· pdf filecreative industries and regional economic development in indonesia meanings,...
TRANSCRIPT
University of Groningen
Creative industries and regional economic development in IndonesiaFahmi, Fikri Zul
IMPORTANT NOTE: You are advised to consult the publisher's version (publisher's PDF) if you wish to cite fromit. Please check the document version below.
Document VersionPublisher's PDF, also known as Version of record
Publication date:2016
Link to publication in University of Groningen/UMCG research database
Citation for published version (APA):Fahmi, F. Z. (2016). Creative industries and regional economic development in Indonesia: Meanings,patterns and impacts [Groningen]: University of Groningen
CopyrightOther than for strictly personal use, it is not permitted to download or to forward/distribute the text or part of it without the consent of theauthor(s) and/or copyright holder(s), unless the work is under an open content license (like Creative Commons).
Take-down policyIf you believe that this document breaches copyright please contact us providing details, and we will remove access to the work immediatelyand investigate your claim.
Downloaded from the University of Groningen/UMCG research database (Pure): http://www.rug.nl/research/portal. For technical reasons thenumber of authors shown on this cover page is limited to 10 maximum.
Download date: 04-05-2018

CREATIVE INDUSTRIES AND REGIONAL ECONOMIC DEVELOPMENT IN INDONESIA
Meanings, Patterns and Impacts
F I K R I Z U L F A H M
I
CREATIVE INDUSTRIES AND REGIONAL ECO
NOM
IC DEVELOPM
ENT IN INDONESIA
F I K R I Z U L F A H M I
Fikri Zul Fahmi (1987) is lecturer in urban and regional planning in the School of Architecture, Planning and Policy Development at Institut Teknologi Bandung (ITB), Indonesia. He holds a bachelor degree in Urban and Regional Planning from ITB and a Research Master degree in Regional Studies from University of Groningen. This book is the outcome of the PhD research project that he conducted in the Faculty of Spatial Sciences at the University of Groningen.
This book looks into the feasibility of promoting creative industries as an instrument for regional economic development in developing economies in general, and in Indonesia in particular. The concept of creative industries has been built upon specific contexts and phenomena in developed countries.
Today, developing countries also adopt the idea of promoting creative industries as a tool for national and local development. However, the position of these industries in socioeconomic development in a developing economy is still unclear.
This book presents four studies which show that the development of creative industries in a developing country such as Indonesia has di�erent meanings, patterns and impacts than those in the developed world.
I N V I T A T I O N
You are cordially invitedto the public defence of
Fikri Zul Fahmi
CREATIVE INDUSTRIES AND REGIONAL ECONOMIC DEVELOPMENT IN INDONESIA
Meanings, Patterns and Impacts
on Thursday 24 November 2016at 12.45 hours
in the Aula of the Academy Building of the University of Groningen,
Broerstraat 5, 9712 CP Groningen
After the defence ceremony you are welcome to the reception
ParanymphsGintarė Morkutė
([email protected])Fean D. Sarian
Creative industries and regional economic development in
IndonesiaMeanings, patterns and impacts
Fikri Zul Fahmi

The research presented in this book was conducted in the Department of Economic Geography/Urban and Regional Studies Institute (URSI), Faculty of Spatial Sciences at the University of Groningen, and financed by Ubbo Emmius Fund.
ISBN978-90-367-9243-1
ISBN (E-Publication)978-90-367-9242-4
Cover designFariz Fadhlillah/Jihad Kreatif ([email protected])
Interior page layoutFikri Zul Fahmi
PrintingGildeprint - www.gildeprint.nl
English language editingEnglishworks, [email protected] (Chapter 1-3 and 5-6, propositions)
Dutch SummaryMarten Middeldorp
ParanymphsGintarė MorkutėFean Davisunjaya Sarian
© Fikri Zul Fahmi, 2016Email: [email protected] and [email protected]
All rights reserved. Save exceptions stated by the law, no part of this publication may be reproduced in any form, by print, photocopying, or otherwise, without the prior written permission from the author.

Creative industries and regional economic development in
IndonesiaMeanings, patterns and impacts
PhD thesis
to obtain the degree of PhD at theUniversity of Groningenon the authority of the
Rector Magnificus Prof. E. Sterkenand in accordance with
the decision by the College of Deans.
This thesis will be defended in public on
Thursday 24 November 2016 at 12.45 hours
by
Fikri Zul Fahmi
born on 21 November 1987in Tasikmalaya, Indonesia

Supervisor Prof. J. van Dijk
Co-supervisor Dr. S. Koster
Assessment committee Prof. T. Firman Prof. F.M.D. Vanclay Prof. H.G. Westlund

And do not walk upon the earth exultantly. Indeed, you will never tear
the earth [apart], and you will never reach the mountains in height.
Al Isra 17:37
To my family


vii
Preface
In the summer of 2013 I was informed that my application for a PhD position in the Faculty of Spatial Sciences was accepted. This was indeed very great news, as I got a chance to live for some more time in Groningen, a favourite city for many people. At the same time, I realised that I had to really continue with this ‘creative economy’ stuff, the topic of my master thesis. I had never thought before that I would wake up to and go to bed thinking about this topic. Now, I have accomplished this project, and gratefully, without any significant obstacles. This would have never been possible without help and support of many people. It is thus my great pleasure to express my gratitude to them.
I would like to sincerely thank my promotor, Jouke van Dijk, who undoubtedly is a very nice person. Jouke, you are always positive and encouraging me to stay focussed, yet enjoy the PhD process. You’ve always motivated me whenever my papers got rejected (or returned with huge revisions) by the journals. You always remind me to be proud of myself and my achievements. You are always there when I need anything, substantially and financially. Despite your busy schedule, you are always easily accessible. You reply to my emails sometimes within seconds.
In the past three years I have worked closely with Sierdjan Koster, my daily supervisor. Sierdjan, I can’t thank you enough for these amazing three years. You have really helped me going through this ‘mission impossible’. I definitely learnt a lot from you and, not to mention, I am now strongly influenced by your academic and writing style. To be honest, meeting your expectations and standards was sometimes not easy. But I knew you wanted me to realise that I am actually more than I thought – that I can move outside my comfort zone. Now I look back to the way I’ve been going through; it’s unbelievably worthwhile. Bedankt voor je steun, en gewoon omdat je zo geweldig bent.
I am also indebted to Philip McCann, who was involved in the writing of Chapter 2. It is worth mentioning that he was the one who brought me up to the research topic. When I did the Research Masters programme, on a course called Scientific Reading, we had to read the book reviews on Richard Florida’s creative class. Although my research project is not looking into the creative class, Philip suggested me to look at the institutionalisation processes of the creative economy as the master thesis research – which then led to this PhD. Philip, thanks for all the ‘good stuff ’, insightful comments and discussions, your input has been great to my research.
I would like to thank Prof. Tommy Firman, Prof. Frank Vanclay and Prof. Hans Westlund for evaluating my thesis.
I owe a debt of gratitude to my colleagues and friends who helped me going through the ‘Permanent Head Damage’ period. First, I appreciate invaluable help

viii
of the Reading Group: Gintare Morkute (also for being my paranymph), Marije Hamersma, Jasper Heslinga, Yang Zhang. Thanks for sharing ideas and all the critical, yet very useful comments on the papers.
My thanks go to my cool, smart, sometimes too noisy, office mates in 2.38 and 2.32: Richard, Dennis, Jelmer, Rixt, Dylan and Dani (also for his help in developing multilevel models in Chapter 5). Thanks for sharing stories and helping each other in any substantial, unsubstantial and technical issues. I am grateful that Marten Middeldorp helped me translating the thesis summary into Dutch. I have also been happy having helpful and friendly colleagues, among others, Heike, Michiel, Liliana, Aleid, Viktor, Ward, Debbie, Ziad and other people in Economic Geography and the Faculty of Spatial Sciences. Also thanks Jeannet and Alida for help in administrative stuff.
Friends come and go during my PhD period. I am grateful for having friends who helped me cure home sickness and bittersweet moments in the past three years. Mas Fean, thanks for all the random times especially during the last stage of my PhD, and also for becoming my paranymph. I thank my (former) housemates, ka Izul + teh Alia + Alisha, Ali + Liany, Almas, Ucon, Salva, Ali + Yosay for sharing not just a house, but home.
Ujegs: Fanny, mas Ok, Yovi, Bakazz a.k.a. kak Fahri (who also helped getting some data), despite all the things that we couldn’t even explain, thanks for being so amazing. Thanks for every single meme you shared. I’ve been thankful for all the good times we had.
I am obliged to thank pak Asmoro + bu Rini + mas Adi + Ifa (+ Riffat) for kindly sending food early in the morning, even when I was still asleep. Thanks mba Ira and mba Nur for welcoming me in their homes – maaf ngerepotin terus ya. Niken, Dedes, Fitri, thanks for all the cupcake and bala-bala times. Reren, Sofi a.k.a. kacopi, mba Fitri+ mas Kus, Guntur, Didin, Windi, Shidiq, nyai Tiur, thanks for sharing happiness, food and unforgettable moments. Mba Wini, thanks for nice talks and help in statistics.
I thank all friends and families in Groningen, PPIG and deGromiest, who have been kind and helpful: Adhyat + Nuri, Delphine, kang Intan and family, mas Zainal + mbak Ayu, mas Didik + mbak Rosel, mba Mita and family, pak Taufiq and family, Satria, mba Vera, bu Ima, mas Ronny, teh Susan + kang Bino, Azis + Amalina, mbak Icha + mas Krisna, mas Kadek + mbak Laksmi, mas Donny + mbak Nieke, mas Edy, bang Donny + kak Citra (also for help in statistics), kang Iqbal + teh Eryth, kang Robby + teh Lia Atwa, mba Lia + mas Yayok, mas Asrofi, kang Zaki + teh Sella, mas Joko, Sasa, Ida, Fika, mas Hegar, Azka, pak Tatang + bu Rohmah, budhe Arie + om Herman, Uwak Asiyah, mba Ria, May, Dina, budhe Nunung, and other people that cannot all be listed here.

ix
I thank Prof. Hari Wibisono, Indonesian Education and Culture Attaché for the Netherlands, for the good and motivating talks.
I am grateful to ITB colleagues and friends who helped and cheered me up during the 2015 fieldwork: bos Delik, ibuk Yunie, pak Adiwan, ceu Ida, bu Anda, Bohok, Dhimas, and other youngsters in PWD. Especially, a bunch of thanks to Yustina Octivanny who helped me preparing administrative stuff before, during and after fieldwork.
I appreciate all the respondents and the people who helped me meet them, among others: Pak Arif Budiman, Pak Eko, mbak Fitri, pak Rizky, mas Gurit, mas Adit, kang Fiki, kang Dendy, teh Fifi, kang Ihsan, kang Ade, Nisrin, Ishma + Hilman, Handini, Debby, and mba Dwi Esti. I also thank para abang GoJek who picked up and sent me to the places where I met the interviewees.
I thank colleagues at the conferences whom I met and gave me feedback on my papers: GeoInnov Utrecht 2014, ERSA St Petersburg 2014, ERSA Summer School Poznan 2014, GCI Hong Kong 2015, ERSA Lisbon 2015, Planocosmo Bandung 2015, RSAN Nijmegen 2016 and ERSA Vienna 2016. I also appreciate the anonymous referee in Cities who helped me find the essential difference between creative and traditional cultural industries I mean in this thesis. Although he had me to do major revisions twice(!) and to read non-geography/economics literature, now I feel confident with my argument on the definitional issue of creative industries.
Importantly, I would like to thank my family, Mimih, Apa, Ende, Didik, Nenek, for all the love, supports and prayers. Jazakumullahu khairan. Hatur nuhun kana sagala kasaean, piduana, kasabaranna salami lima taun ieu. For this, I dedicate this book to them.
Finally, Alhamdulillah, all praise to Allah the Almighty, who grants ease after hardship, who guides me in every single step in my life.
Groningen, September 2016
Fikri Zul Fahmi

x
Contents
Preface - viiList of tables - xiiiList of figures - xiiiList of abbreviations - xivOverview of chapters - xv
1 Introduction - 11.1 The resurgence of the creative economy - 21.2 The ‘fuzzy’ creative economy - 31.3 Importing the creative economy: meanings, patterns and impacts in the
developing world - 41.4 Indonesia as a case in point - 71.5 Research questions and thesis outline - 9
2 Creative economy policy in developing countries - 132.1 Introduction - 152.2 Interpretations of cultural and creative economy concepts - 172.3 Policy transfer and intermediaries in the creative economy - 202.4 Methodology - 222.5 The Indonesian creative economy - 222.6 The Bandung case - 232.7 The Yogyakarta case - 252.8 The Surakarta case - 262.9 Discussion - 282.10 Conclusions - 31Acknowledgements - 32Article Notes - 32References - 32Appendix 2A List of interviewees - 35
3 The location of creative industries in a developing country - 373.1 Introduction - 393.2 Defining creative industries in the context of Indonesia - 413.3 Regional settings for creative industries - 443.4 Methodology - 473.5 The development of creative industries in Indonesia - 513.6 Explaining the concentration of creative industries in Indonesia - 573.7 Discussion and conclusions - 62Acknowledgement - 64References - 64

xi
Appendix 3A Categorising creative and cultural industries - 67Appendix 3B Correlation tables - 68
4 Creative industries and regional productivity growth in the developing economy - 694.1 Introduction - 714.2 Creative industries and regional economic development - 734.3 Methodology - 784.4 General overview of the role of creative industries in Indonesia - 814.5 Estimation results - 834.6 Main results - 854.7 Creative industries: driver or indicator? - 874.8 Robustness check - 894.9 Discussion and conclusions - 90References - 92Appendix 4A Correlation table - 95
5 Business networks, social capital and the productivity of creative industries - 975.1 Introduction - 995.2 Conceptualising the role of networks in the productivity of creative
industries - 1015.3 Methodology - 1075.4 Multilevel analysis - 1125.5 Qualitative analysis - 1145.6 Discussion - 1215.7 Conclusions - 123References - 123Appendix 5A Descriptive overview of variables used in the multilevel
analysis - 126Appendix 5B Correlation tables (multilevel analysis) - 126Appendix 5C List of interviewees - 127
6 General discussion and conclusions - 1296.1 From tradition to the creative economy: (re)defining ‘creative’ and
‘traditional cultural’ industries - 1306.2 Different interpretations and implementations of creative economy
policies - 1326.3 Creative industries: still a ‘luxury good’ in a developing country? - 1336.4 Traditional cultural industries: specificities and potentials - 1346.5 Creative industries and regional productivity: mechanisms - 1356.6 The development picture of creative industries beyond the developed
world: reflections on the literature - 136

xii
6.7 Policy implications: positioning creative industries in regional development - 138
6.8 Data limitations and further research agenda - 141References - 143
Summary - 146Samenvatting in het Nederlands - 151Ringkasan dalam Bahasa Indonesia - 156Related publications not included in this thesis - 161

xiii
List of tables
Table 2.1 Comparison of cases - 29Table 3.1 Variables used in the analysis - 48Table 3.2 Sectoral change in Indonesia’s GDP - 52Table 3.3 Overview of creative industries by category at the national level - 53Table 3.4 Main results - 56Table 3.5 Robustness analysis - 60Table 4.1 Variables used in the analysis - 79Table 4.2 Composition of creative and traditional cultural industries - 83Table 4.3 Main results - 86Table 4.4 Instrumental variable analysis (2SLS) - 88Table 4.5 Robustness check - 90Table 5.1 Multilevel models - 110
List of figures
Figure 3.1 General characteristics of creative (CI) and traditional cultural industries (CULT) - 54
Figure 3.2 Quantile maps of the concentration of creative and traditional cultural industries - 55
Figure 4.1 Sectoral contribution to national employment and GDP 2010 (Government version) - 82
Figure 4.2 Regional distribution of creative and traditional cultural industries - 84Figure 5.1 Analytical framework - 107
xiv
List of abbreviations 2SLS two-stage least squaresBCCF Bandung Creative City ForumBappeda Badan Perencanaan Pembangunan Daerah (local development planning board)BPS Badan Pusat Statistik (Central Statistics Agency) - Statistics IndonesiaDCMS Department of Culture, Media and Sport (in the UK)Disbudpar Dinas Kebudayaan dan Pariwisata (local department of culture and tourism)Disperindag Dinas Perindustrian dan Perdagangan (local department of industry and trade)DIY Daerah Istimewa Yogyakarta (Yogyakarta Special Province)EU European UnionFOCI Forum on Creative IndustriesFPKBL Forum Pengembangan Kampung Batik Laweyan (Forum for the Development of Kampung Batik
Laweyan)GDP gross domestic productGNI gross national incomeGRP gross regional productHDI Human Development IndexICT information and communication technologyISIC international standard industrial classificationIT information technologyIV instrumental variableITB Institut Teknologi BandungIPRs intellectual property rightsKemenparekraf Kementerian Pariwisata dan Ekonomi Kreatif (Ministry of Tourism and Creative Economy)KBLI Klasifikasi Baku Lapangan Usaha Indonesia (Indonesian standard industrial classification)KICK Kreative Independent Clothing KommunityKKKP Kode Klasifikasi Kegiatan Perusahaan (Indonesian standard industrial classification – old system)LM Lagrange multiplierLQ location quotientLR likelihood ratioMNCs multinational companiesMTCE Ministry of Tourism and Creative EconomyOECD Organization for Economic Co-operation and DevelopmentOLS ordinary least squaresRPJMD Rencana Jangka Menengah Daerah (Local midterm development plan)RPJPD Rencana Jangka Panjang Daerah (Local long-term development plan)Sakernas Survei Angkatan Kerja Nasional (National labour force survey)SAR spatial lag modelSDM spatial Durbin modelSEM spatial error modelUK United Kingdom of Great Britain and Northern IrelandUN United NationsUNCTAD United Nations Conference on Trade and DevelopmentUNDP United Nations Development ProgrammeUNESCO United Nations Educational, Scientific and Cultural Organization

xv
Overview of chapters
Chapter 2
Reprinted from Fahmi FZ, McCann P, Koster S. (2015) Creative economy policy in developing countries: The case of Indonesia. Urban Studies doi: 10.1177/0042098015620529
Chapter 3
Reprinted from Fahmi FZ, Koster S, van Dijk J (2016) The location of creative industries in a developing country: The case of Indonesia. Cities 59: 66-79, doi: 10.1016/j.cities.2016.06.005
Chapter 4
Based on Fahmi FZ and Koster S (2015) Creative industries and regional productivity growth: Evidence from Indonesia. Presented at the 55th ERSA Congress, Lisbon, Portugal, 25-28 August 2015. Submitted to an international journal.
Chapter 5
Based on Fahmi FZ (2016) Business networks, social capital and the productivity of creative industries: The case of Indonesia. Presented at the 56th ERSA Congress, Vienna, Austria, 23-26 August 2016. Submitted to an international journal.


Introduction1

2
Chapter 1
1.1 The resurgence of the creative economyThe idea of utilising creativity in economic development, the concept of the ‘creative economy’, has grown in developed countries. Detroit provides an anecdotal example of how this idea emerged in this context. In the first half of the 20th century, Detroit was widely known as a factory town and the world’s automotive capital. The automobile industry dominated the urban economy and absorbed a massive amount of labour. The ‘Big Three’, namely General Motors, Ford and Chrysler, were the most prominent car producers at that time (Sugrue, 2004). However, since the 1950s, the city’s car industry has suffered from global competition. Many firms closed down, while some of the surviving large companies, as well as the parts suppliers associated with the industry, moved production out of Detroit. They relocated to the southern US and also to Canada and Mexico (Sugrue, 2004). As the major plants in Detroit stopped operating, workers increasingly left the city. This economic decline had serious effects on the city’s economy, with local businesses that had once catered to many people shutting down. The city’s population gradually declined from a high of over 1.8 million people in 1950 to about 700,000 in 2010 (Brook, 2012). Poverty and crime rates increased significantly. With at least 70,000 abandoned buildings, 31,000 empty houses and 90,000 vacant lots, many areas in the city were falling into a state of ‘urban decay’ (Binelli, 2012; Brook, 2012). Some even refer to Detroit as a ‘ghost town’ (Brook, 2012). Even worse, in 2013 the city filed for municipal bankruptcy, the largest in US history (Kaffer et al., 2013). Although the city’s economy has declined, this has opened up avenues for other types of developments, especially in the arts and the ‘creative’ sector. Many artists and designers now consider living and working in Detroit for several reasons, such as cheaper rents. They buy up old buildings and plants and transform these into their workplaces (Swanson, 2015). Detroit is deliberately selected as a new home by artists and designers. In 2015, the city was designated as the ‘city of design’, part of the UNESCO Creative Cities Network. With this growing artistic and creativity-based economic activities in Detroit, one might argue that this ‘ghost town’ has begun to revive and enter a new stage of development (DeVito, 2015).
Not only in the US, but also in many other developed countries, labour-intensive sectors, such as agriculture and manufacturing, have steadily declined and this has led to knowledge- and creativity-based economic activities ‘taking over’ the economy. The expansion of the creative sector is not just a natural phenomenon of economic restructuring: governments in developed countries now adopt the idea of promoting the creative sector as a tool for economic development. The creative economy is used not only in response to economic decline, but also proactively to stimulate innovation and regional growth (Gibson and Homan, 2004; Hall, 2000; Pratt, 2008).
Whilst the creative economy in developed countries is given an impetus by deindustrialisation and economic tertiarisation, the discourse on the creative

1
3
Introduction
economy has spread to other parts of the world. Today, developing countries also adopt the idea of the creative economy as a tool for national and local development. However, the position and role of these industries in socioeconomic development in the context of a developing economy is still unclear. There has been only limited research on the role of the creative economy and creative industries in the context of developing countries. Understanding the different meanings and contributions of creative industries in this context is important. Given that the socioeconomic and institutional contexts of developing countries are clearly different from those in the developed world, the policy narratives brought from the ‘West’ might not be applicable in such settings (see Yeung and Lin, 2009). In this respect, this research looks into the feasibility of using the idea of creative industries as an instrument for regional economic development in developing economies in general, and in Indonesia in particular. To elaborate further on the motivation for this research, the following section (1.2) clarifies the somewhat fuzzy concept of the creative economy and what this implies for its adoption in the developing world. The subsequent sections present the research agenda (1.3), followed by the statement of research contributions (1.4) and the thesis outline (1.5).
1.2 The ‘fuzzy’ creative economyReferring to the title of the book written by John Howkins, the creative economy can be defined as ‘how people make money from ideas’ (Howkins, 2001). However, the essence of the term might not be that simple. The creative economy covers the production of creative products – or ‘creative industries’ – as well as related transactions and supporting activities. In practice, there has been an ongoing debate as to the definition of creative industries. The literature has documented numerous definitions and conceptual ideas of creative industries. One of the most referenced definitions is that put forward by the UK Department of Culture, Media and Sport (DCMS), which defined creative industries as
“those industries which have their origin in individual creativity, skill and talent and which have a potential for wealth and job creation through the generation and exploitation of intellectual property” (DCMS, 2001: 04).
Other definitions are generally along similar lines, in which creative industries have several features, such as ‘individual creativity, skill and talent’, ‘originality’, ‘copyright’, ‘intellectual property’, ‘new knowledge creation’, ‘the use of recent technology’ and ‘innovation’ (e.g., Banks and O’Connor, 2009; Flew, 2013; Flew and Cunningham, 2010; Garnham, 2005; O’Connor, 2012). These features essentially reflect the positioning of creative industries in the era of the knowledge economy and post-industrialisation, in which ideas and knowledge are essential (Flew, 2013; Montgomery, 2007). However, it is difficult to measure such features and, in the final analysis, everything can be creative. Further, the debate on this definitional issue is concerned with the distinction, as well as the complementarities, between the ‘newly found’ idea of creative industries and the previously used term ‘cultural industries’.

4
Chapter 1
The UK situation can again be used as an illustration. In 2001, the DCMS classified advertising, architecture, art and antique markets, crafts, design, designer fashion, film and video, interactive leisure software, music, performing arts, publishing, software and computer services, and television and radio as creative industries. A criticism of this classification is that the idea of creative industries is nothing new, and that it is just rebranding the notion of cultural industries (e.g., crafts, film and performing art) and extending it by adding some subsectors that have totally different characteristics, such as software and computer services (O’Connor, 2012). In 2013, the UK government proposed excluding crafts and antiques from the list of creative industries on the basis that ‘high-end craft occupations contain a creative element, but the view is that in the main, these roles are more concerned with the manufacturing process, rather than the creative process’ (DCMS, 2013: 15). However, many parties opposed this proposal. In 2015, a new classification was established and, rather than excluding crafts, the UK government expanded the category to include ‘museums, galleries and libraries’ as part of creative industries (DCMS, 2015). This notably blurs the essence of ‘newness’ and ‘innovation’ in the creative industries. However, it can also be seen as responding to the criticism that the ‘modern’ tone voiced by the concept of creative industries is, to a certain extent, insensitive to the prominence of cultural identity in society (Hesmondhalgh, 2007; O’Connor, 2000, 2012).
Overall, the UK situation shows that the broad, inclusive scope of ‘individual creativity’ is fuzzy and leaves room for interpretation. This situation is also found in the context of Indonesia and other developing countries. Economic activities based on cultural creativity have been and still are present in these countries, but the characteristics of these activities differ from those in the developed world.1 In this regard, this thesis contributes to addressing the definitional fuzziness when it comes to creative and cultural industries in the context of a developing economy. More specifically, it attempts to translate the conceptual definition into an empirical measurement, and in so doing overcome various challenges and the lack of data. In this, the Western concept of creative industries is referred to and reflected on the actual conditions and local potentials.
1.3 Importing the creative economy: meanings, patterns and impacts in the developing world
Facilitated by the advance in information technology (IT), the creative economy can spread rapidly, not only in developed countries but also in the developing world (see Pratt, 2009). In developed countries the creative economy is hotly debated because it offers new imaginations of urban and regional development while, at the same time, raises controversies, such as social exclusion (e.g., Peck, 2005). The development of creative industries in a developing economy reflects a different
1 See Section 2.2 (Chapter 2) and Section 3.2 (Chapter 3) for a more detailed discussion on this issue.

1
5
Introduction
setting. Although the term ‘developing countries’ covers nations with different levels of socioeconomic development (see De Beukelaer, 2014), they generally have less advanced regional economies and technologies than those in ‘developed countries’, and this might present an obstacle when it comes to supporting innovation in knowledge- and creativity-based economic activities (Yusuf and Nabeshima, 2005). In such countries, manufacturing and often agriculture are still important contributors to the economy. Social, entrepreneurial and institutional environments also differ from those in the developed world. Entrepreneurial activities are often performed not because of a recognition of opportunities, but because people cannot find other jobs to earn a living (Singer et al., 2015).
Utilising cultural creativity is not new in Asian and developing countries. Culture-based economic activities are to be found in these nations, but these are generally craft-intensive (UNESCO and UNDP, 2013). Their products tend to be ‘stagnant’ over time, as heritage values are preserved and highlighted as selling points (Kong et al., 2006). Despite these characteristics, which somewhat contradict the conceptual ideas of the creative economy and creative industries, governments in several countries promote these traditional businesses, more recently referred to as ‘traditional cultural industries’, as creative industries. These traditional businesses actually have very different characteristics in that they pay less attention to intellectual property and innovation, which are important features of creative industries (Kong et al., 2006; UNESCO and UNDP, 2013). Given the different socioeconomic contexts and development trajectories in developing economies, the terms creative economy and creative industries could have different meanings and positions in a developing economy. It is unclear whether the creative economy is a suitable instrument for urban and regional development in developing countries. In other words, it is unknown whether creative industries can stimulate regional economic development in this different context, and how such industries should be incorporated in development policies.
Three important facets encourage research on creative industries in the regional context of developing countries. First, the definitions and classifications of creative industries vary across developed countries (Evans, 2009). It is therefore unsurprising that different interpretations of the creative economy are found in developing economies. Some have already started to value innovation and new knowledge, but others simply see the meaning of the creative economy as protecting traditional culture (Kong et al., 2006; O’Connor and Xin, 2006). Although there is growing interest in the mobility of the creative economy in the context of Asian and developing countries, little is understood about how this idea is fashioned among institutions in designing development policies, especially at the local level. Considering the diverse subnational characteristics and contexts, one can expect different interpretations of the creative economy across localities within a country. In particular, a strong attachment to traditional culture might influence the ways in which the term creative economy is interpreted. Such different understandings are

6
Chapter 1
also facilitated by local autonomy, which provides discretion for local governments to govern development processes in their territories (Miraftab et al., 2008). Research has not examined how and by whom the notion of the creative economy is interpreted and implemented and, more importantly, to what extent this leads to a ‘successful’ implementation of the creative economy policy. In other words, it is important to identify whether the creative economy can shape local institutions and be operationalised through actions (see also Rodrik, 2014). Further, it is crucial to examine the implications of incorporating traditional cultural industries within the creative economy policy. Although these industries might not be innovative, nor in line with the conceptual idea of creative industries, they do reflect a specificity of ‘creative industries’ in developing countries.
Second, the idea of the creative economy and creative industries is built upon the specific contexts of developed countries, but the adoption of this idea in developing countries is often not accompanied by a thorough identification of local potentials and challenges. It is unclear as to what extent creative industries are represented in existing conditions or, in other words, whether ‘creative industries’ really exist in this context. Based on the socioeconomic development levels in developing countries, one would expect creative industries to be still small in economic terms (see De Beukelaer, 2014). As in the developed world, creative industries are not distributed evenly, but found mostly in large metropolitan areas, and so it is important to identify where creative industries are situated in the context of a developing economy and how they ended up in certain regions. Understanding the regional patterns of creative industries can provide an insight into whether the idea of creative industries is applicable to regional socioeconomic contexts in developing economies. Further, it is necessary to compare the regional patterns of creative industries and traditional cultural industries. Both types of industry have clearly different characteristics and development trajectories and, thus, they could well be distributed in different regions. If this is evident, then both industries are likely to need different regional development support strategies.
Third, and related to this, there has been an ongoing discussion as to whether creative industries drive economic growth or vice versa (e.g., Marco-Serrano et al., 2014; Potts and Cunningham, 2008). Whilst this discussion has been dominated by the context of developed countries, this issue is also important in the context of developing countries that are gradually implementing creative economy policies. Estimating the regional economic impacts of creative industries in the developing world is important for establishing whether the idea of promoting creative industries is a feasible instrument for regional development in this context. As traditional cultural industries are often large and included in creative industries in many developing countries, it is necessary to compare the economic contribution of ‘real’ creative industries with that of traditional cultural industries. Further, little is understood about the mechanisms through which creative industries deliver economic impacts. In the context of a developing economy, it is important to

1
7
Introduction
examine the extent to which the specific characteristics of the developing world influence the ways in which creative industries contribute to the regional economy. One of the specific characteristics that might influence the mechanism is the societal values and norms that underlie the behaviours of creative firms. In the context of Asian countries, and certainly in Indonesia, societal values and norms are often strong and have the potential to influence economic processes in that social relationships and ties can sometimes kill economic competition (e.g., Iyer et al., 2005; Malecki, 2012).
1.4 Indonesia as a case in pointIndonesia is a good example of a country in which ‘the creative economy’ is being adopted in a context beyond the developed world. It is considered a developing country given its lower-middle level of gross national income per capita ($3630 in 2014), a mid-range human development index (0.684) and an underdeveloped industrial base.2 The Indonesian government is currently adopting the idea of the creative economy and creative industries as a way to drive national and local development. However, its motivation seems different from that seen in developed countries, which is generally to respond to economic decline and to foster innovation (see Pratt, 2008). Rather, the Indonesian government is implementing its creative economy policy on the basis of its enormous cultural potential spread over 1300 ethnicities.
The emergence of the creative economy in Indonesia was stimulated by the growing number of young clothing producers and indie music makers in Bandung at the start of this century. These young creative people not only generated new local economic potentials, they also showed their initiative in pushing the idea of the creative economy as an instrument for local development policy and for developing Bandung as a ‘creative city’. Believing that the ‘success’ of Bandung could be replicated in other cities, the central government, through Presidential Instruction 6/2009, has obliged local governments to promote creative industries. Later, in the 2011 cabinet reshuffle, President Susilo Bambang Yudhoyono announced the formation of a new ministry: the Ministry of Tourism and Creative Economy (MTCE).3 The ministry’s name can be seen as indicating that the national government not only wants to foster the creation of new knowledge and ideas, but also to link creative industries with tourism development by using local cultural potentials. Given this intention, the creative economy in Indonesia clearly has a different meaning and position than that seen in developed economies. This is also indicated by the fact that, in many
2 See http://data.worldbank.org/country/indonesia and http://hdr.undp.org/en/countries/profiles/IDN3 In fact, the MTCE did not exist for long. In 2015, President Joko Widodo decided to move creative economy affairs from the Ministry of Tourism to a new board, the Board of the Creative Economy (Badan Ekonomi Kreatif).
8
Chapter 1
regions, ‘creative industries’ are mostly associated with long-established traditional crafts that have become part of regional identities.
The choice of Indonesia as the basis for a case study is also relevant since it is part of the growing trend of decentralisation in developing countries. As in many other countries, Indonesia is experiencing decentralisation in which power, and the authority to govern, is devolved from the central government to the local governments (Hofman and Kaiser, 2006). This situation could indeed affect regional development processes. Decentralisation stimulates local governments to implement entrepreneurial strategies, including adopting the creative economy, that promote their territories. On the one hand, decentralisation creates opportunities to design better development strategies in response to place-specific potentials and challenges. On the other hand, it has had various side effects, in that it has led many local governments to think of themselves as ‘kingdoms’ (Firman, 2013).
Decentralisation in Indonesia is characterised by a massive and sudden transition – often referred to as ‘Big Bang’ decentralisation – from highly centralised governance to a system in which local governments (kabupaten and kota)4 have the highest authority in directing development in their territories (Hofman and Kaiser, 2006). The decentralisation policy was a response to the political and economic instability at the end of the oppressive regime led by Suharto. Decentralisation was designed to overcome the problem of interregional and social disparity as well as to deliver public services closer to the community (Booth, 2014). However, local governments are often not well-prepared and lack sufficient capability to govern local development (Miraftab et al., 2008). Further, many local actors have agitated for territorial splits (‘pemekaran’), arguing that public services are better delivered in even smaller regions. In reality, many proposals for the establishment of new territories were simply not feasible in that the proposed regions had high poverty rates and little economic potential (Nolan et al., 2014). Questions remain over whether decentralisation has improved regional development. Firman (2013) argues that territorial splits tend to fragment regional development as it becomes more difficult to govern the development and coordination process once a region is divided into several units. Hill and Vidyattama (2014) also found that large interregional differences in living standards and economic structures remained after decentralisation.
Decentralisation has opened up opportunities for local governments to experiment with new ideas and implement innovative policies to improve local development. In the decentralisation era, policy ideas have become more mobile and local governments regularly learn from and make reference to others (e.g., Phelps et al.,
4 Regional governance in Indonesia comprises two hierarchical levels: provincial and local. There are two types of local governments, municipality (kota) and district (kabupaten), but both have the same authority to govern. They usually differ in terms of their urbanity: municipalities tend to be relatively urbanised areas, whereas districts are usually largely rural areas with limited urban areas.

1
9
Introduction
2014). However, as local institutional capacity varies across regions, there is also a range in the capacity to integrate new policy ideas as well as in the potential success of these in different local contexts. Hence, there is a need to understand the degree to which the process of learning and adopting policy lessons among localities is a good way of boosting the impact of ‘innovative’ local development and governance. In addressing this issue, the transfer of the creative economy is a relevant focus for research. The rising popularity of the creative economy in Indonesia, and potentially in other countries, reflects how a ‘mobile’ policy idea circulates and offers new imaginations for regional development. However, in many cases, local governments do not reflect critically on whether a policy idea they might copy from another context is suitable for their local settings, leaving many questions as to whether this idea can deliver the expected outcomes as found in the ‘original’ context.
1.5 Research questions and thesis outlineThe main research question addressed in this thesis is: To what degree do socioeconomic and institutional contexts in a developing country influence the applicability of creative industries as an instrument for regional development? The academic relevance and contributions of this research are threefold. First, it contributes to the understanding of the different meanings, development patterns and impacts of creative industries in the context of a developing economy, an area that has previously been only limitedly elaborated. Reflecting on the specific contexts of Indonesia, this research provides an insight into the development of creative industries in a lower-middle income country, which clearly differs from ‘Western’ countries, where the idea of the creative economy emerged, as well as from higher income Asian countries, such as Japan, Singapore, South Korea and China, which have gone further in the development of creative industries. Second, this research contributes to the current literature in which the notion of creative industries is often examined in theoretical terms rather than through empirical studies (Granger and Hamilton, 2010). In this regard, this research provides empirical evidence on the position and role of creative industries in economic development by incorporating the regional dimension into the analysis. This dimension provides an interesting and crucial perspective on the development of creative industries given that such industries are embedded in and impact on regions. Focussing on the regional scale is also necessary given the diverse geographical characteristics of Indonesia as a nation made up of many islands. Third, this research contributes to the understanding of place-based development in a decentralised governance system in a developing country. Currently, the discussion on place-based development is dominated by the context of high-income countries (OECD, 2014). Decentralisation has opened up opportunities for local governments to design innovative policy strategies and implement locally rooted development processes, including incorporating creative industries in the development policy. In this regard, this research has policy

10
Chapter 1
relevance in that it can inform policymakers about how creative industries should be taken into account in local development policies, including specific issues, such as a possible lack of local institutional capacity, that need to be considered.
To answer the research question outlined above, three different approaches and units of analysis are employed. To begin with, the discourse is analysed in order to elaborate on the adoption of the creative economy idea in local development policies (Chapter 2). Second, an empirical analysis is performed at the regional level to identify the development patterns and economic impacts of creative industries (Chapters 3 and 4). Third, an analysis is conducted at the firm level to examine the mechanisms through which creative industries contribute to the regional economy (Chapter 5).
Chapter 2 examines how and by whom the idea of the creative economy is interpreted and implemented at the local level. This chapter analyses how the creative economy, an idea imported from developed countries, is fashioned within local institutions, and communicated and integrated in local development policies, in a developing country. Here, it is identified whether local interpretations align with the ‘original’ concept of the creative economy, which emphasises the creation of new knowledge and innovation. Given the different local economic and socio-cultural contexts, one would expect different interpretations, and the factors that determine these different interpretations are examined. This analysis will provide an insight into whether the creative economy, as a tool for local development, operates not only as a discourse, but also a viable and practical development framework.
Chapter 3 assesses the occurrence and regional patterns of creative industries in Indonesia. It presents an analysis of the regional characteristics in areas where concentrations of creative industries are found. This analysis provides an insight into the degree to which regional economic settings in Indonesia are suitable for creative industries. Given that the government promotes traditional businesses as creative industries, despite their very different characteristics, it is also examined whether these traditional cultural industries are associated with the same regional characteristics as creative industries. Based on a similar motivation, Chapter 4 examines the extent to which creative industries stimulate regional economic development in Indonesia. The question of whether creative industries are a driver or a follower in regional productivity growth is addressed. The analysis also compares the impact of creative industries with other economic sectors, such as manufacturing, oil and gas, and also traditional cultural industries. As creative industries and traditional cultural industries have different characteristics and trajectories, it is possible that they contribute to regional productivity growth in different ways.
Chapter 5 examines the mechanisms through which creative industries impact on the regional economy in the context of a developing country. More specifically, it assesses the degree to which specific contexts in a developing economy influence

1
11
Introduction
the ways in which creative industries contribute to regional productivity. To reflect on the ‘specific contexts’ of the developing world, the analysis is focussed on networks and social capital, which represent the culture of interactions that influence economic processes in and between creative firms. As economic processes and social interactions occur both internally within a firm as well as externally, networking characteristics and processes on different levels are taken into account in this analysis.
Finally, Chapter 6 concludes this thesis with a general discussion on the findings and an elaboration of policy implications and future research opportunities.
ReferencesBanks M and O’Connor J (2009) After the creative industries. International Journal of Cultural Policy 15(4): 365–
373.Binelli M (2012) How Detroit Became the World Capital of Staring at Abandoned Old Buildings. The New York
Times Magazine. Available from: http://www.nytimes.com/2012/11/11/magazine/how-detroit-became-the-world-capital-of-staring-at-abandoned-old-buildings.html?pagewanted=all.
Booth B (2014) Before the ‘big bang’: Decentralization debates and practice in Indonesia, 1949-99. In: Hill H (ed.), Regional Dynamics in a Decentralized Indonesia, Singapore: Institute of Southeast Asian Studies, pp. 25–39.
Brook P (2012) Captivating Photos of Detroit Delve Deep to Reveal a Beautiful, Struggling City. Wired. Available from: http://www.wired.com/2013/01/detroit-dave-jordano/.
DCMS (2001) Creative Industries Mapping Document 2001. London: Department of Culture, Media and Sport.DCMS (2013) Classifying and Measuring the Creative Industries Consultation on Proposed Changes. London:
Department for Culture, Media & Sport.DCMS (2015) Creative Industries Economic Estimates January 2015. London: Department for Culture, Media &
Sport.De Beukelaer C (2014) Creative industries in ‘developing’ countries: Questioning country classifications in the
UNCTAD creative economy reports. Cultural Trends 23(4): 232–251.DeVito L (2015) 2015 was a pivotal year in Detroit’s art scene Detroit art city? By. Detroit Metro Times. Available from:
http://www.metrotimes.com/detroit/2015-was-a-pivotal-year-in-detroits-art-scene/Content?oid=2387939.Evans G (2009) Creative Cities, Creative Spaces and Urban Policy. Urban Studies 46(5-6): 1003–1040.Firman T (2013) Territorial Splits (Pemekaran Daerah) in Decentralising Indonesia, 2000–2012: Local Develop-
ment Drivers or Hindrance? Space and Polity 17(2): 180–196.Flew T (2013) Global Creative Industries. Cambridge and Malden: Polity Press.Flew T and Cunningham S (2010) Creative Industries after the First Decade of Debate. The Information Society
26(2): 113–123.Garnham N (2005) From cultural to creative industries: An analysis of the implications of the ‘creative industries’
approach to arts and media policy making in the United Kingdom. International Journal of Cultural Policy 11(1): 15–29.
Gibson C and Homan S (2004) Urban Redevelopment, Live Music and Public Space: Cultural performance and the re-making of Marrickville. International Journal of Cultural Policy 10(1): 67–84.
Granger RC and Hamilton C (2010) Re-spatializing the creative industries: a relational examination of under-ground scenes, and professional and organizational lock-in. Creative Industries Journal 3(1): 47–60.
Hall P (2000) Creative Cities and Economic Development. Urban Studies 37(4): 639–649.Hesmondhalgh D (2007) The cultural industries. 2nd ed. Los Angeles ; London: SAGE.Hill H and Vidyattama Y (2014) Hares and tortoises: regional develoment dynamics in Indonesia. In: Hill H (ed.),
Regional Dynamics in a Decentralized Indonesia, Singapore: Institute of Southeast Asian Studies, pp. 68–97.Hofman B and Kaiser K (2006) Decentralization, Democratic Transition, and Local Governance in Indonesia.
In: Bardhan P and Mookherjee D (eds), Decentralization and Local Governance in Developing Countries: A Comparative Perspective, Massachussets: MIT Press, pp. 81–124.
Howkins J (2001) The Creative Economy: How People make Money from Ideas. London: Penguin Press.

12
Chapter 1
Iyer S, Kitson M and Toh B (2005) Social capital, economic growth and regional development. Regional Studies 39(8): 1015–1040.
Kaffer N, Henderson S and Helms M (2013) Detroit files for bankruptcy protection. USA Today. Available from: http://www.usatoday.com/story/news/nation/2013/07/18/detroit-prepares-bankruptcy-filing-friday/2552819/.
Kong L, Gibson C, Khoo L-M, et al. (2006) Knowledges of the creative economy: Towards a relational geography of diffusion and adaptation in Asia. Asia Pacific Viewpoint 47(2): 173–194.
Malecki EJ (2012) Regional Social Capital: Why it Matters. Regional Studies 46(8): 1023–1039.Marco-Serrano F, Rausell-Koster P and Abeledo-Sanchis R (2014) Economic development and the creative indus-
tries: a tale of causality. Creative Industries Journal 7(2): 81–91.Miraftab F, Silver C and Beard VA (2008) Introduction: situating contested notions of decentralized planning the
global south. In: Beard VA, Miraftab F, and Silver C (eds), Planning and Decentralization: Contested spaces for public action in the Global South, USA and Canada: Routledge, pp. 1–18.
Montgomery J (2007) The new wealth of cities: city dynamics and the fifth wave. Burlington, VT: Ashgate.Nolan C, Jones S and Solahudin (2014) The political impact of carving up Papua. In: Hill H (ed.), Regional Dynam-
ics in a Decentralized Indonesia, Singapore: Institute of Southeast Asian Studies.O’Connor J (2000) The definition of the ‘Cultural Industries’. The European Journal of Arts and Education 2(3):
15–27.O’Connor J (2012) Surrender to the Void: Life after Creative Industries. Cultural Studies Review 18(3): 388–410.O’Connor J and Xin G (2006) A new modernity?: The arrival of ‘creative industries’ in China. International Journal
of Cultural Studies 9(3): 271–283.OECD (2014) OECD Regional Outlook 2014: Regions and Cities: Where Policies and People Meet. Paris: OECD
Publishing.Peck J (2005) Struggling with the Creative Class. International Journal of Urban and Regional Research 29(4):
740–770.Phelps NA, Bunnell T, Miller MA, et al. (2014) Urban inter-referencing within and beyond a decentralized Indone-
sia. Cities 39: 37–49.Potts J and Cunningham S (2008) Four models of the creative industries. International Journal of Cultural Policy
14(3): 233–247.Pratt AC (2008) Innovation and Creativity. In: Hall T, Hubbard P, and Short JR (eds), The SAGE Companion to the
City, Los Angeles: SAGE Publications, pp. 138–153.Pratt AC (2009) Policy Transfer and the Field of the Cultural and Creative Industries: What Can Be Learned from
Europe? In: Kong L and O’Connor J (eds), Creative Economies, Creative Cities, Dordrecht: Springer Nether-lands, pp. 9–23.
Rodrik D (2014) When Ideas Trump Interests: Preferences, Worldviews, and Policy Innovations. Journal of Eco-nomic Perspectives 28(1): 189–208.
Singer S, Amorós JE and Arreola DM (2015) Global Entrepeneurship Monitor 2014 Global Report. London: Global Entrepreneurship Research Association.
Sugrue TJ (2004) From Motor City to Motor Metropolis: How the Automobile Industry Reshaped Urban America. Automobile in American Life and Society. Available from: http://www.autolife.umd.umich.edu/Race/R_Over-view/R_Overview4.htm.
Swanson C (2015) Is Soho in the ’70s Just a Two-Hour Flight Away? 9 Artists on Why They Live in Detroit. Vulture. Available from: http://www.vulture.com/2015/01/9-artists-on-why-they-live-in-detroit.html.
UNESCO and UNDP (2013) Creative Economy Report 2013: Special Edition: Widening Local Development Path-ways. New York and Paris: UNESCO and UNDP.
Yeung HW and Lin GCS (2009) Theorizing Economic Geographies of Asia. Economic Geography 79(2): 107–128.Yusuf S and Nabeshima K (2005) Creative industries in East Asia. Cities 22(2): 109–122.

Creative economy policy in developing countriesThe case of Indonesia
2

Abstract
This paper investigates how the creative economy discourse is interpreted and implemented in the context of Indonesia as a developing country. Our main conclusion is that the discourse is interpreted differently across localities. Bandung appears to be the only locality whose interpretation aligns with the general understanding of a creative economy that emphasises knowledge creation and innovation. This was made possible by the strong support from academia and communities who wanted to experiment with this policy idea. Our study also provides an insight into a creative economy developing not only as a discourse, but also as a workable framework for development policies, in this city. Conversely, other cities seem to pragmatically use the policy idea without considering the local context in a rebranding exercise in order to drive economic development, whereby traditional cultural industries are relabelled as creative despite performing hardly any innovation activities. Despite this, Bandung illustrates that there are possibilities for a developing country such as Indonesia to adopt the vision of a creative economy by reshaping local institutions to support successful experimentation with this new idea.
creative economycreative industriescultural economydiscourseeconomic developmentgovernanceIndonesia
This chapter is reprinted from Fahmi FZ, McCann P, Koster S. (2015). Creative Economy Policy in Developing Countries: The case of Indonesia. Urban Studies, doi: 10.1177/0042098015620529
Keywords
t

15
Creative economy policy
2
2.1 IntroductionThe creative economy idea has flourished in industrialised countries, and its influence has spread around the globe. Despite its apparent popularity, its merits are still hotly debated. On the one hand, the creative economy offers new imaginations of urban development. On the other hand, there are many critiques: for example, that a policy focused on the creative economy and the creative class may only benefit the middle classes, thereby contributing to social exclusion (Peck, 2005). Reflecting this discussion, there is considerable literature on the conceptual arguments for and empirical analyses of the dynamics of creative cities (Andersson et al., 2011; Geenhuizen and Nijkamp, 2012). This debate is overwhelmingly situated in the context of the developed world, and little is to be found in the context of Asia and developing countries elsewhere (Yusuf and Nabeshima, 2005). Many such countries do have a policy goal of stimulating the creative economy, and several Asian countries, such as Korea, Singapore, Taiwan and China, have long been home to leading creative industries (UN, 2004). Overall, it is fair to say that the role of creative industries in the economic development of developing countries, as well as the interpretation of the concept, remains unclear.
We argue that it can be difficult in Asian and other developing countries to adopt the original concept of a creative economy. First, the motivation for applying a creative economy policy is different. In North America, Australia and Europe, the idea of the creative economy is mainly used as a tool for regenerating the economy and revitalising derelict neighbourhoods, especially in de-industrialised regions, as well as for developing innovation strategies (Gibson and Homan, 2004; Hall, 2000; Pratt, 2008a; Pratt, 2009b). Meanwhile, developing countries tend to prioritise the use of their comparative advantage in the production costs of cultural products rather than the generation of new knowledge (Evans, 2009). In many cases, they also tend to emphasise traditional values, and efforts to manage innovation are few and far between (Kong et al., 2006). Second, regional economies in these countries are often less advanced, and this can hinder creative and intellectual processes since these require technological innovation (Yusuf and Nabeshima, 2005). Finally, cultural values and societal contexts vary. In many developing countries, intellectual property rights (IPRs) are not treated as private goods, as demonstrated by the frequent piracy and the lack of awareness of and respect for copyrights (Howkins, 2001; UNCTAD, 2010). Therefore, it is not unreasonable to expect a creative economy policy to work differently in such countries, and to not necessarily result in the same outcomes.
In terms of these issues, this paper aims to examine how the creative economy, as a tool for urban development, is interpreted and implemented in a developing country, namely Indonesia. We go beyond simply documenting different interpretations of the creative economy by explaining how policy actions are shaped by the lessons absorbed from the conceptual ideas. In this paper, the creative economy is viewed

16
Chapter 2
as a discourse – as a set of thoughts, notions and categories through which meaning penetrates social life and becomes embedded in practice (see Hajer and Versteeg, 2005). This definition is relevant since we observe how the discourse travels from specific settings to become a development strategy in others (McCann, 2008). As such, it is very possible that the discourse does not automatically work in the way it is narrated. Social preferences, complementarities between institutional components and differences in institutional arrangements all influence the way this policy idea is institutionalised (Rodrik, 2008). Here, this paper contributes to filling the knowledge gap on how different economic, geographic and institutional factors affect the way creative industries are stimulated (Chapain et al., 2012). From this, we will gain insights into whether this idea can effectively reshape local institutions and be operationalised through actions, or whether it is just refashioned as a narrative and a branding exercise (see Rodrik, 2014).
The contribution of this study is also related to the fact that Indonesia represents specific contexts. First, Indonesia illustrates a lower-middle income country that is currently looking for a best model with which to develop a creative economy. Second, Indonesia is one of the largest countries to be experiencing massive decentralisation, which allows for place-based development with various experimentations and interpretations of policy ideas (such as the creative economy). This study provides empirical evidence on the practice of place-based development beyond the dominant context of high-income countries (OECD, 2014).
The creative economy has been particularly embraced as a local policy instrument in Indonesia since a cluster of creative industries emerged in the late-2000s in Bandung, West Java. The progress of Bandung became a barometer, with other localities gradually starting to formulate similar policies. However, they appear to be struggling to interpret the concept of creative industries and adopt it to their local economic context, which sometimes includes existing traditional cultural industries such as crafts. As an illustration, Yogyakarta and Surakarta are designated by the national government as creative cities with a specialisation in traditional crafts. This generates several questions. How and by whom is the creative economy interpreted in these different contexts? Do these interpretations align with current international views? How does the interpretation relate to the success and bottlenecks in implementing this idea through policy? To answer these questions, we examine how the creative economy is interpreted and embodied in development policies, as well as how local actors contribute to this process. A case study approach is employed since the formulation of local development policies is devolved to localities, and the creative economy policy is implemented in different ways in these localities, making it necessary to compare these developments at the local level.
To construct guidelines for comparing Western and Asian concepts of the creative economy, the next section reviews the literature on cultural and creative

17
Creative economy policy
2
economies. The following section develops a framework for examining how and by whom the creative economy is institutionalised. Next, the methodology is briefly explained, followed by a general overview of creative economies in Indonesia. The following three sections present the individual case studies, assessing the situation in Bandung, Yogyakarta and Surakarta respectively. In each, we examine by whom, in which direction, and how the creative economy is interpreted and implemented. This will be followed by a discussion and conclusions.
2.2 Interpretations of cultural and creative economy concepts
There are various understandings of how culture, creativity and the economy are interrelated. This section initially reviews these different understandings, while the latter part discusses this issue in the particular context of Asian and developing countries.
2.2.1 The cultural and creative economy debatesThe literature offers two opposing views that pervade the value orientations towards the creative economy. The first view has a culture-centric orientation, and emphasises cultural values, arts and community wellbeing (Andres and Chapain, 2013; Smith and Warfield, 2008) – or the ‘culturalisation of economies’ (O’Connor, 2015). Generally speaking, this view aligns with a focus on the ‘cultural economy’ and ‘cultural industries’, although this is not to say that there is no economic motivation in these notions. The cultural economy comprises all economic sectors that serve the consumers with ‘amusement, ornamentation, self-affirmation and social display’ (Scott, 1997). This view is not the same as Adorno´s (1991) conceptualisation of the ‘culture industry’, which suggests a negative image of culture that has been commodified and lost its capacity in social life. The cultural economy, and so cultural industries, represents positive metaphors of ‘complex, ambivalent and contested’ values in modern life that can have useful impacts on the economy (Hesmondhalgh, 2002: 17; Pratt, 2009b). Cultural industries attach specific attributes, intellectual properties and symbolic meanings derived from cultural values to products (Galloway and Dunlop, 2007; O’Connor, 2000), irrespective of the economic value that might arise from their production (EU, 2010). In this paper, we use the term ‘cultural economy’ to refer to this view.
The second view has an econo-centric orientation and lays greater emphasis on economic values (Andres and Chapain, 2013; Smith and Warfield, 2008) – or the ‘economisation of culture’ (O’Connor, 2015). We use the term ‘creative economy’ to refer to this view, and this represents the ‘discourse’ discussed in this paper. The creative economy can be explained as the concept of ‘how people make money from ideas’, and includes both the production of creative products – or ‘creative industries’ – and their transactions (Howkins, 2001). In this view, the definition of

18
Chapter 2
creativity is not only limited to cultural creativity, but also includes technological and economic creativity (Florida, 2005; 2012). This view can be associated with the ‘creative class’ – measured as people – and ‘creative industries’ – measured as firms.
Florida states that regions will be economically successful if they attract the creative class, that is, people who use knowledge and intellectual capital in their jobs, ‘whose function is to create meaningful new forms’ (Florida, 2012: 38). To attract such people, regions should have an advanced technology, sufficient amenities and a socially friendly environment – or ‘technology, talent, tolerance’ (the 3Ts). Attempts to attract the creative class are, however, often viewed as a form of neoliberalism: as exclusively targeting a certain group or social class, or of ‘picking winners’. In reality, strategies are often the other way around: regions tend to make use of and sustain cultural resources, including social tolerance, as economic assets (Peck, 2005). A criticism also levelled at Florida’s view is that the presence of these creative people is not sufficient to sustain creative economic activities in a city. Rather, ‘[c]reativity needs to be mobilized and channelled for it to emerge in practical forms of learning and innovation’ (Scott, 2006: 11). Further, others argue that Florida exaggerates the role of creative capital and diversity, and that the impact of human capital is more significant (Glaeser, 2005). In fact, the relationship between amenities and creativity could be the opposite: ‘skilled cities are growing because they are becoming economically productive … not because these cities are becoming more attractive places to live’ (Glaeser and Saiz, 2003: 1).
The notion of creative industries is also controversial in that others argue that it is not a new idea – that artists and cultural industries have long existed (Andersson et al., 2014; Markusen, 2006; Markusen and Schrock, 2006). The creative industry notion is sometimes seen as no more than a ‘substitute’ for the term ‘cultural industries’, and used as a ‘more friendly’ term within the debate on the commodification of culture (Hesmondhalgh, 2008; Pratt, 2009b). In the classification of creative industries, some activities do indeed overlap with the cultural industry category, such as crafts, performing arts and music (see DCMS, 2013). Creative and cultural industries certainly have similarities in that they involve creativity and symbolic meaning, as well as use-value and certain methods of production (Galloway and Dunlop, 2007). Without doubt, digitalization, technology, new knowledge, originality and copyrights have become more important in creative industries and in the creative economy (Banks and O’Connor, 2009; Galloway and Dunlop, 2007; Hartley, 2005). These features are needed to develop market value so as to provide sources of wealth and continuous learning (Scott, 2006; UN, 2004).
These various definitions are not mutually exclusive in that creative and cultural economies can be strongly interrelated. Hartley (2005: 5) notes that the idea of creative industries actually embodies ‘the conceptual convergence of the creative arts (individual talent) with cultural industries (mass scale), in the context of new media technologies (ICTs) within a new knowledge economy’. Further, culture has

19
Creative economy policy
2
intrinsic values, as embedded in cultural amenities, which can become a magnet to attract the creative class and ‘buzz’ innovative milieu for these activities (Pratt, 2008b).
Given the ambivalent and overlapping definitions, it is no surprise that creative and cultural economy concepts are interpreted normatively (Gibson and Kong, 2005; Kong et al., 2006). We argue that it is equally important to pay attention to the policy strategies since each requires a different approach. Strategies for a cultural economy appear to be somewhat ‘top-down’, with the government positioned to play a strategic role in maintaining identities, local knowledge and culture (Smith and Warfield, 2008). Direct subsidies are delivered to cultural industries to sustain livelihoods (Hesmondhalgh, 2008; Smith and Warfield, 2008). In comparison, strategies for a creative economy are designed to encourage an expansion of creative industries with little governmental intervention (Smith and Warfield, 2008), simply to nurture preferably conditions that support value creation mechanisms (Costa, 2008).
2.2.2 The creative economy flies to AsiaGiven the different interpretations of the creative economy in Western countries (Evans, 2009), it is unsurprising that similar differences are found in Asian and other developing countries. The idea of utilising culture and creativity for economic development is nothing new in Asia. In Singapore, Korea, Taiwan and China, cultural industries have long traditions of cultural protectiveness and highlight conservative values as key success factors (O’Connor, 2005). When the concept of the creative economy is introduced, there are various interpretations and reactions towards the discourse. Some start to value innovation and creativity (O’Connor, 2005), while others mix the somewhat contradictive aspects of new knowledge creation and cultural conservativeness.
Several reasons can explain these differences. The first reason is that institutional contexts differ, ‘the trajectories and lived experiences may vary and, critically, causalities may be unproven or be very different from case to case’ (Evans, 2009:1006-1007). As such, the creative economy cannot be simply copied and pasted from the West, that is, ‘Xerox policies’ (Kong et al., 2006; Pratt, 2009a: 15). Second, ‘traditional barriers’, and especially ‘language limitations that cause misinterpretation’ (Kong et al., 2006: 191), remain despite advances in IT and knowledge exchange between scholars. Third, there is the conscious movement within Asian countries against ‘cultural homogenisation’, that is against culture becoming globally similar because of intense knowledge penetration primarily brought about through Western creative products (Jaguaribe, 2008).
As a result, although the creative economy is cited in the policy documents of Asian countries, its essential meaning is taken for granted, and the influences of foreign values are minimised (Kong et al., 2006). Creative economy policies in developing

20
Chapter 2
countries are often connected with other development priorities, such as poverty alleviation, cultural heritage protection, social inclusion, and also to tourism since creative products can be additional attractions in tourist destinations (UN, 2013; UNCTAD, 2010). At the same time, efforts to govern innovation and IPRs are few and far between (Kong et al., 2006).
However, this does not mean that it is impossible for such countries to successfully adopt the creative economy. The huge expansion of multinational companies (MNCs) provides developing countries with an opportunity to rapidly learn new technologies. As a result, they are not only locations for mass-production activities, but also growing as economic systems with socio-cultural and institutional features (Potts, 2009). If developing countries want to develop a creative economy, they need to deal with poor technology and infrastructure challenges, and also compete with Western creative products (Barrowclough and Kozul-Wright, 2008; UNCTAD, 2010). On the other hand, if these countries wish to highlight exotic and heritage values – that is, the cultural economy – policy strategies can be designed differently, in a way that cultural protectiveness will not hinder the creation of economically competitive products.
2.3 Policy transfer and intermediaries in the creative economy
As ‘a global phenomenon and quasi scientific policy rationales’, the creative economy travels to developing countries through policy transfer (Evans, 2009:1005). Policy transfer is the process through which a discourse is brought from one particular setting and applied in others (McCann, 2008). Developing a framework for analysing policy transfer is valuable as this process continues with further stages of structuration and implementation. The literature on policy transfer, both in general and specific to the creative economy, notes that this process involves at least three important aspects: (a) who is involved in this process; (b) what is transferred; and (c) how the idea is transferred (Dolowitz and Marsh, 2000; Dzudzek and Lindner, 2015; McCann, 2008; Prince, 2010).
The first aspect relates to the actors and their motivations in carrying the creative economy to the different contexts. These actors, who have specialist knowledge and play a role in introducing the discourse, are seen as ‘expertise’ (McCann, 2008), or referred to as ‘intermediaries’ in the creative economy literature (O’Connor, 2015). These intermediaries play crucial roles in introducing new ideas, transforming local cultures, providing an opportunity for new practices and acting as agents of change in connecting the discourse with the local contexts and interests to which the idea is being transferred (O’Connor, 2005; O’Connor, 2015). As such, the intermediaries may become important actors who direct others in interpreting the creative economy and guide the further discourse structuration process. In many Asian situations, these intermediaries are international mediators and transnational cooperations

21
Creative economy policy
2
(Kong et al., 2006), as well as academics and professional consultancies (Ren and Sun, 2012). Similar intermediaries can be anticipated in the Indonesian creative economy given the concept is imported from global experiences. Academics can act as intermediaries if they are able to help translate academic concepts into policy recommendations and develop dialogues with decision-makers (Gibson, 2014). In many cases, epistemic communities play more aggressive roles than government assemblages do in structuring the discourse (O’Connor, 2015; Ren and Sun, 2012). These communities often influence government policies on the creative economy. For example, in the UK, cultural policy experts and cultural industry workers formed the Forum on Creative Industries (FOCI) and introduced the term ‘creative industries’, and later influenced policy direction (O’Connor, 2015; Prince, 2010).
The second aspect relates to the ideas that are transferred in the process. Here, one should note that the actual ideas might be not fully transferred, and that, instead, biased or distorted information could be adopted and implemented in further actions. This only partial understanding is not only the result of the actors who help interpret the discourse, it also depends on the setting, the available resources and the audience to which the idea is transferred (Dzudzek and Lindner, 2015). Subsequently, this understanding may influence the policy actions and strategies formulated by the actors (Dolowitz and Marsh, 2000). As outlined in the preceding section, such partial understandings are common in many Asian countries and, therefore, likely to be found in the Indonesian situation.
The third aspect concerns how the idea is transferred and translated into policy actions. Policy transfer occurs when experts travel and distribute policy materials, such as speeches, reports and PowerPoint presentations (McCann, 2008). Following the transfer, the idea will be communicated among institutions, although this might not be in such a way that it shapes concrete policy actions (Dzudzek and Lindner, 2015). Policy transfer and the institutionalisation process involve various stakeholders in different roles. In examining this process, it is necessary to pay attention to the power and influence of these stakeholders, as they not only need the ability and specialist knowledge to communicate the discourse, they also need power and social relationships to shape governmental actions and influence other assemblages (Prince, 2010).
To conclude, these three aspects can be used as the basis for a framework for analysing how the creative economy is interpreted and implemented. That is, our framework will consist of: (a) intermediaries, that is, the actors who help transfer and structure the creative economy ideas; (b) interpretation, that is, the lessons which are learnt from the conceptual ideas of the creative economy; and (c) institutionalisation, that is, how the ideas are transferred and how this process influences further actions.

22
Chapter 2
2.4 MethodologyTo examine how the creative economy travels as a policy strategy across different contexts, we observe intermediaries, interpretations and the institutionalisation process of this policy idea in three localities: Bandung, Yogyakarta and Surakarta. These are the first cities in Indonesia to have explicit creative economy policies, and thus represent the arrival of the discourse in Indonesia. It is difficult to determine whether the interpretation of the discourse in each case aligns with the creative economy view, or whether it is mixed with the cultural economy. We eventually come down to reflecting on which industrial sectors are endorsed by the local governments. In line with the DCMS classification adopted by the Indonesian government, the creative economy is represented by those sectors that, by definition, use individual creativity and aim to produce innovative values and designs. This compares with traditional crafts, which have been employed for generations and which focus less on new knowledge creation, that better align with the cultural economy view.
Policies on the creative economy at the national and local levels were analysed, and semi-structured interviews were conducted to obtain the perceptions of relevant actors about how the creative economy was communicated by these stakeholders and embodied in development frameworks. These interviews were conducted in 2013 with 20 key informants from organisations involved in the institutionalisation of creative economy policy, including representatives of a directorate general in the Ministry of Tourism and Creative Economy (MTCE), related local government bodies, universities and associations of creative and cultural industries. Key informants were first identified through a study of policy documents and newspapers, and further found through recommendations from earlier interviewees (snowballing).
2.5 The Indonesian creative economySingapore, Taiwan, Korea and China refer to both ‘creative’ and ‘cultural’ industries or economies in their policies – but only Singapore carefully clarifies the distinction between them (Kong et al., 2006). Compared to these countries, Indonesia seems to have a stronger preference for the term ‘creative economy’. This reflects the fact that the government has made reference to the British concept in developing its policies: as Minister Mari Pangestu said, ‘we have somewhat followed their examples, especially the UK’.5 The bilateral cooperation over creative industries between Indonesia and the UK has thus been an important facilitator in the transfer of this policy idea.
5 Minister Pangestu’s speech at the Berlin International Economics Congress 2012, https://www.you-tube.com/watch?v=qkLOcLBWlL8
23
Creative economy policy
2
One might wonder why a developing country like Indonesia wants to develop a creative economy. In 2010, agriculture still created 42% of employment, and manufacturing industries contributed 23.9% of GDP. Nevertheless, the government claims that creative industries have created 8.6 million jobs (7% of the workforce) and generated 468.1 trillion rupiah (7% of GDP), and that their growth is expected to increase (MTCE, 2014). With this goal, President Yudhoyono issued Presidential Instruction 6/2009 on the development of the creative economy, which encourages local governments to include the creative economy as part of their development agendas, and created the Ministry of Tourism and Creative Economy (MTCE) in 2011.6 The ministry’s name could be seen as indicating that the national government has an ambivalent interpretation of the creative economy. On the one hand, it wishes to facilitate the generation of novel ideas and innovation. On the other, by utilising cultural potentials that are spread across 1340 ethnicities, there are attempts to link creative industries with tourism. As such, traditional cultural industries, such as batik and crafts, are included as creative industries.
Policies on the creative economy at the national level include the above-mentioned Presidential Instruction as well as long-term and mid-term action plans for the creative economy (MTCE, 2014). At the local level, the creative economy is used as a tool for urban economic development and usually included in local development plans (RPJPDs and RPJMDs). Some local governments have conducted policy studies and formulated specific policies for the creative economy, especially those on the island of Java, where the level of economic development and urbanisation is relatively advanced. Here, tertiary sectors are not only growing in metropolitan areas but also in small and medium-sized cities (Fahmi et al., 2014). Each of these cities has its own internal structure and institutional setting, and this is reflected in how the creative economy policy is implemented and the effectiveness of this process.
2.6 The Bandung caseBandung is the third largest city in Indonesia, located 180 km from the capital Jakarta. The service sector has been growing in Bandung following the development of the Purbaleunyi highway that connects Jakarta and Bandung, making it easier for people from Jakarta to visit Bandung for leisure, shopping and a gastronomic experience.7 Along with this, creative industries are growing, especially in the areas of fashion, music and design, which generated 15% of local income in 2007.8
6 The creative economy has been excluded from the Ministry of Tourism and, from 2015, is coordinat-ed by the Creative Economy Board, see http://www.thejakartapost.com/news/2015/01/20/govt-sets-cre-ative-economy-body.html7 The service sector is growing at 8.24% annually, see http://bisnis.news.viva.co.id/news/read/296914-geser-jakarta--bandung-andalkan-sektor-jasa8 Final Report Need Analysis and Roadmap for the Creative City, Bappeda Kota Bandung, 2008

24
Chapter 2
2.6.1 IntermediariesThe term creative industries first emerged in Bandung in the mid-2000s when young entrepreneurs increasingly opened clothing firms and sold their products in ‘distribution outlets’ (distro). These entrepreneurs formed so-called ‘creative communities’, that is, associations of creative entrepreneurs – which clearly have a different meaning from that mentioned in the literature (cf. Florida, 2012; Markusen, 2006). The British Council, which at that time was developing projects on the creative economy in East Asia, was attracted by this development. Together with university actors, especially from the Institut Teknologi Bandung (ITB), the British Council helped the communities develop their networks and organise events in 2007 (e.g. KickFest and HellarFest) where they displayed their products. The British Council also invited a delegation of creative communities to attend the ‘UK-East Asia Creative Cities Forum’ in Yokohama, in July 2007, in which Bandung was selected as one of its creative city pilot projects. The outcomes of this meeting were carried back to Indonesia and distributed not only to creative communities but also to the public. This milestone also encouraged the creative communities and the university actors to strengthen their grassroots movement and to realise the idea of developing Bandung as a creative city. They later formed the Bandung Creative City Forum (BCCF) in 2008, an alliance of creative communities that is similar to FOCI in the UK context (O’Connor, 2015; Prince, 2010). The BCCF in turn played an important role in structuring the creative economy discourse in Bandung and directing the interpretation of the discourse by local government officials.
2.6.2 InterpretationAs directed by those intermediaries, the creative economy is defined in Bandung in accordance with the DCMS list of creative industries. Nevertheless, the local government did not immediately grasp this definition. As one member of the creative communities put it, ‘the government progress [in formulating the policy] was rather slow … They were confused and did not understand what the creative economy really is.’ As such, there was a gap between the grassroots movement and the policymakers. The local government admitted that it had limited resources in attempting to comprehend the creative economy concept. A local official mentioned that this was ‘because the national government did not give clear directions’.
The HellarFest and KickFest events in 2007 were crucial in the formulation of later policies because the local government and the creative communities first engaged at these events. In the wake of these events, the dialogue continued and the communities helped the government determine the direction of the creative economy policy. As a result of this communication process, the local government slowly grasped that creative industries have different characteristics/tradition-based economic activities that aim to preserve culture. As a consequence, in

25
Creative economy policy
2
the local development policy (RPJMD 2009-2014),9 there are distinct strategies for the creative and for the cultural economies. The development of the creative economy aims at ‘supporting creative businesses based on science and technology that potentially deliver added value and are environmentally friendly’ (pp. III–8). In comparison, traditional cultural industries are regarded as part of the effort to preserve culture and traditions, and thus they are supported by ‘enhancing partnerships with the local production centres’ (pp. III–9).
2.6.3 InstitutionalisationFollowing the creative industries ‘boom’ of the mid-2000s, the Bandung government was still not playing a role in promoting the creative economy. The BCCF thought that the government should have played a role because of its legal authority to govern. Although at first the local government took the creative industries for granted, the BCCF, following up on the HellarFest and KickFest events in 2007, attempted to establish deeper communication with some governmental boards. The local government was required to formulate a mid-term development plan (RPJMD) for 2009–2013, and recognised that the creative economy boom could potentially deliver positive impacts on local development. The RPJMD noted that ‘those economic sectors based on sciences, technology, creativity and innovation have not been utilized yet by far’ (pp. II–48), and these sectors were consequently included as one of the strategic development agendas for the coming period. The local government also started to support the community activities in an effort to implement its creative economy agenda. This involved conducting policy research, integrating the government’s and the communities’ programmes, and providing a subsidised co-working space that also functions as the BCCF office.
2.7 The Yogyakarta caseYogyakarta, or Jogja, is well known for its traditional Javanese and Sultanate identities as well as for its universities, which attract potential artists and creative entrepreneurs. The presence of Kraton (a sultanate palace) has influenced societal values. However, not everybody is attached to Kraton traditions. The public enjoy a range of arts and cultural performances, including both folk arts and contemporary arts. This situation makes Jogja both traditional and cosmopolitan at the same time
2.7.1 IntermediariesThe creative economy was applied to Yogyakarta by the national government since the MTCE wanted to replicate the ‘success’ of Bandung in other cities. This was executed by developing ‘creative city pilot projects’10 that attempted to build a brand
9 Perda (Local Regulation) Kota Bandung 9/2009, amended by Perda 8/201110 Further, these pilot projects are intended to prepare these cities so that they can be registered as part of the UNESCO Creative Cities Network (MTCE, 2014).

26
Chapter 2
image from the local cultural potentials. The local government also included the creative economy as part of its development agendas in the 2012–2016 RPJMD.11
2.7.2 InterpretationThe MTCE designated Yogyakarta as the ‘city of crafts and folk arts’ (MTCE, 2014). The RPJMD indicates that ‘the government focuses on delivering subsidies and assistance [only] to the associations (paguyuban) of crafters’ (pp. VII–16). As confirmed through interviews, the craft subsector was prioritised because the local officials thought that ‘Presidential Instruction 6/2009 obliges us to promote existing (creative) industries, and thus we should focus on crafts’. Although the creative economy to an extent mirrored that in Bandung, the government applied a different idea in Yogyakarta, one that is rather close to the cultural economy view. Although the growing creative industries, such as animation and clothing, were acknowledged (see RPJMD pp. IV–18), traditional cultural industries were eventually prioritised. The RPJMD also mentions that ‘stakeholders still do not understand the concept of creative industries, there is yet no study on the development patterns of these industries and their impacts on the Yogyakarta economy …’ (pp. IV–18). Therefore, although the ‘creative economy’ was used in the local development policy, its actual meaning and the development strategies to support it were not further exemplified.
2.7.3 InstitutionalisationThis interpretation of a creative economy shaped the policy strategies taken by the local government. The creative economy seemed to be imposed as a support system and by relabelling existing programmes. The interviews confirmed that the creative economy was linked with other development agendas, especially tourism, since ‘creative products’ were expected to strengthen touristic attractions. Further, it was linked with poverty alleviation, and to subsidies and prioritisation given to small and medium-sized enterprises. Such subsidies had actually been delivered before the creative economy was included in the RPJMD. Meanwhile, the rise of creative entrepreneurs, in areas such as animation, clothing industries and contemporary performing arts, was simply assumed, with only the traditional cultural industries being prioritised.
2.8 The Surakarta caseSurakarta, or Solo, is located in Central Java Province and crossed by the Semarang-Yogyakarta regional highway. As in Jogja, the presence of Kraton has influenced urban spaces and cultural identities, and can be seen in the batik (dyed textile) clusters, the cultural heritage and the social systems.
11 Perda Kota Yogyakarta 7/2012

27
Creative economy policy
2
2.8.1 IntermediariesAs with Yogyakarta, the creative economy reached Surakarta through MTCE creative city pilot projects. As part of this, a policy study was conducted by the Surakarta Office of the Bank of Indonesia and the University of Muhammadiyah Surakarta that helped identify the development focus for the local creative economy: namely, crafts, fashion and performing arts (Kompas, 2010). At the same time, there was growing interest among local communities in revitalising some old batik clusters, that is, kampongs where people lived and worked as batik creators. For instance, Kampong Batik Laweyan and Kampong Kauman were transformed into tourist destinations. This effort was initiated by a university lecturer who lived in the neighbourhood (Adi, 2012). These revitalization movements did not particularly wish to promote the creative economy but rather aimed at reinventing heritage values. Nevertheless, the local government believed that the creative economy agenda could benefit from this grassroots initiative, in that the agenda would focus on the existing cultural industries.
2.8.2 InterpretationThe local government believed that ‘there are many potentials of cultural diversity in Surakarta that can be shown off in the outer world’ (RPJMD pp. IV–6).12 As such, batik, as part of the local cultural heritage, should be the focus of creative economy development. The philosophy of batik was selected as the basis for the creative economy as it was seen as not only aesthetic motifs and economically valuable commodities, but also as a way of life. In this respect, Surakarta’s interpretation of the creative economy is closer to the cultural economy view. Such a strong attachment to culture has been found to be a barrier to the development of more ‘contemporary’ creative industries. As a community member explained:
it is rather difficult … That we now awaken [i.e. redevelop cultural activities] is, to me, already good. But, for creating something new, that takes some time. Besides, not all people would take risks, while creativity is to take risk.
2.8.3 InstitutionalisationPolicy strategies for the ‘creative economy’ in Surakarta were embodied in the city branding itself as ‘Solo Kreatif Solo Sejahtera’ (Creative Solo, Wealthy Solo). This was designed to build the city image and to attract visitors to cultural festivals and batik clusters, where cultural products would be distributed. Given that the local government focused on batik and other cultural industries, the policy strategies seem to focus on promoting traditional culture. In this regard, the local government supported batik businessmen and the clusters by providing subsidies, including training, equipment and promotions. In line with the city branding strategy,
12 Perda Kota Surakarta 12/2010

28
Chapter 2
cultural festivals have also been organised to promote cultural products and the revitalised clusters.
2.9 DiscussionThe creative economy is interpreted differently across countries (Evans, 2009). It is thus unsurprising that the discourse is interpreted in different ways in individual localities in Indonesia. We identified two different interpretations of the creative economy in Indonesia. Of the three localities investigated, Bandung is the only one whose interpretation aligns with the generally accepted understanding of a creative economy. Yogyakarta and Surakarta, on the other hand, seem to have pragmatically adopted the term but use it to refer to existing traditional businesses. In the latter two, efforts to manage innovation and knowledge are very limited compared to those devoted to preserving heritage and traditions. As such, their interpretation is closer to the cultural economy view.
Below, we explain how these interpretations are able to differ and how they shape the policy actions regarding the creative economy (see Table 2.1).
2.9.1 The role of intermediariesIntermediaries have played an important role in determining in which direction the creative economy discourse was interpreted. The discourse arrived in Indonesia through a two-stage inter-referencing process. First, as in other Asian countries, it was transferred from abroad, and here especially from the British context, to Bandung by international agents and epistemic communities (see Kong et al., 2006; Ren and Sun, 2012). Second, the developments in Bandung became a benchmark for application in other cities, and were to some extent enforced by the national government. These actors in turn influenced the discourse structuration processes that differ from case to case.
Creative communities in Bandung facilitated policy transfer and helped restructure the local institutions to align with their understanding of the creative economy. It is notable that these communities were much influenced by academic thinking, with local university actors directly helping to establish these communities. As such, universities played not only formal roles in educating potential creative entrepreneurs and fostering spinoffs, but also participated in the grassroots movement to realise their aim of developing a creative economy in Bandung.
In comparison, there were no such intermediaries in Surakarta and Yogyakarta. The local actors did not learn of the conceptual ideas behind the creative economy directly from experts. Rather, the discourse was handed down by the national government in an effort to repeat the policy development seen in Bandung, which had been evaluated as successful and applicable in other cities. However, the national government failed to provide a sufficiently clear direction, and local governments eventually chose their own understanding of this concept. The best

29
Creative economy policy
2
option, it was thought, was for these cities (Yogyakarta and Surakarta) to promote their traditional cultural potentials as the source of a creative economy. This eventually led the local governments to pick a focus for their creative economies that is rather different to that intended in that innovation is assumed rather than actively stimulated.
2.9.2 Institutionalisation: bottom-up versus top-downWe have identified two distinct approaches to the structuration of the creative economy in development policies in Indonesia. Firstly, the discourse was introduced in a bottom-up way by creative communities in Bandung who directed the interpretation towards the creative economy view. Secondly, in Surakarta and Yogyakarta, the discourse was applied by the national government in a top-down way through creative city pilot projects, which resulted in a situation resembling the cultural economy view. The structuration approaches adopted, and also the way in which the discourse was embodied in local policies, influenced the policy actions formulated to stimulate a creative economy.
Table 2.1 Comparison of cases
Aspect Bandung Yogyakarta SurakartaUrban characteristicsPopulation ~2.4 m ~600,000
(~2m in the greater area)~500,000
Social diversity Diverse Diverse Limited diversityIntermediaries/actorsInitiative Communities, academics,
The British CouncilNational government National government
InterpretationViewpoint adopted Creative economy Cultural economy Cultural economyTypes of creative/ cultural industries
Fashion, design, music Crafts, performing arts (animation and fashion acknowledged)
Crafts, design (batik), performing arts
InstitutionalisationEmbodiment of the ‘creative economy’ in development policies
Assumed as an important factor in urban development
Supporting system for tourism and other development agendas
Part of city branding
National government pressure
Limited; rather the national government learnt from Bandung
Strong Strong
Role of communities Directing interpretation, influencing policy, advocacy
Developed their own networks, but not connected to the government’s agenda
Initiating kampong revitalisation projects
University role Educating potential creative entrepreneurs, spinoffs, structuring and introducing the discourse
Educating potential entrepreneurs (animation, traditional arts)
Participating in policy studies and formulation
Subsidies provided Specific grants for creative events, the lease for co-working space
Direct subsidies to crafters Direct subsidies to batik creators and crafters

30
Chapter 2
In Bandung, the initiatives by creative communities triggered interactions among stakeholders in which the creative economy was discussed in the policy arena, studied and then included in the local development plan. The creative economy was positioned as an important factor in economic development, and there has been growing awareness that policy strategies for developing the creative economy differ from those required for traditional cultural industries. Although the further implementation of this policy action is still uncertain, this finding shows that the discourse structuration process, involving related stakeholders, did, in turn, help shape formal and informal institutions as well as encourage the discourse not only to stay on the discourse level but also to be converted to policy strategies.
Surakarta and Yogyakarta share both similarities and differences in how the creative economy was institutionalised. In both, the discourse was similarly applied by the national government, and then incorporated into local development plans. However, the local governments did not fully grasp the characteristics of a creative economy and relabelled existing policies. Policies thus remained the same as before the discourse emerged, and focused on actions such as direct subsidies to stimulate cultural economic activities. As such, the creative economy was forcibly connected to other development agendas, such as tourism and cultural preservation, poverty alleviation and city branding. Nevertheless, there was a slight difference between the two cities in how the discourse was communicated between stakeholders before it was included in local policies. In Surakarta, the potential of a creative economy was communicated among local institutions, but the local government eventually chose traditional cultural industries as the focus of development. Since the local government and the communities shared the goal of revitalising their cultural heritage, one can conclude that this development focus was intentional rather than accidental. In comparison, in Yogyakarta, creative economy ideas were only communicated between governmental organisations. The presence of ‘contemporary’ creative economic activities was simply assumed, and there was no express intention to open lines of communication with them. At the end of the day, the ‘creative economy’ remained a government discourse. This finding strengthens the argument that local governments do have the authority to determine the development focus. This is clearly an implication of decentralisation and the local autonomy rights that they possess that allow them to experiment with new ideas and locally rooted development processes.
2.9.3 Place contextsOur findings show that the different interpretations correspond to specific nuances in the institutionalisation process. In particular, this relates to the attachment to local traditions and place-specific contexts. Despite being in the Sundanese region, Bandung appears to have a relatively cosmopolitan culture that made it easier to support a creative economy agenda focused on popular contemporary culture. In comparison, Yogyakarta and Surakarta are strongly attached to Javanese traditions,

31
Creative economy policy
2
which made them reluctant to support the development of contemporary culture. Despite this reluctance, the term creative economy was used, but with little attention given to the actual concept. Instead, existing cultural industries were relabelled as creative, although ‘genuine’ creative industries have nevertheless increasingly appeared. This finding is consistent with other cases in Asia where the discourse is similarly used only normatively to strengthen the local economy image (Gibson and Kong, 2005; Kong et al., 2006).
2.10 ConclusionsIndonesia, as other developing countries, has reinterpreted the ‘Western’ idea of a creative economy to fit the different socioeconomic contexts. A resistance to IPRs coupled with a strong attachment to traditions inhibits an interpretation that is close to the original concept. This is aided by the ongoing trend of decentralisation in the country enabling different implementations and understandings of such a policy idea across localities. The Bandung situation provides the insight that the creative economy works not only as a discourse but also as an operationalised framework that guides policy experimentation. In this case, intermediaries played crucial roles in introducing the discourse, in directing the interpretation so that it remained close to the creative economy perspective and in reshaping formal and informal institutions such that the discourse was translated into policy actions. Given this situation, we argue that it is possible for lower-income countries such as Indonesia to implement a creative economy policy, although not in all regions. In the other cities, the interpretations show a closer adherence to the cultural economy view, encouraged by the fact that these regions have a potential based on traditional cultural industries. As such, we suggest that the policy expectations regarding a creative economy need to be carefully formulated, and should be tailored to local specific contexts.
Our findings also have important implications for academic and policymaking worlds, including in other Asian and developing countries. First, in many Asian countries, traditional businesses are often promoted as creative industries. However, as traditional and creative businesses have different characteristics and potentially different outcomes, we should treat the two types of businesses differently. In this sense, they each require different sets of policy strategies. Second, it is worth giving attention to the presence of, and the potential collaboration with, intermediaries, especially universities and expert fora, who can proactively shape local institutions according to their informed interpretations. Third, and related to the previous aspect, we should reconsider the ways in which the creative economy is adopted at the local level. Most central governments seem to apply the creative economy idea by providing guidance to local governments. However, as we saw in Bandung, grassroots movements can sometimes structure institutions more effectively and, thus, participatory actions should be enabled that encourage collaboration between local stakeholders. Local governments should also be encouraged to better identify

32
Chapter 2
local development potentials so that a creative economy can be built on place-based considerations.
AcknowledgementsThe authors thank three anonymous referees for their constructive comments.
Article NotesFunding This research is funded by Ubbo Emmius Fund, Faculty of Spatial Sciences, University of Groningen. The fieldwork for this study was also partially funded by Beasiswa Unggulan Luar Negeri, Directorate General of Higher Education, Indonesia.
Authors’ note An earlier version of this paper is was presented at the 54th ERSA Congress, St Petersburg, 26–29 August 2014.
ReferencesAdi GN (2012) Revival of Kampung Laweyan’s Batik industry. The Jakarta Post, 16 March, Available at: http://www.
thejakartapost.com/news/2012/03/16/revival-kampunglaweyan-s-batik-industry.html. Adorno T (1991) The Culture Industry: Selected Essays on Mass Culture. London: Routledge. Andersson ÅE, Andersson DE, Daghbashyan Z and Hårsman B (2014) Location and spatial clustering of artists.
Regional Science and Urban Economics 47: 128-137. Andersson DE, Andersson ÅE and Mellander C (2011) Handbook of Creative Cities. Cheltenham and Northampton:
Edward Elgar. Andres L and Chapain C (2013) The Integration of Cultural and Creative Industries into Local and Regional
Development Strategies in Birmingham and Marseille: Towards an Inclusive and Collaborative Governance? Regional Studies 47(2): 161-182.
Banks M and O’Connor J (2009) After the creative industries. International Journal of Cultural Policy 15(4): 365-373.
Barrowclough D and Kozul-Wright Z (2008) Voice, choice and diversity through creative industries: towards a new development agenda. In: Barrowclough D and Kozul-Wright Z (eds) Creative Industries and Developing Countries: Voice, Choice and Economic Growth. New York: Routledge, 3-36.
Chapain C, Clifton N and Comunian R (2012) Understanding Creative Regions: Bridging the Gap between Global Discourses and Regional and National Contexts. Regional Studies 47(2): 131-134.
Costa P (2008) Creativity, innovation and territorial agglomeration in cultural activities: the roots of the creative city. In: Cooke P and Lazzeretti L (eds) Creative Cities, Cultural Clusters and Local Economic Development. Great Britain: Edward Elgar.
DCMS (2013) Classifying and Measuring the Creative Industries. London: Department for Culture, Media and Sport.
Dolowitz DP and Marsh D (2000) Learning from Abroad: The Role of Policy Transfer in Contemporary Policy-Making. Governance 13(1): 5-23.
Dzudzek I and Lindner P (2015) Performing the Creative-Economy Script: Contradicting Urban Rationalities at Work. Regional Studies 49(3): 388-403.
EU (2010) Green Paper Unlocking the Potential of Cultural and Creative Industries. Brussels: European Comission. Evans G (2009) Creative Cities, Creative Spaces and Urban Policy. Urban Studies 46(5-6): 1003-1040. Fahmi FZ, Hudalah D, Rahayu P and Woltjer J (2014) Extended urbanization in small and medium-sized cities: the
case of Cirebon, Indonesia. Habitat International 42: 1-10. Florida R (2005) Cities and the Creative Class. New York and London: Routledge. Florida R (2012) The Rise of the Creative Class, Revisited. New York: Basic Books. Galloway S and Dunlop S (2007) A Critique of Definitions of the Cultural and Creative Industries in Public Policy.
International Journal of Cultural Policy 13(1): 17-31.

33
Creative economy policy
2
Geenhuizen Mv and Nijkamp P (2012) Creative Knowledge Cities Myths, Vision and Realities. Cheltenham and Northampton: Edward Elgar.
Gibson C and Kong L (2005) Cultural economy: a critical review. Progress in Human Geography 29(5): 541-561. Gibson C and Homan S (2004) Urban Redevelopment, Live Music and Public Space. International Journal of
Cultural Policy 10(1): 67-84. Gibson C (2014) Negotiating Regional Creative Economies: Academics as Expert Intermediaries Advocating
Progressive Alternatives. Regional Studies 49(3): 476-479. Glaeser EL and Saiz A (2003) The Rise of the Skilled City. NBER Working Paper No. 10191, December 2003. Glaeser EL (2005) Edward L. Glaeser, Review of Richard Florida’s The Rise of the Creative Class. Regional
Science and Urban Economics 35(5): 593-596. Hajer M and Versteeg W (2005) A decade of discourse analysis of environmental politics: Achievements,
challenges, perspectives. Journal of Environmental Policy & Planning 7(3): 175-184. Hall P (2000) Creative Cities and Economic Development. Urban Studies 37(4): 639-649. Hartley J (2005) Creative Industries. UK: Wiley-Blackwell. Hesmondhalgh D (2002) The Cultural Industries. London: SAGE Publications Ltd. Hesmondhalgh D (2008) Cultural and Creative Industries. In: Bennett T and Frow J (eds) The SAGE Handbook of
Cultural Analysis. London: SAGE Publications Ltd, 552-569. Howkins J (2001) The Creative Economy: How People make Money from Ideas. England: Penguin Press. Jaguaribe A (2008) The policy parameters. In: Barrowclough D and Kozul-Wright Z (eds) Creative Industries and
Developing Countries: Voice, Choice, and Economic Growth. New York: Routledge, 305-29. Kompas (2010) Industri Kreatif, Masa Depan Kota Solo. Kompas, December 10. Kong L, Gibson C, Khoo L and Semple A (2006) Knowledges of the creative economy: Towards a relational
geography of diffusion and adaptation in Asia. Asia Pacific Viewpoint 47(2): 173-194. Markusen A (2006) Urban development and the politics of a creative class: evidence from a study of artists.
Environment and Planning A 38(10): 1921-1940. Markusen A and Schrock G (2006) The Artistic Dividend: Urban Artistic Specialisation and Economic Development
Implications. Urban Studies 43(10): 1661-1686. McCann EJ (2008) Expertise, truth, and urban policy mobilities: global circuits of knowledge in the development of
Vancouver, Canada’s’ four pillar’drug strategy. Environment and Planning.A 40(4): 885. MTCE (2014) Ekonomi Kreatif: Kekuatan Baru Indonesia Menuju 2025. Jakarta: Ministry of Tourism and Creative
Economy. O’Connor J (2005) Creative exports. International Journal of Cultural Policy 11(1): 45-60. O’Connor J (2015) Intermediaries and Imaginaries in the Cultural and Creative Industries. Regional Studies 49(3):
374-387. O’Connor J (2000) The definition of the ‘Cultural Industries’. The European Journal of Arts Education 2(3): 15-27. OECD (2014) OECD Regional Outlook 2014: Regions and Cities: Where Policies and People Meet. Paris: OECD
Publishing. Peck J (2005) Struggling with the Creative Class. International Journal of Urban and Regional Research 29(4):
740-770. Potts J (2009) Do developing economies require creative industries? Some old theory about new China. Chinese
Journal of Communication 2(1): 92-108. Pratt AC (2008a) Innovation and Creativity. In: Hall T, Hubbard P and Short JR (eds) The SAGE Companion to the
City. London: SAGE Publications Ltd, 138-153. Pratt AC (2008b) Creative Cities: The Cultural Industries and the Creative Class. Geografiska Annaler: Series B,
Human Geography 90(2): 107-117. Pratt AC (2009a) Policy Transfer and the Field of the Cultural and Creative Industries: What Can Be Learned from
Europe? In: Kong L and O’Connor J (eds) Creative Economies, Creative Cities: Asian-European Perspectives. Dordrecht: Springer, 9-24.
Pratt AC (2009b) Cultural Economy. In: Kitchin R and Thrift N (eds) International Encyclopedia of Human Geography. Oxford: Elsevier, 407-410.
Prince R (2010) Fleshing out expertise: The making of creative industries experts in the United Kingdom. Geoforum 41(6): 875-884.
Ren X and Sun M (2012) Artistic Urbanization: Creative Industries and Creative Control in Beijing. International Journal of Urban and Regional Research 36(3): 504-521.

34
Chapter 2
Rodrik D (2008) One Economics, Many Recipes: Globalization, Institutions, and Economic Growth. USA: Princeton University Press.
Rodrik D (2014) When Ideas Trump Interests: Preferences, Worldviews, and Policy Innovations. Journal of Economic Perspectives 28(1): 189-208.
Scott AJ (1997) The Cultural Economy of Cities. International Journal of Urban and Regional Research 21(2): 323-339.
Scott AJ (2006) Creative Cities: Conceptual Issues and Policy Questions. Journal of Urban Affairs 28(1): 1-17. Smith R and Warfield K (2008) The creative city: a matter of values. In: Cooke P and Lazzeretti L (eds) Creative
Cities, Cultural Clusters and Local Economic Development. Cheltenham and Northampton: Edward Elgar Publishing, 287-312.
UN (2004) Creative Industries and Development. São Paulo: United Nations. UN (2013) United Nations Creative Economy Report 2013 Special Edition Widening Local Development Pathways.
New York: United Nations. UNCTAD (2010) Creative Economy Report 2010 A Feasible Development Option. Geneva: United Nations. Yusuf S and Nabeshima K (2005) Creative industries in East Asia. Cities 22(2): 109-122.

35
Creative economy policy
2
Appendix 2A List of interviewees(not included in the original article)
No. Organisation Position Date Location NATIONAL GOVERNMENT1 Directorate General for Creative Economy
based on Arts and CultureDirector General 10/04/2013 Kemenparekraf
BANDUNG 2 Local Development Planning Board,
Municipality of BandungStaff member 08/03/2013 Bappeda Bandung
3 Dept. of Industry, Trade and SMEs Head of Department 15/03/2013 Disperindag Bandung
4 School of Business and Management, ITB Professor 13/03/2013 SBM ITB5 Dept. of Architecture/Artepolis Assistant Professor /
Artepolis founder21/03/2013 Center for Urban
Design Studies6 Creative communities partner Freelance researcher 15/03/2013 Akatiga7 Bandung Creative City Forum Internal Director 18/03/2013 Dept. Product
Design ITB8 Taman Kota Coordinator 19/03/2013 Jalan Wira
Angun-Angun9 Common Room Director 21/03/2013 Common RoomSURAKARTA10 Dept. of Industry and Trade, Surakarta Head of Sub Dept. of
Industry25/03/2013 Disperindag
Surakarta11 Local Development Planning Board,
SurakartaHead of Economic Section
25/03/2013 Bappeda
12 Dept. of Culture and Tourism, Surakarta Head of Preservation, Promotion and Partnership
27/03/2013 Disbudpar
13 Solo Creative City Network Coordinator 27/03/2013 Disbudpar14 Kampung Batik Laweyan Forum Chief 27/03/2013 Laweyan15 Mataya Heritage, Red Solo Batik
Community, Blusukan SoloChief 01/04/2013 Mataya
16 Kampong Batik Kaoeman Association Financial manager 01/04/2013 KaumanYOGYAKARTA17 Dept. of Industry and Trade, Special
Province of YogyakartaStaff, Sub Dept of Programming
26/03/2013 Disperindag DIY
18 Dept. of Industry and Trade, Special Province of Yogyakarta
Head of Sub Dept. of Metal, Clothing and Various Industries
26/03/2013 Disperindag DIY
19 Development Planning Borad, Municipality of Yogyakarta
Secretary staff 02/04/2013 Bappeda Kota Yogyakarta
20 Development Planning Borad, Municipality of Yogyakarta
Development and Control Section; member UNESCO CCN proposal team
02/04/2013 Bappeda Kota Yogyakarta
21 lidahibu & mediasastra.com Founder, Member 26/03/2013 Warkop lidahibu22 Papermoon Puppet Managing Director 28/03/2013 Papermoon23 Ketjil Bergerak Managing Director 01/04/2013 nDalem Suratin
Resto24 kotakhitam Managing Director 03/04/2013 Parsley café


The location of creative industries in a developing countryThe case of Indonesia
3

Abstract
This study examines the occurrence and spatial patterns of creative industries in the context of a developing country, specifically Indonesia. Our findings show that, in the context of Indonesia, it is crucial to distinguish between ‘innovative’ creative industries and ‘traditional cultural’ industries. The first category represents those that exploit new knowledge and intellectual property. The latter industries tend to preserve heritage values as selling points and, in Indonesia, they are actually much more significant in economic terms than creative industries and therefore should be taken into account. The spatial patterns of the two industries also differ. Creative industries are likely to concentrate in large urban regions, where innovation and cross-fertilisation of ideas can take place with the support of talent pooling and relatedness among niche producers. The Indonesian case is no exception. Meanwhile, traditional cultural industries are much less dependent on human capital and urbanisation economies. The results of this study suggest that policy strategies aimed at creative industries would be applicable in reasonably advanced regions provided they have sufficient human capital and economic diversification. In comparison, regions specialising in traditional cultural industries can adopt a different strategy to optimise the impact of these industries. Currently, the creative industry policy does not make this distinction.
creative industriescultural industriesspatial distributiondeveloping countriesIndonesia
This chapter is reprinted from Fahmi FZ, Koster S, van Dijk J (2016) The location of creative industries in a developing country: The case of Indonesia. Cities 59: 66-79, doi: 10.1016/j.cities.2016.06.005
Keywords
t

39
The location of creative industries
3
3.1 IntroductionThe idea of creative industries is built upon particular contexts and phenomena that are found in ‘developed’ countries, most notably in North America, Europe and Australia. Today, many countries outside these contexts have also started adopting the idea as a tool for national and local development. However, it is unclear as to what extent this idea is appropriate for these different settings (see Fahmi, McCann, & Koster, 2015). We argue that understanding the regional setting of creative industries beyond the context of developed countries is important. The development of creative industries in these contexts might reflect different patterns and, thus, policy narratives adopted from developed countries might not be applicable in such contexts.
Existing conceptual and empirical contributions have established that regional social and economic settings are critical for creative industries, and that these place-based characteristics create conditions that may boost creativity and entrepreneurial behaviour (Clare, 2013; Florida, 2002; Lee, Florida, & Acs, 2004). Creative industries usually form geographical clusters, often in large cities, where they can benefit from large markets and a variety of activities and people. Urbanisation economies help creative industries develop through new knowledge creation and cross-fertilisation among different specialties (Feldman & Kogler, 2010; Potts, 2007; Rosenthal & Strange, 2004). However, this premise, based on the situation in developed countries, might not always be valid elsewhere.
In line with this argument, this paper aims to examine the degree to which regional economic settings in Indonesia, a developing country, are suitable for creative industries. Indonesia is regarded as a ‘developing’ country based on its lower-middle level of GNI per capita ($3,630 in 2014), its mid-range HDI (0.684) and its underdeveloped industrial base.13 Indonesia has adopted the notion of encouraging creative industries as an instrument for economic development through policy transfer, an idea built especially on the UK concept (see Fahmi et al., 2015).
Given the specific context of the Indonesian situation, this study provides insights into the development of creative industries in a developing country. Although we use the ‘developing country’ shorthand to classify the Indonesian context, it is clear that ‘developing countries’ consist of a heterogeneous group of nations with a range of levels of socioeconomic development, and that this might be reflected in the characteristics of their creative industries (De Beukelaer, 2014). Indonesia clearly has a different context to higher income countries in Asia that have gone further in the development of creative industries, such as South Korea, Japan and also China, which is still categorised as a developing country, but it is actually the largest exporter of creative products in the world (De Beukelaer, 2014, 2015). Despite
13 See http://data.worldbank.org/country/indonesia and http://hdr.undp.org/en/countries/profiles/IDN

40
Chapter 3
the specific aspects of the context, there are at least two aspects shared between Indonesia and other similarly ranked countries that will enable this study to extract lessons for other lower-middle income countries that are currently implementing a creative economy policy.
First, ‘creative industries’ in developing countries often have distinct characteristics from those in developed countries: they are largely craft-based and frequently not associated with intellectual property and innovation (UNESCO and UNDP, 2013). Here, the Indonesian government promotes long-established traditional businesses embedded in particular regions (e.g., batik, handicrafts) as creative industries, even though these do not emphasise the creation of new knowledge (Fahmi et al., 2015). Although such traditional crafts are classified as creative industries in several countries, including the UK, their share of the craft sector is much lower. In comparison, crafts dominate ‘creative industries’ in Indonesia (see Table 3.3).
Second, as in other developing countries, the characteristics of regional economies and technology in Indonesia are not as advanced as elsewhere, and this could be an obstacle to the creation of new knowledge (Yusuf & Nabeshima, 2005). In general, developing countries are still industrializing, although the service sector is often playing an increasing role. Further, the institutional settings and entrepreneurial environment in such contexts are clearly different in that entrepreneurship often appears as a necessity rather than as an opportunity (Singer, Amorós, & Arreola, 2015). Given these issues, the existing conceptual arguments regarding the clustering of creative industries might not fully be evident in the Indonesian case. As described, tradition-based businesses – which we will refer to as ‘traditional cultural industries’ – reflect a specificity in the creative industries in Indonesia and they may have distinct development patterns. In this regard, we argue that, in the context of Indonesia and perhaps other developing countries, it is necessary to distinguish between ‘traditional cultural industries’ and ‘creative industries’. This will help us to better understand their specific characteristics and design more appropriate policy strategies. If both types of industries have the same development trajectories, one would expect them to be interrelated, and perhaps either substitute or complement each other. In contrast, if they have different development paths, they are likely to be located in different regions, and require different policy strategies. This will challenge the current government’s perspective that leads to implementing the same strategies for both creative and traditional cultural industries (Fahmi et al., 2015).
This paper complements the existing publications on the regional locational patterns of creative industries, which are mostly descriptive (e.g., Boix, Lazzeretti, Capone, De Propris, & Sánchez, 2013; Power, 2002; Pratt, 2004) but much less focussed on explaining factors that determine the pattern (e.g., Lazzeretti, Capone, & Boix, 2012). In order to achieve the aim of this paper, we identify the characteristics of regions where these industries are clustered, and reflect these

41
The location of creative industries
3
findings on the current conceptual and empirical contributions on this issue. A regional level analysis is appropriate for several reasons. First, we can compare the concept of creative industries, imported from the developed world, with the actual potential in the regions of Indonesia. Second, our research findings will allow us to identify which regions specialise in creative and/or traditional cultural industries, so that development strategies can be designed to respond better to local potentials. Third, and related to this, as decentralisation is of growing factor in Indonesia, a good understanding of place-specific characteristics is essential to steer regional development processes and policies.
This article is organised as follows. First, in the next section, given the distinct nature of creative industries beyond the developed world, we revisit the definition of such industries in Indonesia. This is followed by a conceptual foundation for examining the factors affecting the location of creative industries. The methodological framework is then presented, followed by a national-level overview of creative industries. The factors associated with the spatial distribution of these industries are then examined, followed by discussion and conclusions.
3.2 Defining creative industries in the context of Indonesia
The term creative industries first emerged in Indonesia when young creative people established indie music and clothing industries (‘distro’) in Bandung in the first decade of the new millennium. These youngsters, supported by the British Council, then attempted to develop Bandung as a ‘creative city’. Later, the national government had the idea that creative industries could also be established in other localities. In response, President Yudhoyono issued Presidential Instruction 6/2009 on the development of the creative economy, which obliges all local governments to promote creative industries in their own localities, and this was followed by the formation of the Ministry of Tourism and Creative Economy (MTCE).14
In practice, the Indonesian government’s classification of creative industries predominantly follows the British (DCMS and John Howkins) model (MTCE, 2014). This British understanding was transferred through the bilateral cooperation between Indonesia and the UK on creative industries (Fahmi et al., 2015). Notwithstanding this standardised definition by the central government, the creative industry notion is interpreted differently across regions. In some localities, such as Bandung, creative industries are considered to encompass ‘innovative’ activities, whereas, in other cities, local governments promote the long-established tradition-based activities embedded in many regions, such as batik and traditional crafts, as creative industries (Fahmi et al., 2015). This suggests that, in practice, the
14 Since 2015, creative economy affairs in Indonesia have been coordinated by the Creative Economy Board

42
Chapter 3
single, albeit broad, national definition of ‘creative industries’ does not correspond to the regional economic realities.
The creative economy masterplan (MTCE, 2014) does not explicitly explain why the British classification is embraced. Rather, the DCMS list of creative industry subsectors is used, and existing industries are positioned within one of these subsectors. The subsectors cover architecture, advertising, antiques, design, crafts, fashion, film, video and photography, interactive games, music, performing arts, publishing, research and development, software, and television and radio.15 Nevertheless, the DCMS definition appears to work in Indonesia because these sectors are present in the Indonesian economy. Conceptually, however, the positioning of the existing sectors in the DCMS model is less straightforward. In particular, the craft industry in Indonesia, which is large in terms of firms and employment, does not meet the conceptual definition of a creative industry as advanced in the literature. The notion of creative industries is understood as economic activities that use individual creativity, skill and talent, and potentially yield economic values, through the exploitation of intellectual property (e.g., DCMS, 2013). As such, there are several characteristics that a creative industry should demonstrate. First, these industries should continuously seek to generate new ideas by conducting research and development around their products and services, an aspect in which individual creativity plays a crucial role. Second, as these industries are focussed on generating original and novel values, this intellectual property needs to be protected. Third, these industries usually need to adapt to recent technologies that support their creative processes (see Banks & O’Connor, 2009; Flew, 2013; Galloway & Dunlop, 2007; Garnham, 2005; O’Connor, 2009).
This conceptual description is used to reclassify creative industries. Ideally, the three features of creative industries – innovation, copyright and technology – are measured on the level of occupations or firms, which is unfortunately usually impossible due to a lack of data. This places a limitation on studies of creative industries (see also Lazzeretti, Boix, & Capone, 2008; Lorenzen & Frederiksen, 2008; Power, 2002). We use available data from the Economic Census to develop a classification by assessing existing industrial sectors.16 In so doing, the UK classification is used as the basis, and we evaluate whether economic activities performed in industrial sectors are broadly in line with the characteristics of creative industries explained above (see Appendix 3A). 17
15 In a later version, ‘culinary’ is added to the creative industries classification. However, this sub-sector is not included in our analysis since it is does not fit with most of the conceptual models in the literature. Further, ‘creative culinary’ is not captured well by the Indonesian industrial classification.16 KBLI, similar to ISIC.17 Unlike the government’s classification, we excluded trade and other supporting activities, as our focus is on the production of creative products.

43
The location of creative industries
3
As such, advertising, architecture, design, publishing, IT and software, radio and television, and research and development can be categorised as creative industries as, generally speaking, these subsectors utilise individual creativity to provide services, often tailor-made, for their consumers whose preferences should be addressed. In this regard, research and development, as well as technologies, are generally required to generate innovative ideas or designs. As such, the products have the potential to be copyrighted. We also include visual, recorded and performing arts in this creative industry category since, in general, these subsectors rely heavily on new ideas to express their art, even though they are ‘traditional’ and do not always use new hardware technologies.
In comparison, traditional crafts have different characteristics and do not seem to comply with the conceptual definition of creative industries. Crafts might use new technologies to support their production processes, but certain methods or customs are preserved. For instance, batik is based on hot wax (‘malam’) being applied to fabric in creating the design. Traditional crafts are strongly attached to tradition, which is the main source of ideas in the development of their products. They have existed for a long time and are an integral part of regional identities, wherein a large number of residents usually participate in the crafting activities and knowledge is passed down through the generations. Even though new ideas and designs are applied, a core prerequisite is the preservation of regional heritage and values which provide unique selling points (Kong, Gibson, Khoo, & Semple, 2006; O’Connor & Xin, 2006). This does not mean that craft industries are not creative, or any less innovative than subsectors falling within the creative industries category. However, traditional crafts utilise a different type of creativity. Whilst creative industries exploit individual creativity, traditional crafts tend to benefit from communal creativity, in which individual creative acts cannot be disentangled from collective values and knowledge – in this case, local traditions. This has implications for the nature of the products in that it is more difficult to assess their originality and intellectual property. Since tradition is a collective good, the copyright mechanism generally applied to knowledge-based products – the ‘Western’ copyright regime – cannot be applied to traditional crafts (see Boateng, 2011). For these reasons, it seems logical to separate traditional crafts from the creative industries category in the Indonesian context. To reflect their distinct characteristics, we refer to these industries as ‘traditional’ cultural industries. We also place antiques in this category since this subsector also seeks to highlight and preserve retrospective values.
It is difficult to place the Indonesian fashion industry in either the creative or the traditional cultural industries. One might expect the fashion industry to continuously develop new styles and designs and, as such, be distinct from traditional crafting activities as explained above. However, many fashion firms in Indonesia are not involved in this innovative process and, for this reason, we exclude fashion from our analytical model.
44
Chapter 3
We accept that this binary dichotomisation of ‘creative’ and ‘cultural’ industries can be criticised. Some scholars argue that the two notions cannot be disentangled since the idea of creative industries is historically and conceptually rooted in the notion of cultural industries (e.g., Flew, 2002). Other scholars criticise the notion of creative industries as reusing existing concepts from the arts and cultural industries, but then extending the boundary by combining cultural industries, such as performing arts, with industries that have different characteristics, such as software and advertising (O’Connor, 2009). However, in the context of Indonesia, separating creative and traditional cultural industries seems justified. First, the Indonesian government does not adopt the term ‘cultural industries’, but uses ‘creative industries’ and the ‘creative economy’, and particularly the DCMS definitions of these terms. Further, given the distinct regional interpretations of the broad term ‘creative industries’, it seems logical to separate the two types. From a theoretical perspective, it could be expected that the economic growth associated with ‘creative’ and with ‘traditional cultural’ industries might take distinct forms. Therefore, in the Indonesian context, it is useful to acknowledge the underlying heterogeneity reflected in the broad ‘creative industries’ term. Second, by establishing this distinction, we can control for a specific segment of the creative industries in Indonesia which has a different agenda: traditional cultural industries might even discourage the creation of new knowledge in aiming to promote the uniqueness of Indonesian traditions. Nevertheless, they can still be very important for regional economic development. It is worth noting that, in the context of Indonesia, traditional cultural industries are profuse (see Table 3.3) whereas, in developed countries such as the UK, crafts usually constitute only a small proportion of the creative industry contribution.
To summarise, we argue that, in the context of Indonesia and perhaps in other developing countries, it is necessary to distinguish between traditional cultural industries and creative industries. Both industries may require distinct contexts to blossom and their economic contributions could be different. Establishing this distinction is likely to be helpful in better understanding the different characteristics, and the regional settings that support, each type of industry.
3.3 Regional settings for creative industriesPrevious studies have shown that creative (and cultural) industries are most likely to flourish in larger cities (e.g., Boix et al., 2013; Lazzeretti et al., 2008; Lorenzen & Frederiksen, 2008; Power, 2002). In general, larger cities provide better access to recent technology, economic resources and soft infrastructure. These supply factors, it is argued, attract creative industries that are searching for knowledge and innovative externalities (Comunian, Chapain, & Clifton, 2010; Florida, 2002; Storper & Scott, 2009). An alternative explanation originates from the demand side, viewing cities as centres of consumption and places of cultural expression and enjoyment. As a consequence, creative industries converge on cities to more easily meet market demands and trends (Glaeser, Kolko, & Saiz, 2001; Scott, 1997).

45
The location of creative industries
3
Understanding the location patterns and development dynamics of creative industries outside of the context of developed countries is important because the empirical reality might not reflect the above arguments that are based on research in developed countries. In particular, it is questionable whether the arguments are relevant to traditional cultural industries, which form the bulk of Indonesian ‘creative industries’, and their location decisions. To construct a conceptual framework for examining the regional characteristics of where creative industries are located, we review both supply-side and demand-side factors and place them in the context of developing countries. These factors are made up of: human capital, the economic and entrepreneurial climate, potential markets, urbanisation economies, and institutional factors.
3.3.1 Human capitalTo start a creative business, creative people are required. Such people are generally young in spirit and are easily able to adapt to new knowledge and technology (Ó Cinnéide & Henry, 2007). They are generally, but not always, highly educated (Florida, 2012). Such people are expected to possess the entrepreneurial skills required for improving the economic value of their products (Ó Cinnéide & Henry, 2007; Potts, 2007). Entrepreneurial skills also enable creative entrepreneurs to search for new opportunities and to reduce risks in order to develop their business (Sawyer, 2012). A concentration of creative industries is therefore likely to be supported by a talent pool of young creative people and university graduates, including in the developing world. Many developing countries have experienced a ‘demographic bonus’, so might benefit from the increasing participation of young people in the labour market (Lam, 2006). However, this does not ensure that these youngsters will start creative businesses and form a cluster of creative industries. Other factors need to trigger the formation of creative businesses and networks, such as university education and spinoffs.
3.3.2 Potential marketsCreative industries are associated with post-industrial cities, where service industries increasingly dominate the economy (Flew, 2002; Garnham, 2005). Service firms are potential consumers of creative industries, especially those requiring specific services such as advertising, publishing and multimedia provision. Creative industries need to focus on continuously monitoring trends and consumers’ tastes in uncertain and rapidly changing markets (Caves, 2000). However, as they generally have extensive networks and are supported by information technology (IT) and social media, their markets are not necessarily limited by their location (Florida & Jackson, 2010). Therefore, one would expect creative industries to prefer urbanised areas and fairly advanced regions with good IT connectivity, and this will help them access both local and global markets.

46
Chapter 3
In a developing country, such as Indonesia, cities might not yet have reached the ‘post-industrial’ phase. Nevertheless, there are rapidly growing cities that have a supra-regional function that extends beyond their direct hinterland and where specialised business services are an important contributor to the local economy (Cohen, 2004). Creative industries are likely to congregate in such cities as they provide relatively advanced facilities, including IT, which help them reach out to their potential markets.
3.3.3 Economic and entrepreneurial climateThe employment structure and economic conditions can determine the location of creative industries. A favourable entrepreneurial climate and culture will encourage people to seek out new opportunities and start new businesses (Malecki, 1993). As such, creative entrepreneurs will probably be located in areas characterised by creativity, diversity and innovation (Lee et al., 2004).
However, the influence of such a climate on creative industries in a developing country, such as Indonesia, might require a complex interpretation. When people become entrepreneurs, this does not automatically mean that they are vigorously responding to opportunities in the economy, it may be that they are unable to perform other jobs (Singer et al., 2015). It is thus uncertain whether creative industries are started in response to a creative recognition of economic opportunities, in which the entrepreneurial climate plays a role (see Ó Cinnéide & Henry, 2007).
3.3.4 Urbanisation economiesCreative industries have been found to benefit from urbanisation economies that support innovation and flexibility by facilitating information flow and interaction networks. Large cities in particular are home to a wide diversity that fosters the cross-fertilisation of ideas (Jacobs, 1992; Rosenthal & Strange, 2004). Related variety within sectors and path dependency have been found to induce cross-fertilisation (Boix-Domenech, Hervás-Oliver, & De Miguel-Molina, 2014; Lazzeretti, Boix, & Capone, 2013). A diversity of skills will encourage creative firms to collaborate with each other through frequent interactions and knowledge transfer (Feldman & Kogler, 2010; Potts, Cunningham, Hartley, & Ormerod, 2008; Power, 2002). As such, we might expect creative industries to be concentrated in regions with diversified economies. In a developing country, such as Indonesia, such regions are rare. Manufacturing industries, and even agricultural activities, remain important contributors to the economy, although it is still possible that service industries can dominate several urban economies.
3.3.5 Institutional factorsPrevious studies have shown, as Florida (2012) postulated, that ‘soft’ factors, such as urban amenities, quality of life, social diversity and tolerance, are associated
47
The location of creative industries
3
with the locational patterns of creative industries or occupations (e.g., Lazzeretti et al., 2013; Wenting, Atzema, & Frenken, 2011). In addition to the physical objects within the cultural amenities, it is also possible that symbols and qualities could play a role in facilitating the creative process (Andersson, Andersson, Daghbashyan, & Hårsman, 2014; Boix-Domenech et al., 2014; Lorenzen & Frederiksen, 2008). However, since developing countries have different societal and cultural contexts from the developed world, here again one cannot be sure such factors apply. As De Beukelaer (2015) argues, culture is not generally understood in developing countries as creative artistic expression, but rather it is regarded as ‘a set of beliefs, rules of behaviour and customary behaviours maintained, practiced, and transmitted in a given society’ (Hahn, 1995, p. 42). This suggests that culture might not necessarily support creative processes. As such, there may be better proxies to represent the ‘coolness’ of place in developing countries, and they might vary from place to place.
3.3.6 ‘Traditional’ cultural industries: different explanations?We have argued that creative and traditional cultural industries could have different regional patterns. Using the concept of cultural industries as explained in the literature to examine the regional distribution of traditional cultural industries might be problematic since they seem to have different development trajectories. Whereas cultural industries in the literature are typically linked with the function of cities as centres for cultural consumption (Pratt, 2009; Scott, 1997), traditional cultural industries, and notably in Indonesia, are not always associated with urban living. Many of these industries have existed for generations by sharing traditional knowledge and skills hereditarily. As such, the factors affecting their locations might be different from those of the creative industries discussed above. A pool of university graduates and young creative people might be unimportant. An entrepreneurial climate and economic diversification might not be a prerequisite since they might have little interest in creating innovative designs and values. Since they often create cultural products with strong, and often exotic, traditional values, they might locate close to tourism objects since these are more relevant to their important potential markets.
3.4 MethodologyTo identify the characteristics and spatial patterns of creative and cultural industries in Indonesia, we used the 2006 Economic Census data obtained from BPS-Statistics Indonesia. This dataset is collated every ten years and provides information on the characteristics of firms, but it is not panel data.18 As such, these are the most recent economic census data available. Due to missing values, some regions were excluded from the analysis (Tanjungpinang, Pontianak, Minahasa, Manokwari and Nabire).
18 The Economic Census (Sensus Ekonomi) is carried out in two stages. In the first stage (L1), all business units (firms) in each census block are identified and listed. In the second stage (L2), each firm is visited and information obtained about their business.

48
Chapter 3
Table 3.1 Variables used in the analysis
Variable name Label Source Mean SD
Dependent variablesLQ_CI Location quotients for creative industries, not including fashion
(with firm data)(a) 0.815 0.538
LQ_CULT Location quotients for traditional cultural industries (with firm data)
(a) 0.724 0.881
LQ_CIE Location quotients for creative industries, not including fashion (with employment data)
(a) 0.909 0.599
LQ_CULTE Location quotients for traditional cultural industries (with employment data)
(a) 1.070 0.857
Explanatory variablesHuman capitalGRAD Percentage of university graduates in the local population (b), (c) 0.054 0.040YOUNG Percentage of people aged 19-34 in the local population (2005) (d) 0.258 0.052Potential marketslnPOP Total population (natural logged) (e) 12.661 1.011LQ_SERVF Location quotients for service sector industries, including 2-digit
KBLI codes 65-99 (firm data)(a) 0.929 0.329
LQ_SERVE Location quotients for service sector industries, including 2-digit KBLI codes 65-99 (employment data)
(a) 1.008 0.266
LIVCOST Index of standard living costs (x100,000) (f) 6.136 0.168TOUR_OBJ Number of tourism objects (a) 0.531 1.134Economic and entrepreneurial climateSELF_EMPL Percentage of self-employed people in the labour force (2007) (g) 0.194 0.076UNEMP Percentage of unemployed people in the labour force (2007) (g) 0.083 0.042Urbanization economiesUNRELF Unrelated variety (at 2-digit level), firm data (a) 3.048 0.341UNRELE Unrelated variety (at 2-digit level), employment data (a) 3.725 0.308RELVARF Related variety (at 5-digit level within 2-digit class), firm data (a) 2.151 0.458RELVARE Related variety (at 5-digit level within 2-digit class), employment
data(a) 2.531 0.334
Note: Strong correlations were found between LQ_CI and LQ_CIE (0.80) as well as between LQ_CULT and LQ_CULTE (0.87). We can therefore expect that the spatial patterns revealed by both firm and employment data are more or less identical. All data are given for 2006, except YOUNG (2005), SELF_EMPL (2007) and UNEMP (2007). Since these data were collected at adjacent time, it is argued that the actual conditions were not different. The data were calculated from these sources:(a) Unpublished raw data “Sensus Ekonomi 2006”, available from BPS-Statistics Indonesia, Jakarta(b) “Sensus Penduduk NAD dan Nias”, available from BPS-Statistics Indonesia, Jakarta, 2005(c) Penduduk 5 tahun ke atas menurut kabupaten/kota dan pendidikan yang ditamatkan, available
from BPS-Statistics Indonesia website http://www.datastatistik-indonesia.com/portal/index.php?option=com_supas&kat=2&idtabel=9&Itemid=953
(d) Jumlah Penduduk menurut Jenis Kelamin dan Kelompok Umur, available from BPS-Statistics Indonesia website http://www.datastatistik-indonesia.com/portal/index.php?option=com_tabel&task=&Itemid=165
(e) Population Estimation by Municipality/District, Unpublished material, BPS-Statistics Indonesia, Jakarta, 2010(f) Indeks Pembangunan Manusia, BPS-Statistics Indonesia, Jakarta, 2006(g) Unpublished material “Labour Force by Occupation Status and Sector”, calculated from the SUPAS 2007 results”,
available from BPS-Statistics Indonesia, Jakarta, 2007

49
The location of creative industries
3
The data were aggregated at the municipality/district (kota/kabupaten) level to reveal regional differences. We calculated the location quotient (LQ) which is a commonly used value to depict the relative proportion of creative or cultural industries in a region compared to the national level (Boix-Domenech et al., 2014; Lazzeretti et al., 2008, 2013). The formula is as follows:
where li = the number of firms in creative or cultural industries in the region, l = total number of firms in the region; Li = the number of firms in creative or cultural industries nationally, and L = the total number of firms nationally (see also Boix-Domenech et al., 2014). LQs can alternatively be calculated using employment data (number of employees rather than number of firms). We opted to use the number of establishments since the dataset used in this study contains firm-level business characteristics and also because data on employment, especially for regions outside of Java and Bali, are unreliable. Nevertheless, we carried out a robustness analysis using employment data for Javanese and Balinese regions only,19 as a check on the conclusions drawn from the main model. This also enables us to control for the different characteristics and levels of socioeconomic development between Java and Bali, and the other islands.
The next step in the analysis was to explain the regional distribution of creative and traditional cultural industries. For this, regression models were estimated with the LQ for each type of industry as the dependent variable. We included several explanatory variables, for which we again obtained data from BPS-Statistics Indonesia. At this stage, two further districts in Papua (Teluk Wondama and Boven Digoel) were excluded due to missing values.
The subsections below describe the explanatory variables, which were selected based on the theoretical considerations outlined in the previous section, including human capital, potential markets, economic and entrepreneurial climate, and urbanisation economies (see Table 3.1).
3.4.1 Relationships between creative and traditional cultural industries
We included the LQ for traditional cultural industries in the regression model for creative industries, as well as LQ for creative industries in the model for traditional cultural industries. This is intended to investigate the relationship between the two types of industries, particularly whether they are co-located and have a similar development trajectory, and thereby maybe stimulate each other.
19 In the robustness analysis, the national level (Li/L) is defined as all regions on Java and Bali.
!" = $%/$!%/!

50
Chapter 3
3.4.2 Human capitalHuman capital was represented by the percentage of university graduates (GRAD) and the percentage of young people (19-34) in the municipal/district population (YOUNG).
3.4.3 Potential marketsSeveral variables were employed to capture different aspects of potential markets. The logged value of total population (lnPOP) was used to represent the market size of a region. As explained in the previous section, we expected service industries (LQ_SERVF or LQ_SERVE) to be the potential customers of creative industries.20 The index of standard living costs (LIVCOST) 21 was employed to reflect the affordability of creative and cultural products. In view of the Indonesian government’s aim of using creative industries to help develop tourism (Fahmi et al., 2015), we included the number of firms in the tourism industry in a region as a variable (TOURISM).
3.4.4 Economic and entrepreneurial climateTo represent regional economic conditions and the entrepreneurial climate, we used unemployment rates (UNEMP) and self-employment rates (SELF_EMPL). Using unemployment rates can lead to endogeneity problems. Nevertheless, we tried to exclude this variable and the results remained robust.
3.4.5 Urbanisation economiesUnrelated variety (UNRELE or UNRELF) and related variety (RELVARE or RELVARF) reflect regional economic diversity and cross-fertilisation (Frenken, Van Oort, & Verburg, 2007). Unrelated variety is an entropy index measured at the 2-digit class of KBLI codes, and indicates diversity between sectors. Related variety is the weighted sum of the entropy index measured at the 5-digit level within each 2-digit class of KBLI codes. Related variety thus represents the diversity within each sector, and it is assumed that ‘the economies arising from variety are especially strong between subsectors, as knowledge spill overs primarily between firms selling related products’ (Frenken et al., 2007, p. 689).
It is difficult to find good proxies for institutional factors because data on urban and cultural amenities at the regional level are not available. We tried using data on religious and social tolerance, which are a component of the available data on social
20 LQ_SERVF has quite a high correlation with GRAD (0.696); LQ_SERVE has a high correlation with RELVARE (0.511) (see Appendix 3B). We tested excluding the LQ for services from the regression models, and the results remained robust, with VIF values classified as tolerable. We therefore opted for models including LQ_SERVF or LQ_SERVE since the fit was better.21 In the original dataset (regional HDI), the variable is labelled ‘purchasing power parity’, see http://www.bps.go.id/Subjek/view/id/26

51
The location of creative industries
3
capital stock, 22 in our analytical model. However, this variable did not provide any added value to our discussion, so we excluded it from our final model.
3.4.6 Estimation methodsWe used spatial econometrics to correct for potential spatial autocorrelations that may exist between neighbouring municipalities and districts. Essentially, while municipalities and districts are administrative entities, socioeconomic systems may transcend these boundaries. Our application of this method also provides an insight into the use of spatial econometrics in a country made up of many islands. Both specific-to-general and general-to-specific frameworks were followed (see Elhorst, 2013). In adopting the first-order Queen contiguity matrix, we ran into the problem that 20 localities, including those on remote islands, did not have neighbours (i.e. share a land border). To overcome this, we defined nearby localities as neighbours provided there was a reasonable connection in the form of a bridge or frequent boat services. This still left five localities without neighbours (Natuna, Sangihe Islands, Talaud Islands, Maluku Tenggara Barat, and Aru Islands) which we further excluded from the analysis. However, these are small, remote areas and unlikely to influence the results to any extent.
3.5 The development of creative industries in IndonesiaTo understand the position of creative industries in Indonesian economic development, we first review the changing economic geography and sectoral productivity between 1966 and 2013 to position creative industries within Indonesia’s overall economic development. We then describe the characteristics and development patterns of creative industries at the national level followed by the regional distribution of these industries.
3.5.1 Understanding the meaning of creative industries in the Indonesian economy
The increasing role of creative industries in Indonesia’s economy can be placed within the overall macroeconomic development of recent decades. This is particularly related to development since the start of the New Order period, when President Suharto led the country (1966-1998). During this period, the economic policy was highly focused on labour-intensive sectors, and Indonesia experienced rapid industrialisation. As can be seen in Table 3.2, manufacturing and other industries grew significantly between 1966 and 1995. These industries were mostly related to natural resource exploitation, and were largely backed by foreign direct investment (Aswicahyono, Hill, & Najoko, 2011). The New Order economic policy followed the stages of growth as put forward by Rostow, and one of its
22 “Stok Modal Sosial 2010 (Berdasarkan Data Susenas 2009)”, available from BPS-Statistics Indone-sia, Jakarta, 2010

52
Chapter 3
goals was that the country’s economy would ‘take-off ’ in the 2000s (Broad, 1995). Unfortunately, the 1998 East Asian crisis hit almost every sector in Indonesia, and many firms closed down and unemployment rates increased. Manufacture remains a significant contributor to the economy, but its growth has slowed (see Table 3.2). The service sector has, however, grown more rapidly, indicating a shift towards a more diversified economy. Creative industries belong to this area of development, and their development is path-dependent. Creative industries did not emerge as an outcome of deindustrialisation; rather they grew because of the crises: people started to make a living in the informal sectors and entrepreneurial activities, including creative industries. This development occurred along with advances in technology and the expansion of global knowledge networks. As such, the initial motivation for starting in creative, and traditional cultural, industries in Indonesia appears different from the general picture in developed countries, in which start-ups in creative industries are based on opportunity recognition and new technologies (Ó Cinnéide & Henry, 2007).
This trend was not followed everywhere in Indonesia, and the stages and conditions of economic development vary significantly. Consequently, we would not expect to find creative industries everywhere. Since Java and Bali have more advanced levels of economic development (Hill, Resosudarmo, & Vidyattama, 2008), their regional economic settings are more likely to support the development of creative industries. This is however not necessarily the case for traditional cultural industries that have been established for a considerable period. The presence of these industries may be
Table 3.2 Sectoral change in Indonesia’s GDP
Agriculture Manufacturing industries Other industries Services
Annual growth rate (average)1961-1965 1.37 1.85 1.32 2.931966-1975 4.26 9.99 10.01 6.371976-1985 4.13 14.59 3.11 8.201986-1995 3.34 11.05 4.02 7.981996-2000 1.37 3.06 0.29 -0.082001-2006 3.23 4.91 1.16 6.462006-2012 3.77 4.52 1.93 8.02
Sectoral share (average)1961-1965 53.19 8.78 5.42 32.611966-1975 42.34 9.68 12.06 35.921976-1985 25.47 12.46 25.27 36.791986-1995 20.03 20.69 18.00 41.281996-2000 17.21 26.23 18.23 38.332001-2006 14.39 28.17 17.29 40.142006-2012 14.65 25.72 21.54 38.09
Source: Calculated from “World Development Indicators”, available from http://databank.worldbank.org/data/views/variableselection/selectvariables.aspx?source=World-Development-Indicators#

53
The location of creative industries
3
more connected with the development of cultural entrepreneurshipin the past,which took place within community clusters (kampongs). In many such clusters, people have been producing cultural products for many years, and transferring the skills for making these products from generation to generation.
3.5.2 Characteristics of creative and traditional cultural industries in Indonesia
According to the dataset we used, creative industries made up 0.63% of all Indonesian firms in 1996, and this figure increased to 0.69% in 2006 (see Table 3.3). In comparison, traditional cultural industries made up 5.80% of all firms in 1996 and 8.23% in 2006. Together, creative and traditional cultural industries, accounted for 8.92% of the total number of firms in Indonesia in 2006. This is a significant proportion, even when compared to developed countries such as Austria, the UK and Canada (see Evans, 2009). When we looked at the corresponding employment data (Javanese and Balinese regions only because of the previously noted data reliability issues), creative industries accounted for 1.33%, and traditional cultural
Table 3.3 Overview of creative industries by category at the national level
Industries1996 2006 Average
Annual GrowthFrequency % Frequency %
The number of firms (all regions)Advertising and marketing 2,431 0.03% 2,564 0.02% 0.53%Architecture and design 4,144 0.05% 2,837 0.02% -3.72%Visual and recorded arts 15,485 0.17% 20,585 0.16% 2.89%Radio and television 4,177 0.05% 2,981 0.02% -3.32%Performing arts 8,666 0.09% 18,259 0.14% 7.74%Publishing 18,237 0.20% 37,920 0.29% 7.59%IT, software and computer services 2,580 0.03% 3,042 0.02% 1.66%Research and development 1,639 0.02% 1,031 0.01% -4.53%Creative industries (1) 57,359 0.63% 89,219 0.69% 4.52%Antiques 1,396 0.02% 1,379 0.01% -0.12%Crafts 529,772 5.79% 1,064,649 8.22% 7.23%Traditional cultural industries (2) 531,168 5.80% 1,066,028 8.23% 7.21%Creative and traditional cultural industries (1+2)
588,527 6.43% 1,155,247 8.92% 6.98%
Fashion (3) 51,322 0.56% 102,339 0.79% 7.15%Other industries (4) 8,514,445 93.01% 11,696,736 90.29% 3.23%All industries (1+2+3+4) 9,154,294 12,954,322 3.53%The number of employment (Java and Bali)Creative industries (1) 340,507 1.50% 501,642 1.33% 3.95%Traditional cultural industries (2) 2,094,348 9.21% 2,668,690 7.07% 2.45%Creative and traditional cultural industries (1+2) 2,434,855 10.71% 3,170,332 8.40% 2,67%Fashion (3) 628,985 2.77% 822,256 2.18% 2.72%Other industries (4) 19,672,111 86.52% 33,751,055 89.42% 5.55%All industries (1+2+3+4) 22,735,951 37,743,643
Source: Calculated from the results of Sensus Ekonomi 1996 and 2006, available from BPS-Statistics Indonesia

54
Chapter 3
industries 7.07% of the total employment in Java and Bali in 2006. Both the creative and the traditional cultural industries had higher average annual firm growth rates than other industries and, therefore, we expect both industries to make increasing contributions to economic development. They also share similar characteristics: they are mostly small firms and informal businesses, and both have grown in the last decade (see Figure 3.1). Creative industries are generally larger and register higher turnovers, and most of them have been established in the past few decades.
As Table 3.3 shows, the size and growth rates of each subsector vary. Both performing arts and publishing have high growth rates, possibly because of the newfound freedom of expression in writing and performance following the 1998 political reforms. The production of crafts is also growing rapidly, reflecting the importance of this subsector, although it cannot be described as innovative.
Figure 3.1 General characteristics of creative (CI) and traditional cultural industries (CULT)
(a) Firm size (number of employees) (b) Start-up year (c) Turnover (in IDR)
(d) Legal status (e) Proportion located on Java and Bali (compared to all firms in the entire country)
(f) Concentration in urban areas
Source: Illustrated from the results of Sensus Ekonomi 2006, available from BPS-Statistics Indonesia

55
The location of creative industries
3
This descriptive overview acts as a general guide for the next stage of analysis. We can conclude that there are creative industries in Indonesia, even though they constitute only a small proportion of all firms. We also see that traditional cultural industries are growing significantly and are far more numerous. It is therefore necessary to continue to distinguish between creative and traditional cultural industries when attempting to identify their impact on the economy.
3.5.3 Regional distribution of creative and traditional cultural industries
As discussed earlier, creative and traditional cultural industries have different characteristics. This is also apparent in their regional patterns. The correlation between the LQs for both industries (see Appendix 4A) is fairly low. As expected, the regional distributions of both industries differ. Figure 3.1(e) shows that most economic activities, including creative and traditional cultural industries, are concentrated in Java and Bali. Figure 3.1(f) shows that creative industries are concentrated in urban areas (71.2%). In contrast, 75.0% of traditional cultural industries are located in rural areas. This is contrast to the situation in the developed
Figure 3.2 Quantile maps of the concentration of creative and traditional cultural industries

56
Chapter 3
Table 3.4 Main results
Model 1A: Concentration of creative industries (LQ_CI)
Model 2A: Concentration of traditional cultural industries (LQ_CULT)
OLS SDM OLS SDMB (Robust
SE) Direct Indirect Total B (Robust SE) Direct Indirect Total
Relationships CI-CULTLQ_CI −0.054
(0.09)−0.130 0.266 0.136
LQ_CULT −0.011 (0.02)
−0.023 0.000 −0.022
Human capitalGRAD 5.279
(0.95)***6.003*** −1.200 4.802*** 1.6942
(1.39)2.082 −1.525 0.557
YOUNG 0.974 (0.42)**
0.821** 2.471*** 3.292*** −1.464 (0.83)*
−1.000 −0.595 −1.595
Potential marketslnPOP 0.023
(0.02)−0.016 0.107*** 0.091** 0.1895
(0.03)***0.149*** 0.022 0.171**
LQ_SERVF 0.296 (0.09)***
0.282*** −0.226 0.056 −0.94 (0.20)***
−0.934*** −0.051 −0.985***
LIVCOST 0.001 (0.00)
−0.001 0.001 0.001 0.0035 (0.00)
−0.002 0.003 0.002
TOURISM 0.004 (0.00)
0.006 −0.005 0.000 0.0269 (0.02)
0.001 0.058*** 0.058***
Economic & entrepreneurial climateSELF_EMPL −0.363
(0.22)*−0.246 −1.200*** −1.446** −0.019
(0.43)0.127 0.102 0.230
UNEMP 0.120 (0.59)
−0.152 −0.272 −0.424 −2.143 (1.04)**
−0.246 −3.958* −4.204*
Urbanisation economiesUNRELF 0.053
(0.06)0.076 0.014 0.090 0.6404
(0.12)***0.454*** 0.264 0.718***
RELVARF 0.283 (0.05)***
0.273*** −0.025 0.248* −0.179 (0.12)
−0.307*** 0.335 0.028
Intercept or Rho
−1.788 (0.61)***
0.392*** −4.032 (1.69)**
0.224***
N 428 428 428 428R2 0.601 0.682 0.273 0.385F 59.57*** 15.57***Mean VIF 1.69 1.82 Spatial diagnosticsMoran's I 6.93*** 5.36***LM lag 28.37*** 33.74***RLM lag 0.20 9.21***LM error 42.84*** 24.98***RLM error 14.67*** 0.44 SDM model testLR test SAR 54.03*** 29.93***LR test SEM 32.93*** 34.12***
Note: Standard errors in parentheses. *** Significant at 1%.** Significant at 5%.* Significant at 10%.
57
The location of creative industries
3
world context where studies demonstrate that cultural industries are mostly concentrated in urban areas. This suggests that creative and traditional cultural industries could have distinct favourable place-specific contexts.
To illustrate the concentration of these industries, Figure 3.2 shows quantile maps of LQs for each industry using establishment data. Map A highlights the strong concentrations of creative industries on Java. A few concentrations can also be found in several major cities on other islands. It would seem that creative industries grow in highly urbanised areas, where the level of economic development is relatively advanced, and social and economic diversity is relatively high.
Strong concentrations of traditional cultural industries are found not only in Javanese and Balinese regions, but also on other islands (see Map B). This indicates that traditional cultural industries do not only grow in relatively advanced economies, such as Java, but also in less-advanced regional centres outside Java. Although concentrations of both types of industries can be found on the same island, they are distributed in distinct clusters. This suggests that the regional distributions of creative and cultural industries probably have different determinants.
3.6 Explaining the concentration of creative industries in Indonesia
In this section, we present our estimation results that aim to explain the regional distribution of creative and traditional cultural industries described above. We test whether the regional factors reviewed in an earlier section are associated with the actual concentration of creative industries. We ran ordinary least squares (OLS) regression models for both creative and traditional cultural industries. We corrected for heteroskedasticity by including robust standard errors. We subsequently corrected for spatial autocorrelations by estimating spatial econometric models (see Elhorst, 2013). We ran Lagrange multiplier (LM) tests for spatial lag and error, then estimated spatial lag (SAR), spatial error (SEM) and spatial Durbin (SDM) models. We also ran likelihood ratio (LR) tests to determine whether the SDM model could be simplified to either the SAR or the SEM model. All the spatial regression analyses pointed to the SDM model being the best choice, so only that model is presented here.
The following subsections present the estimation results. We first discuss each factor in the main regression models for both creative industries and traditional cultural industries (see Model 1A and 2A in Table 3.4). This is followed by a robustness analysis using the employment data for Javanese and Balinese regions only (see Models 1B and 2B in Table 3.5).

58
Chapter 3
3.6.1 Relationships between creative and traditional cultural industries
Our estimation results demonstrate a lack of mutual relationships between creative and traditional cultural industries. The coefficient of LQ for traditional cultural industries was not significant in Model 1A, and was negatively associated with the share of creative industries in Model 2A. The coefficient of LQ for creative industries was also not significant in Model 1B, and was negatively associated with the share of traditional cultural industries in Model 2B. This finding indicates that the concentration of traditional cultural industries is pertinent to that of creative industries, but they have completely different patterns. Earlier, our descriptive overview showed that both creative and traditional cultural industries have high growth rates (see Table 3.3) and, therefore, we can conclude that the two industries neither substitute nor complement each other. In other words, they have developed in different regions and followed different development trajectories.
3.6.2 Human capitalOur estimation results show that creative and traditional cultural industries have different human capital requirements. Human capital is positively associated with the concentration of creative industries in Indonesia. The coefficients of graduates and young people are positive. This supports the thesis that clusters of creative industries are facilitated by young creative people, who are generally highly educated (Ó Cinnéide & Henry, 2007). The concentration of traditional cultural industries is not governed by the same factors. Human capital appears to play no role, given the non-significant coefficient university graduates and the negative coefficient of young people.
In conclusion, and as seen in developed countries, the clustering of creative industries in Indonesia is supported by higher education and young creative talents. However, these attributes do not seem necessary for traditional cultural industries, which do not appear to exploit new knowledge and intellectual property.
3.6.3 Potential marketsMost of the variables used as proxies for potential markets failed to explain the concentration of creative industries. Both the SDM indirect and total impact estimates of total population were positive in Model 1A, indicating that creative industries can benefit from the presence of a large regional population. The coefficient of LQ for services is positive and significant, showing that creative industries do depend on tertiary economic activities to provide customers. This also indicates that creative industries tend to be concentrated in relatively advanced economies, again in line with the literature (Flew, 2002, 2013; Garnham, 2005). The concentration of traditional cultural industries is associated with a different set of potential markets. Unlike with creative industries, the LQ for services is negatively

59
The location of creative industries
3
associated with the concentration of traditional cultural industries. This indicates that the locations of these traditional industries do not correspond to relatively advanced regional economies. However, the SDM indirect and total impact estimates of tourism industries are positive in Model 2A, indicating that tourism objects can create demand for cultural products from a region.
To summarise, different potential markets are associated with concentrations of creative and of traditional cultural industries. Concentrations of creative industries are associated with more advanced economies, whereas traditional cultural industries are not. This strengthens the argument that traditional cultural industries have become established in several regions and are not associated with the current development of ‘tertiarised’ regional economies.
3.6.4 Economic and entrepreneurial climateWe expected that a favourable economic and entrepreneurial climate would foster a concentration of creative industries. The SDM indirect impact coefficient for self-employment rates is negative in Model 1A, indicating that high self-employment rates in a region decrease the concentration of creative industries in surrounding regions. This suggests a complex situation and one possible explanation is that regions with high self-employment rates attract creative industries from the surrounding areas. Another explanation could be that, as creative industries make up only a very small proportion of all firms, that self-employment rates are not associated with the concentration of these industries. Further, self-employment might not to be a good proxy for entrepreneurship, especially if there is significant necessity-based entrepreneurship. Possibly, creative industries are not started for necessity-based reasons but rather as a response to opportunity, which would be in line with the literature (Ó Cinnéide & Henry, 2007). Turning to traditional cultural industries, we see that the coefficient of self-employment is positive, but not significant, in Model 2A. Meanwhile, the unemployment rate is negatively associated with the concentration of these industries. This shows that concentrations of traditional cultural industries are situated in regions with relatively good economic conditions.
In conclusion, we found a mixed picture with regard to the effect of the economic climate on creative and traditional cultural industries. This is not to say that both industries do not do better in an entrepreneurial and economically thriving climate. However, entrepreneurial environment in a developing country, such as Indonesia, is rather complex, and the same industries might be established in recognition of economic opportunities and because of economic need (Singer et al., 2015).
3.6.5 Urbanisation economiesRelated variety, which represents diversity within sectors, is positively associated with the concentration of creative industries. Unrelated variety, on the other hand, does not have a significant relationship with the concentration of creative
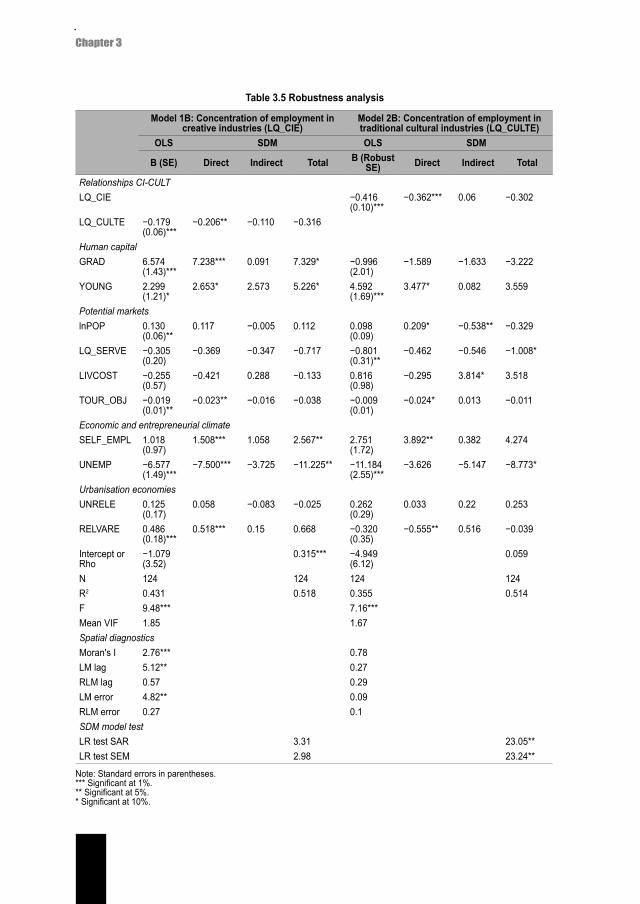
60
Chapter 3
Table 3.5 Robustness analysis
Model 1B: Concentration of employment in creative industries (LQ_CIE)
Model 2B: Concentration of employment in traditional cultural industries (LQ_CULTE)
OLS SDM OLS SDM
B (SE) Direct Indirect Total B (Robust SE) Direct Indirect Total
Relationships CI-CULTLQ_CIE −0.416
(0.10)***−0.362*** 0.06 −0.302
LQ_CULTE −0.179 (0.06)***
−0.206** −0.110 −0.316
Human capitalGRAD 6.574
(1.43)***7.238*** 0.091 7.329* −0.996
(2.01)−1.589 −1.633 −3.222
YOUNG 2.299 (1.21)*
2.653* 2.573 5.226* 4.592 (1.69)***
3.477* 0.082 3.559
Potential marketslnPOP 0.130
(0.06)**0.117 −0.005 0.112 0.098
(0.09)0.209* −0.538** −0.329
LQ_SERVE −0.305 (0.20)
−0.369 −0.347 −0.717 −0.801 (0.31)**
−0.462 −0.546 −1.008*
LIVCOST −0.255 (0.57)
−0.421 0.288 −0.133 0.816 (0.98)
−0.295 3.814* 3.518
TOUR_OBJ −0.019 (0.01)**
−0.023** −0.016 −0.038 −0.009 (0.01)
−0.024* 0.013 −0.011
Economic and entrepreneurial climateSELF_EMPL 1.018
(0.97)1.508*** 1.058 2.567** 2.751
(1.72)3.892** 0.382 4.274
UNEMP −6.577 (1.49)***
−7.500*** −3.725 −11.225** −11.184 (2.55)***
−3.626 −5.147 −8.773*
Urbanisation economiesUNRELE 0.125
(0.17)0.058 −0.083 −0.025 0.262
(0.29)0.033 0.22 0.253
RELVARE 0.486 (0.18)***
0.518*** 0.15 0.668 −0.320 (0.35)
−0.555** 0.516 −0.039
Intercept or Rho
−1.079 (3.52)
0.315*** −4.949 (6.12)
0.059
N 124 124 124 124R2 0.431 0.518 0.355 0.514F 9.48*** 7.16***Mean VIF 1.85 1.67 Spatial diagnosticsMoran's I 2.76*** 0.78LM lag 5.12** 0.27RLM lag 0.57 0.29LM error 4.82** 0.09RLM error 0.27 0.1 SDM model testLR test SAR 3.31 23.05**LR test SEM 2.98 23.24**
Note: Standard errors in parentheses. *** Significant at 1%.** Significant at 5%.* Significant at 10%.

61
The location of creative industries
3
industries. This finding resonates with the current literature on the geography of innovation and creative industries (Feldman & Kogler, 2010; Lazzeretti et al., 2013; Pratt, 2008). Our findings suggest that the concentration of creative industries is strengthened by diversity within sectors, and the literature points to this being because this diversity encourages cross-fertilisation of skills and knowledge transfer between firms in the local creative environment.
A different result is found for traditional cultural industries. The SDM direct and total impact coefficients for unrelated variety are positive in Model 2A, indicating that sectoral diversity facilitates the concentration of traditional cultural industries, whereas related variety is negatively associated with the concentration of these industries. As such, a concentration of traditional cultural industries seems to require diversity between sectors but not within sectors. This supports our thesis that traditional cultural industries are not concerned with the exploitation of new knowledge, and so do not stand to benefit from cross-fertilisation between firms.
3.6.6 Robustness analysisRobustness analyses were conducted to check whether our estimation results would tell a different story if we used employment data rather than firm data to calculate LQs. As reliable employment data are not available for the entire country, these analyses are limited to Java and Bali.
Generally, the results of robustness analyses supported the conclusions drawn from the main model (see Table 3.5). There are slight differences in some coefficients, but not sufficient to challenge our final conclusions. In terms of human capital, a difference was found in the coefficient for the percentage of young people, which was negative in Model 2A but positive in Model 2B, but only significant at the 10% level. This result indicates that young people on Java and Bali are more likely to be involved in traditional cultural industries than those on other islands.
There are also a few differences in significance levels and signs with regard to potential markets. Most notably, the coefficient of LQ for service industries becomes insignificant and that of tourist industries becomes negative in Model 1B. However, the coefficient of LQ for services is still negative in Model 2B (as it was in Model 2A) showing that a strong service sector does not simulate traditional cultural industries. In addition, the coefficient for standard living costs became significant in Model 2B, suggesting that high-income consumers are likely to make use of cultural products from the surrounding regions. Overall, these results strengthen the case for the potential markets for creative and traditional cultural industries being different.
Unemployment rates exert a negative influence on the concentration of both creative and traditional cultural industries, indicating that both require a favourable economic climate. The self-employment coefficient is positive not only in Model

62
Chapter 3
2B but also in Model 1B (while it was negative in Model 1A and insignificant in Model 2A) indicating that self-employment simulates both creative and traditional cultural industries. This change in the association possibly indicates that the regional entrepreneurial climate on Java and Bali is different to that on the other islands. This is to say that, self-employment on Java and Bali reflects a different condition of entrepreneurial activity than it does on other islands. It is possible that, on Java and Bali, entrepreneurship is more likely taken up in recognition of the opportunity provided since the business competition is likely to be more intense due to the higher level of economic activity and population density (see Singer et al., 2015).
Finally, with regard to urbanisation economies, the only change is that the coefficient of unrelated variety becomes insignificant in Model 2B (whereas it was negative in Model 2A), but this does not affect our conclusion that creative and traditional cultural industries require different conditions in terms of economic diversification.
3.7 Discussion and conclusionsThis study has examined the regional characteristics that govern the occurrence of creative industries in the context of a developing country, Indonesia. The term creative industries is imported from developed countries and the ‘original’ concept is often interpreted differently in Indonesia in that it is not always considered to relate only to the promotion of individual creativity and intellectual property. Rather, long-established traditional cultural industries are seen as creative industries, despite their strong attachment to heritage values and little attention to innovation and knowledge creation, which are the main features of creative industries (Fahmi et al., 2015). Therefore, in this paper we distinguish between traditional cultural industries and creative industries. By introducing this distinction, we have been able to account for the underlying heterogeneity in the broad and contested definition of creative industries. Our results point towards distinct regional settings for creative and for traditional cultural industries and, on this basis, a more focussed policy strategy can be defined. The knowledge gained from our findings can deliver insights not only for the Indonesian government, but also for other countries that promote traditional businesses as creative industries.
Our findings highlight the relatively small share of ‘real’ creative industries in the Indonesian economy. This supports the view that creative industries are, in a sense, a ‘luxury good’ and that they are most prominent in advanced economies. Nevertheless, these industries can be important in other contexts as they may spark economic development. In Indonesia, creative industries are found mostly in the Javanese and Balinese regions, where economic development is relatively tertiarised. This finding is in line with theory and with empirical evidence obtained in the context of developed countries which conclude that creative industries tend to be clustered in urban areas and in more advanced regional economies (Lazzeretti et
63
The location of creative industries
3
al., 2013; Potts, 2007; Pratt, 2008). The clustering of creative industries is facilitated by the availability of human capital, and principally of young and higher educated people who are able to establish both formal and informal networks. These start creative businesses by building a learning platform, and generating knowledge spillovers and competition. These processes take advantage of urbanisation economies in which the relatedness between niche producers facilitates the generation and cross-fertilisation of innovative ideas (Feldman & Kogler, 2010). As such, supply factors appear to outweigh the demand-side forces for creative industries. However, this does not mean that demand factors are unimportant for creative industries in that these industries clearly require an economic environment where they can easily access recent technology and control their potential markets, but without being limited by their local markets (see Florida & Jackson, 2010). While the literature has shown that entrepreneurial environments can attract and provide desirable conditions for creative industries (Ó Cinnéide & Henry, 2007), the effect of an entrepreneurial climate is rather unclear in the context of Indonesia. This may be because entrepreneurial activities are born out of necessity rather than in recognition of opportunities (see Singer et al., 2015).
Although our findings are largely in line with the existing literature, creative industries in Indonesia appear to be particularly a phenomenon of the large cities, most notably those on Java and Bali, with a more advanced level of economic development. This reflects the current state of regional disparity in Indonesia: while some major cities have already stepped up to the next stage of economic development, where tertiary and knowledge-based economic activities play more significant roles (Flew, 2002), other regions are still ‘lagging behind’ and focusing on agricultural and industrial activities. This situation may be replicated in other developing countries, where primate cities demonstrate ‘winner-takes-all’ effects.
Further, we found that the factors and dynamics that explain the distribution of creative industries do not similarly explain the locations of traditional cultural industries. These are assumed to be conceptually different in terms of sources of creativity and the role of intellectual property, and this is reflected in the spatial patterns and explanations for the occurrence of traditional cultural industries. In addition, these traditional cultural industries do not follow trends in creative industries or, in other words, they have clearly distinct development trajectories. Traditional cultural industries are not associated with the human capital requirements of creative industries (i.e., young, highly educated people) and diversified urban economic activities. Given the different spatial patterns and explanations for creative and traditional cultural industries, we suggest that the current policy, which regards both industries as similar, is likely to be inappropriate in some instances. As such, policy strategies so far adopted might be less effective than they could be since they are not tailored to the different elements of creative and cultural industries that each have their own specificities. This implication for
64
Chapter 3
policy also seems relevant for other countries that promote traditional industries as creative industries (see Kong et al., 2006).
The current national policy that obliges all local governments in Indonesia to promote creative industries in their localities would also appear ineffective. We therefore suggest that policy strategies should instead be shaped by local specificities, since strategies that foster the development of creative industries are not applicable in every region. It is sensible to promote creative industries in the more advanced regions with sufficient human capital and diverse economic activities, such as some large cities on Java. It is also important to pay attention to other economic sectors that also contribute to regional economies. Given the much greater numbers and high growth rates of traditional cultural industries, it is clear that these are also important although they will affect the local economy in different ways. For regions with large concentrations of traditional cultural industries, policies that aim to stimulate these industries might be more effective than those that encourage the formation of new creative industries.
AcknowledgementAn earlier version of this paper was presented at the 55th ERSA Congress, Lisbon, 25–28 August 2015.
ReferencesAndersson, Å. E., Andersson, D. E., Daghbashyan, Z., & Hårsman, B. (2014). Location and spatial clustering of
artists. Regional Science and Urban Economics, 47, 128–137.Aswicahyono, H., Hill, H., & Najoko, D. (2011). Indonesian industrialization. Helsinki: UNU-WIDER.Banks, M., & O’Connor, J. (2009). After the creative industries. International Journal of Cultural Policy, 15, 365–373.Boateng, B. (2011). The copyright thing doesn’t work here: Adinkra and Kente cloth and intellectual property in
Ghana. Minneapolis: University of Minnesota Press.Boix-Domenech, R., Hervás-Oliver, J. L., & De Miguel-Molina, B. (2014). Micro-geographies of creative industries
clusters in Europe: From hot spots to assemblages. Papers in Regional Science, 94, 753–772.Boix, R., Lazzeretti, L., Capone, F., De Propris, L., & Sánchez, D. (2013). The geography of creative industries
in Europe: Comparing France, Great Britain, Italy and Spain. In L. Lazzeretti (Ed.), Creative Industries and Innovation in Europe: Concepts, Measures and Comparative Case Studies (pp. 23–44). USA and Canada: Routledge.
Broad, R. (1995). The Political Economy of Natural Resources: Case Studies of the Indonesian and Philippine Forest Sectors. The Journal of Developing Areas, 29, 317–340.
Caves, R. E. (2000). Creative industries: contracts between art and commerce. Cambridge and London: Harvard University Press.
Clare, K. (2013). The essential role of place within the creative industries: Boundaries, networks and play. Cities, 34, 52–57.
Cohen, B. (2004). Urban Growth in Developing Countries: A Review of Current Trends and a Caution Regarding Existing Forecasts. World Development, 32, 23–51.
Comunian, R., Chapain, C., & Clifton, N. (2010). Location, location, location: exploring the complex relationship between creative industries and place. Creative Industries Journal, 3, 5–10.
DCMS. (2013). Classifying and Measuring the Creative Industries Consultation on Proposed Changes. London: Department for Culture, Media & Sport.
De Beukelaer, C. (2014). Creative industries in “developing” countries: Questioning country classifications in the UNCTAD creative economy reports. Cultural Trends, 23, 232–251.

65
The location of creative industries
3
De Beukelaer, C. (2015). Developing Cultural Industries Learning from the Palimpsest of Practice. Amsterdam: European Cultural Foundation.
Elhorst, J. P. (2013). Spatial Econometrics: From Cross-Sectional Data to Spatial Panels. New York: Springer.Evans, G. (2009). Creative Cities, Creative Spaces and Urban Policy. Urban Studies, 46, 1003–1040.Fahmi, F. Z., McCann, P., & Koster, S. (2015). Creative economy policy in developing countries: The case of
Indonesia. Urban Studies, doi: 10.1177/0042098015620529.Feldman, M. P., & Kogler, D. F. (2010). Stylized Facts in the Geography of Innovation. In B. H. Hall & N. Rosenberg
(Eds.), Handbook of the Economics of Innovation (Vol. 1, pp. 381–410). Amsterdam: Elsevier.Flew, T. (2002). Beyond ad hocery: Defining Creative Industries. Presented at the The Second International
Conference on Cultural Policy Research: Cultural Sites, Cultural Theory, Cultural Policy, Wellington, New Zealand.
Flew, T. (2013). Global Creative Industries. Cambridge and Malden: Polity Press.Florida, R. (2002). The Economic Geography of Talent. Annals of the Association of American Geographers, 92,
743–755.Florida, R. (2012). The Rise of the Creative Class: Revisited. New York: Basic Books.Florida, R., & Jackson, S. (2010). Sonic City: The Evolving Economic Geography of the Music Industry. Journal of
Planning Education and Research, 29, 310–321.Frenken, K., Van Oort, F., & Verburg, T. (2007). Related Variety, Unrelated Variety and Regional Economic Growth.
Regional Studies, 41, 685–697.Galloway, S., & Dunlop, S. (2007). A Critique of Definitions of the Cultural and Creative Industries in Public Policy.
International Journal of Cultural Policy, 13, 17–31.Garnham, N. (2005). From cultural to creative industries: An analysis of the implications of the “creative industries”
approach to arts and media policy making in the United Kingdom. International Journal of Cultural Policy, 11, 15–29.
Glaeser, E. L., Kolko, J., & Saiz, A. (2001). Consumer city. Journal of Economic Geography, 1, 27–50.Hahn, H. J. (1995). German thought and culture: from the Holy Roman Empire to the present day. Manchester:
Manchester University Press.Hill, H., Resosudarmo, B. P., & Vidyattama, Y. (2008). Indonesia’s Changing Economic Geography. Bulletin of
Indonesian Economic Studies, 44, 407–435.Jacobs, J. (1992). The death and life of great American cities. New York: Vintage Books.Kong, L., Gibson, C., Khoo, L.-M., & Semple, A.-L. (2006). Knowledges of the creative economy: Towards a
relational geography of diffusion and adaptation in Asia. Asia Pacific Viewpoint, 47, 173–194.Lam, D. (2006). The Demography of Youth in Developing Countries and its Economic Implications. World Bank
Policy Research Working Paper 4022.Lazzeretti, L., Boix, R., & Capone, F. (2008). Do Creative Industries Cluster? Mapping Creative Local Production
Systems in Italy and Spain. Industry & Innovation, 15, 549–567.Lazzeretti, L., Boix, R., & Capone, F. (2013). Why Do Creative Industries Cluster? In L. Lazzeretti (Ed.), Creative
Industries and Innovation in Europe (pp. 45–64).Lazzeretti, L., Capone, F., & Boix, R. (2012). Reasons for Clustering of Creative Industries in Italy and Spain.
European Planning Studies, 20, 1243–1262.Lee, S. Y., Florida, R., & Acs, Z. (2004). Creativity and Entrepreneurship: A Regional Analysis of New Firm
Formation. Regional Studies, 38, 879–891.Lorenzen, M., & Frederiksen, L. (2008). Why do cultural industries cluster? Localization, urbanization, products and
projects. In P. Cooke & L. Lazzeretti (Eds.), Cultural Districts, Cultural Clusters and Economic Development. UK and USA: Edward Elgar Publishing.
Malecki, E. J. (1993). Entrepreneurship in Regional and Local Development. International Regional Science Review, 16, 119–153.
MTCE. (2014). Ekonomi Kreatif: Kekuatan Baru Indonesia Menuju 2025. Jakarta: Ministry of Tourism and Creative Economy.
Ó Cinnéide, B., & Henry, C. (2007). Entrepreneurship features of creative industries: The Irish music and dance sector. In C. Henry (Ed.), Entrepreneurship in the creative industries: an international perspective. Cheltenham and Northampton: Edward Elgar.
O’Connor, J. (2009). Creative industries: a new direction? International Journal of Cultural Policy, 15, 387–402.O’Connor, J., & Xin, G. (2006). A new modernity?: The arrival of “creative industries” in China. International Journal
of Cultural Studies, 9, 271–283.

66
Chapter 3
Potts, J. (2007). Art & innovation: An evolutionary economic view of the creative industries. UNESCO Observatory, 1, 1–17.
Potts, J., Cunningham, S., Hartley, J., & Ormerod, P. (2008). Social network markets: a new definition of the creative industries. Journal of Cultural Economics, 32, 167–185.
Power, D. (2002). “Cultural Industries” in Sweden: An Assessment of Their Place in the Swedish Economy. Economic Geography, 78, 103–127.
Pratt, A. C. (2004). Mapping the cultural industries: regionalization: the example of south-east England. In D. Power & A. J. Scott (Eds.), Cultural industries and the production of culture (pp. 19–36). London & New York: Routledge.
Pratt, A. C. (2008). Innovation and Creativity. In T. Hall, P. Hubbard, & J. R. Short (Eds.), The SAGE Companion to the City (pp. 138–153). Los Angeles: SAGE Publications.
Pratt, A. C. (2009). Cultural Economy. In R. Kitchin & N. Thrift (Eds.), International Encyclopedia of Human Geography. Oxford: Elsevier.
Rosenthal, S. S., & Strange, W. C. (2004). Evidence on the nature and sources of agglomeration economies. In Handbook of Regional and Urban Economics (Vol. 4, pp. 2119–2171). Elsevier.
Sawyer, R. K. (2012). Explaining Creativity: The Science of Human Innovation (2nd Ed.). New York: Oxford University Press.
Scott, A. J. (1997). The Cultural Economy of Cities. International Journal of Urban and Regional Research, 21, 323–339.
Singer, S., Amorós, J. E., & Arreola, D. M. (2015). Global Entrepeneurship Monitor 2014 Global Report. London: Global Entrepreneurship Research Association.
Storper, M., & Scott, A. J. (2009). Rethinking human capital, creativity and urban growth. Journal of Economic Geography, 9, 147–167.
UNESCO and UNDP. (2013). Creative Economy Report 2013: Special Edition: Widening Local Development Pathways. New York and Paris: UNESCO and UNDP.
Wenting, R., Atzema, O., & Frenken, K. (2011). Urban Amenities and Agglomeration Economies?: The Locational Behaviour and Economic Success of Dutch Fashion Design Entrepreneurs. Urban Studies, 48, 1333–1352.
Yusuf, S., & Nabeshima, K. (2005). Creative industries in East Asia. Cities, 22, 109–122.

67
The location of creative industries
3
Appendix 3A Categorising creative and cultural industriesNo. Description KBLI (2006) KKKP (1996)Creative industries1 Advertising and marketing
Advertising service; marketing research service 74300; 74130 82932 Architecture and design
Architecture consultancy service; interior design 74210; 45404 8294; 54403 Visual and recorded arts
Photography service; film and video reproduction (re-recording) including by government and private; recording media and reproduction
74940; 22302; 92111; 92112; 22130; 22301
9791; 9628
4 Radio and television Radio and television by government and private 92131; 92132 9627
5 Performing arts Drama, music and other entertainment by government and private; Entertainment supporting services; impresario
92141- 92143; 63450 9631; 9632
6 Publishing Publishing Book, textbook, atlas, brochure, pamphlet, music books, newspaper, journal, tabloid, magazine, special publishing, and others; printing; news agency by government and private, reporter (freelance)
22110; 22120; 22140; 22190; 22210; 92201; 92202; 92203
3420; 9633; 9634
7 IT, software and computer services Portal services; other multimedia service; hardware and software consulting; data processing and database service
64323; 64329; 72100; 72200; 72300; 72400
8230
8 Research and development Research and development Science and Engineering, social sciences, humanities, business and management
73120; 73210; 73220; 74140
8240; 8295
Traditional cultural industries9 Antique market
Antique product retails and street vendors; government and private museum
52406; 52594; 92321; 92322
6256; 9629
10 Batik and crafts Rug/carpet; batik; embroidery; knitted fabrics; products made of leather or artificial leather; webbing of rattan, bamboo and others; woodcut other than furniture; kitchen tools from wood, rattan and bamboo; other wood, rattan and cork that not classified in other categories; other furniture; glass furniture; products and packaging from glass; furniture from porcelain; clay and ceramic products for home use and other than brick and roof tile; marble and granite products for home and decorative; stone products for home and decorative; furniture from wood, metal; various containers from metal; gemstone; jewellery for private use made of noble and non-noble metals; music instruments; toys; hair; packaging and box from paper and carton; knitting confection, socks and others; footwear for daily use, sport, engineering and others
17220; 17124; 17293; 17301; 19129; 20291-20294; 20299; 36109; 26121; 26129; 26124; 26201; 26321; 26324; 26501; 26503; 36101; 36102; 36104; 28994; 36911-36913; 36915; 36921; 36922; 36942; 36993; 21020; 17302- 17304; 19201-19203; 19209
3214; 3211; 3233; 3313; 3314; 3322; 3323; 3323; 3621; 3611; 3641; 3649; 3692; 3691; 3321; 3812; 3901; 3902; 3904; 3906; 3412; 3213; 3241; 3242
Fashion11 Confection from textile and its equipment; from leather; from pelt
and or accessories18101; 18102; 18202 3221; 3222

68
Chapter 3
Appendix 3B Correlation tablesFor Models 1A and 2A
1 2 3 4 5 6 7 8 9 10 11 12 131 LQ_CI 1 2 LQ_FASH 0.154 1 3 LQ_CULT -0.140 0.294 1 4 GRAD 0.702 0.126 -0.154 1 5 YOUNG 0.310 0.011 -0.220 0.260 1 6 lnPOP 0.269 0.227 0.245 0.153 0.062 1 7 LQ_SERVF 0.629 0.039 -0.330 0.696 0.319 0.129 1 8 TOUR 0.157 0.049 0.118 0.138 0.064 0.182 0.091 1 9 LIVCOST 0.513 0.195 0.056 0.532 0.259 0.379 0.406 0.108 1 10 SELF_
EMPL0.024 0.018 -0.121 0.081 0.166 -0.186 0.069 -0.027 0.008 1
11 UNEMP 0.440 0.048 -0.243 0.512 0.277 0.151 0.492 -0.018 0.311 0.257 1 12 UNRELF 0.323 0.252 0.271 0.306 -0.085 0.348 0.184 0.110 0.483 -0.040 0.077 1 13 RELVARF 0.588 0.109 -0.041 0.481 0.190 0.407 0.449 0.177 0.538 0.085 0.425 0.452 1
For Models 1B and 2B
1 2 3 4 5 6 7 8 9 10 11 12 131 LQ_CIE 1 2 LQ_FASHE 0.014 1 3 LQ_CULTE -0.360 0.049 1 4 GRAD 0.536 0.184 -0.371 1 5 YOUNG 0.270 0.289 -0.118 0.465 1 6 lnPOP 0.062 0.180 0.003 -0.191 0.1 1 7 LQ_SERVE 0.301 -0.097 -0.344 0.306 0.141 0.070 1 8 TOUR 0.034 0.030 0.020 0.071 0.132 0.010 -0.065 1 9 LIVCOST 0.333 0.198 -0.153 0.614 0.265 -0.030 0.181 -0.067 1
10 SELF_EMPL
0.012 0.142 -0.086 0.166 0.268 -0.248 -0.053 -0.002 -0.033 1
11 UNEMP 0.081 0.300 -0.388 0.432 0.518 0.087 0.009 -0.129 0.234 0.492 1 12 UNRELE 0.395 0.280 -0.150 0.460 0.349 0.160 0.278 0.019 0.437 0.043 0.216 1 13 RELVARE 0.458 -0.084 -0.406 0.424 0.224 0.098 0.511 0.242 0.275 0.140 0.240 0.447 1
Creative industries and regional productivity growth in the developing economyEvidence from Indonesia
4
Abstract
This paper examines the degree to which creative industries stimulate regional economic development in a developing country, Indonesia. The Indonesian government promotes long-established ‘traditional’ craft businesses as creative industries, but they pay less attention to new knowledge creation and focus on highlighting heritage values as selling points. Our findings show that the ‘real’ creative industries are still scarce and found mostly in fairly advanced urban regions. These industries are more likely to be an indicator than a driver of regional economic development. Meanwhile, those traditional businesses are much larger than creative industries and potentially contribute to regional productivity through consumption activities, thereby requiring different policy strategies.
creative industriesregional economic developmentdeveloping countries
This chapter is based on Fahmi FZ and Koster S. (2015). Creative industries and regional economic development: Evidence from Indonesia. Paper presented at the 55th ERSA Congress, Lisbon, 25-28 August. Submitted to an international journal.
Keywords
t

71
Creative industries and regional productivity growth
4
4.1 IntroductionEconomic activities that utilise individual creativity and talent, such as creative industries, are considered a relatively new instrument for urban and regional economic development in the context of ‘developing’ countries (Barrowclough and Kozul-Wright, 2008; De Beukelaer, 2014; Fahmi et al., 2015; UNESCO and UNDP, 2013). Various policy strategies are designated to promote these industries so as to stimulate economic development. Nevertheless, there has been an ongoing debate on whether paying special attention to these industries is likely to help increase economic outcomes. Potts and Cunningham (2008) describe that creative industries could theoretically deliver either positive, negative or neutral impacts on economic growth. A number of empirical contributions show that creative industries deliver positive effects on regional economic development (e.g., Baum et al., 2009; Boix-Domenech et al., 2013; de-Miguel-Molina et al., 2012; Hong et al., 2014; Lee, 2014; Marco-Serrano et al., 2014; Piergiovanni et al., 2012). Creative industries potentially increase the regional capacity to generate new ideas, resulting in innovation that enhances regional productivity (Boix-Domenech and Soler-Marco, 2015). The expansion of the creative sector accompanied by the higher wage rate reflects that this sector potentially makes increasingly important contributions to the regional economy. On the other side, this development might widen the inequality between the high skilled and the low skilled labour in the regional economy (see Liu and Xie, 2013). Some studies also show that the role of creative industries in job creation is limited to a few specific places only (e.g., Bagwell, 2008; Stam et al., 2008), confirming that these industries are not types of labour-intensive sectors which require a large amount of labour.
The discussion on the role of creative industries in regional development has overwhelmingly focused on the context of higher income countries. There is little published research on this topic in the context of ‘developing’ countries, while the idea of creative industries is gradually embraced in these countries (Kong et al., 2006; Yusuf and Nabeshima, 2005). It is yet unclear how important creative industries are in this context and to which degree these industries can be used as a tool for economic development. Compared to the developed economy, creative industries in developing countries might not be as competitive, in that the global markets of creative products are dominated by products from developed countries and China (Barrowclough and Kozul-Wright, 2008; De Beukelaer, 2014). This implies that creative industries in developing countries might not produce as significant added values as those in the developed world. Nevertheless, it is worth noticing that ‘developing’ countries comprise a group of nations with distinct characteristics and levels of socio-economic development, so the role of creative industries might vary across these countries (De Beukelaer, 2014).
Despite the heterogeneity of development stages across developing countries, there are at least two similar conditions shared between them. First, deindustrialisation

72
Chapter 4
in general does not occur yet in these countries, whereby primary and secondary sectors still grow, although the service sector might play an increasing role in the economy (Rubalcaba et al., 2016). It is thus important to identify the degree to which creative industries contribute to regional development, compared to larger sectors, such as manufacture. Second, the notion of creative industries is often interpreted differently, in that ‘crafts-intensive’ businesses which are not always associated with innovation are included as creative industries (Fahmi et al., 2015; UNESCO and UNDP, 2013). Although utilising cultural creativity in the economy is nothing new in these countries, especially Asian countries, they rather focus on highlighting ‘conservative’ values as selling points (Kong et al., 2006; O’Connor, 2005). Therefore, it is still unknown whether creative industries can be an effective tool for regional development in these contexts.
Indonesia is a typical example of a developing country that currently implements a set of policies to promote creative industries. The Indonesian government claims that these industries have contributed to approximately 7% of the national employment and GDP (MTCE, 2014). However, long-established ‘traditional’ cultural industries (e.g., batik and crafts), which tend to preserve heritage and traditional values, are included in the creative industries classification (Fahmi et al., 2016). These traditional cultural industries actually are different from the ‘real’ creative industries, which emphasise the creation of new knowledge and innovation (e.g., architecture, design and IT-based industries). In fact, traditional cultural industries are much larger than the ‘real’ creative industries. In this regard, differentiating between the two would help understand better their different needs and positions in the regional economy. Although the national government has encouraged local governments to promote creative industries in their localities, it is yet unclear to which degree creative industries, as well as traditional cultural industries, affect regional economic development. We thus argue that it is important to examine whether creative industries can drive regional economic development. In addition, since other sectors, such as manufacturing and mining companies, have been important contributors to the economy, we should also compare the impact of creative industries with these sectors. By understanding these matters, we would be able to determine whether the current policy strategy for supporting creative industries needs to continue.
In response to these questions, this paper aims to examine the degree to which creative industries stimulate regional economic development in the developing economy, particularly Indonesia. It provides an insight into whether regional development strategies based on creative industries are feasibly implemented outside the developed world, especially in lower-middle income countries which have clearly different contexts from Western countries as well as Asian higher income countries, such as South Korea and China, which have been farther in the development of creative industries. In so doing, we provide an empirical evidence on the impact of creative industries on economic growth at the regional level.

73
Creative industries and regional productivity growth
4
Analysis at this level is needed because these impacts might not be distributed evenly and be shown in specific places only. Besides, this analysis will suggest important policy implications for regional development, especially with regard to the extent to which creative and traditional cultural industries should be taken into account into regional development policies and what types of strategies should be designed for supporting both industries (see also Murphy et al., 2015).
This paper is structured as follows. In the following section conceptual arguments on the role of creative industries in regional economic development are reviewed, followed by an overview of technique for modelling the impacts. A descriptive overview is then presented, followed by estimation results. This paper is concluded by a discussion on policy implications.
4.2 Creative industries and regional economic development
There is a huge interest in the role of creative industries in regional development. It has been hotly debated whether the government should pay special attention to this sector, whereas there is not always sufficient evidence showing the extent to which and the mechanism through which creative industries deliver impacts on regional economic growth and development.
Potts and Cunningham (2008) describe four models predicting creative industries might deliver negative, positive as well as neutral impacts on economic growth. The first model, or the ‘welfare’ model, describes that creative industries deliver negative impacts on economic growth because they use more resources than they create. In this case, creative industries are able to grow as facilitated by the transfer of resources, such as subsidies and political interventions. The second model, or the ‘competition’ model’, predicts that ‘creative industries are not economic laggards, nor providers of special goods of higher moral significance, but effectively ‘just another industry’ [...]’ (p. 236). In this regard, the economic impact of creative industries is on par with all other sectors and thus, there is no need to develop special policy strategies for these industries, ‘just consistent application of policy mechanisms extended to other industries’ (p. 237). The third model, or the ‘growth’ model, assumes that creative industries ‘introduce novel ideas into the economy […] or facilitate the adoption and retention of new ideas or technologies in other sectors […]’ (p. 237). The fourth model, or the ‘innovation’ model, describes that the role of creative industries in the economy is not that they are an economic subset that drives economic growth, but rather they are part of the wider innovation system. In this model, creative industries ‘originate and coordinate change in the knowledge base of the economy’ (p. 238). As such, according to these four models, there are open possibilities that creative industries deliver varying impacts on economic development. It is thus important to identity the actual impact of these

74
Chapter 4
industries, so policy strategies can be designed more effectively in line with local contexts and circumstances.
4.2.1 MechanismsHaving understood that creative industries might have varying effects on economic growth, we further elaborate on arguments explaining how these industries deliver these effects. We can summarise four potential mechanisms through which these impacts are shown.
The first mechanism is simply a sectoral effect (Lee, 2014), that is, creative industries generate relatively significant economic values. In line with the ‘growth’ model, this possibly occurs through two alternative ways: supply- and demand-side forces (Potts and Cunningham, 2008). The supply-side explanation of this model stresses the export of new ideas from creative industries to the whole economy (Potts and Cunningham, 2008). Creative industries generate innovative ideas that have large economic values, which then percolate to the economy (Hartley, 2005; Stam et al., 2008). Creative industries also encourage new industries and market niches as well as stabilise existing industries. The demand-side explanation of this model is that the growth of the aggregate economy triggers an increase in demand for creative products or services (Potts and Cunningham, 2008).
Second, related to the first mechanism, creative industries foster growth through spillover effects across sectors. This is to say, creative industries increase the productivity of other sectors which then lead to the growth of the whole economy (Hong et al., 2014; Lee, 2014; Potts and Cunningham, 2008; Stam et al., 2008). This occurs as creative industries interact, exchange ideas and collaborate with other industries. This process is particularly supported by urbanisation economies, that is, externalities resulted from a diversity of sectors which provide opportunities to gain benefits from colocation, the sharing of knowledge and the development of professional and social networks (Feldman and Kogler, 2010; Jacobs, 1969; Lazzeretti, 2007; Lee, 2014; Rosenthal and Strange, 2003).
The third mechanism is that creative industries affect the economy through knowledge spillovers, but the exact role played by these industries is rather different. According to the ‘innovation’ model, creative industries are not seen as a subset of the economy, but rather they are a complex evolving system that yields economic values by facilitating economic evolution and innovation. In this view, the contribution of creative industries is not in terms of relative economic values, but because they play a role in originating and coordinating changes in the knowledge base of the economy as well as in the coordination of new ideas or technologies. Creative industries do not affect economic growth directly, but rather they provide conditions that allow changes in economic order (Audretsch et al., 2006a, 2006b; Potts and Cunningham, 2008). This explanation is particularly relevant for developed economies, in which innovation is the main goal of development and

75
Creative industries and regional productivity growth
4
knowledge-based economic activities have quite a high capability to develop and process new knowledge.
The fourth mechanism is that creative industries might have an amenity value that attracts skilled residents or tourists that will increase productivity (Lee, 2014). This argument is related to the thesis of urban amenities that explains how the economy is growing, which is particularly related to creativity. In this view, economic growth is associated most notably with socio-cultural components, which provide intrinsic values and amenities needed by creative entrepreneurs (Florida, 2003; Lazzeretti, 2007; Pratt, 2008). These components serve as a ‘buzz’ that provides a preferable business climate and social contexts that stimulate creativity. Florida’s argument on this view suggests that social climate, as reflected by the ‘coolness’ of place, social tolerance and technology, affects the economy, as it attracts more creative capitals, such as the creative class or creative industries (Florida, 2003). There are criticisms towards this view, as the growth of creative industries is not only related to particular urban amenities, but also may correspond to a particular fast growing segment of creative industries (Mossig, 2011).
To sum up, creative industries may trigger an increase in regional productivity by consumption activities as well as by introducing new ideas and values and then percolating them to the economy through sectoral and knowledge spillovers (see also Boix-Domenech and Soler-Marco, 2015). It is worth noticing that socio-cultural and place characteristics are also crucial factors that influence these processes. These conceptual arguments need to be tested empirically and with this we can better design policy strategies for optimising the impacts. If creative industries deliver sectoral effects, we may consider these industries to be a ‘special sector’. Accordingly, if spillover effects are evident, policy strategies can be designed so as to facilitate the transfer of ideas and values as well as professional and social contacts.
4.2.2 Regional economic impacts of creative industries in the developing economy
Conceptual arguments described above are built upon specific contexts of developed countries. It is yet unclear to which degree these arguments are relevant beyond these contexts, in which creative industries are situated in less advanced economies and facilitated by less innovative technologies (see Yusuf and Nabeshima, 2005). According to those conceptual arguments (e.g., the growth model), it is actually assumed that the number of creative industries is sufficiently large, so that these industries can deliver economic impacts (Potts and Cunningham, 2008). Spillover effects of creative industries are shown since these industries are agglomerated (see de-Miguel-Molina et al., 2012; Hong et al., 2014; Rosenthal and Strange, 2003). In order to form a cluster or concentration, the number of these industries needs to be sufficiently large, so there will be enough competitors as well as combinations of

76
Chapter 4
different ideas needed for innovation. Meanwhile, creative industries in developing countries are still rather small. It is thus possible that these industries are not a driver, but rather an ‘indicator’ of economic development (De Beukelaer, 2014). Furthermore, it is unknown whether creative industries in developing countries are able to take advantage of agglomeration economies. In order to gain benefits from knowledge spillovers, social contacts as well as a diversity of skills and ideas, firms need to possess an absorptive capacity, which is crucial to process new knowledge available in urban regions (Qian and Acs, 2013).
Further to this, creative industries in developing countries might not always possess such an adequate capacity that facilitates them to benefit from new knowledge. As previously described, creative industries in this context often have different characteristics from those in the developed world. It is unclear whether they are able to generate novel ideas and thus provide a source of economic growth. Fahmi et al. (2016) have discussed in depth the historical and conceptual definition of ‘creative industries’ in the context of Indonesia, which is imported from the British concepts of such a term. The Indonesian government adopts the DCMS (2001) list of creative industries. In practice, long-established traditional business embedded in many regions, such as batik and crafts, are promoted as creative industries.
From a conceptual point of view, the government’s classification is not straightforward since these traditional cultural industries actually have different conceptual ideas than the term ‘creative industries’, which emphasise innovation, copyright and technology (Banks and O’Connor, 2009; Galloway and Dunlop, 2007; Garnham, 2005). Traditional cultural industries might still need recent technologies that support their production activities. Yet, these industries have existed for a long time as regional identities, in which crafters have shared knowledge hereditarily and produce ‘exotic’ products. Whilst creative industries attempt at generating new values and ideas, traditional cultural industries rather focus on promoting the uniqueness of local traditions, which might generate economic outcomes, but they pay less attention to originality and new knowledge generation (see also Kong et al., 2006; O’Connor and Xin, 2006). This does not mean that traditional cultural industries are not creative, but they utilise a different source of creativity. Compared to creative industries which generally originate from individual creativity, traditional cultural industries utilise communal creativity, which originates especially from tradition. Since tradition is a collective good, these traditional products might not be protected by the same copyright regime as the one applied to knowledge-based and creative products (see Boateng, 2011). Apart from this, it is worth noticing that these traditional cultural industries make up to the largest proportion of all ‘creative industries’.
Since we aim to measure the degree to which the idea of creative industries can be a feasible instrument for regional development in a developing country, such as Indonesia, we should reflect on these different conceptual ideas. There has been
77
Creative industries and regional productivity growth
4
an ongoing debate on the definitional issue of creative industries. Many reject the binary opposition between ‘creative’ and ‘cultural’ industries, as the idea of creative industries is historically rooted in the notion of cultural industries (e.g., Flew, 2002). Other scholars criticise the idea of creative industries for using the concept of arts and cultural industries, but extending it beyond the boundary: it combines cultural industries, such as performing arts, with industries that have different characteristics, such as software and advertising (e.g., O’Connor, 2009). Regardless of these controversies, we argue that in the context of Indonesia, the debate seems different. First, the Indonesian government does not adopt the term ‘cultural industries’, but ‘creative industries’ and the ‘creative economy’, particularly the DCMS definitions of these terms (DCMS, 2001). Second, although culture-based economic activities, which we refer to as traditional cultural industries, have been found for years in many regions in Indonesia, they cannot be equalled to the notion of ‘cultural industries’ in the Western literature . Whilst cultural industries in the literature are usually associated with the function of cities as centres for cultural consumption and enjoyment (see Pratt, 2009; Scott, 1997), traditional cultural industries, and notably in Indonesia, are not always situated in urban realms (Fahmi et al., 2016).
In this regard, for the context of Indonesia, and possibly in other countries that promote traditional businesses as creative industries, separating the ‘real’ creative industries and traditional cultural industries seems justified, particularly to control for their potential different impacts. The ‘real’ creative industries, which hold ‘innovative natures’ (i.e. architecture, advertising, design, IT-based industries, multimedia, radio and television, publishing, visual, and recorded and performing arts), can thus be hypothesised to have different economic impacts than traditional cultural industries, which have existed for a long time. On the basis of their different characteristics, we can hypothesise that creative industries introduce new ideas and thus potentially yield larger values. However, they are quite small and so their impacts might not be significant. In comparison, traditional cultural industries might not look for new combinations and new uses of production factors. They may not be leading in terms of innovation and the creation of new values, but rather they just follow consumption patterns without developing their products continuously. Since traditional cultural industries constitute to a large proportion of all firms, they might deliver a sectoral effect, which is triggered by either high consumption or employment. By testing this empirically, we can understand their potentially distinct impacts and thus, suggest policy strategies for supporting both types of industries in the regions.

78
Chapter 4
4.3 Methodology
4.3.1 DataIn order to assess the characteristics of creative industries and their impacts on regional economic growth, we adopted the 1996 and 2006 Economic Census data, the latest datasets available from the BPS-Statistics Indonesia. These data provide information about the characteristics of firms (i.e. creative and traditional cultural industries), observed every ten years, but they are not panel data. There is an issue with regard to these datasets, in which the numbers of regions (kota and kabupaten) in 1996 and 2006 are not the same. To overcome this, newer established regions were merged to their parent regions. Data for other variables were also obtained from the BPS-Statistics Indonesia (see Table 4.1).23 Due to missing values in different datasets, some regions were excluded from the analytical model: Bintan (was Riau Islands), Pontianak city, Minahasa, Kendari city, Manokwari, Paniai, and Nias.24
4.3.2 ModelAn econometric model was designed to estimate the impact of creative industries on regional productivity growth. A dependent variable was selected so as to represent the outcome of regional development processes and reflect the relative economic competitiveness of the regions. For this, annual labour productivity growth was employed (see Hague et al., 2011). Labour productivity was measured as gross regional product (GRP) per employment in the regions, or in other words, how much economic output yielded by each employed person.
Ideally, the econometric model would show not only associations, but also causal relations, or in other words, the impacts of creative industries on regional productivity growth. For this, the variables were lagged, in which average annual growth rates were calculated for the period between 2007 and 2012.25 We used growth rates instead of levels for several reasons. First, to a certain extent, growth rates better represent the outcomes of the development process, in a sense that we can see how much additional outcome produced in a region during a certain period (see Hague et al., 2011). Growth rates also reflect the acceleration, or deceleration, of the process of regional development. Second, according to the Solow and endogenous growth theories, territories might not be distributed evenly around their steady states and income differences might persist indeterminately (Mankiw
23 All variables were transformed into log modulus form, computed as sign(x)*log(|x|+1), which is suitable for all types of values: positive, negative and zero (see John and Draper, 1980).24 Considering the relatively smaller concentration of tertiary activities in these regions, excluding them is unlikely to influence the results.25 Regional employment data are available only from 2007 onwards, but we argue that the condition in 2007 is not very different from 2006.

79
Creative industries and regional productivity growth
4
et al., 1992). As such, following Barro (1991) and Mankiw et al. (1992) in our growth regression models, the initial level of regional productivity was included, and it is hypothesised to have a negative sign, reflecting convergence across regions.
To correct for potential spatial autocorrelations that may exist between neighbouring regions, spatial econometrics was applied. We followed both the general-to-specific and the specific-to-general framework described by Elhorst (2013). A first-order Queen contiguity spatial weight matrix was used, but in this approach 12 localities, especially those on remote islands, did not have neighbours. To overcome this, we
Table 4.1 Variables used in the analysis
Variable Mean SD Source
Share creative industries (CI) (2006) 0.006 0.004 Calculated from raw data Economic Census 2006
Lagged growth CI (1996-2006) 0.071 0.052 Calculated from raw data Economic Census 1996, 2006
Share traditional cultural industries (CULT) (2006) 0.065 0.067 Calculated from raw data Economic Census 2006
Lagged growth CULT (1996-2006) 0.059 0.083 Calculated from raw data Economic Census 1996 and 2006
Share manufacturing firms (2006) 0.138 0.077 Calculated from raw data Economic Census 2006
Share oil and gas firms (2006) 0.00004 0.00037 Calculated from raw data Economic Census 2006
Share trade firms (2006) 0.345 0.064 Calculated from raw data Economic Census 2006
The presence of universities (established in 2006 or earlier)
0.350 0.347 Recapitulated from Pangkalan Data Pendidikan Tinggi1
Population density 0.016 0.051 Calculated from INDO-DAPOER2
Annual labour productivity growth (2007-2012) 0.038 0.033 Calculated from INDO-DAPOER2
Annual labour productivity growth in manufacture (2007-2012)
0.012 0.074 Calculated from INDO-DAPOER2
Annual labour productivity growth in service (2007-2012)
0.019 0.048 Calculated from INDO-DAPOER2
Initial level of labour productivity (2007) 0.018 0.023 INDO-DAPOER2
Initial level of productivity in manufacture (2006) 0.038 0.065 INDO-DAPOER2
Initial level of productivity in service (2006) 0.033 0.029 INDO-DAPOER2
The coverage of good mobile signals (% area) 0.309 0.215 Calculated from raw data Potensi Desa 2005
Ratio of internet café (warnet) in 1,000 inhabitants
0.041 0.058 Calculated from raw data Potensi Desa 2005
Related variety 1.184 0.114 Calculated from raw data Economic Census 2006
Notes: Data in log modulus form. Data source:1. See http://forlap.dikti.go.id/perguruantinggi2. Indonesia Database for Policy and Economic Research (INDO-DAPOER) is managed by The World Bank and
retrieves datasets from BPS-Statistics Indonesia, available from http://databank.worldbank.org/data/reports.aspx?source=1266

80
Chapter 4
corrected the weight matrix by adding neighbours as if two regions were connected by bridge or frequent local boat services.
4.3.3 Explanatory and control variablesAn integral part of our empirical strategy is to distinguish between the two flavours of creative industries: traditional cultural industries and ‘real’ creative industries. They are generally mixed by the Indonesian government, but given their different structures and aims, they are expected to have different impacts on regional economic development. Though conceptually clear, the empirical differentiation of the two is less straightforward. We used the classification as developed in Fahmi, Koster and van Dijk (2016), in which this issue is elaborated in depth. Creative industries were classified according to the Indonesian industrial classification system (KBLI), including advertising, architecture and design, visual and recorded arts, radio and television, publishing, IT-based and software industries, and research and development as creative industries. Meanwhile, crafts, batik and antiques were categorised into traditional cultural industries (see Appendix 3A).26
Other variables were used to control for other factors that determine regional growth and development in these specific contexts. As explained before, the initial levels of regional development indicators were included. Some variables represented other important economic sectors, including manufacturing industries, oil and gas companies, and trade firms. We included lagged growth rates of creative and traditional cultural industries (1996-2006), which represent regions where these industries had rapidly grown. Regions which have high lagged growth rates are assumed to have already a specific ‘buzz’ factor that facilitates the development of such industries. We also controlled for other potential determinants of regional growth and development, including agglomeration economies and human capital (Storper and Scott, 2008). Population density was used to represent and catch various aspects of agglomeration economies, such as urbanity, externalities of scale and localisation. To represent human capital institutions, a dummy variable representing the presence of universities in a region was used.
4.3.4 Showing sectoral and spillover effectsFollowing our theoretical framework, we attempted at estimating sectoral and spillover effects of creative as well as traditional cultural industries. The sectoral effect on the overall economy can be indicated by the association between the share of these industries and labour productivity growth in the aggregate economy. The
26 Fashion is supposed to be included as either creative or traditional cultural industries. However, in the Indonesian context it is difficult to classify fashion along the line of either industry. Fashion is expected to develop new designs and styles, but in fact, many fashion firms in Indonesia do not per-form such an innovative process. Therefore, fashion is excluded from the analytical model (Fahmi et al., 2016).

81
Creative industries and regional productivity growth
4
sectoral effect is possibly shown as these industries increase productivity in certain sectors (Hong et al., 2014; Lee, 2014; Potts and Cunningham, 2008). For this we used labour productivity growth in manufacturing and service sectors as dependent variables. In addition, we can observe spatial spillover effects of creative industries in spatial econometric models, especially spatial Durbin impact measures (see Lesage and Fischer, 2008). However, due to data unavailability, it is not possible to estimate knowledge spillover effects of creative industries.
4.3.5 Tackling potential endogeneity issues and indicating the causality
Despite the strength of growth regression, it might have endogeneity problems (Mankiw et al., 1995). Creative industries could also be endogenous to growth, as they are usually located in growing regions. Although we partially tackle simultaneity problems by using time-lagged variables, we also performed two-stage least squares (2SLS) instrumental variable analysis (IV). With the IV model we can also address the causality issue and determine whether creative industries are a ‘driver’ or ‘follower’ of regional productivity growth (see Marco-Serrano et al., 2014).
Instruments were chosen as they are correlated with the share of creative industries, but are not directly correlated with labour productivity growth (see Appendix 4A). These instruments were selected to be proxies for growing regions, where creative industries might benefit from rather established economic networks and urban amenities (Fahmi et al., 2016; Lazzeretti, 2007). For this, the coverage of good mobile signals and the ratio of internet café in 1,000 inhabitants were employed, as they represent how well-provided infrastructure and facilities in the regions. Besides, related variety was employed since it reflects urbanisation economies and the potential networks between economic activities in the regions. Conceptually, related variety might affect regional economic growth directly (e.g., Frenken et al., 2007), but in our case it is not correlated with regional productivity growth and is not significant when being included in regression models. Therefore, we employed related variety since it supplements other instruments which aim to represent regions which have grown and provided preferable economic conditions.
4.4 General overview of the role of creative industries in Indonesia
The Indonesian government reported that creative industries, combined with traditional cultural industries, contribute to around 7% of national employment and GDP (see Figure 4.1). Creative industries are also predicted to be a new source of economic growth (MTCE, 2014). However, if we separate both types of industries, it appears that ‘real’ creative industries make up to a very small proportion only (less than 1% of the total number of firms), while traditional cultural industries are

82
Chapter 4
much larger (around 7%) (see Table 4.2). It is thus to be expected that both types of industries deliver different impacts on regional economic development.
During 1996-2006, both creative and traditional cultural industries have higher growth rates of firm establishments than other industries (see Table 4.2). This reflects that both industries have potentials to contribute to regional development. Nevertheless, creative industries are still quite small and thus, their sectoral effect on employment might not really be significant. Traditional cultural industries are much larger, so their direct contribution to employment is clearly larger, too. Although creative industries are relatively small, they possibly generate large added values through spillover effects since they generate new ideas and knowledge. It is important noticing that creative industries, as well as traditional cultural industries, are not distributed evenly. As such, economic impacts of both industries might not be shown everywhere. As presented in Figure 4.2, creative industries are concentrated in specific regions, especially on Java Island and major cities on other islands. Therefore, it is important to examine whether the impact of creative industries is mainly shown in these regions only. If the impact is only shown in these relatively advanced urban regions only, the government’s view on obligating all local governments to promote creative industries in their own regions would be less effective.27 If the government wishes to promote traditional cultural industries, in line with the effort to preserve culture and heritage, policy strategies should be designed differently according to the specificities of these industries.
27 See Inpres 6/2009 on the Development of the Creative Economy.
Figure 4.1 Sectoral contribution to national employment and GDP 2010 (Government version)
Employment GDP
Source: Illustrated from MTCE (2011)

83
Creative industries and regional productivity growth
4
Besides, other sectors are still important contributors to the regional economy and thus, they should be taken into account in regional development policies. As seen in Figure 4.1, agriculture creates 38% of employment and manufacturing contributes to about 21% of GDP. Mining industries, especially oil and gas, seem to be one of the most productive sectors, in which although they make up to only 1.2% of employment, they contribute to 11% of GDP. As the service sector has also increasingly become dominant, along with the advance in technologies, economic development policies cannot focus on one specific sector only.
To summarise, this overview provides an insight that creative and traditional cultural industries potentially contribute differently to regional economic development. Creative industries are quite scarce so their sectoral effect seems less significant. Creative industries are mainly found in rather advanced regions, so that we should examine whether they deliver economic impacts outside these regions. As traditional cultural industries are larger and more widespread across regions, we should elaborate how they have contributed to regional economic growth and how we can optimise these impacts.
4.5 Estimation resultsIn this section we present the result of the econometric analysis which estimates the impacts of creative and traditional cultural industries on regional productivity
Table 4.2 Composition of creative and traditional cultural industries
Industries1996 2006 Average
Annual GrowthFrequency % Frequency %
The number of firms (all regions)Advertising and marketing 2,431 0.03% 2,564 0.02% 0.53%Architecture and design 4,144 0.05% 2,837 0.02% -3.72%Visual and recorded arts 15,485 0.17% 20,585 0.16% 2.89%Radio and television 4,177 0.05% 2,981 0.02% -3.32%Performing arts 8,666 0.09% 18,259 0.14% 7.74%Publishing 18,237 0.20% 37,920 0.29% 7.59%IT, software and computer services 2,580 0.03% 3,042 0.02% 1.66%Research and development 1,639 0.02% 1,031 0.01% -4.53%Creative industries (1) 57,359 0.63% 89,219 0.69% 4.52%Antiques 1,396 0.02% 1,379 0.01% -0.12%Crafts 529,772 5.79% 1,064,649 8.22% 7.23%Traditional cultural industries (2) 531,168 5.80% 1,066,028 8.23% 7.21%Creative and traditional cultural industries (1+2)
588,527 6.43% 1,155,247 8.92% 6.98%
Fashion (3) 51,322 0.56% 102,339 0.79% 7.15%Other industries (4) 8,514,445 93.01% 11,696,736 90.29% 3.23%All industries (1+2+3+4) 9,154,294 12,954,322 3.53%
Source: Fahmi et al. (2016), also calculated from the 1996 and 2006 Economic Census raw data

84
Chapter 4
growth. We first present the result of the main models which were developed following spatial econometrics methods by Elhorst (2013). Ordinary least square regressions (OLS) were first estimated, followed by running spatial diagnostics. Spatial models, including spatial error (SEM), spatial lag (SAR) and spatial Durbin (SDM) models, were then estimated, followed by performing likelihood ratio (LR) tests. By spatial diagnostics and LR tests, a conclusion could be drawn on which spatial models should be chosen. As creative industries might be endogenous to growth, instrumental variable analysis was also performed. Subsequently, we present the results of robustness analysis, which examines whether the impact is still shown when Javanese regions are excluded. This analysis needs to be conducted since creative industries are overrepresented in Java and the impacts of these industries may only be shown on this island only.
In general, both creative and traditional cultural industries are positively associated with regional productivity growth, but different explanations are offered. Creative industries are generally situated in rather advanced economies where they build economic linkages and perform transactions with other tertiary sectors. In comparison, the economic contribution of traditional cultural industries most likely correspond to their relative size and consumption patterns in the regions.
Figure 4.2 Regional distribution of creative and traditional cultural industries

85
Creative industries and regional productivity growth
4
Our estimation results also show that other sectors, including manufacture as well as oil and gas companies are still important contributors to regional economic development.
4.6 Main resultsThe main results are presented in Table 4.3. As shown in Model 1, all coefficients for the share of creative industries are positive and statistically significant. The direct SDM coefficient for traditional cultural industries is also positive. As such, both creative and traditional cultural industries are positively associated with labour productivity growth in the aggregate economy. Meanwhile, both types of industries are not associated with labour productivity growth in the manufacturing sector (see Model 2), reflecting that there are no economic linkages, nor sectoral spillovers, between both types of industries and manufacture. In Model 3 the SDM impact coefficient for creative industries is positive and significant, while the share of traditional cultural industries is not significant. This suggests that creative industries have linkages with the service sector, possibly in a form of ‘supplier-buyer’ relationships (see Fahmi et al., 2016). As such, creative industries may help boost the productivity of the tertiary sector, or alternatively, the growing service industry may help creative industries increase their productivity (Flew, 2002; Flew and Cunningham, 2010). In comparison, traditional cultural industries might have less economic linkages with and deliver no spillovers to tertiary economic activities.
Other sectors also appear to be important contributors to the regional economy. The SDM direct coefficient for manufacture is positive, but only significant at 10%. The share of oil and gas companies is also associated with labour productivity growth in the overall economy as well as in the manufacturing sector. This confirms that oil and gas companies are important engines of regional development. In line with our descriptive overview (see Figure 4.1), oil and gas companies generate quite a large added value and boost productivity in the regions where they are located. It also appears that the impact of these companies is potentially much larger than creative industries. This is shown by the coefficient for share of oil and gas companies which is much larger, in which an additional 0.01% of oil companies is associated with a total impact of 0.31% increase in labour productivity growth, while an additional 0.01% of creative industries is likely to increase 0.04% of growth (see Model 1).
We also included lagged growth rates of creative and traditional cultural industries (1996-2006) in the model. It is assumed that regions with high lagged growth rates already have a ‘buzz’ factor that facilitates creative industries to grow, thereby having a higher chance to boost regional productivity growth.28 However, the direct and total impact coefficients of these lagged growth rates were not significant in almost all the models. Furthermore, the initial level of labour productivity (2007)
28 We tried to include the share and the lagged growth separately. However, the results remain the same, so we incorporated both variables simultaneously.

86
Chapter 4
Table 4.3 Main results
M
odel 1: Annual labour productivity growth (2007-2012)
Model 2: Annual labour productivity growth in
manufacture (2007-2012)
Model 3: Annual productivity growth in
services (2007-2012)OLS
SDM Im
pactOLS
SDM Im
pactOLS
SDM Im
pactB (Robust SE)
DirectIndirect
TotalB (Robust SE)
DirectIndirect
TotalB (SE)
DirectIndirect
TotalShare CI (06)
2.46 (0.60)***1.672**
2.433**4.105***
-0.89 (1.51)-2.705
1.641-1.064
3.594 (0.92)***3.873***
-2.953*0.92
Lag growth CI (96-06)-0.022 (0.04)
-0.047-0.1*
-0.147*-0.139 (0.12)
-0.1530.379**
0.226-0.044 (0.06)
-0.038-0.05
-0.088Share CULT (06)
0.101 (0.03)***0.092**
0.0090.102
0.037 (0.11)-0.035
0.01-0.025
-0.038 (0.06)-0.025
0.0460.021
Lag growth CULT (06)0.004 (0.02)
-0.0120.038
0.0260.016 (0.05)
-0.0250.037
0.0110.048 (0.04)
0.0180.085
0.103Share M
anufacture (06)0.059 (0.03)**
0.065*0.002
0.068-0.095 (0.06)
-0.066-0.118
-0.184*-0.04 (0.05)
-0.008-0.057
-0.065Share O
il & Gas (06)
5.335 (1.28)***6.284
25.099***31.383***
29.898 (3.57)***31.945***
-36.694-4.749
-1.296 (7.21)-0.431
5.6655.234
Share Trade (06)0.021 (0.04)
0.069-0.064
0.004-0.109 (0.17)
-0.099-0.055
-0.155-0.158 (0.06)***
-0.113*-0.051
-0.165University dum
my (06)
-0.004 (0.00)-0.004
0.0040.000
0.000 (0.01)-0.005
0.0070.002
0.000 (0.01)-0.002
0.0060.004
Population density (06)0.02(0.03)
0.013-0.094
-0.081-0.022 (0.06)
-0.0160.229
0.2130.05 (0.06)
0.0550.201
0.256Initial level of productivity (07)
-0.752 (0.17)***-0.721*
-0.197*-0.918***
-0.294 (0.08)***-0.317***
0.067-0.25***
-0.577 (0.11)***-0.566***
-0.107-0.673**
Constant0.016 (0.02)
0.085 (0.05)0.078 (0.03)***
Rho
0.161**
0.029
0.183**N
285285
285285
285285
(Adjusted/Nagelkerke) R²0.312
0.4030.071
0.150.135
0.214F
13.85***3.166***
5.44***M
ean VIF1.60
1.57
1.60
Spatial diagnosticsM
oran's I3.43***
0.942.98***
LM error
9.80***0.46
7.26***LM
lag16.12***
0.048.05***
RLM error
0.182.40
0.03RLM
lag6.50**
1.98
0.82
SDM
model test
LR test SAR16.50*
14.609.08
LR test SEM
20.99**
15.04
9.10Note: All variables in log m
odulus form. Standard errors in parentheses. *** significant at 1%
, ** significant at 5%, * significant at 10%

87
Creative industries and regional productivity growth
4
used in each model is negative and significant (see Table 4.3). This is in line with our hypothesis that this initial level is negatively associated with growth rates, indicating convergence in regional productivity growth (Barro, 1991; Mankiw et al., 1992). Meanwhile, other control variables, including population density and university dummy, are not significant in these main models.
To sum up, creative industries are positively associated with regional productivity growth in the aggregate economy as well as the tertiary sector. Yet, it needs to be examined further whether this association implies that creative industries drive, or rather just follow, regional productivity growth. Traditional cultural industries are also positively associated with productivity growth in the overall economy, showing that although these industries pay less attention to innovation and new knowledge, they still potentially contribute to the regional economy. Considering the nature of traditional cultural industries that do not certainly develop their products and designs, we can argue that these industries contribute to regional productivity by following consumption patterns, in a sense of taking advantage of consumers who are interested in ‘exotic’ traditional products. Furthermore, other sectors, especially manufacturing as well as oil and gas companies, are still important contributors to regional productivity growth. This is to say, regional development should be governed not only to promote a specific sector (such as creative industries) as a ‘growth pole’ (see Hague et al., 2011; Pike et al., 2006), but also to consider all components of the economy which may relate to each other.
4.7 Creative industries: driver or indicator?As described in the previous part, the share of creative industries is positively associated with regional productivity growth (see Table 4.4). However, as creative industries may be endogenous to growth, we cannot straightforwardly state that this association automatically means ‘effects’ (see also Marco-Serrano et al., 2014). To correct for these endogeneity problems and address this causality issue, an IV analysis was conducted. As shown in Table 4.4, the results of first-stage regression show that instruments used in the analysis are strong (R2>0.6, F>35). However, Durbin and Wu-Hausman tests are not significant, showing that the share of creative industries is not endogenous. This result indicates that although creative industries are exogenous and potentially spurs an increase in regional productivity, they still heavily benefit from economic conditions in the regions that facilitate their activities. Although endogeneity issues cannot fully be solved in this analysis, both main and IV models point to similar results. In this respect, there is no strong evidence confirming creative industries to be a driver of regional productivity growth. This confirms our descriptive overview which shows that these industries are yet quite small, so they have a low opportunity to drive productivity growth through sectoral effects.
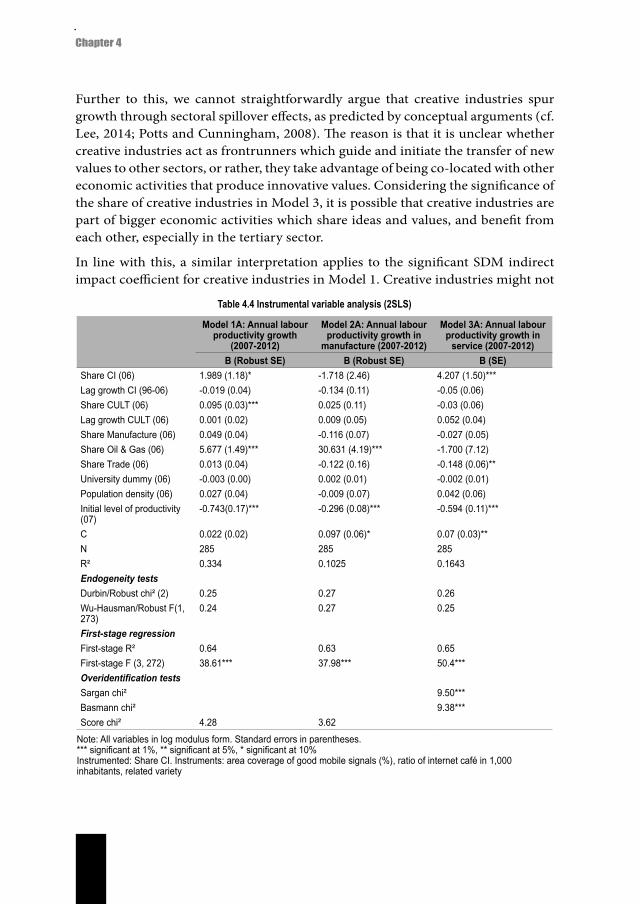
88
Chapter 4
Further to this, we cannot straightforwardly argue that creative industries spur growth through sectoral spillover effects, as predicted by conceptual arguments (cf. Lee, 2014; Potts and Cunningham, 2008). The reason is that it is unclear whether creative industries act as frontrunners which guide and initiate the transfer of new values to other sectors, or rather, they take advantage of being co-located with other economic activities that produce innovative values. Considering the significance of the share of creative industries in Model 3, it is possible that creative industries are part of bigger economic activities which share ideas and values, and benefit from each other, especially in the tertiary sector.
In line with this, a similar interpretation applies to the significant SDM indirect impact coefficient for creative industries in Model 1. Creative industries might not
Table 4.4 Instrumental variable analysis (2SLS)
Model 1A: Annual labour productivity growth
(2007-2012)
Model 2A: Annual labour productivity growth in
manufacture (2007-2012)
Model 3A: Annual labour productivity growth in
service (2007-2012)B (Robust SE) B (Robust SE) B (SE)
Share CI (06) 1.989 (1.18)* -1.718 (2.46) 4.207 (1.50)***Lag growth CI (96-06) -0.019 (0.04) -0.134 (0.11) -0.05 (0.06)Share CULT (06) 0.095 (0.03)*** 0.025 (0.11) -0.03 (0.06)Lag growth CULT (06) 0.001 (0.02) 0.009 (0.05) 0.052 (0.04)Share Manufacture (06) 0.049 (0.04) -0.116 (0.07) -0.027 (0.05)Share Oil & Gas (06) 5.677 (1.49)*** 30.631 (4.19)*** -1.700 (7.12)Share Trade (06) 0.013 (0.04) -0.122 (0.16) -0.148 (0.06)**University dummy (06) -0.003 (0.00) 0.002 (0.01) -0.002 (0.01)Population density (06) 0.027 (0.04) -0.009 (0.07) 0.042 (0.06)Initial level of productivity (07)
-0.743(0.17)*** -0.296 (0.08)*** -0.594 (0.11)***
C 0.022 (0.02) 0.097 (0.06)* 0.07 (0.03)**N 285 285 285R² 0.334 0.1025 0.1643Endogeneity testsDurbin/Robust chi² (2) 0.25 0.27 0.26Wu-Hausman/Robust F(1, 273)
0.24 0.27 0.25
First-stage regressionFirst-stage R² 0.64 0.63 0.65First-stage F (3, 272) 38.61*** 37.98*** 50.4***Overidentification testsSargan chi² 9.50***Basmann chi² 9.38***Score chi² 4.28 3.62
Note: All variables in log modulus form. Standard errors in parentheses.*** significant at 1%, ** significant at 5%, * significant at 10%Instrumented: Share CI. Instruments: area coverage of good mobile signals (%), ratio of internet café in 1,000 inhabitants, related variety

89
Creative industries and regional productivity growth
4
really affect productivity growth in neighbouring regions. Rather, the positive sign might illustrate a complex development process occurring between transboundary regions. An increase in productivity growth in neighbouring regions might not solely correspond to creative industries, but also to all sectors that have economic chains between these regions.
In conclusion, creative industries are more likely to be an indicator, than a driver, of regional productivity growth in a developing country, such as Indonesia (see also De Beukelaer, 2014). Creative industries are situated in relatively advanced regions and it is impossible to disentangle their economic impacts solely, as these industries are interrelated with other sectors. In other words, creative industries appear to be part of a specific type of economic activities currently growing in Indonesian regions, such as knowledge-based service industries, which are to be found mostly in relatively advanced urban realms.
4.8 Robustness checkCreative industries are strongly overrepresented on Java Island and thus, the economic contribution of these industries might only be shown on this island. For this reason, the robustness analysis was performed to check whether when Javanese regions are excluded the main conclusion is still relevant (see results in Table 4.5).29
Generally speaking, there are slight changes in coefficient signs showing a difference with the main results, most notably the share of creative industries. The percentage of creative industries is not significant in Models 1B and 3B simulating labour productivity growth in all sectors and service industries respectively. These results indicate that the association between creative industries and labour productivity growth, as explained previously, seems only evident on Java Island where creative industries are overrepresented. The share of traditional cultural industries remains positive and significant in Model 1B and positive in Model 3B, showing that these industries are associated with labour productivity growth in the regions outside Java. In addition, we found that share of oil and gas companies becomes not significant in these robustness models.
Overall, this analysis shows that determinants of regional economic development on Java Island differ from those on other islands, as they might have different levels of socio-economic development. Our findings also suggest that regional development strategies based on creative industries would be most relevant for Javanese cities only. In comparison, traditional cultural industries would appear a more relevant instrument for regional development outside Java, as these industries are also distributed in regional centres and rural areas.
29 We did not run regressions directly for Javanese regions because the number of regions is too small.

90
Chapter 4
4.9 Discussion and conclusionsThis paper examined the degree to which creative industries stimulate regional economic development in the context of a developing country, Indonesia. In so doing, we have provided an empirical evidence on the extent to which creative industries deliver impacts on regional productivity growth. It is worth noticing that creative industries in developing countries, particularly in Asia, have different characteristics from those in the developed world (see Kong et al., 2006; O’Connor and Xin, 2006). The Indonesian government promotes traditional businesses, such as batik and crafts, as creative industries, although they pay less attention to the ‘innovative features’ of creative industries (Fahmi et al., 2016). In our analysis we should thus separate the ‘real’ creative industries and ‘traditional cultural’ industries, as they have different characteristics and development paths, and potentially deliver different impacts. Traditional cultural industries (about 7%) are, in fact, much larger than creative industries (less than 1% of all firms). As such,
Table 4.5 Robustness check
Model 1B: Annual labour productivity growth
(2007-2012)
Model 2B: Annual labour productivity
growth in manufacturing (2007-2012)
Model 3B: Annual labour productivity growth in services (2007-2012)
OLS OLS OLSB (Robust SE) B (Robust SE) B (SE)
Share CI (06) 0.684 (0.89) -3.024 (2.90) 1.557 (1.33)Lag growth CI (96-06) -0.045 (0.04) -0.100 (0.14) 0.065 (0.07)Share CULT (06) 0.086 (0.03)*** -0.006 (0.14) -0.044 (0.07)Lag growth CULT (06) -0.011 (0.03) -0.005 (0.06) 0.035 (0.05)Share Manufacture (06) 0.043 (0.04) -0.115 (0.09) -0.105 (0.06)Share Oil & Gas (06) 30.375 (29.98) 62.553 (58.12) 21.275 (41.29)Share Trade (06) 0.061 (0.04) -0.026 (0.22) -0.163 (0.08)**University dummy (06) -0.001 (0.01) -0.013 (0.01) -0.004 (0.01)Population density (06) 0.015 (0.01) -0.033 (0.03) 0.052 (0.06)Initial level of productivity (2007)
-1.078 (0.21) -0.385 (0.09) -1.048 (0.26)***
Constant 0.017 (0.02) 0.075 (0.06) 0.114 (0.04)***N 178 178 178Adjusted R² 0.387 0.067 0.068F 12.19*** 2.28** 2.29*Mean VIF 1.50 1.48 1.46Spatial diagnosticsMoran's I 1.52* 0.49 1.74**LM error 1.40 0.04 2.00LM lag 1.05 0.22 1.96RLM error 0.41 2.84* 0.06RLM lag 0.06 3.02* 0.01
Note: All variables in log modulus form. Standard errors in parentheses.*** significant at 1%, ** significant at 5%, * significant at 10%

91
Creative industries and regional productivity growth
4
although the former industries pay less intention to innovation, they also have a potential to stimulate regional economic development.
Our findings show that creative industries are more likely to be an indicator, rather than a driver, of regional economic development. These industries are limitedly found in rather advanced regions, especially major cities in Java, where regional economies are rather advanced and supported by better facilities and technologies. It is difficult to disentangle the contribution of creative industries to regional productivity, and vice versa. Creative industries, in this respect, appear to be an indicator where similar types of economic activities, such as knowledge-based businesses, are also located and involved in economic linkages. Creative industries stimulate productivity as well as benefit from other economic activities, with which they conduct business transactions or even collaborate and share new ideas. Further to this, regional development strategies based on creative industries appear most relevant for rather advanced regions, such as Javanese cities. It is equally important to pay attention to other important sectors, such as manufacturing and mining activities, which are proven to contribute to regional growth.
Traditional cultural industries are also positively associated with regional productivity growth, also outside Javanese regions. However, since these industries pay less attention to the development of ideas and designs, we may put forward a different explanation: they contribute to regional productivity by following consumption patterns. These industries produce exotic products, which clearly have specific market segments, too. This suggests that traditional cultural industries can also be an instrument for regional development both in and outside Javanese regions, but they require a different set of policy strategies.
Further to this, our findings suggest that ‘creative industries’, in a sense of economic activities which emphasise innovation and new knowledge creation, can be an instrument for development policies in a developing country, such as Indonesia, although only in specific regions. There are enormous socio-economic differences within the country, so regional development strategies based on creative industries will not be feasible everywhere. Considering creative industries might be part of other economic activities that are concurrently involved in regional development processes, we should not design policy strategies in a way to regard these industries as a ‘growth pole’ (see Hague et al., 2011; Pike et al., 2006). This is to say, regional development strategies should be designed by considering place-based specificities, local and inter-regional sectoral linkages as well as social relationships between economic actors. The inclusion of creative industries in regional development policies is thus not an act of ‘copy-paste’ policy discourse, but rather, on the basis of the assessment to local potentials and opportunities (see Fahmi et al., 2015; Kong et al., 2006).
In this regard, in the regions where traditional cultural industries are concentrated, supporting these would be more efficient. This conclusion is relevant for other

92
Chapter 4
countries which have similar contexts to Indonesia and which promote traditional businesses as creative industries. It is worth noticing that supporting creative and traditional cultural industries would require different strategies. Creative industries seem to require a support system and preferable climate that facilitate the creation and transfer of new knowledge. In comparison, traditional cultural industries need to be encouraged so as to improve their capacity and competitiveness by going beyond simply following consumption patterns. This is to say, policy strategies can support these industries by introducing new ideas and technologies that can help improve their businesses. However, this might remain a challenge for many cultural contexts in Asia, as to a certain extent traditional values have a sacred meaning that cannot be changed (Kong et al., 2006; O’Connor and Xin, 2006). This is quite different from the context of developed countries, where strategies are designed to transform yesterday’s cultural industries into tomorrow’s creative industries (e.g., Lazzeretti, 2007).
ReferencesAudretsch DB, Keilbach MC and Lehmann EE (2006a) Entrepreneurship as Creative Construction. In:
Entrepreneurship and Economic Growth, Oxford: Oxford University Press, pp. 187–195.Audretsch DB, Keilbach MC and Lehmann EE (2006b) The Knowledge Spillover Theory of Entrepreneurship. In:
Entrepreneurship and Economic Growth, Oxford: Oxford University Press, pp. 34–60.Bagwell S (2008) Creative clusters and city growth. Creative Industries Journal 1(1): 31–46.Banks M and O’Connor J (2009) After the creative industries. International Journal of Cultural Policy 15(4): 365–
373.Barro RJ (1991) Economic Growth in a Cross Section of Countries. The Quarterly Journal of Economics 106(2):
407.Barrowclough D and Kozul-Wright Z (2008) Voice, choice and diversity through creative industries: towards a
new development agenda. In: Barrowclough D and Kozul-Wright Z (eds), Creative Industries and Developing Countries: Voice, Choice, and Economic Growth, New York: Routledge, pp. 3–36.
Baum S, O’Connor K and Yigitcanlar T (2009) The implications of creative industries for regional outcomes. International Journal of Foresight and Innovation Policy 5(1/2/3): 44.
Boateng B (2011) The copyright thing doesn’t work here: Adinkra and Kente cloth and intellectual property in Ghana. Minneapolis: University of Minnesota Press.
Boix-Domenech R and Soler-Marco V (2015) Creative service industries and regional productivity. Papers in Regional Science doi:10.1111/pirs.12187.
Boix-Domenech R, De-Miguel-Molina B and Hervas-Oliver JL (2013) The Importance of Creative Services Firms in Explaining the Wealth of European Regions. In: Cuadrado-Roura JR (ed.), Service Industries and Regions, Berlin, Heidelberg: Springer Berlin Heidelberg, pp. 387–406.
DCMS (2001) Creative Industries Mapping Document 2001. London: Department of Culture, Media and Sport.De Beukelaer C (2014) Creative industries in ‘developing’ countries: Questioning country classifications in the
UNCTAD creative economy reports. Cultural Trends 23(4): 232–251.de-Miguel-Molina B, Hervas-Oliver J-L, Boix R, et al. (2012) The Importance of Creative Industry Agglomerations
in Explaining the Wealth of European Regions. European Planning Studies 20(8): 1263–1280.Elhorst JP (2013) Spatial Econometrics: From Cross-Sectional Data to Spatial Panels. New York: Springer.Fahmi FZ, McCann P and Koster S (2015) Creative economy policy in developing countries: The case of Indonesia.
Urban Studies doi: 10.1177/0042098015620529.Fahmi FZ, Koster S and van Dijk J (2016) The location of creative industries in a developing country: The case of
Indonesia. Cities 59: 66–79.Feldman MP and Kogler DF (2010) Stylized Facts in the Geography of Innovation. In: Hall BH and Rosenberg N
(eds), Handbook of the Economics of Innovation, Amsterdam: Elsevier, pp. 381–410.

93
Creative industries and regional productivity growth
4
Flew T (2002) Beyond ad hocery: Defining Creative Industries. In: Wellington, New Zealand.Flew T and Cunningham S (2010) Creative Industries after the First Decade of Debate. The Information Society
26(2): 113–123.Florida R (2003) Entrepeneurship, Creativity, and Regional Economic Growth. In: Hart DM (ed.), The Emergence
of Entrepreneurship Policy: Governance, Start-Ups, and Growth in the U.S. Knowledge Economy, New York: Cambridge University Press, pp. 39–58.
Frenken K, Van Oort F and Verburg T (2007) Related Variety, Unrelated Variety and Regional Economic Growth. Regional Studies 41(5): 685–697.
Galloway S and Dunlop S (2007) A Critique of Definitions of the Cultural and Creative Industries in Public Policy. International Journal of Cultural Policy 13(1): 17–31.
Garnham N (2005) From cultural to creative industries: An analysis of the implications of the ‘creative industries’ approach to arts and media policy making in the United Kingdom. International Journal of Cultural Policy 11(1): 15–29.
Hague C, Hague E and Breitbach C (2011) Regional and Local Economic Development. New York: Palgrave Macmillan.
Hartley J (ed.) (2005) Creative industries. Malden, MA: Blackwell Pub.Hong J, Yu W, Guo X, et al. (2014) Creative industries agglomeration, regional innovation and productivity growth
in China. Chinese Geographical Science 24(2): 258–268.Jacobs J (1969) The economy of cities. New York: Vintage Books.John JA and Draper NR (1980) An Alternative Family of Transformations. Applied Statistics 29(2): 190.Kong L, Gibson C, Khoo L-M, et al. (2006) Knowledges of the creative economy: Towards a relational geography
of diffusion and adaptation in Asia. Asia Pacific Viewpoint 47(2): 173–194.Lazzeretti L (2007) Culture, creativity and local economic development: evidence from creative industries
in Florence. In: Cooke P and Schwartz D (eds), Creative Regions: Technology, Culture and Knowledge Entrepreneurship, US and Canada: Routledge.
Lee N (2014) The creative industries and urban economic growth in the UK. Environment and Planning A 46(2): 455–470.
Lesage JP and Fischer MM (2008) Spatial Growth Regressions: Model Specification, Estimation and Interpretation. Spatial Economic Analysis 3(3): 275–304.
Liu CY and Xie W (2013) Creativity and Inequality: The Dual Path of China’s Urban Economy? Growth and Change 44(4): 608–630.
Mankiw NG, Romer D and Weil DN (1992) A Contribution to the Empirics of Economic Growth. The Quarterly Journal of Economics 107(2): 407–437.
Mankiw NG, Phelps ES and Romer PM (1995) The Growth of Nations. Brookings Papers on Economic Activity 1995(1): 275–326.
Marco-Serrano F, Rausell-Koster P and Abeledo-Sanchis R (2014) Economic development and the creative industries: a tale of causality. Creative Industries Journal 7(2): 81–91.
Mossig I (2011) Regional Employment Growth in the Cultural and Creative Industries in Germany 2003–2008. European Planning Studies 19(6): 967–990.
MTCE (2014) Ekonomi Kreatif: Kekuatan Baru Indonesia Menuju 2025. Jakarta: Ministry of Tourism and Creative Economy.
Murphy E, Fox-Rogers L and Redmond D (2015) Location Decision Making of ‘Creative’ Industries: The Media and Computer Game Sectors in Dublin, Ireland: Location Decision Making of Creative Industries. Growth and Change 46(1): 97–113.
O’Connor J (2005) Creative exports: Taking cultural industries to St Petersburg. International Journal of Cultural Policy 11(1): 45–60.
O’Connor J (2009) Creative industries: a new direction? International Journal of Cultural Policy 15(4): 387–402.O’Connor J and Xin G (2006) A new modernity?: The arrival of ‘creative industries’ in China. International Journal
of Cultural Studies 9(3): 271–283.Piergiovanni R, Carree MA and Santarelli E (2012) Creative industries, new business formation, and regional
economic growth. Small Business Economics 39(3): 539–560.Pike A, Rodríguez-Pose A and Tomaney J (2006) Local and regional development. Londona nd New York:
Routledge.Potts J and Cunningham S (2008) Four models of the creative industries. International Journal of Cultural Policy
14(3): 233–247.

94
Chapter 4
Pratt AC (2008) Innovation and Creativity. In: Hall T, Hubbard P, and Short JR (eds), The SAGE Companion to the City, Los Angeles: SAGE Publications, pp. 138–153.
Pratt AC (2009) Cultural Economy. In: Kitchin R and Thrift N (eds), International Encyclopedia of Human Geography, Oxford: Elsevier.
Qian H and Acs ZJ (2013) An absorptive capacity theory of knowledge spillover entrepreneurship. Small Business Economics 40(2): 185–197.
Rosenthal SS and Strange WC (2003) Geography, Industrial Organization, and Agglomeration. Review of Economics and Statistics 85(2): 377–393.
Rubalcaba L, Aboal D and Garda P (2016) Service Innovation in Developing Economies: Evidence from Latin America and the Caribbean. The Journal of Development Studies: 1–20.
Scott AJ (1997) The Cultural Economy of Cities. International Journal of Urban and Regional Research 21(2): 323–339.
Stam E, de Jong JPJ and Marlet G (2008) Creative Industries in The Netherlands: Structure, Development, Innovativeness and Effects on Urban Growth. Geografiska Annaler, Series B: Human Geography 90(2): 119–132.
Storper M and Scott AJ (2008) Rethinking human capital, creativity and urban growth. Journal of Economic Geography 9(2): 147–167.
UNESCO and UNDP (2013) Creative Economy Report 2013: Special Edition: Widening Local Development Pathways. New York and Paris: UNESCO and UNDP.
Yusuf S and Nabeshima K (2005) Creative industries in East Asia. Cities 22(2): 109–122.

95
Creative industries and regional productivity growth
4
Appe
ndix
4A
Cor
rela
tion
tabl
e
12
34
56
78
910
1112
1314
1516
1718
1sh
are
CI1
2
lagg
ed g
rowt
h CI
-0.2
11
3
shar
e CU
LT-0
.23
0.33
1
4la
gged
gro
wth
CULT
-0.1
90.
420.
291
5
shar
e m
anuf
actu
re-0
.45
0.20
0.23
-0.0
91
6
shar
e oi
l & g
as0.
100.
110.
080.
09-0
.05
1
7sh
are
trade
0.09
-0.0
9-0
.62
0.01
-0.4
6-0
.02
1
8un
ivers
ity d
umm
y0.
32-0
.05
-0.0
20.
02-0
.13
0.06
-0.0
41
9
pop
dens
ity0.
39-0
.29
-0.1
3-0
.16
-0.2
10.
010.
010.
201
10
prod
gro
wth
all
-0.0
10.
150.
290.
070.
210.
05-0
.22
-0.0
6-0
.04
1
11pr
od g
rowt
h m
anuf
actu
re-0
.02
-0.0
30.
140.
030.
020.
12-0
.14
-0.0
1-0
.01
0.40
1
12pr
od g
rowt
h se
rvice
0.18
0.01
0.07
0.04
-0.0
20.
00-0
.17
0.07
0.09
0.38
0.09
1
13in
itial p
rod
all
0.39
-0.2
8-0
.29
-0.1
6-0
.37
0.08
0.18
0.20
0.24
-0.5
0-0
.15
-0.1
51
14
initia
l pro
d m
anuf
actu
re0.
13-0
.10
-0.2
7-0
.03
-0.3
00.
080.
280.
080.
08-0
.51
-0.2
5-0
.110.
811
15
initia
l pro
d se
rvice
0.43
-0.3
3-0
.21
-0.1
7-0
.34
0.07
0.14
0.14
0.28
-0.2
80.
00-0
.21
0.77
0.36
1
16m
obile
sig
nal
0.69
-0.3
2-0
.02
-0.1
5-0
.33
0.01
-0.2
30.
360.
430.
040.
070.
220.
25-0
.03
0.28
1
17in
tern
et c
afé
ratio
0.52
-0.4
3-0
.27
-0.1
9-0
.38
-0.0
10.
050.
310.
28-0
.37
-0.1
0-0
.06
0.44
0.16
0.45
0.52
1
18re
late
d va
riety
0.58
-0.1
3-0
.19
0.08
-0.4
50.
020.
120.
250.
260.
010.
000.
210.
230.
090.
230.
610.
341


Business networks, social capital and the productivity of creative industriesA case study of Indonesia
5

Abstract
This study examines the degree to which networking characteristics and practices influence the ways in which creative industries impact regional productivity. The notion of social capital is used to conceptualise the complex nature of networks, including both professional and social relationships that occur on multiple levels. This study is set in the context of Indonesia and uses mixed methods, namely multilevel and qualitative analyses. The results show that both firm characteristics and the environment are associated with the productivity of creative industries. Regional environments provide opportunities for creative firms to find specialist suppliers, to gather market information and, more importantly, to find and cross-fertilise new ideas. Although regions provide these opportunities, the absorptive capacity of the firms is crucial in being able to internalise the knowledge available in the environment and to transform this into innovative values embodied in their products.
networkssocial capitalcreative industriesregional developmentIndonesia
This chapter is based on Fahmi FZ (2016) Business networks, social capital and the productivity of creative industries: A case study of Indonesia. Presented at the 56th ERSA Congress, Vienna, 23-26 August. Submitted to an international journal.
Keywords
t

99
Business networks, social capital and productivity
5
5.1 IntroductionIt has been shown that creative industries benefit from the diversified economic activities present in cities, and that these provide opportunities to find and combine, or ‘cross-fertilise’, various skills and ideas in an informal way (Feldman and Kogler, 2010; Karlsson, 2011; Potts, 2007; Rosenthal and Strange, 2003). When creative industries interact, exchange ideas and collaborate with other industries, they may not only benefit from existing regional conditions, but also potentially foster regional economic growth. A possible mechanism is that these industries, through sectoral and knowledge spillovers, introduce and percolate new values to the economy (Boix-Domenech and Soler-Marco, 2015; Fahmi and Koster, 2015; Potts and Cunningham, 2008). Despite creative processes occurring on multiple levels (i.e. individual, team, group and environment) (see Cattani and Ferriani, 2008), the role of creative industries is often examined at the regional level. It consequently remains unclear which mechanisms creative firms utilise across these levels in performing their creative processes, and which may then lead to increased regional productivity.
A potentially better way to explain the mechanisms is to study networks that connect the multiple levels in which these creative processes take place (see also Granger and Hamilton, 2010). Understanding the characteristics and processes through which networks influence the economic performance of creative industries is important since networks provide interaction opportunities and conditions that facilitate creative industries in conducting business-related activities as well as in seeking and processing new ideas (Karlsson, 2011). The term ‘networks’ here includes not only professional ties in which creative industries are involved in supplier-buyer or transactional relationships, but also social networks in which these industries informally gather ideas that might be useful for their creative processes (see Daskalaki, 2010; Huggins et al., 2012).
As such, this study aims to examine the extent to which networking characteristics and practices influence the ways in which creative industries contribute to regional productivity. The notion of social capital – a culture of interaction among people which can smooth transactions, cooperation and the exchange of resources (Malecki, 2012) – is used to conceptualise the features of networks. The use of this concept is relevant for two reasons. First, social capital can illuminate the complex ties around creative industries, where professional and social (non-economic) networks are often difficult to disentangle (Möller and Halinen, 1999). Interactions and ties among economic actors may not only ‘bridge’ cooperation and learning, but also ‘bond’ individuals with a feeling of sameness, which can kill the desire to compete (Iyer et al., 2005; Malecki, 2012). Second, the concept of ‘social capital of the enterprise’ enables observations to be carried out on multiple levels: internal as well as external to the firm, covering production-, market- as well as environment-related social capital (Westlund, 2006).

100
Chapter 5
This study contributes to the discussion on knowledge transfer in geographical clusters in general, and in creative industries in particular. As Thornton and Flynn (2005: 329) note, ‘research that links spatial and relational aspects of the regional contexts to the micro process of entrepreneurship is relatively underdeveloped’. Specifically, it is still unclear how a creative firm connects to other firms and creates a pool of knowledge, and how it processes this knowledge in its own production processes. In addressing this issue, this study provides empirical evidence at the micro-level, with productivity measured at the firm level. Two empirical approaches are employed: multilevel and qualitative data analyses. To begin with, a multilevel analysis is conducted to assess the degree to which firm characteristics and the environment can account for productivity. This method is appropriate since it can reveal whether social capital and networks, both internal and external to a firm, affect productivity simultaneously. Although this method can identify the locus of those creative processes that most contribute to the creation of value, the mechanisms through which firms and their environment relate to each other and boost productivity will remain unclear. Therefore, as a second approach, in-depth interviews are conducted to elaborate on how creative firms benefit from professional and social networks on different levels, and what kinds of resources and knowledge these firms obtain from their networking activities. The results of these analyses contribute to both academic and policymaking worlds in terms of where and how investments in social capital and network building should be applied.
This study is set in the context of Indonesia for two reasons. First, professional and social networks are clearly present. In Indonesia, and especially Java, bonding social capital is rather strong and potentially influences economic processes (e.g., Putnam et al., 1994). Second, by focussing on Indonesia, this study contributes to the understanding of creative industries and wealth creation beyond the developed world. In Indonesia, as in many other Asian countries, traditional businesses are promoted as creative industries despite these tending to focus on preserving and exploiting heritage values and benefiting from communal creativity in the sense that tradition is used as the main source of creativity (Fahmi et al., 2016). As such, these ‘traditional’ cultural industries benefit from networks, and contribute to regional productivity, in a different way to ‘real’ creative industries.
This remainder of this paper is structured as follows. The following section (5.2) presents a literature review on networks and the productivity of creative industries. This is followed by the methodology adopted (5.3). The next two sections then present the results of the analyses, the multilevel analysis in Section 5.4 and the qualitative analysis in Section 5.5. This is followed by a discussion on the findings (5.6) and conclusions (5.7).

101
Business networks, social capital and productivity
5
5.2 Conceptualising the role of networks in the productivity of creative industries
Creative industries have been identified as benefiting from diversified economic activities (Feldman and Kogler, 2010; Lazzeretti et al., 2008; Potts et al., 2008). These industries also rely heavily on social relationships and informal interactions, which make it easier to obtain information, ideas and knowledge, and to generate economic value through their creative processes (Daskalaki, 2010; Karlsson, 2011; Neff, 2005; Potts et al., 2008). Further, while creative firms interact and communicate with other economic activities, they may also have spillover effects on the regions in which they operate. These effects can be shown to occur when firms collaborate on stimulating innovation in regional networks (Rutten and Boekema, 2007), and such collaborations can take place if firms have good relationships and trust each other (Iyer et al., 2005; Malecki, 2012; Westlund, 2006). Here, social capital will have a strong influence on the networking behaviours of creative industries.
In this section, a framework is developed for analysing how specific features of networking characteristics and mechanisms influence the productivity of firms in creative industries. The notion of social capital provides insights that can be used to conceptualise the complex nature of the economic and social relationships around creative industries. The literature has acknowledged the importance of social capital features (e.g., trust and friendship) and networking events (e.g., conferences and meetings) in the productivity of creative firms (Neff, 2005; Wu, 2007). However, it is less clear how these social aspects and events benefit the creative processes that occur on multiple levels. Economic geographers and regional economists show a great interest in social capital, but tend to focus primarily on the macro- (regional) level, whereas the actual process of knowledge transfer seems more likely to occur within groups of individuals or firms (see Cattani and Ferriani, 2008). Therefore, in developing a framework, Westlund’s (2006) concept of ‘the social capital of the enterprise’ is adopted as this can comprehensively characterise networking forms and mechanisms, both internal as well as external to the firm.
The following parts discuss which networking characteristics and practices at each level influence the productivity of creative industries. These levels cover the internal situation of the firm as well as the firm’s external links/relations, including production-, market- and environment-related connections.
5.2.1 Internal social capital of the firmNetworking, either active or passive, is seen as crucial in running a business (Banks et al., 2000). The main motivation for firms’ networking behaviours is that they cannot individually control their activities or futures (Caves, 2000; Möller and Halinen, 1999). Networking provides opportunities for these firms to obtain new ideas and knowledge. However, they need to proactively pick up these opportunities since networking relationships are not free (Möller and Halinen, 1999). Creative

102
Chapter 5
firms need to invest their time and financial resources on developing such relationships, and they need to have the capability to identify, evaluate, construct and maintain their positions and relationships in the networks (Karlsson, 2011; Möller and Halinen, 1999). The firms also need to have an absorptive capacity, that is, the capability to absorb and process external knowledge, so that it will be useful to their productivity (Qian and Acs, 2013; Smit et al., 2015).
The ability to build relationships and process externalities can be referred to as the internal social capital of a firm. Social capital at this level reflects the extent to which a firm’s management and employees are able to internalise firm-specific knowledge and gain access to externalities, such as new ideas, that are available in the networks (Westlund, 2006). This internal social capital is embodied in norms, attitudes or traditions, and it reflects the internal spirit and the motivation of the firm for investing resources in networks (Westlund, 2006). It also represents the internal climate for cooperation. A firm consists of individuals, often grouped in teams, who share knowledge and seek to codify certain knowledge used in the development of the business. As these individuals could have different knowledge and experiences, the exchange of knowledge between them can generate new values and innovation (Desrochers, 2001; Karlsson, 2011).
In brief, the networking capabilities and behaviours of firms depend on the degree to which they are willing to invest their resources in looking into networking possibilities. It is foreseen that the absorptive capacity and the internal social capital have a bearing on the productivity of creative firms, in that firms that actively invest in building networks are likely to outperform those that do not. Further, it is important to understand the mechanisms through which creative firms build networks. In this process, firms need not only to be open to interactions, they also need to be able to extract the benefits from the externalities and apply these in their production processes.
5.2.2 Production-related networksIn general, creative industries do not accomplish their production processes alone and they require complementary skills. Creative industries need to collaborate with specialist suppliers and this is often done repeatedly on the basis of trust (Banks et al., 2000; Caves, 2000; Wu, 2007). Creative firms are generally small, and suppliers are needed not only because they provide raw materials and certain components, but also to help in certain important stages of the innovative processes and this may enable the creative firm to overcome size constraints (see Lipparini and Sobrero, 1994). Co-location and subsequent interactions between creative industries and suppliers can facilitate information exchange, joint learning as well as the diffusion of intangible capabilities (Lipparini and Sobrero, 1994). In this respect, knowledge transfer can go in both directions: suppliers can provide information, such as technological innovation in certain materials and methods, while creative firms

103
Business networks, social capital and productivity
5
can communicate their design ideas so that suppliers can provide suggestions on the materials and methods suitable for these specific needs.
Creative firms could establish criteria for the sort of suppliers with whom they wish to collaborate. While the basic requirements could be quality, cost and delivery (Caves, 2000; Hartley, 2005), supplier selection is more complicated in that ‘chemistry’ is needed to smooth the collaboration. Trust is required and is reflected in the degree to which both parties – the creative firm and the supplier – get along in a collaborative process and share knowledge comfortably (Banks et al., 2000; Wu, 2007). The existing knowledge of the individuals in the firm, as well as information about the complex information and specific suppliers gained from networks in the surrounding environment, can help smooth this process (Lipparini and Sobrero, 1994).
To sum up, a relationship between creative industries and suppliers can lead to innovation through mutual learning and knowledge transfer between both parties. In this regard, it is important to understand how this mutual learning process takes place and influences the performance of creative firms. One would expect suppliers to be able to influence directly the creative processes and productivity of creative industries by suggesting the use of specific ideas in the development of products. To smooth these collaborative processes, aspects of social capital, such as trust and the ability to cooperate and communicate, are crucial.
5.2.3 Market-related networksOne of the fundamental characteristics of creative industries is that they need to monitor consumers’ tastes and preferences. As such, they need to continuously carry out research and development on their products (Caves, 2000; Hartley, 2005). This is not an easy task since trends change dynamically and such industries are not always in direct contact with consumers. In addition, these industries need to maintain their sales and enhance their market share in order for their businesses to survive. Several efforts can be beneficial in managing market-related networks in creative industries. First, these industries can develop relationships with customers in many ways, such as through advertising and consumer clubs (Westlund, 2006), in order to maintain satisfaction and trust as well as to show that they are willing to respond to consumers’ wishes. Second, creative industries also need to maintain their relationships with distributors (e.g., wholesalers, resellers, franchisees) and build relationships with suppliers (Caves, 2000; Hartley, 2005; Westlund, 2006).
It is apparent that market-related networks are crucial to the productivity of creative industries. Trust appears to be an important feature in the development of this type of network. Further, in order to expand their market share, creative industries need to keep an eye on the market information available in the surroundings (Karlsson, 2011). Such information might not only be available from existing and potential customers, but also from other parties in the surroundings, as described below.

104
Chapter 5
5.2.4 Environment-related networksAs creative firms are embedded in their environment, they are exposed to the local/regional conditions as well as to the possibilities of building relationships that are not directly linked to production with other stakeholders, such as political decision-makers, universities and other firms (Westlund, 2006). These relationships are not necessarily aimed at developing supplier-buyer relationships, but rather at ‘socialising’ in general. Nevertheless, building these social relationships is triggered by the same motivation: to lower search costs and the risk of opportunism (Thornton and Flynn, 2005). For example, firm owners socialise to meet investors and look for new ideas for their products (Karlsson, 2011).
As Karlsson (2011) explains it, in principal, the environment provides a ‘buzz’ factor: it is a vibrant setting that offers interesting ideas, information and knowledge that are continuously updated and revised. The environment enables new knowledge to be combined and exchanged in various ways, for instance, individual firms can observe products and processes in different settings and incorporate these in their own ideas, and individual firms that possess different skills can collaborate with each other (see also Desrochers, 2001). In geographical terms, the buzz environment consists of local and nonlocal networks, both of which have different advantages. Local networks stimulate learning and creative processes by generating opportunities for various spontaneous and unanticipated situations, through which creative firms can interact and form learning platforms. In comparison, nonlocal networks encourage the integration of different types of environments, cultivate different potentials and feed local interpretation and the use of ideas, information and knowledge gained from elsewhere (see also Huggins et al., 2012).
Among the possible relationships in the environment, inter-firm relationships – both within and between industries – have a strategic position as these potentially stimulate regional economic growth. There are different views as to how the concentration of firms fosters knowledge spillovers and innovation, often referred to as the debate on MAR (Marshall-Arrow-Romer) – Porter – Jacobs spillovers. Existing conceptual and empirical contributions show that creative industries benefit mostly from Jacobs-type externalities (e.g., Desrochers and Leppälä, 2011a, 2011b; Lazzeretti et al., 2008, 2012). Whereas the MAR and Porter lines argue that it is the concentration of firms from the same industry that encourages economic growth, Jacobs’ view is that it is the proximity of firms from various industries that facilitates individuals with different perspectives and skills to exchange ideas and fosters innovation (Jacobs, 1969)1969. Jacobs also claims the importance of local competition, which can accelerate the adoption of technology and eventually stimulate economic growth (Glaeser et al., 1992). Jacobs’ spillover theory has been developed further by other scholars, most notably by Frenken, Van Oort and Verburg (2007) who separate the benefits of economic diversification, or ‘unrelated variety’, from the Jacobs externalities, or ‘related variety’ (see also Desrochers and

105
Business networks, social capital and productivity
5
Leppälä, 2011b). Related variety in essence reflects the knowledge proximity among producers within the same sector producing similar end-products, which refers to the potential to encourage cross-fertilisation of ideas and innovation (Desrochers and Leppälä, 2011b; Frenken et al., 2007). Despite the controversy over this concept, networks and collaboration are widely seen as crucial for innovation to occur (Desrochers and Leppälä, 2011b; Glaeser et al., 1992; Steinmo, 2015).
Related to this, in order to build collaboration, firms need not only formal strategies but, especially in creative industries, should also invest in developing social relationships (Karlsson, 2011). Social relationships are not just needed for the exchange of prestige and status, friendship, sense of belonging and power (Grandori and Soda, 1995), more importantly they can smooth and stimulate information flows and the exchange of ideas and knowledge (Scott, 2006; Thornton and Flynn, 2005). For this to occur, face-to-face contact is often needed, despite the increasing importance attached to social media and information technologies (Karlsson, 2011). It is worth noting that, at this level, regional culture, as well as social norms and values, might influence the interactions between these firms (Iyer et al., 2005; Malecki, 2012; Westlund, 2006). However, social relationships might not only support the creation of new knowledge, they could also generate negative externalities. While strong ties can lead to supportive interactions among firms, they might instead lead to a mutual reinforcement of existing ideas (Scott, 2006). In this respect, a balanced mix of weak and strong links is more likely to be synergistic than a set of either purely strong or purely weak links (Scott, 2006).
To sum up, inter-firm relationships potentially influence the productivity of creative firms, and this can be either in a positive or in a negative way. One could expect positive externalities to emerge if competition and collaboration are balanced, and if firms can adjust the strength of the ties between them. If social ties become too strong, or too weak, and do not encourage the combination of knowledge, then innovation is less likely to take place and products might not develop. Further, although the environment provides socio-cultural values and opportunities to build relationships, firms (or individuals within firms) need to grasp these opportunities and invest in building relationships. This implies that, in order to understand the degree to which networking affects firm productivity, analyses should be performed at multiple levels, including internal to the firm as well as on every level where the firm is embedded in networks.
5.2.5 Reflecting on the Indonesian situationThe conceptual arguments outlined above are generally seen as relevant to creative industries, these being firms that emphasise individual creativity, intellectual property and new knowledge. In the context of Indonesia, the term ‘creative industries’ is seen as somewhat broader, and not always in line with this definition, in that long-established traditional craft-based industries are promoted as creative
106
Chapter 5
industries. These traditional cultural industries have characteristics that are distinct from ‘real’ creative industries. Traditional cultural industries tend to share knowledge hereditarily in that it is handed down from generation to generation, although they might use new technologies to support their production processes. Nevertheless, these industries prioritise the promotion of heritage and traditional values over the creation of new knowledge. While creative industries utilise individual creativity, traditional cultural industries tend to benefit from communal creativity, in which tradition is the main source of ideas in the development of their products. Since tradition is a collective good, their individual creative acts cannot be disentangled from collective values and knowledge. As such, the ‘Western’ copyright protection mechanism cannot be applied to their products (Boateng, 2011; Fahmi et al., 2016). As such, one could expect the networking forms and mechanisms in traditional cultural industries to be different from those in creative industries. Differentiating between the two ‘creative industries’ would also help in identifying and understanding their specific needs, and identifying policy strategies that would support them.
Further, one could expect the internal social capital of creative industries and traditional cultural industries to be formed in different ways and thus to affect firm productivity differently. As creative industries are usually established on the basis of a recognised opportunity, their internal social capital and absorptive capacity are developed throughout the learning process. Creative industries exploit individual creativity and continuously need new ideas to sustain their production processes. Therefore, they need to carry out research and development on their products and gather new ideas from local and nonlocal networks. In comparison, as tacit knowledge is passed down through the generations in traditional cultural industries, their internal social capital might be built through a process of maintaining the firm’s internal resources and values, for example by establishing trust among employees and consumers. As traditional cultural industries utilise communal creativity and tradition, they might not extensively seek out new ideas but rather focus on highlighting traditional values. Given these differences, internal social capital might be a more important determinant of firm productivity in ‘real’ creative industries than in traditional cultural industries.
Second, if one considers suppliers and consumers to be the main components of any business, then the characteristics of production- and market-related networks could be the same or different between both types of industries. Both industries need to maintain and develop their supplier-buyer relationships in order to enhance their productivity. However, as creative industries require a combination of new ideas, or designs, one might expect them to be more active in looking for new suppliers and production methods.
Third, considering how and where they are spatially concentrated, the environment-related networks may differ between creative industries and traditional cultural

107
Business networks, social capital and productivity
5
industries. Creative industries are generally located in a relatively diverse urban economy, whereas traditional cultural industries are often concentrated in smaller urban regions and rural areas (Fahmi et al., 2016). Often, traditional cultural industries are clustered in kampongs (community villages), where crafting activities have become the main source of living for the inhabitants and also the source of local identities. As such, while it is plausible that creative industries would benefit from Jacobs externalities, these seem less likely to be relevant for traditional cultural industries.
5.3 MethodologyTo examine the extent to which, and the mechanisms through which, networks and social capital on different levels influence the productivity of creative industries, this study employs multilevel modelling and qualitative methods. As illustrated in Figure 5.1, the multilevel analysis looks into the extent to which the characteristics of firms and their environment, as well as the relationships between them, are associated with firm productivity. However, this analysis does not expose the mechanisms through which firms benefit from networking opportunities in the environment. Subsequently, a qualitative analysis is performed to clarify the relationships revealed by the multilevel analysis, specifically by examining network characteristics and practices on each level. Further, given the different business and networking characteristics of creative industries and of traditional cultural industries, separate analyses are conducted for each type of industry.
Figure 5.1 Analytical framework

108
Chapter 5
5.3.1 Multilevel modelThe multilevel analysis simultaneously estimates the influence of firm characteristics and of the environment on productivity. This multilevel analysis draws on data available from the 2006 Economic Census published by BPS-Statistics Indonesia. These data provide information about firm characteristics observed every ten years. This analysis focusses on Java Island, the heart of economic development, considering the data for regions beyond this island as rather unreliable. Ideally, growth measures (e.g., revenue growth or employment growth) would be employed to represent firm productivity but, unfortunately, the data are not in panel form, and so it is not possible to deduce firm growth. Given the information available, the average annual turnover per employee is employed as the dependent variable. A potential concern with using this as the dependent variable is that the capital intensity of a firm is not reflected well, an aspect which again cannot be measured due to the limited data. However, capital intensity is not seen as a key determinant of firm productivity in either creative industries or traditional cultural industries as, in both, firms focus on developing symbolic meanings (e.g., designs, contents, motifs) and the manufacturing or engineering processes are often outsourced.
The explanatory variables come from two levels: the firm level and the regional level (i.e. the environment). Firm level variables, namely firm size (the number of employees) and firm age, are employed to reflect the absorptive capacity, a choice again constrained by the limited data. Squared values of these variables are also included in the analysis to allow for potential nonlinear associations with firm productivity. One would expect that the larger the firm size, the broader the knowledge accumulated by its employees through their various ideas and experiences. In a similar vein, the older the firm, the greater the knowledge accumulated over time from its environment.
In addition, region-level variables are employed to represent social capital and networking potential in the environment. First, the location quotient (LQ), for creative industries and for traditional cultural industries, is used to represent the concentration of similar economic activities in which potential interactions could occur in the form of competition and/or collaboration. The second variable is related variety, that is, the weighted sum of the entropy index measured at the five-digit level within each two-digit class of KBLI codes. As Frenken, van Oort and Verburg (2007: 687) explain, the related variety represents the diverse industry mix in an urbanised locality that ‘improves the opportunities to interact, copy, modify, and recombine ideas, practices and technologies across industries giving rise to Jacobs externalities’. As such, related variety is expected to reflect the opportunities for developing links or relationships with a range of economic activities, including supplier-buyer relationships (production- and market-related networks) as well as collaboration and exchange of knowledge and ideas. Third, to represent environment-related networks, i.e. the regional climate and culture for socialising
109
Business networks, social capital and productivity
5
and collaboration, regional social capital indicators (‘socialising’, ‘friendship’ and ‘helping’)30 available from the 2010 Social Capital Stock data are included. The ‘socialising’ variable reflects the habit of living socially and being involved in the society, such as ‘silaturahmi’ (gathering). ‘Friendship’ represents the perceived friendliness and the ease of making friends, while ‘helping’ reflects the habit of helping one another in terms of financial support. These indicators are measured on the basis of public opinion and thus reflect the social capital of the civil society at the regional (municipal and district) level. Although, as Westlund and Adam (2010) found, the social capital of civil society represents only a small part of social networks and interactions, it still has the potential to induce cooperation between economic actors in a competitive environment. As such, it can have an impact on economic processes and outcomes. Given that the social capital indicators are measured on the macro-level, and that networking forms between firms might be more crucial, cross-level interactions between firm and regional social capital variables are employed to better reflect the networking characteristics and culture of the interactions among firms.
5.3.2 Qualitative analysisThe qualitative analysis aims to uncover the network mechanisms behind the relationships identified in the multilevel analysis, concerning how firms and the environment relate to each other, and how this then influences productivity. Specifically, how do firms use and benefit from opportunities available in the environment (including production- and market-related channels as well as competition and collaboration), and internalise the external benefits for their own creative processes? In this analysis, productivity is defined as the creation of new values that are reflected in products. The fashion subsector is chosen as the focus in this analysis because it is one of the most important creative industries in Indonesia due to its potentially large consumer base. Another advantage is that this also reflects both ‘traditional’ and ‘innovative’ creative industries: some firms attempt to create new designs, while other firms just produce apparel without developing new designs or motifs. Two cases are examined. The first case study is conducted in Bandung, where relatively ‘modern’ creative fashion firms, popularly known as ‘distro’, are located. The second case study is performed in Surakarta, representing ‘traditional’ cultural industries, specifically in Kampong Laweyan, a batik cluster where a revitalisation project took place in the late 2000s, aiming to regenerate traditional batik production activities by transforming this cluster into a tourist attraction. In total, interviews were conducted with 11 firms in Bandung and 10 firms in Surakarta, in which issues related to networking mechanisms on each level were investigated (see Appendix 5C). Key informants were first identified using the information available from firm associations, news and social media sources,
30 In the original dataset, ‘socialising’ is referred to as ‘grouping’ (kelompok), and ‘helping’ as ‘net-working’ (jejaring).

110
Chapter 5
Table 5.1 Multilevel models
Dependent: Turnover per worker (ln)
Model 1 Model 2 Model 3
(A) Creative industries
(B) Traditional
cultural industries
(A) Creative industries
(B) Traditional
cultural industries
(A) Creative
industries
(B) Traditional
cultural industries
Fixed effects B(SE) B(SE) B(SE) B(SE) B(SE) B(SE)Firm levelAge 0.463
(0.02)***-0.195 (0.01)***
0.506 (0.03)***
-0.085 (0.03)**
0.509 (0.03)***
-0.084 (0.03)**
Age² -0.259 (0.02)***
-0.02 (0.01)***
-0.316 (0.03)***
-0.018 (0.01)***
-0.314 (0.03)***
-0.018 (0.01)***
Size 0.411 (0.03)***
0.135 (0.00)***
0.537 (0.04)***
1.546 (0.40)***
0.557 (0.04)***
1.544 (0.40)***
Size² -0.261 (0.03)***
-0.107 (0.00)***
-0.271 (0.06)***
-0.06 (0.01)***
-0.247 (0.06)***
-0.06 (0.01)***
Regional levelLQ CI or CULT 0.232
(0.05)***-0.499 (0.13)***
Related variety 0.113 (0.06)*
0.61 (0.13)***
Friendship -0.148 (0.07)**
-0.305 (0.15)**
-0.134 (0.07)*
-0.27 (0.15)*
Socialising 0.021 (0.08) 0.027(0.17)
0.046 (0.08) 0.139(0.16)
Helping -0.061 (0.07)
-0.130 0.15)
-0.061 (0.08)
-0.281 (0.15)*
Cross-level interactionsAge × Friendship
Size × Friendship
Constant 15.807 (0.03)***
15.04 (0.08)***
15.802 15.041 (0.07)***
15.803 (0.03)***
15.041 (0.07)***
Random effects σ² σ² σ² σ² σ² σ²Intercept regional level σ² 0.118 0.687 0.089 0.542 0.106 0.505Age σ² 0.017 0.112 0.017 0.111Size σ² 0.025 17.923 0.022 17.917Residual σ² 1.591 1.331 1.584 1.303 1.584 1.303No of observations 29260 764176 29260 764176 29260 764176No of regions 114 114 114 114 114 114AIC 96935.7 2387988 96866.2 2372833 96878.6 2372828BIC 96993.7 2388068 96998.7 2373018 97011.1 2373013Log likelihood -48460.9 -1193987 -48417.1 -1186401 -48423.3 -1186398
Note: Firm level variables were group-mean centred, while regional level variables and cross-level interactions were grand-mean centred. Models 2-5 use random slope.*** significant at 1%, ** significant at 5%, * significant at 10%

111
Business networks, social capital and productivity
5
(Table 5.1 cont)
Dependent: Turnover per worker (ln)
Model 4 Model 5
(A) Creative industries
(B) Traditional
cultural industries
(A) Creative industries
(B) Traditional cultural
industries
Fixed effects B(SE) B(SE) B(SE) B(SE)
Firm levelAge 0.507
(0.03)***-0.084 (0.03)**
0.509 (0.03)***
-0.083(0.03)**
Age² -0.318 (0.03)***
-0.018 (0.03)***
-0.318 (0.03)***
-0.018(0.01)***
Size 0.546 (0.04)***
1.547 (0.40)***
0.567 (0.04)***
1.545(0.40)***
Size² -0.306 (0.06)***
-0.06 (0.01)***
-0.287 (0.06)***
-0.06(0.01)***
Regional levelLQ CI or CULT 0.235
(0.05)***-0.498 (0.13)***
Related variety 0.122 (0.06)* 0.608(0.13)***
Friendship -0.167 (0.07)**
-0.456 (0.16)***
-0.158 (0.07)**
-0.407(0.15)**
Socialising 0.018(0.08)
0.029(0.17)
0.039(0.08)
0.140(0.16)
Helping -0.059 (0.07) -0.13 (0.15) -0.059 (0.08) -0.281(0.15)*
Cross-level interactionsAge × Friendship 0.002
(0.05)-0.197 (0.06)***
0.002(0.05)
-0.197(0.06)***
Size × Friendship 0.119(0.06)
1.049(0.80)
0.119 (0.06)**
1.052(0.80)
Constant 15.802 (0.03)***
15.041 (0.07)***
15.803 (0.03)***
15.041(0.07)***
Random effects σ² σ² σ² σ²Intercept regional level σ² 0.088 0.536 0.105 0.505Age σ² 0.016 0.103 0.016 0.111Size σ² 0.016 17.639 0.014 17.917Residual σ² 1.584 1.303 1.584 1.303No of observations 29260 764176 29260 764176No of regions 114 114 114 114AIC 96867.5 2372827 96879.4 2372828BIC 97016.6 2373035 97028.5 2373013Log likelihood -48415.7 -1186396 -48421.7 -1186398

112
Chapter 5
and then based on recommendations from other interviewees (the snowballing technique). In addition, local government officials and university actors were also interviewed for additional information and triangulation purposes.
5.4 Multilevel analysisTable 5.1 presents the results of the multilevel analysis that estimated the extent to which firm characteristics and the environment explain the productivity of creative industries. Following the conceptual argument outlined earlier, analytical models are developed separately for creative industries and for traditional cultural industries since these have distinct characteristics. The multilevel analysis is performed by first running a model including only the intercept, and then gradually adding firm level and regional level variables (Models 1, 2 and 3). A random slope model was chosen to allow for varying effects of firm level characteristics across regions. In general, as more variables are added, the model fit improves, as indicated in the AIC, BIC and log likelihood statistics. Given the significant coefficients found in Models 2 and 3, cross-level interactions, between firm level variables and a regional social capital measure (friendship), are added to reflect the interaction between the firm and the environment (Models 4 and 5). In general, the results show that firm characteristics and the environment both influence the productivity of firms both in creative industries and in traditional cultural industries. Nevertheless, there are differences, most notably that creative industries benefit from co-locating with similar industries whereas traditional cultural industries do not. This potentially reflects the characteristic of the latter of being strongly attached to tradition, such that co-locating with similar activities does not generate new knowledge or the creation of innovative values.
5.4.1 Firm characteristicsInternal firm characteristics, and specifically their absorptive capacity, are associated with the productivity of both creative and traditional cultural firms. As shown in Model 1, and consistently confirmed by the other models, firm size is positively associated with productivity in both creative and traditional cultural industries: the larger the firm, the higher the productivity. Whereas firm age is positively associated with productivity in the sample of creative firms, it is negatively associated with that of traditional cultural firms. This perhaps suggests that knowledge is accumulated over time in creative industries, and that this boosts productivity. This is not the case with the traditional cultural industries, possibly because the knowledge in these industries is unchanging, and this has a negative association with productivity. The squared values of both firm size and firm age are negatively associated with the productivity of both sorts of firms, indicating that the associations between these firm characteristics and productivity are nonlinear.

113
Business networks, social capital and productivity
5
To sum up, and in line with other studies (e.g., van Oort et al., 2012), the absorptive capacity, as represented by firm size and age, of creative and traditional cultural firms, is associated with productivity. The fact that the slopes differed in the models indicates that the impacts of firm size and age varied across regions. Although to some extent these firm-level characteristics could reflect the networking forms and the ability to accumulate knowledge, they are not direct indicators of networking abilities and behaviours. The mechanisms through which firms internally manage knowledge and improve their productivity still need to be uncovered, and this is achieved through the qualitative analysis presented in the next section.
5.4.2 Environment characteristicsGenerally speaking, environmental characteristics, including social capital and networking opportunities, explain the productivity of creative and traditional cultural firms. In this analytical model, the location quotient and the related variety are included separately (for creative and for traditional cultural industries) because both variables are strongly correlated, which generates multicollinearity problems when incorporated together (see Appendices 5A and 5B). As Models 2 and 3 shown in Table 5.1, there are differences between the two types of industries.
Related variety, which reflects the opportunities to develop relationships with various types of activities, has a similar positive influence on the productivity of both creative and traditional cultural firms (although for creative industries it is only significant at the 10% level). This indicates that a diverse local economy has the potential to deliver opportunities for both types of industries to build supplier-buyer relationships as well as to gather information and ideas about various aspects, such as specialist supplies, market information and ‘buzz’ ideas (see Frenken et al., 2007). Meanwhile, the influence of localisation economies differs between the two industry types. The location quotient is positively associated with the productivity of creative industries, but negatively associated with that of traditional cultural industries. A possible explanation is that creative firms industries benefit from co-locating with other firms in the same industry because they can develop inter-firm relationships to collaborate and exchange new ideas, whereas this is not the case for traditional cultural industries. The latter differ in that they tend to focus on preserving traditional values, and so proximity to other firms in the same industry does not lead to the development and spread of new ideas and innovation (see also Fahmi and Koster, 2015; Scott, 2006).
Further, of the measures of regional capital incorporated in the models, ‘socialising’ is negatively associated with the productivity of traditional cultural firms (albeit only at the 10% level) but not with that of creative industries. ‘Helping’ is not statistically significant in all the models. ‘Friendship’ is negatively associated with the productivity of both creative and traditional cultural firms. That is, being in a friendly region would appear to lower productivity. A possible explanation is

114
Chapter 5
that good social relationships strengthen ties, and that this leads to a reduction in economic competition with associated negative externalities (Iyer et al., 2005; Malecki, 2012; Putnam et al., 1994).
To try to better understand this issue, and to reflect on networking characteristics at the micro-level, cross-level interactions are included. As seen in the results for Models 4 and 5 in Table 5.1, ‘Age × Friendship’ is negatively associated with the productivity of traditional cultural industries and not significantly related to that of creative industries. This indicates that, in less friendly regions, the productivity of traditional cultural firms tends to decrease over time whereas, in more friendly regions, the productivity of these firms appears to increase with age. This suggests that, in line with their definitional characteristics, traditional cultural industries rely heavily on tacit knowledge passed down through generations, providing a need only to maintain social relationships to protect such knowledge. This process is not relevant for creative industries that, in contrast, need to continuously search for new ideas and innovate.
At the same time, the variable ‘Size × Friendship’ is positive and significant for creative industries (albeit only at the 10% level in Model 4 and 5% in Model 5). This indicates that, in friendly regions, the productivity of creative firms seems to increase with size, albeit not very significantly. A possible explanation is that friendship not only boosts knowledge, which is useful for the firm, but also carries negative externalities, and that firms with a large number of workers accumulate larger negative externalities from the environment.
To sum up, social capital and networking opportunities present at the regional level do partly explain the productivity of both creative and traditional cultural firms. A diversified economy provides opportunities for both types of industries to build relationships with other economic activities. However, only creative industries appear to benefit from being close to similar businesses, whom they might collaborate, and possibly compete, and thereby stimulate each other. Regional social capital has been shown to have negative externalities for firm productivity, indicating that social relationships are not always good for economic productivity. However, the mechanism through which firms interact with the environment and how this influences productivity remains unclear. This is clarified through a qualitative analysis presented in the section below.
5.5 Qualitative analysisIn the previous analysis, it was shown that networking, both internal and external to a firm, is associated with productivity. However, the multilevel analysis left questions as to the mechanisms though which networks and social capital influence firm productivity. In this section, this issue is now addressed by examining case studies in clothing firms in Bandung, representing ‘creative industries’, and batik businesses in Kampong Laweyan, Surakarta, representing ‘traditional cultural

115
Business networks, social capital and productivity
5
industries’. Below, an overview of each case is presented, followed by the analysis of the mechanisms at play in each type of network: those internal to the firm plus, production-, market- and environment-related networks.
5.5.1 Overview of the Bandung case‘Creative’ clothing firms in Bandung constitute the embryonic creative industries in Indonesia. They were mostly established by young entrepreneurs who wished to develop local brands as alternatives to foreign products that had become far more expensive following the 1998 monetary crisis. They produce apparel that primarily appeals to young, domestic customers. In general, the firms involved in this study were small or medium-sized (SMEs). Their main activities mostly comprise research and development linked to designs. The main production processes, such as sewing and printing, are subcontracted out. In practice, these creative firms set a specific standard for quality, and also consider cost and delivery when negotiating with subcontractors. Two methods are used in seeking and contracting suppliers: first, a firm will look for suppliers itself, and, second, suppliers will approach a firm with an offer. According to the interviewees, the former mechanism is usually used in the first instance but, after the brand becomes known, ‘there will be more suppliers coming here, to our office, and offering their products (or services)’.
These creative firms usually sell their products in distribution outlets (‘distro’), a term first coined by indie music creators to refer to the place where they sell their cassettes and merchandise. The use of the term ‘distro’ by the clothing industry in Bandung sets out to present a strong connection between clothing firms and music identities, many of which have become a major source of inspiration for their products and designs. Distro is essentially a consignment mechanism in which products are deposited in an outlet, and any eventual profit shared, usually 30-35% for the distro and 65-70% for the producer. Such a mechanism is built on the basis of trust, which has to be continuously maintained. Some firms have become sufficiently established to open their own distros (or stores), to avoid profit-sharing, but they then have to manage their own utility and running costs. Today, start-ups and relatively young firms also distribute their products through so-called ‘concept stores’ that sell various brands, which share certain characteristics or identities, to present an image selected by the owners. Further, due to the increasing demand and growing production, clothing firms now sell their products to wholesalers, when the products will be paid for in advance but at a discounted price. This latter mechanism is usually adopted with distributors located far from Bandung, especially those outside Java and abroad.
In addition to these supplier-buyer linkages, the clothing firms have relationships with other parties. First, they usually have business and social relationships with other firms that have similar, or related, types of businesses. There are also a number of business associations that generally function as event organisers for festivals,

116
Chapter 5
such as the ‘Kreatif Independent Clothing Kommunity’ (KICK). Second, some firms also have ties with non-commercial associations, such as music, sport and other youth communities, particularly with ones who are their potential consumers or who inspire their products directly or indirectly.
5.5.2 Overview of the Surakarta caseKampong Laweyan is one of the oldest batik clusters in Surakarta. It is a typical example of economic activities based on cultural creativity in Indonesia, and one that is promoted as a creative industry by the government. In general, these batik businesses have been handed down in a hereditary manner. Tacit knowledge has been shared across generations and has thus been locally embedded in this kampong for many years. The batik industry in Indonesia fluctuates, and many firms closed down due to the 1998 crisis. In 2004, some of the surviving business owners had an initiative to revitalise the kampong and transform it into a tourist destination. They established Forum Pengembangan Kampung Batik Laweyan (FPKBL: Forum for the Development of Kampoeng Batik Laweyan) that acts as a coordinator and knowledge centre in the kampong. Before the establishment of this forum and the revitalisation of the kampong, the batik businessmen in Laweyan did not have formalised communications. They ran their businesses on their own, although they did have some connections with smaller firms. They were not open and, as an interviewee explained,
‘most businessmen in Laweyan were rich people (‘juragan’). They would not open their doors to neighbours. Today, every firm has a gallery or a store, but, in the past, the building was closed and you could not enter it easily. After the establishment of the forum, the social relationships among us have started to be more fluid’.
Nevertheless, as most businessmen take their business over from their parents, they usually inherit established, both backward and forward, business linkages. Most batik firms in Laweyan, as well as in other kampongs, do not carry out all the production processes themselves. Quite often, a firm will design the motif, which is often reproduced several times, while the process of drawing (membatik) on the fabric is usually subcontracted to batik crafters, usually located in villages such as Sukoharjo and Sragen. Once the motif is drawn on the fabric, the firms carry out the colouring process themselves. According to various interviewees, the colouring methods are often unique and constitute the ‘secret recipe’ of each firm. Once manufactured, batik products are distributed through the firm’s own galleries and through wholesalers. As in the Bandung case, this consumer network has been built through seeking out partners and trust-based relationships.
5.5.3 Internal social capital of firmsNetworking capabilities and behaviours reflect the degree to which firms are willing to invest in professional and social relationships in an effort to develop their businesses (Westlund, 2006). During the interviews, several firm owners and

117
Business networks, social capital and productivity
5
managers confirmed the importance of building links and relationships, especially in terms of production and distribution channels. Nevertheless, there are differences between the two cases in terms of perceptions and habits in developing networks, and in internalising knowledge within their firms.
First, the internal social capital of firms is created differently in each case. As an interviewee commented, the first generation clothing firms in Bandung (those founded in the early 2000s) were basically established by ‘trial and error’ in that the founders of these businesses simply wanted to develop affordable local brands as an alternative to the imported fashion products which had become too expensive because of the economic crisis. However, the owners had only limited knowledge on how to manage the business. To overcome this problem, they were strongly motivated to invest in networks to enable ‘learning by doing’. Further, as they had limited financial resources, they had to develop marketing networks, which can be characterised as a consignment system (distro). The process of finding potential distributors involved networking activities and the establishment of trust. As such, a networking ability was a key factor in the development of these businesses. Although newer generations of clothing firms in Bandung (from the late 2000s) might not behave the same, they nevertheless perceive the ability to socialise as an important factor. As an interviewee stated, ‘Bandung is a creative environment; there are a lot of groups, people and information that can be useful to ourselves’. There is ‘buzz’ information that they will acquire if they are actively involved in the networks. In contrast, the internal social capital of batik businesses in Laweyan is inherited through the generations. Today’s owners of batik businesses basically continue from their parents, and inherit tacit knowledge as well as links from the previous generation. As various interviewees noted, it is important for them to maintain these networks, and they ‘would not break the trust that has been built so far’.
Second, because the internal social capital of the firms is built differently in the two cases, the knowledge and other externalities are internalised in different ways in their production systems. The owners and managers of clothing firms in Bandung perceive that it is important to look for new ideas and inspiration, which might be available in the surroundings as well as from competitors. Knowledge from the external environment is internalised through internal meetings and sharing among employees, an activity that is often done on a regular basis. In comparison, batik businesses in Laweyan rely much more on tacit knowledge being shared by previous generation as well as traditional values. Consequently, most firm owners in the Laweyan case study put little focus on searching for inspiration and new ideas, as an interviewee explained, ‘a certain batik motif has its prayers, its hopes. So, if the motif is changed, the [identity] changes as well. But, if only the colour is changed, while the motif remains, the identity continues’.

118
Chapter 5
Nevertheless, several of the interviewees from the batik producers were aware of the importance of looking for new ideas. However, the creative process was still seen as mostly internal, and that ‘design is a secret recipe that nobody else should know’.
From this qualitative analysis, and in line with the results of the multilevel analysis, it can be concluded that the absorptive capacity and the internal social capital of firms determine how the creative processes are carried out, and that these processes then partly determine the performance of these firms. The creative clothing firms in Bandung perceive the importance of socialising and of obtaining knowledge from the external environment in order to develop new ideas and sustain their businesses. In general, these firms also apply mechanisms to internalise this knowledge in their creative processes. In contrast, most batik businesses in Laweyan tend to see networking as only important for marketing, with little attention given to the generation of new ideas and value.
5.5.4 Production-related networksThe assessment of the interviews shows that supplier networks are important to firm productivity in both cases. In general, production-related networks, both in clothing firms in Bandung and in batik businesses in Surakarta, are built on the basis of trust and repeated transactions. It is worth noting that, in Bandung, information regarding specialist suppliers is often received from specific links and relations, such as other firms in the same sector as well as personal channels such as friends. Various interviewees also acknowledged the advantage of being located in Bandung, where the suppliers and components needed for production processes are available and, as the interviewees mentioned, ‘they offer good quality’. The relationship between clothing firms and these suppliers also seems to encourage mutual learning. In this instance, suppliers proactively identify the characteristics of the products of their clients (the clothing firms) and openly offer ideas on making the products. This information can be about new types of materials and methods, current trends as well as hints about what other clothing firms are currently producing.
The findings from the Laweyan case study have a similar tone, in that suppliers provide new information, especially in terms of colouring materials and methods. Various interviewees mentioned that colouring methods can constitute an innovation for their businesses, and so they perform this process themselves. Other than this, for the drawing component, they rely on crafters, mostly from Srragen, with whom they have been working together for a long time. However, this element of the process does not seem to lead to innovation or the creation of new ideas.
To sum up, and in line with theory (Lipparini and Sobrero, 1994), suppliers are able to influence creative processes directly by providing information and new ideas about specific supplies and methods. In our study, the suppliers seemed to be more

119
Business networks, social capital and productivity
5
aggressively seeking innovation than the creative firms, suggesting that creative industries do not always take the lead in innovation in the regional economies.
5.5.5 Market-related networksIt would appear that market-related networks are the most important element of business development in both situations. In the Bandung case, marketing networks are built on the basis of trust and ties. Clothing firms in Bandung were generally established in response to the 1998 economic crisis, and the founders had limited financial resources but strong motivation to promote their businesses. To overcome these financial constraints, these business owners had to use and develop their relationships, which are embodied in the consignment relationships (distro) they have established. As an interviewee said, ‘the thinking behind the (distro) consignment arrangement is that our business cannot stand alone. Our business would not have worked without the help of these people’. As such, various interviewees commented that it is important to keep in contact with these consignees and build trust with them, even though ‘recently wholesales outweigh the sales from consignments’. In addition, market information is crucial for gaining access to new consumers, including wholesalers. This market information is often gained through events and socialising. Events, especially trading expositions, are considered important for younger firms to promote their brands and gain new customers. New consumers are also attracted through social media and seeking endorsements from celebrities or bloggers. Some interviewees mentioned that they often gain access to market information from customers, distributors and friends.
In the Laweyan situation, the current business owners have generally inherited market networks from previous generations and they see it as important to sustain trust with these customers. As in the Bandung case, information about potential buyers is spread through ‘word of mouth’ and by consumers who recommend the products to their friends and relatives.
In conclusion, market-related networks are crucial to the survival and productivity of creative industries. In this regard, in both cases, it was seen that trust building is necessary to maintain existing market networks. More importantly, up-to-date market information is needed to increase market share. Related to this, in many cases, friendship helps in the process of ‘spreading the word’ and advertising the product.
5.5.6 Environment-related networksEnvironment-related networks are crucial since these are the places where creative industries are embedded and obtain information and knowledge. In the Bandung case, various interviewees indicated that the city of Bandung provides a ‘buzz’ environment where they can monitor information and knowledge that is important for their business development ‘by just hanging out around the city’.

120
Chapter 5
As part of this, shopping malls as well as the education and training centres for artists and designers facilitate the circulation of knowledge and ideas, which can easily be captured by these clothing firms’ owners and managers. In addition, some interviewees described the benefits of using social media, such as Instagram and Pinterest, through which they make reference to and monitor global fashion trends, and react by modifying their own products. Conversely, the Laweyan case is situated in a different environment, one in which Javanese culture is the main source of ideas in the development of their products. As the firm owners are familiar with the traditional values used in batik, they do not seek a ‘buzz’ environment, as in Bandung, to find ideas for developing new motifs.
Further, the interactions between these firms and their fellow businesses, as well as between them and other types of economic actors, had different characteristics in the two cases. In the Bandung case, the clustering of clothing firms provides opportunities for socialising and monitoring one another. Various interviewees mentioned that, as they are located close by, they could easily observe the characteristics and styles of their competitors. Nevertheless, they not only compete with each other, they also interact organically and share information and ideas about the development of their businesses. As an interviewee explained, ‘we share information about … good and bad buyers… we recommend our fellows to avoid the bad ones’. Further, some interviewees stated that, as they are co-located, they can meet up and socialise informally, usually when gathering at events or just hanging out in places such as cafés. Social ties between them have proven to be useful, as an interviewee mentioned, ‘with a good relationship they are open about what makes them successful and how they cope with various problems’. Notably, KICK, the association of clothing firms in Bandung, was also developed as an outcome of the good relationships between pioneering clothing firm owners. However, friendship and strong ties between these firm owners often lead to undesirable results. These social relationships are stratified, in that firm owners group according to social status. In many cases, this has resulted in overly strong ties that have not facilitated the development of businesses, as ‘the firm owners are busy with social activities with their friends’. In some of the worst cases, firms have closed down because the owners were no longer focused on developing their businesses. Some interviewees also mentioned that the expos, such as KickFest, organised by associations have recently become ‘just clearance sale events, unlike in the past when events like these were used to introduce our products, our identity’. As such, although interactions can provide useful market information, some firm owners avoid having overly strong ties with fellow clothing firms, as well as with industry associations.
In comparison, in the Laweyan case, Javanese socio-cultural values appear to strongly influence inter-firm relationships. Solidarity is the key feature of relationships between these batik firms. As an interviewee explained, ‘if there are people coming and looking for specific products that we do not have, we will refer them to other shops. […] we help each other here.’ Although such Javanese societal values are strong, it

121
Business networks, social capital and productivity
5
does not mean that the firms in the kampong do not compete with each other. Nevertheless, competition is ‘controlled’ by social norms: each firm focuses on a certain motif or identity, and others will not produce identical products. According to interviewees, although inter-firm relationships in this cluster seem to be quite harmonious, the batik businessmen are strongly differentiated into groups that are not open with each other. Business interactions, such as information sharing and collaborations, are less likely to happen across these groups. To a large extent, this is because creative processes tend to be completely internal and the development of products is confidential.
A difference between the two cases is identified in the characteristics of relationships with various other activities. In Bandung, the clothing firms have strong connections with various communities, notably in music, sport and arts, who help them access market information as well as combine new knowledge. As an interviewee explained, ‘we collaborate with these arts communities in many events and projects. […] In the end, they also endorse our brand in their social media. […] Also with these ‘crowds’ we also find something new, fresh, for our ideas’. Further, there is now an increasing trend of clothing firms collaborating in designing products that combine two brands, such as ‘unkl347 x matoa’. An interviewee said, ‘this collaboration is good as it refreshes our markets and generates new values. We not only compete with fellow businesses, but also… as you can see… we can collaborate. This collaboration indeed creates new values’.
To sum up, the environment in which creative and traditional firms are embedded is able to influence their productivity by providing opportunities to find and combine ideas and knowledge. This is possible through the good relationships between the economic actors. While the multilevel analysis shows that social ties tend to decrease productivity, the qualitative analysis shows that, in the Bandung case, the local environment provides both positive and negative externalities that can influence their productivity. Meanwhile, in the Laweyan case, it seems that social capital features, such as solidarity and kinship, influence the ways in which these people act with each other, but do not affect how they run their businesses.
5.6 DiscussionThe combined results of multilevel and qualitative analyses show that creative industries and traditional cultural industries share similarities as well as differences in terms of networking forms and mechanisms. In elaborating on this issue, it is important to understand the degree to which these distinct characteristics influence their contributions to regional productivity.
Both creative industries and traditional cultural industries, as shown in the qualitative analysis, are focussed on developing and maintaining supplier-buyer relationships. In line with the literature, trust appears to be the most important aspect to be maintained in interactions and repeated transactions (Banks et al.,

122
Chapter 5
2000; Karlsson, 2011; Westlund, 2006). However, the two industries have different internal conditions and social capital and, thus, they show different behaviours when it comes to building relationships. The qualitative analysis showed that creative clothing firms in Bandung go beyond simply developing supplier-buyer relationships, while this was sufficient for the batik firms in Laweyan. This reflects the nature of their products in that creative industries need to find new ideas and knowledge, for instance to detect trends, and this requires them to constantly observe and grasp opportunities available in their surroundings. In comparison, traditional cultural industries utilise tradition as their main source of ideas. The owners of these firms are familiar with traditional values and identities, and so are not strongly motivated to find and develop new combinations of values and ideas.
Further, creative and traditional cultural industries benefit differently from environment-related networks. The environment provides various opportunities to develop supplier-buyer relationships as well as ‘buzz’ factors, which could be useful to the development of businesses. Both the multilevel and qualitative analyses indicate that although the opportunities are similarly available in both the regions included, their influence on the productivity of the two industries studied differ. The multilevel analysis shows that creative industries benefit from both localisation economies and urbanisation economies, indicating that inter-firm relationships can motivate creative industries to become more competitive, and that these relationships provide opportunities to collaborate and possibly combine skills and ideas. However, the qualitative analysis demonstrates that localisation can also have negative externalities for creative industries, especially if the interactions between firms do not lead to either healthy competition or a fruitful collaboration. This danger is particularly relevant for traditional cultural industries which, although they are usually clustered, fail to create added values from this clustering.
Related to this, the analysis showed that regional social capital has quite a complex impact on productivity. While the multilevel model shows that friendship is negatively associated with the productivity both of creative industries and of traditional cultural industries, the qualitative analysis shows that the relationship might not be straightforward. Although friendship plays a role in the selection of suppliers and the exploration of new markets, it does not always encourage the creation and combination of new knowledge between firms. Another important finding, particularly from the multilevel analysis, is that the impact of regional social capital varies according to a firm’s characteristics. This in turn strengthens the argument that the internal social capital of a firm remains a decisive factor in influencing the ways in which external knowledge and resources are internalised and processed to produce its products. Although the local environment provides buzz factors and various resources, the absorptive capacity remains crucial in being able to internalise positive externalities and to extract knowledge that would be useful for a business.

123
Business networks, social capital and productivity
5
5.7 ConclusionsThis paper has investigated the extent to which networking characteristics and practices influence the ways in which creative industries contribute to regional productivity. The environment provides social contexts and culture, externalities as well as opportunities to build relationships and exchange ideas. However, these industries will only benefit from these conditions if they have the ability to capture the opportunities and internalise the positive externalities provided by networks (see also Smit et al., 2015). Traditional cultural industries, which reflect the essence of many creative industries in Indonesia and in other developing countries, illustrate this issue: these industries prioritise highlighting traditional values as selling points, rather than seek innovative ideas, and so do not invest sufficiently to grasp any opportunities for new combinations of ideas. Further, as the findings show that creative industries benefit both from localisation and from urbanisation economies, it can be concluded that they potentially contribute to regional productivity through both competition and collaboration. Being co-located with fellow firms, and with other types of economic activities, can stimulate creative firms to develop their creativity and competitiveness, and also opens up the possibility of collaboration in which they can cross-fertilise fresh ideas, resulting in radical innovation that boosts regional productivity. Again, this will only happen if firms have sufficient ability to be involved in this process. In this regard, policy strategies should be designed such that investments in social capital and networking can be delivered at both the firm and the regional levels. At the firm level, firms could be encouraged to develop their networking and learning capacities. At the regional level, the government can facilitate the nurturing of a climate that stimulates interactions and the exchange of ideas between creative firms and other economic activities.
ReferencesBanks M, Lovatt A, O’Connor J, et al. (2000) Risk and trust in the cultural industries. Geoforum 31(4): 453–464.Boateng B (2011) The copyright thing doesn’t work here: Adinkra and Kente cloth and intellectual property in
Ghana. Minneapolis: University of Minnesota Press.Boix-Domenech R and Soler-Marco V (2015) Creative service industries and regional productivity. Papers in
Regional Science doi:10.1111/pirs.12187.Cattani G and Ferriani S (2008) A Core/Periphery Perspective on Individual Creative Performance: Social
Networks and Cinematic Achievements in the Hollywood Film Industry. Organization Science 19(6): 824–844.Caves RE (2000) Creative industries: contracts between art and commerce. Cambridge and London: Harvard
University Press.Daskalaki M (2010) Building ‘Bonds’ and ‘Bridges’: Linking Tie Evolution and Network Identity in the Creative
Industries. Organization Studies 31(12): 1649–1666.Desrochers P (2001) Local Diversity, Human Creativity, and Technological Innovation. Growth and Change 32(3):
369–394.Desrochers P and Leppälä S (2011a) Creative Environments: The Case for Local Economic Diversity. In: Andersson
D, Andersson Å, and Mellander C (eds), Handbook of Creative Cities, Cheltenham and Northampton: Edward Elgar Publishing, pp. 422–433.
Desrochers P and Leppälä S (2011b) Opening up the ‘Jacobs Spillovers’ black box: local diversity, creativity and the processes underlying new combinations. Journal of Economic Geography 11(5): 843–863.

124
Chapter 5
Fahmi FZ and Koster S (2015) Creative industries and regional economic development: Evidence from Indonesia. Presented at 55th ERSA Congres, 25-258 August, Lisbon.
Fahmi FZ, Koster S and van Dijk J (2016) The location of creative industries in a developing country: The case of Indonesia. Cities 59: 66–79.
Feldman MP and Kogler DF (2010) Stylized Facts in the Geography of Innovation. In: Hall BH and Rosenberg N (eds), Handbook of the Economics of Innovation, Amsterdam: Elsevier, pp. 381–410.
Frenken K, Van Oort F and Verburg T (2007) Related Variety, Unrelated Variety and Regional Economic Growth. Regional Studies 41(5): 685–697.
Glaeser E, Kallal H, Scheinkman J, et al. (1992) Growth in Cities. The Journal of Political Economy 100: 1126–1152.
Grandori A and Soda G (1995) Inter-firm Networks: Antecedents, Mechanisms and Forms. Organization Studies 16(2): 183–214.
Granger RC and Hamilton C (2010) Re-spatializing the creative industries: a relational examination of underground scenes, and professional and organizational lock-in. Creative Industries Journal 3(1): 47–60.
Hartley J (ed.) (2005) Creative industries. Malden, MA: Blackwell Pub.Huggins R, Johnston A and Thompson P (2012) Network Capital, Social Capital and Knowledge Flow: How the
Nature of Inter-organizational Networks Impacts on Innovation. Industry & Innovation 19(3): 203–232.Iyer S, Kitson M and Toh B (2005) Social capital, economic growth and regional development. Regional Studies
39(8): 1015–1040.Jacobs J (1969) The economy of cities. New York: Vintage Books.Karlsson C (2011) Clusters, networks and creativity. In: Andersson D, Andersson Å, and Mellander C (eds),
Handbook of Creative Cities, Cheltenham and Northampton: Edward Elgar, pp. 85–113.Lazzeretti L, Boix R and Capone F (2008) Do Creative Industries Cluster? Mapping Creative Local Production
Systems in Italy and Spain. Industry & Innovation 15(5): 549–567.Lazzeretti L, Capone F and Boix R (2012) Reasons for Clustering of Creative Industries in Italy and Spain.
European Planning Studies 20(8): 1243–1262.Lipparini A and Sobrero M (1994) The glue and the pieces: Entrepreneurship and innovation in small-firm networks.
Journal of Business Venturing 9(2): 125–140.Malecki EJ (2012) Regional Social Capital: Why it Matters. Regional Studies 46(8): 1023–1039.Möller KK and Halinen A (1999) Business Relationships and Networks: Managerial Challenge of Network Era.
Industrial Marketing Management 28(5): 413–427.Neff G (2005) The Changing Place of Cultural Production: The Location of Social Networks in a Digital Media
Industry. The Annals of the American Academy of Political and Social Science 597(1): 134–152.Potts J (2007) Art & innovation: An evolutionary economic view of the creative industries. UNESCO Observatory
1(1): 1–17.Potts J and Cunningham S (2008) Four models of the creative industries. International Journal of Cultural Policy
14(3): 233–247.Potts J, Cunningham S, Hartley J, et al. (2008) Social network markets: a new definition of the creative industries.
Journal of Cultural Economics 32(3): 167–185.Putnam RD, Leonardi R and Nanetti RY (1994) Making democracy work: civic traditions in modern Italy. Princeton:
Princeton Univ. Press.Qian H and Acs ZJ (2013) An absorptive capacity theory of knowledge spillover entrepreneurship. Small Business
Economics 40(2): 185–197.Rosenthal SS and Strange WC (2003) Geography, Industrial Organization, and Agglomeration. Review of
Economics and Statistics 85(2): 377–393.Rutten R and Boekema F (2007) Regional social capital: Embeddedness, innovation networks and regional
economic development. Technological Forecasting and Social Change 74(9): 1834–1846.Scott AJ (2006) Entrepreneurship, Innovation and Industrial Development: Geography and the Creative Field
Revisited. Small Business Economics 26(1): 1–24.Smit MJ, Abreu MA and de Groot HLF (2015) Micro-evidence on the determinants of innovation in the Netherlands:
The relative importance of absorptive capacity and agglomeration externalities. Papers in Regional Science 94(2): 249–272.
Steinmo M (2015) Collaboration for Innovation: A Case Study on How Social Capital Mitigates Collaborative Challenges in University–Industry Research Alliances. Industry and Innovation 22(7): 597–624.

125
Business networks, social capital and productivity
5
Thornton PH and Flynn KH (2005) Entrepreneurship, Networks, and Geographies. In: Acs ZJ and Audretsch DB (eds), Handbook of Entrepreneurship Research, New York: Springer-Verlag, pp. 401–433.
van Oort FG, Burger MJ, Knoben J, et al. (2012) Multilevel Approaches and the Firm-Agglomeration Ambiguity in Economic Growth Studies. Journal of Economic Surveys 26(3): 468–491.
Westlund (2006) Social Capital in the Knowledge Economy. Berlin and Heidelberg: Springer.Westlund H and Adam F (2010) Social Capital and Economic Performance: A Meta-analysis of 65 Studies.
European Planning Studies 18(6): 893–919.Wu W (2007) Dimensions of Social Capital and Firm Competitiveness Improvement: The Mediating Role of
Information Sharing. Journal of Management Studies 45(1): 122–146.

126
Chapter 5
Appendix 5A Descriptive overview of variables used in the multilevel analysis
Variable
Creative industries Traditional cultural industries
(N=29,260) (N=764,176)
Mean Std. Dev. Mean Std. Dev.
Turnover (IDR) 2,080,000,000 138,000,000,000 277,000,000 88,000,000,000
No of workers 5.252 27.089 2.710 46.126
Productivity 703,000,000 88,500,000,000 74,400,000 45,400,000,000
Productivity (ln) 15.970 1.346 14.585 1.339
Size (cent) 0.000 0.499 0.000 0.500
Size² (cent) 0.000 0.499 0.000 0.500
Age (cent) 0.000 0.499 0.000 0.500
Age² (cent) 0.000 0.499 0.000 0.500
LQ CI or CULT (cent) 0.307 0.716 0.362 0.610
Relvar (cent) 0.237 0.496 -0.190 0.486
Friendship (cent) -0.146 0.485 0.083 0.487
Socialising (cent) -0.056 0.486 0.015 0.484
Helping (cent) 0.037 0.444 0.027 0.538
Appendix 5B Correlation tables (multilevel analysis)For models creative industries
1 2 3 4 5 6 7 8 9 101 Productivity (ln) 1 2 Size (cent) 0.10 1 3 Size² (cent) 0.09 0.92 1 4 Age (cent) 0.12 0.18 0.13 1 5 Age² (cent) 0.08 0.17 0.14 0.90 1 6 LQ CI (cent) 0.19 0.00 0.00 0.00 0.00 1 7 Relvar (cent) 0.12 0.00 0.00 0.00 0.00 0.56 1 8 Friendship (cent) -0.12 0.00 0.00 0.00 0.00 -0.18 -0.31 1 9 Socialising (cent) -0.06 0.00 0.00 0.00 0.00 0.01 -0.17 0.46 1
10 Helping (cent) 0.01 0.00 0.00 0.00 0.00 0.23 0.22 0.22 0.57 1
For models traditional cultural industries 1 2 3 4 5 6 7 8 9 10
1 Productivity (ln) 1 2 Size (cent) 0.06 1 3 Size² (cent) 0.03 0.83 1 4 Age (cent) -0.07 -0.01 0.00 1 5 Age² (cent) -0.07 -0.01 0.00 0.91 1 6 LQ CI (cent) 0.02 0.00 0.00 0.00 0.00 1 7 Relvar (cent) 0.09 0.00 0.00 0.00 0.00 -0.60 1 8 Friendship (cent) -0.10 0.00 0.00 0.00 0.00 0.03 -0.14 1 9 Socialising (cent) -0.05 0.00 0.00 0.00 0.00 -0.04 -0.09 0.42 1 10 Helping (cent) -0.09 0.00 0.00 0.00 0.00 -0.01 0.13 0.35 0.56 1

127
Business networks, social capital and productivity
5
Appendix 5C List of interviewees
The Bandung case1. Wadezig, owner2. NIION, owner3. Tubagus Fiki Satari of Airplane (owner), KICK (former chief) and BCCF (chief)4. unkl347, owner5. spiffyxfreak, owner6. papersmooth, co-directors (two persons)7. offf, owner8. Parental Advisory, owner9. wellborn, owner10. Ade Andriansyah of Flashy (co-owner) and KICK (current chief)11. Cosmic, managers (two persons)12. Disperindag, head of department13. Bappeda, staff member
The Laweyan case1. Batik Merak Manis, manager2. Batik Cempaka, owner3. FPKBL, board member #14. FPKBL, board member #25. Batik Putra Laweyan, manager6. Batik Pandono, owner7. Batik Jufa, owner8. Batik Gres Tenan, owner9. Batik Setya Lukisan, owner10. Batik Mahkota, owner11. Batik Estu Mulyo, owner12. Disperindag, head of division13. Bappeda, head of division14. Department of Culture and Tourism, head of division


General discussion and conclusions
6

130
Chapter 6
This thesis has examined the feasibility of adopting the creative economy and creative industries as an instrument for regional economic development in the context of a developing country, namely Indonesia. Using different approaches and levels of analyses, the thesis has identified the degree to which the idea of the creative economy and creative industries is fashioned within local institutions and policies, and represented in the actual potential of the regional economy. Below, the main findings are discussed and reflected upon in the framing of the research questions. This is followed by a discussion on policy implications and suggestions for future research.
6.1 From tradition to the creative economy: (re)defining ‘creative’ and ‘traditional cultural’ industries
There are two opposing views, which reflect different value orientations, on how culture, creativity and the economy are interrelated. The first view has a culture-centric orientation and emphasises cultural values, arts, symbolic meanings and community wellbeing – which in this thesis is referred to as the ‘cultural economy’. The other view has an econo-centric orientation and emphasises commercial values, and the creation of new knowledge and innovation – often referred to as the ‘creative economy’ (Andres & Chapain, 2013; O’Connor, 2015; Smith & Warfield, 2008). However, other scholars reject such a binary perspective and see the idea of ‘creative industries’ as being historically rooted in the notion of ‘cultural industries’ (e.g., Flew, 2002), and see a conceptual convergence of the creative arts and cultural industries (Hartley, 2005).
In promoting long-established craft-based businesses – which are referred to as ‘traditional cultural industries’ in this thesis – the Indonesian government refers to them as creative industries despite the fact that these activities pay little attention to the creation of new knowledge and tend to maintain conservative values. Traditional cultural industries are clearly different from the conceptual idea of creative industries. As such, the single broad definition of creative industries imported from the UK context (and the Howkins model) is not fully appropriate for local contexts in Indonesia. The concept of creative industries emphasises several features, such as innovation, copyright and technology. In comparison, traditional cultural industries have different characteristics that do not seem to comply with this concept. Traditional cultural industries might use new technologies to support their production processes, but certain methods or customs are preserved. Further, these industries look to tradition as the main source of ideas in the development of their products. Although new ideas and designs are applied, these industries prioritise the preservation of regional heritage and values that provide unique selling points (Kong, Gibson, Khoo, & Semple, 2006; O’Connor & Xin, 2006). This is not to say that handicraft industries are not creative, or any less innovative than creative industries. However, traditional cultural industries utilise a different type of creativity – communal creativity – in which individual creative acts cannot be

131
General discussion and conclusions
6
disentangled from collective values and knowledge in the form of local traditions. This has implications for the nature of their products in that it becomes difficult to assess their originality and award intellectual property rights. Since tradition is a collective good, it is difficult to apply the copyright mechanism generally applied to knowledge-based products – the ‘Western’ copyright regime – to traditional cultural industries (see Boateng, 2011).
Returning to the debate on the definition of creative industries, especially in the context of Indonesia as well as other developing countries, it seems more logical to differentiate between creative and traditional cultural industries as this better reflects the specificities of the local reality. Although many, often based on a ‘Western perspective’, argue that creative and cultural industries cannot be disentangled, in developing economies both industries have fairly distinct value orientations (cf. Banks & O’Connor, 2009; Flew & Cunningham, 2010). In the context of Indonesia, and likely in other developing countries, the debate on this definitional issue also seems different. First, the Indonesian government has adopted the ‘creative economy’ and ‘creative industries’ ideas largely from the British context, rather than the terms ‘cultural economy’ and ‘cultural industries’. Second, culture-based businesses have existed for a long time, and they focus on heritage values to provide unique selling points (Kong et al., 2006; O’Connor & Xin, 2006). These long-established businesses – which are referred to as ‘traditional cultural industries’ in this thesis – differ not only from the concept of creative industries, which emphasises new knowledge and innovation, but also from the way the term ‘cultural industries’ is used in the ‘Western’ literature. Whereas cultural industries in a Western context are associated with the production of symbolic meanings that are derived from societal values and the function of cities as centres for cultural consumption (Pratt, 1997; Scott, 1997), traditional cultural industries in the context of Indonesia, and possibly in other developing countries, reflect the historic development of cultural entrepreneurship that occurred in community clusters.
As such, separating the two ‘industries’ seems justified and can help in understanding their distinct characteristics and specific needs, as well as their contributions to regional economies in the developing world. More importantly, making this distinction would help when it comes to designing policy strategies that are appropriate for local conditions and potentials. Although this distinction is clear conceptually, the border between the two is not easy to empirically define. Ideally, innovation, copyright and technology aspects would be measured at the firm level, thereby testing whether a firm performs innovative processes and utilises individual creativity. Unfortunately, and not only in Indonesia, statistics often do not provide such information, and so a classification is developed based on ‘theoretical judgement’: whether, in general, an industrial sector has the aforementioned aspects of creative industries. Despite this challenge, this research has empirically developed a classification distinguishing creative and traditional cultural industries using available Economic Census data. By using these data,

132
Chapter 6
a classification has been developed although, due to the nature of the data, this is limited to industrial sectors, and this remains a limitation of this study. An alternative, recommended, approach would be to measure the relevant features at the level of occupations given that within a creative firm there will be some workers who are not involved in creative processes (e.g., secretaries and accountants).
6.2 Different interpretations and implementations of creative economy policies
Although the national government in Indonesia uses a single definition of creative industries, different interpretations and implementations of the creative economy policy are found at the local level, reflecting both the fuzziness and place-specific situations (Chapter 2). Bandung, one of the first cities to implement the creative economy policy in Indonesia, is the only locality whose interpretation is close to the ‘original’ concept of the creative economy. Meanwhile, other cities, notably Surakarta and Yogyakarta, have re-labelled long-established traditional crafts as creative industries. As such, the ‘creative economy’ in these two cities appears to be a rebranding exercise in pursuance of existing policy strategies, such as delivering subsidies to craft associations. This situation echoes the findings in other Asian countries, in which the creative economy is interpreted differently (see Kong et al., 2006).
Generally speaking, these different interpretations reflect the intermediaries who introduce the discourse, the way the discourse is structured (top-down or bottom-up), the local autonomy of local governments to direct their own interpretations and also the place-specific contexts. In Bandung, the creative economy is not only fashioned as a discourse, it is also operationalised through actions. This ‘successful’ experimentation has been assisted by the grassroots movements that helped introduce the discourse and guided the local government stakeholders in adopting their interpretation of the creative economy. Meanwhile, in Surakarta and Yogyakarta, such intermediaries have not been present. These cities also have a strong attachment to traditional culture and, because of this, the local governments tend to be reluctant to promote creative industries that are involved in ‘contemporary’ culture, as this might wipe out the noble values of local traditions. With their local autonomy rights, the local governments are able to choose to promote the existing traditional crafts, seeing these as containing heritage values that should be protected.
Further, there is the possibility for lower income countries, such as Indonesia, to implement a creative economy policy, but not in all regions. As shown in the Bandung case, the global discourse on the creative economy is able to guide policy experimentations and reshape local institutions in a context beyond the developed world. However, the creative economy is not interpreted in line with the original concept in several localities, and this suggests that the original concept of the creative

133
General discussion and conclusions
6
economy might not be appropriate for these local contexts and, thus, that these localities might be better off not adopting the discourse. If the local governments do want to promote traditional cultural industries, thereby preserving traditional and heritage values, then other policy strategy designs should be pursued.
6.3 Creative industries: still a ‘luxury good’ in a developing country?
The ‘real’ creative industries, in a sense of those economic activities that focus on generating new ideas or designs, are still scarce in Indonesia. Based on the 2006 Economic Census data used in the analysis, creative industries made up to less than 1% of all firms. These industries are largely concentrated in relatively advanced urban regions, such as Java and Bali, where other tertiary sectors are also clustered (Chapter 3). This is not dissimilar to the situation in the developed world, where creative industries are concentrated in metropolitan areas where they benefit from a pool of human capital and a variety of economic activities. Urbanised economies provide opportunities for creative industries to be involved in economic transactions as well as to interact with other economic actors, including the exchange and combination of ideas and knowledge (Lazzeretti, Boix, & Capone, 2013; Potts, 2007; Pratt, 2008). Although ‘post-industrial cities’ might not yet be present in developing countries, including Indonesia, some regions, and especially major cities, are far more ‘advanced’ than other regions and potentially provide better conditions for creative industries. However, these industries are unlikely to constitute the regional economic base, and their consumers remain largely domestic (Chapter 5). This shows that creative industries are, to some extent, still a phenomenon in the large cities, or a ‘luxury good’ in the context of a developing economy.
The literature suggests that creative industries potentially deliver positive impacts on regional productivity since they generate new ideas and thus yield significant economic value. This impact is potentially shown through sectoral and knowledge spillovers (e.g., Boix-Domenech & Soler-Marco, 2015; Potts & Cunningham, 2008). The results presented in this thesis show that, in the context of Indonesia, the presence of creative industries is positively associated with regional productivity growth in the service sector as well as in the entire economy, but that this is only strongly evident in the Javanese regions (Chapter 4). Larger sectors, such as oil and gas companies and manufacturing industries, are still important determinants of regional productivity growth, and more so than creative industries. Creative industries in Indonesia are more likely to be an indicator, rather than a driver, of regional economic development. These industries do not constitute a leading sector that significantly stimulates economic growth. It is true that the creative industries are strongly associated with the tertiary sector, with which they may be involved in business transactions and other types of collaborations. However, this does not mean that creative industries take the lead in generating and transmitting new

134
Chapter 6
values to the other sectors (Chapter 4) in that creative industries also seem to benefit significantly from ideas and values circulating in the regional economy (Chapter 5). It is also important to note that the economic impacts of creative industries might change in the future. Given their relatively rapid growth, creative industries appear to be an ‘infant sector’ and so may well deliver increasing contributions to the regional economy.
Overall, these findings reflect the current situation of regional disparity in Indonesia. While creativity- and knowledge-based economic activities are already in operation in several major cities, especially those on Java, many regions still specialise in agriculture, and there are still ‘underdeveloped’ regions on remote islands. Many other developing countries have a similar characteristic of an urban hierarchy, in which ‘primate cities’ dominate the national economy, while other regions become ‘the hinterland’ (see Henderson, 2002). In this regard, the current challenges in regional development in such developing countries encompass not only developing ‘innovative’ strategies for promoting creative industries in relatively developed regions, but also dealing with the regional and social inequalities that have been present for a considerable period.
6.4 Traditional cultural industries: specificities and potentials
Long-established businesses based on traditional crafts, or traditional cultural industries, are the specificity in the creative economy of Indonesia, and possibly in other Asian and developing countries. Nevertheless, little is understood about the specific characteristics and potentials of these industries. This research has attempted to provide insights into the specific characteristics and position of traditional cultural industries in a developing economy by comparing these to the ‘real’ creative industries.
Although traditional cultural industries tend to pay little attention to innovation and usually focus on preserving heritage values, they are large in economic terms (over 7% of all firms in Indonesia). As such, these industries are important to the economy and should not be overlooked in regional development policies. Concentrations of traditional cultural industries are found not only in relatively advanced regions, such as Java, but also in regional centres outside Java and even in rural areas. This means that these industries are important to the whole of the country. Unlike with clusters of creative industries, regional factors, such as human capital pooling and economic diversity, are not associated with the localisation of traditional cultural industries (Chapter 3). This supports the view that, since traditional cultural industries and creative industries have different characteristics, they belong to different habitats and have different development trajectories.
As traditional cultural industries make up a significant proportion of all firms and likewise employment, they potentially contribute to the regional economy, but most

135
General discussion and conclusions
6
likely in a different way to creative industries (Chapter 4). Rather than developing new ideas and values, these industries seem to follow consumption patterns and produce exotic products that are clearly aimed at specific market segments. As in other Asian countries (e.g., Kong et al., 2006), traditional cultural industries in Indonesia currently generate economic value by highlighting ‘conservative’ values, and these tend to be largely unchanging over time. These industries can contribute to the economy by creating jobs and revenues, as well as serving the tourism industry with their products. These findings strengthen the argument that traditional cultural industries in the context of developing countries such as Indonesia differ significantly from ‘cultural industries’ as described in the literature, which reflect the role of cities as centres for cultural consumption and enjoyment (Pratt, 1997; Scott, 1997). Traditional cultural industries have an important position in various realms, including small and medium-sized cities, as well as rural areas and less-urbanised regions. For example, as discussed earlier in this thesis, batik producers in Kampong Laweyan have had strong relationships with batik crafters in rural areas such as in Sragen and Sukoharjo who have helped them with drawing batik motifs on the fabrics (Chapter 5). This shows that traditional cultural firms can play an important role in building regional supply chains and strengthening the linkage between rural and urban areas.
6.5 Creative industries and regional productivity: mechanisms
This research is not only concerned with the extent to which creative industries have an impact on regional productivity, but also the ways in which these impacts materialise. The results of a regional-level analysis showed that creative industries are likely to be an indicator of regional economic growth (Chapter 4). Unlike in developed countries (Boix-Domenech & Soler-Marco, 2015; Potts & Cunningham, 2008), creative industries are still scarce in Indonesia and, as a consequence, they seem to benefit from existing regional conditions and are unlikely to take the lead in circulating new values to other segments of the economy. At the same time, the results of the micro-level analysis demonstrate that creative firms also have the potential to contribute to the regional economy. The regional environment provides opportunities for creative firms to be involved in business transactions as well as to interact with other economic activities. These firms are able to take advantage of these opportunities to gather new ideas for their businesses and enhance their productivity, which could then increase regional productivity. This may occur through two mechanisms: competition and collaboration (Chapter 5). First, in line with the Schumpeterian ‘creative destruction’ argument (see Scherer, 1989), creative firms compete with their peers in various aspects, resulting in improved quality products, an increased number of customers and maybe the generation of new ideas. Second, these firms might collaborate with various other economic activities through which they share, exchange and cross-fertilise various ideas, resulting

136
Chapter 6
in innovation. Both explanations support the Jacobs spillover argument which predicts that regional economic growth is generated by economic diversification that facilitates economic actors to exchange skills and ideas as well as boosting local competition (Desrochers & Leppälä, 2011; Jacobs, 1961). Further, in line with the argument of related variety, the results of this study show that competition is not the only mechanism of growth, and that collaboration facilitates the exchange of new ideas among individuals or firms, which also enhances productivity (Desrochers & Leppälä, 2011).
It is important not to forget that social culture, values and contexts strongly influence these processes. The environment provides a ‘buzz’ and other opportunities to gather ideas and build networks. Social capital aspects, such as the culture of friendship, also seem influential in these processes, albeit either positively or negatively. As an illustration, friendship can help firm owners find specialist suppliers and customers, but if such relationships are too strong, they might remove the competitive spirit that helps create innovation. Regional economies provide opportunities to be involved in both supplier-buyer relationships and other types of partnerships. However, as argued in the literature, creative firms need the ability to socialise and invest in building relationships with other actors. Firms also need be able to internalise externalities and the knowledge available in their surroundings, so that they can use these in the development of their businesses (Qian & Acs, 2013; Smit, Abreu, & de Groot, 2015; Westlund, 2006).
However, this line of argument is less relevant to traditional cultural industries. These industries have different networking characteristics and capabilities than creative industries. Traditional cultural industries benefit less from being co-located with fellow businesses. This is perhaps because the knowledge shared between these industries is largely unchanging over time, and so the interactions between them do not lead to the generation of new ideas. As such, being clustered with similar businesses tends to generate negative externalities for traditional cultural industries (see Scott, 2006). In addition, this research has shown that these industries do not collaborate with other types of industries. A possible explanation for this is that, since they are focussed on preserving heritage values, they are not looking to combine new ideas.
6.6 The development picture of creative industries beyond the developed world: reflections on the literature
The idea of the creative economy and creative industries has been built upon specific contexts and phenomena that are found in the developed world. This thesis has shown that creative industries are to an extent represented in the local realities of Indonesia. Although regional economies and technologies in this context are relatively less advanced, creative industries do potentially flourish in

137
General discussion and conclusions
6
a developing economy (see also Barrowclough & Kozul-Wright, 2008; Yusuf & Nabeshima, 2005). However, the development patterns and trajectories of these industries in a developing country context appear to be different from those in the developed world. Creative industries are associated in the West with the tertiary (or advanced) economy but in the context of a developing country, such as Indonesia, the development of these industries is not triggered by deindustrialisation (cf. Flew, 2002; Hall, 2000). Unlike in developed countries, creative industries in a developing country are not always established in response to economic opportunities, but sometimes because some people cannot find employment elsewhere, or ‘necessity-based entrepreneurship’ (cf. Singer, Amorós, & Arreola, 2015). The ‘boom’ in creative industries, as well as the emergence of the creative economy policy in Indonesia, was to an extent triggered by the 1998 economic crisis. Many businesses closed down at that time and unemployment increased, such that people started to earn a living in the informal sector and through entrepreneurial activities, including ones that fall under the term creative industries (Chapter 3). This development occurred in parallel with advances in technology, which also smoothed the transfer of creative economy policies to the developing economy.
Another aspect that distinguishes the creative economy in Indonesia, and in other developing countries, is the inclusion of the long established tradition-based craft industries, what we have labelled as ‘traditional cultural industries’. Although these industries are promoted as creative industries, they have a different conceptual basis than the ‘real’ creative industries: they pay little attention to new knowledge and focus on preserving heritage values (see Kong et al., 2006). Traditional cultural industries also have different development patterns, other locations and other impacts than creative industries (Chapters 3, 4 and 5). The Indonesian government has welcomed the arrival of the creative economy in Indonesia, as this enables traditional cultural industries to be ‘renewed’ and positioned under a new policy umbrella. However, this blurs the interpretation and implementation of the creative economy as an instrument for development (Chapter 2). On the one hand, the government seeks to create a new economic path, one that is focussed on the generation of new knowledge and innovation. On the other hand, it emphasises the preservation of heritage and conservative values, and sees these as selling points, which contradicts the essential idea of the creative economy.
Despite this ambivalence, ‘real’ creative industries are to be found in specific regions, although they are far outnumbered by traditional cultural industries. Further, the impacts that creative industries have on regional economies in developed countries, both conceptually and empirically, are barely visible in Indonesia. In line with the prediction of De Beukelaer (2014), this thesis has shown that creative industries in developing countries such as Indonesia are not yet a driver of regional productivity growth (Chapter 4). Currently, creative industries seem to be seen as part of a larger group in such economies, most notably the knowledge-intensive service industries, and appear to benefit significantly from the existing regional

138
Chapter 6
conditions (cf. Boix-Domenech & Soler-Marco, 2015; Potts & Cunningham, 2008). As such, creative industries are able to take advantage of various resources available in the regional environment to develop their businesses, including opportunities to develop business and social networks. Nevertheless, by taking these opportunities, creative industries do have the potential to increase regional productivity. As they interact with other firms, and also compete with them, firms exchange and combine new ideas and through this these industries can gain new ideas and perspectives that can enhance their business productivity (Chapter 5). Here, social norms and values mediate the process by constructing the culture of interactions that influences how economic actors, including creative firms, act in the environment. Reflecting on the societal contexts present in Indonesia, one notes that social ties are rather strong, in that they often bond people with a feeling of sameness and solidarity, and that this can weaken the competition among firms (see Iyer, Kitson, & Toh, 2005; Putnam, Leonardi, & Nanetti, 1994). As such, the barriers to the development of creative industries in Indonesia include not only the less advanced regional economies and technologies, but also the socio-cultural settings. Firms need to build their absorptive capacity, which will help filter out the negative externalities originating in social interactions.
Overall, exploring the development of creative industries in Indonesia reveals a different picture from that seen in the context of industrialised countries. The development of creative industries in Indonesia does not yet reflect a significant restructuring towards a knowledge economy. However, the presence of such industries is a good indicator of economic tertiarisation and diversification. Further, the arrival of the creative economy in Indonesia, and in other developing countries, not only brings Western narratives on regional development, it also indirectly encourages local institutions to build imaginaries based on existing cultural activities. Although in many instances the creative economy appears to be a rebranding exercise, the discourse has increased awareness that the ‘old’ traditional cultural industries do have a large potential in regional development. Questions remain, however, over the future path of these industries and the strategies adopted to promote them. This is particularly related to the question as to whether it is necessary to transform traditional cultural industries into creative industries, by introducing innovation wherever possible, or to leave them as they are. Each aim will require different policy strategies.
6.7 Policy implications: positioning creative industries in regional development
The research findings in this thesis have important implications for urban and regional development policies. The first and most important aspect is related to the definition and classification of creative industries. Currently, the Indonesian government adopts a single, broad definition of creative industries. As has been shown in this thesis, the ‘real’ creative industries and the traditional cultural

139
General discussion and conclusions
6
industries that this broad definition covers different characteristics and conceptual ideas. Separating the two types of industries is necessary, particularly to incorporate their specific requirements when designing appropriate strategies.
As creative industries are not distributed evenly across regions, any development strategies based on these industries will not be applicable for every region. Any such strategies would be mainly relevant for the more advanced urban regions, where the economy is increasingly tertiarising. Contrary to what the central government has sought to achieve,31 the findings of this research suggest that not all regions should promote or set out to attract creative industries. As also argued, creative industries should not be positioned as a ‘growth pole’ (see Darwent, 1969), not only because these industries are still scarce and are yet to significantly stimulate economic growth, but also because other sectors are more important to the regional economies. The niche potential of these industries is a more crucial aspect to take into account when formulating strategies for regional development. In this regard, in line with the place-based approach to regional development, local development strategies should be tailored to local characteristics and potentials (see, for instance, Barca, McCann, & Rodríguez-Pose, 2012; Pike, Rodríguez-Pose, & Tomaney, 2006; Tomaney, 2010). For those regions that specialise in traditional cultural industries, supporting and improving these would be a more feasible approach than encouraging the establishment of new creative industries.
Adopting a place-based approach to regional development, regions should identify and mobilise their own potentials and strengths. Essentially, there are no ‘one size fits all’ strategies for fostering regional economies. The development process is seen as locally rooted, in which local actors are actively involved in drawing on the available resources, especially human capital and innovative capabilities, to create opportunities and resolve local problems (Tomaney, 2010). Nevertheless, institutions have a crucial role in identifying and activating the local potentials (Barca et al., 2012). This approach would seem appropriate for the current institutional context in Indonesia in that, in this decentralisation era, local governments have more power and the authority to direct development. As such, they should be able to develop their local knowledge to determine the ‘best’ strategies that fit their local contexts and potentials.
Further, local governments might come up with different programmes and projects to promote creative industries. Nevertheless, as outlined earlier, it should not be forgotten that socio-cultural norms and climates have a strong influence on the development of creative industries, as well as on the ways in which these industries share, exchange and combine new ideas and knowledge. Furthermore, firms require sufficient internal social capital and absorptive capacity if they are to internalise positive externalities and filter out the potentially negative outcomes
31 Presidential Instruction 6/2009 obliges local governments in Indonesia to promote the creative economy in their territories.

140
Chapter 6
of these interactions (Chapter 5). Based on this conclusion, policy interventions aimed at encouraging creative industries can be designed for both the firm and the region levels. At the firm level, creative industries should be encouraged to develop their own networking capabilities as well as to manage the sustainability of their businesses. At the regional level, policy schemes can be designed to nurture an environment that is conducive for business development and knowledge transfer. One potential instrument would be to provide hard infrastructure, such as meeting places and co-working spaces, where creative entrepreneurs can informally meet and socialise. However, it is more crucial to build a climate that stimulates serendipitous interactions and collaborations between firms without removing the competition between them.
Appropriate strategies for supporting traditional cultural industries would be different from the above-mentioned suggestions. It is more a question of whether traditional cultural industries should be somehow transformed into ‘more innovative’ creative industries, or should they continue to focus on heritage values as their selling point. As discussed in Chapter 5, there is a potential for these cultural businesses to apply new ideas to their products without rejecting the ‘noble’ traditional values they represent. In this respect, traditional cultural industries could be encouraged to improve their capacity and competitiveness by going beyond simple repetition of ‘exotic’ values or motifs, and thereby generate higher economic value. This could be achieved by introducing new ideas and technologies, encouraging collaborations, as well as by opening up potential markets that could stimulate the creation of innovative products.
Some regions may be appropriate for concentrations of both creative and traditional cultural industries. Although both industries seem to require different policy strategies, it does not mean such policy strategies should be strictly isolated. Sometimes, creative industries are inspired by traditional values in developing their ideas or designs.32 This cross-fertilisation of ideas between creative and traditional cultural industries need not be limited to creative industries drawing on traditional values; traditional cultural industries can learn various lessons on developing more competitive businesses and designs from the ‘modern’ creative industries. As such, policy strategies could be designed to encourage interactions, learning and collaborations between the two industries.
Apart from this, the main challenge in establishing a framework for supporting creative and traditional cultural industries at the local (municipality and district) level is that although local governments now have greater power, in many cases they still lack the capacity to govern locally-rooted development processes. Although they now have plenty of opportunities to experiment with new policy ideas, they do not always benefit from these. As discussed earlier (see Chapter 2), some local
32 For instance, game developers use characters from traditional and local tales, and fashion design-ers use and combine batik materials in the products.
141
General discussion and conclusions
6
governments use the term ‘creative economy’ as a branding tool, but make no serious attempt to grasp its essential ideas. More crucially, because policy strategies are not clearly identified, there is no added value from adopting the discourse. Even if local governments, after considering the local potential, decide on their own conceptualisation of the ‘creative economy’, by referring to the cultural economy, this has to be translated into clear strategies, and not be merely a relabelling of existing policies.
The experimentation with a creative economy policy in Bandung was effective because of the active role that ‘creative communities’ played in introducing and structuring the creative economy policy (Chapter 2). However, in many places, such intermediaries are not present, and there needs to be systems in place that are able to guide policy experiments by local government officials. In this regard, local governments need to be proactive in looking into the possibilities of collaborating with other local stakeholders, and also integrating grassroots movements into their governmental programmes. In other words, local governments need to create room for communication and participatory actions with the community. These communication processes could also facilitate mutual learning between the government and the community, which will result in better-formulated policy choices for the creative economy. Further, coordination between the central and local governments is equally crucial. Here, the central government can play a role by assisting local governments to experiment with policy ideas and, more importantly, to translate the development jargon into practical strategies.
6.8 Data limitations and further research agendaThis thesis has opened up several topics for further research on the role of creative and cultural industries in regional development in the context of Indonesia in particular, and developing countries in general. In this thesis, the use of different levels of analysis as well as the combination of quantitative and qualitative research methods have generated complementary knowledge about the position of creative and traditional cultural industries in Indonesia’s regional economies. However, one must recognise that in some areas the analyses have been hampered by the quality of the data. Most of the data used came from the 1996 and 2006 Economic Censuses, the latest datasets available from BPS-Statistics Indonesia.33 These datasets contain information on the characteristics of businesses, including creative and traditional cultural industries, enabling analyses at the regional level (in Chapters 3 and 4). However, there are some concerns regarding these data. First, the detailed information on firm characteristics is not that reliable for regions beyond Java. This is a recognised problem in economic studies involving Indonesia (see for instance, Hill & Vidyattama, 2014). Second, the information is not in the
33 The Economic Census is conducted every ten years. The 2016 census is currently in progress and it is likely to be another one or two years before the data become available.

142
Chapter 6
form of panel data, and so it is not possible to follow the development of individual firms over time (see Chapter 5). Third, the data do not provide detailed information about specific characteristics such as innovativeness, internal social capital and absorptive capacity.
Clearly, adding data from the upcoming 2016 Economic Census would provide a valuable update on the extent to which creative industries have grown in the last decade and whether their contributions to the economy have increased. Further, the identification of other data better able to reflect the ‘creativeness’ or ‘innovativeness’ of firms would be of great value. Here, the labour force survey data (Sakernas) has potential in developing a categorisation of creative industries that is based on individual occupations. However, indications are that the regional scope of the survey is more limited than the Economic Census, and this would complicate regional analyses.
Apart from this data issue, there are several questions that can be elaborated further, particularly with regard to creative industries and traditional cultural industries and their positions in regional economies. First, having carried out a regional analysis of the development patterns of creative industries (Chapter 2), a further refinement through an analysis on the micro-level could clarify some uncertainties. Such a study could look into the locational choices and preferences of creative firms or entrepreneurs within a city. The regional factors that were discussed in this thesis, such as networking opportunities, infrastructure and amenities, the proximity with suppliers and producers plus a range of soft factors, could then be tested on the individual level.
A second important topic is the social side of the regional impacts of creative and traditional cultural industries. Although this thesis has focussed heavily on regional economic development issues, it is clear that the presence of creative communities and business associations, as well as the grassroots movements in institutionalising the creative economy policy in Bandung, reflects social processes and phenomena. Further research could address various issues, such as the social impact of the creative economy policy and the grassroots processes in the development of local creative economies, creative cities or ‘creative kampongs’. The Western literature has critiques of the creative economy that are associated with societal issues, such as social exclusion and conflicts in urban regeneration projects. It would be interesting to see whether implementing the creative economy in Indonesia, and other developing countries, generates similar social dilemmas.
The third, and possibly the most important, research agenda would be to elaborate the potentials and specific characteristics of traditional cultural industries. Research could look into the development trajectories of traditional cultural industries, and the potential to create paths for innovation in these industries. Given that they tend to be located in rural areas, research could investigate their potential contribution to rural development, not only in terms of economic development but also with
143
General discussion and conclusions
6
regard to social issues linked to heritage activities. Traditional cultural firms in rural areas can have strong connections with larger firms in small and medium-sized cities (as shown in Chapter 5) and research could look into regional value chains and their potential role in strengthening urban-rural relationships.
To conclude, this thesis has shown that the development of creative industries in a developing country such as Indonesia has different meanings, patterns and impacts than those in the developed world. Given the rapid growth of creative and traditional cultural industries, one should monitor the progress, and potentially increasing contributions, of both industries to the regional economies. It is equally important to keep a holistic eye on development potentials and challenges in the regions as new ideas and strategies may well arise from the dynamic development processes under way.
ReferencesAndres, L., & Chapain, C. (2013). The Integration of Cultural and Creative Industries into Local and Regional
Development Strategies in Birmingham and Marseille: Towards an Inclusive and Collaborative Governance? Regional Studies, 47, 161–182.
Banks, M., & O’Connor, J. (2009). After the creative industries. International Journal of Cultural Policy, 15, 365–373.
Barca, F., McCann, P., & Rodríguez-Pose, A. (2012). The Case for Regional Development Intervention: Place-based versus Place-neutral Approaches. Journal of Regional Science, 52, 134–152.
Barrowclough, D., & Kozul-Wright, Z. (2008). Voice, choice and diversity through creative industries: towards a new development agenda. In D. Barrowclough & Z. Kozul-Wright (Eds.), Creative Industries and Developing Countries: Voice, Choice, and Economic Growth (pp. 3–36). New York: Routledge.
Boateng, B. (2011). The copyright thing doesn’t work here: Adinkra and Kente cloth and intellectual property in Ghana. Minneapolis: University of Minnesota Press.
Boix-Domenech, R., & Soler-Marco, V. (2015). Creative service industries and regional productivity. Papers in Regional Science, doi:10.1111/pirs.12187.
Darwent, D. F. (1969). Growth poles and growth centers in regional planning -- a review. Environment and Planning A, 1, 5–32.
De Beukelaer, C. (2014). Creative industries in “developing” countries: Questioning country classifications in the UNCTAD creative economy reports. Cultural Trends, 23, 232–251.
Desrochers, P., & Leppälä, S. (2011). Opening up the “Jacobs Spillovers” black box: local diversity, creativity and the processes underlying new combinations. Journal of Economic Geography, 11, 843–863.
Flew, T. (2002). Beyond ad hocery: Defining Creative Industries. Presented at the The Second International Conference on Cultural Policy Research: Cultural Sites, Cultural Theory, Cultural Policy, Wellington, New Zealand.
Flew, T., & Cunningham, S. (2010). Creative Industries after the First Decade of Debate. The Information Society, 26, 113–123.
Hall, P. (2000). Creative Cities and Economic Development. Urban Studies, 37, 639–649.Hartley, J. (Ed.). (2005). Creative industries. Malden, MA: Blackwell Pub.Henderson, V. (2002). Urbanization in Developing Countries. The World Bank Research Observer, 17, 89–112.Hill, H., & Vidyattama, Y. (2014). Hares and tortoises: regional develoment dynamics in Indonesia. In H. Hill (Ed.),
Regional Dynamics in a Decentralized Indonesia (pp. 68–97). Singapore: Institute of Southeast Asian Studies.Iyer, S., Kitson, M., & Toh, B. (2005). Social capital, economic growth and regional development. Regional Studies,
39, 1015–1040.Jacobs, J. (1961). The death and life of great American cities (Vintage Books ed.). New York: Vintage Books.Kong, L., Gibson, C., Khoo, L.-M., & Semple, A.-L. (2006). Knowledges of the creative economy: Towards a
relational geography of diffusion and adaptation in Asia. Asia Pacific Viewpoint, 47, 173–194.

144
Chapter 6
Lazzeretti, L., Boix, R., & Capone, F. (2013). Why Do Creative Industries Cluster? In L. Lazzeretti (Ed.), Creative Industries and Innovation in Europe (pp. 45–64).
O’Connor, J. (2015). Intermediaries and Imaginaries in the Cultural and Creative Industries. Regional Studies, 49, 374–387.
O’Connor, J., & Xin, G. (2006). A new modernity?: The arrival of “creative industries” in China. International Journal of Cultural Studies, 9, 271–283.
Pike, A., Rodríguez-Pose, A., & Tomaney, J. (2006). Local and regional development. Londona nd New York: Routledge.
Potts, J. (2007). Art and innovation: an evolutionary economic view of the creative industry. UNESCO Observatory E-Journal Multi-Disciplinary Research in the Arts, 1, 1–18.
Potts, J., & Cunningham, S. (2008). Four models of the creative industries. International Journal of Cultural Policy, 14, 233–247.
Pratt, A. C. (1997). The cultural industries production system: a case study of employment change in Britain, 1984-91. Environment and Planning A, 29, 1953–1974.
Pratt, A. C. (2008). Innovation and Creativity. In T. Hall, P. Hubbard, & J. R. Short (Eds.), The SAGE Companion to the City (pp. 138–153). Los Angeles: SAGE Publications.
Putnam, R. D., Leonardi, R., & Nanetti, R. Y. (1994). Making democracy work: civic traditions in modern Italy. Princeton: Princeton Univ. Press.
Qian, H., & Acs, Z. J. (2013). An absorptive capacity theory of knowledge spillover entrepreneurship. Small Business Economics, 40, 185–197.
Scherer, F. M. (1989). Innovation and growth: Schumpeterian perspectives. Cambridge, Massachusetts: MIT Press.
Scott, A. J. (1997). The Cultural Economy of Cities. International Journal of Urban and Regional Research, 21, 323–339.
Scott, A. J. (2006). Entrepreneurship, Innovation and Industrial Development: Geography and the Creative Field Revisited. Small Business Economics, 26, 1–24.
Singer, S., Amorós, J. E., & Arreola, D. M. (2015). Global Entrepeneurship Monitor 2014 Global Report. London: Global Entrepreneurship Research Association.
Smith, R., & Warfield, K. (2008). The creative city: a matter of values. In P. Cooke & L. Lazzeretti (Eds.), Creative Cities, Cultural Clusters and Local Economic Development (pp. 287–312). Cheltenham and Northampton: Edward Elgar.
Smit, M. J., Abreu, M. A., & de Groot, H. L. F. (2015). Micro-evidence on the determinants of innovation in the Netherlands: The relative importance of absorptive capacity and agglomeration externalities. Papers in Regional Science, 94, 249–272.
Tomaney, J. (2010). Place-based approaches to regional development: global trends and Australian implications. Sydney: Australian Business Foundation Ltd.
Westlund. (2006). Social Capital in the Knowledge Economy. Berlin and Heidelberg: Springer.Yusuf, S., & Nabeshima, K. (2005). Creative industries in East Asia. Cities, 22, 109–122.


146
SummaryCreative industries and regional economic development in IndonesiaMeanings, patterns and impacts
This research looks into the feasibility of promoting creative industries as an instrument for regional economic development in developing economies in general, and in Indonesia in particular. In a simple way, the creative economy can be defined as ‘how people make money from ideas’, including the production of creative products (that is, creative industries) as well as related transactions and supporting activities (Howkins, 2001). The notion of creative industries is associated with those economic activities which utilise individual creativity, skill and talent, in which intellectual property, originality, copyright and recent technology are important features (e.g., Banks and O’Connor, 2009; Flew, 2013; Flew and Cunningham, 2010; Garnham, 2005; O’Connor, 2012). The creative economy has been built upon specific contexts and phenomena in developed countries, in which it is being used as a strategy to respond to economic restructuring, as well as to stimulate innovation and growth (Gibson and Homan, 2004; Hall, 2000; Pratt, 2008). Today, developing countries also adopt the idea of promoting creative industries as a tool for national and local development. However, the position of these industries in socioeconomic development in a developing economy is still unclear. Regional socioeconomic and institutional settings in the developing economy are clearly different from those in the developed world. Further, economic activities which are based on cultural creativity have existed in these nations, but these are generally craft-intensive (UNESCO and UNDP, 2013). Their products tend to be ‘stagnant’ over time, as heritage values are preserved and highlighted as selling points (Kong et al., 2006). Despite these characteristics, which somewhat contradict the conceptual ideas of the creative economy and creative industries, governments in several countries promote these traditional businesses as creative industries.
The main research question addressed in this thesis is: To what degree do socioeconomic and institutional contexts in a developing country influence the applicability of creative industries as an instrument for regional development? Indonesia is chosen as the basis for the case study, as it is a typical example in which the creative economy is adopted in the context beyond the developed world. The Indonesian government wishes to promote creative industries to drive regional economic growth, also considering the country’s enormous cultural potentials. However, traditional crafts, including batik, are promoted as creative industries, although they tend to preserve traditional values and pay less attention to the creation of knowledge. This actually contradicts the essential idea of the creative economy.

147
Summary
Three different approaches and units of analysis are employed. To begin with, an analysis is conducted to elaborate on the adoption of the creative economy discourse in local development policies (Chapter 2). Second, an empirical analysis is performed at the regional level to identify the development patterns and economic impacts of creative industries (Chapters 3 and 4). Third, an analysis is conducted at the firm level to examine the mechanisms through which creative industries contribute to the regional economy (Chapter 5).
The results of the discourse analysis show that the idea of the creative economy is interpreted and implemented differently in different local settings (Chapter 2). Bandung, one of the first cities to implement the creative economy policy in Indonesia, is the only locality whose interpretation is close to the ‘original’ concept of the creative economy. Meanwhile, other cities, notably Surakarta and Yogyakarta, have re-labelled long-established traditional crafts as creative industries. As such, the ‘creative economy’ in these two cities appears to be a rebranding exercise in pursuance of existing policy strategies, such as delivering subsidies to crafters' associations. Generally speaking, these different interpretations reflect the stakeholders who help transfer and introduce the discourse, the way the discourse is structured (top-down or bottom-up), the local autonomy of local governments to direct their own interpretations and also the place-specific contexts. In Bandung, the creative economy is not only fashioned as a discourse, it is also operationalised through actions. This ‘successful’ experimentation has been assisted by the grassroots movements that helped introduce the discourse and guided the local government stakeholders in adopting their interpretation of the creative economy. Meanwhile, in Surakarta and Yogyakarta, such intermediaries have not been present. These cities also have a strong attachment to traditional culture and, because of this, the local governments tend to be reluctant to promote creative industries that are involved in ‘contemporary’ culture, as this might wipe out the noble values of local traditions. With their local autonomy rights, the local governments are able to choose to promote the existing traditional crafts, seeing these as containing heritage values that should be protected.
The inclusion of traditional craft industries, or ‘traditional cultural industries’, in the classification of creative industries is actually not precise. Traditional cultural industries are clearly different from the conceptual idea of creative industries. The concept of creative industries emphasises several features, such as innovation, copyright and technology. In comparison, traditional cultural industries have different characteristics that do not seem to comply with this concept. Traditional cultural industries might use new technologies to support their production processes, but certain methods or customs are preserved. Further, these industries look to tradition as the main source of ideas in the development of their products. Although new ideas and designs are applied, these industries prioritise the preservation of regional heritage and values that provide unique selling points (Kong et al., 2006; O’Connor and Xin, 2006). This is not to say that handicraft

148
industries are not creative, or any less innovative than creative industries. However, traditional cultural industries utilise a different type of creativity – communal creativity – in which individual creative acts cannot be disentangled from collective values and knowledge in the form of local traditions. This has implications for the nature of their products in that it becomes difficult to assess their originality and award intellectual property rights. Since tradition is a collective good, it is difficult to apply the copyright mechanism generally applied to knowledge-based products – the ‘Western’ copyright regime – to traditional cultural industries (see Boateng, 2011). As such, in the context of Indonesia as well as other developing countries, it seems more logical to differentiate between creative and traditional cultural industries as this better reflects the specificities of the local reality. More importantly, making this distinction would help when it comes to designing policy strategies that are appropriate for local conditions and potentials.
The results of the regional level analysis show that the ‘real’ creative industries are found limitedly in Indonesia. Strong concentrations of these industries are found mainly in fairly advanced urban regions, such as Java and Bali (Chapters 3 and 4). This is not dissimilar to the situation in the developed world, where creative industries are concentrated in metropolitan areas where they benefit from a pool of human capital and a variety of economic activities. Urbanised economies provide opportunities for creative industries to be involved in economic transactions as well as to interact with other economic actors, including the exchange and combination of ideas and knowledge (Lazzeretti et al., 2013; Potts, 2007; Pratt, 2008). Although ‘post-industrial cities’ might not yet be present in developing countries, including Indonesia, some regions, and especially major cities, are far more ‘advanced’ than other regions and potentially provide better conditions for creative industries. Nonetheless, creative industries in Indonesia do not yet constitute a leading sector. They are more likely to be an indicator, rather than a driver, of regional economic development (Chapter 4). It is true that the creative industries are strongly associated with the tertiary sector, with which they may be involved in business transactions and other types of collaborations. However, this does not mean that creative industries take the lead in generating and transmitting new values to the other sectors (Chapter 4) in that creative industries also seem to benefit significantly from ideas and values circulating in the regional economy (Chapter 5). It is also important to note that the economic impacts of creative industries might change in the future. Given their relatively rapid growth, creative industries appear to be an ‘infant sector’ and so may well deliver increasing contributions to the regional economy.
Meanwhile, the results of the micro level analysis show that, despite their relatively small size, creative industries potentially contribute to regional productivity (Chapter 5). Creative industries take advantage of various resources available in the regional environment to develop their businesses, including the opportunities to develop business and social networks. Nevertheless, with these opportunities,

149
Summary
creative industries potentially contribute to regional productivity. As they interact with other firms, and also compete with their fellow firms or rather exchange and combine new ideas with them, these industries can gain new ideas and perspectives in enhancing their business productivity (Chapter 5). Related to this, social culture, values and contexts strongly influence these processes. The environment provides a ‘buzz’ and other opportunities to gather ideas and build networks. Social capital aspects, such as the culture of friendship, also seem influential in these processes positively and negatively. As an illustration, friendship can help firm owners find specialist suppliers and customers, but if such relationships are too strong, they might remove the competitive spirit that helps create innovation. Regional economies provide opportunities to be involved in both supplier-buyer relationships and other types of partnerships. However, as argued in the literature, creative firms need the ability to socialise and invest in building relationships with other actors. Firms also need be able to internalise externalities and the knowledge available in their surroundings, so that they can use these in the development of their businesses (Qian and Acs, 2013; Smit et al., 2015; Westlund, 2006). Based on these conclusions, policy interventions aimed at encouraging creative industries can be designed for both the firm and the region levels. At the firm level, creative industries should be encouraged to develop their own networking capabilities as well as to manage the sustainability of their businesses. At the regional level, policy schemes can be designed to nurture an environment that is conducive for business development and that stimulates serendipitous interactions and collaborations between firms without removing the competition between them. Appropriate strategies for supporting traditional cultural industries would be different from the aforementioned suggestions. It is more a question of whether traditional cultural industries should be somehow transformed into ‘more innovative’ creative industries, or should they continue to focus on heritage values as their selling point. There is a potential for these cultural businesses to apply new ideas to their products without rejecting the ‘noble’ traditional values they represent (Chapter 5). In this respect, traditional cultural industries could be encouraged to improve their capacity and competitiveness by introducing new ideas and technologies, encouraging collaborations, as well as by opening up potential markets that could stimulate the creation of innovative products.
To conclude, this thesis has shown that the development of creative industries in a developing country such as Indonesia has different meanings, patterns and impacts than those in the developed world. Given the rapid growth of creative and traditional cultural industries, one should monitor the progress, and potentially increasing contributions, of both industries to the regional economies. Since other sectors also have important contributions to the regional economies, it is equally important to keep a holistic eye on development potentials and challenges in the regions as new ideas and strategies may well arise from the dynamic development processes under way.

150
ReferencesBanks M and O’Connor J (2009) After the creative industries. International Journal of Cultural Policy, 15(4), 365–
373.Boateng B (2011) The copyright thing doesn’t work here: Adinkra and Kente cloth and intellectual property in
Ghana. Minneapolis: University of Minnesota Press.Flew T (2013) Global Creative Industries. Cambridge and Malden: Polity Press.Flew T and Cunningham S (2010) Creative Industries after the First Decade of Debate. The Information Society,
26(2), 113–123.Garnham N (2005) From cultural to creative industries: An analysis of the implications of the ‘creative industries’
approach to arts and media policy making in the United Kingdom. International Journal of Cultural Policy, 11(1), 15–29.
Gibson C and Homan S (2004) Urban Redevelopment, Live Music and Public Space: Cultural performance and the re‐making of Marrickville. International Journal of Cultural Policy, 10(1), 67–84.
Hall P (2000) Creative Cities and Economic Development. Urban Studies, 37(4), 639–649.Howkins J (2001) The Creative Economy: How People make Money from Ideas. London: Penguin Press.Kong L, Gibson C, Khoo L-M, et al. (2006) Knowledges of the creative economy: Towards a relational geography
of diffusion and adaptation in Asia. Asia Pacific Viewpoint, 47(2), 173–194.Lazzeretti L, Boix R and Capone F (2013) Why Do Creative Industries Cluster? In: Lazzeretti L (ed.), Creative
Industries and Innovation in Europe, pp. 45–64.O’Connor J (2012) Surrender to the Void: Life after Creative Industries. Cultural Studies Review, 18(3), 388–410.O’Connor J and Xin G (2006) A new modernity?: The arrival of ‘creative industries’ in China. International Journal
of Cultural Studies, 9(3), 271–283.Potts J (2007) Art and innovation: an evolutionary economic view of the creative industry. UNESCO Observatory
E-Journal Multi-Disciplinary Research in the Arts, 1(1), 1–18.Pratt AC (2008) Innovation and Creativity. In: Hall T, Hubbard P, and Short JR (eds), The SAGE Companion to the
City, Los Angeles: SAGE Publications, pp. 138–153.Qian H and Acs ZJ (2013) An absorptive capacity theory of knowledge spillover entrepreneurship. Small Business
Economics, 40(2), 185–197.Smit MJ, Abreu MA and de Groot HLF (2015) Micro-evidence on the determinants of innovation in the Netherlands:
The relative importance of absorptive capacity and agglomeration externalities. Papers in Regional Science, 94(2), 249–272.
UNESCO and UNDP (2013) Creative Economy Report 2013: Special Edition: Widening Local Development Pathways. New York and Paris: UNESCO and UNDP.
Westlund (2006) Social Capital in the Knowledge Economy. Berlin and Heidelberg: Springer.
151
Samenvatting in het Nederlands
Samenvatting in het NederlandsCreatieve industrie en regionale economische ontwikkeling in IndonesiëInterpretaties, patronen en gevolgen
Dit proefschrift onderzoekt de haalbaarheid van het bevorderen van creatieve industrie als instrument voor regionale economische ontwikkeling in opkomende economieën in het algemeen, en in Indonesië in het bijzonder. Kort gezegd omvat de creatieve economie alle activiteiten waarbij geld wordt verdiend met ideeën: de productie van creatieve producten (de eigenlijke creatieve industrie), gerelateerde transacties en ondersteunende activiteiten (Howkins, 2001). Het begrip ‘creatieve industrie’ heeft betrekking op alle economische activiteiten waarin individuele creativiteit, vakmanschap en talent benut worden en waarin intellectueel eigendom, originaliteit, auteursrecht en nieuwe technologieën een belangrijke rol spelen (zie bijv. Banks & O’Connor, 2009; Flew, 2013; Flew & Cunningham, 2010; Garnham, 2005; O’Connor, 2012). In gevestigde economieën heeft de creatieve economie zich binnen een specifiek kader ontwikkeld: creatieve industrie wordt in deze landen gezien als een mogelijkheid om in te spelen op veranderingen in de economie en als een manier om groei en innovatie te stimuleren (Gibson & Homan, 2004; Hall, 2000; Pratt, 2008). Hoewel in opkomende economieën creatieve industrie steeds vaker wordt ingezet als een instrument voor nationale en regionale economische ontwikkeling, is het nog onduidelijk welke rol sociaaleconomische omstandigheden in deze landen spelen bij de ontwikkeling van creatieve industrie. De regionale sociaaleconomische en institutionele omstandigheden in deze landen verschillen sterk met die in gevestigde economieën. Daarnaast zijn de creatieve economische activiteiten in opkomende economieën vaak sterk gericht op traditionele ambachten (UNESCO en UNDP, 2013). De producten van deze ambachten veranderen door de tijd heen slechts weinig, omdat het belang als cultureel waardevol erfgoed wordt benadrukt (Kong et al., 2006). Hoewel bovenstaande kenmerken niet volledig aansluiten bij gangbare definities van creatieve economie en creatieve industrie, wordt desondanks in verschillende opkomende economieën dit soort traditionele bedrijvigheid geschaard onder de creatieve economie.
De vraag die centraal staat in dit proefschrift luidt: In hoeverre beïnvloedt de sociaaleconomische en institutionele context in een opkomende economie de mogelijkheden om creatieve industrie in te zetten als instrument voor regionale ontwikkeling? In het proefschrift fungeert Indonesië als case study voor de inzetbaarheid van creatieve industrie in een niet-Westerse context. De overheid ziet creatieve industrie als mogelijke motor van regionale economische groei, ook gezien het enorme culturele potentieel van het land. Aan de andere kant worden traditionele ambachten, zoals batik, ook geschaard onder de creatieve industrie,

152
ondanks dat deze voornamelijk gericht zijn op het behoud van culturele waarden en slechts weinig bijdragen aan kenniscreatie.
De hoofdvraag wordt via verschillende benaderingen en op verschillende niveaus onderzocht. Ten eerste wordt in hoofdstuk 2 beschreven hoe in lokaal ontwikkelingsbeleid het discours omtrent creatieve industrie wordt toegepast. Daarna worden in hoofdstukken 3 en 4 op regionaal niveau de ontwikkelingspatronen en economische impact van creatieve industrie onderzocht. Tenslotte wordt in hoofdstuk 5 op bedrijfsniveau bestudeerd via welke mechanismen creatieve industrie bijdraagt aan de regionale economie.
De resultaten van de discoursanalyse (hoofdstuk 2) laten zien dat de implementatie van beleid omtrent de creatieve economie afhankelijk is van de lokale context. Bandung, een van de eerste steden waar beleid omtrent de implementatie van de creatieve economie is ontwikkeld, is de enige plaats waar de interpretatie van creatieve economie dichtbij het ‘originele’ concept blijft. In andere steden, zoals Surakarta en Yogyakarta, zijn reeds lang bestaande traditionele ambachten ook onder creatieve industrie geschaard. Het beleid in deze steden lijkt er eerder op gericht om bestaande beleidsstrategieën, zoals het subsidiëren van verenigingen van ambachtslieden, te versterken. In de uiteenlopende interpretaties herkent men de stakeholders die het discours helpen introduceren en implementeren, de manier waarop het discours wordt vormgegeven (top-down dan wel bottom-up), de autonomie van lokale overheden om eigen interpretaties te hanteren en de verschillende plaats-specifieke contexten. In Bandung blijft de ‘creatieve economie’ niet slechts een leeg begrip, maar wordt ondernemerschap in de creatieve industrie ook daadwerkelijk door gerichte acties bevorderd. Deze ‘succesvolle’ operationalisering is te danken aan bottom-up bewegingen die het discours rondom de creatieve economie mede hebben geïntroduceerd en lokale overheden hebben weten te beïnvloeden bij de interpretatie en implementatie. In Surakarta en Yogyakarta waren dergelijke actoren niet aanwezig. De lokale overheid in deze steden is daarnaast sterker gericht op het behouden van traditionele cultuur. Dientengevolge zijn lokale overheden minder geneigd beleid te ontwikkelen ten behoeve van creatieve industrie die gericht is op ‘moderne’ cultuur, omdat zij deze zien als een bedreiging voor het voortbestaan van ‘nobele’ lokale waarden en tradities. De hoge mate van autonomie die deze overheden genieten stelt hen in staat om beleid te ontwikkelen ten faveure van bestaande traditionele ambachten.
Traditionele culturele industrie, zoals ambachten, verschilt in een aantal opzichten sterk van creatieve industrie, waardoor het onjuist is om deze onder dezelfde noemer te scharen. Waar bij creatieve industrie innovatie, auteursrecht en technologie een grote rol spelen, heeft traditionele culturele industrie eigenschappen die niet bij het concept passen. Hoewel bij traditionele culturele industrie in het productieproces ook gebruik kan worden gemaakt van moderne technologie, blijven bepaalde methoden en gebruiken bewaard. Daarnaast wordt met name teruggegrepen op

153
Samenvatting in het Nederlands
traditie als inspiratiebron voor productontwikkeling. Hoewel nieuwe ideeën en ontwerpen worden toegepast, ligt de focus op het behoud van regionaal erfgoed en lokale onderscheidende kenmerken (Kong et al., 2006; O’Connor & Xin, 2006). Dit betekent niet dat handwerkindustrie niet net zo creatief of innovatief kan zijn als creatieve industrie. Echter, creativiteit heeft in traditionele creatieve industrie een ander, meer gemeenschappelijk karakter. Individuele creativiteit is bij dit type industrie onlosmakelijk verbonden met lokale, gemeenschappelijke waarden, kennis en tradities. Hierdoor is het lastig om originaliteit en intellectuele eigendomsrechten, kernbegrippen voor creatieve industrie, te bepalen en toe te kennen. Het ‘standaard’, Westerse, model van auteursrecht dat normaliter wordt gebruikt voor kennisgoederen is niet direct toepasbaar op producten uit de traditionele culturele industrie, omdat traditie een collectief goed is (Boateng, 2011). Een scherp onderscheid tussen creatieve en traditionele culturele industrie past derhalve beter bij de specifieke lokale context in Indonesië en andere opkomende economieën. Daarnaast, en belangrijker, zal een scherp onderscheid ook van groot nut zijn bij beleidsontwerp dat rekening houdt met lokale omstandigheden en mogelijkheden.
De analyses op regionaal niveau laten zien dat ‘echte’ creatieve industrie in Indonesië zeldzaam is. Concentraties van deze industrie zijn vooral in de progressieve grote steden zoals Java en Bali te vinden (hoofdstuk 3 en 4). Ook in gevestigde economieën vindt men creatieve industrie overigens voornamelijk in grootstedelijke regio’s, waar zij profiteren kan van de hoge concentratie menselijk kapitaal en de verscheidenheid aan economische activiteiten. Verstedelijkte economieën bieden ondernemers in de creatieve industrie de mogelijkheid tot transacties en interactie met andere actoren, zoals de uitwisseling en combinatie van ideeën en kennis (Lazzeretti et al., 2013; Potts, 2007; Pratt, 2008). Post-industriële steden bestaan in opkomende economieën, waaronder Indonesië, nog niet, maar sommige regio’s - in het bijzonder de grootste steden - zijn veel verder ‘ontwikkeld’ dan andere regio’s en bieden betere omstandigheden voor creatieve industrie. Desalniettemin is de creatieve industrie nog geen leidende sector in de Indonesische economie. In die zin is de aanwezigheid van creatieve industrie veeleer een indicator dan een aanjager van regionale economische ontwikkeling (hoofdstuk 4). Hoewel er sterke banden bestaan met de tertiaire sector, bijvoorbeeld in de vorm van transacties en andere vormen van samenwerking, heeft de creatieve industrie geen leidende rol in het ontwikkelen en verspreiden van nieuwe waarden en ideeën naar andere sectoren (hoofdstuk 4); eerder lijkt zij ook voordelen te ondervinden van waarden en ideeën die in andere sectoren in de lokale economie circuleren (hoofdstuk 5). Daarnaast moet opgemerkt worden dat de economische impact van creatieve industrie in de toekomst kan veranderen. De creatieve industrie groeit nog altijd relatief snel en kan gekenmerkt worden als een jonge groeisector; haar bijdrage aan de lokale economie zou derhalve nog sterk kunnen groeien.

154
Hoewel creatieve industrie in Indonesië dus nog een betrekkelijk kleine rol speelt in de regionale economie, laten de resultaten van de analyse op micro-niveau zien dat zij in potentie kan bijdragen aan regionale productiviteit. Ondernemers in de creatieve industrie maken bij het ontwikkelen van hun bedrijven gebruik van verschillende lokaal beschikbare productiebronnen, zoals sociale en professionele netwerken. Door van deze mogelijkheden gebruik te maken, draagt creatieve industrie vervolgens ook weer bij aan de groei van de regionale economie. Door de interactie met andere bedrijven, inclusief directe concurrenten, worden ideeën uitgewisseld en ontstaan nieuwe ideeën die tot een hogere productiviteit leiden (hoofdstuk 5). Dit proces kan worden versterkt onder invloed van lokale sociale interacties, waarden en context. Wanneer in de lokale omgeving een ‘buzz’ of andere mogelijkheden om ideeën te krijgen en netwerken te creëren ontstaan, leidt dit tot versterking van de creatieve industrie. In deze context is het ook belangrijk stil te staan bij de dubbele uitwerking die vriendschappen kunnen hebben op deze processen, omdat deze zowel positief als negatief kan zijn. Zo kunnen vriendschappelijke banden voor creatieve ondernemers van nut zijn bij het vinden van leveranciers en klanten. Aan de andere kant kunnen vriendschappelijke banden de competitiedrang verminderen, waardoor er minder innovaties plaatsvinden. Regionale economieën bieden mogelijkheden voor het ontstaan van leverancier-afnemer relaties en andere partnerschapsvormen, maar creatieve industrie vereist ook mogelijkheden tot vriendschappelijke omgang en diepere relaties met andere actoren in de omgeving. Daarnaast vergt creatieve industrie de mogelijkheid om externe effecten en lokale kennis te internaliseren en in de eigen onderneming toe te passen (Qian & Acs, 2013; Smit et al., 2015; Westlund, 2006). Derhalve kunnen beleidsinterventies gericht op het stimuleren van creatieve industrie op zowel bedrijfs- als regionaal niveau ontwikkeld worden. Op bedrijfsniveau zouden ondernemers in de creatieve industrie aangemoedigd moeten worden eigen netwerken te creëren om zo de bestendigheid van hun bedrijven te versterken. Op regionale schaal zou beleid ontwikkeld kunnen worden dat een lokaal milieu nastreeft dat bevorderlijk is voor de groei van bedrijven, spontane interactie stimuleert en samenwerking tussen bedrijven faciliteert, zonder in te boeten aan gezonde competitiedrang. Beleidsstrategieën die gericht zijn op het ondersteunen van traditionele culturele industrie zouden een geheel andere focus hebben. De vraag is veeleer of traditionele culturele industrie op een of andere wijze getransformeerd zou moeten worden naar de meer ‘innovatieve’ creatieve industrie, of dat de focus op culturele erfgoedwaarden als onderscheidend kenmerk zou moeten blijven. In dit proefschrift blijkt dat er zeker mogelijkheden zijn om nieuwe ideeën toe te passen, zonder de ‘nobele’ traditionele waarden waar deze bedrijven voor staan volledig af te zweren (hoofdstuk 5). Bedrijven in de traditionele culturele industrie zouden aangemoedigd kunnen worden hun ondernemerschap en concurrentiekracht te versterken door nieuwe ideeën en technologieën toe te passen, samenwerking te
155
Samenvatting in het Nederlands
stimuleren en mogelijke afzetmarkten aan te boren teneinde de ontwikkeling van innovatieve producten mogelijk te maken.
Dit proefschrift heeft laten zien dat creatieve industrie in ontwikkelingslanden zoals Indonesië anders wordt geïnterpreteerd en andere patronen en gevolgen heeft dan in de gevestigde economieën. Gezien de snelle groei van creatieve en traditionele culturele industrie is het van belang om de ontwikkeling in en bijdrage aan de regionale economie van beide typen industrie op de voet te volgen. Andere sectoren dragen op andere wijze bij aan de regionale economie en het is dan ook zaak om ontwikkelingen en uitdagingen over de gehele breedte in het oog te houden; in een dynamische economie kunnen nieuwe ideeën en strategieën zich altijd en overal voordoen.
ReferentiesBanks M en O’Connor J (2009) After the creative industries. International Journal of Cultural Policy, 15(4), 365–
373.Boateng B (2011) The copyright thing doesn’t work here: Adinkra and Kente cloth and intellectual property in
Ghana. Minneapolis: University of Minnesota Press.Flew T (2013) Global Creative Industries. Cambridge and Malden: Polity Press.Flew T and Cunningham S (2010) Creative Industries after the First Decade of Debate. The Information Society,
26(2), 113–123.Garnham N (2005) From cultural to creative industries: An analysis of the implications of the ‘creative industries’
approach to arts and media policy making in the United Kingdom. International Journal of Cultural Policy, 11(1), 15–29.
Gibson C en Homan S (2004) Urban Redevelopment, Live Music and Public Space: Cultural performance and the re‐making of Marrickville. International Journal of Cultural Policy, 10(1), 67–84.
Hall P (2000) Creative Cities and Economic Development. Urban Studies, 37(4), 639–649.Howkins J (2001) The Creative Economy: How People make Money from Ideas. London: Penguin Press.Kong L, Gibson C, Khoo L-M, et al. (2006) Knowledges of the creative economy: Towards a relational geography
of diffusion and adaptation in Asia. Asia Pacific Viewpoint, 47(2), 173–194.Lazzeretti L, Boix R en Capone F (2013) Why Do Creative Industries Cluster? In: Lazzeretti L (ed.), Creative
Industries and Innovation in Europe, pp. 45–64.O’Connor J (2012) Surrender to the Void: Life after Creative Industries. Cultural Studies Review, 18(3), 388–410.O’Connor J and Xin G (2006) A new modernity?: The arrival of ‘creative industries’ in China. International Journal
of Cultural Studies, 9(3), 271–283.Potts J (2007) Art and innovation: an evolutionary economic view of the creative industry. UNESCO Observatory
E-Journal Multi-Disciplinary Research in the Arts, 1(1), 1–18.Pratt AC (2008) Innovation and Creativity. In: Hall T, Hubbard P, and Short JR (eds), The SAGE Companion to the
City, Los Angeles: SAGE Publications, pp. 138–153.Qian H en Acs ZJ (2013) An absorptive capacity theory of knowledge spillover entrepreneurship. Small Business
Economics, 40(2), 185–197.Smit MJ, Abreu MA en de Groot HLF (2015) Micro-evidence on the determinants of innovation in the Netherlands:
The relative importance of absorptive capacity and agglomeration externalities. Papers in Regional Science, 94(2), 249–272.
UNESCO en UNDP (2013) Creative Economy Report 2013: Special Edition: Widening Local Development Pathways. New York and Paris: UNESCO en UNDP.
Westlund (2006) Social Capital in the Knowledge Economy. Berlin en Heidelberg: Springer.

156
Ringkasan dalam Bahasa IndonesiaIndustri Kreatif dan Pengembangan Ekonomi Wilayah di IndonesiaMakna, Pola dan Dampak
Studi ini bertujuan untuk mengidentifikasi sejauh mana gagasan mendorong industri kreatif dapat digunakan sebagai instrumen pengembangan ekonomi wilayah di negara-negara berkembang pada umumnya, dan Indonesia pada khususnya. Secara sederhana, ekonomi kreatif dapat didefinisikan sebagai “bagaimana orang menghasilkan uang dengan ide”, mencakup produksi barang-barang kreatif (atau industri kreatif) dan juga kegiatan transaksi terkait dan pendukung lainnya (Howkins, 2001). Istilah industri kreatif dapat diasosiasikan dengan kegiatan ekonomi yang menggunakan kreativitas individu, keterampilan dan bakat, dan yang aspek utamanya mencakup hak kekayaan intelektual, orisinalitas, hak cipta dan teknologi baru (misalnya, Banks & O’Connor, 2009; Flew, 2013; Flew & Cunningham, 2010; Garnham, 2005; O’Connor, 2012). Ekonomi kreatif pada dasarnya dibangun atas konteks dan fenomena spesifik yang ditemukan di negara-negara maju, yang menggunakan ekonomi kreatif sebagai strategi untuk menghadapi restrukturisasi ekonomi dan juga untuk mendorong inovasi dan pertumbuhan (Gibson dan Homan, 2004; Hall, 2000; Pratt, 2008). Pada saat ini, negara-negara berkembang mulai mengadopsi gagasan pengembangan industri kreatif sebagai alat pembangunan nasional dan daerah. Akan tetapi, posisi industri kreatif dalam pembangunan sosial-ekonomi pada konteks negara berkembang masih belum teridentifikasi secara jelas. Situasi sosial, ekonomi dan kelembagaan pada negara berkembang jelas berbeda dengan negara maju. Selain itu, kegiatan ekonomi berbasis kreativitas budaya sudah ditemukan sejak lama, tetapi kegiatan ini pada umumnya identik dengan kerajinan tangan (UNESCO dan UNDP, 2013). Barang-barang hasil kegiatan ekonomi ini juga cenderung tidak berubah dari waktu ke waktu karena nilai-nilai warisan leluhur dilindungi dan ditonjolkan sebagai nilai jual (Kong et al., 2006). Terlepas dari karakteristik tersebut, yang juga cenderung berlainan dengan hakikat ekonomi kreatif dan industri kreatif, pemerintah di berbagai negara berupaya untuk mempromosikan usaha tradisional ini sebagai industri kreatif.
Pertanyaan utama dalam penelitian ini adalah: Sejauh mana konteks sosial-ekonomi dan kelembagaan di suatu negara berkembang mempengaruhi kemungkinan diaplikasikannya industri kreatif sebagai instrumen pengembangan wilayah? Indonesia dipilih sebagai basis dalam studi kasus karena negara ini merupakan contoh yang baik dan khas di mana ekonomi kreatif diadopsi dan diaplikasikan di luar konteks negara-negara maju. Pemerintah di Indonesia bermaksud untuk mempromosikan industri kreatif dengan harapan industri ini dapat mendorong pertumbuhan ekonomi wilayah, selain mempertimbangkan potensi budaya

157
Ringkasan dalam Bahasa Indonesia
yang besar dan tersebar di daerah-daerah. Namun demikian, kerajinan tangan tradisional, termasuk batik, dikategorikan sebagai industri kreatif, walaupun usaha ini lebih mementingkan nilai-nilai tradisi dan cenderung kurang memperhatikan penciptaan nilai-nilai baru. Hal ini jelas berlainan dengan hakikat ekonomi kreatif itu sendiri.
Tiga pendekatan dan unit analisis digunakan dalam penelitian ini. Sebagai permulaan, analisis dilakukan untuk mengelaborasi proses adopsi gagasan ekonomi kreatif pada kebijakan pengembangan daerah (Bab 2). Kedua, analisis empiris dilakukan pada tingkat daerah untuk mengidentifikasi pola perkembangan dan dampak ekonomi kreatif (Bab 3 dan 4). Ketiga, analisis dilakukan pada tingkat perusahaan untuk mengamati mekanisme bagaimana industri kreatif berperan terhadap perekonomian wilayah (Bab 5).
Analisis diskursus menunjukkan bahwa gagasan ekonomi kreatif diinterpretasikan dan diimplementasikan secara berbeda mengikuti konteks daerahnya (Bab 2). Bandung, salah satu kota pertama yang mengimplementasikan kebijakan ekonomi kreatif di Indonesia, ialah satu-satunya daerah yang interpretasinya paling dekat dengan konsep “asli” ekonomi kreatif. Sementara itu, kota-kota lain, yaitu Surakarta dan Yogyakarta, merujuk kerajinan tangan tradisional sebagai industri kreatif. Ekonomi kreatif di kedua kota ini tampak sebagai pencitraan kembali (rebranding) strategi kebijakan yang sebenarnya sudah ada, seperti pemberian subsidi untuk paguyuban pengrajin. Pada prinsipnya, perbedaan interpretasi ini disebabkan oleh (a) aktor yang berperan dalam mentransfer dan memperkenalkan ide ekonomi kreatif, (b) metode strukturisasi wacana (dari atas ke bawah atau dari bawah ke atas), (c) otonomi pemerintah daerah dalam menentukan interpretasi mereka, dan (d) konteks spesifik daerah. Pada kasus Bandung, ekonomi kreatif tidak hanya digunakan dalam pembangunan wacana, tetapi juga dioperasionalisasikan melalui tindakan. Eksperimentasi ini ‘berhasil’ di antaranya dibantu oleh gerakan akar rumput yang memperkenalkan ide ekonomi kreatif dan membantu pihak pemerintah daerah dalam mengadopsi interpretasi mereka mengenai ekonomi kreatif. Sementara itu, tidak ada aktor perantara yang membantu adopsi ekonomi kreatif di Surakarta dan Yogyakarta. Kedua kota ini juga memiliki keterikatan yang kuat terhadap budaya tradisional, dan karena hal ini, pemerintah daerah di kedua kota tersebut berkeberatan jika harus mempromosikan budaya "kontemporer" yang mungkin akan menggugurkan nilai luhur tradisi. Dengan otonomi yang dimilikinya, pemerintah daerah memiliki kewenangan untuk mempromosikan kerajinan tangan tradisional yang telah lama ada, mempertimbangkan nilai warisan budaya terkandung yang harus dilindungi.
Diintegrasikannya kerajinan tangan, atau "industri budaya tradisional", dalam klasifikasi industri kreatif sebenarnya tidak tepat. Industri budaya tradisional jelas berbeda dengan konsep industri kreatif. Industri kreatif menekankan beberapa aspek, di antara inovasi, hak cipta dan teknologi. Sementara itu, industri budaya

158
tradisional mungkin menggunakan teknologi baru yang mendukung proses produksinya, tetapi metode atau kebiasaan tertentu sangat mungkin dipertahankan. Selain itu, industri budaya tradisional melihat tradisi sebagai sumber utama ide dalam pengembangan produknya. Meskipun ide dan desain baru diaplikasikan, industri budaya tradisional cenderung mengutamakan preservasi nilai dan warisan budaya daerah yang memberikan nilai jual yang unik (Kong dkk., 2006; O’Connor & Xin, 2006). Hal ini tidak berarti kerajinan tangan tidak kreatif, atau kurang inovatif dibandingkan industri kreatif. Namun demikian, industri budaya tradisional menggunakan jenis kreativitas yang berbeda, yakni kreativitas bersama (komunal), di mana tindakan kreativitas individu sulit dipisahkan dari nilai-nilai dan pengetahuan kolektif, utamanya dalam bentuk tradisi. Hal ini berimplikasi terhadap sifat produknya, yakni menjadi lebih sulit untuk menilai orisinalitas dan kekayaan intelektualnya. Karena tradisi adalah barang kolektif, cenderung sulit untuk mengaplikasikan mekanisme hak cipta yang biasanya diterapkan pada produk berbasis pengetahuan – rezim hak cipta “Barat” – pada industri budaya tradisional (lihat Boateng, 2011). Dengan demikian, untuk konteks Indonesia dan negara-negara berkembang lainnya, sebaiknya industri kreatif dan industri budaya tradisional dipisahkan terutama ketika menyusun pengembangan kebijakan terkait, sedemikian rupa sehingga strategi dapat dirancang sesuai dengan kondisi dan potensi daerah.
Hasil analisis kewilayahan menunjukkan bahwa industri kreatif yang "sesungguhnya" ditemukan, namun terbatas, di Indonesia. Konsentrasi industri kreatif ditemukan utamanya di wilayah-wilayah yang cukup maju, seperti Jawa dan Bali (Bab 3 dan 4). Ini tidak berbeda dengan situasi di negara-negara maju di mana industri kreatif berkumpul di kawasan metropolitan di mana mereka mendapatkan keuntungan dari berkumpulnya modal manusia dan keberagaman aktivitas ekonomi. Ekonomi perkotaan menyediakan kesempatan kepada industri kreatif untuk terlibat dalam transaksi ekonomi dan juga untuk berinteraksi dengan aktor-aktor ekonomi, termasuk pertukaran dan kombinasi gagasan dan pengetahuan (Lazzeretti dkk., 2013; Potts, 2007; Pratt, 2008). Walaupun kota-kota “pasca-industrialis” belum ada pada konteks negara-negara berkembang, termasuk Indonesia, beberapa wilayah, terutama kota-kota besar, nyatanya jauh lebih “maju” dibandingkan wilayah lainnya dan dengan demikian berpotensi menyediakan kondisi yang lebih baik untuk perkembangan industri kreatif. Hanya saja, industri kreatif belum menjadi sektor yang besar di Indonesia. Industri kreatif lebih berpotensi menjadi indikator, daripada menjadi pendorong, pengembangan ekonomi wilayah (Bab 4). Industri kreatif memang memiliki hubungan positif dengan sektor tersier, yang merupakan mitra dalam transaksi bisnis atau hal lainnya. Akan tetapi, hal ini tidak berarti bahwa industri kreatif berada di garda terdepan dalam menciptakan dan menyebarkan nilai-nilai baru kepada sektor-sektor lainnya (Bab 4). Dengan kata lain, industri kreatif mungkin juga diuntungkan dengan gagasan dan nilai-nilai yang sudah tersirkulasi di wilayah tersebut (Bab 5). Penting juga untuk ditekankan bahwa

159
Ringkasan dalam Bahasa Indonesia
dampak ekonomi industri kreatif, seperti disebutkan sebelumnya, sangat mungkin untuk berubah pada masa yang akan datang. Mengingat pertumbuhannya yang relatif cepat, industri kreatif tampak sebagai ‘sektor dalam masa pertumbuhan’ yang akan memberikan kontribusi meningkat dari waktu ke waktu terhadap perekonomian wilayah.
Sementara itu, hasil analisis pada tingkat mikro menunjukkan bahwa industri kreatif, walaupun proporsinya relatif kecil, berpotensi untuk berkontribusi terhadap produktivitas wilayah (Bab 5). Industri kreatif mengambil keuntungan dari berbagai sumber daya yang tersedia di lingkungan sekitarnya, termasuk kesempatan untuk membangun jejaring bisnis dan sosial. Selain diuntungkan dengan kondisi ini, industri kreatif juga berpotensi untuk meningkatkan produktivitas wilayah. Dengan berinteraksi dengan berbagai perusahaan, bersaing atau mungkin juga bertukar dan menggabungkan ide-ide baru dengan mereka, industri kreatif berpotensi untuk mendapatkan ide dan perspektif baru dalam meningkatkan produktivitas bisnisnya (Bab 5). Terkait hal ini, budaya, nilai dan konteks sosial mempengaruhi secara kuat proses tersebut. Lingkungan memberikan suatu “gaung” (buzz) dan kesempatan untuk mengumpulkan gagasan dan membangun jejaring. Aspek-aspek modal sosial, seperti budaya pertemanan, juga berpengaruh terhadap proses ini baik secara positif maupun negatif. Sebagai ilustrasi, pertemanan dapat membantu pemilik perusahaan untuk menemukan penyedia bahan baku dan pelanggan, tetapi jika hubungan pertemanan ini terlalu kuat sangat mungkin hal ini malah melunturkan semangat kompetitif yang penting untuk menghasilkan inovasi. Perekonomian wilayah memang menyediakan pelbagai kesempatan untuk terlibat dalam hubungan penjual-pembeli dan kemitraan lainnya. Akan tetapi, seperti yang dibahas dalam literatur, industri kreatif perlu memiliki kemampuan untuk bersosialisasi dan menanam investasi dalam membangun hubungan dengan pihak lain. Perusahaan juga harus mampu untuk menginternalisasi eksternalitas dan pengetahuan yang tersedia di sekitarnya, sehingga hal ini dapat bermanfaat dalam pengembangan bisnisnya (Qian & Acs, 2013; Smit dkk., 2015; Westlund, 2006). Berdasarkan kesimpulan ini, intervensi kebijakan yang dimaksudkan untuk mendorong industri kreatif dapat dirancang baik pada tingkat perusahaan maupun wilayah. Pada taraf perusahaan, industri kreatif harus didorong untuk membangun kemampuan berjejaring dan juga untuk mengelola keberlanjutan usahanya. Pada tingkat wilayah, skema kebijakan dapat dirancang untuk memelihara lingkungan yang kondusif untuk pengembangan usaha dan juga menstimulasi interaksi spontan dan kolaborasi antarperusahaan tanpa harus mengikis persaingan di antara mereka. Strategi yang sesuai untuk mendukung industri budaya tradisional akan berbeda dengan hal-hal yang disebutkan sebelumnya. Strategi pengembangan untuk industri budaya tradisional lebih merupakan pertanyaan terkait apakah perlu industri ini diubah menjadi industri kreatif “yang lebih inovatif ”, atau haruskah mereka berlanjut dengan upayanya untuk menekankan warisan budaya sebagai nilai jual. Sebenarnya industri budaya tradisional memiliki potensi untuk

160
mengaplikasikan nilai-nilai baru dalam produknya tanpa harus menafikan nilai ‘luhur’ budaya (Bab 5). Dalam hal ini, industri budaya tradisional dapat didorong untuk meningkatkan kapasitas dan daya saingnya dengan memperkenalkan ide-ide baru dan teknologi, mendorong kemitraan dan juga membuka pasar baru yang menstimulasi penciptaan produk yang inovatif.
Sebagai kesimpulan, disertasi ini menunjukkan bahwa perkembangan industri kreatif di negara berkembang seperti Indonesia memiliki makna, pola dan dampak yang berbeda dibandingkan negara-negara maju. Mengingat pertumbuhan yang cepat, baik pada industri kreatif maupun industri budaya tradisional, kita harus memperhatikan perkembangan dan kontribusi ekonominya yang berpotensi meningkat pada masa yang akan datang. Namun demikian, karena sektor-sektor lain juga memberikan kontribusi yang penting terhadap perekonomian wilayah, sama pentingnya juga untuk memperhatikan potensi dan tantangan pembangunan wilayah secara utuh maupun gagasan dan strategi yang mungkin muncul dari proses pembangunan yang berlangsung dinamis.
ReferensiBanks M dan O’Connor J (2009) After the creative industries. International Journal of Cultural Policy, 15(4), 365–
373.Boateng B (2011) The copyright thing doesn’t work here: Adinkra and Kente cloth and intellectual property in
Ghana. Minneapolis: University of Minnesota Press.Flew T (2013) Global Creative Industries. Cambridge and Malden: Polity Press.Flew T dan Cunningham S (2010) Creative Industries after the First Decade of Debate. The Information Society,
26(2), 113–123.Garnham N (2005) From cultural to creative industries: An analysis of the implications of the ‘creative industries’
approach to arts and media policy making in the United Kingdom. International Journal of Cultural Policy, 11(1), 15–29.
Gibson C dan Homan S (2004) Urban Redevelopment, Live Music and Public Space: Cultural performance and the re‐making of Marrickville. International Journal of Cultural Policy, 10(1), 67–84.
Hall P (2000) Creative Cities and Economic Development. Urban Studies, 37(4), 639–649.Howkins J (2001) The Creative Economy: How People make Money from Ideas. London: Penguin Press.Kong L, Gibson C, Khoo L-M, et al. (2006) Knowledges of the creative economy: Towards a relational geography
of diffusion and adaptation in Asia. Asia Pacific Viewpoint, 47(2), 173–194.Lazzeretti L, Boix R dan Capone F (2013) Why Do Creative Industries Cluster? In: Lazzeretti L (ed.), Creative
Industries and Innovation in Europe, pp. 45–64.O’Connor J (2012) Surrender to the Void: Life after Creative Industries. Cultural Studies Review, 18(3), 388–410.O’Connor J and Xin G (2006) A new modernity?: The arrival of ‘creative industries’ in China. International Journal
of Cultural Studies, 9(3), 271–283.Potts J (2007) Art and innovation: an evolutionary economic view of the creative industry. UNESCO Observatory
E-Journal Multi-Disciplinary Research in the Arts, 1(1), 1–18.Pratt AC (2008) Innovation and Creativity. Dalam: Hall T, Hubbard P, and Short JR (eds), The SAGE Companion
to the City, Los Angeles: SAGE Publications, pp. 138–153.Qian H dan Acs ZJ (2013) An absorptive capacity theory of knowledge spillover entrepreneurship. Small Business
Economics, 40(2), 185–197.Smit MJ, Abreu MA dan de Groot HLF (2015) Micro-evidence on the determinants of innovation in the Netherlands:
The relative importance of absorptive capacity and agglomeration externalities. Papers in Regional Science, 94(2), 249–272.
UNESCO dan UNDP (2013) Creative Economy Report 2013: Special Edition: Widening Local Development Pathways. New York and Paris: UNESCO dan UNDP.
Westlund (2006) Social Capital in the Knowledge Economy. Berlin dan Heidelberg: Springer.

161
Related publications not included in this thesis
Related publications not included in this thesis
1. Fahmi FZ. (2014) Promoting the Creative Economy. The Jakarta Post, 8 July. Available at: http://www.thejakartapost.com/news/2014/07/08/promoting-creative-economy.html
2. Fahmi FZ, McCann P, Koster S. (2016) Creative economy policies in developing countries: The case of Indonesia (blog post). Urban Studies Journal, http://urbanstudiesjnl.blogspot.com/2016/02/creative-economy-policy-in-developing.html
3. Fahmi FZ. (2016) The location of creative industries in a developing countriy (excerpt in Bahasa Indonesia). Jurnal Kawasan No. 27, pp. 28-29. Directorate for Lagging, Transmigration and Rural Regions, Ministry of National Development Planning/National Development Planning Board (Bappenas).
4. Fahmi FZ & Koster S, based on materials in this thesis, contribute to the writing of Creative Economy: The New Generation Sustainable Growth Sectors. To be published by United Nations Conference on Trade and Development (UNCTAD), in progress, 2016.


CREATIVE INDUSTRIES AND REGIONAL ECONOMIC DEVELOPMENT IN INDONESIA
Meanings, Patterns and Impacts
F I K R I Z U
L F A H
M I
CREATIVE IN
DU
STRIES AN
D REG
ION
AL ECO
NO
MIC D
EVELOPM
ENT IN
IND
ON
ESIA
F I K R I Z U L F A H M I
Fikri Zul Fahmi (1987) is lecturer in urban and regional planning in the School of Architecture, Planning and Policy Development at Institut Teknologi Bandung (ITB), Indonesia. He holds a bachelor degree in Urban and Regional Planning from ITB and a Research Master degree in Regional Studies from University of Groningen. This book is the outcome of the PhD research project that he conducted in the Faculty of Spatial Sciences at the University of Groningen.
This book looks into the feasibility of promoting creative industries as an instrument for regional economic development in developing economies in general, and in Indonesia in particular. The concept of creative industries has been built upon specific contexts and phenomena in developed countries.
Today, developing countries also adopt the idea of promoting creative industries as a tool for national and local development. However, the position of these industries in socioeconomic development in a developing economy is still unclear.
This book presents four studies which show that the development of creative industries in a developing country such as Indonesia has di�erent meanings, patterns and impacts than those in the developed world.
I N V I T A T I O N
You are cordially invitedto the public defence of
Fikri Zul Fahmi
CREATIVE INDUSTRIES AND REGIONAL ECONOMIC DEVELOPMENT IN INDONESIA
Meanings, Patterns and Impacts
on Thursday 24 November 2016at 12.45 hours
in the Aula of the Academy Building of the University of Groningen,
Broerstraat 5, 9712 CP Groningen
After the defence ceremony you are welcome to the reception
ParanymphsGintarė Morkutė
([email protected])Fean D. Sarian