industrial waste treatment handbook
TRANSCRIPT

Industrial Waste Treatment Handbook


Industrial Waste Treatment Handbook
Frank Woodard, Ph.D., P.E., President
Copyright © 2001 by Butterworth–Heinemann
A member of the Reed Elsevier group
All rights reserved.
No part of this publication may be reproduced, stored in a retrieval system, or transmitted in any form or by any means, electronic, mechanical, photocopying, recording, or otherwise, without the prior written permission of the publisher.
Recognizing the importance of preserving what has been written, Butterworth–Heinemann prints its books on acid-free paper whenever possible.
Butterworth–Heinemann supports the efforts of American Forests and the Global ReLeaf program in its campaign for the betterment of trees, forests, and our environment.
Library of Congress Cataloging-in-Publication DataWoodard, Frank, 1939
Industrial waste treatment handbook/Frank Woodardp. cm.
Includes bibliographical references and indexes.ISBN 0-7506-7317-6 1. Factory and trade waste—Management—Handbooks, manuals, etc. 2. Sewage—Purification—Handbooks, manuals, etc. 3. Industries—Environmental
TD897.W67 2000]628.4—dc21
00-044448
British Library Cataloguing-in-Publication DataA catalogue record for this book is available from the British Library.
The publisher offers special discounts on bulk orders of this book.For information, please contact:
Manager of Special SalesButterworth–Heinemann225 Wildwood AvenueWoburn, MA 01801-2041Tel: 781-904-2500Fax: 781-904-2620
For information on all Butterworth–Heinemann publications available, contact our World Wide Web home page at:http://www.bh.com
10 9 8 7 6 5 4 3 2 1
Printed in the United States of America

v
Dedication
To Dr. James C. Buzzell, whose fascinatinganecdotes lured me into this profession; Dr. OtisJ. Sproul, by whose example I became accustomed toand enjoyed hard work and a scholarly approachto life; Dr. James E. Etzel, by whose example Ideveloped an insatiable desire to figure out betterways to achieve treatment of industrial wastes; andmy (almost) lifelong best friend, Jean McNearyWoodard, who deserves much of the credit for theexistence of this book.

1 Management of Industrial Wastes: Solids, Liquids, and Gases 1....................1.1 Management of Industrial Wastewater 1................................................................................1.2 O&M Costs 10...........................................................................................................................1.3 Management of Solid Wastes from Industries 18.....................................................................1.4 Management of Discharges to the Air 20..................................................................................1.5 Bibliography 28.........................................................................................................................
2 Fundamentals 29....................................................................................................2.1 Introduction 29..........................................................................................................................2.2 Characteristics of Industrial Wastewater 29..............................................................................2.3 The Polar Properties of Water 30.............................................................................................2.4 Electrical and Thermodynamic Stability 33...............................................................................2.5 Chemical Structure and Polarity of Water 36............................................................................2.6 Hydrogen Bonding 37...............................................................................................................2.7 Polar Solvents versus Nonpolar Solvents � True Solutions 38..................................................2.8 Emulsification 40.......................................................................................................................2.9 Colloidal Suspensions 43..........................................................................................................2.10 Mixtures Made Stable by Chelating Agents 44.......................................................................2.11 Summary 44............................................................................................................................2.12 Examples 45...........................................................................................................................2.13 Bibliography 48.......................................................................................................................
3 Laws and Regulations 49.......................................................................................3.1 Introduction 49..........................................................................................................................3.2 History of Permitting and Reporting 49.....................................................................................3.3 Requirements 49.......................................................................................................................3.4 Water Pollution Control Laws 50...............................................................................................3.5 Groundwater Pollution Control Laws 52...................................................................................3.6 Air Pollution Control Laws 55....................................................................................................3.7 Bibliography 60.........................................................................................................................
4 Wastes from Industries 61.....................................................................................4.1 Chemical Descaling 61.............................................................................................................4.2 Degreasing 62...........................................................................................................................4.3 Rinsing 64.................................................................................................................................4.4 Electroplating of Tin 65.............................................................................................................4.5 The Copper Forming Industry 74..............................................................................................4.6 Prepared Frozen Foods 77.......................................................................................................4.7 Wastes From De-inking 86.......................................................................................................4.8 Die Casting: Aluminum, Zinc, and Magnesium 93....................................................................4.9 Anodizing and Alodizing 99.......................................................................................................4.10 Production and Processing of Coke 103...................................................................................4.11 The Wine-Making Industry 107.................................................................................................4.12 The Synthetic Rubber Industry 110..........................................................................................4.13 The Soft Drink Bottling Industry 119.........................................................................................4.14 Production and Processing of Beef, Pork, and Other Sources of Red Meat 124.....................4.15 Rendering of By-Products from the Processing of Meat, Poultry, and Fish 130.......................4.16 The Manufacture of Lead Acid Batteries 138............................................................................4.17 Bibliography 144.......................................................................................................................
5 Industrial Stormwater Management 149.................................................................5.1 General 149................................................................................................................................5.2 Federal Stormwater Regulations 149.........................................................................................5.3 Prevention of Groundwater Contamination 151..........................................................................5.4 Stormwater Segregation, Collection, Retention, and Treatment 152..........................................5.5 Design Storm 152.......................................................................................................................5.6 System Failure Protection 153....................................................................................................5.7 Stormwater Retention 153..........................................................................................................5.8 Stormwater Treatment 153.........................................................................................................5.9 Stormwater as a Source of Process Water Makeup 154............................................................5.10 Bibliography 165.......................................................................................................................

6 Wastes Characterization: The Wastes Characterization Study, WastesAudit, and the Environmental Audit 166....................................................................
6.1 Wastes Characterization Study 166............................................................................................6.2 Wastes Audit 169........................................................................................................................6.3 Environmental Audit 172.............................................................................................................6.4 Characteristics of Industrial Wastewater 179..............................................................................6.5 Characteristics of Discharges to the Air 192...............................................................................6.6 Sample Analysis 198..................................................................................................................6.7 Ambient Air Sampling 198..........................................................................................................6.8 Characteristics of Solid Waste Streams from Industries 201......................................................6.9 Bibliography 205.........................................................................................................................
7 Pollution Prevention 208..........................................................................................Findings and Policy 208....................................................................................................................7.1 General Approach 209................................................................................................................7.2 Source Reduction 212................................................................................................................7.3 The Waste Audit 215..................................................................................................................7.4 Benefits of Pollution Prevention 216...........................................................................................7.5 Bibliography 216.........................................................................................................................
8 Methods for Treating Wastewaters from Industry 219..........................................8.1 General 219................................................................................................................................8.2 Principle and Nonprinciple Treatment Mechanisms 220.............................................................8.3 Waste Equalization 223..............................................................................................................8.4 pH Control 227............................................................................................................................8.5 Chemical Methods of Wastewater Treatment 230......................................................................8.6 Biological Methods of Wastewater Treatment 255.....................................................................8.7 Development of Design Equations for Biological Treatment of Industrial Wastes 256...............8.8 Physical Methods of Wastewater Treatment 322.......................................................................8.9 Bibliography 394.........................................................................................................................
9 Treatment and Disposal of Solid Wastes from Industry 397................................9.1 Characterization of Solid Wastes 398.........................................................................................9.2 The Solid Waste Landfill 400......................................................................................................9.3 Solid Waste Incineration 409......................................................................................................9.4 The Process of Composting Industrial Wastes 421....................................................................9.5 Solidification and Stabilization of Industrial Solid Wastes 427....................................................9.6 Bibliography 433.........................................................................................................................
10 Methods for Treating Air Discharges from Industry 437....................................10.1 Reduction at the Source 437....................................................................................................10.2 Containment 437.......................................................................................................................10.3 Treatment 438...........................................................................................................................10.4 Bibliography 456.......................................................................................................................
Index 461......................................................................................................................

ix
Preface
This book has been developed with the inten-tion of providing an updated primary referencefor environmental managers working in indus-try, environmental engineering consultants,graduate students in environmental engineer-ing, and government agency employeesconcerned with wastes from industries. It pre-sents an explanation of the fundamentalmechanisms by which pollutants become dis-solved or suspended in water or air, then buildson this knowledge to explain how differenttreatment processes work, how they can beoptimized, and how one would go about effi-ciently selecting candidate treatment processes.
Examples from the recent work history ofWoodard & Curran, as well as other environ-mental engineering and science consultants,are presented to illustrate both the approachused in solving various environmental qualityproblems and the step-by-step design of facili-ties to implement the solutions. Where permis-sion was granted, the industry involved in eachof these examples is identified by name. Other-wise, no name was given to the industry, andthe industry has been identified only as to type
of industry and size. In all cases, the actualnumbers and all pertinent information havebeen reproduced as they occurred, with theintent of providing accurate illustrations ofhow environmental quality problems have beensolved by one of the leading consultants in thefield of industrial wastes management.
This book is intended to fulfill the need foran updated source of information on the char-acteristics of wastes from numerous types ofindustries, how the different types of wastes aremost efficiently treated, the mechanismsinvolved in treatment, and the design processitself. In many cases, “tricks” that enable lowercost treatment are presented. These “tricks”have been developed through many years ofexperience and have not been generally avail-able except by word of mouth.
The chapter on laws and regulations is pre-sented as a summary as of the date stated in thechapter itself and/or the addendum that isissued periodically by the publisher. For infor-mation on the most recent addendum, pleasecall the publisher or Woodard & Curran’soffice in Portland, Maine, at (207) 774-2112.
x
Acknowledgments
This work was produced over a period of morethan five years; during that time, a very largenumber of individuals, corporations, and variousbusiness organizations contributed significantmaterial. I have tried to cite each contributor,and I apologize mightily if I have missed one ormore. Thus, I extend heartfelt gratitude andacknowledgement to:
Adam H. Steinman; Aeration Technologies,Inc.; R. Gary Gilbert; Albert M. Presgraves;Andy Miller; Claire P. Betze; Connie Bogard;Connie Gipson; Dennis Merrill; Dr. StevenE. Woodard; Geoffrey D. Pellechia; GeorgeAbide; George W. Bloom; Henri J. Vincent; Dr.Hugh J. Campbell; J. Alastair Lough; Janet
Robinson; Dr. James E. Etzel; JamesD. Ekedahl; Karen L. Townsend; KatahdinAnalytical Services; Keith A. Weisenberger;Kurt R. Marston; Michael Harlos; MichaelJ. Curato; Patricia A. Proux-Lough; PaulBishop; Randy E. Tome; Eric P. King; Ray-mond G. Pepin; Robert W. Severance; StevenN. Whipple; Steven Smock; Susan G. Stevens;Terry Rinehart; and Thora Knakkergaard, all ofwhom contributed text or verbal informationfrom which I freely drew, either word-for-wordor by way of paraphrase. I extend specialthanks to Adam Steinman, Esq., who providedtext and verbal information regarding laws,regulations and environmental audits.

1
1 Management of Industrial Wastes: Solids, Liquids, and Gases
The approach used to develop systems to treatand dispose of industrial wastes is distinctlydifferent from the approach used for municipalwastes. There is a lot of similarity in the char-acteristics of wastes from one municipality, orone region, to another. Because of this, the bestapproach to designing a treatment system formunicipal wastes is to analyze the performancecharacteristics of many existing municipal sys-tems and deduce an optimal set of designparameters for the system under consideration.Emphasis is placed on the analysis of other sys-tems, rather than on the waste stream underconsideration. In the case of industrial waste,however, few industrial plants have a highdegree of similarity between products pro-duced and wastes generated. Therefore,emphasis is placed on analysis of the wastesunder consideration, rather than on what is tak-ing place at other industrial locations. This isnot to say that there is little value in analyzingthe performance of treatment systems at other,more or less similar, industrial locations. Quitethe opposite is true. It is simply a matter ofemphasis.
Wastes from industries are customarily clas-sified as liquid wastes, solid wastes, or air pol-lutants, and often the three are managed bydifferent people or departments. The three sep-arate categories are regulated by separate anddistinct bodies of laws and regulations, and his-torically, public and governmental emphasishas moved from one category to another fromone time period to another. The fact is, how-ever, that the three categories of wastes areclosely interrelated, both as they impact on theenvironment and as they are generated andmanaged by individual industrial facilities.Solid wastes disposed of in the ground caninfluence the quality of groundwater and
surface waters by way of leachate entering thegroundwater and traveling with it through theground, then entering a surface water bodywith groundwater recharge. Volatile organics inthat recharge water can contaminate the air. Airpollutants can fall out to become surface wateror groundwater pollutants, and water pollutantscan infiltrate into the ground or volatilize intothe air.
Waste treatment processes can also transfersubstances from one of the three waste catego-ries to one or both of the others. Air pollutantscan be removed from an air discharge by meansof a water solution scrubber. The waste scrub-ber solution must then be managed to enable itto be discarded within compliance with appli-cable water regulations. Airborne particulatescan be removed from an air discharge using abag house, thus creating a solid waste to bemanaged. On still a third level, waste treatmentor disposal systems themselves can directlyimpact on the quality of air, water, or ground.Activated sludge aeration tanks are very effec-tive in causing volatilization of substancesfrom wastewater. Failed landfills can be potentpolluters of both groundwater and surfacewater.
The total spectrum of industrial wastes, then,must be managed as substances resulting froma system of interrelated activities. Materialsbalances must be tracked, and overall costeffectiveness must be kept in focus.
Management of Industrial Wastewater
With respect to industrial wastewater, Figure1-1 illustrates the approach for developing awell-operating, cost-effective treatment system.The first step is to gain familiarity withthe manufacturing processes themselves. This

2 Industrial Waste Treatment Handbook
Figure 1-1 Approach for developing an industrial waste-water treatment system.
usually starts with a tour of the facility, andthen progresses through a review of the litera-ture and interviews with knowledgeablepeople. The objective is to gain an understand-ing of how wastewater is produced, for tworeasons. The first is to enable an informed andtherefore effective wastes reduction, or minimi-zation (pollution prevention) program; thesecond is to enable proper choice of candidatetreatment technologies.
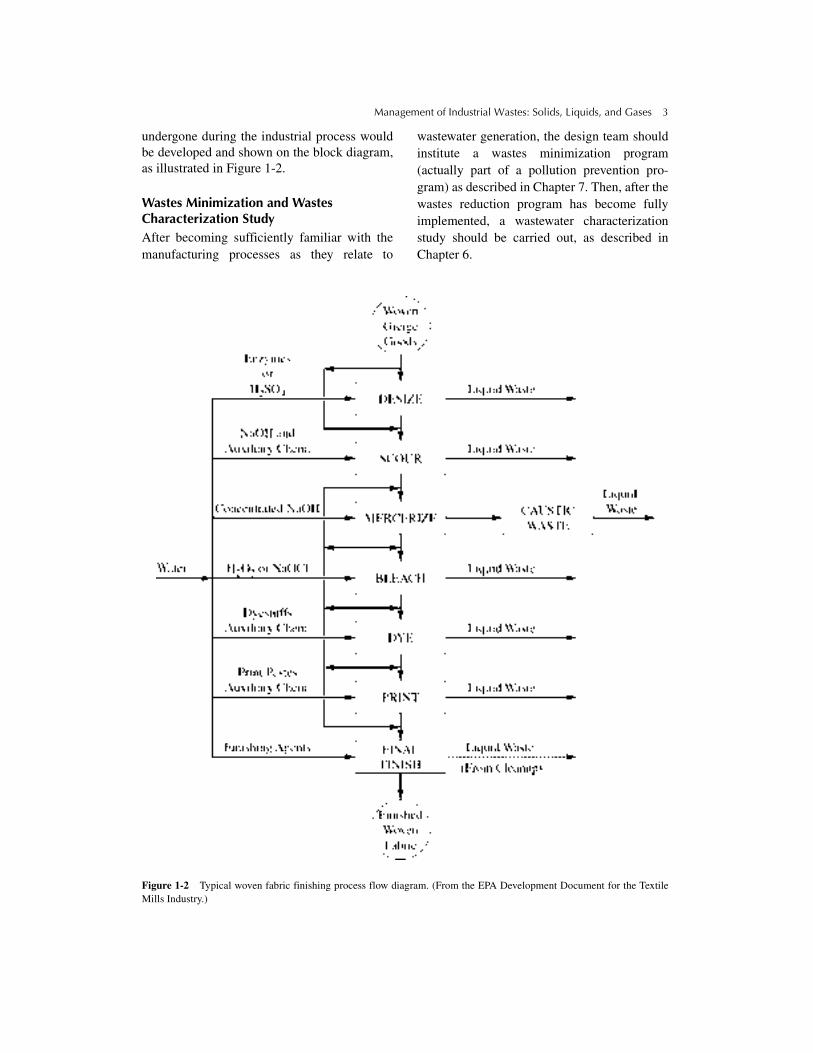
Analysis of Manufacturing ProcessesOne of the first steps in the analysis of manu-facturing processes is to develop a blockdiagram that shows how each manufacturingprocess contributes wastewater to the treatmentfacility, as is illustrated in Figure 1-2. In Figure1-2, a block represents each step in the manu-facturing process. The supply of water to eachpoint of use is represented on the left side ofthe block diagram. Wastewater that flows awayfrom each point of wastewater generation isshown on the right side.
Figure 1-2 is representative of the processesinvolved in producing finished woven fabricfrom an intermediate product of the textileindustry. The “raw material” for this process isfirst subjected to a process called “desizing,”during which the substances used to size thewoven greige goods, or raw fabric, areremoved. The process uses sulfuric acid; there-fore, the liquid waste from this process wouldbe expected to have a low pH as well as containwhatever substances were used as sizing. Forinstance, if starch were the substance used tosize the fabric, the liquid waste from the desiz-ing process would be expected to exhibit a highbiochemical oxygen demand (BOD).
As the knowledge became available, fromthe industry’s records, if possible, or from mea-surements taken as part of a wastewater charac-terization study, the flow rates, total quantitiesfor a typical processing day, upper and lowerlimits, and characteristics such as BOD, chemi-cal oxygen demand (COD), total suspendedsolids (TSS), total dissolved solids (TDS),and specific chemicals would be indicated onthe block diagram. Each individual process
Management of Industrial Wastes: Solids, Liquids, and Gases 3
undergone during the industrial process wouldbe developed and shown on the block diagram,as illustrated in Figure 1-2.
Wastes Minimization and Wastes Characterization StudyAfter becoming sufficiently familiar with themanufacturing processes as they relate to
wastewater generation, the design team shouldinstitute a wastes minimization program(actually part of a pollution prevention pro-gram) as described in Chapter 7. Then, after thewastes reduction program has become fullyimplemented, a wastewater characterizationstudy should be carried out, as described inChapter 6.
Figure 1-2 Typical woven fabric finishing process flow diagram. (From the EPA Development Document for the TextileMills Industry.)

4 Industrial Waste Treatment Handbook
The ultimate purpose of the wastewatercharacterization study is to provide thedesign team with accurate and completeinformation on which to base the design ofthe treatment system. Both quantitative andqualitative data are needed to properly sizethe facility and to select the most appropriatetreatment technologies.
Often, enough new information about mate-rials usage, water use efficiency, and wastesgeneration is learned during the wastewatercharacterization study to warrant a second levelof wastes minimization effort. This second partof the wastes minimization program should befully implemented, and its effectiveness shouldbe verified by more sampling and analyses,which amounts to an extension of the wastewa-ter characterization study.
A cautionary note is appropriate here con-cerning maintenance of the wastes minimiza-tion program. If, after implementation of thewastes minimization program, operation of themanufacturing facilities and/or housekeepingpractices loses attention and becomes lax sothat wastewater increases in volume, strength,or both, the treatment facility will be underde-signed and will be overloaded at the start. It isextremely important that realistic goals be setand maintained for the wastes minimizationprogram, and that the design team, as well asthe industry’s management team, are fullyaware of the consequences of overloading thetreatment system.
Treatment ObjectivesAfter the volume, strength, and substance char-acteristics of the wastewater have beenestablished, the treatment objectives must bedetermined. These objectives depend on wherethe wastewater is to be sent after treatment. Ifthe treated wastewater is discharged to anothertreatment facility, such as a regional facility ora municipal treatment system, pretreatmentrequirements must be complied with. As aminimum, the Federal Pretreatment Guide-lines issued by the Environmental ProtectionAgency (EPA) and published in the FederalRegister must be complied with. Some
municipal or regional treatment facilities havepretreatment standards that are more stringentthan those required by the EPA.
If the treated effluent is discharged to anopen body of water, then a National Pollut-ant Discharge Elimination System (NPDES)permit, plus a permit issued by the appropri-ate state agency, must be complied with. Inall cases, Categorical Standards issued by theFederal EPA apply, and it is necessary towork closely with one or more governmentagencies while developing the treatmentobjectives.
Selection of Candidate Technologies Once the wastewater characteristics and thetreatment objectives are known, candidate tech-nologies for treatment can be selected.Rationale for selection is discussed in detail inChapter 8. The selection should be based onone or more of the following:
• Successful application to a similar waste-water
• Knowledge of chemistry, biochemistry, andmicrobiology
• Knowledge of what technologies are avail-able, as well as knowledge of theirrespective capabilities and limitations
Then, bench scale investigations should beconducted to determine technical as well asfinancial feasibility.
Bench Scale InvestigationsBench scale investigations quickly and effi-ciently determine the technical feasibility anda rough approximation of the financial feasi-bility of a given technology. Bench scalestudies range from rough experiments inwhich substances are mixed in a beaker andresults are observed almost immediately, torather sophisticated continuous flow studies inwhich a refrigerated reservoir contains repre-sentative industrial wastewater, which ispumped through a series of miniature treat-ment devices that are models of the full-sizeequipment. Typical bench scale equipment

Management of Industrial Wastes: Solids, Liquids, and Gases 5
includes the six-place stirrer shown inFigure 1-3(a), small columns for ion exchangeresins, activated carbon, or sand, shown inFigure 1-3(b), “block aerators,” shown inFigures 1-3(c) and (d), for performing micro-biological treatability studies, and any numberof custom-designed devices for testing thetechnical feasibility of given treatmenttechnologies.
Because of scale-up problems, it is seldomadvisable to proceed directly from the resultsof bench scale investigations to design of thefull-scale wastewater treatment system. Only incases for which extensive experience existswith both the type of wastewater being treatedand the technology and types of equipment tobe used can this approach be justified. Other-wise, pilot scale investigations should be
conducted for each technology that appears tobe a legitimate candidate for reliable, cost-effective treatment.
In the absence of pilot scale investigations,the design team is obliged to be conservative inestimating design criteria for the treatment sys-tem. The likely result is that the cost for thefacility will be greater than the total cost for thepilot scale investigations plus the treatmentfacility that would have been designed usingthe information that would have been devel-oped from the pilot scale investigations. Saidanother way, the objective of pilot scale investi-gations is to develop the data necessary todetermine the minimum size and least costlysystem of equipment to enable the design of atreatment system that will reliably meet itsintended purpose.
Figure 1-3(a) Photograph of a six-place stirrer. (Courtesy of ©Phipps & Bird, Inc., 2000.)

6 Industrial Waste Treatment Handbook
Figure 1-3(b) Illustration of a column set-up to evaluate treatment methods that use granular media. (From Wachinski andEtzel, Environmental Ion Exchange: Principles and Design, 1997. Reprinted by permission of CRC/Lewis Publishers.)
Figure 1-3(c) Diagrammatic sketch of a block aerator set-up for performing treatability studies in the laboratory.

Management of Industrial Wastes: Solids, Liquids, and Gases 7
Pilot Scale InvestigationsA pilot scale investigation is a study of the per-formance of a given treatment technologyusing the actual wastewater to be treated, usu-ally on site, and using a representative modelof the equipment that would be used in thefull-scale treatment system. The term “repre-sentative model” refers to the capability of the
pilot treatment system to closely duplicate theperformance of the full-scale system. In somecases, accurate scale models of the full-scalesystem are used. In other cases, the pilotequipment bears no physical resemblance tothe full-scale system. Fifty-five gallon drumshave been successfully used for pilot scaleinvestigations.
Figure 1-3(d) Photograph of a block aerator set-up for performing treatability studies in the laboratory. (Courtesy ofAWARE Environmental, Inc.)

8 Industrial Waste Treatment Handbook
It is not unusual for equipment manufactur-ers to have pilot scale treatment systems thatcan be transported to the industrial site on aflatbed truck trailer. A rental fee is usuallycharged, and there is sometimes an option toinclude an operator in the rental fee. It isimportant, however, to keep all options open.Operation of a pilot scale treatment system thatis rented from one equipment manufacturermight produce results that indicate that anothertype of equipment (using or not using the sametechnology) would be the wiser choice.
Figure 1-4 presents a photograph of a pilotscale wastewater treatment system.
One of the difficulties in operating a pilotscale treatment system is the susceptibility ofthe system to upset caused by slug doses, wideswings in temperature, plugging of the rela-tively small diameter pipes, and lack of famil-iarity on the part of the operator.
When operating a pilot scale treatment sys-tem for a sufficiently long period, it is criticallyimportant to:
1. Evaluate its performance on all combina-tions of wastes that are reasonablyexpected to occur during the foreseeablelife of the prototype system.
2. Provide sufficient opportunity to evaluateall reasonable combinations of operationparameters. When operation parametersare changed—for instance the volumetricloading of an air scrubber, the chemicalfeed rate of a sludge press, or the recycleratio for a reverse osmosis system—thesystem must operate for a long enoughtime to achieve steady state before data tobe used for evaluation are taken. Ofcourse, it will be necessary to obtain dataduring the period just after operationparameters are changed, to determinewhen steady state has been reached.
During the pilot plant operation period,observations should be made to determinewhether performance predicted from the resultsof the bench scale investigations is being con-firmed. If performance is significantly differentfrom what was predicted, it may be prudent to
stop the pilot scale investigation work and tryto determine the cause.
Preliminary DesignsThe results of the pilot scale investigationsshow which technologies are capable of meet-ing the treatment objectives, but do not enablean accurate estimation of capital and operatingcosts. A meaningful cost-effectiveness analysiscan take place only after preliminary designs ofthose technologies that produced satisfactoryeffluent quality in the pilot scale investigationshave been completed. A preliminary design,then, is a design of an entire wastewater treat-ment facility, carried out in sufficient detail toenable accurate estimation of the costs for con-structing and operating a wastewater treatmentfacility. It must be complete to the extent thatthe sizes and descriptions of all of the pumps,pipes, valves, tanks, concrete work, buildings,site work, control systems, and labor require-ments are established. The difference betweena preliminary design and a final design is prin-cipally in the completeness of detail in thedrawings and in the specifications. It is almostas though the team that produces the prelimi-nary design could use it to directly constructthe plant. The extra detail that goes into thefinal design is principally used to communicateall of the intentions of the design team to peoplenot involved in the design.
Economic Comparisons The choice of treatment technology and a com-plete treatment system between two or moresystems proven to be reliably capable of meet-ing the treatment objectives should be based ona thorough analysis of all costs over theexpected life of the system.
Example: Pretreatment for a Microcrystal-line Cellulose Manufacturing Plant
By Henri VincentThe following sections illustrate an economiccomparison of five alternatives for treatingwastewater from an industrial plant producing

Management of Industrial Wastes: Solids, Liquids, and Gases 9
Figure 1-4 Photograph of a pilot scale wastewater treatment system. (Courtesy of Paques ADI, Inc.)

10 Industrial Waste Treatment Handbook
microcrystalline cellulose from wood pulp.This plant discharged about 41,000 gallons perday (GPD) of wastewater to the local municipalsewer system (publicly owned treatment works[POTW]). The municipality that owned thePOTW charged the industry a fee for treatment,and the charge was proportional to the strength,in terms of the BOD, TSS, fats, oils, andgreases (FOG), and total daily flow (Q).
In order to reduce the treatment chargesfrom the POTW, the plant had the option ofconstructing and operating its own wastewatertreatment system; however, because there wasnot an alternative place to discharge thetreated wastewater other than the municipalsewer system, there would continue to be acharge from the POTW, but it would bereduced in proportion to the degree of treat-ment accomplished by the industry. Becausethe industry’s treated wastewater would befurther treated by the POTW, the industry’streatment system is referred to as a “pretreat-ment system,” regardless of the degree oftreatment accomplished.
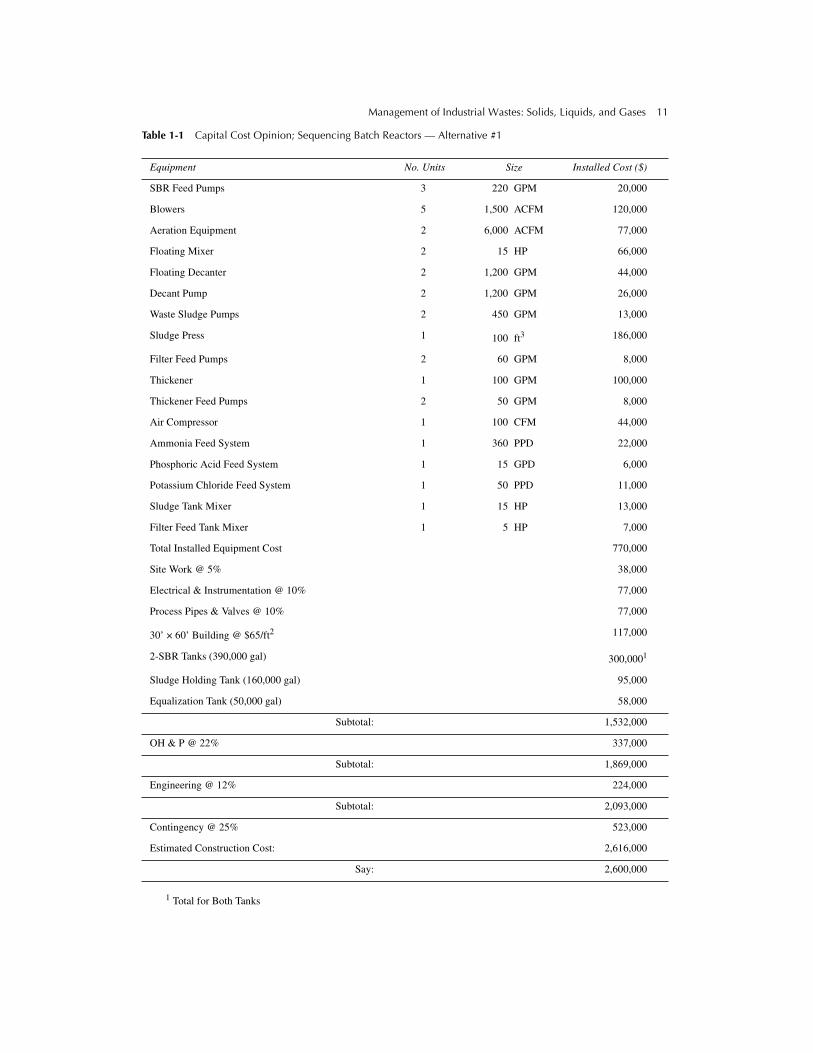
Sequencing Batch ReactorsThe use of sequencing batch reactors is onealternative for pretreating the plant’s wastewa-ters. Table 1-1 presents capital costs associatedwith this.
Rotating Biological ContactorsTable 1-2 presents a summary of the capitalcosts associated with this option. Also includedin Table 1-2 is the number of each unitrequired, along with its size and installed cost.
Fluidized Bed Anaerobic ReactorsTable 1-3 presents a summary of the capitalcosts associated with this option. Also includedin Table 1-3 is the number of each unitrequired, along with its size and installed cost.
Expanded Bed Anaerobic Reactors Because the expanded bed is not commer-cially available, capital costs were estimated
using the major system components fromthe fluidized bed anaerobic reactor (seeTable 1-3) and deleting the following itemsthat are not required for the expanded bedsystem:
• Two 40-ft Secondary Clarifiers
• Two 20 GPM Sludge Pumps
• One 40-ft3 Filter Press
• Two 60 GPM Filter Feed Pumps
• Two 80 GPM Sludge Transfer Pumps
• One 10 BP Sludge Tank Mixer
• One 5 HP Sludge Tank Mixer
• One 100 CFM Compressor
Also, a smaller building was designed forthis option.
As a result of these deletions, the estimatedcapital cost for the expanded bed anaerobicreactor system is $1,600,000.
O&M Costs
Operational and maintenance costs presentedfor each treatment alternative include the fol-lowing elements:
• Chemicals
• Power
• Labor
• Sludge disposal, if applicable
• Sewer use charges
• Maintenance
The bases for estimating the annual operat-ing cost for each of the previous elements were(1) the quantity of chemicals required for aver-age design value; (2) power costs for runningpumps, motors, blowers, etc.; (3) laborrequired to operate the facility; (4) sludge dis-posal costs, assuming sludge would be dis-posed of at a local landfill; (5) the cost forsewer use charges based on present rates; and(6) maintenance costs at a fixed percentage oftotal capital costs. The estimated sewer usecharges for each treatment alternative are givenin Table 1-4.
Management of Industrial Wastes: Solids, Liquids, and Gases 11
Table 1-1 Capital Cost Opinion; Sequencing Batch Reactors — Alternative #1
1 Total for Both Tanks
Equipment No. Units Size Installed Cost ($)
SBR Feed Pumps 3 220 GPM 20,000
Blowers 5 1,500 ACFM 120,000
Aeration Equipment 2 6,000 ACFM 77,000
Floating Mixer 2 15 HP 66,000
Floating Decanter 2 1,200 GPM 44,000
Decant Pump 2 1,200 GPM 26,000
Waste Sludge Pumps 2 450 GPM 13,000
Sludge Press 1 100 ft3 186,000
Filter Feed Pumps 2 60 GPM 8,000
Thickener 1 100 GPM 100,000
Thickener Feed Pumps 2 50 GPM 8,000
Air Compressor 1 100 CFM 44,000
Ammonia Feed System 1 360 PPD 22,000
Phosphoric Acid Feed System 1 15 GPD 6,000
Potassium Chloride Feed System 1 50 PPD 11,000
Sludge Tank Mixer 1 15 HP 13,000
Filter Feed Tank Mixer 1 5 HP 7,000
Total Installed Equipment Cost 770,000
Site Work @ 5% 38,000
Electrical & Instrumentation @ 10% 77,000
Process Pipes & Valves @ 10% 77,000
30’ × 60’ Building @ $65/ft2 117,000
2-SBR Tanks (390,000 gal) 300,0001
Sludge Holding Tank (160,000 gal) 95,000
Equalization Tank (50,000 gal) 58,000
Subtotal: 1,532,000
OH & P @ 22% 337,000
Subtotal: 1,869,000
Engineering @ 12% 224,000
Subtotal: 2,093,000
Contingency @ 25% 523,000
Estimated Construction Cost: 2,616,000
Say: 2,600,000

12 Industrial Waste Treatment Handbook
Table 1-2 Capital Cost Opinion; Rotating Biological Contactors — Alternative #2
Equipment No. Units Size Installed Cost ($)
RBC Feed Pumps 3 220 GPM 20,000
Clarifiers 2 40’ Diameter 195,000
Sludge Pumps 2 100 GPM 11,000
Sludge Press 1 100 ft3 186,000
Filter Feed Pumps 2 60 GPM 8,000
Thickener 1 100 GPM 100,000
Thickener Feed Pumps 2 50 GPM 8,000
Air Compressor 1 100 CFM 44,000
Ammonia Feed System 1 360 PPD 22,000
Phosphoric Acid Feed System 1 15 GPD 5,500
Potassium Chloride Feed System 1 60 PPD 11,000
Sludge Tank Mixer 1 15 HP 13,000
Filter Feed Tank Mixer 1 5 HP 7,000
Blowers 5 500 CFM 63,000
Aeration System 1 2,000 CFM 44,000
Total Installed Equipment Cost: 737,000
Site Work @ 5% 37,000
Electrical & Instrumentation @ 10% 74,000
Process Pipes & Valves @ 10% 74,000
30’ × 60’ Building @ $65/ft2 117,000
Sludge Holding Tank (160,000 gal) 95,000
RBC Tanks (Concrete) 50,000
Subtotal: 1,184,000
22% OH & P 260,000
RBC Shafts & Enclosures 1,444,000
Subtotal: 2,806,000
12% Engineering 337,000
Subtotal: 3,143,000
25% Contingency 786,000
Estimated Construction Cost: 3,929,000
Say: 3,900,000

Management of Industrial Wastes: Solids, Liquids, and Gases 13
Table 1-3 Capital Cost Opinion; Fluidized Bed Anaerobic Reactors — Alternative #3
Sequencing Batch Reactors An illustration of yearly O&M costs associ-ated with the use of sequencing batch reactorsfor wastewater pretreatment is presented inTable 1-5.
Rotating Biological Contactors Table 1-6 presents a summary of the capitalcosts associated with this treatment alternative.Also included in Table 1-6 is the estimatedquantity and unit cost for each O&M element.
Equipment No. Units Size Installed Cost ($)
Reactor Feed Pumps 3 220 GPM 20,000
Secondary Clarifiers 2 40’ Diameter 195,000
Sludge Pumps 2 20 GPM 3,300
Filter Press 1 40 ft3 108,000
Filter Feed Pumps 2 60 GPM 8,000
Sludge Transfer Pumps 2 80 GPM 8,000
Sludge Tank Mixer 1 10 HP 1,000
Filter Feed Tank Mixer 1 5 HP 7,000
Compressor 1 100 CFM 44,000
Gas Recovery Blower 40 CFM 18,700
Total Installed Equipment Cost: 413,000
Site Work @ 5% 21,000
Electrical & Instrumentation @ 10% 42,000
Process Pipes & Valves @ 10% 42,000
30’ × 30’ Building @ $65/ft2 58,000
Sludge Holding Tank (30,000 gal) 35,000
Subtotal: 611,000
OH & P @ 22% 134,000
Subtotal: 745,000
Upflow Fluidized Bed Reactor System 1,000,000
Subtotal: 1,745,000
Engineering @ 12% 209,000
Subtotal: 1,954,000
Contingency @ 25% 488,000
Estimated Construction Cost: 2,442,000
Say: 2,450,000

14 Industrial Waste Treatment Handbook
Table 1-4 Estimated Sewer Use Charges
Table 1-5 Yearly O&M Cost Summary; Sequencing Batch Reactors — Alternative #1
Fluidized Bed Anaerobic Reactors Table 1-7 presents a summary of the capitalcosts associated with this treatment alternative.Included in Table 1-7 is the estimated quantityand unit cost for each O&M element. Additionalinformation on gas recovery is also included toshow potential offsetting of O&M costs.
Expanded Bed Anaerobic Reactors Because the expanded bed is not commerciallyavailable, O&M costs were estimated with the
O&M elements from the fluidized bed anaero-bic reactor (see Table 1-7) and adjusted for thefollowing:
• Labor. Because no sludge dewatering isrequired, labor requirements can bedecreased by 75%.
• Sludge Disposal. None required becausecellulose can be recycled.
Based on the above, the total O&M costwithout gas recovery is $400,000, and with gasrecovery is $300,000.
Scenario *Yearly Cost ($)
*Based on flow, TSS, and BOD5 charges currently incurred.
No Treatment 928,000
SBR Alternative 325,000
RBC Alternative 325,000
Fluidized Bed Alternative 384,000
Expanded Bed Alternative 335,000
Item Unit Quantity Unit Cost ($) *Yearly Cost ($)
*Total rounded to nearest $50,000.
Chemicals
Ammonia (Anhydrous) Ton 66 135 8,910
Phosphoric Acid (85%) lb 83,000 0.22 18,260
Potassium Chloride (99%) lb 41,000 0.67 27,470
Sludge Conditioning lb 9,000 1.00 9,000
Polymer
Power kw-hr 3,000,000 0.054 162,000
Labor man-hr 4,380 38 166,440
Sludge disposal 1
1 Sludge assumed to be nonhazardous; includes transportation.
Ton 3,600 70 252,000
Sewer Use Charges 2
2 Per Table 1-4.
— — — 325,000
Maintenance 3
3 Assumed to be 2% of total capital cost.
— — — 52,000
Total: 1,021,000
Say: 1,000,000

Management of Industrial Wastes: Solids, Liquids, and Gases 15
Table 1-6 Yearly Operating Cost Summary; Rotating Biological Contactors — Alternative #2
Annualized Costs Annualized costs are a convenient method formaking economic comparisons among treat-ment alternatives. To obtain annualized costs,the capital cost for the alternative in question isamortized over the life of the system, which forthe purposes of this example is assumed to be20 years. The cost of money is assumed to be10%.
The five alternative treatment systems evalu-ated in the previous sections include (1) asequencing batch reactor (SBR), (2) a rotatingbiological contactor (RBC), (3) a fluidized bedanaerobic reactor, (4) an expanded bed anaero-bic reactor, and (5) the option of no pretreat-ment, which would result in paying the POTWfor accomplishing all of the treatment. Thefour treatment system types are described inChapter 8.
The estimated costs for the major items ofequipment presented in this example, referredto as “cost opinions,” and also presented inTable 1-8, were obtained by soliciting pricequotations from vendors. Ancillary equipmentcosts were obtained from cost estimatingguides such as Richardson’s, as well as experi-ence with similar projects. Elements of capitalcost such as equipment installation, electrical,process piping, and instrumentation were esti-mated as a fixed percentage of the purchaseprice of major items of equipment. Costs forthe building, including plumbing and heating,ventilation, and air conditioning (HVAC) wereestimated as a cost per square foot of the build-ing. At this level of cost opinion, it is appropri-ate to use a contingency of 25%, and to expecta level of accuracy of plus or minus 30% forthe total estimated cost.
Item Unit Quantity Unit Cost ($) *Yearly Cost ($)
*Total rounded to nearest $50,000.
Chemicals
Ammonia (Anhydrous) Ton 66 135 8,910
Phosphoric Acid (85%) lb. 83,000 0.22 18,260
Potassium Chloride (99%) lb. 41,000 0.67 24,470
Sludge Conditioning lb. 9,000 1.00 9,000
Polymer kw-hr 890,000 0.054 48,060
Power
Labor man-hr 4,380 38 166,440
Sludge disposal 1
1 Sludge assumed to be nonhazardous; includes transportation.
Ton 3,600 70 252,000
Sewer Use Charges 2
2 Per Table 1-4.
— — — 325,000
Maintenance 3
3 Assumed to be 2% of total capital cost.
— — — 78,000
Total: 930,140
Say: 950,000

16 Industrial Waste Treatment Handbook
Table 1-7 Yearly Operating Cost Summary; Fluidized Bed Anaerobic Reactor — Alternative #3
Table 1-8 Annualized Costs
Item Unit Quantity Unit Cost ($) *Yearly Cost ($)
* Total rounded to nearest $50,000.
Chemicals
Ammonia (Anhydrous) Ton 5 135 675
Phosphoric Acid (85%) lb. 7,000 0.22 1,500
Potassium Chloride (99%) lb. 3,000 0.67 2,000
Sludge Conditioning
Polymer lb. 6,000 1.00 6,000
Power kw-hr 262,000 0.054 14,150
Labor man-hr 4,380 38 166,440
Sludge disposal 1
1 Sludge assumed to be nonhazardous; includes transportation.
Ton 1,642 70 114,940
Sewer Use Charges 2
2 Per Table 1-4.
— — — 384,000
Maintenance 3
3 Assumed to be 2% of total capital cost.
— — — 49,000
Total: 738,705
Say: 700,000
Gas Recovery MCF: 19,000 3.50 (56,000)
Total with Gas Recovery: 640,000
Say: 650,000
Total CapitalAlternative
Annual CapitalCost ($) Cost ($) 1
1 Assumes 20-yr. life, 10% cost of money.
Total AnnualO&M Cost ($) 2
2 Assumes no increase in future O&M costs. Numbers in parentheses reflect energy recovery.
Cost ($)
#1 SBRs 2,600,000 300,000 1,000,000 1,300,000
#2 RBCs 3,900,000 450,000 950,000 1,400,000
#3 Fluidized Bed 2,450,000 300,000 700,000 1,000,000
(650,000) (950,000)
#4 Expanded Bed 1,600,000 200,000 400,000 600,000
(300,000) (500,000)
#5 Day Surcharge — 900,000 900,000

Management of Industrial Wastes: Solids, Liquids, and Gases 17
Final Design The final design process is both a formalityduring which standardized documents includ-ing plans and specifications are produced, anda procedure during which all of the subtledetails of the facility that is to be constructedare worked out. The standardized documentshave a dual purpose; the first is to provide acommon basis for several contractors to pre-pare competitive bids for constructing thefacility. The second is to provide completeinstructions for building the facility, so thatwhat gets built is exactly what the design teamintended.
Competitive Bids for Construction The purpose of going through the competitivebidding process is to ensure that the facilitydeveloped by the design team is built at thelowest achievable cost. In addition, the contrac-tors invited to participate in the bidding processshould be carefully selected on the basis ofcompetence, experience, workmanship, andreliability. In the end, the best construction jobfor the lowest possible price will not have achance of being realized if the best contractoris not on the list of those invited to submit bids.
The foundation of the bidding process is theset of documents known as the “plans andspecifications.” The first duty of the plans andspecifications is to provide all information insufficiently complete detail that each of thecontractors preparing bids submits cost propos-als for exactly the same, or truly equivalent,items. It is essential that each contractor’s bidproposal be capable of being compared on an“apples to apples” basis. That is, regardless ofwhich contractor builds the facility, it would beessentially identical in all respects relating toperformance, reliability, O&M requirements,and useful life. The key to obtaining this resultis accuracy and completeness, down to the fin-est details, of the plans and specifications.
As it has developed in the United States, thebidding process follows the block diagramshown in Figure 1-5. Figure 1-5 illustrates thatthe first of six phases is to develop a list ofpotential bidders, as discussed previously. This
list is developed based on past experience, ref-erences, and discussion with contractorsregarding their capabilities. Other means fordeveloping the list can involve advertising forpotential bidders in local and regional newspa-pers, trade journals, or publications issued bytrade associations. In the second phase, a for-mal request for bids is issued, along with plans,specifications, a bid form, and a timetable forbidding and construction.
The third phase, the pre-bid conference, iskey to the overall success of the project.This phase involves assembling all potentialcontractors and other interested parties, such
Figure 1-5 Illustration of the bidding process.

18 Industrial Waste Treatment Handbook
as potential subcontractors, vendors, and sup-pliers, for a meeting, preferably at the projectsite. This site visit normally includes a guidedand annotated tour, a presentation of the engi-neer’s/owner’s concept of the project, and aquestion-and-answer period. This meeting canresult in identification of areas of the designthat require additional information or change.If this is the case, the additional informationand/or changes are then addressed to all partiesby issuance of formal addenda to the plans andspecifications.
The final three phases—receipt and openingof bids, bid evaluation, and award of contract—are highly interrelated. Upon receipt, the bidsare reviewed to determine accuracy, complete-ness, and the lowest responsible bidder. If allbids are higher than was expected, the indus-try’s management and engineers have theopportunity to explore alternatives for redesignof the project. Finally, the project is awarded tothe contractor submitting the lowest responsi-ble bid. Construction or implementation cannow begin.
Management of Solid Wastes from Industries
By Janet Robinson
Industrial wastes that are discharged to neitherair nor water are classified as solid, industrial,or hazardous waste. At the federal level, thesewastes are regulated primarily by the ResourceConservation and Recovery Act (RCRA),which contains specific design and manage-ment standards for both hazardous wastes(Subtitle C of the Act) and municipal solidwastes (Subtitle D).
Solid WasteSolid waste (i.e., trash) includes such routinewastes as office trash, unreusable packaging,lunchroom wastes, and manufacturing or pro-cessing wastes that are not otherwise classifiedas “hazardous” under RCRA. These wastes arenormally deposited in trash cans and dumpstersand collected by a local trash hauler for disposal
in a municipal landfill or treatment at a munici-pal incinerator. Although RCRA contains designand other standards for municipal waste man-agement facilities, these facilities are normallygoverned primarily by state and local regulation.
General solid waste management has comeunder increasing scrutiny in recent yearsbecause of a recognition of the relatively highproportion of hazardous household compoundsthat solid waste contains. As a result, technicaldesign standards for solid waste landfills arenow approaching those for industrial and haz-ardous waste landfills. In addition, a reductionin the amount of available landfill space nation-wide has caused a steady increase in tippingfees (the fees charged for using municipal land-fills) and has prompted energetic recyclingefforts by many industries and communities.
Industrial or Special Wastes Industrial or special wastes are nonhazardousmanufacturing wastes that are barred frommunicipal waste treatment or disposal facili-ties, but do not meet the regulatory definitionof “hazardous waste.” Examples of thesewastes include tannery leather scraps, feathersand other wastes from poultry processing, non-hazardous sludge, and asbestos. These materi-als are normally disposed of in an industriallandfill, which is generally more strictly regu-lated, more highly designed, and more closelymonitored than municipal landfills. Prior wastetesting and approval are necessary before anindustry can ship waste to the site.
Industrial wastes are normally regulated onthe state and local levels, and most facilities arelicensed to accept only certain kinds of waste.Special state approval is often necessary forunusual waste streams.
Hazardous Waste Hazardous waste is a type of waste that meetsspecific characteristics of toxicity, ignitability,reactivity, or corrosivity, or is specificallylisted as a hazardous waste in RCRA regula-tions. Examples of wastes that are said toexhibit a hazardous “characteristic” are sludges

Management of Industrial Wastes: Solids, Liquids, and Gases 19
containing heavy metals that can be solubilizedby certain weak acids (toxic), waste gasoline(ignitable), elemental alkali metals such assodium or potassium (reactive), and acidwastes (corrosive). “Listed hazardous wastes”include waste commercial products, wastesfrom specific industrial processes, andwastes (e.g., spent solvents) from nonspecificsources.
Hazardous waste management is arguablyamong the most complex and comprehensivearenas of environmental regulation. As describedin Chapter 3, the RCRA program containsdetailed requirements for storing, handling,transporting, treating, and disposing of hazard-ous wastes, and mandates a “cradle-to-grave”waste tracking system to ensure that wastes aretransported and disposed of only by properlylicensed firms. Although hazardous waste regu-lations originated at the federal level, most statesare authorized by the EPA to administer theirown programs and often promulgate standardsthat are more strict than the federal standards.
Hazardous waste generators are required bythe land disposal restrictions (LDRs), alsoreferred to as “land ban” restrictions, to deter-mine the concentrations of certain constituentsin their hazardous wastes. Depending on theconstituents present and their concentrations,specific treatment standards, expressed as spec-ified technologies, may be required before thewastes can be land disposed. Residues result-ing from treatment of the waste are subject tothe same requirements and restrictions.
The distinctions between each of the wastecategories (municipal, industrial, and hazard-ous) as described are not always clear, and theonus is on the individual industry, or appropri-ate facility, to make the correct determination.Some states, for instance, consider waste oils tobe hazardous waste, even though federal lawdoes not. Cans of dried paint are generallyregarded as a normal solid waste that can go ina dumpster; however, cans of wet paint, espe-cially those that contain lead or chromate, areusually designated as hazardous. Tannerywastes with trivalent chrome usually can go toan industrial landfill, but some states considerthese materials to be hazardous. And, at the
present time, mixtures of listed hazardouswastes and nonhazardous wastes (e.g., rinsewa-ters containing spent plating solution, a listedhazardous waste) are hazardous in many cases.The so-called mixture rule illustrates theimportance of keeping waste streams separateto minimize the volume of hazardous waste fordisposal.
In addition to these wastes, most industriesproduce by-products, scraps, or spent materialsthat can be reused, reclaimed, or recycled foruse on or off site. Depending on their charac-teristics, these materials may be regulated ashazardous wastes even during the recyclingprocess, or they may become wastes if thedemand for them decreases to the point wherereprocessing becomes unprofitable. A goodworking knowledge of the solid waste manage-ment laws, or the advice of a reputable consult-ant or attorney, is imperative to avoid violationsof waste RCRA regulations.
Waste management and disposal often repre-sent significant and constantly increasing costsfor industry. In order to minimize these costsand reduce the likelihood of enforcementactions by regulators, environmental managersmust ensure that a sound program is in placeand that all personnel, from laborers to topmanagers, are vigilant in carrying it out. Thefollowing guidelines are often helpful:
• Know the facility waste streams. Like indus-trial wastewaters, these are seldom the samefor different plants. As a first step, facilitiesmust know how much of each type of solidwaste they are producing.
• Keep wastes segregated. Heavy fines, aswell as criminal sentences, are the penaltiesfor improper waste disposal. Facilities mustensure that hazardous wastes are not put inthe trash dumpster, that listed hazardouswastes are not mixed with other nonhazard-ous materials, and generally that wastes arehandled as they’re supposed to be.
• Choose waste disposal firms carefully.Because facilities can be held responsiblefor clean-up costs of the waste facilities theyuse, waste transporters and facilities shouldbe chosen carefully.

20 Industrial Waste Treatment Handbook
• Institute a pollution prevention program thatincludes a vigorous wastes minimizationeffort. Where possible, reduce the quantityor toxicity of materials used in production.
• Keep areas clean. Frequent spills or releasesnot only present safety hazards, but also willincrease the amount of facility decontami-nation necessary at closure.
• Keep good records. Industrywide, a greatdeal of money is wasted on testing anddisposing of unknown materials or in inves-tigating areas with insufficient historicaldata. Good recordkeeping is essential tokeep both current and future waste manage-ment costs to a minimum.
Excellent texts that discuss in detail themany aspects of solid, industrial, and hazard-ous waste management are available; these ref-erences are listed in the bibliography at the endof this chapter and can be consulted for specificinformation.
Management of Discharges to the Air
The discharge, or release, of substances to theair, no matter how slight, is regarded as air pol-lution. Such discharges can be classified in oneof only two categories, within compliance or notwithin compliance. A federal permit as well as astate license or permit must cover all dischargesover a certain quantity per unit time. Local ordi-nances or regulations may also apply.
Discharges to the air can be direct, by meansof a stack, or by way of leaks from a building’swindows, doors, or other openings. The latterare referred to as “fugitive emissions.” Volatil-ization of organic compounds, such as solventsand gasoline from storage containers, transferequipment, or even points of use, are importantsources of air discharges. Another source ofdischarge to the air of volatile organics is aer-ated wastewater treatment systems.
Management of discharges to the air isalmost always interrelated with management ofdischarges to the water and/or the groundbecause air pollution control devices usuallyremove substances from the air discharge (usu-ally a stack) and transfer them to a liquid
solution or suspension, as with a scrubber, or toa collector of solids, as with a bag house.Therefore, a total system approach to environ-mental pollution control is preferred, and thisapproach should include a pollution preventionprogram with vigorous waste minimization.
There are three phases to the air pollutioncycle: (1) the release, or discharge, at thesource; (2) the dispersal of pollutants in theatmosphere; and (3) the reception of pollutantsby humans, animals, or inanimate objects.Management of the first phase is a matter ofengineering, control, and operation of equip-ment. The second phase can be influenced bystack height, but meteorology dictates the pathof travel of released pollutants. Because themotions of the atmosphere can be highly vari-able in all dimensions, management of the thirdphase, which is the ultimate objective of airpollution control, requires knowledge of mete-orology and the influence of topography.
Chapter 3 presents a detailed synopsis oflaws and regulations that pertain to protectionof the nation’s air resources. Because theselaws are constantly being revised and replacedby new legislation, an updated supplement tothis book is published every five years.
Analysis of Manufacturing ProcessSuccessful and cost-effective air pollution con-trol has its foundation in complete awarenessof all of the individual sources, fugitive as wellas point sources. The process of cataloguingeach and every individual air discharge withinan industrial manufacturing or other facility ismost efficiently done by developing detaileddiagrams of the facility as a whole. Dependingon the size and complexity of the facility, itmay also be advantageous to develop separatediagrams for point sources and sources of fugi-tive emissions. Next, a separate block diagramfor each air discharge source should be devel-oped. The purpose of each block diagram is toillustrate how each manufacturing process andwastewater or solid wastes treatment or han-dling process contributes unwanted substancesto the air. Figures 1-6 through 1-8 are examplesof these diagrams.

Management of Industrial Wastes: Solids, Liquids, and Gases 21
Figure 1-6 Block diagram of a cement manufacturing plant.

22 Industrial Waste Treatment Handbook
Figure 1-7 Flowsheet for the manufacture of Portland Cement. (Taken from the EPA Development Document PB-238610, 1974.)

Management of Industrial Wastes: Solids, Liquids, and Gases 23
Figure 1-8 Kiln dust collection and handling.

24 Industrial Waste Treatment Handbook
Figures 1-6 through 1-8 are block diagramsthat pertain to a facility that manufacturescement from limestone. Figure 1-6 is a diagramof the facility as a whole, showing the cementmanufacturing process as well as the physicalplant, including the buildings, parking lots, andstorage facilities.
Cement, manufactured for use in makingconcrete, is produced by grinding limestone,cement rock, oyster shell marl, or chalk, allprincipally calcium carbonate, and mixing itwith ground sand, clay, shale, iron ore, andblast furnace slag, as necessary, to obtain thedesired ingredients in proper proportions. Thismixture is dried in a kiln and then ground againwhile mixing with gypsum. The final product isthen stored, bagged, and shipped. Each of theindividual production operations generates, oris otherwise associated with, dust or “particu-lates” and is a potential source of air pollutantemissions exceeding permit limits.
Figures 1-6 and 1-7 illustrate that raw mate-rials are received and stockpiled at the plant,and are potential sources of particulate emis-sions because of the fine particles of dust thatare generated during the mining, transporta-tion, loading, and unloading processes. Theirsusceptibility to being blown around if they areout in the open is also a factor. In order tocontrol emissions from these sources, it is nec-essary to conduct all loading, unloading, grind-ing, and handling operations within enclosuresthat are reasonably air-tight, to prevent fugitiveemissions, and are also ventilated, for thehealth and safety of employees. Ventilationrequires a fresh air intake and a discharge. Thedischarge requires a treatment process. Candi-date treatment processes for this applicationinclude bag houses, wet scrubbers, and electro-static precipitators, possibly in combinationwith one or more inertial separators. Each ofthese treatment technologies is discussed inChapter 10.
A very important aspect of air pollution con-trol is to obtain and then maintain a high degreeof integrity of the buildings and other enclo-sures that have as at least one of their purposesthat of containment of potential air pollutants.Doors and windows and vents must be kept
shut. The building or enclosure must be kept ingood repair to avoid leaks. In many cases, it isnecessary to maintain a negative pressure(pressure inside building below atmosphericpressure outside building) in order to preventthe escape of gasses or particulates. Maintain-ing the integrity of the building or enclosurebecomes very important in this case to mini-mize costs for maintaining the negative pres-sure gradient.
As further illustrated in Figure 1-6, the nextseries of processing operations constitutes thecement manufacturing process itself, and startswith crushing, then proceeds through mixing,grinding, blending, and drying in a kiln. Each ofthese processes generates major amounts of par-ticulates, which must be contained, transported,and collected by use of one or more treatmenttechnologies, as explained in Chapter 10. Insome cases, it may be most advantageous frompoints of view of reliability or cost effectiveness,or both, to use one treatment system for all pointsources. In other cases, it might prove best totreat one or more of the sources individually.
Continuing through the remaining pro-cesses illustrated in Figures 1-6 and 1-7, thefinished product (cement) must be cooled, sub-jected to finish grinding, cooled again, stored,then bagged and sent off to sales distributionlocations. Again, each of these operations isa potential source of airborne pollutants, inthe form of particulate matter, and it is neces-sary to contain, transport, and collect the partic-ulates using hoods, fans, ductwork, and one ormore treatment technologies as explained inChapter 10.
The next step in the process of identifyingeach and every source of air pollutant dischargefrom the cement manufacturing plant beingused as an example is to develop a block dia-gram for each individual activity that is a majoremission source. Figure 1-8 illustrates this step.Figure 1-8 is a block diagram of the processreferred to as the “kiln,” which dries the unfin-ished cement using heat. This diagram pertainsto only the manufacturing process and does notinclude sources of emissions from the physicalplant, most of which are sources of fugitiveemissions.

Management of Industrial Wastes: Solids, Liquids, and Gases 25
Figure 1-8 shows that the inputs to the kilninclude partially manufactured (wet) cementand hot air. The outputs include dry partiallymanufactured cement and exhaust air, ladenwith cement dust, or particulates. The diagramthen shows that there are four candidate tech-nologies to treat the exhaust gas to remove theparticulates before discharge to the ambient air.The four candidate technologies are:
• Electrostatic precipitator
• Cyclone
• Bag house
• Wet scrubber
Each of these technologies is worthy of fur-ther investigation, including their technical fea-sibility and cost effectiveness. Also, each ofthese technologies results in a residual, whichmust be handled and disposed of properly.
For instance, the bag house technology pro-duces a residual that can be described as a dry,fine dust that is essentially “raw” cement. Thismaterial can be stored in a “dust bin” (the dustbin must be managed as a potential air pollu-tion source), and from there can be:
• Returned to the kiln in an attempt to increasethe yield of the manufacturing process
• Buried
• Hauled (as a by-product) to another point ofuse
• Mixed with water to form a slurry
The first of the aforementioned options isonly a partial solution, at best, because theremust be some “blow down,” if only to maintainquality specifications for the finished product.The second option, “burial,” is a final solution,but it must be accomplished within the parame-ters of good solid waste disposal practice, andthe third option, “water slurry,” is only aninterim treatment step. Forming a water slurrytransforms the air pollution potential probleminto a water pollution potential problem(“cross-media” effect). The slurry can be trans-ported to another location without risk of airpollution, but it must then be dewatered by sed-imentation before final disposal within the
bounds of acceptable solid waste and wastewa-ter disposal practices.
The foregoing example illustrates how anentire manufacturing facility must be analyzedand diagrammed to define each and everysource of discharge of pollutants to the air as anearly step in a technically feasible and cost-effective air pollution control program. Thenext steps are presented as follows.
Wastes Minimization and Characterization StudyAfter all potential sources of air pollutants havebeen identified, the objectives of the industry’spollution prevention program should beaddressed. As explained in Chapter 7, wastesminimization is only one aspect of a pollutionprevention program, but it is a critical one.Each source should first be analyzed to deter-mine if it could be eliminated. Next, materialssubstitution should be considered to determineif there are opportunities to use nonobjection-able substances in place of currently usedobjectionable ones. Then, it should be deter-mined whether a change in present operations,for instance, improved preventive maintenanceor improved equipment, can significantlyreduce pollutant generation. Finally, it shouldbe determined whether improvements in acci-dent and spill prevention as well as improvedemergency response are warranted.
After a prudent wastes minimization pro-gram has been carried out, a period should beallocated to determine if the changes madeappear to be permanent. This phase of the over-all air pollution control program is importantbecause, if the determination of air pollutantflow rates and concentrations is made on thebasis of improved maintenance and operationalprocedures, and if the facility regresses to theway things were done previously, the handlingand treatment equipment designed on the basisof the improved procedures will be overloadedand will fail.
Once all air pollution flows and loads havebecome stabilized, each of the sources shouldbe subjected to a characterization program todetermine flow rates and target pollutant

26 Industrial Waste Treatment Handbook
concentrations (flows and loads) for the pur-pose of developing design criteria for handlingand treatment facilities. Examples of handlingfacilities are hoods, fans, and ductwork.Examples of treatment equipment are electro-static precipitators and fabric filters (baghouses, for instance). The characterizationstudy is essentially the process of developingestimates of emission rates based on historicalrecords of either the facility under consider-ation or those of a similar facility. For instance,materials balances showing amounts of rawmaterials purchased and products sold can beused to estimate loss rates.
Treatment ObjectivesTreatment objectives are needed to completethe development of design criteria for handlingand treatment equipment. The air dischargepermit, either in hand or anticipated, is one ofthe principal factors used in this development.Another principal factor is the strategy to beused regarding allowances, i.e., whether or notto buy allowances from another source or toreduce emissions below permit limits andattempt to recover costs by selling allowances.This strategy and its legal basis are discussed inChapter 3. Only after all treatment objectiveshave been developed can candidate treatmenttechnologies be determined; however, it maybe beneficial to employ an iterative process,whereby more than one set of treatmentobjectives and their appropriate candidatetechnologies are compared as competing alter-natives in a financial analysis to determine themost cost-effective system.
Selection of Candidate Technologies After the characteristics of air discharges, interms of flows and loads, have been determined(based on stabilized processes after changeswere made for wastes minimization), and treat-ment objectives have been agreed upon,candidate technologies for removal of pollut-ants can be selected. The principles discussedin Chapters 2 and 8 are used as the bases forthis selection. The selection should be based onone or more of the following:
• Successful application in a similar set ofconditions
• Knowledge of chemistry
• Knowledge of options available, as well asknowledge of capabilities and limitations ofthose alternative treatment technologies
The next step is to conduct bench scaleinvestigations to determine technical and finan-cial feasibility.
Bench Scale InvestigationsUnless there is unequivocal proof that a giventechnology will be successful in a given appli-cation, a rigorous program of bench scalefollowed by pilot scale investigations must becarried out. Such a program is necessary forstandard treatment technologies as well asinnovative technologies. The cost for this typeof program will be recovered quickly, as aresult of the equipment being appropriatelysized and operated. Under-designed equipmentwill simply be unsuccessful. Over-designedequipment will cost far more to purchase,install, and operate.
The results of a carefully executed benchscale pollutant removal investigation providethe design engineer with reliable data on whichto determine the technical feasibility of a givenpollutant removal technology, as well as a pre-liminary estimate of the costs for purchase,construction and installation, and operation andmaintenance. Without such data, the designengineer is forced to use very conservativeassumptions and design criteria. The result,barring outrageous serendipity, will be unnec-essarily high costs for treatment throughout thelife of the treatment process.
Pilot Scale InvestigationsBench scale investigations are only the firststep in a necessary procedure for determiningthe most cost-effective treatment technology.Inherent scale-up problems make it inadvis-able, to say the least; imprudent, to beconservative; and negligent, to be truthful, todesign a full-scale treatment system based only
Management of Industrial Wastes: Solids, Liquids, and Gases 27
on data from bench scale work. The next stepafter bench scale investigations is the pilotscale work. A pilot plant is simply a small ver-sion of the anticipated full-scale treatmentsystem.
A good pilot plant should have the capabilityto vary operational parameters. It is not suffi-cient to merely confirm that successful treat-ment, in terms of compliance with dischargelimitations, can be achieved using the sameoperating parameters as was determined by thebench scale investigations. Again, it would beoutrageous serendipity if the results of thebench scale investigations truly identified themost cost-effective, as well as reliable, full-scale treatment system design and operatingparameters.
The pilot scale investigation should becarried out at the industrial site, using a por-tion of the actual gas stream to be treated. Apilot scale treatment unit, for instance a wetscrubber, or an electrostatic precipitator, can,in many cases, be rented from a manufac-turer and transported to the site on a flatbedtruck.
The pilot plant should be operated continu-ously, over a representative period, so as toinclude as many of the waste stream variationsthat are expected to be experienced by the full-scale unit as is reasonably possible. One diffi-culty in carrying out a pilot scale study is thatsmaller units are more susceptible to upset,fouling, plugging, or other damage from slugdoses caused by spills or malfunctions in pro-cessing equipment. Also, unfamiliarity on thepart of the pilot plant, either with the gasstream being treated, the processing systemfrom which the stream is generated, or the pilotplant itself, can result in the need for prolongedinvestigations.
Similar to wastewater treatment pilot plantinvestigations, it is critically important to oper-ate a pilot scale treatment system for a suffi-ciently long period to:
• Include as many combinations of wastesthat are reasonably expected to occur duringthe foreseeable life of the prototype system,as is reasonably possible.
• Evaluate as many combinations of operationparameters as is reasonably possible. Whenoperation parameters are changed, forinstance the volumetric loading of an airscrubber, the chemical feed rate of a pHneutralization system, or the effective poresize of a bag house type fabric filter, the sys-tem must operate for a long enough time toachieve steady state before data to be usedfor evaluation are taken. Of course, it will benecessary to obtain data during the periodjust after operation parameters are changed,to determine when steady state has beenreached.
Observations should be made to determinewhether performance of the pilot plant using aparticular set of parameters is in the range ofwhat was predicted from the results of thebench scale investigations. If the difference inperformance is significant, it may be prudent tostop the pilot scale investigation work and tryto determine the cause.
Preliminary DesignsThe results of the pilot scale investigationsshow which technologies are capable of meet-ing the treatment objectives, but do not enablean accurate estimation of capital and operatingcosts. A meaningful cost-effectiveness analysiscan take place only after preliminary designs ofthose technologies that produced satisfactoryeffluent quality in the pilot scale investigationshave been completed. A preliminary design,then, is a design of an entire waste treatmentfacility, carried out in sufficient detail to enableaccurate estimation of the costs for construct-ing and operating a waste treatment facility. Itmust be complete to the extent that the sizesand descriptions of all of the pumps, pipes,valves, tanks, concrete work, buildings, sitework, control systems, and labor requirementsare established. The difference between a pre-liminary design and a final design is principallyin the completeness of detail in the drawingsand specifications. It is almost as though theteam that produces the preliminary designcould use it to directly construct the plant. Theextra detail that goes into the final design is

28 Industrial Waste Treatment Handbook
principally used to communicate all of theintentions of the design team to people notinvolved in the design.
Economic Comparisons The choice of treatment technology and com-plete treatment system between two or moresystems proven to be reliably capable of meet-ing the treatment objectives should be based ona thorough analysis of all costs over theexpected life of the system.
Bibliography
American Society of Civil Engineers, Manualof Practice: Quality in the ConstructionProject—A Guide for Owners, Designers,and Contractors, New York, 1988.
CELDS: United States Army Corps of Engi-neers, Construction Engineering Research.
Chanlett, E.T., Environmental Protection, 2nded., McGraw-Hill, New York, 1979.
Dunne, T., and L.D. Leopold, Water in Envi-ronmental Planning, Freeman, SanFrancisco, 1978.
Pruett, J.M., “Using Statistical Analysis forEngineering Decisions,” Plant Engineering,May 13, 1976, pp. 155–157.
U.S. Environmental Protection Agency, DesignCriteria for Mechanical, Electric, andFluid System and Component Reliability,EPA-430-99-74-001, Washington, D.C.,1974.
U.S. Environmental Protection Agency, Devel-opment Document for Effluent Limitationsand Guidelines and New Source Perfor-mance Standards for the CementManufacturing Point Source Category, EPA/PB-238 610, January 1974.
U.S. Environmental Protection Agency, ISO14000 Resource Directory, National RiskManagement Research Laboratory, EPA/625/R-97/003, Cincinnati, Ohio, 1997.
Vesilind, P.A., Environmental Pollution andControl, 10th ed., Ann Arbor Science Pub-lishers, Ann Arbor, Michigan, 1982.
Wachinski, A.M., and J.E. Etzel, Environmen-tal Ion Exchange, Lewis Publishers, NewYork, 1997.
Willis, J.T., (ed.), Environmental TQM, 2nded., McGraw-Hill, New York, 1994.
29
2 Fundamentals
Introduction
Although the laws and regulations that requireindustrial wastewater treatment are constantlychanging, the fundamental principles on whichtreatment technologies are based do notchange. This chapter presents a summarizedversion of the basic chemistry and physics thattreatment technologies are based on, with theobjective of showing that a command of theseprinciples can enable quick, efficient identifica-tion of very effective treatment technologiesfor almost any given type of wastewater.
The fundamental idea upon which theapproach suggested in this chapter is based canbe stated as follows: If the mechanisms bywhich individual pollutants become incorpo-rated into a waste stream can be identified, ana-lyzed, and described, the most efficientmethodology of removal, or treatment, will beobvious.
As an example of the usefulness of thisapproach to quickly develop an effective, effi-cient treatment scheme, the leachate from alandfill was to be pretreated, then discharged toa municipal wastewater treatment facility(publicly owned treatment works [POTW]).Because the waste sludge from the POTW wasto be disposed of by land application, a restric-tive limitation was placed on heavy metals inthe pretreated leachate. Analysis of theleachate showed that the content of iron wasrelatively high. Other metals such as cadmium(probably from discarded batteries), zinc, cop-per, nickel, and lead were also present in excessof the concentrations allowed by the pretreat-ment permit, but substantially lower than iron.
Knowledge of the following enabled quickconceptualization of a treatment scheme:
• All metals are sparingly soluble in water.
• Iron in the divalent state is highly soluble inwater, whereas iron in the trivalent state isnot.
• Iron can be converted from the divalent stateto the trivalent state by passing air throughthe aqueous solution containing the dis-solved iron. (The oxygen in the air oxidizesthe ferrous (divalent) ion to ferric (trivalent)ion.)
• Because substances such as cadmium, zinc,and lead are so sparingly soluble, they tendto adsorb to the surface of almost any solidparticle in an aqueous environment.
In this scheme, the leachate would be con-veyed to a simple, open concrete tank where airwas bubbled through it. In this tank, insolubleiron oxide was formed from soluble ferrouscompounds, the precipitated iron oxide parti-cles would coagulate and flocculate because ofthe gentle mixing action of the air bubbles, anddissolved species of other metals would adsorbto the iron oxide particles. Next, the aeratedleachate was allowed to settle, effectivelyremoving all of the heavy metals to within thelimits of the pretreatment permit.
The following sections of this chapter havebeen developed to explain the fundamentalchemical and physical principles by which pol-lutants become dissolved, suspended, or other-wise incorporated into wastewater. At the endof this chapter, several simple examples, simi-lar to that involving the leachate, are given tofurther illustrate the usefulness of the techniquewhereby fundamental concepts of chemistryand physics can be applied to efficientlydeduce optimal treatment schemes.
Characteristics of Industrial Wastewater
Industrial wastewater is the aqueous discardthat results from the use of water in an indus-trial manufacturing process or the cleaningactivities that take place along with thatprocess.

30 Industrial Waste Treatment Handbook
Industrial wastewater is the result of sub-stances other than water having been dissolvedor suspended in water. The objective of indus-trial wastewater treatment is to remove thosedissolved or suspended substances. The bestapproach to working out an effective and effi-cient method of industrial wastewater treatmentis to examine those properties of water and ofthe dissolved or suspended substances thatenabled or caused the dissolution or suspen-sion, then to deduce plausible chemical orphysical actions that would reverse those pro-cesses. Familiarity with the polar characteris-tics of water is fundamental to being able tomake such deductions.
The Polar Properties of Water
Water molecules are polar. This polarity arisesfrom the spatial arrangement of protons andelectrons in the individual hydrogen and oxygenatoms that make up each water molecule. Con-sidering hydrogen first, it is the smallest of theelements. Hydrogen consists of one protonwithin a small, extremely dense nucleus and oneelectron contained within an orbital that is moreor less spherical and surrounds the nucleus. Anorbital is a region in space where, according tothe theory of quantum mechanics, an electron ismost likely to be found. Figure 2-1 is a two-dimensional portrayal of the three-dimensionalhydrogen atom, but is sufficient to show that, atany given instant, the negatively charged elec-tron is able to counteract the positively chargednucleus within only a small region of the spacethat the atom occupies.
Figure 2-1 Diagram of a hydrogen atom.
Figure 2-1 illustrates that, if a charge detec-tor could be placed near the hydrogen atom, atany given instant, it would detect a negativecharge in the region near the electron and apositive charge everywhere else. The positivecharge would register strongest in the regionopposite in space to the region occupied by theelectron. At any given instant then, a hydrogenatom is a polar object, having a negativelycharged region and a positively charged region.In this sense, at any given instant, a hydrogenatom exhibits properties of a tiny magnet; how-ever, the electron is in continual motion, and atany given instant can be found anywherewithin the approximately spherical orbital sur-rounding the nucleus. The net effect of an iso-lated hydrogen atom is to appear electricallyneutral and not polar.
Before proceeding to an examination of thestructure and electrically charged characteris-tics of oxygen, and then water, it is useful toexamine the construction of the six elementsthat lie between hydrogen and oxygen in size,and to consider, in a step-by-step way, howeach successive proton and its associated elec-tron influence the characteristics of each ele-ment. Several “rules” govern where electronsare to be found within an atom or a molecule.The first has to do with energy level. As atomsincrease in size, the additional protons alwaysreside in the nucleus, but the additional elec-trons reside in successively larger orbitals that,in turn, exist within successively larger concen-tric shells. The electrons within orbitals that arecloser to the nucleus are of lower energy levelthan those in larger orbitals. One of the strictrules of electron location is that no electron canoccupy an orbital of higher energy level untilall orbitals of lower energy are “full.” A secondrule is that only two electrons can occupy anyatomic orbital, and these electrons must haveopposite spins. These electrons of oppositespin are called “electron pairs.” Electrons oflike spin tend to get as far away from eachother as possible. This rule is the “Pauli exclu-sion principle” and is the most important of allthe influences that determine the properties andshapes of molecules.

Fundamentals 31
Figures 2-2(a) and (b) show two waysto depict a spherical electron orbital.Figure 2-2(a) presents the orbital as a spheri-cal cloud surrounding the nucleus. Figure 2-2(b) is simply a convenient, two-dimensionalrepresentation of the orbital. Figure 2-3 showsthe shapes of the two orbitals of lowestenergy level, which are the two smallest orbit-als as well.
Figure 2-3(a) shows that the smallest and,therefore, lowest energy level orbital is desig-nated the “1s” orbital and is approximatelyspherical. The center of the 1s orbital coincideswith the center of the atom’s nucleus. Figure2-3(b) shows that the next larger orbital iscalled the “2s” orbital and is also approxi-mately spherical, with its center coincidingwith the center of the nucleus. Next in size (andenergy level) are three orbitals of equal energylevel that have two approximately sphericallobes each, and can thus be described as having
Figure 2-2(a) Spherical electron orbital as a sphericalcloud surrounding the nucleus.
Figure 2-2(b) Two-dimensional representation of theelectron orbital.
shapes similar to dumbbells (as in weightlift-ing). These orbitals, named “2p orbitals,”are shown in Figures 2-4(a), (b), and (c).Figure 2-4(a), (b), and (c) show that the threetwo-lobed orbitals are arranged so as to be asfar away from one another as possible, and arethus arranged such that the center of each lobelies on one of three axes that are perpendicularto one another.
The center of the atomic nucleus coincideswith the origin of the three axes. The axes arereferred to as the x, y, and z-axes, and the threeorbitals are called the 2px, 2py, and 2pz orbitals.
The electron orbitals exist within electronshells. The electron shells are concentric andare numbered 1, 2, 3, 4, etc., and the smallershells, closer to the nucleus, must become fullbefore electrons will be found in orbitals inhigher, or larger, shells. Shell 1 is full with one(1s) orbital. The total number of electrons inshell 1, when it is full, then, is two. Shell 2 is
Figure 2-3(a) 1s orbital.
Figure 2-3(b) 1s and 2s orbital.

32 Industrial Waste Treatment Handbook
full when it contains four (one 2s and three 2p)orbitals. Thus, a full shell 2 contains eight elec-trons. Figure 2-5 shows an atom with the fiveorbitals of lowest energy level. The 1s orbital
resides within shell 1, and the 2s, 2px, 2py, and2pz orbitals reside within shell 2. The center ofthe nucleus coincides with the origin of thethree axes.
Figure 2-4(a) 2px orbital.
Figure 2-4(b) 2py orbital.
Figure 2-4(c) 2pz orbital.


34 Industrial Waste Treatment Handbook
Carbon, the next larger element, has six pro-tons and six electrons. Carbon must thereforelose four electrons or gain four to attain a fullouter electron shell. In fact, carbon has almostno tendency to do either, but tends to attain afull outer shell by way of a process called elec-tron sharing. Using the electron-sharing mech-anism, carbon can enter into what is known asthe covalent bonding process, as illustrated inFigure 2-6.
Figure 2-6 depicts the formation of methane,CH4, the result of the covalent bonding of fourhydrogen atoms with a single carbon atom.Figure 2-7 shows a carbon atom with each ofthe four valence electrons arranged in space sothat they are as far away from one another asthey can be and still occupy the same electronshell. Some rearranging of orbitals is requiredto make this configuration possible. Becausecarbon has a total of six electrons, it would beexpected, on the basis of the foregoing discus-sion, that two would reside as a pair within the1s orbital, another pair would reside in the 2sorbital, and one unpaired electron would residein each of two 2p orbitals; however, thisarrangement would allow only two covalentbonds, yielding CH2 if those bonds were withhydrogen atoms. This configuration wouldresult in carbon having six electrons in its outershell, whereas eight are required for a full
outer shell. What actually happens, because ofthe very strong tendency for carbon to attain afull outer shell of eight electrons, is that the 2sorbital and the three 2p orbitals form fourhybrid orbitals of equal energy level havingone unpaired electron in each. These fourhybrid orbitals are called sp3 orbitals and areshaped as shown in Figure 2-7. As shown inFigure 2-7, an sp3 orbital has two lobes ofunequal size. The nucleus of the atom residesbetween the two lobes. Figure 2-8 shows thatthe four hybrid sp3 orbitals of a carbon atomare arranged to be as far from one another aspossible. The carbon atom thus attains ashape such that, if straight lines are drawn toconnect the outer limits of each lobe, a tetrahe-dron will be drawn. Thus, carbon atoms aresaid to exist in the shape of a regular (all sidesequal in size) tetrahedron, with one valenceelection available to form a covalent bond ateach corner of the tetrahedron, and with thecenter of the nucleus coinciding with the centerof mass of the tetrahedron. Figure 2-9 shows atwo-dimensional representation of Figure 2-6.Figure 2-10 depicts four hydrogen atoms, eachneeding one additional electron to fill its outershell, combining with each of the four valenceelectrons of the carbon atom to form themethane molecule. The bonds betweenthe hydrogen atoms and the carbon atom that
Figure 2-6 Formation of a molecule of methane.

Fundamentals 35
together makeup the methane moleculeare covalent bonds. Each of the four electronpairs is shared, and the molecule exists as acohesive unit. This is in contrast to com-pounds of lithium, for example. In watersolution, lithium gives up its one valence
Figure 2-7 Configuration of a hybrid sp3 orbital.
electron to another atom—chlorine, forinstance—and exists as the discrete lithiumion, Li+, not physically attached to anotherion. Thus, the principal difference betweencovalent bonds and ionic bonds has beenillustrated.
Figure 2-8 The four sp3 orbitals of an atom of carbon.
Figure 2-9 Two-dimensional representation of a carbon atom showing the four valence electrons.
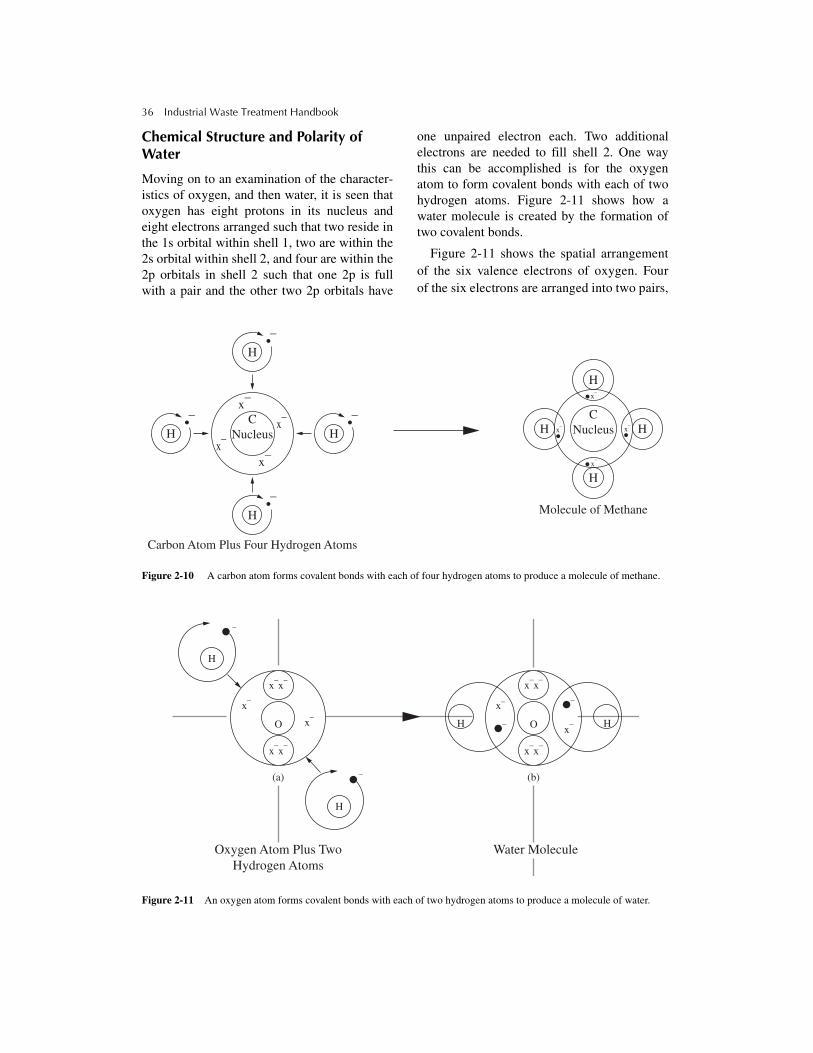
36 Industrial Waste Treatment Handbook
Chemical Structure and Polarity of Water
Moving on to an examination of the character-istics of oxygen, and then water, it is seen thatoxygen has eight protons in its nucleus andeight electrons arranged such that two reside inthe 1s orbital within shell 1, two are within the2s orbital within shell 2, and four are within the2p orbitals in shell 2 such that one 2p is fullwith a pair and the other two 2p orbitals have
one unpaired electron each. Two additionalelectrons are needed to fill shell 2. One waythis can be accomplished is for the oxygenatom to form covalent bonds with each of twohydrogen atoms. Figure 2-11 shows how awater molecule is created by the formation oftwo covalent bonds.
Figure 2-11 shows the spatial arrangementof the six valence electrons of oxygen. Fourof the six electrons are arranged into two pairs,
Figure 2-10 A carbon atom forms covalent bonds with each of four hydrogen atoms to produce a molecule of methane.
Figure 2-11 An oxygen atom forms covalent bonds with each of two hydrogen atoms to produce a molecule of water.
Molecule of Methane
x–
x–
x–
x–
H H H x– x
–
x–
x–
H
H
H
H
Carbon Atom Plus Four Hydrogen Atoms
H
–
–
–
–
CNucleus
CNucleus
O
H
H
x–
x–
(a)
x–x
–
x–x
–
x–x
–
x–x
–
OH H
x–
(b)
Oxygen Atom Plus TwoHydrogen Atoms
Water Molecule
–x
–
–
–
–

Fundamentals 37
and two are arranged so that each can partici-pate in a covalent bond, and thus be included inan electron pair. When the covalent bonds havebeen formed, the resulting four electron pairsarrange themselves to be as far away from oneanother as possible, resulting in another tetra-hedral structure of four sp3 orbitals similar tothat of the carbon molecule. The mutual repul-sion caused by like charges (negative)associated with each of the electron pairscauses them to form the tetrahedral structureand thus be as far away from one another aspossible and still occupy the same electronshell.
There is a difference between the methanemolecule’s tetrahedral structure and that for thewater molecule, for the following reason: In thecase of methane, there are equivalent hydrogenatom-carbon valence electron structures at eachof the four corners. In the case of water, two ofthe corners of the tetrahedral structure containthe hydrogen-oxygen valence electron pair andtwo contain simply an electron pair. There isequal repulsion between the electron pairs inthe case of methane; therefore, a regular tetra-hedron structure results. The structure of themethane molecule is almost perfectly symmet-rical. In the case of water, however, equalrepulsion does not exist between the structuresat the corners of the tetrahedral molecule, and adistorted tetrahedral structure results.
Figure 2-12 shows a slightly different two-dimensional representation of a water mole-cule. Figure 2-12 shows that, in the region ofeach of the two hydrogen atoms that areinvolved in the makeup of each water mole-cule, the electron pair that makes up the cova-lent bond spends most of the time in the spacebetween the oxygen atom and the hydrogen’snucleus. The result is that the positive chargeof each hydrogen nucleus is exposed. Figure2-12 further shows that the two electron pairsthat occupy the corners of the distorted tetrahe-dral structure of the water molecule other thanthe two occupied by hydrogen atoms display anegative charge. Therefore, each water mole-cule is seen to have regions of positive chargeand regions of negative charge. Each watermolecule thus exhibits characteristics of a tiny
magnet, having a negative “pole” and a posi-tive “pole,” and is said to be a polar molecule.Methane, on the other hand, as described pre-viously, has a tetrahedral structure where allfour corners are identical. Methane is thereforesaid to be nonpolar.
The consequence of the polar versus nonpo-lar nature of molecules is well illustrated by theremarkable difference in physical state betweenwater and methane. Water has a molecularweight of 18, and is liquid at room temperature.Methane has a molecular weight of 14, veryclose to that of water, but is a gas at room tem-perature. The reason that such a low-molecular-weight substance as water is liquid at roomtemperature is illustrated in Figure 2-13.Figure 2-13 shows that water molecules, actinglike tiny magnets, attract each other, whereasmethane molecules, having no polar properties,have no attraction for one another. The result inthe case of water is that the space between mol-ecules is relatively small, compared to thelarger space between methane molecules atroom temperature.
Hydrogen Bonding
The attraction between the positive areas on thehydrogen atoms of each water molecule andthe negatively charged areas that result fromthe two unbonded electron pairs on the oxygenatom of each water molecule is referred to as“hydrogen bonding.” Hydrogen bonding not
Figure 2-12 Relative position of electron pairs on a watermolecule.

38 Industrial Waste Treatment Handbook
Figure 2-13 Strong attractive forces between molecules of water as compared to weak attractive forces between moleculesof methane.
only accounts for water existing as a liquid atroom temperature, but it also accounts for thecapability of water to solvate, or dissolve,many substances; thus, its nickname, “the uni-versal solvent.”
Polar Solvents versus Nonpolar Solvents — True Solutions
A solvent is a medium into which other sub-stances can dissolve. When dissolved, thesesubstances, in accordance with the second lawof thermodynamics (explained following, butbasically states that, “In nature, everythingtends to become randomly distributed.” It takesa force of some kind, which requires energy, tocounteract this tendency), become distributeduniformly throughout the volume of the sol-vent. As illustrated in Figure 2-14, substancesthat ionize into cations and anions are soluble inpolar solvents such as water. Substances that donot ionize, such as oil, are poorly soluble(everything is soluble to some degree, in water)
in polar solvents, but are highly, and in manycases infinitely, soluble in nonpolar solvents.Substances that are polar in nature and there-fore soluble in water are said to be“hydrophilic.” Nonpolar substances are onlysparingly soluble in water and are said to be“hydrophobic.”
The mechanism of solubility of sodium chlo-ride in water can be used to illustrate howhydrophilic substances become dissolved inwater. Sodium chloride is made up of sodiumions, each of which has a single electron in itsouter shell, and chloride ions, each of whichneeds one electron to fill its outer shell.Sodium chloride exists as a crystalline solid inits pure form, and in water, it ionizes to sodiumions and chloride ions (cations and anions,respectively). The positively charged sodiumions are attracted to the negatively chargedsites on water molecules, and the negativelycharged chloride ions are attracted to the posi-tively charged sites on water molecules (hydro-gen bonding).
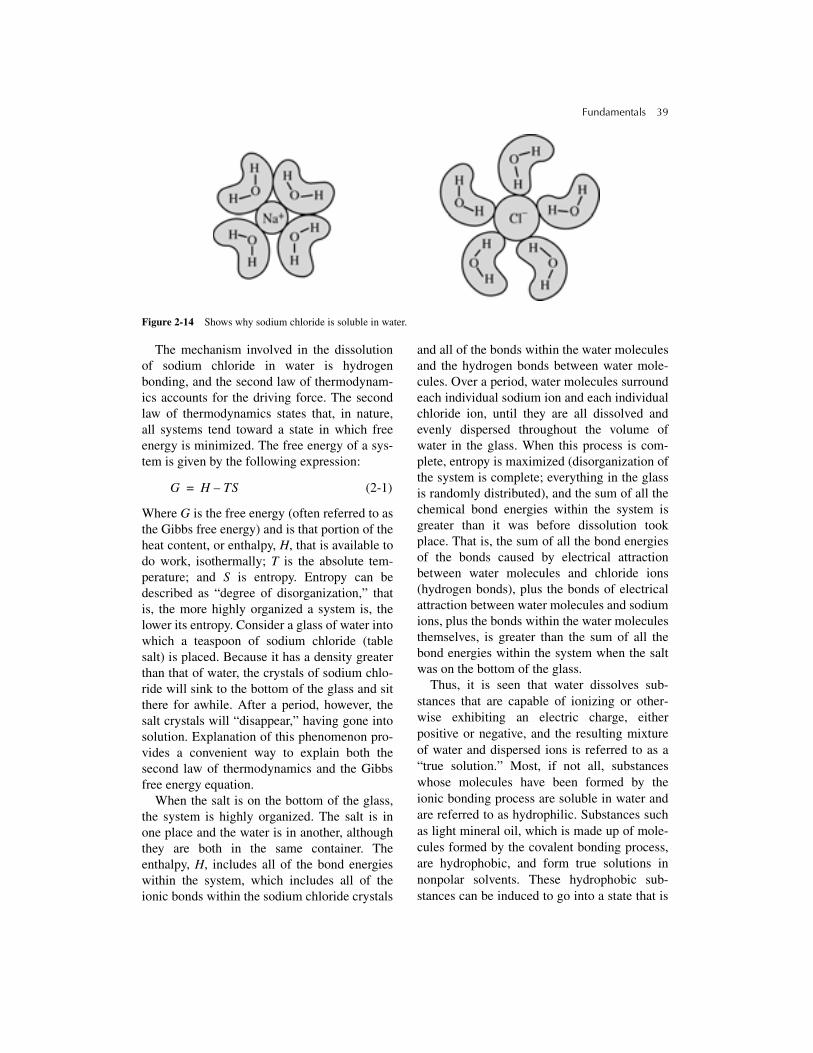
Fundamentals 39
Figure 2-14 Shows why sodium chloride is soluble in water.
The mechanism involved in the dissolutionof sodium chloride in water is hydrogenbonding, and the second law of thermodynam-ics accounts for the driving force. The secondlaw of thermodynamics states that, in nature,all systems tend toward a state in which freeenergy is minimized. The free energy of a sys-tem is given by the following expression:
(2-1)
Where G is the free energy (often referred to asthe Gibbs free energy) and is that portion of theheat content, or enthalpy, H, that is available todo work, isothermally; T is the absolute tem-perature; and S is entropy. Entropy can bedescribed as “degree of disorganization,” thatis, the more highly organized a system is, thelower its entropy. Consider a glass of water intowhich a teaspoon of sodium chloride (tablesalt) is placed. Because it has a density greaterthan that of water, the crystals of sodium chlo-ride will sink to the bottom of the glass and sitthere for awhile. After a period, however, thesalt crystals will “disappear,” having gone intosolution. Explanation of this phenomenon pro-vides a convenient way to explain both thesecond law of thermodynamics and the Gibbsfree energy equation.
When the salt is on the bottom of the glass,the system is highly organized. The salt is inone place and the water is in another, althoughthey are both in the same container. Theenthalpy, H, includes all of the bond energieswithin the system, which includes all of theionic bonds within the sodium chloride crystals
and all of the bonds within the water moleculesand the hydrogen bonds between water mole-cules. Over a period, water molecules surroundeach individual sodium ion and each individualchloride ion, until they are all dissolved andevenly dispersed throughout the volume ofwater in the glass. When this process is com-plete, entropy is maximized (disorganization ofthe system is complete; everything in the glassis randomly distributed), and the sum of all thechemical bond energies within the system isgreater than it was before dissolution tookplace. That is, the sum of all the bond energiesof the bonds caused by electrical attractionbetween water molecules and chloride ions(hydrogen bonds), plus the bonds of electricalattraction between water molecules and sodiumions, plus the bonds within the water moleculesthemselves, is greater than the sum of all thebond energies within the system when the saltwas on the bottom of the glass.
Thus, it is seen that water dissolves sub-stances that are capable of ionizing or other-wise exhibiting an electric charge, eitherpositive or negative, and the resulting mixtureof water and dispersed ions is referred to as a“true solution.” Most, if not all, substanceswhose molecules have been formed by theionic bonding process are soluble in water andare referred to as hydrophilic. Substances suchas light mineral oil, which is made up of mole-cules formed by the covalent bonding process,are hydrophobic, and form true solutions innonpolar solvents. These hydrophobic sub-stances can be induced to go into a state that is
G H TS–=

40 Industrial Waste Treatment Handbook
equivalent in many ways to a water solution, bya process known as emulsification. An emul-sion is equivalent to a solution in that it con-sists of a stable mixture that will not separateunder quiescent conditions. A sample takenfrom anywhere within the volume of the mix-ture is representative of the mixture as a whole,and as the mixture flows from one place toanother, it does not change in character. Atleast two processes can produce such a mix-ture; both can be referred to as emulsification.
Emulsification
Pure hexane is a liquid that is sparingly solublein water. It is composed of a six-carbon chainhaving hydrogen atoms bonded by covalentbonds at all bonding sites other than thoseinvolved in the six-carbon chain. Figure 2-15depicts a hexane molecule.
Hexane has a molecular weight of about 86and exists as a liquid at room temperature. Verysmall electrical attractive forces exist betweenmolecules, resulting from the fact that, at thesite of any given hydrogen atom bonded bycovalent bonds to a carbon atom, when both ofthe electrons involved in the bond are locatedbetween the hydrogen and the carbon, thenucleus of the hydrogen atom presents apositively charged site on the molecule. Figure2-16 depicts this state.
Figure 2-15 A single molecule of hexane.
Figure 2-16 Carbon-hydrogen covalent bond exhibitingpositive charge.
In fact, the two electrons involved ineach hydrogen-carbon bond are in continuousorbital motion around the hydrogen nucleus, sothe time during which the positively chargednucleus is exposed is very brief, it is intermit-tent, and the strength of the charge is relativelyweak. In exactly the same fashion, when one orboth of the electrons involved in any givenhydrogen-carbon bond are on the side of thehydrogen nucleus that is away from the carbonatom, a negative charge is presented to the sur-rounding environment. At any given instant,then, there is a probability that there will beone or more positively charged sites on eachhexane molecule and one or more negativelycharged sites, and there will be an electrical, ormagnetic-type attraction between hexane mole-cules. These charged sites are much weakerthan those involved in the hydrogen bondingthat is characteristic of water, however; there-fore, hexane is sparingly soluble in water.
Hexane can be emulsified in water, however,and the result is, for practical purposes, equiva-lent to true solution as far as industrial waste isconcerned. There are at least two ways toaccomplish emulsion. One way is to use anemulsifying agent, such as a detergent. Thesecond way is to mix hexane and watertogether vigorously. The mechanisms of thesetwo methods for forming an emulsion areexplained as follows.
Forming an Emulsion with an Emulsifying Agent Figure 2-17 presents a representation of a typi-cal detergent.
The detergent molecule shown in Figure 2-17consists of two active components, a group thatwill ionize in water, in this case the sulfonategroup (-S=O−), and a group that is nonpolar innature and is therefore attracted to, andsoluble in, organic material such as fats,oils, and greases. Figure 2-18 depicts the pro-cess by which detergent molecules form a linkbetween water and substances that are onlysparingly soluble in water (note—dirt usuallyadheres to a thin film of oil on skin, clothing,etc.).
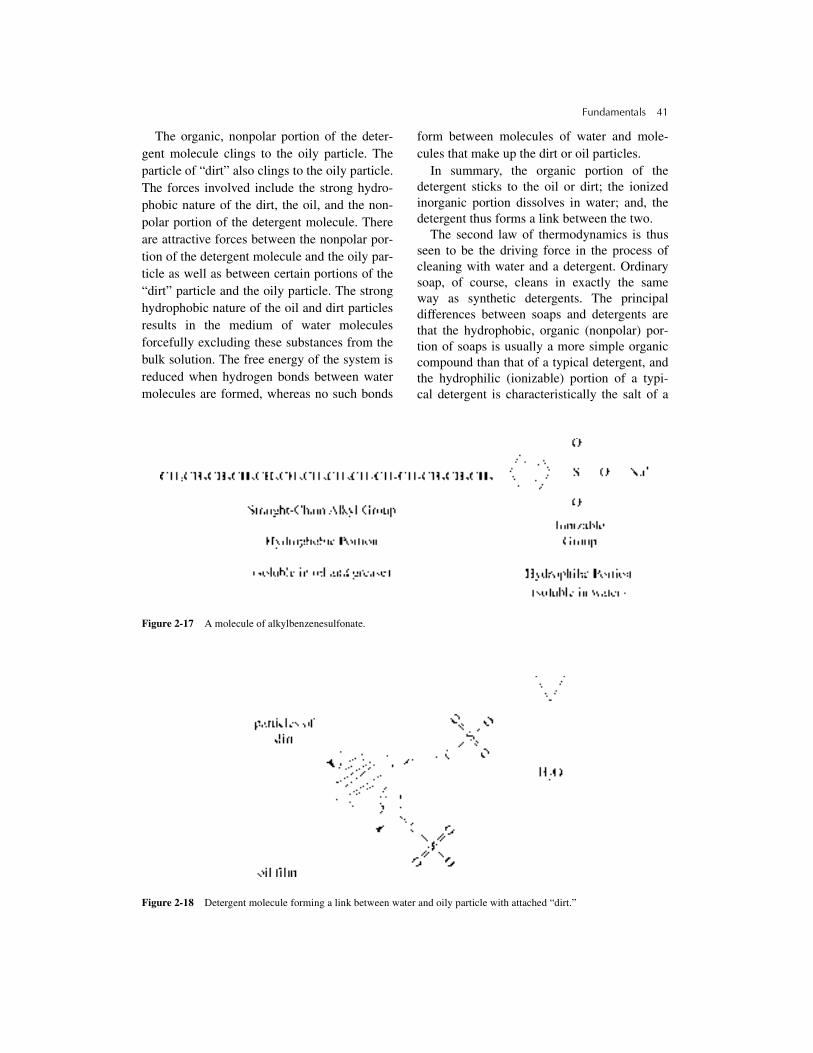
Fundamentals 41
The organic, nonpolar portion of the deter-gent molecule clings to the oily particle. Theparticle of “dirt” also clings to the oily particle.The forces involved include the strong hydro-phobic nature of the dirt, the oil, and the non-polar portion of the detergent molecule. Thereare attractive forces between the nonpolar por-tion of the detergent molecule and the oily par-ticle as well as between certain portions of the“dirt” particle and the oily particle. The stronghydrophobic nature of the oil and dirt particlesresults in the medium of water moleculesforcefully excluding these substances from thebulk solution. The free energy of the system isreduced when hydrogen bonds between watermolecules are formed, whereas no such bonds
form between molecules of water and mole-cules that make up the dirt or oil particles.
In summary, the organic portion of thedetergent sticks to the oil or dirt; the ionizedinorganic portion dissolves in water; and, thedetergent thus forms a link between the two.
The second law of thermodynamics is thusseen to be the driving force in the process ofcleaning with water and a detergent. Ordinarysoap, of course, cleans in exactly the sameway as synthetic detergents. The principaldifferences between soaps and detergents arethat the hydrophobic, organic (nonpolar) por-tion of soaps is usually a more simple organiccompound than that of a typical detergent, andthe hydrophilic (ionizable) portion of a typi-cal detergent is characteristically the salt of a
Figure 2-17 A molecule of alkylbenzenesulfonate.
Figure 2-18 Detergent molecule forming a link between water and oily particle with attached “dirt.”

42 Industrial Waste Treatment Handbook
strong acid (sodium sulfonate, for instance),whereas it is usually the salt of a weak acid(sodium carbonate, for instance) in the case ofsoaps.
Figure 2-19 shows how oil and other nonpo-lar substances can be held in a solution-like sus-pension, referred to as an emulsion, by anemulsifying agent such as a synthetic detergent.
Forming an Emulsion by Vigorous Mixing Figure 2-20 shows an emulsion of a light oil inwater. By vigorous mixing, as in a kitchenblender, the oil has been separated into veryfine droplets. There is an electric charge on thesurface of each oil droplet. This charge can be
either positive or negative, depending on thetype of oil and whatever ions or other sub-stances exist in the water that adhere to thesurface of the oil droplets, but is almost alwaysnegative.
The fact that the charge is of the same typeon all droplets causes mutual repulsionbetween the droplets. This mutual repulsionis the source of stability of the emulsion. Atleast two forces tend to destabilize the emul-sion, and cause the oil and the water to sepa-rate into distinct phases. Gravity is one force.If the oil is less dense than water, gravitytends to cause the water to sink below allof the oil, resulting in the oil forming a
Figure 2-19 Emulsion by use of an emulsifying agent.
Figure 2-20 Emulsion by vigorous mixing.

Fundamentals 43
separate layer on top of the water. Gentle mix-ing tends to cause the droplets of oil to collide,whereupon the droplets would coalesce untilfinally the oil would form a completely sepa-rate phase over or under the water, dependingon its density. If the mutually repulsive forcescaused by similar surface charges on thedroplets are sufficiently strong, then the desta-bilizing forces will not prevail, and theemulsion will remain stable.
Colloidal Suspensions
A third type of industrial wastewater mixture,in addition to true solutions (pollutants dis-solved in water) and emulsions (pollutantssuspended in water by emulsification) is thecolloidal suspension. In all three types ofwastewater mixture, the pollutants are held inthe water medium by electrical forces. Theforces are those of attraction in the case of truesolutions and are those of repulsion in the caseof both emulsions and colloidal suspensions. Infact, colloidal suspensions are essentially iden-tical to emulsions formed by vigorous mixing,described in the previous section, in that thesource of stability for the mixture, mutualrepulsion by like electric charges, results fromdissociated bonds (i.e., the resulting sites ofattraction and/or cohesion). Figure 2-21 illus-trates the source of stability of colloidalsuspensions of clay. Figure 2-21 illustrates thephysical structure of clay as an indefinitely
extended sheet of crystalline hydrous alumi-num silicate. Many of the chemical bondswithin the crystal lattice structure are covalent.This arrangement of silicon, aluminum, oxy-gen, and hydrogen atoms results in a relativelystrong negative charge on each flat surface ofthe “indefinitely extended sheet.” This chargeattracts cations, such as magnesium, alumi-num, ferrous and ferric, potassium, etc., andthese cations attract individual sheets togetherto make up an indefinitely extended three-dimensional structural mass of clay.
When the clay is pulverized into very small(colloidal-sized) particles, the pulverizing pro-cess amounts to the dissociation of countlessbonds, whereby each dissociated bond resultsin a site having a negative charge. Each of thesesites contributes to an electric charge surround-ing the surface of each particle, and if the parti-cles are mixed into water, the particles repeleach other. After the mixing has taken place,three important forces act on the suspension:(1) gravity acts to cause the particles to settle tothe bottom of whatever contains the suspen-sion; (2) Brownian and other forces, referred toas “thermal agitation,” keep the particles inceaseless motion, tending to make them collide(These collisions, if successful, would result incoalescence, reversing the dispersal process.);and (3) repulsive forces caused by like electriccharges on the surface of each particle tend toprevent collisions, and even settling caused bythe force of gravity. If the surface charges are
Figure 2-21 Source of the negative charge that is present on the surface of particles of clay.
Si Si
Al
= Oxygen = Hydroxyl groupSi = SiliconAl = Aluminum
H2O
−
− − −

44 Industrial Waste Treatment Handbook
strong enough to overcome the force of gravityas well as the forces of thermal agitation, thenthe particles will be successfully held awayfrom each other, and the colloidal suspensionwill be stable.
The principal difference, therefore, betweenan emulsion and a colloidal suspension as theyrelate to industrial wastes, is that the sus-pended substance, or “pollutant,” in an emul-sion is a liquid under ambient conditions,whereas the pollutant in the case of a colloidalsuspension is a solid. Substances in addition toclays that form colloidal suspensions includethose substances that do not readily dissolveinto ions in water, and are therefore “insolu-ble” (meaning only sparingly soluble, or verypoorly soluble), but can be pulverized into verysmall particles having a surface charge. Almostany substance that exists as a solid at roomtemperature, but will not dissolve to any greatextent in water, can be made to form a colloidalsuspension.
Mixtures Made Stable by Chelating Agents
Most metal ions are soluble in water withincertain pH ranges and are quite insoluble outsidethe appropriate pH range. Even within the opti-mum pH ranges for solubility, however, mostmetals are soluble to only a limited extent. Cer-tain chemical agents, called “chelating agents,”are able to “hold” metal ions in “solution” overbroad ranges of pH, inside as well as outside theoptimum pH ranges for solubility, at concentra-tions far in excess of their solubility limits. Theseagents, whose name derives from the Greekword “chele,” which means “claw,” have phys-ical structures that accommodate, or “fit,” themetal cations, like an object in the grip of a claw,and thus “seize,” or “sequester,” them to preventthem from forming insoluble salts or hydroxideswith anions or to enter into ion exchange reac-tions. Chelating agents can be inorganic, forinstance, polyphosphates (the active ingredientin Calgon), or they can be organic, for instance,EDTA (ethylenediaminetetraacetic acid). Typi-cally, a chelating agent consists of “ligand”atoms, for instance, oxygen, nitrogen, or sulfur,
which have available two electrons to form a“coordinate” bond with the metal ion. The ligandportion of the chelating agent bonds the cation,and the “claw” structure protects the cation fromother chemical influences.
Summary
Wastewater can be described as a mixture ofundesirable substances, or “pollutants,” in water.If the mixture is stable, the pollutants will not set-tle out of the water under quiescent conditionsunder the influence of gravity; and one or moretreatment processes, other than plain sedimen-tation, must be used to render the water suitableto be returned to the environment. The key todetermining an efficient, effective treatment pro-cess lies in the ability to recognize what forcesare responsible for the stability of the mixture(unless biological treatment is to be used). Thischapter has described five general types of mix-tures: (1) true solutions, where the stability arisesfrom hydrogen bonding between water mole-cules and the electrical charge associated witheach ion; (2) emulsions caused by emulsifyingagents, where stability is provided by an agent,such as a detergent, that links small droplets ofa liquid substance to water by having one portionof the agent dissolved in the water and anotherdissolved in the droplets of suspended liquid pol-lutant; (3) emulsions in which the stability of amixture of small droplets of a liquid pollutant inwater arises from the repulsion caused by likeelectric charges on the surface of each droplet;(4) colloidal suspensions in which small parti-cles of a nonsoluble solid are held away fromeach other by the repulsive forces of like electriccharges on the surface of each solid particle; and(5) solutions in which ions that would not nor-mally be soluble in water under the prevailingconditions are held in solution by so-calledchelating agents.
In each of the five cases, the most efficientway to develop an effective treatment schemeis to directly address the force that is responsi-ble for the stability of the wastewater mixture.Chapters 6 and 8 present the details of this sug-gested approach.

Fundamentals 45
Examples
The following descriptive examples areintended to show how a working knowledge ofthe foregoing fundamental concepts can beused to quickly deduce the proper technologiesfor efficiently treating different types of indus-trial wastewater.
Poultry Processing Wastewater The processing of poultry involves receivinglive birds and preparing them for sale in foodstores. As shown in Figure 2-22, a typical poul-try processing operation includes at least sixoperations in which water is used, contami-nated, then discharged, plus washdown forplant clean-up. Several of the operationsinvolve water having direct contact with thebirds as they are being processed (defeathered,washed, eviscerated, washed again, chilled,then cut up if desired), leading one to expectthat any and all of the component materials ofchicken flesh and blood will be found in thewastewater. These component substanceswould be expected to include blood cells, fatsand oils, protein materials, and suspended sol-ids of various makeup, including “dirt.”
Most of the materials in the wastewaterwould be expected to be organic in nature, andtherefore biodegradable. For this reason, a bio-logical treatment process, aerobic or anaerobic,would appear to be a good choice for treat-ment. Laboratory analyses of the combinedwastewater from a typical poultry processingplant, however, as shown in Table 2-1, revealthat the oil and grease content is relativelyhigh. Also, it is reasonable to expect that muchof the biochemical oxygen demand (BOD)would result from the presence of blood. Poul-try fat is known to be relatively soft, and there-fore more soluble, especially in hot water, thanother animal fats, and would likely exist in“solution” as a colloidal suspension, or emul-sion. The pertinent indication here is thatthe oil and grease component of poultry pro-cessing wastewater would be relatively slowlydegraded by a biological treatment process. Onthe other hand, a combined physical-chemicaltreatment process should work well, becausesurface chemistry holds the fats, oils, andgreases (FOG) in suspension. A gravity separa-tion process should work well once the suspen-sion is destabilized by taking advantage ofsurface chemistry phenomena.
Table 2-1 Characteristics of Raw Wastewater Poultry Processing*
∗Data based on a 34-day average; production averaged 72,000 broilers/day.
Sampling PointFlow
(MGD)BOD
(lb/day)SS
(lb/day)Grease
(1b/day)
Main drain 0.052 430 460 40
New York room
(excluding feather
flush)
Main drain 0.448 1,680 1,140 850
Processing room
Evisceration 0.30 910 930 520
Carriage water
Chiller overflow 0.05 240 150 90
Chiller dump 0.09 440 270 115
Scalder overflow 0.027 200 210 5
Scalder dump 0.015 110 80 2
Washdown (night) 0.36 240 810 750
Total for plant 0.860 2,850 2,410 1,640

46 Industrial Waste Treatment Handbook
A second major component of poultry pro-cessing wastewater is blood. This is obviousfrom Figure 2-22, which shows that two of themajor steps in the processing of poultry arekilling followed by bleeding, and that theseprocesses undergo cleaning by washing withwater each day. Because blood contains redblood cells, which can be described as largeparticles that will not truly dissolve in waterbut will disperse uniformly throughout avolume of water in which it is placed, the con-clusion is that blood must form a stable suspen-sion in water. The stabilizing force in the
suspension of blood is most likely electric sur-face charge; therefore, chemical coagulationwould quickly come to mind as an efficientmethod for its removal.
The previous considerations, taken togetherwith the knowledge that (1) poultry fat has aspecific gravity less than 1.0, and (2) red bloodcells have a specific gravity very close to thatof water, indicate that chemical coagulationfollowed by dissolved air flotation (DAF)should be a very promising candidate technol-ogy for treatment of poultry processing waste-water.
Figure 2-22 Schematic of a poultry processing system.

Fundamentals 47
Wastewater from Metal GalvanizingWastewater from a metal galvanizing processwould be expected to contain dissolved zinc.A quick check of the properties of variouscompounds would reveal that zinc hydroxide,zinc sulfide, and zinc phosphate are all verypoorly soluble in water within certain ranges ofpH. Therefore, treatment of the wastewaterusing caustic, a sulfide compound, or a solublecompound of phosphate would probably all beviable candidates for treatment of the wastewa-ter; however, zinc phosphate is seen to be theleast soluble in the acid pH range and, there-fore, would likely produce a sludge that wouldbe more stable than either the hydroxide or thesulfide. For this reason, treatment of wastewa-ter from a galvanizing process would seemto be best treated by the addition of a solublecompound of phosphorus (phosphoric acid, forinstance, or super phosphate fertilizer). A fur-ther check would reveal that the phosphatecompounds of all metals likely to be present inwastewater from a galvanizing process (iron,lead, nickel, tin) are all very poorly soluble inwater of low pH as well as in the neutral pHrange, further indicating treatment with phos-phorus as a likely optimal treatment approach.
Removal of Heavy Metals from an Industrial Wastewater Containing Dissolved Iron Many industrial wastewaters contain iron aswell as other heavy metals, all of which must beremoved to one degree or another. It is often pos-sible to take advantage of two characteristics ofmetal ions, the first being specific to iron, andthe second being common to many metal ions.
Iron is soluble in water in its plus two valencestate (ferrous form) but is insoluble in its plusthree valence state (ferric form). Moreover, theferrous form can readily be oxidized to the ferricform by contact with atmospheric oxygen (air).Therefore, it is easy to remove iron from waste-water by simply bubbling air through it, whichaccomplishes the conversion of the dissolvedferrous ions to insoluble ferric ions, then provid-ing a slow mix time of 5 or 10 minutes to allowflocculation of the ferric oxide particles, then
passing the mixture through a gravity separationdevice such as a tube or plate settler.
It is a characteristic of nearly all heavy metalions that they are only weakly soluble in waterand tend to adsorb onto the surface of smallparticulates in suspension whenever they areavailable. Iron flocs, precipitated by bubblingair through wastewater containing dissolvedferrous ions, present just such a surface.
On the basis of the previous two characteris-tics of metal ions, an extremely simple andinexpensive system, consisting of an aerationstep, a flocculation step, and a sedimentationstep, can be used to remove the ions of manymetal species to concentrations of between 2and 6 mg/l, which is often a very worthwhilepretreatment prior to ion exchange or anothermore expensive process, which can then beused to polish the wastewater to very low con-centrations suitable for discharge. Theinexpensive pretreatment process can greatlyprolong the life of the more expensive process,resulting in a less expensive total cost.
Wastewater from a Parts Cleaning Process
Wastewater from a parts cleaning processwithin an automobile gear manufacturing facil-ity was shown to contain a high concentrationof oil, but the oil could not be removed in astandard API separator (plain sedimentationdevice). It was determined that treatment ofthis waste stream at the source was desirablebecause the FOG load contributed by thisprocess to the total waste stream from the man-ufacturing facility was so great as to be a causefor failure of the main wastewater treatmentfacility. Investigation of the parts washing pro-cess revealed the presence of a detergent of thesulfonate type, giving rise to the thought thataddition of calcium chloride, an inexpensivesubstance, would result in the formation ofinsoluble calcium sulfonate at the water-solu-ble sulfonate site on the detergent molecule.This caused the oil emulsion, which was stabi-lized by the detergent, to “break,” allowing thedroplets of oil to coalesce, then rise to the sur-face in the API separator, enabling easyremoval.

48 Industrial Waste Treatment Handbook
Bibliography
Seinfeld, J.H., Air Pollution: Physical andChemical Fundamentals, McGraw-Hill,New York, 1975.
Streitwieser, A., Jr., and C.H. Heathcock, Intro-duction to Organic Chemistry, Macmillan,New York, 1985.
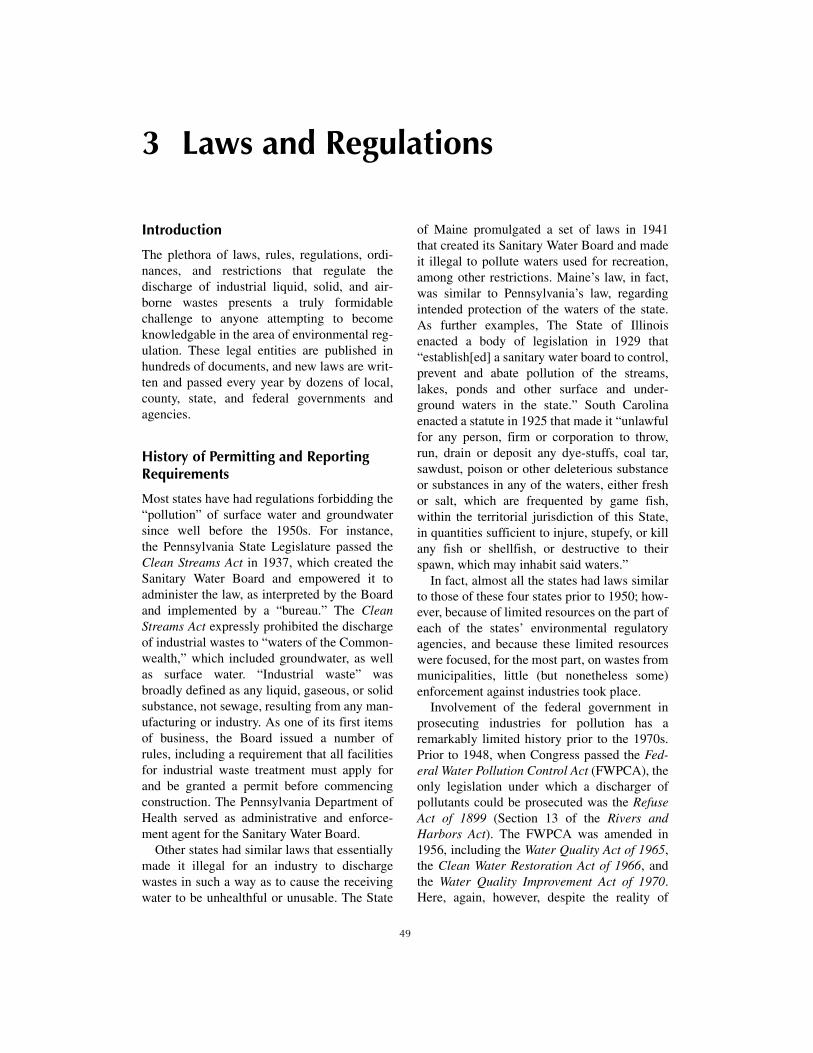
49
3 Laws and Regulations
Introduction
The plethora of laws, rules, regulations, ordi-nances, and restrictions that regulate thedischarge of industrial liquid, solid, and air-borne wastes presents a truly formidablechallenge to anyone attempting to becomeknowledgable in the area of environmental reg-ulation. These legal entities are published inhundreds of documents, and new laws are writ-ten and passed every year by dozens of local,county, state, and federal governments andagencies.
History of Permitting and Reporting Requirements
Most states have had regulations forbidding the“pollution” of surface water and groundwatersince well before the 1950s. For instance,the Pennsylvania State Legislature passed theClean Streams Act in 1937, which created theSanitary Water Board and empowered it toadminister the law, as interpreted by the Boardand implemented by a “bureau.” The CleanStreams Act expressly prohibited the dischargeof industrial wastes to “waters of the Common-wealth,” which included groundwater, as wellas surface water. “Industrial waste” wasbroadly defined as any liquid, gaseous, or solidsubstance, not sewage, resulting from any man-ufacturing or industry. As one of its first itemsof business, the Board issued a number ofrules, including a requirement that all facilitiesfor industrial waste treatment must apply forand be granted a permit before commencingconstruction. The Pennsylvania Department ofHealth served as administrative and enforce-ment agent for the Sanitary Water Board.
Other states had similar laws that essentiallymade it illegal for an industry to dischargewastes in such a way as to cause the receivingwater to be unhealthful or unusable. The State
of Maine promulgated a set of laws in 1941that created its Sanitary Water Board and madeit illegal to pollute waters used for recreation,among other restrictions. Maine’s law, in fact,was similar to Pennsylvania’s law, regardingintended protection of the waters of the state.As further examples, The State of Illinoisenacted a body of legislation in 1929 that“establish[ed] a sanitary water board to control,prevent and abate pollution of the streams,lakes, ponds and other surface and under-ground waters in the state.” South Carolinaenacted a statute in 1925 that made it “unlawfulfor any person, firm or corporation to throw,run, drain or deposit any dye-stuffs, coal tar,sawdust, poison or other deleterious substanceor substances in any of the waters, either freshor salt, which are frequented by game fish,within the territorial jurisdiction of this State,in quantities sufficient to injure, stupefy, or killany fish or shellfish, or destructive to theirspawn, which may inhabit said waters.”
In fact, almost all the states had laws similarto those of these four states prior to 1950; how-ever, because of limited resources on the part ofeach of the states’ environmental regulatoryagencies, and because these limited resourceswere focused, for the most part, on wastes frommunicipalities, little (but nonetheless some)enforcement against industries took place.
Involvement of the federal government inprosecuting industries for pollution has aremarkably limited history prior to the 1970s.Prior to 1948, when Congress passed the Fed-eral Water Pollution Control Act (FWPCA), theonly legislation under which a discharger ofpollutants could be prosecuted was the RefuseAct of 1899 (Section 13 of the Rivers andHarbors Act). The FWPCA was amended in1956, including the Water Quality Act of 1965,the Clean Water Restoration Act of 1966, andthe Water Quality Improvement Act of 1970.Here, again, however, despite the reality of

50 Industrial Waste Treatment Handbook
federal laws, actual prosecution of industriesfor polluting was very limited before the 1970s.
Development of the intense regulatory cli-mate that industrialists must operate withinduring the 2000s began with passage of the1972 amendments to the Clean Water Act, Pub-lic Law 92-500 (PL 92-500), which replacedthe entire language of the original 1956 act,including all amendments. This comprehensivelegal milestone had the broad objective ofreturning all bodies of water in the UnitedStates to a condition where they could safelyand enjoyably be fished in and swum in, withina few years of passage of the law itself. Manyrivers, streams, and lakes at that time were vir-tually open sewers, and it was rare that any sig-nificant water body within the bounds ofcivilized development was not polluted, simplybecause of the lack of enforcement of existinglaws, both state and federal, which resultedfrom a basic lack of resources on the part ofenforcement agencies.
As an example of the prevailing attitudetoward clean water during the 1940s, a foot-bridge was built across a major river so work-ers could walk from a town to a large integratedpulp and paper mill in the Northeast. A garbagechute was built into the side of the footbridgeas a convenience to these workers so they couldcarry bags of household trash and garbage ontheir way to work and simply drop them intothe river.
There is, however, a tendency to over-extrap-olate the apparent indifference toward pollutionof the environment that prevailed prior to the1970s. Synthetic organic chemicals having ahigh degree of toxicity were not widely avail-able and not widely recognized as a threat toenvironmental quality before the 1960s. Theprevailing thought was that all garbage andother household wastes were biodegradable,and would ultimately “disappear,” and eventu-ally be incorporated into the environment“from whence it came.” The Superfund sitesand other problems of gross environmentaldegradation of the 1980s and 1990s, for themost part, involved synthetic chemicals such asPCBs, pesticides, herbicides, and chlorinatedhydrocarbons.
In addition to the unacceptable state of thenation’s waterways, a significant portion of thenation’s groundwater became contaminated byunregulated deposition of solid as well as liq-uid wastes in open, unlined dumps. Much ofthis material was toxic. Beginning in the 1980s,several lawsuits were brought against indus-tries whose waste disposal practices resulted incontamination of groundwater supplies thatserved entire cities.
Inadequately controlled release of air pollut-ants has degraded the quality of air in theUnited States to the point where significantnumbers of people with respiratory illnesseshave been pushed to the point of death andmany thousands of others have suffered healthimpairment. Visibility has become substan-tially reduced in many regions of the country. Ithas even reached the point where nations havethreatened legal action against other nationsbecause of massive quantities of air pollutantsthat have crossed international boundaries. Aswith the quality of the nation’s water resources,a low point was reached during the 1970s and1980s, and because of the installation and oper-ation of control technologies, the overall qual-ity of air in most regions of the United Stateshas improved. There are still many regions thathave unsatisfactory air quality, however, andthe business of air quality protection is a robustone.
Water Pollution Control Laws
The foundation of all federal, state, and localwater pollution control laws and regulationscontinues to be PL 92-500, the 1972 amend-ments to the Clean Water Act. Before passageof this watershed legislation, water pollutioncontrol laws were based on an approach thatfocused on water quality standards and effluentlimitations tailored to those standards. Thedegree of treatment required of a given indus-trial discharger depended on the assimilativecapacity of the receiving water body. The foun-dation of this approach was that the “solutionto pollution is dilution,” and the amount ofdilution available was the basis of the degree of
Laws and Regulations 51
treatment required. One doctoral thesis, writtenduring the late 1960s, used dissolved oxygenmonitors in a river to control a valve to regulatethe rate of discharge from an industrial facility.The flow of treated industrial wastewater to theriver was from a reservoir into which the efflu-ent from the treatment plant flowed. Treatedwastewater would build up in volume in thereservoir when the allowable discharge to theriver was low, and the reservoir would emptyinto the river during periods when the allow-able discharge rate (as indicated by a relativelyhigh concentration of dissolved oxygen in theriver) was high.
The approach used in developing modernenvironmental protection laws was to requireequal treatment by all dischargers, regardlessof the assimilative capacity of the receivingwater. The assimilative capacity of the receiv-ing water took on a different role, which wasthat of an indicator of minimum degree oftreatment required as opposed to its former roleas an indicator of maximum degree of treat-ment required. The modern use of mathemati-cal water quality models determines if the“categorical standard” requirement for wastetreatment will ensure that the water body neverviolates legislated quality standards. If themodel indicates a potential violation, thenadditional treatment is typically required.
PL 92-500 has been amended several timessince 1972 and is a comprehensive law that isdifficult to summarize in a few pages. Some ofthe more important requirements are identifiedin the following statements:
• All dischargers must have a permit underthe National Pollutant Discharge Elimina-tion System (NPDES). The permits havethree major parts: (1) effluent limitations,(2) compliance schedules, and (3) monitor-ing and reporting requirements.
• All dischargers are required to treat waste-water to a specified degree, as a minimum.If there are hazardous wastes involved, addi-tional requirements must be complied with.
• Each industry has been classified under theStandard Industrial Classification (SIC).One of the principal purposes of the SIC is
to maintain uniformity of requirementsamong industries of the same type to pre-vent a competitive disadvantage on the partof any individual industrial plant.
• Within each SIC category, a study, leadingto production of a guidance document calleda “development document,” has been car-ried out. Each development documentidentifies typical characteristics of wastewa-ter from that industry, discusses methods forminimizing waste production, and definesachievable as well as acceptable levels ofwastewater treatment.
• Penalties for noncompliance are set forth.
• Industries that discharge to publicly ownedtreatment works (POTWs) are regulated bythe so-called Pretreatment Regulations. ThePretreatment Regulations are published inpart 403 of PL-92-500.
• Receiving waters for which the provisionsof PL 92-500 are applicable include all riv-ers, streams, brooks, creeks, lakes, ponds,bogs, swamps, territorial seas within the3-mile limit, as well as wetlands, drainageditches, and intermittent streams. In short, ifa receiving body of water has a free surfacethat is open to the atmosphere, it is wise toassume that the provisions of PL 92-500apply.
• Discharge of toxic substances is regulatedunder separate provisions from discharge ofconventional substances.
• In 1983, an amendment was enacted thatrequired each state to adopt an anti-degrada-tion policy, known as “anti-backsliding,”and to identify methods of implementing it.
• Nonpoint sources of pollution, includingstormwater runoff from industrial sites, areregulated.
• Combined sewer overflows are regulated.
• Development and implementation of area-wide waste treatment management plans areauthorized.
• Water quality standards and implementationplans for achieving those standards for eachwater body are required.
52 Industrial Waste Treatment Handbook
• If the desired quality in the receiving water(water quality standard) cannot be achievedby the so-called categorical effluent limita-tions for a given discharger, then additionaltreatment is required.
• New sources are held to more restrictive dis-charge limitations than sources that were inexistence at the time of passage of the law.
• Before an NPDES permit can be granted,the industry must obtain a discharge permitfrom the appropriate state.
Each state has its own body of water pollu-tion control laws. Any of the individual states’laws and/or regulations can be more restrictivethan the comparable federal law or regulation;however, it would be meaningless if a state wereto promulgate a law or regulation having lessrestrictive requirements than the federal law.
The provisions of the federal Clean WaterAct as amended are such that any given statecan be authorized to administer the federal law.In fact, most states do. In these cases, applica-tion for discharge permits under federal law(NPDES permit) and state law are doneconcurrently.
Groundwater Pollution Control Laws
By Adam Steinman
Whereas PL 92-500 is primarily addressed tothe protection of the quality of waterways,other laws have been promulgated that haveprotection of the ground, the groundwater, andthe air as primary objectives. The primary fed-eral law that is addressed to the protection ofboth the groundwater and the ground itself isthe Resource Conservation and Recovery Act(RCRA), (PL 94-580), passed by the U.S. Con-gress in 1976, which places restrictions ondisposal of substances on or in the ground. Itthereby restricts activities that would lead topollution of the ground, directly, and thegroundwater, via the formation of leachate andsubsequent percolation down through the soilto the groundwater. RCRA also protects thegroundwater by prohibiting deposition ofwastes directly therein.
RCRA, as amended, also defines the term,“hazardous waste,” and identifies substances towhich this term is to be applied. These defini-tions are discussed in Chapter 6 of this text.Disposal of all solid wastes, as well as contain-erized liquids, can be done only as allowed inthe provisions of RCRA.
RCRA completely replaced the Solid WasteDisposal Act of 1965, and supplemented theResource Recovery Act of 1970. RCRA wasamended extensively in 1980 and again in1984, by the Hazardous and Solid WasteAmendments (HSWA).
The principle objectives of RCRA are to:
• Promote the protection of human health andthe environment from potential adverseeffects of improper solid and hazardouswaste management.
• Conserve material and energy resourcesthrough waste recycling and recovery.
• Reduce or eliminate the generation of haz-ardous waste as expeditiously as possible.
RCRA authorizes the EPA to regulate thegeneration, management, treatment, storage,transportation, and disposal of hazardouswastes, solid wastes, and underground storagetanks. This authorization is put forth in theform of nine subtitles, three of which containthe specific laws and regulations that industrialfacilities must operate in compliance with.Subtitles C and D contain the programs for haz-ardous wastes and nonhazardous wastes,respectively. Subtitle I contains the program forunderground storage tanks.
Subtitle C authorizes the EPA to:
• Promulgate standards governing hazardouswaste generation and management.
• Promulgate standards for permitting hazard-ous waste treatment, storage, and disposalfacilities (TSDs).
• Inspect hazardous waste managementfacilities.
• Enforce RCRA standards.
• Authorize states to manage the RCRA Sub-title C program, in whole or in part, within

Laws and Regulations 53
their respective borders, subject to EPAoversight.
Through RCRA, as amended, then, eachstate is both required and authorized to setup and administer regulations that governthe generation, use, and ultimate fate of allsubstances that fall within the definition of“hazardous.”
The 1986 amendment to RCRA, HSWA,mentioned previously, adds requirements forhandling and disposal of present wastes andregulates the clean-up of problems resultingfrom past disposal of solid (including hazard-ous) wastes.
TheComprehensive Environmental Response,Compensation, and Liability Act (CERCLA) andthe 1986 Superfund Amendments and Reautho-rization Act (SARA) are bodies of legislation inaddition to RCRA and HSWA, upon which solid(including hazardous) wastes are regulated.CERCLA and SARA provide for and regulate theclean-up and restoration of abandoned hazardouswaste disposal sites.
Among the more prominent provisions ofRCRA is the requirement to document the loca-tion and movement of all hazardous materials.Known as “cradle-to-grave” documentation,this section of RCRA requires that a manifest,or written record, accompany all hazardousmaterials from creation to disposal. An exam-ple manifest is shown in Chapter 6. RCRA’score regulations establish the “cradle-to-grave”program through the following major sets ofrules:
• Identification and listing of regulated haz-ardous wastes (Part 261)
• Standards for generators of hazardouswastes (Part 262)
• Standards for transporters of hazardouswastes (Part 263)
• Standards for owners/operators of hazard-ous waste TSD facilities (Parts 264, 265,and 267)
• Standards for the management of specifichazardous wastes and specific types of haz-ardous waste management facilities (Part266)
• Land disposal restrictions (Part 268)
• Requirements for the issuance of permits tohazardous waste facilities (Part 270)
• Standards and procedures for authorizingstate hazardous waste programs to be oper-ated in lieu of the federal program (Part271)
The EPA may authorize a state to administerand enforce its hazardous waste program inlieu of the federal Subtitle C program (pursuantto section 3006 of RCRA). For a state to receiveauthorization for its program, its rules must:
• Be consistent with and no less stringent thanthe federal program.
• Provide adequate enforcement to ensurecompliance with Subtitle C requirements.
In practical terms, state programs must fol-low the same general approach and be at leastas stringent as federal hazardous waste rules.State law must include penalties that are atleast equal to federal penalties (although thepenalties don’t have to be identical); and stateenforcement activities must be equivalent tothose performed by the EPA. Because staterules can be more stringent than federal rules,and each state’s rules are somewhat different,large corporations having manufacturing plantsor other facilities in more than one state mustmake accommodation for the differences.
States have generally received authorizationincrementally, consistent with the gradualimplementation of the federal RCRA program.This is because of the unavoidable lag betweenfederal promulgation of Subtitle C standardsand adoption of similar standards by the states.Consequently, a state may be authorized toadminister and enforce its programs regulatingcertain types of waste management units andpractices within the state, but it may not beauthorized for other types of units. Typically,states are more likely to be authorized toenforce rules adopted pursuant to RCRA thanrules adopted pursuant to HSWA. As a result,some facilities in a state may be subject to stateenforcement, whereas others are subject to fed-eral enforcement through EPA regional offices.
54 Industrial Waste Treatment Handbook
Some facilities may be subject to joint federal/state enforcement.
Some federal rules do not apply in a statewith an authorized program until the stateadopts those federal rules. Federal rules thatare adopted under HSWA apply as a matter offederal law when they are promulgated, evenif a state’s rules have not incorporated them;however, only the EPA may enforce theserules.
In general, when a facility is subject to jointfederal/state authority, compliance inspectionsmay be conducted by the EPA, the state, orboth.
Any industrial establishment that generateshazardous wastes and intends to dispose ofsome or all of them on the land is subject tocertain requirements referred to, collectively, as“land disposal restrictions” (LDRs). All gener-ators are required to determine the concentra-tions of certain constituents in their wastes.Depending on the constituents present and theirconcentrations, generators may be required totreat their wastes, or the residues from treat-ment of these wastes, using certain specifiedtechnologies. This requirement, referred to asthe “Universal Treatment Standards,” is con-tained in 40 C.F.R. §268.42. In order to deter-mine which treatment standard is applicable,the generator must determine whether a listedwaste exhibits any characteristic (40 C.F.R.§262.11[c]) and, if it does, the listed wastetreatment standard specifically addresses thecharacteristic. For example, F005 wastes arelisted for both toxicity and ignitability. Fortreatment standard purposes under 40 C.F.R.Part 268, the waste must be considered asF005/D001 because the F005 treatment stan-dard does not specifically address ignitability.
If a waste is restricted, the generator mustcertify, on a land disposal restriction notifica-tion form that accompanies the hazardouswaste manifest, whether it:
• Meets applicable treatment standards orexceeds applicable prohibition levels at the“point of generation”
• Can be land disposed without furthertreatment
• Is subject to a “national capacity variance”or a “case-by-case extension”
A generator of hazard waste may not rely ontransporters or TSD facilities to make determi-nations regarding land disposal restrictions onthe wastes it generates. The regulations areclear that the responsibility for these determi-nations rests solely with the generators them-selves. Although this does not appear to be awidely known or appreciated reality, it is veryimportant. If a transporter or TSD facilityneglects to make a determination, or makes anincorrect determination, the generator is sub-ject to enforcement for violating LDR rules. Ifa facility treats hazardous waste to meet appli-cable treatment standards, then it must developand make available a written waste analysisplan. The plan must describe how the proce-dures it uses comply with the LDRs (40 C.F.R.§268.7 [a][4]).
The LDRs prohibit dilution from being usedin any way to comply with any of the require-ments or restrictions. The LDR dilution prohi-bition is that:
(a) No one shall in any way dilute a restrictedwaste, or residual from treatment of arestricted waste, as a substitute for ade-quate treatment to achieve compliancewith Subpart D, to circumvent effectivedates, or to circumvent a statutory prohibi-tion under RCRA §3004.
(b) Dilution of wastes that are hazardous onlybecause they exhibit a characteristic in atreatment system that subsequently dis-charges pursuant to a permit issued under§402 of the Clean Water Act (CWA) or pre-treatment of waste discharged under §307of the CWA; or dilution of D003 reactivecyanide waste is permissible unless a spe-cific treatment method is specified as thetreatment standard at 40 C.F.R. §268.42.
For instance, if a waste is hazardous onlybecause it is an acid and therefore exhibits thecharacteristic of corrosivity, and if that wastestream is subsequently treated in a simple pHneutralization system, then further treated in atreatment system that discharges under a CWA
Laws and Regulations 55
permit, mixing that waste with other wastestreams does not constitute prohibited dilutionunder LDR regulations. Furthermore, the resid-uals from that treatment system do not, for rea-sons of only the acid waste stream, have to bemanaged under LDR regulations; however, ifthat same acid waste stream also contains cad-mium, in concentrations that exceed applicableprohibition levels, it does fall under 40 C.F.R.§268.3 and cannot be diluted in any way toachieve compliance with Subpart D. One of thespecific exceptions to the dilution prohibition,however, is that it is permissible to combinewaste streams for centralized treatment ifappropriate treatment of the waste is occurring.Therefore, if the centralized wastewater treat-ment plant has one or more processes that arespecifically designed and operated to removecadmium (as well as other heavy metals), thencombining the waste streams is not consideredinappropriate or prohibited under LDRs.
Air Pollution Control Laws
GeneralThis section presents, first, a brief history ofthe development of air pollution control lawsand regulations, as well as a synopsis of theprovisions of each of the major laws. Then, asynopsis of the laws and regulations that werein effect as of the year 2000, including adescription of the major requirements of theClean Air Act (CAA) that are pertinent to themanagement of discharges to the air fromindustrial facilities, as affected by those regula-tions, is presented.
Before 1963, the only federal law underwhich an industrial facility could be penalized,or otherwise required under law to control(manage) discharges to the air, was under eithergeneral nuisance statutes or public health stat-utes. General nuisance laws had their roots inthe 600-year-old rule of common law—“sicutere tuo, ut alienum non laedas.” (Use yourown property in such a manner as not to injurethat of another.) (Black’s Law Dictionary, 1551[4th ed., 1951].)
Federal involvement in air pollution controlhad humble beginnings in 1955, with passageof the Air Pollution Control Act of 1955, PublicLaw 84-159. This act was very narrow inscope, and because of the reluctance of Con-gress to encroach on states’ rights, consideredprevention and control of air pollution to beprimarily the responsibility of state and localgovernments. In 1955, the federal governmentconsidered itself a resource, as opposed to anenforcer, and this perception was reflected inthe provisions of the Air Pollution Control Act,which were as follows:
• The Public Health Service was mandated toinitiate research on the effects of airpollution.
• There were provisions for:
• technical assistance to the states
• training of individuals in the area of airpollution
• research on air pollution control
Although modest in its impact at the time,the 1955 law served as a wake-up call to statesthat air pollution was to be taken seriously, andthat enforceable laws regulating emission ofpollutants would be forthcoming.
The 1955 law was amended in 1960 to theextent that it directed the surgeon general toconduct research into the health effects of auto-mobile exhaust. A report was submitted in1962, and as a result, the 1955 law was furtheramended to require the surgeon general to con-duct still more research. The result of the fur-ther research was the Clean Air Act of 1963,Public Law 88-206, which has been amendedseveral times, the most dramatic (in fact, earth-shaking) change being the 1970 amendmentsand the present, prevailing law, the 1990amendments.
The Clean Air Act of 1963 provided for:
• A stepped-up research and training program
• A matching grants program whereby statesand local agencies would receive federalassistance in promulgating air pollutionregulation
• The development of air quality criteria

56 Industrial Waste Treatment Handbook
• Federal authority to require abatement ofinterstate flow of air pollutants
The 1963 Clean Air Act designated six pol-lutants as “criteria pollutants,” thought to bethe most important substances affecting thepublic’s health and welfare. These criteria pol-lutants, still regarded as such in the year 2000,were as follows:
• Sulfur dioxide
• Nitrogen oxides
• Carbon monoxide
• Lead
• Ozone
• Particulate matter
The 1990 amendments made additionalsweeping changes, especially with regard toindustrial sources. Title V established a newpermitting system that had the effect of per-manently changing the way environmentalmanagers in industry must do their job.Among the major provisions of Title V aremonitoring and reporting requirements thatare greatly expanded compared to previousrequirements. Now, all “regulated pollutants”must be catalogued, approved treatment equip-ment must be installed, and the equipmentmust be operated in compliance with stan-dards written into the permit. It is alsorequired that compliance monitoring andreporting be carried out. This requirement formonitoring and reporting has been comparedto a (hypothetical) requirement that individualcitizens attach strip chart recorders to their pri-vate automobiles, and then report each speedlimit exceedance.
In addition to the new permitting, monitor-ing, and reporting requirements, the numberof designated hazardous air pollutants (“airtoxics”) (Title III) was increased from 7 to189, and then subsequently (in 1999) reducedby one to 188. Also, significant changes weremade regarding nonattainment areas, emis-sions from automobiles (Title II), and acid rainprovisions (Title IV), all of which are perti-nent to the job of the industrial environmentalmanager.
Air Pollution Control Law, as of the Year 2000Most industrial establishments are regulated bythe Clean Air Act (CAA) as amended in 1990,and as administered by the state, or the localAir Quality Management Agency, in which theindustry operates. Some industrial establish-ments may be regulated by one or more state oragency requirements that are more restrictivethan the CAA. The federal government, throughthe EPA, issues regulations that must be fol-lowed by the administrating authorities, andoversees that administration.
As prescribed by the CAA as amended, theEPA is charged with setting National AmbientAir Quality Standards (NAAQSs), a processthat began in the 1970s and undergoes revisionperiodically. Each state has developed a StateImplementation Plan (SIP) to attain those stan-dards.
The CAA is organized into 11 titles, five ofwhich are of direct concern to the industrialenvironmental manager. Those five are:
• Title I, Attainment and Maintenance ofNational Ambient Air Quality Standards(NAAQSs).
• Title III, Air Toxics Control
• Title IV, Acid Rain Control
• Title V, Permits and Reporting
• Title VII, Enforcement
The following sections present a synopsis ofthe provisions of each of these five titles thatare of most concern to the industrial environ-mental manager.
Title VThe requirements that pertain to applying for,obtaining, and operating within compliance ofair discharge permits is a major concern of theindustrial environmental manager. The permitsystem under the CAA has been modeled afterthe NPDES system, with the exception thateach state, or Air Quality ManagementAgency, where applicable, administers the sys-tem. (In the case of NPDES permits, some“designated” states administer the program.)

Laws and Regulations 57
The permits can be enforced by either the statesor the EPA. The cost of administration is recov-ered through a fee system, through which eachpermitee pays not less than $25 per ton of regu-lated pollutant (excluding carbon monoxide).This fee can be adjusted each year, based onthe consumer price index.
ApplicationEach state has developed standard forms forapplying for air discharge permits. The formsdiffer somewhat from state to state, but, inaccordance with Title IV, certain “key ele-ments” must be included. One key element isidentification and description of each and everyemission point. Also required is a complete listof regulated substances to be discharged,compliance and monitoring plans, an assess-ment of past compliance, alternative operatingscenarios, and identification and description,including location, of any and all air pollutioncontrol equipment. Determination of whetheror not the source is “major” is one of the mostimportant requirements of the application.
Regulated Air PollutantsThe substances that are regulated under theCAA include the six criteria pollutants that wereoriginally regulated under the Clean Air Act of1963 (sulfur dioxide, nitrogen oxides, carbonmonoxide, lead, ozone, and particulate matter),volatile organic compounds (VOCs), and thosesubstances already regulated under new sourceperformance standards (NSPSs), which includehydrogen sulfide, reduced sulfur compounds,total reduced sulfur, sulfuric acid mist, dioxin/furan, fluorides, and hydrogen chloride. Inaddition, 188 hazardous air pollutants (HAPs)are regulated on a “technologically achievable”basis, as are substances that deplete the ozoneand those chemicals that are subject to the acci-dental release provisions.
Ozone Protection RequirementsCertain requirements under the CAA relate toprevention of leaks and servicing of stationaryand mobile air conditioning units, which must
be included in the permit. These requirementsare contained in sections 608 and 609.
National Emission Standards for Hazardous Air Pollutants (NESHAPs)NESHAPs are addressed directly in Title IIIand are very important regarding completion ofthe permit application. In the case of majorsources, the NESHAPs become “maximumachievable control technology” (MACT). In thecase of small or area sources, they become“generally available control technology”(GACT). These control technologies areintended to reduce emissions of each of the 188designated HAPs, if the state to which theapplication for permit is to be submitted hasissued a MACT or GACT standard.
Monitoring and ReportingOperating permits, issued under Title V, containthe monitoring procedures and test methods tobe used for each substance regulated under thepermit. Reporting is normally required at six-month intervals. Certain industrial facilities aresubject to “compliance assurance monitoring”(CAM), which involves additional require-ments. These facilities, generally, are thosemajor sources that rely on pollution controlequipment to comply with the terms of the per-mit, as opposed to restricting operations orother strategy.
New Source Performance Standards (NSPSs)NSPSs have been issued for several types ofindustrial establishments. (A new source is onethat commences construction or reconstructionafter a standard that applies to that source hasbeen proposed.) In general, NSPSs reflect“cutting-edge” control technology for majorsources. In some cases, monitoring and report-ing requirements are more comprehensive. Forinstance, regarding VOC emissions, require-ments for recording include the quantities ofsolvents used in manufacturing processes andcalculations of solvent usage versus the quan-tity emitted to the air.
58 Industrial Waste Treatment Handbook
In summary, each source that is subject tothe operating permit program is required toprepare and submit an application for a permit.The application must describe each and everysource of air pollutants, as well as pertinent airpollution control requirements and standards.Whenever a facility is in a noncompliance situ-ation, compliance plans and remedial measuresmust be developed and submitted. Actual emis-sions must be monitored, and monitoringreports must be submitted periodically. At leastonce a year, each source must certify its statusof compliance.
Whenever the operating status of a sourcechanges, applications for permit modificationsmust be submitted. Also, permit renewals mustbe submitted at least every 5 years. The sourcesthat are subject to the operating permit programinclude the following:
• Major sources, as defined by the CAA, or(more restrictively) by the applicable stateor local Air Quality Control Agency
• “Affected sources,” which includes any sta-tionary source that contains one or moreunits subject to an acid rain emission limita-tion, or reduction (Title IV)
• Any source, including area sources, whichis subject to NSPSs
• Any source, including area sources, that issubject to standards, limitations, or otherrestrictions of the NESHAPs
Title IIIThe requirements of Title III, control of hazard-ous air pollutants, include limiting the releaseof 188 substances referred to as “air toxics.”The approach that Congress adopted in writingand promulgating the requirements of Title IIIwas to mandate the publishing by the EPA ofemission standards for each of the 188 hazard-ous substances based on what could reasonablybe expected to be achievable by the best tech-nology available. It was intended that the EPAwould issue the national standards for signifi-cant sources for 40 of the source categories byNovember 15, 1992, another 25% of sourcecategories by November 15, 1994, another 25%
by November 15, 1997, and the remaining byNovember 15, 2000. Compliance with thesenational standards was to be complete withinno more than 6 years of issuance of the stan-dards. (Facilities are allowed to delaycompliance for up to 6 years if they reduceemissions before standards are issued.)
MACTUnder Title III, MACT can include processchanges, materials substitutions, enclosuresand other containment strategies, as well asactive treatment for pollutant removal.
Record KeepingIndustrial facilities permitted under Title V andsubject to the requirements of Title III mustkeep records of processing and monitoring forat least 5 years, and retain them on site for atleast 2 years.
Title IWhether or not an industrial facility is locatedin a nonattainment area, and the classificationof that area, has a significant influence on thefinancial burden that facility must bear to main-tain compliance with requirements of the CAA.For instance, if an industrial plant is located in anonattainment area classified as “moderate,” itwill be allowed to emit no more than 100 tonsper year of VOCs. If the same plant is located ina nonattainment area classified as “extreme,” itis limited to no more than 10 tons per year ofVOC emissions. The basic structure for desig-nations on nonattainment areas resides in Title I.
Simply put, an area is designated as “nonat-tainment” if the ambient air is not of a specifiedquality. Nonattainment, then, refers to a defi-ciency in quality regarding one or more spe-cific substances. If an area is designated asnonattainment in particulate matter, then thatsituation may be of little consequence to anindustry having no significant particulate mat-ter emissions. The opposite is equally impor-tant. An industry having significant particulateemissions would be well advised not to locatein this area.
Laws and Regulations 59
Title IVStrategies that are being pursued for the pur-pose of acid rain control are based on therealization that the mobility of the acidic com-pounds in the atmosphere that result fromemissions of sulfur and nitrogen oxides makesit impossible to control on a local basis. Theessence of these strategies is to achieve reduc-tion of SO2 emissions by use of a market-based approach, and NOx emissions throughemission limits. For instance, sources thatgenerate heat and/or power by burning coalare allocated certain “allowances” regardingSO2 emissions. The allowances that have beengiven out were done so with the goal ofreducing yearly emissions, nationwide, of SO2by 10 million pounds from 1980 levels. Whatis unique about the acid rain reductionapproach is that the allowances can be bar-tered. If a given source emits less than theallowance, it can sell the excess, or “bank” itfor future use.
A given source has the options of selectinglow-sulfur fuel, making use of emission treat-ment technologies, or buying allowances fromanother source to meet its own allowance. Agiven source can also sell excess allowance thatit has obtained by selecting low-sulfur fuel, forinstance, to reduce the net cost of the selectedoption.
NOx emission limits are levied on the basisof type of burner, with the nationwide goal ofreducing NOx emissions by 2 million tons from1980 levels. The strategy is to achieve attain-ment of acid rain control goals through theemission limits, then to institute an allocationbartering system similar to that in use for SO2emissions to achieve regional ozone levelissues if necessary.
Title VIIThe best strategy for environmental managersto follow regarding enforcement is to use allreasonable means to avoid enforcementactions. Enforcement actions can be initiatedby the federal government, the state govern-ment, local agencies, citizen groups, orindividual citizens.
The foundation of avoiding enforcementactions is in implementing corporate policytoward compliance. “Fighting city hall” isexceedingly expensive and has a poor trackrecord. Experience bears out that gettingactively involved in the permit process, devel-oping a good working relationship with regula-tors, fostering a sound policy amongemployees of careful handling and use ofpotential environmental pollutants, substitutingnonpolluting substances when possible, andprudently maintaining and operating pollutioncontrol equipment are far preferable to dealingwith enforcement actions.
Industrial establishments, referred to as“sources,” are categorized as a “major source”if their air emissions exceed certain specifiedamounts. The specified amounts are different,depending on whether or not the source islocated in a nonattainment area, and if thatnonattainment area has been designated asmarginal, moderate, serious, severe, orextreme, or if the source is located in a desig-nated Ozone Transport Region. In any case, asource is categorized as major if it emits, or hasthe potential to emit, 100 tons per day (tpd) ormore of any air pollutant or 10 tpd of any one,or 25 tpd of a combination, of the 188 desig-nated HAPs (air toxics). Major sources havesignificantly more requirements regardingapplying for and operating under a CAA permitthan do nonmajor sources. If a source is subjectto NSPSs, is subject to national emissions stan-dards for HAPs, or is an “affected source” sub-ject to the acid rain program under Title IV, italso has significantly greater requirements.
For some industries, “fugitive emissions” areto be included in the emission totals. “Fugitiveemissions” are those that issue from open win-dows and doors, cracks in buildings or duct-work, or, in general, via any outlet other than astack, vent, or other device specificallydesigned and built to discharge substances tothe air.
It is possible for an industrial establishmentthat has potential emissions that exceed majorsource thresholds to avoid major source classi-fication, and thus become a “synthetic minorsource” by agreeing to limit emissions to below

60 Industrial Waste Treatment Handbook
the designated maximums (even though theyhave the potential). Some states have activelyencouraged such agreements in order to reducethe considerable cost of administration.
Bibliography
Army Corps/EPA, Section 404(b) (1) Guide-lines Mitigation MOA (February 7, 1990);EPA/Army Corps, Memorandum to theField: Appropriate Level of AnalysisRequired for Evaluating Compliance withthe Section 404(b) (1) Guidelines Alterna-tives Requirements (August 23, 1993).
Clean Water Act, 33 U.S.C. 1251 et seq.(1948–1987).
Clean Water Act, 404, 33 U.S.C. 1344.Coastal Zone Management Act, 16 U.S.C.
1451 et seq. (1972–1986).Comprehensive Environmental Response, Com-
pensation and Liability Act, 42 U.S.C. 9601et seq. (1980–1987).
Council on Environmental Quality, Implemen-tation of Procedural Provisions of NEPA,Final Regulations, 43FR, No. 230, Novem-ber 19, 1978.
Endangered Species Act, 16 U.S.C. 153 1-1542et seq. (1973–1984).
Federal Guidelines—State and Local Pretreat-ment Programs, U.S. Environmental Pro-tection Agency, Office of Water ProgramOperations, EPA-43019-76-017c, Washing-ton, D.C., January 1977.
Federal Insecticide, Fungicide, and Rodenti-cide Act, 7 U.S.C. 136 et seq. (1972–1991).
Fish and Wildlife Coordination Act, 16 U.S.C.661 et seq. (1958–1965).
National Academy of Sciences, National Acad-emy of Engineering, Water Quality—1972,U.S. Government Printing Office, Washing-ton, D.C., 1974.
National Environmental Policy Act, 42 U.S.C.4321 et seq. (1970–1975).
National Historic Preservation Act, 16 U.S.C.470-470 et seq. (1966–1992).
National Technical Advisory Committee,Water Quality Criteria, Federal Water Pollu-tion Control Administration, Washington,D.C., 1968.
Pollution Prevention Act, PL 101-508, Title VI,subtitle F, Sections 6601-6610 et seq. (1990).
Quality Criteria for Water, U.S. EnvironmentalProtection Agency, Washington, D.C., 1976.
Resource Conservation and Recovery Act. 42U.S.C. 6901 et seq. (1976–1992).
Safe Drinking Water Act, 42 U.S.C. 300f et seq.(1974–1996).
Superfund Amendments and ReauthorizationAct, 42 U.S.C. 11001 et seq. (1986).
Toxic Substances Control Act, 15 U.S.C. 2601et seq. (1976–1988).
U.S. Environmental Protection Agency, Legis-lation, Programs and Organization, January1979.
U.S. Environmental Protection Agency,“National Discharge Elimination System,”Code of Federal Regulations, Title 40, Part122, U.S. Government Printing Office,Washington, D.C., 1983–1995.
U.S. Environmental Protection Agency,“National Emission Standards for HazardousAir Pollutants,” Code of Federal Regula-tions, Title 40, Part 61, U.S. GovernmentPrinting Office, Washington, D.C., 1997.
U.S. Environmental Protection Agency,“National Primary and Secondary AmbientAir Quality Standards,” Code of FederalRegulations, Title 40, Part 50, U.S. Govern-ment Printing Office, Washington, D.C.,1997.
U.S. Environmental Protection Agency, “Pre-treatment Standards,” Code of FederalRegulations, Title 40, Part 403, U.S. Govern-ment Printing Office, Washington, D.C.,1997.
U.S. Environmental Protection Agency, “Sec-ondary Treatment Regulation,” Code ofFederal Regulations, Title 40, Part 133, U.S.Government Printing Office, Washington,D.C., 1985.
U.S. Environmental Protection Agency, “Stan-dards of Performance for New StationarySources,” Code of Federal Regulations, Title40, Part 60, U.S. Government PrintingOffice, Washington, D.C., 1997.
Wild and Scenic Rivers Act, 16 U.S.C. 1271 etseq. (1968–1987).

61
4 Wastes from Industries
Wastes from industries include solid wastes, airpollutants, and wastewaters. These separatecategories of wastes are regulated by separateand distinct bodies of laws and regulations; i.e.,solid wastes are regulated by RCRA, CERCLA,SARA, HSWA, and other federal laws and regu-lations as well as certain state laws andregulations; air pollutants are regulated by theClean Air Act (as well as other federal and cer-tain state laws and regulations); and wastewaterdischarges are regulated by the Clean WaterAct, as amended (as well as other federal andcertain state laws and regulations). However,the three categories of wastes are closely inter-related, both as they impact the environmentand as they are generated and managed by indi-vidual industrial facilities. As examples,certain solid wastes handling, treatment, anddisposal facilities are themselves generators ofboth air discharges and wastewaters. Baghouses used for air pollution control generatesolid wastes, air scrubbers and other air pollu-tion control devices generate both liquid andsolid wastes streams, and wastewater treatmentsystems generate sludges as solid wastes andrelease volatile organics and aerosols as airpollutants.
The total spectrum of industrial wastes, then,must be managed as a system of interrelatedactivities and substances. Materials balancesmust be tracked, and overall cost-effectivenessmust be kept in focus. Moreover, as discussedmore fully in Chapter 7, the principles of pollu-tion prevention must be implemented to themost complete extent practicable. All wastesmust be viewed as potential resources. In somecases, wastes can be used as raw materials foradditional products, either on site or at otherindustrial facilities. In other cases, wastes canbe used as treatment media for other wastes. Inall cases, the generation of wastes must be min-imized by employment of scrupulous house-keeping, aggressive preventive maintenance,
substitution of nonhazardous substances forhazardous substances, and prudent replacementof old, inefficient process technology withtechnology that results in generation of lesspollutants.
The objective of this chapter is to presentfourteen industries as representative of manymore industries regarding types of manufactur-ing processes; generation of solid wastes, airdischarges, and wastewaters; strategies for pol-lution prevention; and wastes handling, treat-ment, and disposal technologies. A generaldescription of manufacturing processes is dis-cussed in order to show the “roots” of eachsignificant solid, airborne, and waterborne pol-lutant. Then, techniques for wastes minimiza-tion as part of an overall pollution preventionprogram are discussed. Finally, methods for“end-of-pipe” treatment are presented anddiscussed.
Discussion of the thirteen representativeindustries is preceded by a discussion of threeprocesses that are common to many differentindustries: chemical descaling (pickling), vapordegreasing, and rinsing. Vapor degreasing isused by nearly all industries that place a coat-ing on metal as part of the manufacturing pro-cess. It is very common for these industries torequire extensive cleaning of the metal surfacesbefore the coating is applied, and vapordegreasing is often included in the cleaningprocess. In addition, the process of rinsing isused by many industries to remove residualsubstances from one manufacturing process inpreparation for another.
Chemical Descaling
Many manufacturing processes that involvemetal parts include a step for removing theproducts of corrosion from those metal parts. Acommon method for doing this is to immersethe parts in a bath of aqueous solution of acid

62 Industrial Waste Treatment Handbook
or molten alkali. If acid is used, it is often sul-furic because of its relatively low cost. If acaustic bath is used, it is usually sodiumhydroxide. This process is known as “pickling”and is usually followed by a rinse to removeresidual acid or caustic. Other chemical descal-ing agents include aqueous solutions of nitricand hydrofluoric acids, molten salt baths, andvarious proprietary formulations.
When sulfuric acid is used to descale ferrousmetals, some of the iron dissolves in the acidsolution and exists there as FeSO4. As thequantity of dissolved FeSO4 builds up overtime, the solution loses its effectiveness andmust be renewed, by either batch replacementor continuous makeup and overflow. The spentsolution must be treated before disposal.Similar acid salts result from the use of acidsother than sulfuric to descale metals other thanferrous.
As with all other immersion processes, thepickling solution that fails to drip back into thepickling bath after the piece is removed(dragout) must be dealt with. The quantity ofdragout can be minimized by use of airsqueegies, longer drip times, or both.
Treatment of spent pickling solutionsinvolves neutralization and precipitation of dis-solved metals. The metals precipitate as a con-sequence of the neutralization; however, theprecipitation process must be well managed inorder to prevent loss to the effluent due to non-completion of the precipitation and/or solidsremoval process. If the precipitation/solidsremoval process does not take place before dis-charge, it will take place after discharge, poten-tially causing problems of toxicity or, as aminimum, discharge permit excursions.
Degreasing
Industries that are engaged in the working,forming, plating, or welding of metals almostalways apply, and then remove, one or moreoily or greasy substances to the metal surfacesduring the manufacturing process. For instance,virtually all industries that apply a coating tometal in the course of their manufacturingactivities operate one or more processes that
remove greasy substances that were applied toprevent corrosion. A commonly used process iswashing in hot caustic solution, with or withoutdetergents. In addition, some facilities makeuse of a device known as the vapor degreaser.Simple immersion tanks, otherwise known as“dip tanks,” are also common.
Vapor degreasers consist of the followingelements:
• A heated tank to contain and volatilize theliquid degreaser substance
• An open chamber to contain the vaporsabove the heated tank
• A system to condense the vapors
• A system of hangers or baskets, typicallymounted on a moving conveyor overhead, tohold the objects to be degreased (the work)
American Society for Testing Materials(ASTM) publication No. D 3698–99, titled“Standard Practice for Solvent Vapor Degreas-ing Operations,” defines “solvent vapordegreasing operations” as “the process bywhich materials are immersed in vapors ofboiling liquids for the purpose of cleaning oraltering their surfaces, and are subsequentlyremoved from the vapors, drained, and dried ina solvent vapor degreaser.” This publicationdefines a “solvent vapor degreaser” as “a sol-vent and corrosion-resistant tank with a heatedsolvent reservoir or sump at the bottom, a con-densing means near the top, and freeboardabove the condensing means, in which suffi-cient heat is introduced to boil the solvent andgenerate hot solvent vapor. Because the hotvapor is heavier than air, it displaces the air andfills the tank up to the condensing zone. Thehot vapor condenses on the cooled condensingmeans, thus maintaining a fixed vapor level andcreating a thermal balance.”
Figure 4-1 shows a photograph of a typicalvapor degreaser. The system, or “means,” tocool the space above the heated tank typicallyconsists of coils containing cold water or arefrigerant. As the objects to be degreasedmove through the open chamber, vapors of thedegreasing substance condense on the (rela-tively cold) objects. The condensed degreasing

Wastes from Industries 63
Figure 4-1 Photograph of a typical vapor degreaser.(Courtesy of Greco.)
liquid dissolves grease on the surfaces of theobjects. As the degreasing liquid drips off theobjects, it drops into a system of troughs thatcarry it to a reservoir, from which it then flowsback into the tank. Anything that it dissolved orsuspended from the surfaces of the objects iscarried into the reservoir (and then, in the caseof a portion of this material, into the tank withthe condensed solvent).
Because only the vapors from the heatedtank contact the objects to be degreased, for-eign material from previously cleaned objectsis not brought into contact with the objectsbeing cleaned. As dirt and dissolved greaseaccumulate in the heated tank, they must bemaintained below a desired concentration byadding fresh degreaser. Some systems use abatch process where the tank is dumped period-ically and refilled with fresh degreaser; othersuse a continuous overflow from the tankand continuous makeup with fresh degreasingsubstance.
Water also condenses from the ambient air inthe (relatively cool) space above the heateddegreasing tank. Some of this condensationtakes place as the humid shop air contacts the(relatively cold) metal objects entering thevapor degreaser. Some condensation simplyoccurs in the open space of the upper portion ofthe degreasing chamber. This condensed watergradually accumulates in the tank, along with
accumulating oil, grease, and dirt. As thiswater accumulates, it begins to interfere withthe effectiveness of the solvent. Water must,therefore, be maintained below a certain con-centration, in order to achieve satisfactoryoperation.
Other sources of water contaminationinclude:
• Water brought in on the surfaces of the work
• Water remaining in the degreaser aftercleaning
• Leaks in the water coils or the steam coils
There are two methods by which this wateris removed from the vapor degreasers. The firstis by use of a separator that simply provides aquiescent volume within which water that isnot dissolved in the solvent separates from itunder the influence of gravity. The second is byuse of a still that makes use of the large differ-ence between the boiling temperatures of thewater and the solvent. When the separatedwater and solvent exit the gravity separator,there is water dissolved in the solvent phase (asa contaminant) and there is solvent dissolved inthe water phase (also as a contaminant). Stillscan then be used to remove the water contami-nation from the solvent, and to remove the sol-vent contamination from the water.
Many vapor degreaser systems include whatis known as an “auxiliary still” to remove watercontamination from the solvent before return-ing the (reclaimed) solvent to the heated tank.
Desirable characteristics of the degreasingsubstance include high solubilities of thegreasy materials used to preserve metals, ahigh degree of volatility, and chemical stability.Substances used as degreasers have includedmethylene chloride, methyl chloroform, per-chloroethylene, 1,1,1 trichloroethane, trichlo-roethylene, perchloroethane, n-propyl bromide,and trichlorotrifluoroethane.
Periodically, the vapor degreaser must beemptied, the sludge cleaned out, and the spentdegreaser disposed of. Disposal of spentdegreasing liquids is best done by fractionaldistillation to recover relatively pure degreas-ing substance for reuse. The still bottoms

64 Industrial Waste Treatment Handbook
should be incinerated or placed in a securelandfill. Spent degreaser liquid should never belandfilled directly because of toxic propertiesand the virtual impossibility of containing it“forever.” The sludge that is cleaned fromthe degreaser must also be disposed of bymeans similar to those used for the spentsolvent.
Residual degreasing substance that fails todrip back into the degreaser before thedegreased object leaves the process (dragout) isa toxic contaminant that must be dealt with. Itcan be minimized by use of air squeegees and/or longer drip times.
Certain vapor degreasing facilities are sub-ject to air discharge restrictions of the NationalEmission Standards for Halogenated SolventCleaning (Halogenated Solvent CleanerNESHAP). These restrictions are contained in40 CFR Part 63, Subpart T. The user mustdetermine the applicability of these regulations.
Rinsing
Rinsing processes are common in many indus-tries. Typically, parts and pieces undergoingmanufacturing processes are rinsed in a waterbath after each process that involves emersionin an aqueous solution. For instance, a typicalelectroplating process involves emersion of theobject being plated (the work), typically a
metal, in an aqueous solution (plating bath) ofa salt of the plating material, usually a differentmetal. In order to dissolve the metal salt beingplated, the plating bath must be highly acidic. Itwill, therefore, be highly corrosive. For thisreason, the plating bath is normally followedimmediately by two or three rinse tanks insuccession.
After completing the process in the platingbath, the work is emersed in the first waterbath, where most of the residuals from the plat-ing bath are removed. Because these residualssimply dissolve in the rinse water, they arepresent on the surface of the rinsed work inproportion to their concentration in the rinsewater. Therefore, it is necessary to rinse thework in a cleaner bath after the first rinse, andso on, until the work is sufficiently clean. Eachtime an object is removed from an emersiontank, it brings a certain amount of the bathsolution (dragout) with it. Dragout contami-nates the next emersion solution or rinsewaterbath. Use of air squeegees and/or longer driptimes can minimize dragout. Figure 4-2 showsa typical rinsing sequence for an electroplatingprocess.
It is common to have three rinse tanks inseries and advisable to have them set upsuch that fresh makeup water is added to thefinal rinse tank, ensuring a concentrationof “impurities” sufficiently low that the rinsed
Figure 4-2 Rinsing sequence for a typical electroplating process. (From Bishop, © 2000. Reprinted by permission ofMcGraw-Hill, Inc.)
Mass Balance for Counter-Current Rinse System
CP
QD
QRPlating Bath
Tank # 1
Tank # n
Effluent
Workpiece
QR
CP
QD CP + QR C2 = QD C1 + QR C1
QD Cn–1 + QR CR = QD Cn + QR Cn
QR = [(CP/ Cn )1/n + 1/n]QD
QD C1
C1
QD C2
C2
QRC3
QRCn–1
QRCn
QRCR
QD Cn–2 QD Cn–1 QD Cn
C1 C2 Cn–1 Cn

Wastes from Industries 65
work is as clean as required. The final rinsetank should overflow into the preceding rinsetank, and so on, and the overflow from the firstrinse tank should be used as makeup water forfresh plating bath solution. This set-up isreferred to as “counter-current rinsing” and haslargely replaced the older practice of forwardflow rinsing, where fresh rinsewater was addedto the first rinse tank, which overflowed intothe second rinse tank, and so on. Because theconcentration of contaminants in the final rinsetank (even when there is only one tank)governs the required flow rate of the cleanmakeup water, it follows, then, that the concen-tration of contaminants will always be lower,for any given flow rate of makeup water, in thesecond (or final) tank if the clean makeupwater is added to the final tank rather than thefirst tank.
In the forward flow set-up, lightly contami-nated rinsewater from only the final rinse tankhad to be treated before discharge within per-mit compliance, and spent plating bath solu-tion, heavily contaminated, had to be treated bya separate system. With counter-current rins-ing, where the overflow from the first rinsetank is used as makeup water for fresh platingsolution, only the spent plating solution has tobe treated.
Treatment of spent plating solution or spentrinsewater involves removal of all thosesubstances used in the plating bath plus dis-solved ions from the object being plated (thework). The same is true for treatment of spentplating solution, which is typically much lowerin volume, and, consequently, more concen-trated. Technologies for treatment of thesewastewaters before reuse or discharge are pre-sented in Chapter 8.
Electroplating of Tin
Tin has been used for centuries as both a pri-mary metal with which to make tools, utensils,and other useful objects, and as a cover or“plate” over other metals such as iron, to pro-tect them from the elements. The tinning ofiron, by hammering it onto the surface of theiron, appeared around the fourteenth century in
Bohemia. The largest simple use for tin inmodern times has been as a coating for steel tomake tin plate, which is used in the manufac-ture of the “tin can.” Over half the tin used inthe United States is for this purpose. Other usesfor tin include dairy and other food handlingequipment, washing machine parts, radio andelectronic components, as a coating on refrig-erator evaporators, as a coating on copper wire,as a component of piston rings, and for bearingsurfaces. Tin is of great importance to the elec-tronics industry, which uses coatings of tin andtin-rich (greater than 50% tin) tin-lead alloys(solder plate). Tin’s resistance to corrosion andchemical etchants, as well as ease of soldering,are highly desirable.
The favorable characteristics of tin as a plat-ing material or coating are the following:
• Nontoxic properties
• Resistance to corrosion
• Ease of soldering
• Ductility—easy to work with
Tin and its inorganic compounds and alloysare essentially nontoxic. This characteristic isextremely important to the food industry, theprepared foods industry, the dairy industry, andenvironmental engineers or scientists. Consid-ering that the elements that are closest to tinon the periodic chart exhibit considerable tox-icity, the nontoxic nature of tin is somewhatsurprising. Those elements include arsenic,lead, cadmium, antimony, and thallium. Theonly hazardous characteristics exhibited byinorganic tin substances are a result of proper-ties other than toxicity; for instance, stannouschloride is acidic, and the various stannates arestrongly alkaline. Although there are manyorganic compounds of tin, none is present inmetal finishing operations.
Production ProcessesElectroplating is by far the most widelyencountered manufacturing process for tin. Thebasic tin electroplating process is illustrateddiagrammatically in Figure 4-3. The object tobe plated, called the work, is immersed in an

66 Industrial Waste Treatment Handbook
Figure 4-3 Schematic diagram of the tin-plating process.
electrolyte (solution of metal salts). The platingmetal (tin) is also immersed in the electrolyteor bath. Using DC current, the work is madethe cathode, and the plating metal (tin, in thiscase) is made the anode. The electric currentcauses ions of tin to be dissolved into the bath,then to be deposited (plated out) on the surfaceof the work. The quality, thickness, and othercharacteristics of the resulting tin plate dependon the current amperage, which is a function ofthe electrical conductivity of the electrolyteand the applied voltage. Also affecting thequality and thickness of the tin plate productare plating time and the quality of preparationof the work.
PreplatingThe surface of the work must be very clean, aswell as activated, before plating. Consequently,as is illustrated in Figure 4-3, the first five stepsin a typical tin-plating operation are for thepurpose of thoroughly cleaning and activatingthe surface of the work. The actual mechanicsof the operation of each of these five stepsdiffers somewhat, depending on the character-istics of the work. As well, two or more of thesteps may be combined for certain types ofwork. Of interest to the environmental engineer
or scientist is that rinsing with water, using oneor more rinse tanks or sprays, follows each ofthe preplating steps.
PrecleanThe first step in preparing the work for tin
plating is to remove all gross amounts of oil,grease, and dirt. Depending on the work andits condition on arrival at the plating shop, pre-cleaning can include wiping, air spraying,brushing, vapor degreasing, emulsifiable sol-vent, solvent spray, hot alkaline spray, invertemulsion cleaners, or other processes in orderto decrease, to the extent practicable, the loadon the following cleaning processes. Varioussolvents are used for precleaning, includingmineral spirits, kerosene, and chlorinatedhydrocarbons such as perchloroethylene.Extreme measures are required in handlingthese solvents and disposing of the residualsbecause of their toxic nature. When vapordegreasing is used, the vapors as well as theliquids must be contained. An advantage to thevolatile solvents is that they can be reclaimedon site or by use of a commercial reclaimingservice, and the concentrated residuals fromthe reclaiming process can be destroyed orencapsulated for safe landfill disposal.
Wastes from Industries 67
CleanThe second step, or clean step, removes all
residuals from the preclean step as well asremoves substances that were resistant toremoval by vapor degreasing, solvent emul-sion, or other processes used in the precleanstep. Typically, the clean step makes use ofalkaline solutions to remove soils that havebeen softened but not completely removed bythe precleaning step. Cleaning solutions can bemade up using various alkali soaps, detergents,chelating agents, complexing agents, and vari-ous surfactants. Cleaning processes includemanual brushing, mechanical brushing, soak-ing, spraying, or high-pressure spraying. Heatis often used. For instance, one processinvolves immersing the work in a detergentsolution, and heating to a rolling boil, followedby soaking for a period. Mechanical agitation,ultrasonic energy, and high-pressure under-sur-face spraying are options for use in lifting thesoil off the surface of the work. Anotheroption, alkaline electrolytic cleaning, results inthe production of bubbles of hydrogen andoxygen gas, which provide a scrubbing action.After rinsing, the precleaned and cleaned workshould be completely free of any type of soilother than chemical derivatives of the workitself, such as oxides (rust) and scale.
PicklingPickling is an acid or alkaline (usually acid)
dip process that is common to many metal-cleaning operations. Pickling dissolves, by useof strong acids, corrosion products (rust, in thecase of ferrous metals) or scale. Pickling pro-cesses vary from an acid dip to anodic treat-ment in a dry, alkaline salt. Sulfuric acid iswidely used because of its relatively low cost;other acids include hydrochloric, phosphoric,and nitric.
DesmuttingWhen the work is made from steel, a carbide
film must be removed after pickling. Thiscarbide film is referred to as smut and must beremoved before plating. Several processes areavailable for this purpose, including anodic
treatment in a dry, alkaline salt. If this type oftreatment is used as the pickling step, desmut-ting occurs simultaneously.
Acid DipThe final step in cleaning the work is an acid
dip in relatively dilute sulfuric or hydrochloric(or other) acid to remove residual alkali,remove any remaining oxides, and micro-etchthe surface. The micro-etching is referred to asactivation because of its effect of enhancingadhesion of the plating metal.
Plating Baths Plating baths for tin are either acid or alkaline.There are advantages and disadvantages toeach type, and the choice depends on the spe-cific requirements of a given application. Acidbaths are made from stannous sulfate or stan-nous fluoborate. When these substances areused, the process can take place at room tem-perature, the current density can be relativelylow, and deposition of tin onto the work takesplace from the stannous, or bivalent (+2), state.Acid bath plating has the disadvantages ofrequiring so-called addition agents, and there isless throwing power. Throwing power refers tothe uniformity of deposition of the platingmetal over the entire surface of the work.Another characteristic of acid bath plating isthe brightness of the tin plate. This representsno advantage when the tin plate is on the insideof a food can, but in other situations it mightrepresent enough of an advantage to favor theacid bath process over the alkaline bathprocess.
Alkaline bath plating uses sodium or potas-sium stannate as the base material. A widerange of concentrations can be used as a meansof regulating the rate of plating, and the formu-lation is relatively simple. No additional agentsare needed. Also, alkaline tin plating bathshave excellent throwing power. Another advan-tage is that insoluble anodes can be used,which means that all of the plated tin has itsorigin in the stannate ions. Hot stannate bathsare also known for their ability to tolerateimperfect cleaning of the work. Disadvantages

68 Industrial Waste Treatment Handbook
of alkaline bath plating compared to acid bathplating include the fact that the tin is platedfrom the stannic, or trivalent (+3), state, whichrequires higher current density. Another disad-vantage is the requirement for the bath to beheated. The hot bath is not suitable for platingdelicate work, such as printed circuit boards.
Du Pont has developed an alternative bathspecifically for the purpose of electrotinningsteel strips on a continuous throughput basis.Stannous chloride is used to provide the tin andfluoride salts with conductivity. This bath isknown as the halogen electrolyte bath.Table 4-1 lists components of typical platingbaths, including acid, alkaline, and halogenbaths.
Rinse The sequential steps of the tin-plating processmust each be followed by a thorough and com-plete rinse before beginning the next sequentialstep. For instance, if the work is not rinsedcompletely after the acid dip and before analkaline plating bath, the alkalinity of the plat-ing bath will be too quickly neutralized. Asanother example, if the cleaning solution is notcompletely rinsed from the work, the deter-gents and contaminants from the washwaterwill contaminate the following bath or baths.Some rinse steps involve only one tank. Thework is dipped in the bath, then extracted fromit. As the work is dipped in, any dragout fromthe previous process contaminates the rinsebath. When the work is extracted, it drags out acertain quantity of the rinsewater with it, alongwith whatever contaminants are in the rinsewa-ter. Therefore, to keep the concentration ofthese contaminants low, fresh water must becontinually added to the rinse tank. Conse-quently, an amount of flow leaves the rinse tankthat is equal to the inflow minus the dragout.This outflow water constitutes a waste streamunless a use can be found for it.
One way to reduce the quantity of outflow isto use two rinse tanks in series, rather than asingle tank. With two rinse tanks in series, thefirst tank can be allowed to build up in
Table 4-1 Components of Typical Plating Baths
Plating Bath Composition
Alkaline Stannate Baths
Bath Makeup (g/L)
Potassium stannate 100
Free potassium hydroxide 15
Potassium stannate 210
Free potassium hydroxide 22
Alkaline Stannate Baths
Bath Makeup (g/L)
Potassium stannate 420
Free potassium hydroxide 22
Sodium stannate 100
Free sodium hydroxide 10
Acid Baths
Stannous Sulfate Bath
Stannous sulfate 72
Free sulfuric acid 50
Pheno-/cresolsulfonic acid 40
Gelatin 2
Acid Baths
Stannous Sulfate Bath
Beta-napthol 1
Stannous Fluoborate Bath
Stannous fluoborate 200
Fluoboric acid 150
Gelatin 6
Beta-napthol 1
Halogen Bath
Stannous chloride 63
Sodium fluoride 25
Potassium bifluoride 50
Sodium chloride 45
Addition agents 2
[Lowenheim, 1978]
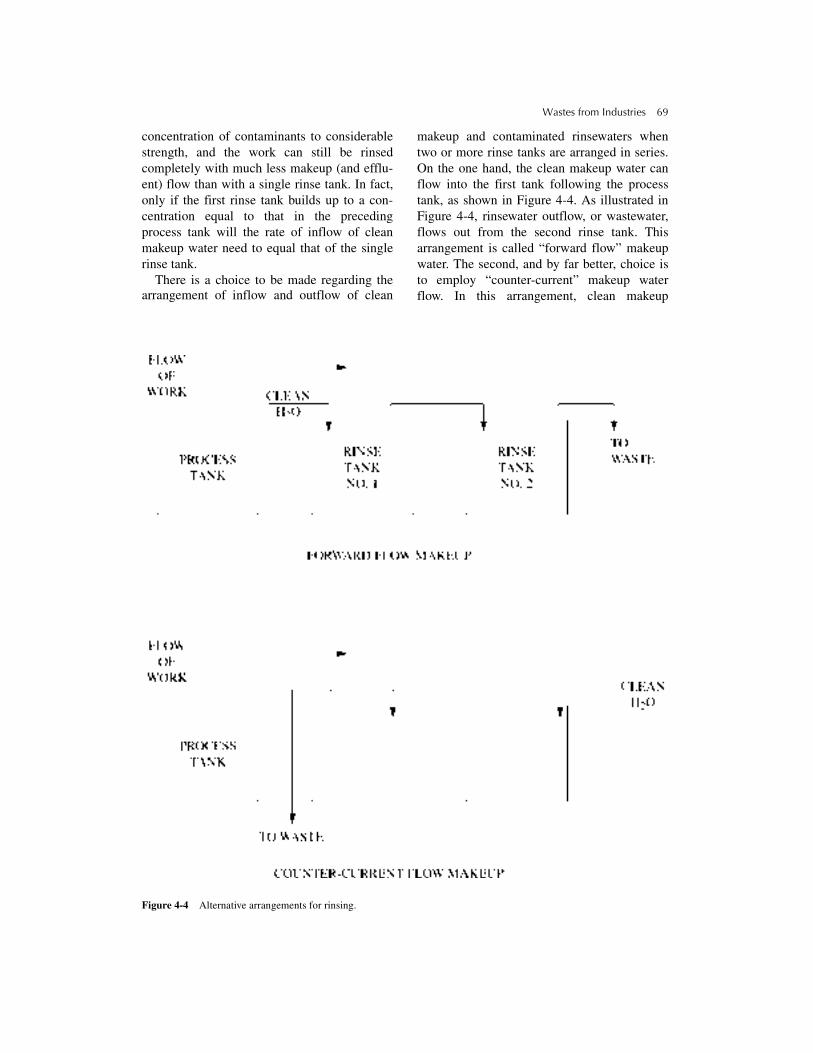
Wastes from Industries 69
concentration of contaminants to considerablestrength, and the work can still be rinsedcompletely with much less makeup (and efflu-ent) flow than with a single rinse tank. In fact,only if the first rinse tank builds up to a con-centration equal to that in the precedingprocess tank will the rate of inflow of cleanmakeup water need to equal that of the singlerinse tank.
There is a choice to be made regarding thearrangement of inflow and outflow of clean
makeup and contaminated rinsewaters whentwo or more rinse tanks are arranged in series.On the one hand, the clean makeup water canflow into the first tank following the processtank, as shown in Figure 4-4. As illustrated inFigure 4-4, rinsewater outflow, or wastewater,flows out from the second rinse tank. Thisarrangement is called “forward flow” makeupwater. The second, and by far better, choice isto employ “counter-current” makeup waterflow. In this arrangement, clean makeup
Figure 4-4 Alternative arrangements for rinsing.

70 Industrial Waste Treatment Handbook
water is added to the second of the two tanks inseries (or final tank, if more than two tanks inseries are used). Because the concentration ofcontaminants in the final rinse tank (even whenthere is only one tank) governs the requiredflow rate of the clean makeup water, it follows,then, axiomatically, that the concentration ofcontaminants will always be lower, for anygiven flow rate of makeup water, in the second(or final) tank if the clean makeup water isadded to the final tank rather than the firsttank.
Where rinsing is the final step, it is neces-sary to dry the plated product completelybefore packing for shipping to prevent staining,corrosion, or other discoloration.
Sources and Characteristics of Wastes
Solid WastesSolid wastes from the tin-plating industryinclude sludges from baths and from air andwastewater treatment facilities. Also includedare unrecyclable trash from packaging andshipping, and construction debris from generalrepair, rebuilding, expansion, and remodelingthat takes place over time. Sludges from bathsinclude the preclean, clean, pickle, and de-smutbaths and other devices, as well as the platingbaths. The cleaning baths contain products ofcorrosion and scaling as well as oils, greases,and general dirt. The still bottoms from thestills used to regenerate volatile organic sol-vents used for cleaning oils and greases fromthe work that is being prepared for plating aresolid wastes that must be managed as hazard-ous wastes.
Airborne WastesAir pollutants that must be managed includefumes from degreasing, etching, and platingoperations, plus the air discharges from boilers.Wet scrubbers are the standard devices used tocontrol fumes. The wet scrubbers convert airpollutants to water pollutants with the attendantproduction of a certain quantity of solid wastesin the form of sludges.
Waterborne WastesThere are three primary sources of wastewaterfrom tin-plating facilities: (1) rinsewaters, (2)cleaning and conditioning solutions, and (3)plating solutions. Rinsewaters are normallyproduced on a continuous basis because of con-tinuous freshwater makeup and consequenteffluent overflow. Periodically, rinse baths aredumped in order to clean the tanks.
Cleaning and conditioning solutions andplating solutions are normally discharged on abatch basis, as a result of the periodic need todump spent cleaning and plating baths.
Spent Rinse WatersAs discussed previously and illustrated inFigures 4-2 and 4-3, a rinse step normally fol-lows each cleaning, preparing, and plating step.These rinsing processes can be dip tanks,sprays, or both. Also, dip tanks can be singletanks or multiple tanks in series. Multiple (twoor more) tanks can be operated as forward flowor counter-current flow, regarding the makeupof clean water and discharge of contaminatedrinsewater. As explained previously, for pur-poses of wastes minimization, counter-currentflow is highly preferred, to the extent that thereis essentially no justification for forward flow.
Contaminated discharges from rinsing pro-cesses are basically dilute solutions of thecleaning, conditioning, or plating processesthat precede the rinsing process, along withsmall amounts of other contaminants. For thisreason, the most advantageous method for“disposing” of “spent” rinsewaters is to usethem to the extent possible, as the source ofwater for making up new batches of the preced-ing cleaning, conditioning, or plating solution.The excess rinsewaters must then be treatedbefore discharge, but their quantity will beminimized.
Spent Cleaning and Conditioning SolutionsCleaning and conditioning (conditioning isnormally considered part of cleaning) are thefirst processes used by the tin-plating industry,as illustrated in Figure 4-1. Because the

Wastes from Industries 71
purpose of cleaning is to remove oils, grease,dirt, products of corrosion and scaling, and tocondition, or activate the surface of the work tobond well with the tin, the spent cleaning andconditioning solutions contain all of the oils,greases, dirt, and products of corrosion andscaling, as well as the spent and unspent deter-gents, solvents, acids, alkalis, and othersubstances used for cleaning and conditioning.Because many cleaning solutions are propri-etary, it often takes some intensive research todetermine the individual components in thewaste cleaning solutions.
Although not usually present in significantamounts, some spent cleaning and conditioningsolutions contain chromium and cyanide.Chromium results from dissolution fromcarbon steel during strong acid treatment.The chromium content of carbon steel rangesfrom 0.5% to 1%. Cyanide, in the form offerocyanide, is sometimes used in tin platingto scavenge other heavy metals from thesurface of the work. Also, sodium cyanideis sometimes used as a cyanide dip or asan integral part of one of the cleaning stepsto help preserve work that will not be platedimmediately.
Spent Plating SolutionsThere is great variability in tin-plating opera-tions; therefore, it is not feasible to set forth atypical or average wastewater. As an exampleof one industry’s wastewater, Tables 4-2 and4-3 are presented to illustrate the wastewatercharacteristics from two continuous strip elec-trotinning facilities.
Spent plating baths, although consideredhazardous in the as-is state because of
Table 4-2 Waste Characteristics, Continuous StripTin-plating
Table 4-3 Additional Waste Characteristics, Continuous Strip Tin-plating
Parameter Value (g/L)
pH 3.3
Chloride 2.6
Total iron 0.04
Tin (II) 1.3
Tin (IV) 0.5
Fluoride 2.1
[Ellis and Whitton, 1978]
Tin lines Average
Parameter 4 5 6 —
pH 6.4 4.6 3.9 4.6
Chloride 39.1 207.0 45.5 97.2
Sulfate 104.6 152.00 250.7 169.1
Suspended solids 80.2 129.1 146.0 118.4
Total iron 4.4 21.6 29.0 18.3
Total chromium 20.2 15.5 2.1 12.6
Hexavalent chromium 10.4 0.34 0.0 3.6
Cyanide 0.74 1.06 1.04 0.95
Tin 48.9 122.9 12.4 61.4
Fluoride 27.0 30.5 8.6 22.0
(all values except pH in mg/L)
[Azad, 1976]

72 Industrial Waste Treatment Handbook
corrosivity or possibly other characteristics, arenot normally considered toxic. This makes tin-plating waste somewhat unique as a metal-plat-ing waste, simply because, as discussed earlier,tin is not a toxic substance.
Wastes MinimizationAs is the case with other metal electroplatingindustries, the key to minimizing the cost foreventual waste treatment and disposal iswastes minimization, within an overall pollu-tion prevention program, as illustrated by thefollowing:
• Whenever possible, nontoxic substancesshould be used for degreasing and cleaning.
• If toxic substances, for instance, chlorinatedvolatile organics, must be used fordegreasing or other cleaning processes,containment, recycle, and reuse must bepracticed to the maximum extent possible.
• Biodegradable detergents should be used.
• Drips must be contained and returned to thesource.
• Aggressive maintenance must be practicedto eliminate the occurrence of leaks or otheraccidents that could lead to noncontainmentof chemicals and other substances.
• Reconstitution of cleaning baths, acid baths,alkali baths, and plating baths should bedone on an as-needed basis according to thework performed, rather than on a regulartiming or other schedule.
• Dry methods of clean-up, including brooms,shovels, and dry vacuuming, should be usedto the maximum extent.
• Rinsing should be counter-current, withrespect to freshwater makeup and spentrinsewater overflow.
• Maximum (feasible) time should be pro-vided for dipped work to drip back into thetank from which that work has beenextracted. To this end, speed of withdrawalshould be minimized. Also, shaking tech-niques are options to consider.
• Air squeegees should be used to the maxi-mum extent to increase dripping into source
tanks and prevent dragout and consequentcontamination of the next sequential bath orother process.
• Temperature and viscosity of bath should beincluded in those variables that can beadjusted to minimize dragout.
• Purchasing should be guided by aggressiveselection of raw materials in order to obtainthe cleanest possible materials.
• Purchasing should be guided to demand thatpackaging of materials delivered to the plantbe recyclable, or otherwise of low solidwaste nature.
• There should be a constant and consistentprogram to substitute less-polluting andnonpolluting substances for those thatrequire expensive treatment and disposal.
• There should be a constant and consistentprogram for replacing cleaning, condition-ing, plating, and rinsing processes withtechnologies that inherently generate lesswastes, having even less objectionablecharacteristics.
• In concert with the previous point, thereshould be a constant and consistent programfor replacing process controls, includingsensors, microprocessors, and hardware,with the objective of decreasing waste andmaximizing retention, containment, recycle,and reuse of all substances.
• Technologies for recovering and regenerat-ing chemicals, as well as separating andremoving contaminants, should be aggres-sively employed. The general objectiveshould be to treat wastes as close as possibleto the source (individual manufacturing pro-cess) and to reuse as much material aspossible. Reverse osmosis or ultrafiltrationto effect removal of oils from alkaline clean-ing solutions are examples. Centrifugationhas also been used for this purpose. Acti-vated carbon can be used to remove organicimpurities.
Both filtration and centrifugation produceconcentrated impurities that offer the possibilityof recovery. If recovery of substances is notfeasible, the concentrated impurities are in a
Wastes from Industries 73
form more easily disposed of. Evaporation hasalso been used with success. If the total aqueouswastes, or, alternatively, a side stream, can bereduced in volume by counter-current rinsing,use of spent rinsewaters as makeup for washand/or plating baths, the cost energy toevaporate may be less than other treatment anddisposal. The relatively pure water condensedfrom the vapor can be used as rinsewatermakeup.
Recovery of metals from spent plating bathsand concentrated rinsing baths by electrolytictechniques has been very well developed. Met-als that have been deposited on the cathode arerelatively easy to recover. These metals canthen be reused in the plating bath. Even thoughcomplete recovery is not feasible, the process isvery effective in reducing overall costs byreducing costs for the plating chemicals and forwaste treatment and disposal. Evaporation, ionexchange, and reverse osmosis are additionalmethods that can be used to enhance recoveryby concentrating the metals before electrolyticrecovery. As a final example, ferrocyanide hasbeen used as a chelating agent in tin-plating toeffect selective scavenging of other metals insolution.
Wastewater Treatment When wastes minimization has been imple-mented to the maximum extent, thosecontaminants that remain must be treated anddisposed of. In fact, several wastes minimiza-tion methods discussed previously can beconstrued to constitute waste treatment; how-ever, other techniques can be employed that aretruly end-of-pipe treatment.
Although some waste streams can be com-bined and managed as one, regarding wastetreatment processes, it is usually advisable totreat certain waste streams separately.
Treatment of tin-plating wastes usuallyinvolves removal of oils and greases from thepreplating operations, and recovery of tin, andpossibly other metals, from the plating bathand rinse wastes. The removal of oils andgreases can be done by reverse osmosis, ultra-filtration, chemical coagulation followed by
dissolved or dispersed air flotation, in combi-nation with simple skimming.
As discussed in Chapter 8, recovery of tinand other metals is most often accomplished byalkaline, sulfide, phosphate, or carbonate pre-cipitation. If the wastewaters contain fluoride,then use of lime as the precipitating agent willeffect removal of fluorides concurrently. If theeffluent contains hexavalent chromium, thenaddition of (slightly soluble) ferrous sulfidewill effect sulfide precipitation of tin and othermetals, and at the same time reduce the hexava-lent chrome to trivalent chrome (far less toxic).If the pH is maintained between 8.0 and 9.0during this process, then the trivalent chromewill be precipitated as the hydroxide. Thus, tin,other metals, and hexavalent chrome can beremoved simultaneously, by addition of ferroussulfide, pH adjustment, slow mixing, sedimen-tation, and filtration. These methods, com-bined, produce an effluent having metals (tinplus other metals, including trivalent chro-mium) between 2 and 5 mg/L. Ion exchangecan then be employed to reduce the concentra-tions of these substances to, essentially, nonde-tect levels, as discussed in Chapter 8. Theproduct water can then be returned to the pro-cess for use as either plating bath makeupwater or rinse makeup water.
Insoluble starch xanthate has been used suc-cessfully as a precipitant for tin and other met-als over pH levels from 3.0 to 11.0, withoptimal effectiveness above 7.0. This process iseffective over a wide range of metals concen-tration levels.
When metals, including tin, are removed bya reaction to produce an insoluble compound(precipitation) (for instance, stannous sulfide),the precipitation stage is normally followed bygravity sedimentation, often by use of tube orplate settlers. Because simple precipitationoften results in small particles of precipitatethat do not settle well, a coagulation step mustbe added. Coagulation (see Chapter 8) involvesthe addition of a metal salt or an organic poly-mer, followed by a very short (15 to 30 sec-onds) rapid mix, then followed by a period of15 to 30 minutes of slow mixing beforethe gravity settling process. These processes
74 Industrial Waste Treatment Handbook
combine to produce a large, relatively heavyfloc that settles much faster and more com-pletely than the original small, precipitated par-ticles. Three distinct processes are involved: (1)precipitation, brought about by addition of thechemical (sodium hydroxide, for instance) thatreacts with the target metal ions to produce aninsoluble compound (metal hydroxide); (2)coagulation, brought about by addition of thecoagulant (metal salt or organic polymer); and(3) flocculation, brought about by the slowmixing process. The result is an effluent thathas 5–15 mg/L of metal ions. Filtration canreduce the concentration to 2–5 mg/L. If it isdesired to produce an effluent reliability lowerthan 5 mg/L of metals, then ion exchange mustbe employed.
The Copper Forming Industry
Copper forming includes rolling, drawing,extruding, and/or forging copper and copperalloys. The products of copper forming varyfrom wires to brewery kettles.
The raw materials for the copper-formingindustry are copper bars, square cross-sectionwire bars, rectangular cakes or slabs, sheets,strips and cylindrical billets, all, of which arecast in copper refineries. Other metals are oftenmixed with copper at the refinery in order toimprove corrosion resistance, electrical con-ductivity, and other properties of the end prod-uct of copper forming.
The products made by the copper-formingindustry can be divided into six categories:plates, sheets, strips, wires, rods, and tubes.Bars and wires make up about 65% of the total,whereas sheets, strips, and plates account forabout 20%. The remaining 15% is made up oftubes and pipes. Plates are usually greater thanone-quarter inch thick and are used forthe manufacture of processing vessels, heatexchangers, and printing equipment. Sheets arethin plates, and strips are basically sheets hav-ing one long dimension. Sheets and strips areboth used for roof flashing, gutters, radio parts,and washers. Rods and wires have circularcross-sections and are used for springs, electri-cal conductors, fasteners, and cables. Tubes
and pipes are used for hydraulic lines, or by theplumbing and heating industry.
The Copper Forming ProcessFive different processes, plus variations withinthose five processes, are used to form copper.
Hot RollingHot rolling is carried out at temperatures abovethe recrystallization temperature of the metal.The recrystallization temperature is that tem-perature at which the crystal lattice structure ofthe metal becomes reoriented. Consequently,the metal becomes more workable and ductile.
Cold RollingLike hot rolling, cold rolling involves passingthe metal between a series of rollers, some ofwhich are opposite others, in order to make thiscross-section of the metal piece become evensmaller. Because cold rolling is done at temper-atures below the recrystallization temperature,the product is less ductile.
ExtensionExtension involves forcing molten copper orcopper alloy through an orifice or die at tem-peratures of 1,200–2,000°F.
ForgingForging involves intermittent application ofpressure, as with hammering, to force the metalinto a desired shape.
AnnealingAnnealing involves heating the copper or cop-per alloy, often by the combustion of naturalgas, to reduce stresses introduced into themetal by forging or cold rolling. Electronealunits work by passing electrical currentthrough the formed wire. In some cases, aquenching step follows the heating step withthe consequent production of wastewater.Figure 4-5 presents a flow diagram of a typicalcopper-forming process.
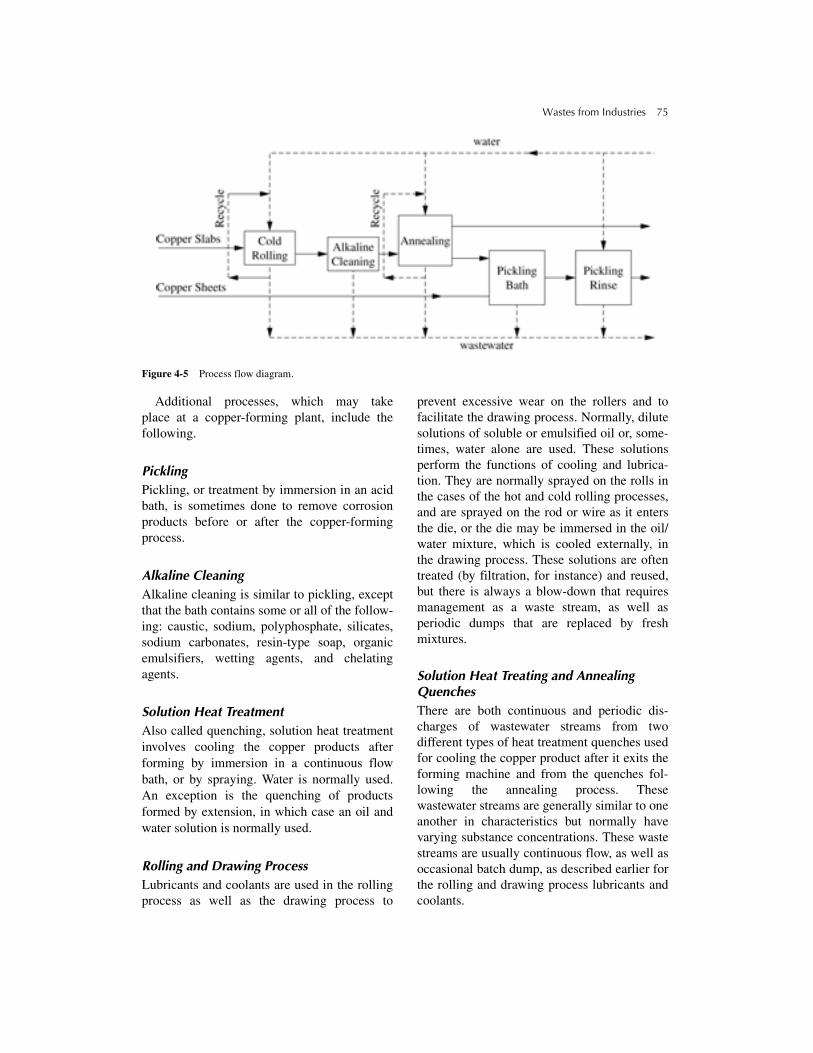
Wastes from Industries 75
Figure 4-5 Process flow diagram.
Additional processes, which may takeplace at a copper-forming plant, include thefollowing.
PicklingPickling, or treatment by immersion in an acidbath, is sometimes done to remove corrosionproducts before or after the copper-formingprocess.
Alkaline CleaningAlkaline cleaning is similar to pickling, exceptthat the bath contains some or all of the follow-ing: caustic, sodium, polyphosphate, silicates,sodium carbonates, resin-type soap, organicemulsifiers, wetting agents, and chelatingagents.
Solution Heat TreatmentAlso called quenching, solution heat treatmentinvolves cooling the copper products afterforming by immersion in a continuous flowbath, or by spraying. Water is normally used.An exception is the quenching of productsformed by extension, in which case an oil andwater solution is normally used.
Rolling and Drawing ProcessLubricants and coolants are used in the rollingprocess as well as the drawing process to
prevent excessive wear on the rollers and tofacilitate the drawing process. Normally, dilutesolutions of soluble or emulsified oil or, some-times, water alone are used. These solutionsperform the functions of cooling and lubrica-tion. They are normally sprayed on the rolls inthe cases of the hot and cold rolling processes,and are sprayed on the rod or wire as it entersthe die, or the die may be immersed in the oil/water mixture, which is cooled externally, inthe drawing process. These solutions are oftentreated (by filtration, for instance) and reused,but there is always a blow-down that requiresmanagement as a waste stream, as well asperiodic dumps that are replaced by freshmixtures.
Solution Heat Treating and Annealing QuenchesThere are both continuous and periodic dis-charges of wastewater streams from twodifferent types of heat treatment quenches usedfor cooling the copper product after it exits theforming machine and from the quenches fol-lowing the annealing process. Thesewastewater streams are generally similar to oneanother in characteristics but normally havevarying substance concentrations. These wastestreams are usually continuous flow, as well asoccasional batch dump, as described earlier forthe rolling and drawing process lubricants andcoolants.
76 Industrial Waste Treatment Handbook
Alkaline Cleaning Rinse and BathsAlkaline cleaning, which normally precedesthe annealing process, removes lubricants, tar-nish, and dirt. Therefore, all of thesesubstances, including the substances addedinto the alkaline cleaning baths, are present inthe waste streams from those processes. Thealkaline cleaning bath may contain some orall of caustic, sodium polyphosphate, sili-cates, sodium carbonates, soaps, aquaticemulsifiers, wetting agents, and chelatingagents.
Pickling Baths, Rinses, and Fume ScrubbersPickling is basically a cleaning process. Acidsolutions are used to remove oxides from thesurface of the metal. In addition, other sub-stances that are on the surface of the metal willbe removed, in whole or in part, and will, there-fore, be present in the waste stream. Inparticular, metal sulfates accumulate in pick-ling baths when sulfuric acid is used as thepickling agent, as is generally the case. Forinstance, copper sulfate forms when copper ispickled, as follows:
(4-1)
Equation 4-1 shows that as the pickling pro-cess proceeds, the acid is gradually depletedand copper sulfate builds up. For this reason,makeup acid must be added, either continu-ously or periodically.
When the metal parts are taken out of thepickling bath and placed in a rinse tank, drag-out transfers a certain amount of the picklingsolution to the rinse tank; therefore, the treatedrinsewaters have the same substances as thepickling bath, except that they are far moredilute, and these treated rinsewaters should beused as makeup water for fresh picklingsolution in order to reduce overall wastewaterdischarge.
Wastes Generation
Lubrication, cooling, and blow-down from wetscrubbers are the most important sources of
wastes that require management in the copper-forming industry.
Solid Wastes Solid waste streams include ordinary trashfrom shipping and packaging, sludges fromcopper-forming processes, and sludges fromscrubbers and wastewater treatment.
Airborne WastesAir pollutants include fumes from furnaces,pickling processes, and other cleaning opera-tions.
Waterborne Wastes, Wastes Minimization, and Wastewater TreatmentThe primary pollutants from the copper-form-ing process are listed in Table 4-4.
Oil and GreaseGlycerides of fatty acids consisting of 16 to18 carbon atoms are commonly used aslubricants throughout the copper-formingprocess. The oil molecules are charged suchthat the water molecules reject them. Becauseof the specific gravity of the oils, they rise tothe surface and can be removed mechanically;however, because water-soluble oils or emulsi-fied oils are used, precipitation techniques mustbe used to separate them from the water.
Toxic Organics and MetalsToxic organics, such as chlorinated solventsused to clean oils and greases from the surfacesof raw materials, intermediates, and products,should be replaced by nontoxic solvents, suchas detergents, and thus be eliminated from thewaste stream. Metals, however, cannot beeliminated. Metals can be removed from thewaste stream by alkaline, sulfide, phosphate, orcarbonate precipitation, followed by filtrationand ion exchange, as discussed in Chapter 8.In many instances, metals can be recoveredfrom sludges and ion exchange resins, andevery opportunity to do so should be thor-oughly investigated.
CuO H2SO4+ CuSO4 H2O+→

Wastes from Industries 77
Table 4-4 Sources of Copper-Forming Wastes
O&G = Oil and Grease TM = Toxic Metals TO = Toxic Organics SS = Suspended Solids
Suspended Solids Particles of metals, metal oxides, and dirt arealways present in metal-processing wastesbecause of abrasion, both intended and other-wise. Airborne particles are often scrubbedusing wet scrubbers, converting these particlesfrom air pollutants to water pollutants. It isusually a viable option to mix these wasteswith wastewaters from the process itself, thento remove the combined suspended solids bychemical coagulation and filtration. Maximumrecycle and reuse of treated wastewater shouldbe a continuous objective.
Prepared Frozen Foods
Prepared frozen foods are foods that have beenmixed with other ingredients, sometimescooked or partially cooked, and packagedfor easy consumer use. TV dinners are exam-ples. Prepared frozen foods vary from frozensingle items to complete meals arranged in seg-mented aluminum or plastic plates forconvenient bake-and-consume or microwave-and-consume use.
There is evidence that prehistoric peoplefroze foods for later consumption. The rapidincrease in commercialization of frozen foods(as opposed to prepared frozen foods) beganin the 1920s, when Clarence Birdseye devel-oped the process of quickly freezing foods in away that preserved taste and texture. Appar-ently, as freezing takes place, the smaller theice crystals that result, the more closely theproduct resembles fresh product at the time ofconsumption. The rapid growth of preparedfrozen foods began with the rapid increase intime spent viewing television, starting in the1950s.
The American Frozen Food Institute (AFFI)has divided the specialty foods industry intoten categories, the following five of which areappropriately included under prepared frozenfoods:
• Prepared dinners
• Frozen bakery products
• Italian specialties
• Chinese and Mexican foods
• Breaded frozen products
Process Waste Source Pollutants/Parameters
Hot Rolling Lubricant O&G, TM, TO, SS
Cold Rolling Lubricant O&G, TM, TO, SS
Drawing Lubricant O&G, TM, TO, SS
Solution Heat Tmt. (SHT) Quench O&G, TM, TO, SS
Extrusion Press SHT Quench O&G, TM, TO, SS
Alkaline Cleaning Bath Dump O&G, SS, high pH
Alkaline Cleaning Rinse Water O&G, SS, high pH
Annealing Water O&G, SS
Annealing Oil O&G, SS
Pickling Bath TM, low pH
Pickling Rinse TM, low pH
Pickling Fume Scrubber TM, low pH

78 Industrial Waste Treatment Handbook
Prepared frozen foods can be characterizedas having value (and pollution potential)added when compared to frozen fruits, vegeta-bles, and unprocessed meat, fish, and poultry.In general, the substances added duringthe (factory) preparation of prepared frozenfoods are a larger source of pollutants thatmust be managed than are the basic foodsthemselves.
Preparing frozen foods, like essentially all ofthe food-processing industry, is not associatedwith toxic wastes. Some of the wastes mayexhibit one or more hazardous characteristics,for instance, corrosivity due to low pH or highpH, resulting from one or more cleaning activi-ties. These characteristics can readily be cor-rected by simple treatment techniques such asneutralization, using one or more acid or caus-tic substances.
Food processing of all types, including theprepared frozen foods industries, is character-ized by a start-up, operate, and plant clean-upsequence. It is essentially always true that plantclean-up activities produce the greatest quanti-ties of wastes. Process start-up is a distant sec-ond and, for well-operated and maintainedplants, the operation phase produces a smallquantity of pollutants. This is in contrast tooperations such as pulp mills, where the bulkof the pollutants are produced on a continuousbasis.
The food-processing industry is here to stay.Furthermore, there is every indication that theprepared frozen foods industry will enjoysteady growth in the foreseeable future.
Because plant clean-up activities producemost of the wastes from prepared frozen foodsproduction facilities, those activities that leadto starting and stopping processing lineswarrant close scrutiny regarding wastes mini-mization. There is an inherent economy ofscale regarding wastes generation. The idealprocessing plant, from a wastes minimizationstandpoint, is a relatively large plant that pro-cesses at near maximum capacity for two ormore shifts per day and undergoes plant clean-up only once per day. The most difficult pro-cessing plant in terms of wastes minimization
is a relatively small plant that changes productsone or more times each shift and often operatesunder capacity. Each time there is a change ofprocess on a given processing line, the line, andmuch of the rest of the plant, must be thor-oughly washed down.
Wastes Generation
Solid WastesConsiderable solid wastes are generated at pre-pared frozen food plants, including debris fromfresh raw materials that make up the basic sub-stance of the prepared food. Examples are asfollows:
• Fish carcasses in the case of fish-processingplants
• Feather and inedible body parts in the caseof poultry-processing plants
• Dirt, stems, leaves, etc., in the case of vege-table or fruit-processing plants
Some prepared frozen food plants initiateproduction with all raw materials processed tosome degree at other locations. For instance,certain producers of frozen chicken potpiespurchase chicken that has been processed to thedegree that it is ready for cooking. In thesecases, the solid wastes from processing the livechickens do not have to be dealt with; however,packaging and shipping materials such asboxes, wrappers, steel bands, etc., make up animportant portion of the solid waste stream.Additional solid wastes include sludges fromprocessing tanks, sludges from wastewatertreatment processes, and the material that iscollected during plant clean-up operationsusing dry methods such as brooms, air squee-gees, and shovels.
Many of the solid wastes from prepared fro-zen foods as well as other food-processingfacilities are putrescible; therefore, they arepotential nuisance odor problems (thus, theyrepresent a source of air pollution). The bestmanagement practice to prevent such an odorproblem from developing is to maintain a

Wastes from Industries 79
clean plant throughout the premises, and todispose of the solid wastes before a problemdevelops.
Airborne Wastes
The only airborne waste from prepared frozenfood processing plants should be those nor-mally associated with the boilers. Nuisanceodor problems are often a potential problem,but should never be allowed to develop.
Waterborne Wastes
Plant clean-up operations produce the largestpercentage of waterborne wastes. The sub-stances included in these wastes are character-istic of the products produced, as discussed inthe following sections.
Prepared DinnersMore plants produce prepared dinners thanany other category of prepared frozen foods.Frozen potpies represent a large portion ofthe total. Some of these plants process livechickens, turkeys, swine, or cattle; most pur-chase processed or partially processed poultrymeat or beef. Characteristically, most of thewastewater is generated by plant clean-upoperations, usually during a late night orearly morning clean-up shift. Additionalclean-up takes place at changes of shifts,changes of items being processed or prod-ucts being prepared, and as a result of spills.Washing, rinsing, and blanching of vegeta-bles represent other sources of wastewater,and frying, breading, and cooking representother sources. Tables 4-5 and 4-6 presentaverage values of wastewater characteristicsobtained from several prepared frozen foodsprocessing plants. These tables have beenreproduced from a report on a study con-ducted by the AFFI during the 1980s. Theseresults are not presented as average or eventypical for the industry as a whole becausesuch great variability exists from one plant toanother regarding raw materials taken in,processes taking place, frequency of clean-up,
items produced, and plant maintenance proce-dures. Tables 4-5 and 4-6 are presented heresimply to illustrate the wastewater character-istics observed at six individual preparedfrozen food plants.
In general, it can be said that the wastewatersfrom prepared frozen dinner plants, as repre-sented by the six plants that were the subjectsof Tables 4-5 and 4-6, were relatively strong,were organic in nature, and had every indica-tion of being biodegradable. For instance,Table 4-6 shows that, for the six plantsincluded in this portion of the report, theconcentration of biochemical oxygen demand(BOD5) varied from a low of 620 mg/L(plant C) to a high of 4,000 mg/L (plant A),with the average concentration for all sixplants equaling 1,900 mg/L. This comparesto the BOD5 for domestic wastewater of250–350 mg/L.
Frozen Bakery ProductsCompared to frozen dinners, frozen bakery
products processing plants produce wastewa-ters that are higher in fats, oils, and grease(FOG), higher in carbohydrates, and lower inprotein. The high FOG result from the use ofbutter, shortening, and cooking oils. The highcarbohydrates result from the use of starch(flour) and sugar.
Again, there is a tendency for the bulk of thewaste load to be generated by clean-up activi-ties, and again, there is every indication that thesubstances in the wastewater would respondwell to biological treatment.
Tables 4-7 and 4-8 are also reproducedfrom the AFFI study mentioned earlier. Thesedata show that the wastewaters from the prepa-ration of frozen bakery products, as repre-sented by two plants studied by the AFFIduring the early 1980s, can be characterizedas strong. For instance, the concentration ofBOD5 in the wastewater from the twoplants was about 2,100 mg/L for one of theplants, and 4,300 mg/L for the other plant,compared to about 250–350 mg/L for domesticwastewater.

80 Industrial Waste Treatment Handbook
Table 4-5 Prepared Dinners, Average Pollutants Contained in Wastewater Per Unit Production
Table 4-6 Prepared Dinners, Average Wastewater Characteristics
Italian SpecialtiesPrepared frozen foods included in the
category of Italian specialties include frozenspaghetti, lasagna, ravioli, pizza, and sauces for
Italian foods. The raw materials for these prod-ucts include tomatoes, cheese, and flour(starch). Meat and seasonings are included aswell.
Plant code
Constituent (kg/kkg finished product)*
* kg = kilogram kkg = thousand kilogram
COD**
** COD = Chemical Oxygen Demand BOD = Biological Oxygen Demand SS = Suspended Solids (Total) VSS = Volatile Suspended Solids Total P = Total phosphorus TKN = Total Kjeldahl Nitrogen
L/kkg = Liters per thousand kilograms
BOD SS VSS Total P TKN Grease and oil
Volume (L/kkg)
A 69 35 34 33 0.25 0.44 44 8,700
B 42 18 11 11 0.18 0.25 21 6,200
C 28 13 11 11 0.24 0.61 — 22,000
D 27 15 14 14 0.16 0.55 2.9 21,000
E 20 11 6.6 6.0 — — 3.8 9,400
F 17 8.8 6.2 6.2 0.12 0.37 4.8 4,400
Average 34 17 14 14 0.19 0.44 15 12,000
Range 17−69 9−34 6−34 6−33 .12−.25 .25−.61 2.9−44 4,400−22,000
Plant code
Concentration (mg/L)
COD BOD SS VSS Total P TKN Grease and oil
A 7,900 4,000 3,900 3,800 29 51 5,100
B 6,800 2,900 1,800 1,700 30 34 3,400
C 1,300 620 530 510 11 28 —
D 1,300 720 680 650 7.6 26 140
E 2,100 1,240 700 640 — — 400
F 3,800 2,000 1,400 1,400 28 85 1,100
Average 3,900 1,900 1,500 1,500 21 45 2,000
Range 1,300−7,900 620−4,000 530−3,900 510−3,800 7.6−30 26−85 140−5,100

Wastes from Industries 81
Tables 4-9 and 4-10 are reproductions oftables presented in the AFFI study mentionedearlier. The data included in Tables 4-9 and4-10 indicate, among other things, the charac-teristic variability of wastewater from oneprocessing plant to another. For instance, theBOD5 reported for the wastewater from plantQ was 200 mg/L. The BOD5 from plant Rwas 690 mg/L. These results compare to theBOD5 from domestic wastewater of 250–350mg/L. A wastewater treatment plant designedon the basis of the characteristics reported for
plant Q would appear to be severely overloadedif placed into operation at Plant R. Thisobservation is contradicted by the resultspresented in Table 4-9. When expressed asunits of BOD5 per thousand units of product,plant Q discharged 5.2 mg/kkg, but plantR discharged only 1.1 pounds. From thesedata it would appear that the wastewatertreatment plant designed on the basis ofdata obtained at plant Q would be severelyunderloaded if placed into operation atPlant R.
Table 4-7 Frozen Bakery Products, Average Pollutants Contained in Wastewater Per Unit Production
Table 4-8 Frozen Bakery Products, Average Wastewater Characteristics
Table 4-9 Italian Specialties, Average Pollutants Contained in Wastewater Per Unit Production
Plant code
Constituent (kg/kkg finished product)
COD BOD SS VSS Total P TKN Grease and oil
Volume (1/kkg)
G 52 23 14 14 0.082 0.30 11 11,000
H No production information provided
Plant code
Concentration (mg/L)
COD BOD SS VSS Total P TKN Grease and oil
G 4,600 2,100 1,300 1,200 7.8 27 940
H 9,300 4,300 3,100 3,000 5.7 45 690
Average 7,000 3,200 2,200 2,100 6.8 36 820
Plant code
Constituent (kg/kkg product)
COD BOD SS VSS Total P TKN Grease and oil
Volume (1/kkg)
O 39 19 14 13 0.79 0.59 — 80,000
P — 3.3 — — — 0.12 — 9,800
Q 8.8 5.2 3.4 3.1 0.052 0.15 4.7 26,000
R 2.6 1.1 0.65 0.59 0.011 0.061 — 1,800
Average 17 7.2 6.0 5.6 0.28 0.23 29,000
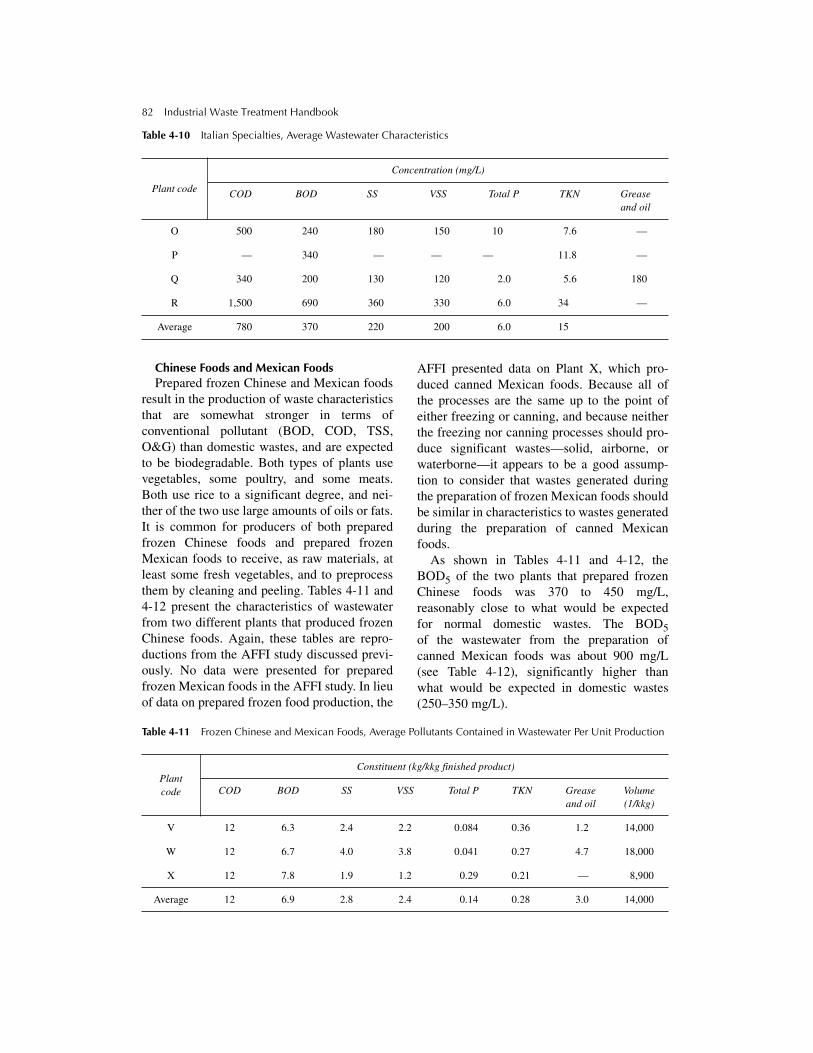
82 Industrial Waste Treatment Handbook
Table 4-10 Italian Specialties, Average Wastewater Characteristics
Chinese Foods and Mexican Foods Prepared frozen Chinese and Mexican foods
result in the production of waste characteristicsthat are somewhat stronger in terms ofconventional pollutant (BOD, COD, TSS,O&G) than domestic wastes, and are expectedto be biodegradable. Both types of plants usevegetables, some poultry, and some meats.Both use rice to a significant degree, and nei-ther of the two use large amounts of oils or fats.It is common for producers of both preparedfrozen Chinese foods and prepared frozenMexican foods to receive, as raw materials, atleast some fresh vegetables, and to preprocessthem by cleaning and peeling. Tables 4-11 and4-12 present the characteristics of wastewaterfrom two different plants that produced frozenChinese foods. Again, these tables are repro-ductions from the AFFI study discussed previ-ously. No data were presented for preparedfrozen Mexican foods in the AFFI study. In lieuof data on prepared frozen food production, the
AFFI presented data on Plant X, which pro-duced canned Mexican foods. Because all ofthe processes are the same up to the point ofeither freezing or canning, and because neitherthe freezing nor canning processes should pro-duce significant wastes—solid, airborne, orwaterborne—it appears to be a good assump-tion to consider that wastes generated duringthe preparation of frozen Mexican foods shouldbe similar in characteristics to wastes generatedduring the preparation of canned Mexicanfoods.
As shown in Tables 4-11 and 4-12, theBOD5 of the two plants that prepared frozenChinese foods was 370 to 450 mg/L,reasonably close to what would be expectedfor normal domestic wastes. The BOD5of the wastewater from the preparation ofcanned Mexican foods was about 900 mg/L(see Table 4-12), significantly higher thanwhat would be expected in domestic wastes(250–350 mg/L).
Table 4-11 Frozen Chinese and Mexican Foods, Average Pollutants Contained in Wastewater Per Unit Production
Plant code
Concentration (mg/L)
COD BOD SS VSS Total P TKN Grease and oil
O 500 240 180 150 10 7.6 —
P — 340 — — — 11.8 —
Q 340 200 130 120 2.0 5.6 180
R 1,500 690 360 330 6.0 34 —
Average 780 370 220 200 6.0 15
Plant code
Constituent (kg/kkg finished product)
COD BOD SS VSS Total P TKN Grease and oil
Volume (1/kkg)
V 12 6.3 2.4 2.2 0.084 0.36 1.2 14,000
W 12 6.7 4.0 3.8 0.041 0.27 4.7 18,000
X 12 7.8 1.9 1.2 0.29 0.21 — 8,900
Average 12 6.9 2.8 2.4 0.14 0.28 3.0 14,000
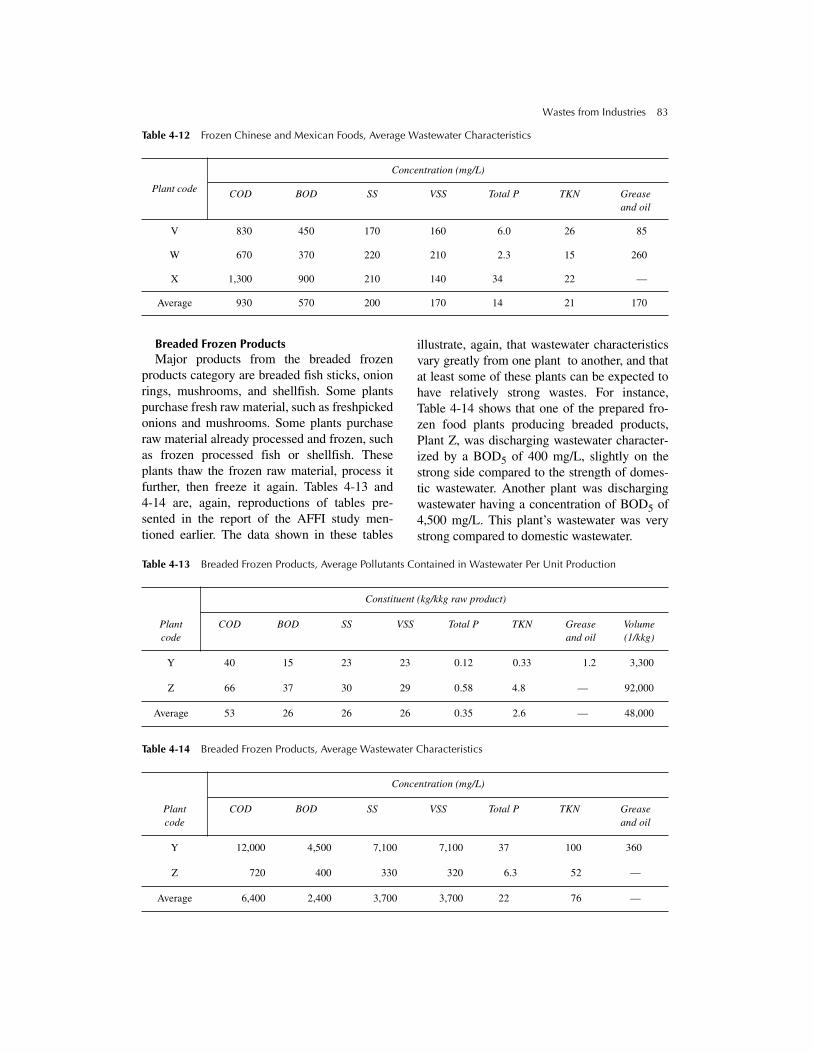
Wastes from Industries 83
Table 4-12 Frozen Chinese and Mexican Foods, Average Wastewater Characteristics
Breaded Frozen ProductsMajor products from the breaded frozen
products category are breaded fish sticks, onionrings, mushrooms, and shellfish. Some plantspurchase fresh raw material, such as freshpickedonions and mushrooms. Some plants purchaseraw material already processed and frozen, suchas frozen processed fish or shellfish. Theseplants thaw the frozen raw material, process itfurther, then freeze it again. Tables 4-13 and4-14 are, again, reproductions of tables pre-sented in the report of the AFFI study men-tioned earlier. The data shown in these tables
illustrate, again, that wastewater characteristicsvary greatly from one plant to another, and thatat least some of these plants can be expected tohave relatively strong wastes. For instance,Table 4-14 shows that one of the prepared fro-zen food plants producing breaded products,Plant Z, was discharging wastewater character-ized by a BOD5 of 400 mg/L, slightly on thestrong side compared to the strength of domes-tic wastewater. Another plant was dischargingwastewater having a concentration of BOD5 of4,500 mg/L. This plant’s wastewater was verystrong compared to domestic wastewater.
Table 4-13 Breaded Frozen Products, Average Pollutants Contained in Wastewater Per Unit Production
Table 4-14 Breaded Frozen Products, Average Wastewater Characteristics
Plant code
Concentration (mg/L)
COD BOD SS VSS Total P TKN Grease and oil
V 830 450 170 160 6.0 26 85
W 670 370 220 210 2.3 15 260
X 1,300 900 210 140 34 22 —
Average 930 570 200 170 14 21 170
Plant code
Constituent (kg/kkg raw product)
COD BOD SS VSS Total P TKN Grease and oil
Volume (1/kkg)
Y 40 15 23 23 0.12 0.33 1.2 3,300
Z 66 37 30 29 0.58 4.8 — 92,000
Average 53 26 26 26 0.35 2.6 — 48,000
Plant code
Concentration (mg/L)
COD BOD SS VSS Total P TKN Grease and oil
Y 12,000 4,500 7,100 7,100 37 100 360
Z 720 400 330 320 6.3 52 —
Average 6,400 2,400 3,700 3,700 22 76 —
84 Industrial Waste Treatment Handbook
Wastes MinimizationMost of the wastes that require management inthe form of containment, treatment, and dis-posal from industrial plants engaged in theproduction of prepared frozen foods have beenshown to have their principal source in clean-up operations, spills, and leaks. The mostimportant steps that can be taken to reduce to aminimum the quantity of wastes generated arethe following:
• Pursue an aggressive, ongoing, daily pro-gram to prevent accidental spills. Spills arethe most prevalent of the preventable occur-rences that add to the quantity and strengthof discharged wastes in food-processingplants of all types.
• Pursue an aggressive preventive mainte-nance program to eliminate the occurrenceof leaks of water or wastewater from any-where in the plant.
• Aggressively employ technologies forrecovering lost raw material as well as sepa-rating and removing contaminants. Thegeneral objective should be to treat wastesas close as possible to the source (individualmanufacturing process) and to reuse asmuch material as possible.
• Limit plant clean-up occurrences to as fewas possible on any given day. Plan theprocessing of different products so as tochange what is being produced on each lineas few times per day as is feasible.
• During plant clean-up, use dry methods,such as brooms, air squeegees, and shovels,to remove as much of what needs to becleaned up as possible. This materialbecomes solid waste, which can probably betreated and disposed of, or used as animalfeed via a rendering facility, at much lesscost than for wastewater treatment.
• Never have running water when wash sta-tions are not in use. Water should be turnedon by hand, knee, or foot-actuated valves,and should turn off automatically when theuser is finished.
• Never leave water running in hoses that arenot in use.
• Make sure the ingredients of all detergentsare known and scrutinized to ensurecompatibility with wastewater treatmentprocesses.
The AFFI study found that the attitude ofplant management was an extremely importantfactor regarding the quantity of wastes that ulti-mately required handling and treatment. Onespecialty food-processing plant employed con-tinuous monitoring to keep track of the loss ofvaluable product. When waste quantityincreased to 1% of the product produced, aninvestigation was initiated to determine andcorrect the cause.
Other factors that have been shown to influ-ence the quantity of wastes generated at pre-pared frozen foods processing plants includeplant size, number of shifts, relative amounts ofingredients preprocessed at other locations, thecost of water, the cost of waste disposal, theage of the plant, and the age of the individualprocesses and equipment. There definitelyappears to be an economy of scale regardingwaste generated (proportional to product loss).Larger plants have been shown to generate lesswaste material (equivalent to losing less prod-uct) than smaller plants.
Treatment and Disposal of WastesTwo prominent characteristics of both solidand waterborne wastes from most processingplants engaged in the production of preparedfrozen foods are that they are amenable to bio-logical methods of treatment and that they tendto be relatively strong. For these reasons, can-didate treatment technologies that wouldappear to hold promise are composting in thecase of solid wastes and anaerobic or aerobicbiological treatment for waterborne wastes.
Solid WastesA significant portion of the solid wastestream from prepared frozen foods plants con-sists of normal industrial plant trash, such aspackaging and shipping material (associatedwith both incoming and outgoing material);construction debris from remodeling, plant

Wastes from Industries 85
expansion, and regular maintenance; and equip-ment and appurtenances that are no longerusable. In fact, because packaging and shippingare such major activities for this industry, thequantity of waste packaging and shipping mate-rial, such as cardboard boxes, paper boxes,paper wrapping, and strapping material, areconsiderable. Because much of this material isrecyclable, a large portion of the solid wastesdisposal problem can be avoided.
Success in solving waste disposal problemsby recycling is best enhanced by proper set-upof storage facilities, proper arrangements fortransportation to a recycling facility, and anaggressive program for keeping recyclablematerials cleaned up around the plant andplaced in appropriate containers. Nonrecyclablewastes can usually be landfilled because haz-ardous materials are not normally included inwastes from food-processing plants of this type.
Other than packaging and shipping wastes,the principle solid waste stream from preparedfrozen plants consists of trimmings, rejectedraw material, and other portions of the organic(edible, for the most part) wastes from foods.Composting, therefore, presents itself as apotential disposal method that can accept all ofthis portion of the plant’s solid waste streamand result in a useful product, namely, soil con-ditioner and fertilizer. Another possibility fordisposal of organic solid wastes is by directapplication on land, followed by tilling into thesoil to avoid problems with odors and pestssuch as rodents and flies.
Waterborne WastesThree characteristics that strongly influenceselection of candidate treatment technologiesfor wastewaters from prepared frozen foodsindustrial plants are as follows:
1. The wastes are amenable to biologicaltreatment.
2. In the case of most plants, the liquid wastestreams are relatively strong, in terms ofconcentration of BOD5, TSS (largelyorganic solids), and, sometimes, oil andgrease.
3. The wastewaters tend to come in slugs,such as the high quantity of flow duringthe occurrence of plant clean-up, and theemptying of processing facilities when aproduct line is changed.
The characteristic of being generated inslugs, as opposed to being generated at asteady rate, strongly indicates that flow equal-ization should be one of the first componentsin the wastewater treatment system. The flowequalization device should be preceded by barracks, screens, or both to remove large objectsand screenable materials that would settle tothe bottom of the equalization device. Agrease trap or other oil and grease removaldevice should also be placed upstream of theequalization device. As discussed in Chapter8, if the equalization device is a variable-depth holding basin, it should be equippedwith surface skimming equipment as well asbottom scraping and sludge removal. The highdegree of putriscibility of food-processingwastes requires that there be no opportunityfor solids that are either lighter than water orheavier than water to collect and remain forany length of time before being removed andprocessed.
The characteristics of amenability to biologi-cal treatment, along with relatively highstrength, strongly suggest anaerobic biologicaltreatment as a candidate treatment technology,especially one of the high-rate anaerobic tech-nologies, such as the upflow anaerobic sludgeblanket (UASB), a suspended growth system,or one of the fixed film systems, such as thefluidized reactor or the expanded bed reactor.These technologies are presented and discussedin Chapter 8. There are two major advantagesof anaerobic treatment technologies, asopposed to aerobic systems. The first is a farlower requirement for electrical energy. Thesecond is a much smaller quantity (20% to30%) of biological solids generated that mustbe managed.
Notwithstanding the apparent advantages ofanaerobic treatment technologies, the mostprevalent methods of wastewater treatmentthat have been used in the past are aerobic
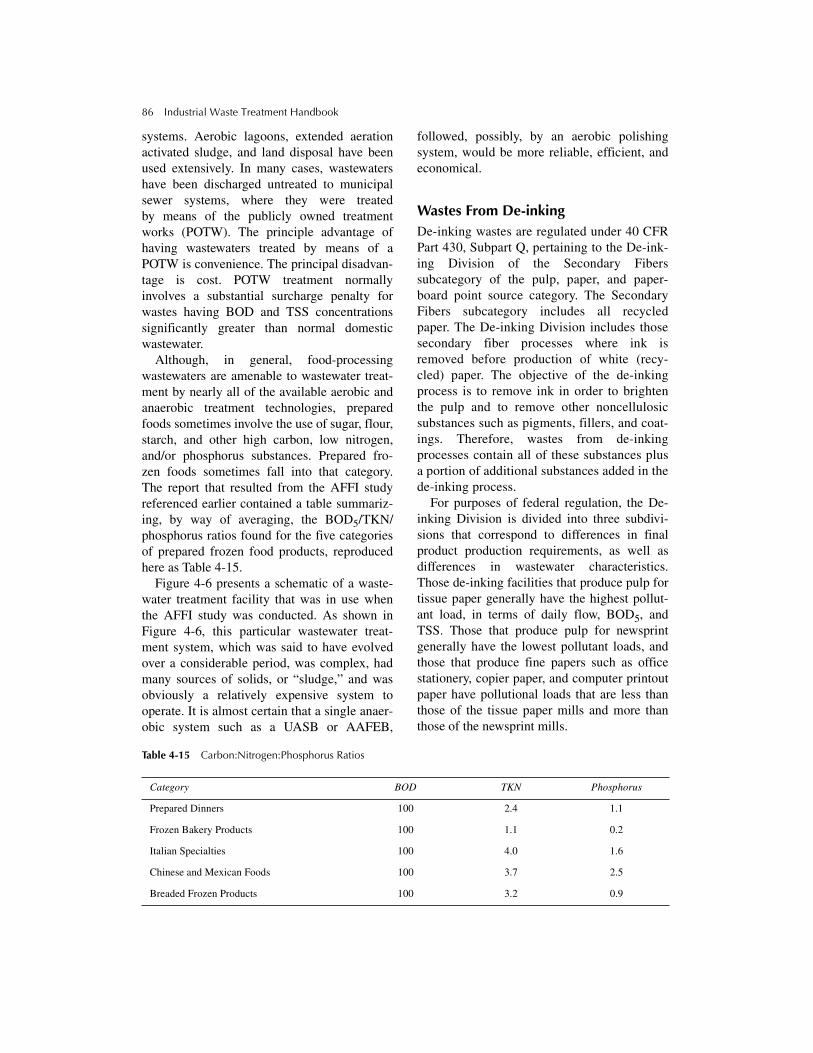
86 Industrial Waste Treatment Handbook
systems. Aerobic lagoons, extended aerationactivated sludge, and land disposal have beenused extensively. In many cases, wastewatershave been discharged untreated to municipalsewer systems, where they were treatedby means of the publicly owned treatmentworks (POTW). The principle advantage ofhaving wastewaters treated by means of aPOTW is convenience. The principal disadvan-tage is cost. POTW treatment normallyinvolves a substantial surcharge penalty forwastes having BOD and TSS concentrationssignificantly greater than normal domesticwastewater.
Although, in general, food-processingwastewaters are amenable to wastewater treat-ment by nearly all of the available aerobic andanaerobic treatment technologies, preparedfoods sometimes involve the use of sugar, flour,starch, and other high carbon, low nitrogen,and/or phosphorus substances. Prepared fro-zen foods sometimes fall into that category.The report that resulted from the AFFI studyreferenced earlier contained a table summariz-ing, by way of averaging, the BOD5/TKN/phosphorus ratios found for the five categoriesof prepared frozen food products, reproducedhere as Table 4-15.
Figure 4-6 presents a schematic of a waste-water treatment facility that was in use whenthe AFFI study was conducted. As shown inFigure 4-6, this particular wastewater treat-ment system, which was said to have evolvedover a considerable period, was complex, hadmany sources of solids, or “sludge,” and wasobviously a relatively expensive system tooperate. It is almost certain that a single anaer-obic system such as a UASB or AAFEB,
followed, possibly, by an aerobic polishingsystem, would be more reliable, efficient, andeconomical.
Wastes From De-inkingDe-inking wastes are regulated under 40 CFRPart 430, Subpart Q, pertaining to the De-ink-ing Division of the Secondary Fiberssubcategory of the pulp, paper, and paper-board point source category. The SecondaryFibers subcategory includes all recycledpaper. The De-inking Division includes thosesecondary fiber processes where ink isremoved before production of white (recy-cled) paper. The objective of the de-inkingprocess is to remove ink in order to brightenthe pulp and to remove other noncellulosicsubstances such as pigments, fillers, and coat-ings. Therefore, wastes from de-inkingprocesses contain all of these substances plusa portion of additional substances added in thede-inking process.
For purposes of federal regulation, the De-inking Division is divided into three subdivi-sions that correspond to differences in finalproduct production requirements, as well asdifferences in wastewater characteristics.Those de-inking facilities that produce pulp fortissue paper generally have the highest pollut-ant load, in terms of daily flow, BOD5, andTSS. Those that produce pulp for newsprintgenerally have the lowest pollutant loads, andthose that produce fine papers such as officestationery, copier paper, and computer printoutpaper have pollutional loads that are less thanthose of the tissue paper mills and more thanthose of the newsprint mills.
Table 4-15 Carbon:Nitrogen:Phosphorus Ratios
Category BOD TKN Phosphorus
Prepared Dinners 100 2.4 1.1
Frozen Bakery Products 100 1.1 0.2
Italian Specialties 100 4.0 1.6
Chinese and Mexican Foods 100 3.7 2.5
Breaded Frozen Products 100 3.2 0.9

Wastes from
Industries87
Figure 4-6
Plant A
—w
astewater treatm
ent facility.

88 Industrial Waste Treatment Handbook
The De-inking Process—Wastes GenerationWastepapers to be reused as secondary fiberproducts must first be sorted and classified asto suitability for final product. Newer second-ary fiber processing facilities are capable ofhandling a much wider range of recycled papertypes and are equipped to separate out wire,bottles, and a wide variety of unwanted foreignobjects. Older mills are not as well equipped.Once the “used” paper has been sorted, the fol-lowing processes convert it to a pulp productthat is ready for the paper mill. In some cases,the recycled pulp is mixed with virgin pulp. Inmany cases, it proceeds directly to the paper-making process by itself.
There are ten basic steps in the de-inkingprocess, and they are as follows:
1. Pulping2. Prewashing, heat, and chemical loop3. Screening (coarse and fine)4. Through-flow cleaning (or reverse
cleaning)5. Forward cleaning6. Washing7. Flotation8. Dispersion9. Bleaching
10. Water recirculation and makeup
Different de-inking facilities employ differ-ent numbers and different sequences of theseten steps depending on the requirements of thefinal product and the characteristics of thewastepaper. A brief description of each step isas follows.
Pulping Waste paper is loaded into a pulper, where it ismixed with hot water, alkali (pH = 9 to 11), andvarious solvents, detergents, and dispersants.This mixture is “cooked,” which produces a“stock” of the resulting pulverized paper. Theadded chemicals dissolve and disperse adhe-sives, fillers, sizes, ink pigments, binders, andcoatings, all of which eventually end up in oneor another waste stream from the process. Abuilt-in coarse screen allows smaller solids andliquids to continue on. Those solids that do not
pass the screen are either returned for anotherpass through the pulper or enter the wastestream.
PrewashingGross amounts of ink, clay, and other materialsare removed by prewashing, which consists offine screening, partial dewatering, dissolved ordispersed air flotation, and/or settling.
ScreeningThe prewashed stock is next subjected to bothcoarse and fine screening. The fine screens aresometimes operated under pressure.
Through-flow CleaningAlso called “reverse cleaning,” this process istypified by a counter-current washing process.In one form, the stock flows down an inclinedscreen having several intermediate barriers.The stock is sprayed with water at each barrier,which washes substances such as ink particlesthrough the screen. Clean water is applied atthe lowest barrier and recycled. Progressivelydirtier water is applied at progressively higherbarriers. Because of the relatively large amountof water used, this process is a significantsource of wastewater.
Forward CleaningHeavy contaminants that pass through thethrough-flow and fine-screening processes arethe target pollutants for the forward cleaningprocess. This process operates in a multistagesequence similar to that of the through-flowprocess; however, the stock is much moredilute (less than 1% solids). Large amounts ofwater are used. This water is cleaner than thatused for through-flow cleaning.
WashingThe washing process makes use of counter-cur-rent flow washing to remove ink from the stockthat has not yet been successfully removed.Equipment includes tangential screens, gravitydeckers, and dewatering screws.

Wastes from Industries 89
FlotationThose colloidal substances, including inks thatare resistant to screening and washing pro-cesses, are the target substances for theflotation process. Flotation does not make useof added water but may use coagulation chemi-cals including organic polymers. In someinstances, the flotation process is located aheadof the washing process. The high pH from thepulping process sometimes aids significantly inflotation.
DispersionThose quantities of inks that are not removedby screening, through-flow cleaning, forwardcleaning, washing, and flotation are dispersedin order to make them undetectable in the fin-ished paper.
BleachingBleaching of the recycled pulp is highly spe-cific to each individual mill. Bleaching can bedone in the pulper, just after prewashing, orafter flotation and dispersion. Bleaching chem-icals can include chlorine, chlorine dioxide,peroxides, and/or hydrosulfites.
Water Recirculation and MakeupThe nine processes discussed previously arediagramed in Figure 4-7. One of many alterna-tives to the processing sequence shown inFigure 4-7 is presented in Figure 4-8. In thealternative process, some of the steps shown inFigure 4-8 have been eliminated or combined,leaving seven of the major processing steps infive processes.
Wastes Generation and Wastes Minimization De-inking facilities produce significant solidwastes in the form of wastepaper sortingrejects, screening rejects, and sludges from flo-tation and sedimentation. Air pollutants arerelatively few and are treated by use of wetscrubbers, which create more wastewater andsolid waste (sludge).
De-inking facilities use very large quantitiesof water, which can be reduced by aggressiveapplication of recycle. The different processes,sequence of processes, and chemicals usedresult in varying wastewater loads and charac-teristics from one de-inking plant to another.
The de-inking process illustrated inFigure 4-7 shows that the major source ofwastewater is blow-down from the recycle ofrinsewaters and process water makeup. To thisblow-down water is added contaminated waterfrom leaks and spills, which become incorpo-rated in the second major source of wastewater,plant washdown water. The plant must bewashed down periodically because of leaks andspills.
Consequently, aggressive maintenance toprevent leaks and careful management of spillsand clean-up become among the most impor-tant waste management activities.
Contaminants in de-inking wastewater arethose substances extracted from the wastepaper, plus a portion of the detergents, dispers-ants, coagulants, and other chemicals addedduring the de-inking process. A listing of themajor pollutants of concern includes adhe-sives, starches, clays, ink particles and carri-ers, sizing, fillers, detergents, dispersants,coagulants, lost fiber, solvents, and bleachingchemicals.
Toxic PollutantsPentachlorophenol (PCP) and trichlorophenolare among the most common toxic pollutants inde-inking wastewater. The source of these sub-stances is the slimicides and biocides used tokeep troublesome biological growths undercontrol. This fact amounts to strong indicationfor biological treatment as a candidate treat-ment process for de-inking plant wastewaters.
Wastewater CharacteristicsTable 4-16 presents average values of charac-teristics of wastewater from the de-inkingindustry, as published in the EPA’s Develop-ment Document for the pulp, paper, andpaperboard point source category.

90Industrial W
aste Treatment H
andbook
Figure 4-7
Ten-step de-inking process flow diagram
.

Wastes from
Industries91
Figure 4-8
Seven-step de-inking modified process flow
diagram.

92 Industrial Waste Treatment Handbook
Table 4-16 De-inking Wastewater—Average Values of Untreated Wastewater Characteristics by Subdivision
All values obtained from Development Document for Effluent Limitations Guidelines and Standards for the Pulp, Paper andPaperboard Point Source Category, Tables V-14 and V-33.
Wastes MinimizationMinimization of wastes from the de-inkingindustry is best accomplished by the following:
• Substitution of nontoxic chemicals for toxicchemicals
• Aggressive pursuit of good housekeeping
• Preventive maintenance to eliminate leaks
• Equipment modifications to prevent spills
• Reuse of water to the maximum extentfeasible
• Recovery of usable fiber
• A continuous program to reduce usage ofwater
Wastewater TreatmentAfter substitution of nontoxic materials fortoxic materials, the most advantageous technol-ogy for treatment of wastewaters from the de-inking industry has often been determined to beaerobic or anaerobic biological treatment.When preceded by appropriate primary treat-ment, for instance, pH neutralization,screening, flow equalization, and primary clari-fication, biological secondary treatment hasgarnered a history of success. Because of lownutrient levels, it is necessary to add sources ofnitrogen, phosphorus, and some trace nutrients.The following biological treatment technolo-gies have been used.
Aerated LagoonsAerated lagoons have been used extensively forthe treatment of wastewaters from many pulpand paper-related industries, including de-ink-ing wastes. Two attractive features of aerobiclagoons for these and other industrial wastesare (1) the low-stressed nature of the systembecause of relatively low organic loading rates;and (2) the fact that a significant fraction ofaeration is atmospheric, as opposed to mechan-ical, or by way of diffusers. The low organicloading rates result in the ability to absorbshock, or spike loads, and require relativelylow intensity of operator attention. The atmo-spheric aeration results in lower costs forpower. As is the case with all lagoons, aeratedlagoons must be lined to protect thegroundwater.
Oxidation BasinsOxidation basins have been used in southernregions, where higher temperatures favorhigher biological reaction rates and moreintense sunlight provides more energy foroxygen generation by algae. These lagoonsshould be preceded by primary treatment, haveexcellent buffering capacity against shockloads, and have no mechanical requirements.These facilities must be lined to protect thegroundwater.
Flow BOD5 TSS
kL/kkg kgal/ton kg/kkg lb/ton kg/kkg lb/ton
Fine Papers 88.1 21.1 37.3 74.6 174.1 348.1
Tissue 136.9 32.8 87.2 174.3 251.0 501.9
Newsprint 67.5 16.2 15.9 31.7 96.8 193.5
Toxic Pollutants—De-inked Pulp for Tissue Papers
2,4,6-Trichlorophenol, ug/L Pentachlorophenol, ug/L PCB-1242, ug/L
8.8 4.8 21.3

Wastes from Industries 93
Activated SludgeModifications of the activated sludge processthat have been used with success to treat waste-waters from de-inking include complete mix,conventional, tapered aeration, step aeration,contact-stabilization, and pure oxygen. A two-stage activated sludge process having a deten-tion time of 4 hours and having an integratedselector was discussed in the development doc-ument as being particularly effective for thetreatment of wastewaters from de-inking.
Anaerobic Contact FilterThe anaerobic contact filter is essentially anonaerated trickling filter. This technology hasproved to be successful at several de-inkingfacilities. Detention times of up to 3 days havebeen used.
Die Casting: Aluminum, Zinc, and MagnesiumDie casting is one of the oldest methods used toshape metals. The metal or metal alloy ismelted, then poured into a prepared mold andallowed to cool. The molded piece is thenremoved from the mold and processed furtherby one or more of a great variety of processes.The mold, depending on the process used, maybe used again as is, may be rebuilt to varyingdegrees and used again, or may be completelydestroyed during the process of removing theshaped piece. Molds are normally made of ametal or metal alloy that has a significantlyhigher melting point than the metal beingmolded. There are three principal elements toall die casting machines: (1) a casting machineto hold the die into which the molten metal tobe cast is injected, (2) the mold itself thatreceives the molten metal and is capable ofejecting the solidified product, and (3) the cast-ing metal or alloy. The process proceeds byfirst melting the metal and adding desired addi-tives, if any. Then, a source of hydraulic energyimpacts a high velocity to the molten metal,causing it to rapidly fill the die. The die mustabsorb the stresses of injection and dissipatethe heat from the molten metal.
Two types of die casting machines are incommon use; the first is an air-operatedmachine. Compressed air forces the moltenmetal (or metal alloy) into the die by exertinghigh pressure on the surface of the moltenmetal in a special ladle referred to as thegoose. The second type of die casting machinehas a cylinder and piston submerged in themolten metal to force the molten metal into thedie.
There are three primary variations of the diecasting process: (1) the hot chamber process,used for lower-melting metals such as zinc andmagnesium, (2) the cold chamber process, usedfor higher-melting metals such as aluminum,and (3) the direct injection process. In the hotchamber process, the hydraulically actuatedcylinder and piston are submerged in the mol-ten metal. In the cold chamber process, themolten metal is fed to the cylinder and pistonfrom a reservoir. In the direct injection process,nozzles directly inject molten metal into thedies. Large amounts of noncontact coolingwater are normally associated with the die cast-ing process. Also, lubricants, referred to as “dielubes,” are used to prevent adherence of thecasting to the die. Selection of the die lube isgoverned by, first, wastewater treatment anddischarge permit considerations, and second,by its performance in providing the castingwith a better finish, allowing the metal to flowinto all cavities of the die, and handling charac-teristics. Die lubes that were used historicallythat contained complex phenolic compoundsand even PCBs have been replaced with dielubes having a vegetable oil base.
Aluminum Die CastingFigure 4-9 presents a schematic of a typicalaluminum die casting process. Aluminum diecastings are used in automobiles and manyother products. The raw material for aluminumdie castings is largely recycled aluminum cansand other articles. The first step in an alumi-num die casting operation is to crush, shred,and sort the raw material. Then, the raw mate-rial is melted, by use of coreless and channelinduction furnaces, crucible and open-hearthreverberatory furnaces fired by fuel oil, natural

94Industrial W
aste Treatment H
andbook
Figure 4-9
Schem
atic of an aluminum
die casting process. (From
the EPA
Developm
ent Docum
ent, 1980.)

Wastes from Industries 95
gas, or electric resistance and electric radiationfurnaces. Air flows from the furnaces to wetscrubbers. Furnace temperatures are in therange of 425–600°F.
Next, salts are added to remove oxides fromthe melt, then hydrogen, which causes voids inthe product casting, is removed by addition ofdry, chemically pure nitrogen, argon, or chlorine.
The next step is to lubricate the dye, which isnormally done by automatic spray. Then, themolten metal is injected into the mold. Coldchamber processing is typically used for diecasting aluminum. Processes referred to as gat-ing and risering are sometimes used to mini-mize shrinkage and to produce directionalsolidification.
Quenching in a water bath is then used torapidly cool the casting to room temperature.Oil, salt baths, and various organic solutionsare alternative quenching solutions, but water ismost often used. After quenching, the casting issometimes “heat treated” by holding the cast-ing at a temperature of 95 to 260ºC. This pro-cess is sometimes referred to as aging. Finally,the casting is cleaned by use of alkaline and/oracid solutions.
Zinc Die CastingFigure 4-10 presents a schematic diagram of atypical zinc die casting process. The first stepis to crush the scrap metal and prepare it formelting. Then, the metal is melted at tempera-tures between 325 and 475°°°°F. Next, the moltenmetal alloy, having a typical mixture of 1%copper, 3.9% aluminum, 0.06% magnesium,and the balance, zinc, is maintained at thedesired temperature within 6 degrees in theholding furnace. After the die has been lubri-cated, the molten zinc alloy is injected into themold. The hot chamber process is used. Aftersolidifying, the casting is extracted, trimmed,then dropped into a quenching tank. Finishingmay include texturing by acid etching oranother process, electroplating, or polishing.
Magnesium Die CastingMagnesium die casting follows approximatelythe same procedure as that shown for zinc die
casting in Figure 4-11. Magnesium alloy typi-cally contains zinc plus aluminum, beryllium,nickel, and copper. Oxygen may be releasedfrom the molten alloy by use of a flux (magne-sium chloride, potassium chloride, or sodiumchloride) or by use of a fluxless process thatuses air/sulfur-hexafluoride. The temperatureof the molten alloy is held in the range of475–525°°°°F by use of a crucible furnace. Beforeit is injected into the die, the molten alloy issurface skimmed to remove oxides, and the dieis lubricated very lightly (or, in some cases ofmagnesium die casting, not at all).
The molten alloy is injected using the hotchamber procedure. Relatively low pressure isused. After solidification, the casting isextracted, quenched, then finished by use ofgrinding.
Waste Streams and Waste ManagementWaste streams from each of aluminum, zinc,and magnesium die casting processes havesimilar sources, and the waste substances arecharacteristic of the alloys used and the state ofcleanliness of the raw material. The followingis an itemization of sources of wastes, commonto all three die casting processes, and com-ments about treatment.
Heating FurnaceOff-gasses are normally treated by wet scrub-bers. Sludge from metal residuals develops inthe bottom of the furnace and can be recovered.
ScrubbersWet scrubbers are used extensively at die castfacilities. Ammonia, cyanide, magnesium, phe-nols, sulfide, copper, iron, and zinc, as well astotal suspended solids (TSS) and oil andgrease, are waste substances that are commonto the scrubber blow-down from all three typesof facilities. In addition, aluminum and nickelare found in scrubber blow-down from alumi-num die casting facilities. Copper is found inscrubber blow-down from magnesium and zincdie casting facilities. Treatment of scrubberblow-down after recycle is carried out to the

96Industrial W
aste Treatment H
andbook
Figure 4-10
Schematic of a zinc die casting process. (From
the EPA
Developm
ent Docum
ent, 1980.)
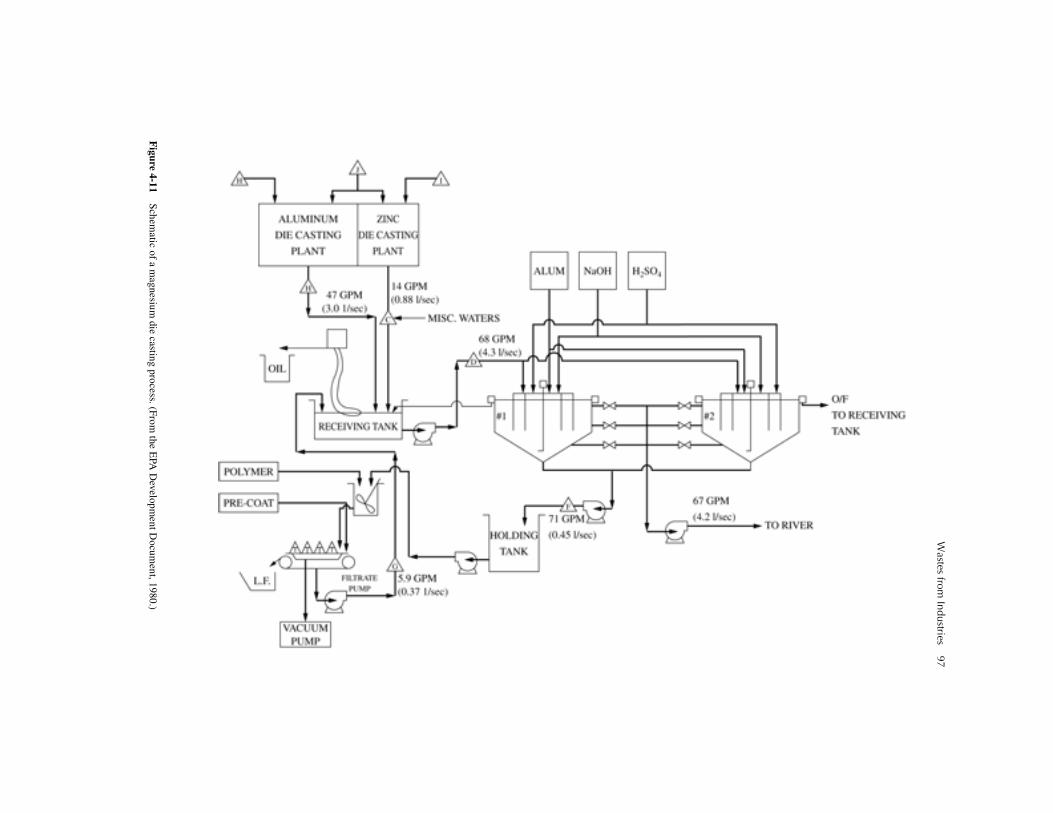
Wastes from
Industries97
Figure 4-11
Schematic of a m
agnesium die casting process. (From
the EPA
Developm
ent Docum
ent, 1980.)

98 Industrial Waste Treatment Handbook
maximum extent it can be by precipitation,coagulation, sedimentation, filtration, and ionexchange.
QuenchThe molded product is allowed to cool justenough to solidify in the die. It is then ejectedinto a water bath, or “quench tank.” The waterbath is continually renewed, to prevent thebuildup of impurities to levels that wouldadversely affect the casting, and to keep it cool.The overflow goes to wastewater treatment. Theprincipal objective of water management in thedie casting industry is to recycle as much of thetreated wastewater as possible. A certain frac-tion must always be bled, or “blown down,”from the system, and an equal amount of cleanwater replaced, or “made up,” thus eliminatingthe possibility of complete recycle. The fractionthat must be blown down is a function of themaximum concentration allowable in thequench tank of that substance that is least wellremoved in the wastewater treatment system.Blow-down from the quench tanks containsmetal residuals, plus substances used to lubri-cate the dies. Biological treatment has been usedsuccessfully when the die lube was derived fromvegetable oils. Metals have been a problem andhave resulted in the necessity of disposing of thedewatered sludge as hazardous waste.
Die CastingSurface cooling sprays and machine and floorwashdown waters, together with leaks fromhydraulic systems, leaks from noncontact coolingwater piping, and in some cases, intermingling ofall of the above with quench water produces awaste stream that must be managed. When allsubstances in this waste stream have been care-fully selected to be biodegradable, including thehydraulic oils and the detergents used formachine, floor, and general plant clean-up, bio-logical treatment has been used successfully.
FinishingWaste characteristics differ among the three diecasting processes. In the case of aluminum die
casting, trim pieces are knocked off mechani-cally as well as by hand. The solid wastestream that results is recycled back to the scrapaluminum crusher at the head of the process,and associated oils, greases, and dirt thusbecome a portion of the waste discussed ear-lier. In the case of magnesium and zinc diecasting, trimming is done by grinding, whichcreates dust. The wastes (dust) from this grind-ing operation are captured by scrubbers. Thescrubber blow-down then becomes the princi-ple waste stream from the magnesium diecasting finishing process. This waste streamcan be treated by chemical precipitation, coag-ulation, sedimentation, and filtration. Recycleand reuse of the clarified effluent as quenchwater, cooling water, and/or plant washdownwater can significantly reduce overall wastedischarges from the plant. Because lead andzinc are listed as toxic pollutants, all steps inthe waste treatment and recycle system must becarefully managed.
Additional Waste Management ConsiderationsSeveral substances that have normally beenused in aluminum, magnesium, and zinc diecasting operations are listed as hazardous.These substances include degreasing solvents,such as perchloroethane, perchloroethylene,and trichloroethane, and other chlorinated sol-vents as well as cyanide, copper, lead, zinc, andnickel. In some cases, phenolic compounds arepresent. The following discussion is arrangedsuch that categories of pollutant substances aregrouped, regardless of the individual sources,and treatment techniques are presented.
SolidsAs discussed in Chapter 8 under PhysicalTreatment Methods, suspended TSS and settle-able solids are normally removed fromwastewater streams by sedimentation, followedby, or along with, chemical coagulation. Plateor tube settlers are often used. These processescan be followed by filtration. Dissolved solidssuch as dissolved metals can be removed by

Wastes from Industries 99
alkaline precipitation, followed by sand orother filtration. Pressure filtration has beenused with success. Other filtration processesthat have been used before recycle and reuse ordirect discharge include vacuum filtration andultrafiltration. Resulting sludges and filtercakes must be disposed of as hazardous waste,unless they fall in a category that has beendelisted.
Dissolved OrganicsDissolved organics in wastewaters from diecasting processes can be successfully treatedby biological processes, if care is taken toensure that all products used in the manufactur-ing process contain only biodegradable organicsubstances.
Dissolved InorganicsThe principle dissolved inorganics in wastesfrom die casting processes include the metalbeing cast, plus those added as alloys, and theirsalts. Other inorganic substances includesodium, calcium, compounds of sulfur, nitro-gen, and chloride, and those additionalinorganics included in proprietary products. Ingeneral, alkaline, carbonate, sulfide, or phos-phate precipitation followed by sedimentationand filtration are used to remove the metals. Asdiscussed in Chapter 8, the solubility character-istics of the various metal hydroxides,carbonates, sulfides, and phosphates must becarefully considered when designing a metalremoval process. In addition, the toxic or otherhazardous characteristic of the treatment resid-uals is a major factor regarding treatment anddisposal of these wastes.
Oil and GreaseThe two principle methods for removing sub-stances that are measured and reported as oiland grease are mechanical skimming for thenondissolved fraction and chemical coagula-tion (sometimes with just pH adjustment),often with dissolved air flotation, for the dis-solved and/or suspended (including emulsified)fraction. Ultrafiltration or reverse osmosis can
be used as polishing steps, or, in some cases, asthe only method for removal of oil and grease.
Destruction of PhenolicsEvery effort should be made to exclude phe-nolic substances from die casting processingand cleaning materials, and thus from thewastewater. When unavoidably present, simplephenolic compounds can quite easily beremoved by biological treatment. Some com-plex phenolics must be removed by activatedcarbon adsorption, which must be preceded bysand (or other) filtration.
Anodizing and Alodizing
Anodizing and alodizing are industrial pro-cesses that enhance the property that somemetals have of forming a protective coating ofthe metal oxide on their surfaces. This layer ofmetal oxide is quite stable and protects themetal from further contact with oxygen, hydro-gen ions, and other substances that wouldotherwise cause further corrosion.
Anodizing is an electrochemical process;alodizing is a strictly chemical process. Bothprocesses act to produce a thicker, more even,and more predictable coating than would beformed naturally. In addition, the anodized oralodized metals have a strong affinity for paintsand other organic coatings.
The processes by which anodizing or alodiz-ing coatings form are complex. Basically, oxy-gen from the hydrolysis of water, in the case ofanodizing, reacts with the metal itself to pro-duce two results. One is the formation of pitson the surface of the metal; the other is the for-mation of metal oxide molecules and ions. Thenext step is an attachment of the metal oxidespecies to the newly formed surfaces of thepits. As this process progresses, the local areason the metal surface where this process hastaken place become nonreactive. Consequently,those local areas that have not yet been coatedbecome somewhat more reactive, until theentire surface of the metal becomes coated.
In nature, this progressive process is seldomcomplete. There are almost always local areas

100 Industrial Waste Treatment Handbook
on the metal surface that are not completelycoated and are thus exposed to additional cor-rosion. The controlled industrial processeshave the objective of taking the progressiveself-coating process to completion.
The thickness of the protective metal oxidecoating can be increased by increasing theintensity of the electrochemical (in the case ofanodizing) or chemical (in the case of alodiz-ing) process and the time over which it isallowed to take place. Thus, there is controlover the product in terms of money spent(energy, chemicals, and time).
AnodizingWhen aluminum, for example, is placed in anelectrolytic (good conductor of electric current)solution, and is made the anode, then oxygenfrom the electrolysis of water reacts with thealuminum at its surface as illustrated by the fol-lowing simplified reactions:
(4-2)
(4-3)
As aluminum atoms are extracted from thesurface of the metal, pits are formed. The sur-faces of the pits are also particularly reactive,probably because of the availability of elec-trons for covalent bonding. The aluminumoxide that is in the process of forming also hasavailable electrons; therefore, aluminum oxidebonds with the raw metal surface of the pits,forming a relatively stable complex.
The desired properties of the electrolyte arethat it conducts electric current efficiently andis a good solvent for the metal species (alumi-num ions, partially formed aluminum oxides)involved in the electrolysis process. It shouldnot, however, be a solvent for the final coatingproduct, which is the aluminum oxide–alumi-num metal complex.
The electric current intensity, electrolytecharacteristics, temperature, and process dura-tion all influence the characteristics of thepitting and the thickness and integrity ofthe coating. Higher applied voltage increasesthe speed of oxidation, the size of the pits, and
the thickness of the coating. Longer durationincreases coating thickness. Temperature andelectrolyte characteristics influence the rate ofdissolution of the metal surface. Electrolytecharacteristics affect pore density. For instance,use of sulfuric acid results in more than twicethe number of pores generated compared to useof chromic acid.
The size and density of the pores affect abra-sion resistance as well as the capacity of thecoating to absorb dyes for coloring and paints fordesired surface characteristics. Generally, coat-ings having a higher density of smaller pores,which have a higher resistance to abrasion.
AlodizingAlodizing produces a protective oxide coatingon metal surfaces similar to that produced byelectrolysis, but the process is purely chemical.Often, the metal to be coated is dipped in anacid solution containing chromate, phosphate,and fluoride ions. Alternatively, coatings canbe applied by brushing or swabbing. The acidacts to dissolve metal from the surface, whichthen reacts with oxygen in the alodizing bath toform the metal oxide, which then reacts withthe newly exposed metal surface to result in theprotective metal oxide coating. The coatingformed by alodizing is characteristically thin-ner and has less abrasion resistance than doesthe coating formed by anodizing. Alodizing isan economical alternative to anodizing if resis-tance to abrasion is not required.
Wastes GenerationThe anodizing and alodizing processes havesimilar steps that produce wastes. The basicproduction steps are cleaning, rinsing, deoxi-dizing, rinsing, etching, anodizing or alodizing,rinsing, coloring, rinsing, and sealing. All stepsproduce wastes, as described in the followingsections.
CleaningThe cleaning of metal objects to be processedproduces various wastes. If degreasing isrequired, an important waste that must be
2H2O Elect+ O2 2H2+→
2Al 3O2+ 2AlO3→

Wastes from Industries 101
managed is the waste solvent, as well as thesubstance removed. In general, the most appro-priate way to manage the waste solvents is toregenerate for reuse, then dispose of the residu-als. For instance, if a chlorinated solvent isused for degreasing, regeneration is accom-plished by use of a still. The still bottoms arethen treated and disposed of by one of themethods described in Chapter 8.
Rinsing In general, rinsing after any of the five process-ing steps (cleaning, deoxidizing, etching,anodizing or alodizing, and coloring) identifiedpreviously, produces wastes that are simplydilute forms of the wastes produced directly bythose processing steps. Often, rinsing wastesare best managed by operating the rinsing pro-cess in a counter-current mode, in which two ormore rinsing baths are used for each of the pro-cessing steps. Clean makeup water iscontinually added to the final rinse tank, whichoverflows in the rinse tanks that preceed it inthe processing steps, and so on, if more thantwo rinse tanks are used, as discussed previ-ously in this chapter. The overflow from thefirst rinse tank after each processing step, anod-izing, for instance, is then used as make-upwater for the process itself.
Deoxidizing and EtchingDeoxidizing and etching are both done witheither caustic or acid solutions. Deoxidizingmay use both, in series, if the metal to be anod-ized or alodized is badly oxidized. The purposeof deoxidizing is to remove oxides that haveformed naturally, but in an undesirable manner.The purpose of etching is to expose a clean,fresh metal surface for the anodizing oralodizing process. Wastes contain spent acid orcaustic solutions and ions of the metal beingcoated.
Anodizing or AlodizingThe spent acid baths from the anodizing oralodizing process constitute the major wastefrom the coating process. These solutions must
be maintained above a certain quality for thecoating processes to be satisfactory. Buildup ofmetal salts (from the metal being coated) mustbe kept below a level where they interfere withthe anodizing or alodizing process. Also, as thesolution is weakened by drag-in from the previ-ous rinse process, the active ingredients mustbe made up to maintain a required minimumconcentration. In continuous flow anodizing oralodizing operations, continuous make-up ofwater and active ingredients can maintain suc-cessful operation for a period; however, as theacid or alkali bath solutions continually attackthe metal being coated, eventually the bathmust be dumped and the process restarted withnew anodizing or alodizing solution. Thesedumps of spent solutions, which normallyoccur about once per month, represent a majorwaste stream.
ColoringColoring, if included in the process, produceswastes that are specific to the coloring processbeing used.
Tables 4-17 and 4-18 present typicalwastewater sources with typical flows andcharacteristics from an aluminum anodizingoperation, which includes acid polishing beforethe caustic etch. The process also includes acoloring process.
Wastes MinimizationAs discussed previously, wastes from rinsingcan be minimized, and sometimes eliminated,by use of counter-current rinsing and using themost concentrated rinse wastes as makeupwater for baths that precede that particularrinse. Other waste-minimizing alternativesinclude use of air squeegees to minimizedragout and use of either static rinses ormaintaining makeup water flow-through at aslow a rate as possible. Strict adherence tothe rule of turning water off when the rinse lineis not in use is an absolute requirement.Regarding the processing baths, which mayinclude cleaning baths, deoxidizing, causticetching, acid etching, anodizing, alodizing, and

102 Industrial Waste Treatment Handbook
Table 4-17 Wastewater from an Actual Anodizing Plant. (Anodizing capacity of the plant: 2.500 tons aluminumper month)
Table 4-18 Wastewater Sources
coloring, all solutions should be rebuilt and/ormaintained at working strength according toneed based on work done, rather than by aregular time table.
In some cases, usable, and even marketable,products have been prepared from spent acidetch solutions. When aluminum is the metalbeing coated, sodium hydroxide can be
recovered using the Bayer reaction. This can beaccomplished by operating the caustic sodaetch tank (where applicable) so as to favormovement of the following chemical equilib-rium to the right:
(4-4)
When operation is conducted in such a man-ner, it is said that the etching bath is operated ina metastable range; however, crystallizationnuclei are needed for sodium aluminate todecompose to sodium hydroxide and aluminumhydroxide. A process patented by Alcoa intro-duces the waste etch solution to a reactor thatcontains 300–500 g/L aluminum hydroxide.Precipitated aluminum hydroxide is separatedfrom the sodium hydroxide solution by filtra-tion, and the sodium hydroxide solution isreturned to the caustic etch process. The alumi-num hydroxide can be marketed as a wastetreatment chemical.
Another method that combines waste treat-ment (of the caustic etch wastes) with wastesminimization is to precipitate and recover cal-cium aluminate from spent caustic etchingsolutions. High calcium lime is added to thespent etch solution, which contains aluminumions at high pH. The recovered calcium alumi-nate can be sold or given to a cement
Description Alkaline Wastewater Acidic Wastewater Rinsewater
pH Strong alkaline soln. Strong acidic soln. 4–5
Liquid Temp. (°C) 15–60 15–60 15–25
NaOH (%) 5–7 — —
H2SO4 (%) — 15 —
Al3+ (%) 5.0–9.0 1.5–1.8 —
SS* (mg l)
* Primarily insoluble Al(OH)3
— — 100–200
Flow Rate 56 cu m/day 60 cu m/day 250 cu m/hr
ExtrusionExtrusion Press Cooling Tower Blow-down Extrusion Press Die Quelch Caustic Die Cleaner
Negligible
1,3001,300
Fabrication Negligible
Finishing Tap Water RinsesTap Water Sprays Chiller Cooling Water Rinse De-Ionized Water RinseDemineralized Water RinseRectifier Cooling Water Rinse Periodic Tank Dumping
52,0002,400
10,0002,0001,000
15,0003,500
Miscellaneous Air Compressor Cooling WaterRegeneration of Water De-Ionizer Demineralizer and Soltener UnitsBoiler Water Blowdown
12,500Negligible
Negligible
Total 101,000
NaAlO2 2H2O+ Al OH( )3 NaOH+→
Wastes from Industries 103
manufacturer, to be used as an additive. Spentcaustic etch solutions have been processed asshown by the following chemical reaction:
(4-5)
The product, nephelin hydrate, can be mar-keted as a toilet cleaning product.
Regarding spent acid etch solutions, a strongbase ion exchange resin can be used to separatethe acid from its salts.
Technologies for recovering and regenerat-ing chemicals, as well as separating andremoving contaminants, should be aggressivelyemployed. The general objective should be totreat wastes as close as possible to the source(individual manufacturing process) and toreuse as much material as possible. Reverseosmosis, or ultrafiltration to effect removal ofoils from alkaline cleaning solutions are exam-ples. Centrifugation has also been used for thispurpose. Activated carbon can be used toremove organic impurities.
Waste Treatment and DisposalTreatment and disposal of wastes, includingsolid wastes and liquid wastes, are best accom-plished by recovering substances for reuse,wherever feasible, then treating remainingwaste solutions and solids using procedurespresented in Chapter 8 so as to produce as fewresiduals for disposal as possible. For instance,spent acid and caustic solutions can be com-bined to produce water and nonhazardous saltssuch as sodium sulfate. Precipitated metal saltscan be treated and conditioned so as to enabledisposal as ordinary nonhazardous waste.
Production and Processing of Coke
Coke is a dark gray, porous solid that is pro-duced when pulverized soft coal is heated in anoxygen-deprived atmosphere. It contains 87%to 89% carbon and burns with intense heat andvery little smoke. Coke is used as fuel in blastfurnaces for the manufacture of iron and steel.
The Coking ProcessThe process of producing coke involves heat-ing coal to about 2000oF. Many of the organicsubstances that make up coal volatize at thattemperature, leaving the coke behind. The vol-atilized gas is then subjected to sequentiallylower temperature condensing chambers (asshown in Figure 4-12), which capture tar (amixture of many relatively heavy organic com-pounds), oils, light oils, then low-molecular-weight gases. The separated coke is then usedas fuel or as a component of steel. Often, someof the coke is used as fuel in the same cokeovens where it was produced. Production ofcoke is one of the major processes in an inte-grated steel mill.
As illustrated in Figure 4-12, the first com-pounds (highest condensing temperature) to berecovered are tars. Some coke plants recoverseveral high-molecular-weight materials fromseveral separate high-temperature condensers.Others simply use only one high-temperaturecondenser, which collects all of the high-molec-ular-weight compounds together as the tar. Thenext successively lower temperature condenserscollect oils, then light oils, and finally, low-molecular-weight (methane, ethane, propane,etc.) gases.
The heating of the coal is done in narrow,rectangular, silica brick ovens. The ovens standin groups of 10 to 100 or more, called batteries.After about 18 hours of “cooking,” the remain-ing substance, “coke,” which amounts to 1,300to 1,550 pounds for each ton of coal heated, ispushed into a quenching car that transports thecoke to quenching towers. Here, the coke issprayed with water to lower the temperature.About 35% of this water evaporates and leavesthe system as steam, or water vapor. Theremaining water drains to a settling basin,where the coke fines are removed.
The vaporized organics produced in theovens are withdrawn during cooking byexhausters, then sprayed with water in the firstof several condensers. The sprayed water satu-rates and cools the gas, causing condensationof the tar. The mixture of “flushing liquid,” or“flushing liquor,” and tar flow to a separatorwhere the water is decanted. The remaining gas
2NaAlO2 2SiO3Na2 9H2O+ + 4NaOH→
Al2O3 Na2O• 2SiO2•+

104Industrial W
aste Treatment H
andbook
Figure 4-12
The coking process for producing coke and by-products. (From
the EPA
Developm
ent Docum
ent, 1973.)
COOLINGCOILS
COOLING LIQUOR
WATER RETURN
FLUSHINGLIQUOR
TAR
TAR
FRESH WATERSUPPLY(INTERMITTENT)
TAR
AMMONIA
TAR
COOLINGWATER
NAPHTHALENESUPPLY
SULFURICACID
WATERSUPPLY
COOLINGLIQUOR(EXCESS)
PRIMARYCOOLER
TARSEPARATOR
EXHAUSTER
CRYSTALIZERSYSTEM
COOLINGTOWER
NAPHTHALENESKIMMER BASIN
TAREXTRACTOR
FINALCOOLER
WASH OILFROM BENZOL
PLANT
WASH OILTO BENZOL
PLANT
GASSCRUBBER
AMMONIAABSORBER
COKEOVENS
COAL SUPPLY
COKE
AMMONIA LIQUOR(EXCESS)
COKE
COKE
TARAMMONIASULFATE
TO STORAGEFACILITIES
MAKEUPWATER
BENZOL WASTES
WATER SUPPLY
QUENCHSTATION
SPRAYWATER
SETTLINGBASIN
COKE FINESRECLAIMED
MAKEUPWATER
WHARFDRAINAGE
RAILROAD CARTO COKE USERS
WHARF
AMMONIALIQUOR
STORAGE
TO STORAGEFACILITIES
TO TREATMENTPLANT
DECANTER
FINAL COOLINGSYSTEM OVERFLOW
OR CLEANOUT

Wastes from Industries 105
flows on through a tar extractor, which is anelectrostatic precipitator that removes most ofthe remaining tar.
Ammonia can also be recovered from theflushing liquid, using either of two methods:the semi-direct and the indirect processes. Inthe semi-direct process, ammonia is recoveredby use of an ammonia absorber or saturatorafter the tar extractor. The gas is brought intocontact with 5% to 10% sulfuric acid solution,causing ammonium sulfate to precipitate. Thecrystals of ammonium sulfate are dried andsold. In the indirect process, some of theammonia dissolves into the flushing liquor.More ammonia is scrubbed from the gas withwater and mixed with the flushing liquor. Theflushing liquor is then distilled and depheno-lized, and the recovered ammonia is marketed.
The phenol that is removed from the ammo-nia liquor is recovered as sodium phenolate.Light oil is recovered as the gas passes througha scrubber that uses an absorbent known asstraw oil. The straw oil absorbs 2% to 3% of itsweight of light oil. The remaining gas is thenused for fuel, either on site or is marketed.Steam distillation is then used to strip the oilsfrom the straw oil that was previously theabsorbent. The wash oil is then cooled andreturned to the scrubbers, as illustrated inFigure 4-12. Hydrogen sulfide is removed fromthe coke oven gas after the light oil scrubbers.
Sources of WastesThe production of coke creates considerablesolid, airborne, and waterborne wastes. Phe-nolic compounds, which make up aconsiderable portion of coal, are found inwastes discharged to all three media. It isessential, then, to determine the status regard-ing the hazardous nature of all wastes as part ofwastes management.
Solid WastesSolid wastes from the production of cokeinclude reject coal, reject coke, sludges fromclarification of quench water, and normal pack-aging and shipping wastes. These wastes are in
addition to the normal solid waste streamfrom most typical industrial facilities, whichincludes construction debris from plant mainte-nance, repair, and expansion. Also, broken orworn-out equipment must be managed.
Airborne WastesAir pollution is a major concern at coke pro-duction facilities. Blowing coal dust must becontrolled by containment. Because the cokingprocess is a heating and vaporization process,there is the need to control emissions from theoven stacks. Also, there is the need to containthe vapors to prevent loss via fugitive emis-sions or directly out one or more stacks.Electrostatic precipitators, bag houses, and wetscrubbers are used in conjunction with aggres-sive preventive maintenance to avoid leaks.
Waterborne WastesThe principle sources of wastewater from theproduction of coke are as follows:
• Excess flushing liquor
• Final cooling water overflow
• Light oil recovery wastes
• Condenser wastes from the crystallizer
• Gas stream desulferization
• Sludges from air pollution controlequipment
• Coal pile runoff
• Overflows from sumps, including thequench sump
The major source of wastewater is flushingliquor. The quantity of this wastewater varieswith the moisture content of the coal and withthe process used for recovery of ammonia.Because it is the first water to come into con-tact with the coke oven gases, it has the highestconcentrations of pollutants. Contaminantsinclude ammonia, phenol, sulfides, thiocyan-ates, and cyanides.
Final cooling water overflow results fromspraying the gas stream with water to removeremaining water-soluble components andnaphthalene crystals. After the naphthalene has

106 Industrial Waste Treatment Handbook
been removed from the stream, the water canbe used for cooling. Some process wastewatershave been recycled by using them for quench-ing; however, caution must be exercised. As thewater is evaporated during quenching, pollut-ants remaining in the process wastewater maybe volatilized, causing air pollution. Thosecontaminants that are not volatilized stay withthe quenched coke and thus represent a poten-tial problem during subsequent use of the coke.
Wastes MinimizationCover and containment are extremely impor-tant in order to minimize wastes generated at acoke production facility. If at all possible, thecoal pile should be covered to prevent contami-nation of stormwater. Also, it is important tocover the quenching system and to contain thequench water; that is, to not allow quenchwater sumps to overflow. In addition, the fol-lowing wastes minimization measures shouldbe strictly adhered to:
• Drips must be contained and returned to thesource.
• Aggressive maintenance must be practicedto eliminate the occurrence of leaks or otheraccidents that could lead to noncontainmentof chemicals and other substances.
• Dry methods of clean-up, including brooms,shovels, and dry vacuuming, should be usedto the maximum extent possible.
• Purchasing should be guided by aggressiveselection of raw materials in order to obtainthe cleanest possible materials.
• Purchasing should be guided to demand thatpackaging of materials delivered to the plantbe recyclable or otherwise of low solidwaste nature.
• There should be a constant and consistentprogram to substitute less-polluting andnonpolluting substances for those thatrequire expensive treatment and expensivedisposal. For instance, low-sulfur coalshould be used to the extent that financialfeasibility allows to minimize the quantityof sulfides and other sulfur compounds inthe waste air and water.
Air Pollution ControlControl of blowing coal dust and coke fines canonly be accomplished by covering the sources.Covering has the dual benefit of reducingwastewater by preventing contamination ofstormwater.
Scrubbers, both wet and dry, are used exten-sively at coke production facilities. Also, baghouses are used in conjunction with systemsthat maintain clean air within the work areas ofthe production facilities. The blow-down fromthe wet scrubbing systems is a significantsource of wastewater that must be managed.
Wastewater TreatmentBiological treatment systems have been used tosuccessfully treat wastewaters from the cokingprocess, even though these wastewaters nor-mally contain significant amounts of toxicsubstances. Two procedures are used to over-come the toxic effects of these substances; thefirst is to remove some of them by use of a pre-treatment step. The second is to employ theprocess of gradual acclimation of the biologicaltreatment system to the wastewaters.
The removal step involves combining waste-waters from light oil recovery, final cooling, airpollution control blow-down, and excess flush-ing liquor. This combined wastewater stream isthen passed through the free leg of the ammo-nia still. The waste from this process is thenincreased in pH by addition of lime. It is thenpassed through the fixed leg of the ammoniastill, where ammonia is removed and recov-ered. The effluent from this process is thencombined with wastewater from the crystallizer(see Figure 4-11) and held in a storage tank fora period. The pH of the effluent from this hold-ing tank is then lowered with acid to the neutralrange. The pretreated wastewater is now readyfor treatment by a properly acclimated biologi-cal system.
The acclimation step involves subjecting thebiological treatment system, activated sludge,for instance, to gradually increasing levels ofthe toxic substances in the full-strength waste-water, until full-strength wastewater is beingtreated. One way to accomplish acclimation is

Wastes from Industries 107
to develop the activated sludge system usingdomestic wastewater until it is fully functionalas a wastewater treatment system. Then, thepretreated industrial wastewater is added to thedomestic wastewater starting with a mix ofabout 10% pretreated industrial wastewater and90% domestic wastewater. When it has beenestablished that the treatment system is workingwell on the 10%–90% mixture, the proportionof pretreated industrial wastewater is increased,and so on, until the treatment system is receiv-ing and operating well on full-strength pre-treated wastewater. What happens during theacclimation procedure is that those microorgan-isms that can develop the capability to produceenzymes that can metabolize the toxic materialsin the pretreated industrial wastewater grow andflourish in the activated sludge (or other biolog-ical treatment medium). Those that cannotmetabolize gradually die off or are replacedover time. The result is an acclimated biologicaltreatment system that is able to successfullytreat the pretreated industrial wastewater.
An acclimated biological treatment systemthat consists of three extended aeration basins inseries has been developed. Phenols are removedin the first basin, oxidation of both ammoniaand cyanide takes place in the second basin, andthe third basin (nonaerated) is used to removenitrogen via the denitrification process. It isnecessary to maintain favorable concentrationsof other nutrients such as phosphorus in each ofthe biological treatment basins.
Chemical–physical treatment systems havebeen used with some success. One version ofchemical–physical treatment has been to usechemical oxidation to destroy organics, ammo-nia, and cyanide, then to use activated carbonto remove unreacted substances as well as par-tially treated substances. Oxidation is accom-plished by adding chlorine to the pretreatedwastes in an aeration basin. Oxygen from airand chlorine are the oxidizing agents. Spentactivated carbon can then be recovered (par-tially) by the process of heating (incinerating).
The Wine-Making Industry
Production of wine is one of the oldest endeav-ors of human industry. The historical record
shows that the Egyptians and the Assyrianswere making wine from grapes by 3500 B.C.The basic process has remained unchanged forcenturies; however, some new wine productshave been developed during more moderntimes.
In the year 2000, approximately 12% of theworld’s production of wine was taking place inthe United States. About 80% of the world pro-duction was in Europe. California producedmore than 20% of U.S. wine. Other wine-pro-ducing states, in approximate order of quantity,were New York, Washington, Pennsylvania,and Oregon.
The most widely used grape for wine pro-duction is Vitis Vinifera, known as the Euro-pean grape. It is grown throughout Europe, theUnited States, Australia, Chile, and in regionsof Asia. Other grapes used for wine productioninclude Vitis rotund folia and Vitis Labrusca,but it is widely agreed that superior wines areproduced from vinifera varieties.
The Wine Production Process
The basic, age-old process for producing wineincludes six steps: destemming, crushing,pressing, fermentation, racking, and bottling.Although some destemming takes place beforecrushing, destemming is also accomplishedsimultaneously with the crushing process.
When the grapes are ripe, they are picked byhand or by mechanical harvesters. They aretransported to the winery that is typically closeby and are destemmed, then crushed. Theamount of destemming that takes place beforecrushing depends on the type of wine to bemade. The stems impart tannins to the wine,thus influencing the color and flavor. Theproduct of the grape-crushing processbecomes what is called must, sometimesbefore and in some cases after the solids areremoved from the juice. The must is what thenenters the fermentation process. If white wineis to be produced, the solids, including theskins, seeds, and the quantity of stems thatremain, are removed before fermentation. Ifred wine is to be produced, the solids are con-sidered part of the must. Most of the pigments

108 Industrial Waste Treatment Handbook
in grapes are located in the skins. Dependingon the characteristics desired in the wine prod-uct, varying degrees of care are exerted toavoid breaking the seeds during the crushingprocess.
Sulfur dioxide is often used to treat the mustbefore fermentation. In some cases, sufficientsulfur dioxide treatment is used to kill all of theyeast and other microorganisms naturallypresent in the must. Then, a desired species ofyeast is added. Other effects of treating themust with sulfur dioxide include the following:settling characteristics for solids removal areimproved, thus improving clarification, desiredfor some white wines; the color of red wines ischanged somewhat; and, in some cases, storagecharacteristics are improved by inhibition ofundesirable enzyme activity.
After treatment, if any, the must is pumpedinto tanks for fermentation. Typically, some ofthe juice is pumped over the top of the cap thatforms as a result of skins and other solids col-lecting on the surface. This is done to increasethe extraction of pigments from the skins. Asethanol increases in amount during the fermen-tation process, it increases the rate of extractionof pigments.
When the desired intensity of color has beenachieved, the partially fermented must ispressed to separate solids from the juice, as isdone before fermentation for white wines.Many types of presses are used, but all have thecommon objective of gently squeezing juicefrom the skins, seeds, pulp, and other solidswithout extracting undesirable substances. Atthis point, the solids become part of the wastestream, whereas the juice is returned to tanks tocomplete the fermentation process. When fer-mentation is complete, the process called rack-ing is initiated. The objective of racking is asfollows: After pressing to remove the skins,stems, seeds, and most of the pulp and the juicehas been returned to vats for completion of fer-mentation, a layer of sediment called the lees,composed of dead yeast cells and bits of grapefragments, forms on the bottom of the vat. Ifthe developing wine is allowed to remain incontact with the lees, off flavors develop fromdecomposition of the lees. Consequently, the
developing wine is drawn off and placed inclean vats, a process called racking.
When fermentation has proceeded to com-pletion, various substances are often added,which are referred to as fining agents. Finingagents act to remove colloidal solids andinclude bentonite clay, egg whites, and gelatin.After clarification by sedimentation, the wineis normally filtered, then aged in wooden vatsor bottled.
Variations on the wine process include thoseprocesses for making brandy, dessert wines,sparkling wines, and champagne. Brandy ismade by first distilling the alcohol from thewaste materials such as the solids or pomaceleft after pressing. Then, this alcohol is addedto the wine, to raise the total alcohol content toabout 20%. In some cases, brandy is added toother wines along with sugar and possiblyother substances to produce dessert wines.
Sparkling wines are made by allowing thefermentation process to take place in a closedcontainer. The CO2 produced during the fer-mentation process dissolves into the wineunder pressure. In some cases, compressedCO2 is added to enhance the natural CO2 con-tent of the sparkling wine.
Champagne is normally produced by addingsugar and more yeast to finished wine. Theyeast ferments the added sugar to producemore alcohol and CO2. The process takesplace in a closed container in order to retainthe CO2 as explained previously for sparklingwines.
Wine-Making Wastes The six major steps in wine production all pro-duce wastes, either solid or liquid or both. Airpollution is not a normal problem in winemak-ing, unless unusual circumstances result in aproblem with emissions from boilers or in theproduction of odors. Figure 4-13 presents aschematic diagram of an example winery,where production of both wine and brandy takeplace. As illustrated in Figure 4-13, plantclean-up operations produce plant washdownwastes from essentially all the wine-makingsteps.

Wastes from Industries 109
Figure 4-13 Production of wine and brandy.
The destemming step produces waste stemsand dirt that can be land applied. This can usu-ally be done without causing pollution prob-lems. The next step, crushing, results in normalplant clean-up wastes. The waste lees that
result from the pressing step represent varyingquantities of waste material depending onwhether or not by-product recovery is prac-ticed. Fermentation also results in normal plantclean-up wastes, plus the dregs from the

110 Industrial Waste Treatment Handbook
fermentation process itself (dead yeast cellsand various settled or filtered solids from thegrapes themselves).
Racking results in sediment in the bottom ofthe vats, as well as normal plant washdownwastes. Finally, bottling results in moreplant washdown wastes. All of these wine-making steps, except for destemming, contrib-ute wastes in the form of lost product, includ-ing the final step, bottling, where lost wineproduct from spillage, overfilling, bottle break-ing, and other unintentional releases contributeto the BOD level of the overall plant wastestream.
Wastes MinimizationSimilar to many food processing industries, by-product recovery can reduce the quantity ofwastes that require treatment. One example isthe recovery of tartrates, salts of tartaric acid,which occur in lees, pomace, and on the sur-faces of wine storage tanks. Tartrates are rinsedoff the surfaces of storage tanks and extractedfrom pomace using water and are then precipi-tated with calcium carbonate or lime. The driedprecipitates are used in cooking as cream oftartar.
Another example is the recovery of an edibleoil from grape seeds.
Pomace is sometimes used for animal feed.Otherwise, it can be mixed with the stems andother solids and returned to the vineyards foruse as a soil conditioner and fertilizer.
Treatment of Winery WastesThe principal liquid waste from wineries isthe washwater from general plant clean-up aswell as vat cleaning, bottle cleaning, and prod-uct loss. In general, biological treatmentprocesses have been used with success,including anaerobic processes and aerobic pro-cesses. In 1989, Farmer reported on a pilotplant project in which an upflow anaerobicsludge blanket (UASB) and an anaerobic con-tact process were used to treat high-strengthwastes (COD of about 15,000 mg/L) from awinery.
Both processes were successful in removing98% of the soluble COD. Following the pro-cesses with aerobic treatment increased overallCOD removal to more than 99%. As expected,the principal advantages of the anaerobic pro-cesses over using only aerobic treatment werethat the anaerobic processes produced about80% less sludge and occupied a significantlysmaller footprint.
One of the most popular methods for treatingwinery wastes has been that of land disposal,especially the ridge and furrow method. Rus-sell et al. reported on a land application systemthat treated up to 50,000 gallons of wastewaterper day in California. The operation was calledan unqualified success, with negligible contam-ination of groundwater.
Ryder reported on the successful use of anaerobic lagoon to treat winery wastes. Ryderemphasized the value of the aerated lagooneffluent as irrigation water for the vineyards.
An aspect of winery waste treatment that isdifferent from most other industrial wastes isthat the destruction of any waste containingalcohol must be in accordance with regulationsof the Bureau of Alcohol, Tobacco, and Fire-arms (BATF). The law specifically regulatesdisposal of lees, requiring that wine must becompletely pressed or drained from the leesbefore it can be used for animal feed or produc-tion of cream of tartar or other uses.
The Synthetic Rubber Industry
Many different types of synthetic rubber areproduced today, and a host of products aremade from them. Annual (world) production inthe year 2000 exceeded 20 million tons,accounting for well over 80% of all rubberproducts produced, including natural rubber.
Nearly 300 years after Columbus discoveredHaitian children playing with what would laterbe known as rubber balls, Joseph Priestly, anEnglish chemist, discovered that the gum fromcertain trees grown in South America, Haiti,and nearby islands would rub out pencil marks.Hence, the name, rubber was born. Duringthe next 100 years, use for this remarkable
Wastes from Industries 111
substance, produced from the sap of HeveaBrasiliensis that were still confined to the jun-gles of South America and nearby islands,developed slowly. In 1876, the British trans-planted thousands of these trees in southeasternAsia and began large-scale production of rub-ber, now known as natural rubber. The milkysap from which natural rubber is made has,since that time, been called latex, from the latinword for milk, lactic.
Shortages during the war years, from WorldWar I through the early 1950s, prompted thedevelopment of synthetic rubber. During WorldWar II, the effort put forth by the United Statesto develop its synthetic rubber manufacturingcapability was second only to its efforts todevelop the atomic bomb. The principal syn-thetic rubber produced during that period wascalled GR-S, for Government Rubber Styrene,which is still produced as SBR, Styrene Buta-diene Rubber.
The many different types of synthetic rubberproduced in the early 2000s include siliconerubbers, used in the aerospace industry for theirusefulness over wide ranges of temperature;butyl rubber, used for the manufacture of innertubes; chloroprene rubber, used to line tanks toprevent corrosion; latex (foam rubber), used forthe manufacture of cushions, padding, andother things; nitrile rubber, used in the manu-facture of oil-resistant and heat-resistant hoses,gaskets, and other things; and styrene butadi-ene rubber (SBR), the most commonly usedtype of synthetic rubber. SBR is used in themanufacture of automobile tires, conveyorbelts, noise and vibration insulators, foulweather gear, and many other things. Morethan 500 different types of SBRs are produced,most for the automobile industry.
For purposes of regulation, the EPA hasdivided the rubber manufacturing industry intotwo categories, the Tire and Inner Tube Indus-try and the Synthetic Rubber Industry. Bothcategories make extensive use of SBR. Becausethe raw materials from which SBR is manufac-tured are derived from petroleum, the syntheticrubber industry tends to be located within twoclusters. The plants that produce synthetic rub-ber are clustered in the oil-producing states,
mainly Louisiana and Texas, whereas thosethat produce products made from synthetic rub-ber are located in industrialized areas, espe-cially those associated with the automobileindustry.
Production of Synthetic RubberSo-called tire rubber, which is also used formany other products, is produced as a sub-stance known as crumb rubber. There are twoprinciple methods for producing crumb rubber:solution crumb production and emulsioncrumb production. Solution crumb productioninvolves mixing the raw materials in a homoge-nous solution wherein polymerization takesplace. Emulsion crumb production involvesproducing an emulsion of the raw materials,resulting in bulk polymerization of droplets ofmonomers suspended in water. The mecha-nisms of solution polymerization are those ofionic interaction. The mechanisms of emulsionpolymerization require sufficient emulsifier, inthe form of a soap solution, to maintain a stableemulsion and proceed as follows.
Emulsion Crumb ProductionProduction of crumb rubber by emulsion poly-merization has been the traditional process forproduction of synthetic rubber. It is still themost commonly used process, accounting for90% of the world’s production of SBR.Figure 4-14 is a schematic diagram of theemulsion crumb rubber production process.
As illustrated in Figure 4-14, raw materialsin the form of monomers, produced by thepetroleum industry, are delivered to tank farm.The monomers include styrene and butadiene.Because production facilities such as theseoperate 24 hours per day, 365 days per year, thetank farm always maintains a constant supply.Other materials delivered and stored in tankfarms include soap (or detergent), activator,catalyst, modifier, extender oil, and carbonblack. Butadiene, as well as certain otherpolymers, is delivered with polymerizationinhibiters mixed in, to prevent premature poly-merization during delivery and storage.

112Industrial W
aste Treatment H
andbook
Figure 4-14
General w
ater flow diagram
for an emulsion polym
erized crumb rubber production facility.
SUPPLYSTREAM
TREATEDPROCESSWATERCONDENSATE
RETURN
BOILERHOUSE BOILER FEED WATER
REGENERATIONWASTE
WASTEWATER
WASTEWATER
WATERTREATMENTUNITS
GENERAL WATER FLOW DIAGRAM FOR AN EMULSION POLYMERIZED CRUMB RUBBER PRODUCTION FACILITY
EXTENDER OIL
TREATED PROCESS
WATER
EXTENDER OIL
MAKEUP
WATER
CARBONBLACK
CARBON BLACKSLURRY
SPILLS
WASHDOWNWASTEWATER
ACTIVATORCATALYSTMODIFIER
ACTIVATORCATALYSTMODIFIERSOLUTIONS
SOAP
SOAPSOLUTION
TREATED PROCESSWATER
EQUIPMENT
EQUIPMENTCLEANUP
WASTEWATER WASTEWATER
WASTEWATER
WASTEWATER
WASTEWATER
WASTEWATER
LIVE STEAM
CLEANUP
LATEXSTORAGE
STEAMSTRIPPING
VACUUMDISTILLATION
POLYMER-IZATIONREACTORS
SHORTSTOP
RECYCLE RECYCLE
HEAVYMONOMERSEPARATION
LIGHTMONOMERSEPARATION
COAGULATINGSULFURICACID
COAGULATINGBRINE
OV
ER
FLO
W
OV
ER
FLO
W
COAGULATIONAND
SCREENING
CRUMB RINSING
ANDDEWATERING
DRYING BALING
STEAMLIVE
STEAM
PRODUCTSTORAGE
ANDSHIPPING
COOLINGTOWER
COOLINGWATERTREATMENT
RAW INTAKE
WATER
COOLINGWATERSUPPLY
WASTEWATER
UNINHIBITED MONOMER
INHIBITEDMONOMER
SPENTCAUSTIC
MONOMERINHIBITORREMOVALANDWASH
MONOMERSTORAGE
RAW INTAKE
WATER
CARBON BLACK SUPPLY
WASTEWATER
MONOMER
DELIVERY
BLOW−DOWN
BLOW−DOWN
EQUIPMENTCLEANUP
EQUIPMENTCLEANUP
ANTIOXIDANT
WASTEWATER WASTEWATER
EQUIPMENTCLEANUP
WASTEWATER
CO
AG
UL
AT
ION
LIQ
UO
R
RE
TU
RN
RIN
SE W
AT
ER
FIL
TR
AT
E
RIN
SE
WA
TE
R R
ET
UR
N
SCR
EE
NE
D C
OA
GU
LA
TIO
N
LIQ
UO
R
MAKEUP
WATER

Wastes from Industries 113
The production process begins with removalof the polymerization inhibiters, by passage ofthe monomer through a caustic scrubber. Themonomers to be polymerized are mixed withsoap solution, deionized water, catalyst, activa-tor, and modifiers before entering the first of aseries of reactors. The purpose of the soapsolution (or detergent) is to hold the entire mix-ture in a stable emulsion throughout the poly-merization process. Rosin acid soap or fattyacid soap is typically used. The purpose of thecatalyst is to generate free radicals to initiateand maintain polymerization. Typical catalystsused are hydroperoxides or peroxysulfates.
The function of the activator is to assist thecatalyst in generating free radicals, as well asto enable reaction at a lower temperature. Themodifier acts to control the length of the poly-merized chain and, consequently, the size (andmolecular weight) of the polymer. The processis operated as either cold (40−45oF at 0−15psig) or hot (122oF at 40−60 psig), to producecold SBR or hot SBR, respectively. Cold SBRprocesses are stopped at 60% polymerization.Hot SBR processes, the older of the two, areallowed to proceed to near completion of thepolymerization process.
Cold rubbers have improved properties,compared to hot rubbers, but require moreextensive process management. The emulsifiedmixture resulting from the initial mixing ofmonomers and additives must be kept cool bymeans of an ammonia refrigerant before enter-ing the reactors. Also, a shortstop solution mustbe added to the solution exiting the reactor, inorder to halt the polymerization process at 60%completion. Then, the unreacted monomers, aswell as the catalysts, activators and modifiers,water, and emulsifiers, must be separated fromthe polymerized material, reconditioned, andreturned for continued use.
The shortstop solution is made up of sodiumdimethyl dithiocarbonate and hydroquinone.The 60% reacted mixture, at the point of beingstopped, is milky-white in appearance and iscalled latex. Although it resembles the sapfrom the natural rubber tree in appearance, thetwo are not to be confused with each other.
The next step is recovery of unreacted buta-diene by use of a vacuum flash tank. Recoveryof styrene is accomplished by use of perforatedplate stripping columns. The stripped latexmust be protected from oxidation by oxygen orozone. This is accomplished by adding an anti-oxidant in a blend tank. The polymerized mate-rial is then separated from the remaining latexby coagulation, which is brought about byaddition of dilute sulfuric acid (pH 4−4.5) andsodium chloride (brine). At this point, the prod-uct is called crumb. Carbon black and variousoils are added to the crumb to produce desiredproperties, including color.
Separation of the coagulated crumb isaccomplished on a shaker screen. The liquor isthen returned for reuse, after reconditioning byaddition of fresh acid and brine. The crumb iswashed by resuspension in water in a reslurrytank. Gravity separators, called crumb pits, areused as clarifiers to recover floatable crumbrubber from both the liquor having passedthrough the shaker screen and overflow fromthe reslurry tank.
The filtered and washed crumb rubber isdried by use of hot air, then weighed, baled,and stored for shipping.
Solution Crumb ProductionProduction of crumb rubber by the solutioncrumb process allows the use of stereo-specificcatalysts that are able to produce polymersnearly identical to natural rubber. In the properorganic solvent, as opposed to an emulsion, asused in emulsion polymerization, the cis struc-ture can be obtained in an amount up to 98% ofthe total.
Figure 4-15 is a schematic diagram of a solu-tion polymerized crumb rubber productionfacility. As can be seen, there are similarities tothe emulsion polymerization process but sev-eral important differences. Solution polymer-ization requires that the monomers be of a veryhigh degree of purity. The solvent in which themonomers, catalyst, and modifiers are dis-solved must also be absolutely anhydrous. Thepolymerization process proceeds to over90% completion, in contrast to the emulsion

114Industrial W
aste Treatment H
andbook
Figure 4-15
General w
ater flow diagram
for a solution polymerized crum
b rubber production facility.
HEAVY
MONOMER
SEPARATION
LIGHT
MONOMER
SEPARATION
TO MONOMER
RECOVERY
SOLVENT
SEPARATION
TO MONOMER
STEAM
STEAM
WASTE−WATER
HEAVY
SLOPS
WASTEWATER WASTEWATER
MONOMERSTORAGE
MONOMERINHIBITORREMOVALAND WASH
INHIBITEDMONOMER
MONOMERDELIVERY
FEEDDRYING
POLYMER-IZATIONREACTOR
CEMENTSTORAGE
STEAMSTRIPPINGANDCOAGULATION
DEWATERINGSCREENING
DRYING BALING
PRODUCTSTORAGEANDSHIPPING
NOTE
EXTENDER OIL AND CARBONBLACK ARE NOT ADDED TONONEXTENDED RUBBERTYPES
MAKEUPWATER
SLU
RR
Y W
AT
ER
RE
TU
RN
COOLINGTOWER
COOLINGWATERSUPPLY
COOLINGWATERRETURN
COOLINGWATERTREATMENT
RAWWATER
CRUMPSLURRY
WATERTREATMENTUNITS
TREATEDPROCESSWATER
CONDENSATERETURN
BOILERHOUSE
SUPPLY
STREAMBOILER FEED WATER
WASTEWATER
WASTEWATER
REGENERATIONWASTES
RAW
INTAKE
WATER
CATALYSTMONOMER
ANTIOXIDANT
EXTENDEROIL
CARBONBLACK
CARBON BLACKSLURRY
EXTENDER OIL
CARBON BLACK SLURRY
MAKEUPWATER
WASTEWATERSPILLS
WASHDOWN
STEAM
SOLVENTSTORAGE
UNINHIBITED MONOMER
SCR
EE
NE
D S
LU
RR
Y W
AT
ER
LIVESTEAM
SPENTCAUSTIC
WASTEWATER
GENERAL WATER FLOW DIAGRAM FOR A SOLUTION POLYMERIZEDCRUMB RUBBER PRODUCTION FACILITY
BLOW-DOWN
OVERFLOW
WASTEWATER
BLOW−DOWN
WASTEWATER

Wastes from Industries 115
polymerization process, which is stopped bythe introduction of the shortstop solution at thepoint of 60% completion.
Figure 4-15 shows that the stored monomersare pumped from the tank farm throughcaustic soda scrubbers to remove polymeriza-tion inhibitors. The monomers proceed tofractionater-drying towers, where water isremoved. These towers are also used to removewater from recycled as well as fresh solvents.The monomers and solvents are mixed to pro-duce mixed feed, and catalysts are added. Thisbegins the polymerization process, which isexothermic. For this reason, the reaction ves-sels must be cooled, typically by an ammoniarefrigerant. The shortstop solution is addedafter the reaction has reached 90% or morecompletion.
After the polymerization reaction has beenhalted, additional substances are added, includ-ing antioxidants and oil for oil extension. Themixture is then transferred to a coagulationvessel, where the polymerized material precipi-tates as the crumb. Carbon black is typicallyadded at this point.
The mixture is now ready for separation ofthe crumb from the liquor and separation ofsome of the components of the liquor for reuse.A series of strippers is used to strip off solventsand unreacted monomers. The vapors of mono-mers and solvents are condensed and sent to adecant system. The organic portion is returnedto the fractionator. Decant is discharged aswastewater. The stripped crumb slurry is sepa-rated further and proceeds to a vibratingscreen, where it is washed with water. Most ofthe washwater recycles to the coagulationstage, and the rest is discarded as blow-down.The crumb is dried, baled, and stored for ship-ment to a processor.
Specialty Products Far less important in terms of annual produc-tion totals, but important in terms of pollutantgeneration, are the specialty rubbers. Theseproducts have more diverse composition aswell as end uses. The largest of these, in termsof production volume, are the butadiene
rubbers, which are sold by producers in alatex form as opposed to the crumb rubberform.
Production of latex is the same as emulsioncrumb production, except that the coagulationstep for separation of the crumb rubber fromthe liquor is not carried out. Another differ-ence, important in terms of pollutants gener-ated, is that in latex production, polymerizationis allowed to proceed essentially to completion.This is in contrast to the production of crumbrubber, in which the polymerization process isstopped at the point of 60% completion. Con-sequently, recovery of unpolymerized mono-mer is not feasible. Figure 4-16 presents aschematic of the latex production process.
Wastes GenerationThe generation of wastes at manufacturingfacilities engaged in the production of syntheticrubber depends to an unusually high degree onhow well the entire facility is managed to pre-vent such generation. Raw materials aredelivered as bulk liquids, and the delivery pro-cess can be pollution free if there are no spillsand fumes are contained. The entire process,except for the clarification and decant steps, iscontained within tanks, pumps, piping systems,and mixing vessels; therefore, the only oppor-tunities for air pollution are from leaks andsloppy handling. The only solid materialinvolved in the production process that is ofsignificant volume is the product rubber itself.Any loss of this material to solid waste is a lossof valuable product.
Solid WastesSolid wastes requiring management at atypical synthetic rubber production facilityshould be only those nonproduction-relatedwastes such as packaging and shippingwastes, construction debris from plant main-tenance, modifications, expansions, and peri-odic facility upgrade projects. In addition,sludges from wastewater treatment and wasteresins from process water deionization requiremanagement.

116Industrial W
aste Treatment H
andbook
Figure 4-16
Schematic of the em
ulsion latex production process.
SUPPLYSTREAM
TREATEDPROCESSWATER
CONDENSATERETURN
BOILERHOUSE
WASTEWATERWASTEWATER
WASTEWATER
WATERTREATMENTUNITS
RAW INTAKE
WATER
BLOW−DOWN
WASTEWATER
SPENT CAUSTIC
GENERAL WATER FLOW DIAGRAM FOR AN EMULSION LATEX RUBBER PRODUCTION FACILITY
TREATED WATER PROCESS
TREATED WATER PROCESS
ACTIVATORCATALYSTMONOMER
ACTIVATORCATALYSTMONOMERSOLUTION
RAW INTAKE WATERCOOLINGTOWERTREATMENT
COOLINGTOWER
COOLINGWATERRETURN
COOLINGWATERSUPPLY
BLOW−DOWN
MAKEUP WATER
MONOMERINHIBITORREMOVALAND WASH
POLYMER-IZATIONREACTORS
INHIBITED
MONOMER
UNINHIBITED MONOMER
LIGHTMONOMERVACUUMDISTILLATION
HEAVYMONOMERSTEAMSTRIPPING
LATEXBLENDINGAND BULKSTORAGE
PRODUCTDRUMMINGSTORAGEAND SHIPPING
LIGHT MONOMERTO ATMOSPHERE
VACUUM SOURCE(STEAM JET ORVACUUM PUMP)WITHOUTCONDENSER
EJECTOR(STEAM JET ORVACUUM PUMP)WITH CONDENSER
VACUUM PUMPSEAL WATER
STABILIZERANTIOXIXXNTS
EQUIPMENT CLEANUPEQUIPMENT CLEANUPLIVE
STEAM
WASTEWATER
MONOMER AND STEAM
CONDENSATE
WASTEWATER WASTEWATER
EQUIPMENT CLEANUPEQUIPMENTCLEANUP
SOAP
SOAPSOLUTION
MONOMERSTORAGE
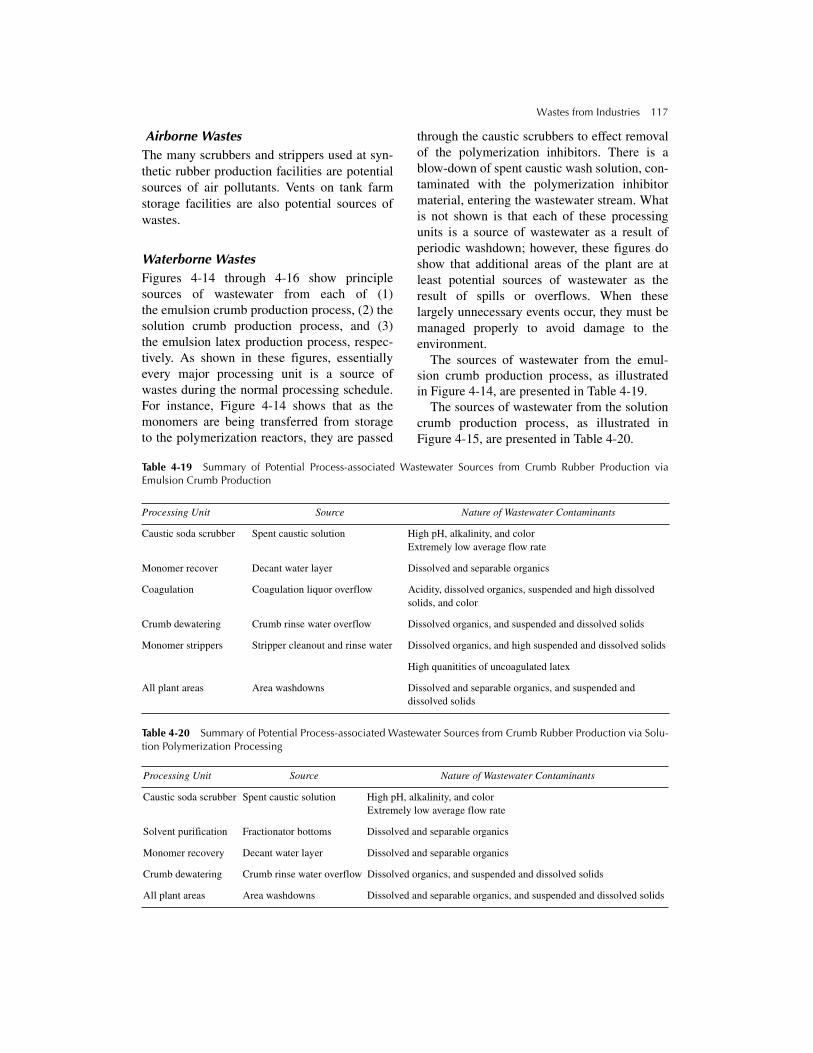
Wastes from Industries 117
Airborne WastesThe many scrubbers and strippers used at syn-thetic rubber production facilities are potentialsources of air pollutants. Vents on tank farmstorage facilities are also potential sources ofwastes.
Waterborne WastesFigures 4-14 through 4-16 show principlesources of wastewater from each of (1)the emulsion crumb production process, (2) thesolution crumb production process, and (3)the emulsion latex production process, respec-tively. As shown in these figures, essentiallyevery major processing unit is a source ofwastes during the normal processing schedule.For instance, Figure 4-14 shows that as themonomers are being transferred from storageto the polymerization reactors, they are passed
through the caustic scrubbers to effect removalof the polymerization inhibitors. There is ablow-down of spent caustic wash solution, con-taminated with the polymerization inhibitormaterial, entering the wastewater stream. Whatis not shown is that each of these processingunits is a source of wastewater as a result ofperiodic washdown; however, these figures doshow that additional areas of the plant are atleast potential sources of wastewater as theresult of spills or overflows. When theselargely unnecessary events occur, they must bemanaged properly to avoid damage to theenvironment.
The sources of wastewater from the emul-sion crumb production process, as illustratedin Figure 4-14, are presented in Table 4-19.
The sources of wastewater from the solutioncrumb production process, as illustrated inFigure 4-15, are presented in Table 4-20.
Table 4-19 Summary of Potential Process-associated Wastewater Sources from Crumb Rubber Production viaEmulsion Crumb Production
Table 4-20 Summary of Potential Process-associated Wastewater Sources from Crumb Rubber Production via Solu-tion Polymerization Processing
Processing Unit Source Nature of Wastewater Contaminants
Caustic soda scrubber Spent caustic solution High pH, alkalinity, and color Extremely low average flow rate
Monomer recover Decant water layer Dissolved and separable organics
Coagulation Coagulation liquor overflow Acidity, dissolved organics, suspended and high dissolved solids, and color
Crumb dewatering Crumb rinse water overflow Dissolved organics, and suspended and dissolved solids
Monomer strippers Stripper cleanout and rinse water Dissolved organics, and high suspended and dissolved solids
High quanitities of uncoagulated latex
All plant areas Area washdowns Dissolved and separable organics, and suspended and dissolved solids
Processing Unit Source Nature of Wastewater Contaminants
Caustic soda scrubber Spent caustic solution High pH, alkalinity, and colorExtremely low average flow rate
Solvent purification Fractionator bottoms Dissolved and separable organics
Monomer recovery Decant water layer Dissolved and separable organics
Crumb dewatering Crumb rinse water overflow Dissolved organics, and suspended and dissolved solids
All plant areas Area washdowns Dissolved and separable organics, and suspended and dissolved solids
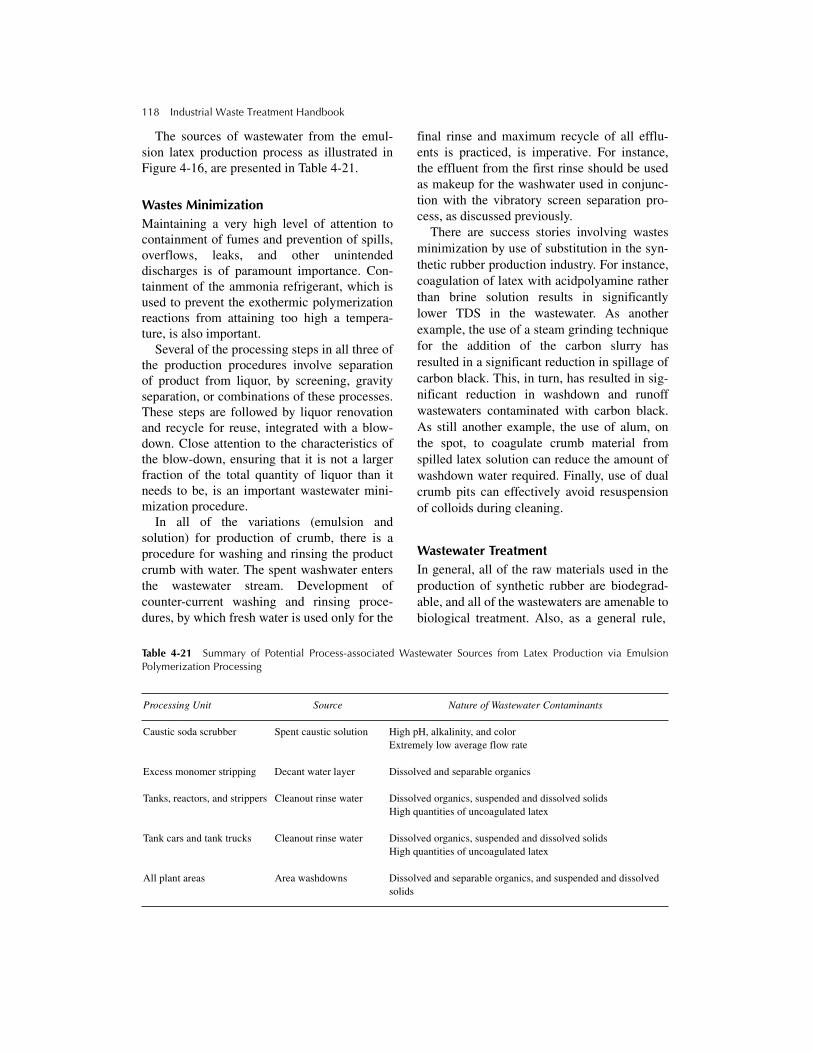
118 Industrial Waste Treatment Handbook
The sources of wastewater from the emul-sion latex production process as illustrated inFigure 4-16, are presented in Table 4-21.
Wastes MinimizationMaintaining a very high level of attention tocontainment of fumes and prevention of spills,overflows, leaks, and other unintendeddischarges is of paramount importance. Con-tainment of the ammonia refrigerant, which isused to prevent the exothermic polymerizationreactions from attaining too high a tempera-ture, is also important.
Several of the processing steps in all three ofthe production procedures involve separationof product from liquor, by screening, gravityseparation, or combinations of these processes.These steps are followed by liquor renovationand recycle for reuse, integrated with a blow-down. Close attention to the characteristics ofthe blow-down, ensuring that it is not a largerfraction of the total quantity of liquor than itneeds to be, is an important wastewater mini-mization procedure.
In all of the variations (emulsion andsolution) for production of crumb, there is aprocedure for washing and rinsing the productcrumb with water. The spent washwater entersthe wastewater stream. Development ofcounter-current washing and rinsing proce-dures, by which fresh water is used only for the
final rinse and maximum recycle of all efflu-ents is practiced, is imperative. For instance,the effluent from the first rinse should be usedas makeup for the washwater used in conjunc-tion with the vibratory screen separation pro-cess, as discussed previously.
There are success stories involving wastesminimization by use of substitution in the syn-thetic rubber production industry. For instance,coagulation of latex with acidpolyamine ratherthan brine solution results in significantlylower TDS in the wastewater. As anotherexample, the use of a steam grinding techniquefor the addition of the carbon slurry hasresulted in a significant reduction in spillage ofcarbon black. This, in turn, has resulted in sig-nificant reduction in washdown and runoffwastewaters contaminated with carbon black.As still another example, the use of alum, onthe spot, to coagulate crumb material fromspilled latex solution can reduce the amount ofwashdown water required. Finally, use of dualcrumb pits can effectively avoid resuspensionof colloids during cleaning.
Wastewater TreatmentIn general, all of the raw materials used in theproduction of synthetic rubber are biodegrad-able, and all of the wastewaters are amenable tobiological treatment. Also, as a general rule,
Table 4-21 Summary of Potential Process-associated Wastewater Sources from Latex Production via EmulsionPolymerization Processing
Processing Unit Source Nature of Wastewater Contaminants
Caustic soda scrubber Spent caustic solution High pH, alkalinity, and color Extremely low average flow rate
Excess monomer stripping Decant water layer Dissolved and separable organics
Tanks, reactors, and strippers Cleanout rinse water Dissolved organics, suspended and dissolved solids High quantities of uncoagulated latex
Tank cars and tank trucks Cleanout rinse water Dissolved organics, suspended and dissolved solids High quantities of uncoagulated latex
All plant areas Area washdowns Dissolved and separable organics, and suspended and dissolved solids

Wastes from Industries 119
those wastewaters generated by emulsioncrumb and emulsion latex production proce-dures require chemical coagulation (to breakthe emulsions) before chemical treatment. Thisis not true of the solution polymerized produc-tion wastewaters. Following appropriatepreliminary treatment, conventional primarytreatment by gravity clarification, possiblyaided by settling aids, secondary treatment byany of the variations of the activated sludgeprocesses, with appropriate addition of nitro-gen and phosphorus as nutrients, and additionaltreatment as required for compliance withreceiving water classification requirements, hasbeen successful. Those additional treatmenttechnologies have included sand filtration andmixed media filtration.
An equalization system preceding thewastewater treatment system can effectivelyeven out the flows and loads, and allow con-struction and operation of a smaller treatmentsystem. Also, pH control in conjunction withthe equalization system has been effective inimproving the performance of primary clarifi-cation. Settling aids such as cationic polymersmay improve the performance of primaryclarification.
Wastewater characterization parameters thathave been of significance are the conventionalparameters, namely, pH, TSS, BOD5, COD,and O&G. Other parameters have includedTDS, acidity, alkalinity, surfactants, color, andtemperature. The COD-to-BOD ratio is typi-cally high because of COD demand of inor-ganic constituents. COD values have rangedfrom about 9 pounds per thousand pounds ofproduct for wastewaters from the solutioncrumb process to about 35 pounds per thousandpounds of product for the emulsion latex pro-cess. BOD values have ranged from about onepound per thousand pounds of product (solu-tion crumb) to about 5 pounds per thousandpounds of product in the case of the emulsioncrumb process.
Wastewaters from emulsion crumb and latexplants are characterized by high values of TSS,due, usually, to uncoagulated latex. In general,TSS values have ranged from about 3 poundsper thousand pounds of product, for solution
crumb wastewaters, to about 6 pounds perthousand pounds of product for emulsion latexwastewaters. Total dissolved solids are typi-cally attributable to carbonates, chlorides, sul-fates, phosphates, and nitrates of calcium,magnesium, sodium, and potassium. Traces ofiron and manganese can also be present. Amajor source of TDS from the emulsion crumbprocess has been the liquor from the coagula-tion process that was used to separate thecrumb. High TDS values are also characteristicof wastewaters from the solution crumb andemulsion latex processes.
O&G in wastewaters from all synthetic rub-ber production processes have been attributedto undissolved monomers and extender oils.Leaked or spilled machine lubricating oils andhydraulic fluids are also potential sources.
The Soft Drink Bottling Industry
In the late 1800s, the then fledgling U.S. softdrink industry was party to the introduction ofa new drink made from African kola nut andcocoa extracts and water saturated with carbondioxide. The first cola drink thus began what isnow one of the world’s major industries. Thisindustry is still experiencing significant growthin the early 2000s.
Production of Bottled Soft DrinksThe soft drink industry’s products (in the U.S.)are divided into two categories: soda water andcolas, also known as peppers. Soda water issimply water saturated with carbon dioxide.Saturation is defined as that amount of carbondioxide dissolved, at equilibrium, under a pres-sure of one atmosphere (about 15 psig) at atemperature of 60oF. This quantity is referredto as one volume of carbon dioxide. A cola (orpepper) must contain caffeine from the kola nutor from extracts of other natural substances. Inthe United States, the quantity of caffeine is notallowed to exceed 0.02% by weight. The exactformula for most commercial beverages is pro-prietary and closely guarded; however, the twoformulas in Table 4-22 are said to berepresentative.

120 Industrial Waste Treatment Handbook
Table 4-22 Typical Soft Drink Formulas Table 4-23 presents a general summary ofthe ingredients of various types of carbonatedsoft drinks.
Sweeteners include dry or liquid sucrose,invert sugars, dextrose, fructose, corn syrup,glucose syrups, sorbitol, or an artificial sub-stitute. Flavorings are often used in a carriersuch as ethanol, propylene glycol, glycerin,or may be in the form of fruit juice extracts,or the juices themselves, dehydrated or fullstrength, or extracts from bark, vegetables,roots, or leaves. Edible acids used includeacetic, citric, fumaric, gluconic, lactic, malic,tartaric, or phosphoric. This statement ofingredients is by no means intended to becomplete; rather, it is intended to illustratethe variety of substances the environmentalengineer may be confronted with in situa-tions involving spills, leaks, or sloppy man-agement of the production plant.
Figure 4-17 presents a flow diagram of atypical soft drink bottling industrial facility.The term bottling is used generically to includepackaging, under a pressure of about oneatmosphere, in bottles, cans, plastic containers,kegs, or other bulk containers. The first signifi-cant activity is delivery of raw materials to thereceiving and storage facilities, usually a rela-tively small tank farm. Also, water is signifi-cant activity is delivery of raw materials
Table 4-23 Types of Soft Drinks
Soft Drink Ingredients (General)
Carbonated Cola Beverage
Sugar syrup, 76 Brix 305.00 ml
Phosphoric Acid, 85% 1.25 ml
Caffeine solution, 4%* 10.00 ml
Caramel color, double strength 4.00 ml
Natural cola flavor 2.00 ml
Water 177.75 ml
*Caffeine solution, 4% (wt/wt)
Sodium benzoate 5%
Water 91%
Caffeine 4%
Pale Dry Ginger Ale
Pale dry ginger ale flavor 2.00 ml
Citric acid solution, 50% 9.20 ml
Sodium benzoate solution, 18% 5.00 ml
Carmel color 2X, 20% solution 0.30 ml
Sugar syrup, 76 Brix 248.00 ml
Water 235.50 ml
Soft Drink Flavors Color Sugar (%) Edible Acid
Carbon Dioxide
(CO2)(volume of gas)
Cola Extract of kola nut, lime oil, spice oils, and caffeine
Caramel 11–13 Phosphoric 3.5
Orange Oil of orange and orange juice Sunset yellow FCF with some Tartrazine
12–14 Citric 1.5–2.5
Ginger ale Ginger root oil or ginger, and lime oil
Caramel 7–11 Citric 4.0–4.5
Root beer Oil of wintergreen, vanilla, nut-meg, cloves, or anise
Caramel 11–13 Citric 3
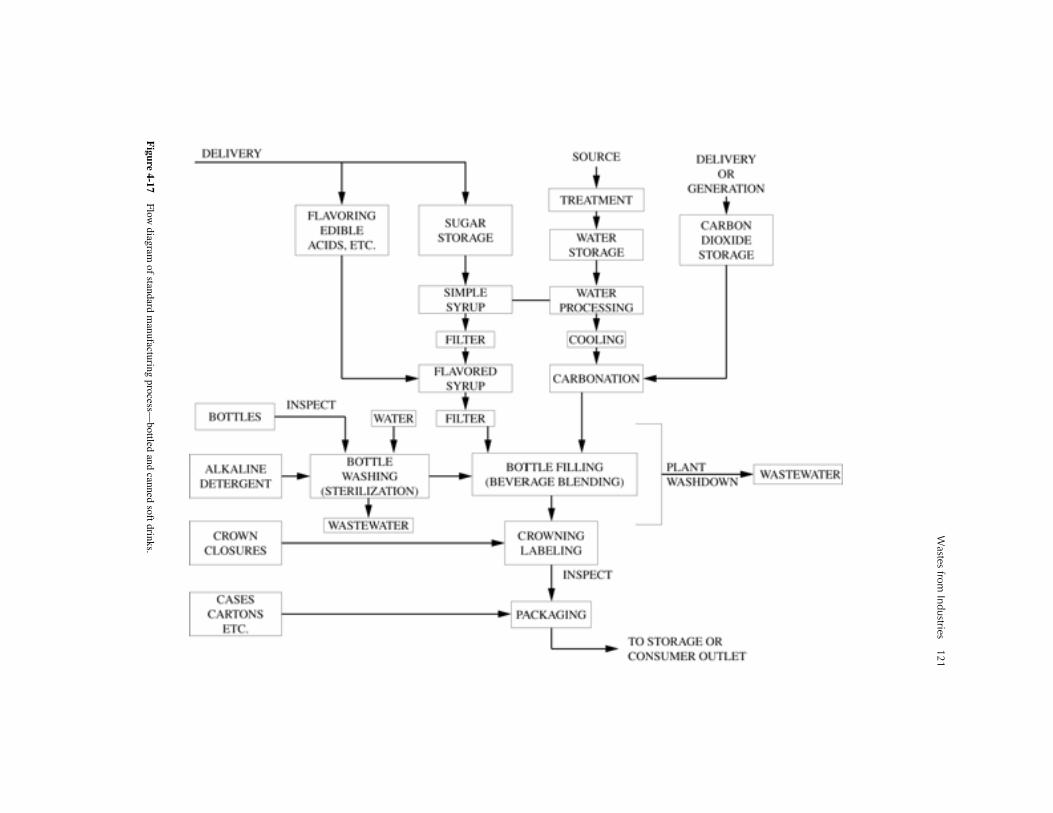
Wastes from
Industries121
Figure 4-17
Flow diagram
of standard manufacturing process—
bottled and canned soft drinks.

122 Industrial Waste Treatment Handbook
to the receiving and storage facilities, usually arelatively small tank farm. Also, water isstored, after treatment to the specifications ofthe bottling company on the one hand and therequirements of applicable agencies and fed-eral, state, and local regulations on the otherhand. Carbon dioxide may be delivered to thesite or may be generated on site.
Treatment of the water may include simplefiltration or activated carbon adsorption, or itmay include extensive treatment such ascoagulation, flocculation, and sedimentation,followed by filtration, activated carbon adsorp-tion, disinfection, and dechlorination. In addi-tion to high-quality water from the standpointof health, the concerns of the bottling companyare any substances in the water that may affecttaste, or high carbonate hardness, which cancause the beverages to go flat in a short amountof time. Also, certain heavy metal ions cancause rapid loss of carbonation. Desirable char-acteristics of the water to be used in soft drinkproduction include complete absence of bacte-ria, turbidity, dissolved carbon dioxide, andchlorine.
Preparation of the bottles (or other contain-ers) includes washing and sterilization. As willbe discussed later, this process represents oneof the most important and largely unavoidable(but not amenable to minimization) sources ofwastewater. Reusable bottles require washingin a hot caustic solution. They are then sub-jected to the washing and rinsing proceduresused on new bottles.
The mixing of ingredients by transferringthem from storage to blending systems is oneof three major operations in the soft drinkproduction process. However this is accom-plished, whether by means of pumps andpipes, or by use of transfer vessels, clean-upoperations at the end of each processing day,and, in some cases, throughout the processingday, it represents a major source of wastegeneration.
The next steps after mixing are carbonationand bottling, usually done concurrently. Here,again, no true wastewater is generated, exceptunintentionally as from spills, leaks, brokenbottles or other containers, or, in very rare
instances, the need to discard a bad batchbecause of contamination. Daily washdown ofequipment, of course, is an ever-present majorsource of wastewater.
After bottling, the filled and sealed contain-ers are labeled, then packaged for storage and/or shipment.
Wastes GenerationExcept for boiler operation, the bottled softdrink industry is not a significant source of airpollutants. Both solid wastes and waterbornewastes, however, are of major concern to plantand environmental managers.
Solid WastesThere are several significant sources of solidwastes from the bottled soft drink industry. Thefirst, using the flow-through of materials fromreceipt and storage to shipment of final productas the approach, is the discarded (and not recy-cled) material used for packaging and shippingraw materials to the facility. There are also thematerials intended for recycle that are found tobe unacceptable for recycling. Next, there arethe residuals from treatment of the water to beused in the product. Then, there are the sub-stances cleaned from the processing facilityfloor during clean-up operations. This caninclude broken bottles or other objects, lostcaps, and discarded personal items fromemployees. The residuals from wastewatertreatment constitute a major source of solidwastes. Finally, there are the items discardedfrom labeling and packaging the product forstorage and/or shipment.
Nonprocess-related solid wastes includeconstruction debris from plant upgrades, facil-ity expansions, general facility repair, andupkeep, and incidental wastes such as garbageand trash from the cafeteria. In general, thereare no hazardous wastes from these facilities.
Waterborne Wastes The major sources of wastewater from soft drinkbottling operations include plant washdownwastewater and the wastewater from washing

Wastes from Industries 123
bottles (and other containers), as shown in Fig-ure 4-17. Plant washdown water includes thewater used to clean the machines, pumps, pipes,and mixing and bottling equipment, as well as towash the floors and the general work area.
Wastes MinimizationWastes minimization at soft drink bottlingfacilities is best accomplished by the following:
• Installing overflow warning devices on allstorage tanks, mixing tanks, blending tanks,and holding tanks.
• Using biodegradable detergents.
• Containing drips and returning them to thesource.
• Practicing aggressive maintenance to elimi-nate the occurrence of leaks or otheraccidents that could lead to noncontainmentof sweeteners, finished product, and othersubstances.
• Using dry methods of clean-up, includingbrooms, shovels, and dry vacuuming, to themaximum extent.
• Rinsing bottles after cleaning in a counter-current manner, with respect to freshwatermakeup and spent rinsewater overflow.
Wastewater TreatmentBecause no nonbiodegradable substances areused at soft drink bottling facilities, all waste-waters are amenable to biological treatment.As a general rule, no pretreatment other thanscreening and pH adjustment is required beforesecondary treatment by either an on-site bio-logical treatment system or at a POTW.Adjustment of pH is required because of thecaustic used for cleaning bottles, pipes, tanks,floors, and mixing and bottling machinery.
A two-stage aerated lagoon has been usedwith success at a bottling plant in NewEngland. The layout and characteristics of thissystem are as follows:
• The first lagoon is operated as a sequencingbatch reactor.
• The second lagoon is operated as a conven-tional aerobic lagoon.
• Potassium is added to both lagoons as anutrient.
The primary reasons for selecting the two-lagoon system were as follows:
• Lagoons, because of their relatively largevolume, are capable of withstanding largevariations in flows and loads, pH, and con-centrations of chlorine.
• The sandy nature of the soil in the area ofthe plant would allow percolation of liquidinto the ground and to the groundwater forremoval from the area.
• There was ample distance to the groundwaterfor complete treatment (renovation of thewastewater) before reaching the groundwater.
• The sandy nature of the soil allowed freemovement of oxygen into the soil to supportthe in situ, on-site biological treatment.
• It was calculated that sludge would have tobe removed only once every 5 to 10 years.
The Pepsi Corp. has patented a wastewatertreatment system having the following layoutand operational characteristics:
• Waste from the returned bottle prerinse wasdirected to a trickling filter operated as aroughing filter.
• The effluent, along with the sloughingsfrom the roughing filter, were directed to anoxidation tank, which also received flowfrom the bottling area in the processingplant, the plant washdown water, and thewastewater from a solids separator used forthe process water filter backwash.
• The oxidation tank was aerated with air forbiological treatment as well as ozone forchemical oxidation.
• The effluent from the oxidation tankflowed to an aerated mixing tank, where itmixed with wastewater from the final bottlerinse.
• This mixture flowed to an activated sludgeaeration tank followed by a final clarifier,then a disinfection tank, where ozone wasadded as the disinfectant and pH was givena final adjustment before discharge.
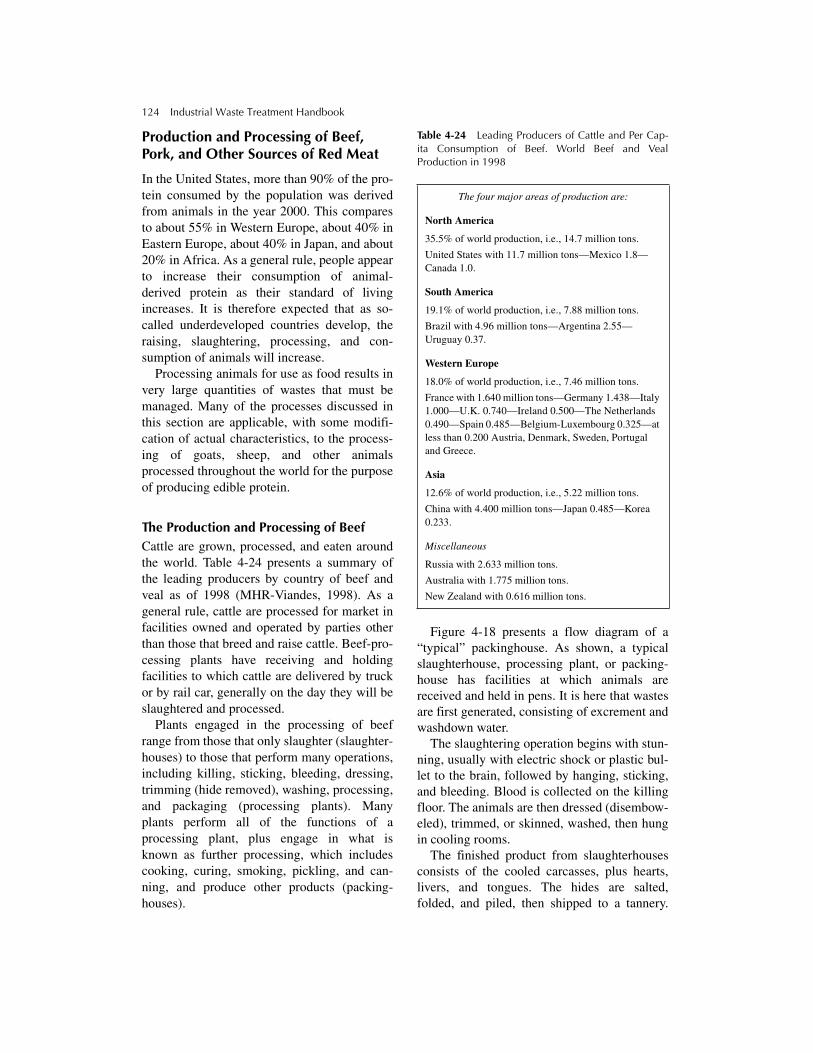
124 Industrial Waste Treatment Handbook
Production and Processing of Beef, Pork, and Other Sources of Red Meat
In the United States, more than 90% of the pro-tein consumed by the population was derivedfrom animals in the year 2000. This comparesto about 55% in Western Europe, about 40% inEastern Europe, about 40% in Japan, and about20% in Africa. As a general rule, people appearto increase their consumption of animal-derived protein as their standard of livingincreases. It is therefore expected that as so-called underdeveloped countries develop, theraising, slaughtering, processing, and con-sumption of animals will increase.
Processing animals for use as food results invery large quantities of wastes that must bemanaged. Many of the processes discussed inthis section are applicable, with some modifi-cation of actual characteristics, to the process-ing of goats, sheep, and other animalsprocessed throughout the world for the purposeof producing edible protein.
The Production and Processing of BeefCattle are grown, processed, and eaten aroundthe world. Table 4-24 presents a summary ofthe leading producers by country of beef andveal as of 1998 (MHR-Viandes, 1998). As ageneral rule, cattle are processed for market infacilities owned and operated by parties otherthan those that breed and raise cattle. Beef-pro-cessing plants have receiving and holdingfacilities to which cattle are delivered by truckor by rail car, generally on the day they will beslaughtered and processed.
Plants engaged in the processing of beefrange from those that only slaughter (slaughter-houses) to those that perform many operations,including killing, sticking, bleeding, dressing,trimming (hide removed), washing, processing,and packaging (processing plants). Manyplants perform all of the functions of aprocessing plant, plus engage in what isknown as further processing, which includescooking, curing, smoking, pickling, and can-ning, and produce other products (packing-houses).
Table 4-24 Leading Producers of Cattle and Per Cap-ita Consumption of Beef. World Beef and VealProduction in 1998
Figure 4-18 presents a flow diagram of a“typical” packinghouse. As shown, a typicalslaughterhouse, processing plant, or packing-house has facilities at which animals arereceived and held in pens. It is here that wastesare first generated, consisting of excrement andwashdown water.
The slaughtering operation begins with stun-ning, usually with electric shock or plastic bul-let to the brain, followed by hanging, sticking,and bleeding. Blood is collected on the killingfloor. The animals are then dressed (disembow-eled), trimmed, or skinned, washed, then hungin cooling rooms.
The finished product from slaughterhousesconsists of the cooled carcasses, plus hearts,livers, and tongues. The hides are salted,folded, and piled, then shipped to a tannery.
The four major areas of production are:
North America
35.5% of world production, i.e., 14.7 million tons.
United States with 11.7 million tons—Mexico 1.8—Canada 1.0.
South America
19.1% of world production, i.e., 7.88 million tons.
Brazil with 4.96 million tons—Argentina 2.55— Uruguay 0.37.
Western Europe
18.0% of world production, i.e., 7.46 million tons.
France with 1.640 million tons—Germany 1.438—Italy 1.000—U.K. 0.740—Ireland 0.500—The Netherlands 0.490—Spain 0.485—Belgium-Luxembourg 0.325—at less than 0.200 Austria, Denmark, Sweden, Portugal and Greece.
Asia
12.6% of world production, i.e., 5.22 million tons.
China with 4.400 million tons—Japan 0.485—Korea 0.233.
Miscellaneous
Russia with 2.633 million tons.
Australia with 1.775 million tons.
New Zealand with 0.616 million tons.

Wastes from Industries 125
Viscera, feet, and head bones are either sent toa rendering facility, or, in many cases, pro-cessed in an on-site rendering facility. Wastesfrom rendering are discussed in a separatechapter.
The next series of operations is referred to asprocessing. The carcasses are cut into smallersections or into individual cuts. At some plants,curing, smoking, canning, and possibly manyadditional activities take place.
Packinghouses are also capable, typically, ofperforming many by-product processing opera-tions, such as processing blood collected justafter the animals are killed, and rendering theinedible materials. Rendering refers to separat-ing the fats and proteinaceous materials byuse of heat and sometimes pressure. Fatsare harvested as lard and other products.Protein material is harvested as animal feedsupplement.
Figure 4-18 Flowchart for packinghouse. (From North Star Research & Development Institute, “Final Report, IndustrialWaste Study of the Meat Products Industry,” EPA Contract No. 68-01-0031.)
Manuretrap
LivestockPens
Animals
Killing Blood Processing
Hide Processing
Viscera Handling
InedibleRendering
EdibleRendering
HogHair Recovery
Hide Removal
Hog Dehairing
EvisceratingTrimming
Cooling
CuttingDeboning
Processing Grinding
CuringPicklingSmokingCookingCanning
Grease trapor
FlotationUnit
SecondaryTreatment
Solid WasteCompostingLand Fill
Solid Liquid Primary Secondary
ProductsProcessesWaste
Dried Blood
Hides
Hog Hair
LiverHeartKidneys
Tripe
Cut Meat
Carcasses
By-products
LardEdible tallow
Meat Products
Process Flow
Waste Flow
SLA
UG
HT
ER
HO
USE
PRO
CE
SSIN
G P
LA
NT
PAC
KIN
G H
OU
SE

126 Industrial Waste Treatment Handbook
The Production and Processing of PorkSimilar to the processing of beef, plantsengaged in the processing of swine range fromthose that only slaughter (slaughterhouses) tothose that perform many operations, includingkilling, scalding, dehairing, washing, eviscerat-ing, processing, and packaging (processingplants). Many plants perform all of the func-tions of a processing plant, plus engage in whatis known as further processing, which includescooking and producing bacon, sausage, andmany other products (packinghouses). Manyspecialty plants receive processed swine andproduce items such as summer sausage andspecialty meats, all of which can be catego-rized as “further processing.”
Production ProcessesIn the slaughterhouse portion of the operation,the animals are first stunned, usually by electricshock, then are hung over a bleeding trough.Movement of the animals is continuousthrough the next several steps, enabled by amoving conveyor, to which the hooks that hangthe animals are attached. As the animals moveover the bleeding trough, they are stuck (jugu-lar vein is cut), and the draining blood iscollected in a trough. The animals are thenpassed through a scalding tank, where very hotwater softens the hair follicles. After emergingfrom the scalding tank, the animals aredehaired, usually by abrasion from some typeof rotating rubber fingers in a machine thatbecomes extremely loaded with hair, bits ofhide, and blood throughout the processing day.An open flame singes the carcasses to removethe last traces of hair, and then they are sprayedwith water for cooling and washing.
At an increasing number of slaughteringfacilities, the animals are subjected to skinning,which eliminates the scalding and dehairing;however, the hides eventually have to becleaned and dehaired, which amounts to trans-ferring the waste management problem toanother location.
The next step is to open the carcasses (byhandheld knives) for disemboweling, referredto as the eviscerating procedure. The carcasses
are cut in half and hung in a cooler for 24 hoursor more. They are then cut into smaller sectionsor into individual cuts, and major differencesoccur from one packinghouse to another at thispoint. Swine (usually called hogs in the U.S.)are cut into hams, sides, shoulders, and loins.At some plants they are cured. Loins, however,are usually packaged without curing.
Heart, liver, and kidneys are washed and pro-cessed as edible meat products. Meat for sau-sage is ground and emulsified, then blendedwith herbs, spices, and nitrite and nitrate pre-servatives. The sausage mix may then be pack-aged or extruded into casings that have beenremoved from the outside of hog or other ani-mal intestines. Cellulose materials are alsoused for sausage casings. The sausage maythen be cooked or smoked, or packaged for saleas fresh. Smoking is accomplished by hangingthe meat or meat product in an atmosphere ofsmoke generated by burning hardwood sawdust(above 137ºF to prevent botulism). The cresolsfrom this burning process are responsible forthe characteristic flavor of smoked meat. Analternative process is to soak or inject the meator meat product in a solution of salt, sugar, andnatural and/or artificial flavorings.
Wastes GenerationAnimal slaughtering operations result in largequantities of solid, airborne, and waterbornewastes. Even when all possible materials arecontained and processed as by-products, thereare large quantities of solid wastes frompaunch manure and sludges from wastewatertreatment to be managed. There are many air-borne substances in the form of odors, and verylarge amounts of strong waterborne wastesfrom blood, plant washdown, and by-productoperations such as on-site rendering facilities.
Solid WastesGeneration of solid wastes begins in the receiv-ing and holding pen area. Wastes includeexcrement, washwater, and often, rainfallrunoff. Unless the holding pen area is coveredand has a well-engineered, constructed, and

Wastes from Industries 127
maintained stormwater management system,the runoff can become heavily contaminatedand represent a significant management prob-lem. Well managed, the excrement can remainas solid waste and be treated and disposed ofby use of composting (see Chapter 8) orapplied directly to farmland.
Hides are major products of animal slaugh-tering facilities. Although the hides themselvesare not solid waste, they typically contain largeamounts of excrement and dirt. This materialmust be removed and managed as waste mate-rial somewhere, either at the slaughterhouse orat the tannery.
Airborne WastesAir pollution from animal-processing facilitiesis typically a significant issue only if therelease of odors is not controlled. If a renderingplant is operated on site, it is a major issue.Rendering facilities are almost always sourcesof generation of nuisance odors. Typically, con-tainment and treatment by use of wet scrubberscan keep the problem under control.
Waterborne WastesAlmost every operation involving slaughteringand processing animals results in wastewater.Certain operations, such as the scalding of hogsas part of the cleaning and hair removal pro-cess, produce large volumes directly. Otheroperations, such as butchering, produce mostof the wastewater during clean-up activities.
Components of wastewater are blood,paunch manure, fat solids, meat solids, grease,oil, and hair. In-house laundry operations alsocontribute to wastes. Each beef stomach con-tains 55 to 80 pounds of paunch manure. Onehundred gallons or more of water are typicallyrequired to wash out a single paunch. Thisquantity can be reduced by using dry removaland handling systems.
Blood, a major contributor to the highstrength of wastewater, has more than 150,000mg/L of BOD5. Sources of blood within an ani-mal-processing facility begin at the killing andbleeding facility and continue on through the
processing facility. Normally, each successiveprocessing operation at a (complete) packing-house is a less important source of blood thanthe one before it; however, it is the usual prac-tice to combine wastewater from all sources atanimal-processing facilities before treatment.
Cutting and packaging operations (butcher-ing, or further processing) include additionaloperations that contribute to wastewater. Intes-tinal casings require squeezing or pressing toremove the contents. The casing used for pro-duction of edible foods such as sausages andhot dogs has to be removed from the outside ofthe intestine. The intestine itself is sent to therendering facility. The intestine casing issalted, then drained. This operation, as a whole,results in wastewater that is high in grease aswell as sodium chloride.
Scalding is used to process tripe, the muscu-lar part of an animal’s stomach. This processresults in wastewater containing grease andTSS. Again, all processing stations are washeddown each processing day, some several timeseach day. The washdown water is a majorsource of wastewater from any animal-process-ing facility.
In the case of slaughtering and processinghogs, the freshly killed and bled carcasses arescalded by immersion in a tank of near boilingwater to wash and prepare them for removal ofhair. The scalding tanks overflow at a certainconstant rate in order to prevent solids anddissolved materials (pollutants) from buildingup to an unacceptable level. This overflow con-stitutes a major source of wastewater from theprocessing of hogs. It is comparable to thescalder overflow encountered in the processingof chickens, turkeys, and ducks. The BOD5 ofany of these scalder overflow wastewaters istypically in the range of 2,000 to 5,000 mg/L.
Wastes MinimizationWashing the cattle, hogs, or other animalsbefore delivery to the slaughtering facilitycan best minimize solid wastes produced inholding pens. A second major source of solidmaterials to be managed is the sludges fromwastewater treatment and from air pollution

128 Industrial Waste Treatment Handbook
control; however, if the processes that createthese residuals are managed properly, they canbe used as raw material to the rendering facil-ity. The result will be twofold: a very largedecrease in solid wastes to be disposed of andan increase in the animal feed supplement pro-duced by the rendering facility.
Paunch manure should be handled by drymethods, such as dry conveyors and dry collec-tion systems. In addition, daily (or more often)plant clean-up should begin by thoroughsweeping, squeegeeing, air blast, or other feasi-ble dry method. All of the material thusremoved from the killing, bleeding, and pro-cessing equipment and floors can be processedinto animal feed supplement in an on-site oroff-site rendering facility.
Regarding airborne wastes, and, more spe-cifically, nuisance odors, the best minimizationstrategy is to maintain a scrupulously cleanfacility, in order to minimize putrefaction oforganic substances. The products of biodegra-dation, such as fatty acids, amines, amides, andreduced sulfur compounds such as hydrogensulfide and mercaptans, are responsible for badodors from meat-processing facilities.
Treatment and DisposalConsiderable similarity exists between themanagement of wastes from all types of redmeat production and processing facilities.Beef, pork, and most other red meat source ani-mals result in solid, airborne, and waterbornewastes that are appropriately managed in verymuch the same ways.
Solid WastesMost solids from meat-packing facilities areorganic. As such, they have a potential use. Theexcrement, and possibly the paunch manure,has been successfully processed in compostingfacilities and thus converted to useful materialsuch as fertilizer or soil improvement agent.Another use for paunch manure is as feed toappropriate rendering facilities.
All other solid materials resulting from theslaughtering and processing of animals can be
managed as feed for an appropriate renderingfacility.
Airborne WastesThe treatment of nuisance odors—the only airpollutants of consequence at red meat process-ing facilities—is done by containment and wetscrubbing. Containment usually means preven-tion of the release of fugitive emissions. Ifthere is a rendering facility on site, contain-ment definitely includes maintenance of anegative pressure in side buildings (comparedto the atmospheric pressure outside thebuildings). During windy periods, a greaterdifferential pressure is required. Blowing sig-nificant quantities of air from the inside of thebuildings to the outside, at a constant rate, cre-ates the negative pressure. Control of nuisanceodors is accomplished by exhausting the blow-ers through wet scrubbers. This technology isdiscussed more completely in the section titledRendering of By-Products from the Processingof Meat, Poultry, and Fish.
Waterborne WastesTreatment of wastewaters generated at slaugh-terhouses, processing plants, and/or packing-houses, where red meat is produced and pro-cessed, typically consists of biologicaltreatment preceded by screening and primarysedimentation. In some instances, dissolved airflotation (DAF) has either replaced primarysedimentation or has been placed between pri-mary sedimentation and biological treatment.The solids harvested from the DAF process(flot) can be used as raw material for renderingfacilities, resulting in production of a valuableanimal feed supplement.
Primary TreatmentScreening should be used to the maximum
extent feasible because the solids captured byscreening are excellent raw material for therendering process. Many different types ofscreens have been used successfully, includingshaking screens, tangential screens, conveyorscreens, rotary screens, and static screens. It
Wastes from Industries 129
may be necessary to place a grease trap aheadof the screening system to prevent blinding.
Flow equalization has been found to be valu-able and even necessary in some cases, toenable screening systems, gravity clarifiers,and DAF systems to operate successfully.Many occurrences during the processing daycause significant change in both rate of waste-water flow and wastewater strength. Theseoccurrences include periodic plant washdown,daily plant washdown, spills, and dumps ofunacceptable product or intermediate.
Flow equalization systems must be equippedto cope with floating and settling solids. Thevariable quantities of fats, oils, and settleablesolids can cause debilitating problems if theyare not so equipped.
Secondary TreatmentWastewaters from the processing of red meat
are well suited to biological treatment becauseof their very high organic content. Either anaer-obic or aerobic methods can be used; however,the high strength of these wastes, in terms ofBOD5, TSS, and O&G make them particularlywell suited to anaerobic treatment. The ele-vated temperature of these wastewaters is alsoa factor. Higher temperatures decrease the oxy-gen transfer efficiency of aeration equipmentbut tend to increase the rate of anaerobic treat-ment. These considerations are discussed morefully in Chapter 8.
As discussed in Chapter 8, the more recentlydeveloped anaerobic treatment technologies,such as the upflow anaerobic sludge blanket(USAB) and the anaerobic contact process,have had significant success treating wastewa-ters from the dairy industry. Although there hasnot been significant success reported for theUSAB process, it appears obvious that signifi-cant potential exists.
Anaerobic contact systems have been usedwith success. These systems consist of a con-ventional anaerobic digester, with mixingequipment and a clarifier portion. With deten-tion times of only 6 to 12 hours, 90% BOD5removals have been typical. Using the 6- to 12-hour detention time, solids have been separated
in the clarifier portion and, for the most part,returned to the active digester. It has been nec-essary to waste only a relatively small fractionof the biological solids. In order to achievegood separation, it is necessary to de-gas thesolids as they are transferred from the activedigester to the settling component.
Anaerobic lagoons have long been used totreat wastewaters from the processing of cattleand hogs. The most successful of these treat-ment systems have been designed with low sur-face-to-volume ratios to conserve heat and tominimize aeration. Depths of 12 to 18 feet havebeen used. Covers are required for odor con-trol. In some cases, the natural cover formed byfloating greases has sufficed, but it has typi-cally been necessary to place covers made ofStyrofoam or other floating material. Polyvinylchloride and nylon-reinforced hypalon havebeen used with success. These lagoons, ofcourse, must be lined to prevent contaminationof the groundwater.
BOD5 loading rates of 15 to 20 pounds per1,000 cubic feet have been common. Detentiontimes of 5 to 10 days have resulted in effluentBOD5 concentrations of 50 to 150 mg/L,amounting to removals of 70% to 85%. Addi-tional treatment, usually by means of an aero-bic stabilization pond or another aerobicbiological treatment system, is generallyrequired to enable compliance with EPA stan-dards. Ammonia is another issue. Anaerobiclagoons as described here typically dischargeeffluents having up to 100 mg/L of ammonia.
Placing the inlet to the anaerobic lagoon nearthe bottom of the lagoon is often helpful. Thisarrangement allows the incoming wastewaterto contact the sludge blanket containing activemicroorganisms.
Aerobic lagoons have been used for second-ary treatment; however, because of the highcost of providing the large quantity of oxygenrequired by these high-strength wastewaters,they are most often used as a step followinganother technology, such as an anaerobiclagoon or anaerobic contact system. Aeratedlagoons used for treatment following anaerobicsystems have operated with detention times of

130 Industrial Waste Treatment Handbook
2 to 10 days. Depths of 8 to 18 feet have beenused with mechanical or diffused air systems.
In appropriate climates, oxidation pondshave been used as a final (polishing) treatmentstep, following either anaerobic or aerobic bio-logical treatment systems. Oxidation pondshaving depths of 4 to 8 feet, sized for organicloadings of 20 to 40 pounds of BOD5 per acre-day, and having detention times of 1 to 6months have worked with success.
When preceded by effective equalization, theactivated sludge process has successfullytreated wastewaters from red meat processingfacilities. Various modifications have beenused, including tapered aeration, step aeration,extended aeration, and contact stabilization.Extended aeration appears to have had the mostsuccess.
Trickling filters have been used as roughingfilters and as components of nitrogenmanagement systems. As roughing filters, thetrickling filters receive a relatively heavy loadof BOD5 for a relatively short period. In thismode, trickling filters are capable of removing25% to 40% of the BOD5, at relatively low costper unit of BOD5 removed. As components ofnitrogen management systems, trickling filtersare appropriate media for the nitrification step,preceding denitrification.
Rendering of By-Products from the Processing of Meat, Poultry, and Fish
Rendering is a process for separating fat fromanimal tissue. Heat is very often used, andsometimes one or more of chemicals, pressure,and vacuum are used as well. Rendering servesthe invaluable function of converting whatwould otherwise be waste materials into usefulproducts, including animal, poultry, or fishfeed supplements and oils for industrial andhousehold use such as soaps and rust-proofing paints. A material made from render-ing feathers obtained from the processing ofpoultry has long been used to manufacture afoam product used in firefighting. Edible ren-dering produces edible lard, chicken fat, orspecialty fats or oils.
The rendering process itself results in con-siderable, sometimes difficult, wastes to man-age. In total, however, wastes resulting fromrendering are a small fraction of the wastes itmakes use of. A huge number of renderingplants operate in the U.S. and around theworld. Virtually all facilities that manufacturefoods derived from animal, poultry, or fish pro-duce by-products that can be used as raw mate-rials at a rendering plant.
The Rendering ProcessThe rendering process is customized, depend-ing on the products and the raw materials;however, the following discussion is applicableto the rendering process in general. The wastesthat result from most rendering operations areremarkably similar. Figure 4-19 presents a gen-eralized schematic of a “typical” renderingplant. There are both “wet” and “dry” render-ing processes. In the wet rendering process,live steam is injected into the rendering tank,along with the material being rendered. In dryrendering, steam is confined in a jacket thatsurrounds the tank containing the materialbeing rendered.
As illustrated in Figure 4-19, rendering plantshave facilities for receiving and storing the rawmaterial. The materials are taken from storageand are usually ground and blended. The groundand blended material is then pumped, conveyed,or placed by use of a bucket loader into a tank inwhich the rendering process takes place (the ren-dering system). Live steam at 40 to 60 psig isintroduced, and the rendering process, not to beconfused with cooking, takes place. In somecases, pH is adjusted. Sometimes, other chemi-cals are introduced. As the rendering process pro-ceeds, fats and oils are drawn off the top of thetank. The remaining liquid, called “stick water,”contains the protein material. The stick water istypically evaporated and added to animal feed.
Dry rendering typically involves placing thematerials to be rendered in a steam-jacketedrendering system that is placed under vacuum.Screening and centrifugation are used to sepa-rate the fats and oils from the solids, whichcontain the protein matter.

Wastes from
Industries131
Figure 4-19
Schem
atic of a “typical” rendering plant.
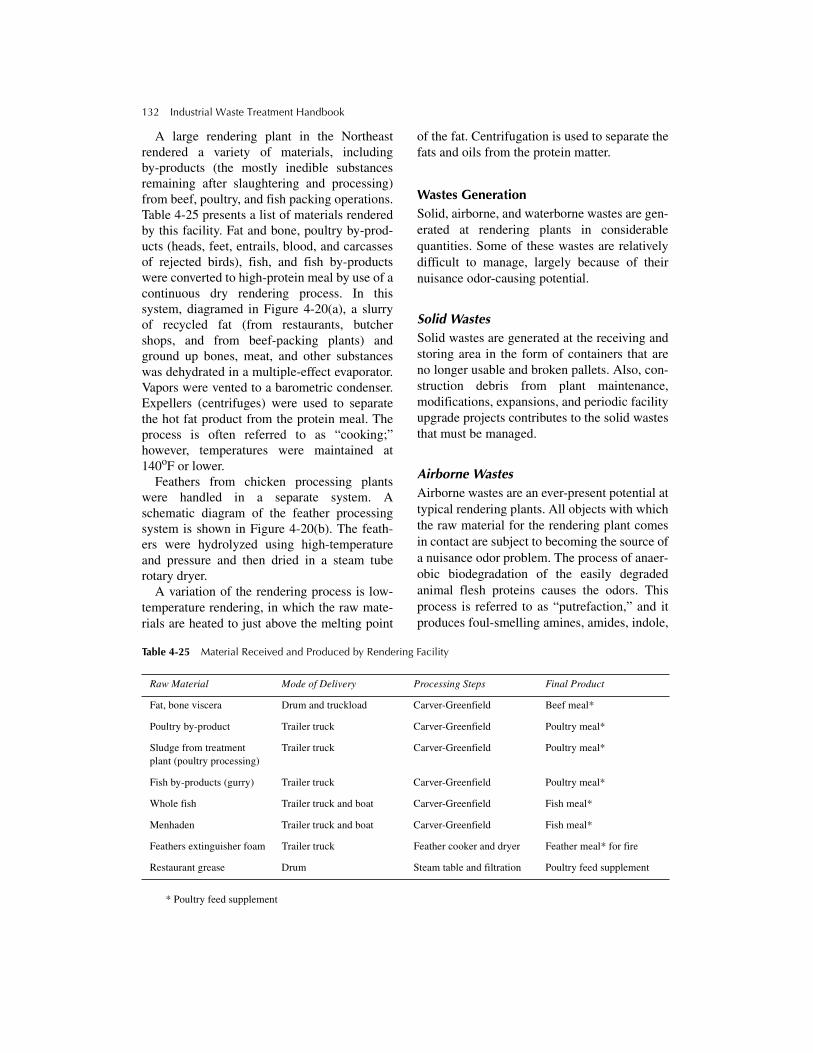
132 Industrial Waste Treatment Handbook
A large rendering plant in the Northeastrendered a variety of materials, includingby-products (the mostly inedible substancesremaining after slaughtering and processing)from beef, poultry, and fish packing operations.Table 4-25 presents a list of materials renderedby this facility. Fat and bone, poultry by-prod-ucts (heads, feet, entrails, blood, and carcassesof rejected birds), fish, and fish by-productswere converted to high-protein meal by use of acontinuous dry rendering process. In thissystem, diagramed in Figure 4-20(a), a slurryof recycled fat (from restaurants, butchershops, and from beef-packing plants) andground up bones, meat, and other substanceswas dehydrated in a multiple-effect evaporator.Vapors were vented to a barometric condenser.Expellers (centrifuges) were used to separatethe hot fat product from the protein meal. Theprocess is often referred to as “cooking;”however, temperatures were maintained at140oF or lower.
Feathers from chicken processing plantswere handled in a separate system. Aschematic diagram of the feather processingsystem is shown in Figure 4-20(b). The feath-ers were hydrolyzed using high-temperatureand pressure and then dried in a steam tuberotary dryer.
A variation of the rendering process is low-temperature rendering, in which the raw mate-rials are heated to just above the melting point
of the fat. Centrifugation is used to separate thefats and oils from the protein matter.
Wastes GenerationSolid, airborne, and waterborne wastes are gen-erated at rendering plants in considerablequantities. Some of these wastes are relativelydifficult to manage, largely because of theirnuisance odor-causing potential.
Solid WastesSolid wastes are generated at the receiving andstoring area in the form of containers that areno longer usable and broken pallets. Also, con-struction debris from plant maintenance,modifications, expansions, and periodic facilityupgrade projects contributes to the solid wastesthat must be managed.
Airborne WastesAirborne wastes are an ever-present potential attypical rendering plants. All objects with whichthe raw material for the rendering plant comesin contact are subject to becoming the source ofa nuisance odor problem. The process of anaer-obic biodegradation of the easily degradedanimal flesh proteins causes the odors. Thisprocess is referred to as “putrefaction,” and itproduces foul-smelling amines, amides, indole,
Table 4-25 Material Received and Produced by Rendering Facility
* Poultry feed supplement
Raw Material Mode of Delivery Processing Steps Final Product
Fat, bone viscera Drum and truckload Carver-Greenfield Beef meal*
Poultry by-product Trailer truck Carver-Greenfield Poultry meal*
Sludge from treatment plant (poultry processing)
Trailer truck Carver-Greenfield Poultry meal*
Fish by-products (gurry) Trailer truck Carver-Greenfield Poultry meal*
Whole fish Trailer truck and boat Carver-Greenfield Fish meal*
Menhaden Trailer truck and boat Carver-Greenfield Fish meal*
Feathers extinguisher foam Trailer truck Feather cooker and dryer Feather meal* for fire
Restaurant grease Drum Steam table and filtration Poultry feed supplement

Wastes from
Industries133
Figure 4-20
Schematic of rendering system
s.

134 Industrial Waste Treatment Handbook
skatole, various volatile acids, and reduced sul-fur compounds such as hydrogen sulfide andmethyl as well as ethyl mercaptans.
Waterborne WastesPrimary sources of wastewaters from renderingplants are as follows:
• Blood and other “juices” that drain from theanimal, poultry, and fish by-products thatare the raw material for the renderingfacility
• Plant washdown water that is constantly inuse to control air pollution by foul odors
• Blow-down from wet scrubbers used for airpollution control
Plant washdown, as part of housekeepingpractices implemented to control nuisanceodors, is the major source of wastewater interms of volume. Constant washdown of theplant equipment and floors is necessitated bythe nature of the equipment and the mate-rial handled. Most rendering plants producenothing for human consumption. For thisreason, the equipment is not the easilycleaned, relatively expensive type used inedible food-processing plants. The materialhandling equipment typically consists ofscrew conveyors and open impellor pumps.This equipment handles poultry and animalentrails, fish and fish parts, and sludge fromwastewater treatment plants (both on-sitetreatment plants and treatment plants locatedat off-site meat, poultry, and fish processingplants). This combination of sloppy mate-rial along with the types of handling equip-ment leads to almost continuous drippingand spilling.
In addition, oil vapors within the processingareas continually condense on surfaces, result-ing in a biodegradable film that gets thicker astime goes on if it is not regularly washed off.The consequence is that plant washdown mustcontinue in a never-ending fashion. As soon asan area is cleaned, it begins to downgrade. Wetscrubbers must also be constantly in operationto control odors.
Wastes MinimizationNotwithstanding the fact that plant washdownwater creates most of the wastewater thatrequires treatment, good housekeeping prac-tices are still the most important wastesminimization technique for rendering facilities.The key is to make use of drip pans and othercontainment devices to decrease as much aspossible the quantity of material that isrequired to be cleaned from unconfined areassuch as floors, walls, and surfaces of themachinery.
Dry methods of cleaning must always beused to the maximum extent feasible. Drymethods of cleaning, using brooms, shovels,vacuum cleaners, and air blowers, is animportant wastes minimization technique inany industrial setting. It is especially importantin the setting of a meat, poultry, or fishby-product rendering facility because of theever-present “juices” of very high organiccontent.
Whenever possible, liquid drainings andjuices should be disposed of before they get tothe rendering facility. This, of course, involvesa tradeoff because these liquids must be man-aged somewhere. From the point of view of therendering facility, the less of this material thebetter.
One example of this type of wastes minimi-zation occurred at a trash fish (“inedible” fish,such as Menhaden) rendering facility on theeast coast of the U.S. Before the wastes mini-mization measure was instituted, fishing boatswould catch fish by use of the “purse-seinemethod” and load them aboard boats. Theboats would transport them to shore, wherethey were transferred to trucks by use of a vac-uum pump. During the earlier days of thisindustry, the vacuum pump routinely pumpedthe fish, as well as the “fish juice,” out of theboat. Because of the high water content of thefish juice, it was sent overboard into the harbor,rather than put into the trucks and carried to therendering facility. Evaporation of this waterwas too costly.
Eventually, however, it became illegal todump this fish juice in the harbor. At this point,the juice was pumped into the trucks, then

Wastes from Industries 135
dumped on the receiving room floor at the ren-dering facility. This caused a massive wastewa-ter problem at the rendering facility. Thesolution that was eventually worked out was tohandle and dispose of this fish juice at dock-side, in a nonpolluting manner.
In the case of wet rendering, there may beexcess tank water at the end of the renderingprocess. This water, which typically has aBOD5 in the range of 50,000 mg/L and a TSSvalue in the range of 2% should be evaporatedand blended into animal feed supplement.
Treatment and DisposalTreatment and disposal of wastes from meat,poultry, and fish by-product rendering facilitiesis a matter of minimizing contact betweenorganic material and the solid wastes, in orderto control odors from the solid wastes, and han-dling and disposal of the solid wastes asordinary (nonhazardous) waste. Regarding airpollutants, the key is containment and treat-ment by means of wet scrubbers. Wastewatersare entirely organic, with the possible excep-tion of wet scrubber blow-down and chemicalsused for pH adjustment and for cleaning theplant. Biological treatment should, therefore,be appropriate.
Solid WastesThe principle solid wastes from meat, poultry,and/or fish by-products consist of packagingand transport materials such as 55-gallondrums, broken pallets, steel strapping, andnonrecyclable containers previously usedfor chemicals, detergents, lubricants, andlaboratory supplies. After aggressive wastesminimization and recycling, these materialscan be disposed of as ordinary solid wastes.There should be no organic materials in thesolid waste stream because any such wastesshould simply have been added to the feed tothe rendering system.
Airborne WastesFor many rendering facilities, the most trouble-some problem is nuisance odors from the
anaerobic biodegradation of protein matter.The solution is to rigorously contain any odorsso generated, and to treat them by the oxidativeaction of the chemical solutions in wetscrubbers.
The foul odors that require containment, col-lection, and treatment emanate from handlingand storage of the raw material, as well as fromthe handling and processing equipment on theprocessing floor. The rendering process itself,as well as subsequent processes such as press-ing and drying, is generally agreed to be thesource of strongest odors. These “high-inten-sity” sources emit varying concentrations ofodors, depending on the type and age of theraw material, and the temperature of the rawmaterial during the hours or days before itsplacement in the rendering system. In general,the older the raw material, and the higher itstemperature, the more concentrated or “stron-ger” the bad odors.
Odors from rendering operations have beengenerally described as those of ammonia,ethylamines, and hydrogen sulfide. Skatole,other amines, sulfides, and mercaptans also con-tribute to the blend of “rendering plant odors.”
The types of equipment normally used forcontrolling odors in the rendering industry areafterburners, condensers, adsorbers, and wetscrubbers. Gases from wet rendering processesare almost always condensed. Removing con-densable odors results in as much as a 10-foldvolume reduction. The condensed gases canthen be directed to additional treatment.
Flame incineration (after burning) offers apositive method of odor control; however, thecost of fuel makes afterburner operation expen-sive. Scrubbing with chemical solutions is theprimary method for controlling odors. Acti-vated carbon has also been used to removeodors by the mechanism of adsorption; how-ever, its application is limited to treatment ofrelatively cool and dry gases.
The typical situation at large renderingplants is to have from two to four wet scrub-bers. Air from any location within the plantmust go through one of these scrubbers beforereaching the outside. Figure 4-21 is an illustra-tive diagram of a typical scrubbing system used
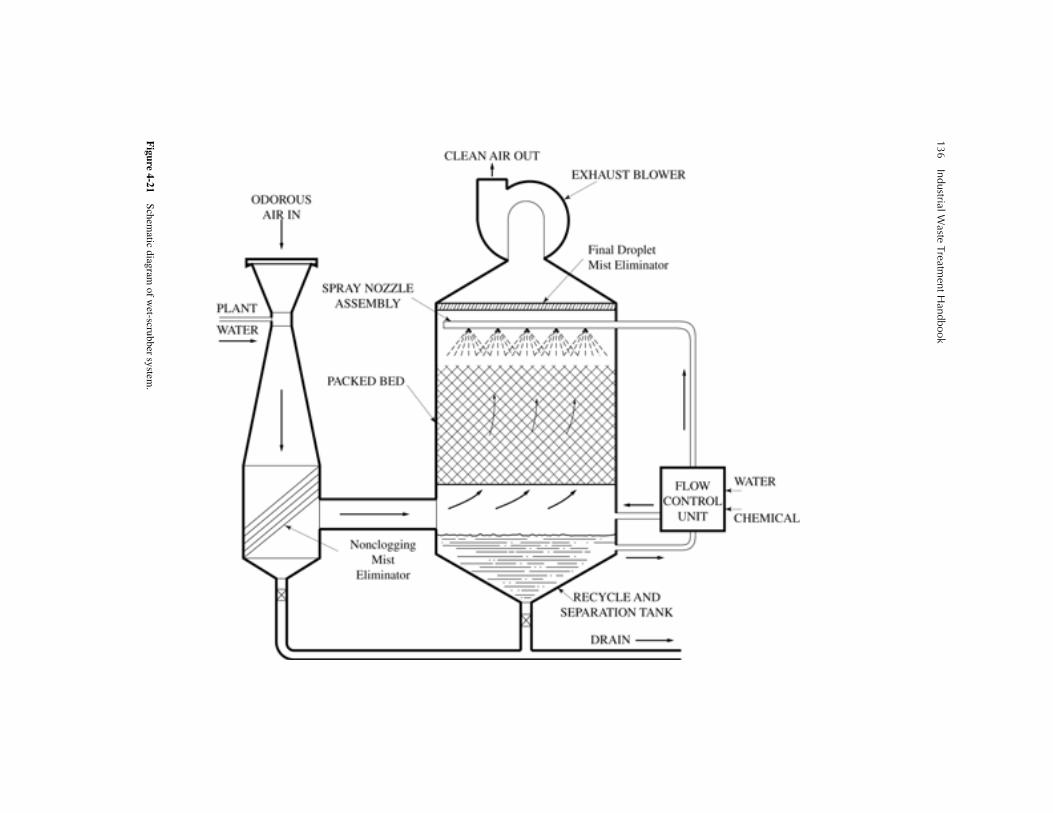
136Industrial W
aste Treatment H
andbook
Figure 4-21
Schem
atic diagram of w
et-scrubber system.

Wastes from Industries 137
for this purpose. The system shown in Figure4-21 consists of a venturi (fixed throat opening)section followed by a packed tower. A largeinduced-draft fan pulls air from within thebuilding that houses the rendering system andforces it through the venturi-scrubber systemshown in Figure 4-21. Process gases are alsoforced to pass through a venturi-scrubber sys-tem, similar to the system shown in Figure 4-21.
The wet scrubber portion of the venturi-scrubber system is typically a tower packedwith plastic tellerettes, which provide a verylarge surface area. A solution of hypochlorite,with the pH adjusted for maximum effective-ness, is sprayed onto the top of the tellerettes.This solution flows down over the (very large)surface area of the packing. At the same time,gases are forced up through the packing by theaction of the fan. As the gases contact thescrubbing solution, the oxidizing action of thehypochlorite changes the chemical nature ofthe odor-causing substances. Also, many ofthese substances become dissolved in thescrubbing solution.
One of the most important objectives of theodor control system described previously ismaintaining a “negative pressure” within therendering plant building. If the barometricpressure inside the building is less than thebarometric pressure outside the building, it ismore difficult for fugitive emissions to passfrom inside to outside. This negative pressure(negative inside relative to outside) is main-tained simply by keeping all the doors andwindows closed while operating the wet scrub-ber systems. It is necessary for the buildings tohave good structural integrity; that is, to be freeof leaks in the walls and to have good, reason-ably tight fits regarding doors and windows. Ifthe building is relatively sound, it is a simplematter to maintain a negative pressure and tomaintain effective control over fugitive emis-sions. Occasional opening and closing of doorsfor human and truck traffic can be tolerated.
Waterborne WastesWastewaters from rendering plants using redmeat, poultry, and/or fish by-products as raw
material are amenable to biological treatmentbecause these wastewaters are almost entirelyorganic. The only sources of inorganic chemi-cals are the blow-down wastes from the airpollution control systems and possibly inor-ganic agents used for cleaning.
Anaerobic as well as aerobic technologiesare valid potential treatment technologies. Thenormally very high-strength character of thesewastewaters, as well as elevated temperatures,makes them particularly well suited to anaero-bic treatment technologies; however, aerobictreatment has been used with success as well.A large rendering facility in New England suc-cessfully treated wastewaters by making use ofchemical coagulation and dissolved air flota-tion (DAF) to remove most of the protein, fats,and oils (which accounted for about 80% of theBOD5), followed by activated sludge forremoval of the dissolved fraction of waterbornepollutants.
This rendering facility used by-productsfrom red meat processing, poultry processing,fish processing, and sludge from wastewatertreatment as raw material. Two rendering sys-tems were used. One was a continuous flowdry rendering system that operated at about140ºF and under a vacuum. The second was abatch-type dry rendering system. On a typ-ical day, the continuous flow system wasstarted up on poultry (offal, heads, feet, andblood) and operated at the rate of 30,000 lb/hrfor 7 hours. It would be switched to fat andbone and run at the rate of 23,000 lb/hr for 2.5hours. It would then be switched to fat, bone,and meat scraps from red meat processing andbutcher shops, as well as grease from restau-rants in the area. It would then be switched toby-products from fish processing plants andoperated at 50,000 lb/hr for 3 hours or so.Finally, it would be switched to menhaden, aparticularly oily fish, for 4 to 10 hours, depend-ing on supply.
The batch rendering system would be startedup on feathers from poultry processing plantson Monday afternoons and run at a rate ofabout 3,000 pounds per hour until the supply offeathers was exhausted on Saturday.

138 Industrial Waste Treatment Handbook
The characteristics of the combined waste-waters from this plant, including plant wash-down water were as follows:
• Flow 96,000 gpd
• BOD5 85,000 mg/L
68,000 lb/day
• TSS 6,000 mg/L
4,800 gpd
Chemical coagulation in combination withDAF removed about 80% of the BOD5 andabout 90% of the TSS. About 95% of the oiland grease was also removed by DAF. All ofthe sludge (flot) from this system was used asraw material in the continuous feed dry render-ing system.
The aerobic, activated sludge system thatfollowed the DAF system was operated by useof mixed liquor volatile suspended solids(MLVSS) concentrations between 9,000 and11,000 mg/L, and a hydraulic retention time ofabout 3 days. An integral clarifier was attacheddirectly to the aeration tank, and sludge waswasted from the aeration tank. Sludge age wasmaintained at 10 days. All of the waste sludgewas used as raw material in the continuousflow dry rendering system.
Overall, BOD5 removal for the combinedDAF–complete-mix activated sludge systemconsistently exceeded 99%. TSS and oil andgrease removals exceeded 95%.
The Manufacture of Lead Acid Batteries
A battery, as the name is used in this section,is a modular source of electric power in whichall or part of the fuel is contained within theunit and the electrical power is generated by achemical reaction within the unit. The pri-mary components are the anode, the cathode,and the electrolyte. The function of the anodeand cathode, called the electrodes, is to con-vert chemical energy into electrical energy. Ifan electrical circuit outside the unit is con-nected between the anode and the cathode,electric current is caused to flow through thecircuit.
The EPA has divided the manufacturing ofbatteries into eight categories: cadmium, cal-cium, lead, leclanche, lithium, magnesium,nuclear, and zinc. The lead subcategory is thelargest in terms of number of manufacturingplants and volume of batteries produced. Prod-ucts that utilize batteries included in the leadsubcategory include automobiles, portablehand tools, lanterns, and various implementsused in industry and the military.
There are four common types of lead acidbatteries: wet-charged, dry-charged, damp, anddehydrated. Wet-charged batteries are shippedafter manufacture with electrolyte. All othersare shipped without electrolyte.
Lead Battery ManufactureOnly production of the anode, the cathode, andancillary devices are considered part of batterymanufacture. Production of the structural com-ponents such as the cases, terminal fittings,electrode support grids, seals, separators, andcovers are all included in other manufacturingcategories; however, any or all of them may bemanufactured at the same plant that manufac-tures the electrodes.
Anodes are metals when in their fullycharged state in a battery. In the case of mostlead acid batteries, anodes are manufactured byapplying a paste of lead oxide to a support.The paste-support structure is allowed to dry.Cathode active materials are typically metaloxides. The lead oxide substance used to makecathodes for lead acid batteries is called leadyoxide within the battery manufacturing indus-try. This substance is a specific oxidation stateof lead oxide that is 24% to 30% lead free. It isused for the manufacture of both the anodesand cathodes in lead acid batteries and is manu-factured by the so-called Barton process or by aball mill process.
Cathodes for use in lead acid batteries aremanufactured by applying a paste of the leadyoxide to a structural grid. The grid must be ableto carry the desired electrical current and sup-port the leady oxide. Thus, the fabricationof anodes and cathodes for use in lead acid bat-teries is very similar. There is a difference,

Wastes from Industries 139
however, in that cathodes remain in the leadperoxide state.
Ancillary operations are those operations ofthe battery manufacturing process other thanfabrication of the anodes and cathodes.Included are battery assembly, productionof leady oxide, battery washing, and washingof floors, manufacturing equipment, andpersonnel.
Figure 4-22 presents a flow diagram for theprocess of manufacturing wet-charged leadacid batteries using a closed formation pro-cess. It is more or less typical of all lead acidbattery manufacturing processes as far aswastes generation is concerned. As illustratedin Figure 4-22, there are two initial processes.One is the production of leady oxide to beused in fabricating anodes and cathodes. Theother is casting of the grids to be used for thissame purpose.
Leady Oxide ProductionFinely divided metallic lead is mixed with leadoxides to produce the active materials used formanufacturing the battery electrodes or plates.So-called leady oxide is produced by placinghigh-purity lead particles in a ball mill. Thefriction within the ball mill generates heat, anda forced flow of air provides oxygen. The resultis particles of red lead letharge and a certainpercentage of unoxidized metallic lead. Non-contact cooling, along with regulation of the airflow, governs the speed of oxidation of thelead.
An alternative process, the Barton process,produces leady oxide by feeding molten leadinto a pot and vigorously agitating it to breakthe lead into small droplets. Oxygen from astream of air oxidizes a certain percentage ofthe lead into a mixture of yellow lead, redletharge, and metallic lead.
Grid ManufacturingGrids are fabricated by casting lead alloys suchas lead-antimony and lead-calcium. Traceamounts of arsenic, cadmium, selenium, silver,and tellurium are also added.
Paste Preparation and PastingThe anodes are fabricated by applying a pasteof lead oxides mixed with binders and othersubstances to the grids. The paste is preparedby mixing leady oxide and granular lead, or redlead. The cathodes are prepared in the samemanner, except that the paste is prepared bymixing leady oxide, lead, sulfuric acid, water,and expanders such as lampblack, bariumsulfate, and various organic materials. One ofthe principle objects in fabricating the elec-trodes is to create a very large surface area bypreparing the paste to have a porous, veryrough texture. The paste is often appliedby hand. Some facilities use mechanizedequipment.
CuringA principle objective of the curing process isto induce the electrodes to obtain properporosity and strength. To this end, the curingprocess is strictly controlled. The plates areflash dried, stacked, and covered or placed ina humidity-controlled room for several days.Small crystals of tribasic lead convert tolead peroxide. One technique is to soak theplates in sulfuric acid to enhance sulfationand improve mechanical properties. This soak-ing is done in the battery case or in a separatetank.
Stacking and WeldingThe cured plates are stacked for convenientaccess at the assembly line. Separators areplaced to prevent short-circuiting. Separatorsare made from plastic, rubber, fiberglass, orpaper.
AssemblyThe assembly process involves placing thestacked, alternating anode-cathode plateswithin the battery case, welding the connectingstraps, and installing the covers and vents.Also, the connections are made to the batteryposts.

140 Industrial Waste Treatment Handbook
Figure 4-22 Production of wet-charged lead acid batteries using the closed formation process.
* Not considered in battery manufacturer category.

Wastes from Industries 141
There are two types of assembly: openformation and closed formation (formationrefers to charging the battery as a result of acidreacting with substances on the electrodes).Figure 4-22 is appropriate to the closed-forma-tion process. In the closed-formation process,the top and vents of the battery are installedbefore the acid (electrolyte) is added. The oppo-site is true for the open-formation process,which allows visual inspection of the plates,separators, strap welds, and posts after the elec-trolyte has been added.
Electrolyte Preparation and Addition(Acid Fill)The electrolyte solution for the battery is pre-pared by diluting concentrated sulfuric acidwith water. This acid-cutting process is typi-cally performed in two steps: The first isdilution to 45% acid, by weight. This acid solu-tion is used for preparation of the paste, asdescribed earlier. The second acid cut is dilu-tion to 25% to 30%. This acid solution is usedfor battery formation and filling.
With respect to the quantity of wastewatergenerated, there are several different methodsused for filling lead acid batteries. One is to filleach battery to overflowing, to ensure thatfilling is complete. Another is to immerse thebatteries in a tank of the electrolyte, afterwhich the batteries are rinsed. A third is tomake use of sensing and relay equipment toautomatically stop the filling process at theproper time.
FormationThe active substance for the cathode is leadperoxide, although it is not a component of thepaste that is applied to the cathode grids duringfabrication of the cathodes. The formation oflead peroxide takes place after the newly fabri-cated cathodes are immersed in the electrolyteand an electric current is applied. In the case ofthe closed-formation battery manufacturingprocess, this process takes place just after theacid fill step.
The forming process consists of applying anelectric current between the anodes within a
newly filled battery and the cathodes. Whenthis is done, lead oxide and sulfate are con-verted to lead peroxide on the cathode, andlead oxide is converted to lead on the anode.The final composition on the cathode is 85% to95% lead peroxide, and the composition on theanode is greater than 90% lead.
The formation process takes time. Severalmethods are used to ensure proper formation.Two of them are as follows: In one method,each battery is filled with full-strength electro-lyte, and the battery is ready for shipment after1 to 7 days, depending on the type of batteryand the characteristics desired. The secondmethod involves filling each battery with amore dilute electrolyte, then emptying andrefilling with full-strength electrolyte beforeshipment. A boost charge is applied beforeshipment. The entire process takes place in oneday or less.
Battery WashdownTypically, batteries are washed before ship-ment. This washdown removes electrolyte andother materials from the outside surfaces of thebatteries resulting from filling and forming.Detergents are usually used to remove oils anddirt.
Battery Testing and RepairTesting batteries seldom generates wastes;however, when testing determines that a batteryis faulty, it is taken apart for repair. Whenthis is done, faulty parts are replaced, and thefaulty parts become solid waste. Electrolytedrained from the battery becomes waterbornewaste.
Wastes GenerationLead acid battery manufacturing plants arehighly variable in terms of wastes generated.For instance, work done in preparation of pro-ducing the EPA’s Development Document forthe battery manufacturing point source cate-gory determined that total plant discharges ofwastewater ranged from 0 to 390,000 gpd, witha median of 22,000 gpd.

142 Industrial Waste Treatment Handbook
Solid WastesSolid wastes are generated from packaging andshipping wastes, construction debris from plantmaintenance, modifications, expansions, andperiodic facility upgrade projects. In addition,sludges from wastewater treatment and wasteresins from process water deionization requiremanagement. Lead acid battery manufacturingplants also generate solid wastes as a result ofreject batteries and faulty battery parts, includ-ing cases, tops, posts, electrode grids, straps,and separators.
Airborne WastesThe major source of air pollutants fromlead acid battery manufacturing plants isacid fumes. Typically, these substances arecontrolled by the use of scrubbers. There isalways a discharge because of the less than100% efficiency of the scrubbers; therefore,an aggressive operation and maintenanceprogram, including aggressive preventivemaintenance, is necessary.
Scrubbers are located throughout the pro-cessing plant, including those processes carry-ing out the following production steps: leadyoxide production, grid manufacturing, electro-lyte preparation and addition, formation, bat-tery washdown, battery testing and repair, andany acid storage and dispensing facilities.
Waterborne WastesWastewater generated from the production oflead acid batteries has three primary sources:the paste preparation and pasting operations,the electrode-forming operations, and thewashing of finished batteries; however,there are wastewaters generated from each ofthe manufacturing steps, as illustrated inFigure 4-22, in the production of lead acidbatteries.
Leady Oxide ProductionLeady oxide production results in wastewa-
ters from cooling and leakage from ball mills,contact cooling during grinding of oxides, andwet scrubbers used for air pollution control.
Paste Preparation and PastingPaste preparation and pasting results in
wastewaters from washdown of the equipmentas well as the production area. These wash-down wastewaters typically contain high con-centrations of suspended solids and lead, aswell as additives used in making the paste.
Electrolyte Preparation and Addition(Acid Fill)There is almost always dripping, spilling,
and overflowing of acid in the electrolyte prep-aration and addition (acid fill) area. Therefore,washdown and rinsewaters are typically highlyacidic. Also, wet scrubbers are normally usedin this area because of the fumes from thedripped, leaked, spilled, or overflowed acid.
FormationThe formation production area is subject to
acid spills, similar to the fill area. The waste-waters generally contain significant concentra-tions of various metals. Copper and iron in thewastewater result from corrosion, caused bythe acid of process equipment and chargingracks. Oil and grease also result from equip-ment washdown. Wet scrubbers in this areagenerate significant wastewater.
Battery WashdownThe battery washdown process is the site
of considerable wastewater generation. Wetscrubbers are used in this area as well.
Battery Testing and RepairWhen faulty batteries are detected, they are
often drained. The drained electrolyte can be amajor source of wastewater. Wet scrubbers areoften used in this area.
Wastes MinimizationThere are many opportunities for wastes mini-mization at lead acid battery manufacturingfacilities. Most fall within the category of goodplant housekeeping. Similar to many otherindustries, the key to minimizing the cost foreventual waste treatment and disposal is toaggressively implement the following:

Wastes from Industries 143
• Whenever possible, nontoxic substancesshould be used for degreasing and cleaning.
• If toxic substances, for instance, chlorinatedvolatile organics, must be used for degreasingor other cleaning processes, containment,recycle, and reuse must be practiced to themaximum extent possible.
• Biodegradable detergents should be used.
• Drips must be contained and returned to thesource.
• Aggressive maintenance must be practicedto eliminate leaks and accidents that couldlead to noncontainment of chemicals andother substances.
• Reconstitution of cleaning baths, acid baths,alkali baths, and plating baths should bedone on an as-needed basis according to thework performed, rather than on a regulartiming or other schedule.
• Water used for the first stages of batterywashdown should be recycled water fromother processes.
• Dry methods of clean-up, including brooms,shovels, and dry vacuuming, should be usedto the maximum extent possible.
• Techniques such as treating wastewaterfrom washdown of the pasting area shouldbe treated in multistage clarifiers. At someplants, this technique has enabled total reuseof the water. The clarified water has beenused for washdown, and the solids havebeen reused in new batches of paste.
• Rinsing should be counter-current, withrespect to freshwater makeup and spent rin-sewater overflow.
• Purchasing should be guided by aggressiveselection of raw materials in order to obtainthe cleanest possible materials.
• There should be a constant and consistentprogram to substitute less-polluting andnonpolluting substances for those thatrequire expensive treatment and expensivedisposal.
• In concert with the above, there shouldbe a constant and consistent programfor replacing process controls, including
sensors, microprocessors, and hardware,with the objective of decreasing waste andmaximizing retention, containment, recycle,and reuse of all substances. For instance, thebattery-filling system must be constantlymaintained and upgraded to keep overflow-ing to a minimum.
• Technologies for recovering and regenerat-ing acids, lead, and other chemicals as wellas for separating and removing contami-nants should be aggressively employed.Ultrafiltration to effect removal of oils fromalkaline cleaning solutions is an example.Centrifugation has also been used for thispurpose. Activated carbon can be used toremove organic impurities.
Both filtration and centrifugation produceconcentrated impurities that offer the possibil-ity of recovery. If recovery of substances is notfeasible, the concentrated impurities are in aform that is more easily disposed of.
Wastewater TreatmentWastewaters from the manufacture of lead acidbatteries are typically acidic, as the result ofcontamination by sulfuric acid, which is used asthe electrolyte. In addition, dissolved lead andsuspended solids containing lead are majorcomponents. Differences from one plant toanother regarding the presence of pollutantsother than acid and lead depend on whether ornot leady oxide is produced at the plant, whetheror not the electrode grids are produced at theplant, and the type of grids fabricated; i.e., anti-mony alloy, pure lead, or calcium alloy. Otherfactors include differences in the methodof plate curing, forming, and assembly. Param-eters that are regulated and, therefore, havebeen found in wastewaters from plantsmanufacturing lead acid batteries include anti-mony, cadmium, chromium, copper, lead,mercury, nickel, silver, zinc, iron, oil and grease,and TSS. pH value is also regulated. Someplants pretreat and discharge to a POTW. Otherstreat and discharge on site. Either way, thewastewater treatment system must be capable ofpH control and removal of multiple metals.

144 Industrial Waste Treatment Handbook
In general:
• Wastewaters containing significant quantitiesof oil and grease should be isolated, treatedfor removal of oil and grease—for instance,by reverse osmosis—then combined withother wastes for removal of metals.
• Wastewater, including equipment wash-down water from the paste makeup andpasting areas should be isolated, treatedon-site by multiple clarifiers, and both theclarified water and the solids reused. Thewater should be used for paste makeup andfor acid dilution in the electrolyte makeuparea. The solids should be returned to pastemakeup. As usual, a certain amount ofblow-down will probably be required.
• The final wastewater stream from a typicallead acid battery manufacturing facility, afterwastes minimization, wastes segregation andpretreatment, and combining of the pre-treated flows, can best be treated by use ofprecipitation for removal of metals, sedimen-tation for removal of precipitated metals andother suspended solids, and chemical coagu-lation, sedimentation, sand or mixed mediafiltration, final pH adjustment, and ionexchange as necessary to achieve requiredlevels of metals, TSS, pH, and oil and grease.It may be necessary to perform the metalsremoval operations in two or more stages, inseries, using different values of pH for eachstage, to remove all the metals (some ofwhich have different values of pH for lowestsolubility). These wastewater treatment tech-niques are discussed in detail in Chapter 8.
Bibliography
ABMS Non-Ferrous Metal Data, 1988.Amerine, M.A., H.W. Berg, R.E. Kunkee, C.S.
Ough, V.L. Singleton, and A.D. Webb, TheTechnology of Wine Making, 4th ed. AVIPublishing, Westport, Connecticut, 1980.
Anonymous, “California Wine: On the Grape-vine,” Economist, Vol. 307, No. 7547, April23, 1988.
Apotheker, S. “Plumbing Lead from the WasteStream,” Resource Recycling, April 1992,pp. 34.
Azad, H.S., Industrial Waste ManagementHandbook, McGraw-Hill, New York, 1976.
Bagot, B. “Brand Report No. 161-DomesticWine: Wine Tastings,” Marketing & MediaDecisions, Vol. 24, No. 5, May 1989.
Baker, D.A. and J.E. White, “Treatment ofMeat Packing Waste Using PVC TricklingFilters,” Proceedings of the 2nd NationalSymposium on Food Processing Wastes,U.S. Environmental Protection Agency,Denver, Colorado, 1971.
Bethea, R.M., B.N. Murthy and D.F. Carey,“Odor Control for Rendering Plants,” Envi-ronmental Science and Technology, Vol. 7,June 1973.
Bishop, P.I., Pollution Prevention: Fundamen-tals and Practice, New York, 2000, p. 426.
Blanc, F.C. and S.H. Corr, “Treatment of BeefSlaughtering and Processing Waste WatersUsing Rotating Biological Contactors,” Pro-ceedings of the 38th Industrial WasteConference, Purdue University, 1983, pp.133-140.
“Bottling Breakthrough at 1000 to 2000 BPM,”Food Engineering, March 1969.
Bramer, H.C., Industrial Wastewater Manage-ment Handbook, New York, McGraw-Hill,1975.
Brooks, C.S., “Metal Recovery from WasteSludges,” Proceedings of the 39th PurdueIndustrial Waste Conference, Purdue Univer-sity, 1985, pp. 545-553.
Carron, H., Modern Synthetic Rubbers, VanNostrand Reinhold, New York, 1937.
Chadwick, T.H. and E.D. Schroeder, “Charac-terization and Treatability of PomaceStillage,” Journal of the Water PollutionControl Federation, Vol. 45, 1978.
Considine, D.M., Chemical and Process Tech-nology Encyclopedia, McGraw-Hill, NewYork, 1974.
Considine, D.M. and G.D. Considine, Foodsand Foods Production Encyclopedia. VanNostrand Reinhold, New York, 1982.
Crandall, C.J. and J.R. Rodenberg, “WasteLead Oxide Treatment of Lead Acid BatteryManufacturing Wastewater,” Proceedings ofthe 29th Purdue Industrial Waste Confer-ence, Purdue University, 1974, pp. 194-206.

Wastes from Industries 145
Crow, D.R. and R.F. Secor, The Ten Steps ofDeinking, TAPPI Journal, 70, 7 (July 1987).
Current Industrial Reports, U.S. DOC, Bureauof the Census, 1986, 1989.
Cushnie, G.C. Jr., Removal of Metals fromWastewater Neutralization and Precipita-tion, Noyes Publications, Park Ridge, NewJersey, 1984.
Eldridge, E.F. “Michigan Engineering Experi-ment Station Bulletin #60,” 1934.
Ellis, J. and R.W. Whitton, “Recovery of Tinform Electroplating Solutions and Rinsewa-ters,” Effluent and Water Treatment Journal,Vol. 18, N8, 1978, p. 389.
Etzel, J.E., Private Conversation, March 1989.Farmer, J.K., A.A. Friedman, and W.C. Hagen,
“Anaerobic Treatment of Winery Wastewa-ters,” Proceedings of the 43rd IndustrialWaste Conference, Purdue University, May1988.
Food Science, 3rd Edition, Potter, N.N., AVIPublishing, 1978.
“Frozen Foods,” Supermarket Business, 44, 9,175, September 1989.
Fukuyama, Yoji, Y. Misaka, and K. Kato,“Recovery of Aluminum Hydroxide fromFabricating Plant of Aluminum Products,”Proceedings of the 29th IndustrialWaste Conference, Purdue University, May1974.
Gillies, M.T., “Soft Drink Manufacture,” FoodTechnology Review, (8), 1973.
Graham, A.K., Electroplating EngineeringHandbook, Van Nostrand Reinhold Com-pany, New York, 1971.
Gudger, C.M., and J.C. Bailes, “The EconomicImpact of Oregon’s Bottle Bill,” OregonState University, Corvalis, Oregon, March1974.
Hamilton, J.O.C., Abstract No. 88-17491,“What Slump? It’s a Vintage Year for Pre-mium California Wines,” Business Week(Industrial Technology Edition), Issue 2947,May 1986.
Hunt, G.E., et al. “Cost-Effective Waste Man-agement for Metal Finishing Facilities,”Proceedings of the 39th Industrial WasteConference, Purdue University, 1985, pp.545–553.
“Increasing Wastewater Treatment,” FoodEngineering, 59, 8, 97, August 1987.
Jones, D.D., “Biological Treatment ofHigh-Strength Coke-Plant, Wastewater”,Proceedings of the 38th Industrial WasteConference, Purdue University, 561, 1983.
Kanicki, D.P., “Casting, Advantages, Applica-tions and Market Size,” 45M Handbook V.15: Castings, ASM International 1988.
Krofta, M., and L.K. Wang, Total Closingof Paper Mills with Reclamation andDeinking Installations, 43rd Purdue Indus-trial Waste Conference Proceedings, LewisPublishers Inc., Chelsea, Michigan, May1988.
Labella, S.A., I.H. Thaker, and J.E. Tehan,“Treatment of Winery Waste by AeratedLagoon, Activated Sludge and Rotating Bio-logical Contactor,” Proceedings of the 27thIndustrial Waste Conference, Purdue Univer-sity, May 1972.
Loehr, Raymond C., Pollution Control ForAgriculture, 2nd ed., Orlando, Florida, Aca-demic Press, 1984.
“The Looming Battle for Center of the Plate,”Advertising Age, 60, 49, S10, November 13,1989.
Lowenheim, F.A., Electroplating, Sponsoredby the American Electroplaters’ Society,McGraw-Hill, New York, 1978.
Macauley, M.N., W.T. Stebor, and C.L. Berndt,“Anaerobic Contact Pretreatment of Slaugh-terhouse Waste,” Proceedings of the 42ndIndustrial Waste Conference. Purdue Univer-sity, 1987, pp. 647–655.
Manzione, M.A., D.T. Merrill, M. McLearn,and W. Chow, “Meeting Stringent MetalsRemoval Requirements with Iron Adsorp-tion/Coprecipitation,” Proceedings of the44th Purdue University Industrial WasteConference, Purdue University, 1989.
Maxwell, J.C., Jr., “Coolers Have ChillingEffect on Wine Sales,” Advertising Age, Vol.59, No. 27, June 27, 1988.
Medbury, H. (ed.), The Manufacture of BottledCarbonated Beverages, American Bottlersof Carbonated Beverages, Washington, D.C.,1945.

146 Industrial Waste Treatment Handbook
Mermelstein, N.H., “Water Purification forBeverage Processing,” Food Technology,February 1972.
Metal Finishing 55th Guidebook Directory,Issue 1987, Vol. 85 No. 1A, Mid-January1987.
Metals Handbook, 9th ed., ASM International,1988.
MHR-VIANDES, World Beef and Veal Pro-duction in 1996: Meat Industry Statistics,Rond Point de l’Europe, France, 1998.
Modern Pollution Control Technology, Vol. 1,Air Pollution Control, Research and Educa-tion Association, New York, 1978.
Morton, M., Rubber Technology, AmericanChemical Society, Van Nostrand Reinhold,New York, 1973.
Nemerow, N.L., Liquid Waste of Industry,Addison-Wesley, Reading, Massachusetts,1971.
Neveril, R.B., J.U. Price, and K.L. Engdahl,“Capital and Operating Costs of Selected AirPollution Control Systems IV,” ControlTechnology News, Vol. 28, November 1978.
Niles, C.F., and H. Gordon, “Operation of anAnaerobic Pond on Hog Abattoir Wastewa-ter,” Proceedings of the 26th IndustrialWaste Conference, Purdue University, 1971.
Norcross, K.L., S. Petrice, R. Bair, and G.Beaushaw, “Start Up and Operation Resultsfrom SBR Treatment of a Meat ProcessingWastewater,” Proceedings of the 42nd Indus-trial Waste Conference, Purdue University,1987.
Osag, T.R. and G.B. Crane, Control of Odorsfrom Inedibles Rendering Plants, EPA 450/1-74-006, July 1974.
“PAC-Activated Sludge Treatment Coke-PlantWastewater,” Proceedings of the 40th Indus-trial Waste Conference, Purdue University,33, 1985.
Pandey, R.A., “Wastewater Characteristics ofLTC Process of Coal.” Journal of Environ-mental Science and Health, A24(6), 633(1989).
Parsons, Dr. W.A., Chemical Treatment of Sew-age and Industrial Wastes, Bulletin No. 215,National Lime Association, Washington,D.C., 1965.
Patrick, G.C. et al., “Development of DesignCriteria for Treatment of Metal-ContainingWastewaters at Oak Ridge National Labora-tory,” Proceedings of the 42nd PurdueIndustrial Waste Conference, Purdue Univer-sity, 1988, pp. 819-830.
Patterson, J.W. Industrial WastewaterTreat-ment Technology, Butterworth-Heinemann,Boston, 1985.
Patterson, J.W., “Metals Separation and Recov-ery,” Metals Speciation, Separation, andRecovery, Lewis Publishers, Chelsea, Michi-gan, 1987.
Perry, R.H., Perry’s Chemical Engineers’Handbook, 6th ed. McGraw-Hill, New York,1984.
Peters, R.W. and Young Ku. “The Effect of Cit-rate, A Weak Chelating Agent, on theRemoval of Heavy Metals by Sulfide Precip-itation,” Metals Speciation, Separation, andRecovery, Lewis Publishers, Chelsea, Michi-gan, 1987.
“Pilot Study of Upgrading of Existing CokeOven Waste Treatment Facility With Trick-ling Filter,” Proceedings of the 41stIndustrial Waste Conference, Purdue Univer-sity, 586, 1986.
Porges, R., and E.J. Struzeski, “Wastes fromthe Soft Drink Bottling Industry,” Journal ofthe Water Pollution Control Federation, Vol.33, p. 167, 1961.
Potter, N.N., Food Science. AVI Publishing,Westport, Connecticut, 1978.
Prokop, W.H., “Plant Operations,” RendererMagazine, October, 1979.
Prokop, W.H., “Wet Scrubbing of High Inten-sity Odors from Rendering Plants,”presented at the APCA Specialty Confer-ence, State-of-the-Art of Odor ControlTechnology II, Pittsburgh, Pennsylvania,March 10–11, 1977.
Pulp and Paper Manufacture, Vol. II: Control,Secondary Fiber, Structural Board, andCoating, Joint Textbook Committee of thePaper Industry, 1969.
Ramirez, E.R. and O.F. D’Alessio, “InnovativeDesign and Engineering of a WastewaterPretreatment Facility for a Metal FinishingOperation,” Proceedings of the 39th Purdue

Wastes from Industries 147
Industrial Waste Conference, Purdue Univer-sity, 1985, pp. 545-553.
“A Report on Bottled and Canned Soft Drinks,SIC 2086, and Flavoring Extracts and Syr-ups, SIC 2087,” Associated Water and AirResearch Engineers, Inc., August 1971.
Robertson, W.M., J.C. Egide and J.Y.C. Huang,“Recovery and Reuse of Waste Nitric Acidfrom an Aluminum Etch Process,” Proceed-ings of the 35th Industrial WasteConference, Purdue University, May 1980.
Rudolfs, W. Industrial Wastes: Their Disposaland Treatment, L.E.C. Publishers, NewYork, 1961.
Russell, J.M. and R.N. Cooper, “Irrigation ofPasture with Meat-Processing Plant Efflu-ent,” Proceedings of the 42nd IndustrialWaste Conference, Purdue University, 1987,pp. 491–497.
Russell, L.L., J.N. DeBoice, and W.W. Carey,“Disposal of Winery Wastewater,” Proceed-ings of the 7th National Symposium on FoodProcessing Wastes, EPA 600/2-76-304,December 1976.
Ryder, R.A., “Winery Wastewater Treat-mentand Reclaimation,” Proceedings of the28th Industrial Waste Conference, PurdueUniversity, May 1973.
Sawyer, C.N. and P.L. McCarty, Chemistry forEnvironmental Engineers, 3rd Edition,McGraw-Hill, New York, 1978.
Sell, N.J., Industrial Pollution Control, VanNostrand Reinhold, New York, 1981.
Sirrine, K.L., P.H. Russell, Jr., and J. Make-peace, Winery Wastewater Characteristicsand Treatment, EPA 600/2-77-102.
Snoeyink, V.L. and D. Jenkins, Water Chemis-try, John Wiley & Sons, New York, 1980.
Stander, G.T., “Treatment of Wine DistilleryWaste by Anaerobic Digestion,” Proceedingsof the 22nd Industrial Waste Conference,Purdue University, May 1967.
Steffan, A.J. and M. Bedker, “Operationsof a Full Scale Anaerobic ContactTreatment Plant for Meat Packing Wastes,”Proceedings of the 16th Industrial WasteConference, Purdue University, 1971.
Steffen, A.J., In-Plant Modifications To ReducePollution And Pretreatment Of Meat Packing
Wastewater For Discharge To MunicipalSystems, Environmental Protection Agency,West Lafayette, Indiana, 1973.
Stevenson, T., Southby’s World Wine Encyclo-pedia, Little Brown, Boston, 1988.
Supermarket Business, 44, 3, 85, March 1989.Synthetic Rubber: The Story of an Industry,
International Institute of Synthetic RubberProduction, New York, 1973.
Title 40, Code of Federal Regulations, EffluentGuidelines and Standards, Part 430, SubpartQ Deink Subcategory, published January 30,1987.
U.S. Bureau of the Census, Statistical Abstractof the United States: 1988, Washington,D.C., 1987.
U.S. Bureau of the Census, Statistical Abstractof the United States: 1990 (110th AnnualEdition), January 1990.
U.S. Department of Energy, Quarterly CoalReport, October–December 1989.
U.S. Department of Health, Education, and Wel-fare, An Industrial Guide to the Meat Industry,U.S. Government Printing Office, PublicationNo. 386, Washington, D.C., 1954.
U.S. Environmental Protection Agency, Bio-logical Removal of Carbon and NitrogenCompounds from Coke Plant Wastes. EPA,April 1973.
U.S. Environmental Protection Agency, Devel-opment Document for Effluent LimitationGuidelines and New Source PerformanceStandards for the Red Meat Processing Seg-ments of the Meat Products Point SourceCategory, EPA, Washington, D.C., 1974.
U.S. Environmental Protection Agency, Devel-opment Document for Effluent LimitationGuidelines and Standards for the Foundries(Metal Molding and Casting), EPA 440/1-80/070a, 1980.
U.S. Environmental Protection Agency, Devel-opment Document for Effluent LimitationsGuidelines and Standards for the Iron andSteel Manufacturing Point Source Category,Vol. II. EPA, December 1980.
U.S. Environmental Protection Agency, Devel-opment Document for Effluent LimitationsGuidelines and Standards for the Pulp,Paper and Paperboard Point Source

148 Industrial Waste Treatment Handbook
Category, U.S. EPA Office of Water, EPA440/1-82/025, October, 1982.
U.S. Environmental Protection Agency, Devel-opment Document for Effluent LimitationsGuidelines and Standards of Performancefor the Battery Manufacturing Point SourceCategory, EPA 440/1-82/067-b, Washing-ton, D.C., 1982.
U.S. Environmental Protection Agency, Devel-opment Document for Effluent LimitationsGuidelines and Standards of Performance,Rubber Processing Industry, EPA 440/1-74-013-A, Washington, D.C., 1974.
U.S. Environmental Protection Agency, Pro-ceedings 8th National Symposium on FoodProcessing Wastes, U.S. EPA, Washington,D.C., August 1977.
U.S. Environmental Protection Agency, Treat-ability Manual, EPA 600/2-82-001b, 1982.
U.S. Environmental Protection Agency,Upgrading Meat Packing Facilities to ReducePollution, EPA, Washington, D.C., 1973.
U.S. Environmental Protection Agency, Waste-water Characteristics for the Specialty FoodIndustry, U.S. EPA, Washington, D.C., 1974.
U.S. Environmental Protection Agency, Officeof Water Regulation and Standards, Effluent
Guidelines Division, Proposed Develop-ment Document for Effluent LimitationsGuidelines and Standards for the CopperForming Point Source Category, EPA 44011-82/074-b, October 1982.
Van Nostrand, N.J., Van Nostrand’s ScientificEncyclopedia, John Wiley & Sons, NewYork, 1983.
Varley, P.C., The Technology of Aluminum andIts Alloys, CRC Press, Cleveland, Ohio,1970.
Ward, Roger C., “Aluminum Anodizing Waste-water Treatment and Reuse,” Proceedings ofthe 36th Industrial Waste Conference, Pur-due University, May 1981.
Ward, Roger C., “Aluminum Anodizing Waste-water Treatment and Reuse,” Proceedings ofthe 36th Industrial Waste Conference, Pur-due University, May 1981.
Westra, M.A. and B.L. Rose, “Oil and GreaseRemoval from a Concentrated Source inthe Metal Finishing Industry,” Proceedingsof the 44th Purdue University IndustrialWaste Conference, Purdue University,1989.
Whitby, G.S., Synthetic Rubber, John Wiley &Sons, New York, 1954.
149
5 Industrial Stormwater Management
General
Precipitation of all types falls on industrialfacilities and, in so doing, transports chemicalsand inert solids from wherever it physicallycontacts them to other parts of the environ-ment. Any industrial facility will have somecontamination on all surfaces, including roofs,parking lots, storage facilities, roads, side-walks, and grassy areas.
Because all substances are soluble, to someextent, in water (the universal solvent), anychemical substances in either liquid or solidform will become dissolved (to an extent equalto or less than the solubility limit for that sub-stance) and will either percolate into theground or be carried with the rainfall runoff.Some particles that are not dissolved will becarried along with the runoff, and some amountof gases will be dissolved in the runoff. Most,if not all, of that which percolates into theground will eventually join the groundwater.
The type and amounts of materials thatbecome incorporated into the runoff depend onthe state of cleanliness of the industrial facility,the area of the roofs, parking lots, roadways,etc., as well as the characteristics of the precip-itation itself, in terms of intensity, duration, pH,temperature, and chemical constituents. Fac-tors such as the topography of the plant site, thecharacteristics of the surfaces over which therunoff flows, and the stormwater managementfacilities that have been constructed will alsohave a major influence on the quality of thestormwater runoff as it leaves the industrial siteor percolates into the ground.
The quality and, in some cases, the quantityof the water that leaves the industrial site,whether via overland flow to surface waters orvia percolation into the groundwater, is ofimportance in the context of compliance with
environmental regulations. More to the point,the quality and quantity of the stormwater run-off before it leaves the site is the subject ofstormwater management, as it relates to a pol-lution prevention program, the design of col-lection and treatment facilities, and regulatorycompliance monitoring.
Control and, indeed, prevention of contami-nation of groundwater and surface water bystormwater percolation or runoff is a matterof preventing or controlling the followingactivities:
• Contamination of surfaces with whichstormwater can come into contact, such asroofs, parking areas, storage areas, roads,industrial yard areas, tanks, piping systems,and outdoor equipment
• Contamination of unpaved areas by spills,leaks, and drips, either by accident or as aroutine consequence of inadequate preven-tive maintenance
• Accidents
Prevention of accidents is best accomplishedthrough a vigorous safety program. Preventionof leaks and drips is best accomplished throughan exemplary preventive maintenance program.
Federal Stormwater Regulations
By Karen Townsend
BackgroundFederal regulation of stormwater originatedwith the 1987 Clean Water Act amendmentsthat established the authority for the U.S. EPAto develop a phased approach to stormwaterdischarge permitting and management. Two

150 Industrial Waste Treatment Handbook
stormwater rules followed in 1990 and 1992:the “stormwater application rule” and the“stormwater implementation rule.” The storm-water application rule of November 1990identified the types of facilities subject to per-mitting under the National Pollutant DischargeElimination System (NPDES) program (foundat 40 CFR Part 122), and the stormwater im-plementation rule of April 1992 described therequirements for NPDES stormwater permits.
Phase I of the stormwater application rule isapplicable to heavy industrial dischargers, asidentified by the Standard Industrial Classifica-tion (SIC) code, as well as large and mediummunicipal separate storm sewers and operatorsof large construction sites (i.e., disturbing 5 ormore acres of land area). The Phase II rules,finalized in October 1999, expanded the PhaseI authority to include small municipal separatestorm sewers and small construction sites (i.e.,that disturb between 1 and 5 acres of land).
Industrial facilities are required to complywith the stormwater rules if they meet the fol-lowing three criteria:
• Discharge stormwater via one or more pointsources (e.g., a pipe, swale, or ditch) intowaters of the U.S. (either directly or througha municipal separate storm sewer) and
• If the facility falls within one of the follow-ing categories:
• either engaged in industrial activity(defined by SIC code)
• already covered under a NPDES permitor
• identified by the EPA as contributing to awater quality violation
Note that the federal stormwater rules are notapplicable in the following situations (althoughstate or local rules may be applicable):
• Nonpoint source discharges of stormwater• Discharges of stormwater to municipal
sewer systems that are combined stormwa-ter and sanitary sewers
• Discharges of stormwater to groundwater
There are currently two types of stormwaterdischarge permits issued to industrial dischargers
by the NPDES permitting authority (either theU.S. EPA region or the state administrator, inthe case of states with delegated NPDES per-mitting authority): the Multi-Sector GeneralPermit and the Individual Permit.
Multi-Sector General PermitThe NPDES Stormwater Multi-Sector GeneralPermit (MSGP) is the simplest form of NPDESpermit coverage that an industrial facility canobtain, although there are circumstances thatwould cause a facility to be ineligible forMSGP coverage. The original MSGP wasissued in the Federal Register on September29, 1995, and incorporates requirements for 29industrial sectors. On September 30, 1998, themodified MSGP was issued to cover additionalindustrial dischargers not previously includedin the MSGP. Industrial facilities that haveactivities covered under one or more of theindustrial sectors in the MSGP are eligible forcoverage.
To obtain MSGP coverage, the facility mustsubmit a Notice of Intent (NOI) for coverageand prepare and implement a StormwaterPollution Prevention Plan (SP3). The MSGPcontains industry-specific requirements forstormwater monitoring, reporting, and, in somecases, specific best management practices(BMPs) to minimize contamination of runoff.
Individual PermitThe NPDES Individual Permit requires thepreparation and submittal of NPDES Forms 1and 2F, which request specific informationabout the facility; the industrial operations; andthe results of stormwater sampling, analysis,and flow measurement. A facility-specific Indi-vidual Permit is issued by the NPDESpermitting authority and typically contains dis-charge limits, monitoring and reportingrequirements, and may require implementationof BMPs or pollution prevention measures.Industrial facilities that are required to applyfor an Individual Permit include:
• Facilities that are not covered under theMSGP

Industrial Stormwater Management 151
• Facilities that have previously had anNPDES permit for stormwater
• Facilities that are determined by the permit-ting authority to be contributing to aviolation of a water quality standard
Because of the backlog of applications andthe lengthy application review and permit writ-ing process for Individual Permits, permittingauthorities typically recommend that discharg-ers seek coverage under the MSGP, if eligible.In some U.S. EPA regions, applicants seekingIndividual Permits have waited 3 to 5 years ormore to receive their permits.
Construction General PermitOne additional stormwater permitting issuethat an industrial or environmental managermust be aware of is the NPDES StormwaterConstruction General Permit. This permit isapplicable to construction projects at industrialfacilities that disturb 1 or more acres of landarea. The permitting process is the same as forthe MSGP; submittal of an NOI for coverageand implementation of an SP3 that focuses onBMPs (such as sediment and erosion controlmeasures) during construction.
Stormwater Pollution Prevention Plan (SP3)Among the important requirements of theMSGP is the development and implementationof an SP3. The goal of the SP3 is to reduce oreliminate the amount of pollutants in stormwa-ter discharges from an industrial site. The SP3must be developed with input from a desig-nated Pollution Prevention Team, consisting offacility staff representing key manufacturing,operations, and environmental managementareas. The SP3 must identify all potential pol-lutant sources and include descriptions ofcontrol measures to eliminate or minimize con-tamination of stormwater. The SP3 mustcontain the following:
• A map of the industrial facility identifyingthe areas that drain to each stormwater dis-charge point
• Identification of the manufacturing or otheractivities that take place within each area
• Identification of the potential sources ofpollutants within each area
• An inventory of materials that can beexposed to stormwater
• An estimate of the quantity and type of pol-lutants likely to be contained in thestormwater runoff
• A history of spills or leaks of toxic or other-wise hazardous materials for the past 3years
Best Management Practices (BMPs) must beidentified. BMPs should include good house-keeping practices, structural control measureswhere needed, a preventive maintenance pro-gram for stormwater control measures, andprocedures for spill prevention and response.Traditional stormwater management controls,such as oil/water separators and retention/equalization devices, must also be included asneeded.
• For facilities that are subject to EPCRA 313reporting, the SP3 must address those areaswhere the listed Section 313 “water prioritychemicals” are stored, processed, or han-dled. These areas typically require stricterBMPs in the form of structural controlmeasures.
• A certification of Nonstormwater Dis-charges. In order to make this certification,the facility must have piping diagrams thatconfirm no nonstormwater connections tothe storm sewer. Otherwise, all outfalls mustbe tested, by dye or other tracer, to ensurethat there are no connections of sewers thatcarry other than stormwater.
• A recordkeeping system must be developedand maintained, as well as an effective pro-gram for training employees in matters ofcontrols and procedures for pollutionprevention.
Prevention of Groundwater Contamination
Measures and facilities to prevent contamina-tion of groundwater should be developedconcurrently with those that have the purpose

152 Industrial Waste Treatment Handbook
of protecting against surface water contamina-tion. The most important are as follows:
• Construction of impermeable barriers such asconcrete pads to prevent percolation ofstormwater after it has become contaminated
• Installation of fool-proof automatic shut-offdevices to prevent spills from overflowingtanks
• Alarms
• An aggressive preventive maintenance pro-gram to prevent the occurance of leaks
• Control of particulate and aerosol emissionsand routine cleaning of all surfaces on theindustrial site
The foregoing work seeks to eliminate and/or reduce contamination of stormwater runoffat the site to the point where compliance withall applicable regulations occurs without thenecessity of expensive collection, retention,treatment, and discharge facilities.
A thorough program should be carried out toeliminate leaks, spills, and uncovered storageareas. Also, spill containment devices should becarefully designed and constructed. It is veryimportant to segregate uncontaminated runofffrom contaminated or potentially contaminatedrunoff. For instance, roofs that have a reason-able potential to become contaminated withdust or other fallout should be fitted with guttersand ancillary piping. The piping should segre-gate this runoff from any and all runoff that willnot become contaminated. Paved and unpavedareas should be surveyed, and those areas thatare not subject to contamination should be iso-lated, regarding runoff collection and convey-ance. Certainly, a safe approach would be todesign and construct a retention basin for runoffthat is expected to be clean and to sample andanalyze this water before it is discharged.
Stormwater Segregation, Collection, Retention, and Treatment
The collection system for contaminated runoffconsists of rain gutters, catch basins, pumpingstations, open channels, and pipes. This systemmust always be well maintained, kept clean,
and free of leaks. Also, easy access to the col-lection system for sampling and analysisshould be designed and built into the system.Because this water undergoes retention andtreatment, its volume should be minimizedby careful segregation from uncontaminatedstormwater. Careful segregation will also maxi-mize the concentration of contaminantsbecause, presumably, the quantity of contami-nants at a given industrial site at a given time isfixed by the circumstances and events that haveoccurred before the storm event. Therefore, thesmaller the amount of stormwater in which thecontaminants are dissolved or suspended, themore concentrated they will be. For most treat-ment devices, such as oil skimmers andsedimentation facilities, this higher concentra-tion will lead to more effective treatment.
Control of the quantity and quality of storm-water discharges is possible only if effectivesegregation, collection, retention, and treat-ment facilities are in use. Furthermore, theeffectiveness—from both a cost perspectiveand a physical perspective—depends on properdesign. Opportunities for segregation of“clean” runoff from “contaminated” runoffshould be exposed as the first step in develop-ing an effective stormwater management pro-gram. Source segregation can be effective inreducing the volume of runoff to be collectedand treated. In general, the sizes of the collec-tion, retention, and treatment facilities arederived from precipitation records and selec-tion of a design storm. Because the concept ofa design event implies periodic “failure,” it isnecessary to include, within the design of thestormwater management facilities, provisionsto prevent damage to those facilities or viola-tions of permits.
Design Storm
The 25-year, 24-hour storm event has beenshown to be an appropriate design basis forstormwater management facilities for an indus-trial plant when “conventional” pollutants arethe only substances of concern. (In situationswhere PCBs or other toxic substances arepotential pollutants, a 50- or 100-year storm

Industrial Stormwater Management 153
would be more appropriate, as discussed later.)The total volume of runoff, calculated by use ofthe “rational method” or another more sophisti-cated runoff modeling procedure, is used todetermine the capacity of the retention device.The peak runoff rate is used to size the collec-tion and piping, ditching, pumping, or otherconveyance facilities.
By definition, there is a 4% probability thatthe 25-year storm will be exceeded in anygiven year. For this reason, a type of riskassessment or alternatives analysis should becarried out to determine if the benefits ofdesigning for a storm event that would yield agreater volume and/or peak flow rate such asthe 50-year, 24-hour storm or even the 100-year storm would outweigh the risk of an over-flow and, potentially, a permit exceedance.Factors to be considered in such a risk assess-ment include the water quality standards of thereceiving water, the discharge permit limits,and the potential enforcement consequences,should an exceedance of permit limits occur. Ifthe receiving stream winds through a publicpark, for instance, the presence of an oil sheenwould likely result in a permit exceedance, notto mention unfavorable publicity for theresponsible party.
System Failure Protection
Because, by definition, the stormwater manage-ment system will “fail” periodically, in terms ofcapacity of the retention device, and/or the con-veyance facilities, it is extremely important todesign and construct overflow devices and otherexcess water management facilities. The over-flow and excess water conveyance devices mustprotect against erosion and contamination ofgroundwater. These devices must also be main-tained and kept clean and they should, therefore,be designed to allow easy access. The capacityof these facilities should accommodate any con-ceivable storm event.
Stormwater Retention
Stormwater retention facilities retain contami-nated stormwater until it can be treated
to concentration limits specified in theappropriate discharge permit or to quality char-acteristics required for use of the processmakeup water in the industrial plant (seeStormwater as a Source of Process WaterMakeup). Retention can be accomplished inlined, earthen basins or in above- or below-ground concrete or steel tanks. An industrialplant in a nonurban location having large areasof unused land would consider the cost effec-tiveness of a lined, earthen basin first, whereasa plant in an urban location with limited avail-able unused land might first consider an above-or below-ground concrete basin.
As explained earlier, the size of the storm-water retention facility is based on a designstorm event. Additional factors that must beincluded are as follows:
• Precipitation that falls directly into theretention device
• The rate at which water is taken out of thebasin, as it relates to the probability ofanother storm event taking place very soonafter the design storm has occurred
The rate at which water is removed from theretention basin is a function of the capacity ofthe treatment system and the rate of use of thiswater, if it is indeed used as a source of make-up water in one or more processes in themanufacturing facility. The procedures pre-sented in Chapter 8 for designing the size (vol-ume) of a flow equalization facility areappropriate to be used for the design of astormwater retention basin, once the volumeand characteristics of the design storm havebeen determined.
Stormwater Treatment
Design of treatment systems for stormwaterrunoff is always based on the degree and typeof treatment required, which depend on:
• The water quality limits specified in the dis-charge permit
• The water quality criteria required for use inthe plant

154 Industrial Waste Treatment Handbook
Almost always, pH adjustment is required,which normally involves pH measurement andrecording, chemical feeding and mixing, andflow measurement and control. Oil skimmingis also very common. If simple skimmingproves inadequate, sand or other filtration, pos-sibly with chemical augmentation, might benecessary. Dissolved air flotation (DAF) isanother potential treatment strategy for meet-ing fats, oils, and greases (FOG) limitations.
If the total suspended solids (TSS) must becontrolled to low limits, there is a possibilitythat retaining the stormwater runoff for a con-siderable period will provide for this control bysedimentation in the retention basin. If thismethod is to be used, the design of the reten-tion device must include provision for removalof the solids and maintenance of sufficient free-board to contain the next one or more stormswhile the sedimentation process is takingplace.
If sedimentation within the retention basin isnot sufficient for the degree of TSS removalrequired, chemical coagulation facilities, asdescribed in Chapter 8, possibly followed bysand or other filtration, may be the best solu-tion. Again, DAF might also be appropriate, inwhich case TSS and FOG removal would takeplace simultaneously.
If the stormwater is to be used as a source ofprocess water makeup, the total dissolved sol-ids (TDS) content may be an important consid-eration. If such is the case, it is likely thatdilution is the only feasible solution, ratherthan any of the methods for removal of TDSsuch as those shown on the left side of Figure8-1, presented in Chapter 8.
Design of treatment facilities for stormwaterrunoff must always include consideration offuture requirements, such as more stringentlimits in future NPDES permits. Such consid-eration might result in simply providing roomto add additional treatment devices; however,the most cost-effective procedure might be toprovide a high level of treatment and to use andreuse the stormwater in one or more processeswithin the industrial plant. This solution wouldrequire a certain amount of blow-down to con-trol TDS and/or temperature, which would
have to be discharged as treated processwater, within compliance with the appropriatepermit(s).
Stormwater as a Source of Process Water Makeup
If collected stormwater is to be used as make-up water for one or more manufacturing, clean-ing, cooling, or other processes in the industrialplant (or by a neighboring industrial or otherfacility), treatment considerations can becomemuch different from those that are appropriateto simple discharge within compliance with anNPDES permit. For one thing, a storage facilityfor the treated stormwater will likely beneeded. In addition, if it is elected to recycleand reuse the stormwater (plus water fromother sources), provisions must be included toprevent buildup of TDS, BOD, and heat toundesirable levels.
Dissolved Solids (TDS)As explained in Chapters 7 and 8, recyclingwater in an industrial plant results in increasingTDS concentration because of evaporation.High levels of TDS can lead to scaling and/orcorrosion of facilities and equipment. Often,the most cost-effective solution is to dischargea certain quantity of the recycle water each day(blow-down) and make it up with water of lowTDS concentration; however, in locationswhere water of low TDS concentration is notavailable, or is available at high cost, the bestsolution may be to remove TDS by either side-stream treatment or full-flow treatment by oneof the methods presented in Chapter 8. A solidsbalance analysis must be performed, as pre-sented later, to properly design the blow-down,makeup, and/or treatment facilities.
Biological Oxygen Demand (BOD)The buildup of BOD in a water recycle systemoccurs in exactly the same manner as TDS,described earlier. Rather than a scaling or cor-rosion problem, however, the buildup oforganic solids that are associated with BOD

Industrial Stormwater Management 155
results in the growth of microbes in the waterconveyance and use system. This condition,referred to as “biological fouling,” can result indisaster and is to be avoided to say the least. Ingeneral, there are three approaches to avoidingthe problem of biological fouling:
• Employing sufficient blow-down andmakeup so that biological fouling can becontrolled with disinfection
• Removing dissolved organics by activatedcarbon, ultrafiltration, or other physicaltreatment process, probably in conjunctionwith blow-down, makeup, and disinfection
• Removing BOD with biological treatment,by one of the methods presented in Chapter8, probably in conjunction with blow-down,makeup, and disinfection
Again, mass balances must be performed, aswas the case for TDS, to properly design BODcontrol facilities for water recycle and reusesystems.
HeatIn certain situations, heat can build up to unde-sirable levels in a water recycle/reuse system.There are, in general, three approaches to solv-ing this problem:
• Passing the recycle water through a heatexchanger to transfer some of the heat to aprocess stream or to plant washdown waters
• Making use of a cooling tower to wastesome of the heat
• Diluting the recycle stream with cold waterfrom another source
In all three of these approaches, the quantityof water in the recycle system must be main-tained within an acceptable range by addingmakeup water or discharging excess water.Also, whether or not it is intended to ever dis-charge any stormwater, an NPDES permitshould be obtained because the possibility, infact, the probability, of discharging stormwaterrunoff as a result of an unexpectedly largestorm or a problem with the stormwater recy-cle/reuse system is always present.
Case HistoryA metals forging manufacturing facility islocated on a 189-acre parcel of land alongside ariver having a 7Q10 flow of 240 cfs. The plantperforms various metal-working operations suchas forging, heat treating, chemical etching, andgrinding. The manufacturing complex consistsof two primary manufacturing buildings: a forgeshop and a process and maintenance (P&M)building. Other support buildings include anoffice and administration building, several airpollution control (APC) buildings, a rinsewaterpretreatment plant (RPP), and an oily wastewa-ter treatment plant (OWTP), as shown inFigure 5-1.
Stormwater runoff from the building roofand yard areas in the northern, eastern, andnorthwestern portions of the plant site flow bygravity to an existing impoundment (Impound-ment 001) and are discharged at an NPDES-permitted Outfall 001. Remaining roof andyard areas are collected and directly dischargedat four other NPDES-permitted outfalls on site.In addition to stormwater runoff, Impoundment001 receives some pretreated process wastewa-ters from the forge shop and P&M building,fire protection water from the forge shop, andnoncontact cooling water. The plant uses lubri-cating and cutting oils, greases, coolants, andacids in its forging and associated processes.
Forge Shop Area Stormwater ProjectThe Forge Shop Area Stormwater Projectaddressed the stormwater and process waste-water that drained to NPDES Impoundment001. The objectives of this project werethreefold:
• Segregate uncontaminated and contami-nated stormwaters
• Construct a new Runoff Management Facil-ity (RMF) to replace Impoundment 001
• Identify BMPs to manage stormwaterquality
Preliminary Engineering StudiesAs a result of studies to identify and character-ize the sources of flows to Impoundment 001,

156Industrial W
aste Treatment H
andbook
Figure 5-1
Site plan.
BOSTON & ALBANY RAILROAD
BONNY BROOK DRAINAGE SWALE
COOLINGTOWER
WATER TOWERS
FORGE SHOP
NPDESOUTFALL 003
NPDESOUTFALL 011
NPDESOUTFALL 008
APC
COMPLEX
STO
RA
GE
PROCESS & MAINTENANCE(P&M)BUILDING
FORMER SLUDGEDRYING BEDS
FORMER SEWAGEDISPOSAL PLANT
QUINSIGAMOND RIVERWATER PUMP STATION
NPDES OUTFALL 009
GUARDHOUSE
OFFICE BLDG.
GRAFTON RINSEWATERPRETREATMENT PLANT(GRPP)
NPDESOUTFALL010
NPDES OUTFALL 001
IMPOUNDMENT 001
OILY WASTE WATERTREATMENT PLANT(OWTP)
DRAINAGESWALE
N

Industrial Stormwater Management 157
it was determined that the storm drainage sys-tem had been used for the discharge of someprocess wastewaters, that there was a potentialfor spills to enter the system, and that a limitednumber of source areas were responsible for alarge portion of the total constituent loading toImpoundment 001.
Next, an evaluation was conducted of avail-able options for eliminating or segregating pro-cess wastewaters and contaminated stormwaterfrom uncontaminated stormwater. The resultsof this work indicated that:
• Many sources could be eliminated at lowcapital cost.
• The eastern half of the P&M building roofwas not contaminated and could be segre-gated, thereby eliminating 7.2 acres ofrunoff area from the total 29-acre drainagearea to Impoundment 001.
Treatability studies were conducted on theexpected influent stream to Impoundment 001,based on elimination of the identified processsources and the clean portion of the P&Mbuilding roof. A stormwater management con-cept of containment of the design storm, treat-ment, and controlled release of the effluent tomeet mass-based permit limits was developedas the initial basis of design for the RunoffManagement Facility (RMF).
Initial Design of RMFPiping system modifications were designedand constructed that would eliminate processwastewater and segregate the clean portion ofthe P&M building roof. The uncontaminatedroof runoff was discharged without treatment atNPDES Outfall 009. The areas that were sub-ject to impact from industrial activitiesremained tributary to NPDES Outfall 001.
The RMF design included runoff collection,treatment, and direct discharge at a newNPDES Outfall 001. The treatment conceptconsisted of grit removal, sedimentation, oilskimming, and pumped discharge of the efflu-ent at a rate that would meet current mass-based NPDES permits, as follows:Total Suspended Solids (TSS) 70 lbs/day Fats, Oil, and Grease (FOG) 50 lbs/day
Provisions were included for containment ofspills within the drainage area of the RMF, andconsideration was given to future effluent pol-ishing (by means of polymer addition andadsorption clarification) in the event that theRMF was not able to meet the limits of theNPDES permit. Subsequent to the developmentof this concept, the U.S. EPA issued a renewedNPDES permit containing the water quality–based limits presented in Table 5-1, whichcould not be met with the proposed treatmentscheme.
Revised Design of RMFBecause of the high cost for an advanced treat-ment system and lack of guarantee of meetingthe new discharge limits, it was decided toinstitute a stormwater recycle program to elim-inate the regular discharge at Outfall 001 andreduce the demand for water from processwater supply sources. The design concept wasthus revised to incorporate sand filtration andrecycle of the treated water for use in the man-ufacturing process. The original designfeatures of grit and oil removal, sedimentation,and equalization were retained.
The following design criteria for the RMFwere agreed upon:
Design Storm: 25-year, 24-hour stormevent
Mode of operation: Incorporate processwater effluent intostormwater retentionand treatment system.Recycle and reuse con-tinuously. Blow-downas necessary to main-tain desired waterquality.
Recycle Water Quality: TSS: <1–10 mg/L FOG: <1 mg/L pH: 5.0 –8.0
In order to determine the buildup of TDS,TSS, BOD, and heat caused by the “cycles ofconcentration” effect, mass balances of water,constituent substances, and heat were per-formed.

158 Industrial Waste Treatment Handbook
Table 5-1 Existing NPDEs Outfall 001 Permit Limits
(Limits stated in mg/L except as indicated.)
Water BalanceBecause the RMF would receive both stormwa-ter runoff and process wastewaters, dry and wetweather flows had to be considered. A waterbalance was performed to represent the flow ofwaters before and after the recycle system wasput into effect. Incoming water to the site origi-nated from several sources:
• Onsite wells for process use and fireprotection
• Municipal water for process and sanitary use
• River water for process use and fire protection
• Stormwater
Flow measurement data were collected, andaverage annual rainfall data were used to
Constituent Monthly Avg. Daily Max.
Oil & Grease — 15
pH (range) 6.5–8.0
Temperature, ºC 20 28.3
Total suspended solids (lb/day) 70 210
Total Aluminum 0.087 0.75
Total Arsenic < 0.01 < 0.01
Ammonia 0.096 0.122
Total Copper 0.006 0.0084
Total Iron 0.3 0.3
Total Lead < 0.010 < 0.010
Total Mercury < 0.0002 0.0002
Total Molybdenum 0.004 0.004
Total Selenium 0.010 0.05
Total Thallium 0.0136 0.0136
Total Zinc 0.054 0.059
Total Cyanide 0.005 0.022
Trichloroethylene 0.0027 0.005
2,4,6-Trichlorophenol 0.0012 0.0036
Methylene chloride 0.05 0.05
Tetrachloroethylene 0.0008 0.0008
Biological Toxicity:
C-NOEC > 100% Effluent > 100% Effluent
LC50

Industrial Stormwater Management 159
estimate average wet weather flow. The waterbalance representing the “before recycle” sce-nario is presented in Figure 5-2.
Discharges from the site originated from thefollowing sources:
• NPDES permitted outfalls
• RPP effluent
• Sanitary wastewater
• Miscellaneous losses
As with the incoming flows, flow data werecollected and water use records were used toestimate sanitary and process wastewaterflows. An internal cooling water tower wasresponsible for most of the losses because ofevaporation. Also, some water was lost fromthe system as dilution water for acid and caus-tic solutions. The “after recycle” water balance,presented in Figure 5-3, shows that all storm-water runoff could be used as process watermakeup. In addition to reducing the waterwithdrawn from the river, less municipal waterwould be used (68,000 vs. 160,000 GPD).
Mass BalanceAlthough the existing levels of TDS, TSS, andBOD were very low, the mass balance showedthat levels of BOD in the recycle loop couldreach 10 to 15 mg/L, indicating a need for dis-infection to prevent biological fouling of thewater distribution piping and equipment. It wasdetermined that TDS would not reach problem-atic levels, and, because of the sand filter in thetreatment train, TSS was not expected to be aproblem. A heat balance showed that the tem-perature within the recycle loop could reach102ºF during the summer, indicating the possi-ble need for a heat exchanger or cooling tower.A cooling tower, of course, would have theeffect of increasing the concentration of TDS,TSS, and BOD, and would require revision ofthe mass balances if considered further.
Stormwater Collection and RetentionThe RMF was designed to serve three stormdrain lines and the effluent from the proposedoily wastewater pretreatment system (OWPS),
a pretreatment system that was being designedto remove free oils and emulsified oils frompresswaters. All of these flows were routed tothe eastern portion of the site to Outfall 001 butrequired interception prior to the Outfall andrerouting to the northeast to the proposed RMFlocation. This was accomplished via the designof a cast-in-place concrete junction chamber atthe head end of the Impoundment. The junctionchamber was designed to intercept and reroutethe flows without “throttling” the storm drain-age system or allowing solids to settle out. Thestructure was designed to be constructed in aphased approach that would maintain the dis-charges to Impoundment 001 until the RMFwas ready to receive flow.
The sedimentation basin was sized to retainthe design storm volume, to provide the surfacearea and retention time for solids settling, andto serve as an equalization tank. Design of thebasin (configuration and depth) was controlledby site hydraulic limitations imposed by theinvert elevations of the existing storm drainlines relative to the water surface elevation ofthe receiving water for the overflow discharge.
Treatment and Recycle StorageThe unit processes of the RMF are representedin Figure 5-4. The process flow diagram andthe layout of the RMF site are shown Figure5-5. The unique design aspects of each unitprocess are described in the following sections.
PLC Control and Operator InterfaceControl of the RMF is semiautomatic with
the use of a programmable logic controller(PLC) for pump control and alarms. An opera-tor interface terminal (OIT) was placed in theRMF for operator control. A second OIT wasplaced in the plant engineering office for moni-toring purposes.
Grit ChamberThe grit chamber was designed to lower the
influent flow velocity, thereby allowing for theremoval of particles with a specific gravitygreater than 2.65 and of a size that wouldbe retained on a 100-mesh screen. Initial oil

160Industrial W
aste Treatment H
andbook
Figure 5-2
Water balance before recycle.

Industrial Stormw
ater Managem
ent161
Figure 5-3
Water balance after recycle.
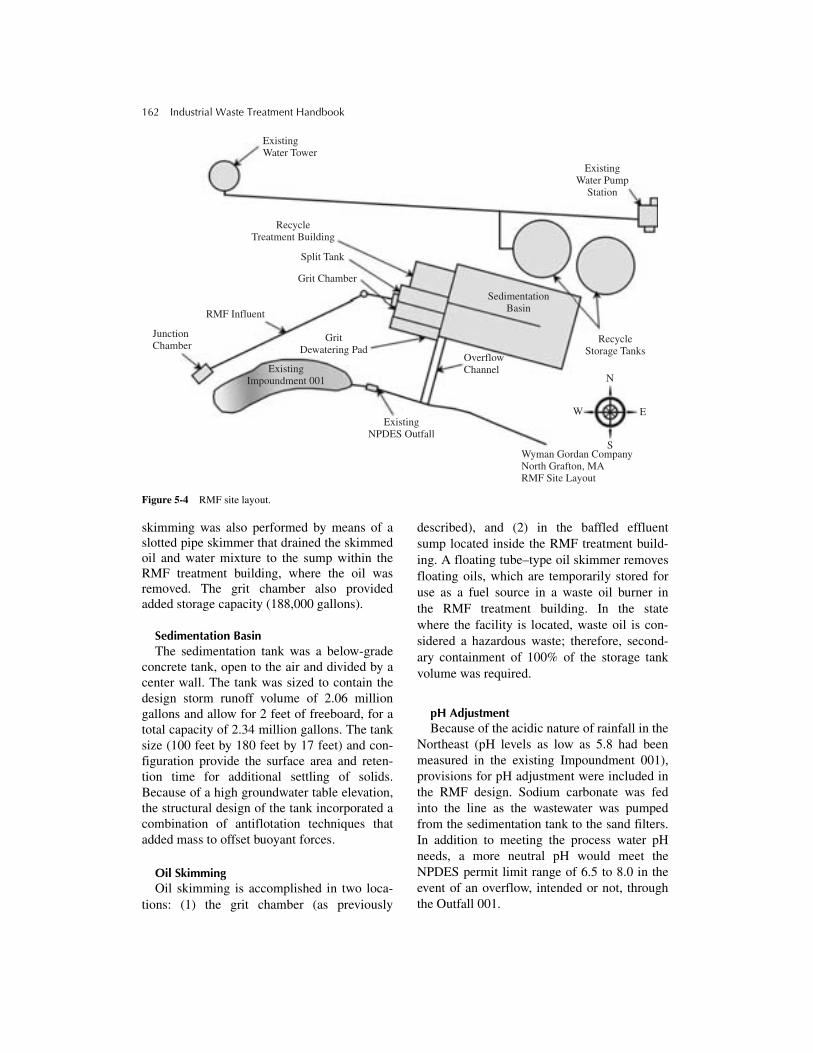
162 Industrial Waste Treatment Handbook
Figure 5-4 RMF site layout.
skimming was also performed by means of aslotted pipe skimmer that drained the skimmedoil and water mixture to the sump within theRMF treatment building, where the oil wasremoved. The grit chamber also providedadded storage capacity (188,000 gallons).
Sedimentation BasinThe sedimentation tank was a below-grade
concrete tank, open to the air and divided by acenter wall. The tank was sized to contain thedesign storm runoff volume of 2.06 milliongallons and allow for 2 feet of freeboard, for atotal capacity of 2.34 million gallons. The tanksize (100 feet by 180 feet by 17 feet) and con-figuration provide the surface area and reten-tion time for additional settling of solids.Because of a high groundwater table elevation,the structural design of the tank incorporated acombination of antiflotation techniques thatadded mass to offset buoyant forces.
Oil SkimmingOil skimming is accomplished in two loca-
tions: (1) the grit chamber (as previously
described), and (2) in the baffled effluentsump located inside the RMF treatment build-ing. A floating tube–type oil skimmer removesfloating oils, which are temporarily stored foruse as a fuel source in a waste oil burner inthe RMF treatment building. In the statewhere the facility is located, waste oil is con-sidered a hazardous waste; therefore, second-ary containment of 100% of the storage tankvolume was required.
pH AdjustmentBecause of the acidic nature of rainfall in the
Northeast (pH levels as low as 5.8 had beenmeasured in the existing Impoundment 001),provisions for pH adjustment were included inthe RMF design. Sodium carbonate was fedinto the line as the wastewater was pumpedfrom the sedimentation tank to the sand filters.In addition to meeting the process water pHneeds, a more neutral pH would meet theNPDES permit limit range of 6.5 to 8.0 in theevent of an overflow, intended or not, throughthe Outfall 001.
ExistingWater Tower
ExistingWater Pump
Station
RecycleStorage Tanks
N
S
EW
OverflowChannel
SedimentationBasin
GritDewatering Pad
ExistingImpoundment 001
ExistingNPDES Outfall
RMF Influent
Grit Chamber
Split Tank
RecycleTreatment Building
JunctionChamber
Wyman Gordan CompanyNorth Grafton, MARMF Site Layout

Industrial Stormw
ater Managem
ent163
Figure 5-5
Process flow
diagram.
GRIT CHAMBER
SPILL TANK
OIL SKIMMER
SEDIMENTATION TANK RMF EFFLUENT PUMPS
DUPLEX STRAINER
SAND FILTEREFFLUENT TANK
SPLITTER BOX
RECYCLE STORAGE PUMPS
RECYCLE STORAGE TANKS
RECYCLE DISTRIBUTION PUMPS
SAND FILTERS WATER TOWER
SODIUM CARBONATE FEED SYSTEMSKIMMED OIL
TRANSFER PUMPSKIMMED OILDECANT TANK
GRIT TANK
SPILL TANK
SED
IME
NTA
TIO
N B
ASI
N
M
M
M
M
M
MM
M M
M
M
M
M
M
M
OVERFLOW pHMONITORING PUMP
SODIUM HYPOCHLORITEFEED SYSTEM
SAND FILTER AIR COMPRESSORS
TO EXITINGHEATING OILSTORAGETANK
LOCKINGQUICKCONNECT
DECANTSUMP
BAFFLE
OVERFLOW CHANNEL
MIXER
OV
ER
FLO
WW
AT
ER
STATICMIXER
TREATMENTBUILDING
DISTRIBUTIONSYSTEM
TO SEDIMENTATIONTANK EFFLUENT UMP
pH
TO SAND FILTEREFFLUENT TANK
PLANT WATER
OUTFALL
FLOOR DRAIN
OUTFALL
TO TRENCHDRAIN
TO TRENCHDRAIN
WASTEWATER
LOCKINGQUICKCONNECT
FROMJUNCTIONCHAMBER

164 Industrial Waste Treatment Handbook
Sand FiltrationFiltration was achieved by two Parkson
upflow sand filters. This type of filter wasselected because the continuous backwash sys-tem eliminated the need for large volumes ofbackwash water (backwash flow was approxi-mately 5% to 7% of the forward flow for theupflow filter).
Recycle Water DisinfectionIt was recognized that recycle of the treated
runoff could result in increased BOD concen-trations in the recycle water and create a prob-lem with biofouling in the process waterdistribution system. A sodium hypochloritefeed system was therefore included.
Recycle Water Storage and DistributionRecycle water was stored in two A.0.
Smith glass-fused-to-steel above-ground stor-age tanks (ASTs) with aluminum domes, eachwith a capacity of 1.5 million gallons. Thistype of tank requires no sandblasting, welding,or painting and, therefore, little maintenance.Recycle water was pumped from the ASTs tothe existing process water distribution systemas needed. In the event that there is not enoughrecycle water in storage, the existing riverwater pumps receive a signal to provide supple-mental water.
Hydraulic OverflowThe RMF was designed to handle the 25-year,
24-hour design storm without a discharge toNPDES Outfall 001. In the event that a storm inexcess of the design storm, or a series of smallstorms occurring in rapid succession so as toexceed the capacity of the RMF, two optionshave been included for hydraulic relief. Minoroverflows (up to 1.4 cfs) can be routed toNPDES Outfall 010 via an existing outfall pipethat discharges directly to the river. Hydraulicoverflows in excess of 1.4 cfs spill over a knee-wall in the overflow channel and discharge atNPDES Outfall 001, in a location tributary tothe river. Flow measurement at Outfall 010 isachieved using an orifice plate located in thefloor of the overflow channel. An H-flume can
be used to handle the larger range of flows thatmay be experienced at Outfall 001.
Spill ContainmentA spill containment tank has been located at
the influent end of the sedimentation tank,adjacent to the grit chamber, to provide plantpersonnel the opportunity to divert a spill fromthe sedimentation basin. Spill-contaminatedrunoff can be contained separately rather thanallowed to further contaminate a potentiallylarge volume of runoff contained in the sedi-mentation basin.
Treatment ResidualsWastewater treatment residuals that are gen-
erated by the RMF consist of skimmed oil, grit,and sludge from the sedimentation tank.Skimmed oil is burned in the RMF waste oilburner to recover the heat value. The grit cham-ber and sedimentation tank are cleaned on anannual basis. The method of disposal of gritand sludge depends on their characteristics.
Operations Strategy In order to minimize the size of the sedimen-
tation basin, it was designed for an operatingdepth between 1.5 and 3.0 feet during dryweather conditions. The 3.0 feet level gives thetreatment system 8 hours of continuous opera-tion, thereby avoiding frequent equipmentstarts and stops. With this type of operationsstrategy, the sedimentation basin has beencapable of containing the 25-year, 24-hourdesign storm runoff volume without an over-flow; however, it was also necessary to con-sider what would happen during a storm eventin excess of the design storm. The approachwas to fully utilize both the in-ground andabove-ground storage capabilities by stoppingthe pumps that fill the ASTs if they are at theoverflow level and the sedimentation basin isnot full. At the point where the sedimentationbasin reaches its capacity, treatment willresume and overflow should occur from theASTs to Outfall 010 (depending on the over-flow rate), therefore eliminating the dischargeof untreated stormwater runoff.

Industrial Stormwater Management 165
SummaryThe design of the RMF, which was the subjectof this case history, was driven by a need tocomply

166
6 Wastes Characterization: The Wastes Characterization Study, Wastes Audit, and the Environmental Audit
Wastes Characterization Study
Wastes characterization is the term used for theprocess of determining the chemical, biologi-cal, and physical characteristics, as well as thequantity, mass flow rates, strengths (in terms ofconcentration), and discharge schedule of awastewater stream, air discharge, or solid wastestream. A wastes characterization programmust be carefully thought out and properly exe-cuted. The foundation of the study is asampling and analysis program, which must beperformed on representative samples. Theequipment used to measure rates of flow and tophysically obtain samples must be appropriateto the application and accurately calibrated.
There are three general categories of wastescharacterization study in common use: TheWastewater (or Air Discharge, or Solid WasteStream) Characterization Study, the Environ-mental Audit, and the Wastes Audit. Theappropriate choice among these three catego-ries, for a given application, depends on theprincipal purpose of the study. A Wastes Char-acterization Study (Wastewater, Air Discharge,or Solid Wastes Stream) is usually carried outto obtain design criteria for a wastes treatmentfacility, with a concurrent pollution preventionprogram. An Environmental Audit is performedto assess a plant’s state of compliance with var-ious environmental regulations. A WastesAudit is carried out to assess opportunities tominimize the amount of wastes generatedthrough improved efficiency or substitution ofnonhazardous substance(s) for one or more ofthose that are classified as hazardous. In each
case, choices are made about the location ofsampling points, equipment to be used, thesampling schedule, and the laboratory and fieldanalyses to be performed. There is always abalance to be struck between the cost of theprogram and the ultimate value of the dataobtained.
Choice of Sampling LocationBecause pollution prevention is always a pri-mary objective of any wastes managementprogram, wastes sampling programs shouldalways be designed to determine at what loca-tions in an industrial processing plantsignificant amounts of wastes are generated.Otherwise, it would be necessary to sampleonly the final composite effluent from theentire plant. The following example illustratessome of the choices to be made when designinga wastes sampling program:
Figure 6-1 is a schematic of an electroplatingshop having four different plating processes,designated Process 1, Process 2, Process 3, andProcess 4. At the present time, all four pro-cesses discharge to a common drain that leadsto the municipal sewer system. The task athand is to develop a wastes sampling and anal-ysis program to provide data for a wastesreduction program, as well as to enable calcu-lation of design criteria for one or more treat-ment devices to pretreat the wastewater beforedischarge to the municipal sewer system withincompliance with all applicable regulations. Ifthe sole objective were to treat the wastewaterto within compliance with the regulations, it

Wastes Characterization 167
Figure 6-1 Schematic of an electroplating shop having four different processes.
would make sense to locate one compositesampler at the end of the building to sample themixed effluent from all four plating processes.The questions, then, would be: “How manydays should the sampling period cover?” and“Over how long a time should each composit-ing period take place?” The answer to the firstquestion depends on the processing scheduleand whether or not different processes are runon a campaign basis in one or more of the fourprocessing units. It is more or less standardpractice to sample the wastes from a given pro-cess (or set of processes) over a three-consecutive-day period. Five would be betterthan three, but a decision has to be madebetween the greater cost for the longer sam-pling period and the greater risk associatedwith the shorter sampling period. A prudentengineer develops more conservative designcriteria if the risk of not having accurate wastecharacteristics is higher. The higher cost for themore conservatively designed treatment systemmay well be more than the higher cost for thelonger sampling period.
The second question is about the length intime of each compositing period. Four 6-hourcomposites per day produce four discrete sam-ples to be analyzed, whereas two 12-hour com-posite samples taken each day will cost onlyhalf as much to have analyzed. Using anystatistical approach available, the more discrete
samples taken during the 24-hour operatingday (that is, the shorter the compositing peri-ods), the more accurate the results of thewastes characterization study will be. Here,again, a prudent engineer recognizes that moreconservatism and, therefore, higher cost willhave to be designed into a system when thecompositing periods are long, the number ofdiscrete samples each day is low, and the riskof not having accurate, detailed characteriza-tion information is higher.
If the four plating processes are quite differ-ent from each other, then a less expensive over-all treatment system might result if one or moreare treated separately. If such is the case, itwould be appropriate to locate composite sam-plers at the discharge point of each of the fourprocesses. Now, the number of samples to beanalyzed for a given number of sampling daysand a given number of composites each day ismultiplied by four. Still, the considerations ofrisk, conservatism in design, and total costapply, and it is often cost effective to invest in amore expensive wastes characterization studyto obtain a lower total project cost.
It is seldom prudent to consider that the solereason for carrying out a wastes characteriza-tion study is to obtain data from which todevelop design criteria for a wastes treatmentsystem. Rather, pollution prevention shouldalmost always be a major objective, as it should
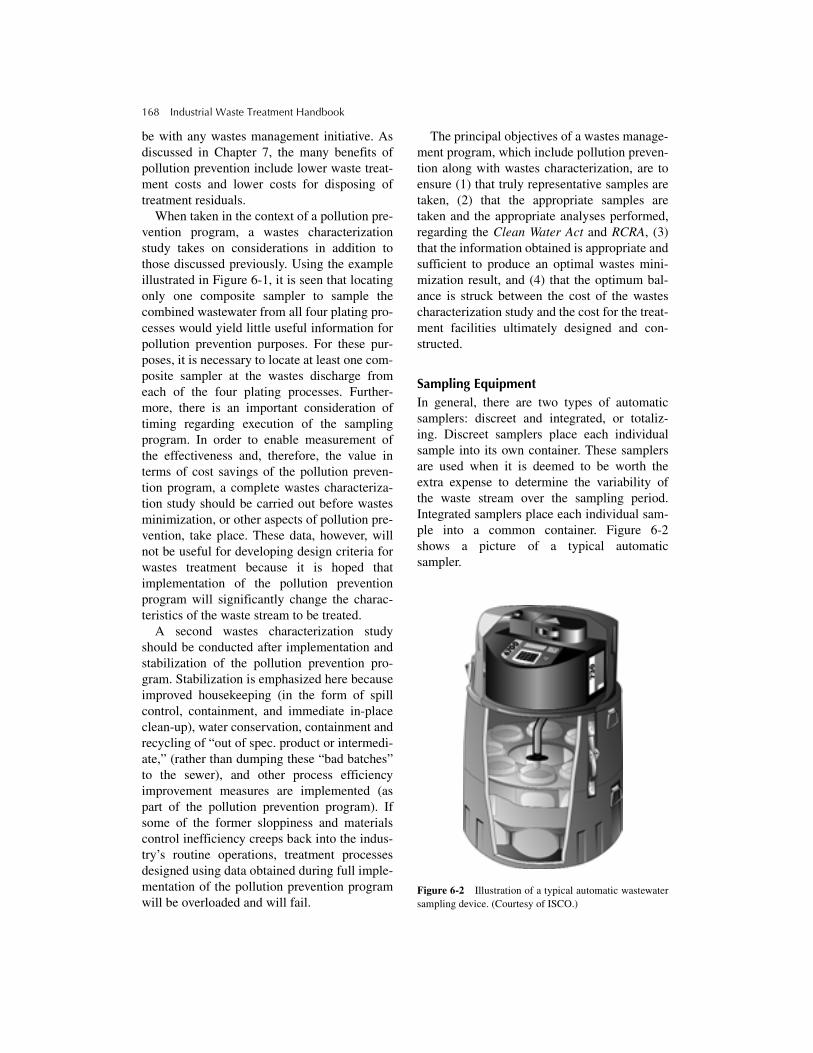
168 Industrial Waste Treatment Handbook
be with any wastes management initiative. Asdiscussed in Chapter 7, the many benefits ofpollution prevention include lower waste treat-ment costs and lower costs for disposing oftreatment residuals.
When taken in the context of a pollution pre-vention program, a wastes characterizationstudy takes on considerations in addition tothose discussed previously. Using the exampleillustrated in Figure 6-1, it is seen that locatingonly one composite sampler to sample thecombined wastewater from all four plating pro-cesses would yield little useful information forpollution prevention purposes. For these pur-poses, it is necessary to locate at least one com-posite sampler at the wastes discharge fromeach of the four plating processes. Further-more, there is an important consideration oftiming regarding execution of the samplingprogram. In order to enable measurement ofthe effectiveness and, therefore, the value interms of cost savings of the pollution preven-tion program, a complete wastes characteriza-tion study should be carried out before wastesminimization, or other aspects of pollution pre-vention, take place. These data, however, willnot be useful for developing design criteria forwastes treatment because it is hoped thatimplementation of the pollution preventionprogram will significantly change the charac-teristics of the waste stream to be treated.
A second wastes characterization studyshould be conducted after implementation andstabilization of the pollution prevention pro-gram. Stabilization is emphasized here becauseimproved housekeeping (in the form of spillcontrol, containment, and immediate in-placeclean-up), water conservation, containment andrecycling of “out of spec. product or intermedi-ate,” (rather than dumping these “bad batches”to the sewer), and other process efficiencyimprovement measures are implemented (aspart of the pollution prevention program). Ifsome of the former sloppiness and materialscontrol inefficiency creeps back into the indus-try’s routine operations, treatment processesdesigned using data obtained during full imple-mentation of the pollution prevention programwill be overloaded and will fail.
The principal objectives of a wastes manage-ment program, which include pollution preven-tion along with wastes characterization, are toensure (1) that truly representative samples aretaken, (2) that the appropriate samples aretaken and the appropriate analyses performed,regarding the Clean Water Act and RCRA, (3)that the information obtained is appropriate andsufficient to produce an optimal wastes mini-mization result, and (4) that the optimum bal-ance is struck between the cost of the wastescharacterization study and the cost for the treat-ment facilities ultimately designed and con-structed.
Sampling EquipmentIn general, there are two types of automaticsamplers: discreet and integrated, or totaliz-ing. Discreet samplers place each individualsample into its own container. These samplersare used when it is deemed to be worth theextra expense to determine the variability ofthe waste stream over the sampling period.Integrated samplers place each individual sam-ple into a common container. Figure 6-2shows a picture of a typical automaticsampler.
Figure 6-2 Illustration of a typical automatic wastewatersampling device. (Courtesy of ISCO.)

Wastes Characterization 169
Sample PreservationIt is always desirable to perform laboratoryanalyses of samples as soon as possible afterthe sample is taken; however, appropriate mea-sures must be taken to ensure that the samplewill not change with respect to the characteris-tics that are to be measured in the laboratory,no matter how soon, or late, the analyses areperformed after the samples are taken. One ofthe most common problems that results inchanges in sample characteristics is bacterialaction. If conditions within the sample allowbacterial metabolism, the sample will not berepresentative of the waste stream from whichit was taken when it arrives at the laboratory.
Two common methods of preventing or min-imizing bacterial growth are: lowering the tem-perature of the sample and reducing the pH ofthe sample.
The rate of bacterial metabolism or, indeed,the metabolism of most life forms decreases byhalf for every 10ºC decrease in temperature.Metabolism essentially stops at 0ºC. For thisreason, refrigeration, mechanically or with ice,is accepted as a good method for preservingsamples. It must be determined before sam-pling, however, whether or not refrigerationwill change the characteristics of the sample. Apossible reason for such change is decreasedsolubility of one or more substances in thesample, which might then result in precipita-tion of that substance.
A second method of preserving samples is tolower the pH to between 1 and 2. Here, again,care must be taken not to change the characterof the sample. The best way to determine theeffect of sample preservation is to perform afew laboratory analyses immediately after tak-ing a sample and comparing the results to sam-ples subjected to exactly the same preservationprotocol, including elapsed time between sam-ple taking and preservation and laboratoryanalyses, as is anticipated for the actual wastescharacterization program.
Sampling for Oil and GreaseSpecial sampling techniques must be usedwhen assaying a waste stream for certain
substances. Nonmiscible substances in waste-water such as oils, greases, and waxes areexamples. In general, these substances must besampled for by taking grab samples using adipping action that ensures taking some liquidfrom throughout the depth of wastewater flow,including the surface. The current edition of“Standard Methods,” as well as any specialinstructions issued by the EPA or anotherappropriate authority, must always be con-sulted to determine the currently acceptedtechniques.
Volatile SubstancesSubstances such as trichloroethylene (TCE)that have vapor pressures significantly higherthan water and will volatilize at ambienttemperatures are additional examples ofsubstances that require special sampling tech-niques. Again, the current edition of“Standard Methods,” in addition to any spe-cial instructions (current) issued by the EPAor another appropriate authority must be con-sulted before embarking on a samplingprogram.
Wastes Audit
A Wastes Audit has the primary purpose ofassessing opportunities to improve efficiencies,decrease wastes, or substitute nonhazardousmaterials for hazardous materials, therebyminimizing wastes generation. An accountingprocedure is to be used, along with a materialsbalance approach to account for the fates of asmany important substances as possible. Figure6-3 presents a suggested work plan for awastes audit whose focus is on hazardoussubstances.
Identify the Hazardous Substances that are PurchasedThe records of the Purchasing Agent or thePurchasing Department plus inventory recordscan be examined to determine all basic andproprietary chemicals and products that arebrought in to the plant. In some cases, some of

170 Industrial Waste Treatment Handbook
1. Identify the hazardous substances thatare purchased by the facility. Include allsubstances that are ingredients ofmixtures.
2. Identify all the hazardous substances inthe water, air, and solid wastes thatleave the facility.
3. Determine the source of each hazardoussubstance.
4. Prioritize the waste streams to bereduced.
5. Analyze the technical and economicfeasibility of reducing the toxic load ineach waste stream.
6. Evaluate the economics of pollutionprevention vs. other approaches towaste management.
Figure 6-3 Wastes audit procedure.
these records are maintained at corporate head-quarters. Materials purchased for research anddevelopment use and for laboratory use mustalso be scrutinized. It is most important,especially in the case of proprietary products,to determine each individual chemicalcomponent.
For example, at a very large aluminum dyecast plant belonging to one of the giants of theautomobile industry, there was a problem withexcessive quantities of phenolic compounds inthe effluent from the wastewater treatment facil-ity. Noncompliance problems forced employeesto perform extensive work to try to improveremoval of phenolics by the wastewater treat-ment equipment. At the same time, a thoroughsearch for the source of the phenolics was car-ried out, but to no avail. Finally, the facilitymanagement decided to purchase and install alarge activated carbon system to use as tertiarytreatment to remove the phenolic substances. Itwas also determined that the activated carbonsystem would have to be preceded by a largesand filter system. While the preliminary engi-neering for the new tertiary system was inprogress, the search for the source of the phe-nolic substances was greatly intensified. It was
finally determined that a detergent that wasused every night by an outside contractorcleaning service was the source. The contractorchanged to a different detergent, and the entireproblem disappeared. Fortunately, the sand fil-ter–activated carbon tertiary treatment systemhad not yet reached the construction stage.
Identify all Hazardous Substances that Leave the FacilityAll discharges of wastewater, solid wastes, andair must be thoroughly characterized to deter-mine each hazardous substance that leaves thefacility and in what form. Some of the hazard-ous materials are a portion of those that werepurchased but were not consumed in process orwere not completely accounted for in processconsumption, plus that which became includedin one or more of the products from the facility.Chlorine, for instance, is used in the manufac-ture of paper from wood pulp. One of the usesof chlorine is to solubilize lignin fragments thatcause the pulp and, consequently, the paper tobe brown.
Another function that chlorine performs is toadd across the double bonds in the organicstructure of the lignin molecule, which changesthe molecule (or molecular fragment) frombeing brown to being colorless. In summary,chlorine is used to “bleach” wood pulp in orderto make white paper by allowing the removalof a portion of the lignin (that which becomessolubilized, then rinsed away with water andcaustic). Another portion simply becomes col-orless and stays with the pulp, and ultimatelywith the paper. The rinsewater is then wastewa-ter that must be treated and discharged. Thechlorine that enters into the process of addingacross double bonds goes out of the plant withthe paper (product).
For each pound of chlorine purchased, a por-tion leaves the plant as a component of thewastewater, and a portion leaves the plant as acomponent of the salable product of the plant.Closer scrutiny reveals that yet another portionleaves the plant as a component of the airborneemissions, some with the fugitive emissionsand some with the bleach plant vent and

Wastes Characterization 171
scrubber emissions, because chlorine is a gas atambient temperatures, and it volatilizes atevery opportunity. A very thorough anddetailed study is required to determine the fateof chlorine that is purchased by an integratedpulp and paper mill.
Determine the Source of Each Hazardous SubstanceOnce each solid, liquid, and airborne wastestream leaving the facility has been thoroughlycharacterized, and all hazardous substances areidentified and/or accounted for, the next step isto determine the source of each one. This canbe done by use of an accounting procedure,together with principles of chemistry andknowledge of the individual industrial pro-cesses. The accounting procedure is used as aformat to ensure that all chemical reactants andproducts are accounted for.
For some large industrial facilities, such adetailed accounting is a very significant under-taking. In the long term, however, the entireprocess is almost guaranteed to produce afinancial gain, rather than a long-term loss, forthe industrial facility. The example of the floor-washing detergent given previously is a graphicexample of the benefit of being tenaciousin determining the source of each hazardoussubstance.
Prioritize the Waste Streams to be ReducedThe objective of this step is to identify, in orderof degree of adverse effect on the environment,which waste streams should be addressed first,to achieve maximum benefit to the environ-ment. Although, in some cases, suchprioritization is obvious, in other cases, itrequires an in-depth study of the affected envi-ronment to determine proper prioritization. Forinstance, if chlorinated (halogenated) organicsare being discharged to an extremely largeriver, and at the same time, a much smallerquantity per day of chlorine gas is being dis-charged to the atmosphere, but the plant is in anonattainment area for ozone (another strongoxidizing substance), the waste stream that
should receive the higher priority is not obvi-ous. On the other hand, if the facility has asolid waste stream that is very concentrated ina chlorinated solvent that could be reduced dra-matically by installation of a new, highlyefficient vapor degreaser plus a new still forrecovery and reuse of the solvent, the choice oftop priority for action is more easily identified.
Analyze the Technical and Economic Feasibility of Reducing Toxic LoadsTo continue with the example of the paper mill,an alternative process for bleaching wood pulpto obtain white paper is to use oxygen as thebleaching agent to remove about 50% of thelignin, rather than chlorine. However, to makethe change, new equipment would have to bepurchased and installed at significant capitalexpense, and the value of the paper (product)may well be less because of a lesser degree ofwhiteness, although not necessarily so. In orderto make an informed decision, then, a detailedanalysis of both technical feasibility and eco-nomic feasibility must be carried out.
Regarding technical feasibility, there aremany questions, including:
• Can the oxygen process, known as “oxygendelignification,” produce pulp that can ulti-mately be “bleached” to the desired degreeof whiteness?
• Will other properties of the paper, such asstrength, be negatively impacted to an unac-ceptable degree?
• Is the necessary equipment available?
• Can the existing water pollution, air emis-sion, and solid waste control facilitiesfunction properly if the change is made?Will they perform better? Will any compo-nents be redundant?
• Will other facilities and/or equipment in theplant have to be changed?
Regarding financial feasibility, the ques-tions include:
• Can the facility actually obtain sufficientcapital to make the change?

172 Industrial Waste Treatment Handbook
• Can the facility survive the period betweenthe time of initial investment and the timewhen overall net savings become a reality?
• Does the change conform to the facility’slong term plan?
Evaluate the Economics of Pollution Prevention
It is one thing to ascertain the financial feasibil-ity of a project; it is quite another thing todetermine the short-term and long-term effectson the overall profit and loss position of thecompany. Evaluation of economics of pollutionprevention versus other approaches to wastemanagement means evaluating the financialeffects on all phases of the product, from initialproduction, throughout the useful life, to finaldisposal. This evaluation is a very extensiveundertaking, and interim findings must be con-tinuously updated as new information becomesavailable.
Continuing with the pulp mill example, thedecision to be made is whether to continue withthe (ever-increasing) expense of managing thewastes from the bleaching process using com-pounds of chlorine, such as chlorine dioxide, orto invest a large capital expenditure in a non-chlorine alternative, such as ozone system,thereby reducing wastes management costs. Inthis case, the costs of management throughoutthe useful life and the costs for final disposalwill not be affected because the product is, forpractical purposes, identical whether chlorinebleaching is used as opposed to “oxygen delig-nification.” However, there are large differ-ences in the following:
• Costs for the “bleaching agent” itself (chlo-rine compounds versus oxygen compounds)
• Costs for processing equipment
• Costs for air pollution control
• Costs for wastewater treatment
• Costs for management of the solid wastes.(Certain chlorine wastes must be managedas “hazardous waste.”)
• Costs for obtaining discharge permits
• Costs for monitoring air discharges, waste-water discharges, and solid wastes disposalfacilities
There are many more categories of costs thatare affected by a major change in industrialprocess, especially one that changes from aprocess that generates hazardous wastes to aprocess that does not. In the final analysis, thedecision to change or not change a processshould be based on the size of the long-termnet financial gain or loss.
A properly executed Wastes Audit, shouldresult in an overall savings in the cost of oper-ation of an industrial facility, especiallyregarding the impact of the cost of wastes han-dling and disposal on the annual cost of plantoperations.
Environmental Audit
An Environmental Audit is normally con-ducted to assess the state of compliance ofan industrial facility with laws and regula-tions. As such, there is no need to sampleand analyze waste streams at locations otherthan final discharge points, unless it isdesired to determine which individual pro-cesses are responsible for noncompliance, ifany exist. What is important, however, isensuring that the sampling and analysis workis appropriate to the law or regulation underconsideration.
The two federal laws that wastes (solid andliquid) discharged from industrial facilitiesmust comply with are the Clean Water Act(CWA) and the Resource Conservation andRecovery Act (RCRA). These two laws not onlyplace restrictions on different substances, butthey also require different protocols for sam-pling and analysis work in the case of some ofthe substances.
Table 6-1 presents lists of substances forwhich the CWA and the RCRA, respectively,specify restrictions. Notice, for instance, thatthe CWA (through NPDES permits) restrictsthe discharge of 24 metals, whereas the RCRArestricts 8 metals.

Wastes Characterization 173
Table 6-1 Requirements for Chemical, Physical, and Bacterial Analysis
PARAMETERS CWA NPDES List
(1)
RCRAHazardous Waste
(2)
SDWASDWA List
(3)
VOLATILE ORGANICS
Acrolein X
Acrylonitrile X
Benzene X P-R
Bromobenzene U
Bromochloromethane U
Bromodichloromethane X U
Bromoform X U
Bromomethane X U
n-Butylbenzene X U
sec-Butylbenzene X U
tert-Butylbenzene X U
Carbon tetrachloride X P-R
Chlorobenzene X U
Chloroethane X U
2-Chloroethylvinyl ether X
Chloroform X U
Chloromethane X U
2-Chlorotoluene U
4-Chlorotoluene U
Dibromochloromethane X P-R
1,2-Dibromoethane X U
Dibromomethane X U
Dichlorodifluoromethane X U
1,1-Dichloroethane X U
1,2-Dichloroethane X P-R
1,1-Dichloroethene X U
cis-1,2-Dichlorethene X U
trans-1,2-Dichloroethene X U
Dichloromethane X P-R
1,2-Dichloropropane X U
1,3-Dichloropropane X U
2,2-Dichloropropane X U
1,1-Dichloropropene X U
cis-1,3-Dichloropropene X U
trans-1,3-Dichloropropene X U
Ethylbenzene X U
Isopropylbenzene X U
4-Isopropyltoluene X U
Methylene chloride X U
n-Propylbenzene X U

174 Industrial Waste Treatment Handbook
Table 6-1 Requirements for Chemical, Physical, and Bacterial Analysis (continued)
PARAMETERS CWA NPDES List
(1)
RCRAHazardous Waste
(2)
SDWASDWA List
(3)
Styrene X U
1,1,1,2-Tetrachloroethane X U
1,1,2,2-Tetrachloroethane X U
Tetrachloroethene X U
Toluene X U
1,2,3-Trichlorobenzene X U
1,1,1-Trichloroethane X P-R
1,1,2-Trichloroethane X U
Trichloroethene X P-R
Trichloroflouromethane X U
1,2,4-Trimethylbenzene X U
1,3,5-Trimethlybenzene X U
Vinyl chloride X P-R
m-Xylene X U
o-Xylene X U
p-Xylene X U
SEMIVOLATILE ORGANICS
Acenaphthene X
Acenaphthylene X
Anthracene benzidine X
Benzo(a)anthracene X
Benzo(a)pyrene X
Benzo(b)flouranthene X
Benzo(g,h,i)perylene X
Benzo(k)flouranthene X
bis(2-Chloroethoxy)methane X
bis(2-Chloroethyl)ether X
bis(2-Ethylhexyl)phthalate X
4-Bromophenyl-phenylether X
Butylbenzylphthalate X
Carbofuran X P-R
4-Chloro-3-methlyphenol X
2-Chloronaphthalene X
2-Chlorophenol X
4-Chlorophenyl-phenylether X
Chrysene X
Di-n-butylphthalate X
Di-n-octylphthalate X
Dibenz(a,h)anthracene X
1,2-Dibromo-3-chloropropane U

Wastes Characterization 175
Table 6-1 Requirements for Chemical, Physical, and Bacterial Analysis (continued)
PARAMETERS CWA NPDES List
(1)
RCRAHazardous Waste
(2)
SDWASDWA List
(3)
1,2-Dichlorobenzene X U
1,3-Dichlorobenzene X U
1,4-Dichlorobenzene X P-R
3,3'-Dichlorobenzidine X
2,4-Dichlorophenol X
Di(2-ethylhexyl)adipate P-R
Diethylphthalate X
2,4-Dimethylphenol X
Dimethylphthalate X
4,6-Dinitro-2-methiphenol X
2,4-Dinitrophenol X
2,4-Dinitrotoluene X
2,6-Dinitrotoluene X
Fluoranthene X
Fluorene X
Hexachlorobenzene X
Hexachlorobutadiene X U
Hexachlorocyclopentadiene X
Hexachloroethane X
Indeno(1,2,3-cd)pyrene X
Isophorone X
Naphthalene X U
Nitrobenzene X
2-Nitrophenol X
4-Nitrophenol X
N-Nitroso-di-n-propylamine X
N-Nitrosodimethylamine X
N-Nitrosodiphenylamine X
2,2'-oxybis(I -Chloropropane)** X
Pentachlorophenol X
Phenanthrene X
Phenol X
Pyrene X
Simazine P-R
1,2,4-Trichlorobenzene X U
2,4,6-Trichlorophenol X
1,2,3-Trichloropropane U
PESTICIDES/PCBS
Arochlor-1016 (PCB-1016) X
Arochlor-1221 (PCB-1221) X

176 Industrial Waste Treatment Handbook
Table 6-1 Requirements for Chemical, Physical, and Bacterial Analysis (continued)
PARAMETERS CWA NPDES List
(1)
RCRAHazardous Waste
(2)
SDWASDWA List
(3)
Arochlor-1232 (PCB-1232) X
Arochlor-1242 (PCB-1242) X
Arochlor-1248 (PCB-1248) X
Arochlor-1254 (PCB-1254) X
Arochlor-1260 (PCB-1260) X
Polychlorinated biphenyls (as Arochlors) (as decachlorobiphenyl) P-R
Aldrin X U
alpha-BHC X
beta-BHC X
delta-BHC X
gamma-BHC (Lindane) X X P-R
Chlordane X
4,4'-DDD X
4,4'-DDE X
4,4'-DDT X
Dieldrin X
Endosulfan I X
Endosulfan II X
Endosulfan sulfate X
Endothall P-R
Endrin X X P-R
Endrin aldehyde X
Endrin ketone
Heptachlor X P-R
Heptachlor epoxide X P-R
Methoxychlor P-R
Toxaphene X P-R
HERBICIDES
2,4-D X P-R
Dalapon P-R
Diquat (as Diquat dibromide monohydrate) P-R
2,4,5-TP (Silvex) P-R
METALS
Aluminum, total X S-R
Antimony, total X P-R
Arsenic, total* X X P-R
Barium, total* X X P-R
Beryllium, total X
Boron, total X

Wastes Characterization 177
Table 6-1 Requirements for Chemical, Physical, and Bacterial Analysis (continued)
PARAMETERS CWA NPDES List
(1)
RCRAHazardous Waste
(2)
SDWASDWA List
(3)
Cadmium, total* X X P-R
Calcium X P-R
Chromium, total* X X P-R
Cobalt, total X
Copper, total X P-R
Iron, total X S-R
Lead, total* X X P-R
Magnesium, total X R
Manganese, total X S-R
Mercury, total* X X P-R
Molybdenum, total X
Nickel, total X U
Selenium, total* X X P-R
Silver, total* X X S-R
Sodium, total P-R
Thallium, total X P-R
Tin, total X
Titanium, total X
Zinc, total X S
GENERAL CHEMISTRY
Ammonia (as N) X
Asbestos X P-R
Biochemical oxygen demand (BOD) X
Bromide X
Chemical oxygen demand (COD) X R
Chloride X S-R
Chlorine, total residual X
Coliform, fecal X P-R***
Coliform, total X P-R
Color X S-R
Corrosivity X S-R
Cyanide X P-R
Flow X
Flouride, soluble X P-R
Ignitability X X
Langelier saturation index X P-R
Nitrate X P-R
Nitrite X P-R
Nitrogen, total organic X
Odor X S-R

178 Industrial Waste Treatment Handbook
* RCRA regulates based on toxic characteristic leaching procedure (TCLP).
** CAS # 108-60-1 is sometimes incorrectly identified as bis (2-chloroisopropyl) ether.
*** Only required if total Coliform analysis is positive.
P = Primary drinking water analyte.
R = Regulated parameter.
S = Secondary drinking water analyte.
U = Unregulated parameter.
X = Parameter regulated by this list.
(1) This table is a convenient reference only; for details see the specific rule/regulation: 40 CFR Part 504, Vol.53, No. 235. Wednesday, December 7, 1988.NPDES = National Pollutant Discharge Elimination System.
(2) Current reference list: 40 CFR Part 261, July 1, 1988. The regulations also include “Acute Hazardous and“Toxic Waste Parameters,” which are not included in this list.
(3) Current reference list: 52 FR 25946, July 9, 1987. RCRA = Resource Conservation and Recovery Act.
(4) Information provided by Katahdin Analytical Services, Westbrook, Maine, (800) 683-3994.
Table 6-1 Requirements for Chemical, Physical, and Bacterial Analysis (continued)
PARAMETERS CWA NPDES List
(1)
RCRAHazardous Waste
(2)
SDWASDWA List
(3)
Oil and Grease X
pH X P-R
Phenols X
Phosphate, ortho X P-R
Phosphorus, total (as P) X
Radioactivity, total alpha X P-R
Radioactivity, total beta X P-R
Radium 226, total X P-R
Radium 228 X P-R
Radium, total X
Radon, 222 X P-R
Reactivity X X
Silica X P-R
Sulfate (as S04) X P-R
Sulfide (as S) X
Sulfite (as S03) X
Surfactants X R (California only)
Temperature X P-R
Total dissolved solids (TDS) X S-R
Total organic carbon (TOC) X
Total suspended solids (TSS) X
Turbidity X P-R
OTHER
2,3,7,8-Tetrachloro-dibenzo-p-dioxin X

Wastes Characterization 179
The Safe Drinking Water Act (SDWA) con-tains a list of restricted substances that is differ-ent in some respects from either CWA orRCRA and requires different protocols to ana-lyze for some substances. It is very importantwhen engaging the services of an analyticallaboratory to inform the analysts of the appro-priate law (i.e., CWA, RCRA, or SDWA) towhich the analyses should conform.
RCRA requires waste generators to deter-mine whether each segregable waste stream is a“hazardous waste.” The determination can bemade by sampling and specified analyses orbased on the generator’s knowledge of the pro-cess generating the waste and the chemistry ofthe waste. For purposes of determining whethera waste stream is “hazardous waste,” the deter-mination must be made at the point of genera-tion as opposed to after it has been commingledwith other (separate) waste streams. In somecases, it is necessary to store certain wastestreams and manage them separately, ratherthan discharge them to an industrial wastetreatment facility or to a POTW.
Characteristics of Industrial WastesIndustrial wastes are classified as wastewater,air discharges, or solid wastes. There is someoverlap of physical characteristics of the sub-stances contained in each of these threeclassifications of wastes because wastewatercan contain dissolved gases and suspended andsettleable solids; air discharges can containvaporized liquids, liquids in the aerosol state,and solid particles known as particulate emis-sions; and solid waste streams can includecontainers of compressed gases, and/or liq-uids. The basis of the classification is theenvironmental medium to which the waste isdischarged, and the characterization of thewaste is normally based on the body of lawsand regulations that govern that medium.
Characteristics of Industrial Wastewater
Priority PollutantsWhereas the term “hazardous waste” is nor-mally associated with solid waste and is
regulated under 40 C.F.R. Subpart C, the term“priority pollutant” is used in association withwastewater constituents that are of a hazardousnature. At the writing of this text, there were126 substances, in the five categories of (1)Metals, (2) Pesticides/PCBs, (3) SemivolatileOrganics, (4) Volatile Organics, and (5) Gen-eral Chemistry, designated by the EPA aspriority pollutants, as shown in Table 6-2.
As explained previously, atomic adsorptionanalysis is the standard method used to deter-mine concentrations of metals. A techniquethat combines gas chromatography with themass spectrometer, referred to as “GC-massspec,” is used to analyze for the organics listedin Table 6-3. In this technique, the gas chro-matograph is used to separate the organicsfrom each other, and the mass spec is used todetermine the concentration of each specificorganic compound.
The characteristics of industrial wastewa-ters are determined in accordance with severalsets of laws and regulations that govern thequality of water bodies, both surface water andground-water. These laws and regulationsinclude the Clean Water Act (CWA), theResource Conservation and Recovery Act(RCRA), and the Safe Drinking Water Act(SDWA), as explained previously. Each ofthese laws defines several physical, chemical,and biological characteristics and specifies aprotocol to be used in determining each of thecharacteristics. The following are generaldescriptions of many of the characteristics reg-ulated by one or more of the CWA, the RCRA,or the SDWA.
BODThe standard 5-day BOD test is the mostcommonly used method to estimate the totalquantity of biodegradable organic material inwastewater. The results of the 5-day BOD test(abbreviated BOD5) are considered to be esti-mates of the amount of oxygen that would beconsumed by microorganisms in the process ofusing the organic materials contained in awastewater for food for growth and energy.Some of the organic material will thus be

180 Industrial Waste Treatment Handbook
converted to additional microorganisms. Somewill be converted to carbon dioxide and someto water. Oxygen is needed for all three pur-poses, as seen in Equation 6-1.
Organic matter + microorganisms + O2 →more microorganisms + CO2 + H2O
(growth) (waste products)
(6-1)
Table 6-2 Priority Pollutants
PARAMETER USEPA Method #
Typical LaboratoryPQL
VOLATILES Ug/L
Acrolein 624 5
Acrylonitrile 624 50
Benzene 624 5
Carbon tetrachloride (tetrachloromethane) 624 5
Chlorobenzene 624 5
1,2-Dichloroethane 624 5
1,1,1-Trichloreothane 624 5
1,1-Dichloroethane 624 5
1,1,2-Trichloroethane 624 5
1,1,2,2-Tetrachloroethane 624 5
Chloroethane 624 10
2-Chloroethyl vinyl ether (mixed) 624 10
Chloroform (trichloromethane) 624 5
Chloromethene 624 5
1,1-Dichloroethylene (dichloroethene) 624 5
1,2-trans-Dichloroethene 624 5
1,2-Dichloropropane 624 5
cis-1,3-Dichloropropene 624 5
trans-1,3-Dichloropropene 624 5
Ethylbenzene 624 5
Methylene chloride (dichloromethane) 624 10
Methyl chloride (dichloromethane) 624 5
Methyl bromide (bromomethane) 624 10
Bromoform (tribromomethane) 624 5
Chlorodibromomethane (dibromochloromethane) 624 5
Dichlorobromomethane (bromodichloromethane) 624 5
Tetrachloroethene 624 5
Toluene 624 5
Trichloroethene 624 5
Vinyl chloride (chloroethene) 624 10
SEMIVOLATILES Ug/L
Acenaphthene 625 5
Benzidine 625 25

Wastes Characterization 181
Table 6-2 Priority Pollutants (continued)
PARAMETER USEPA Method #
Typical LaboratoryPQL
1,2,4-Trichlorobenzene 625 5
Hexachlorobenzene 625 5
Hexachloroethane 625 5
bis(2-Chloroethyl) ether 625 6
2-Chloronaphthalene 625 5
2,4,6-Trichlorophenol 625 5
2-Chlorophenol 625 5
1,2-Dichlorobenzene 625 5
1,3-Dichlorobenzene 625 5
1,4-Dichlorobenzene 625 5
3,3-Dichlorobenzidine 625 10
2,4-Dichlorophenol 625 5
2,4-Dimethylphenol 625 5
2,4-Dinitrotoluene 625 5
2,6-Dinitrotoluene 625 5
Fluoranthene 625 5
4-Chlorophenyl phenyl ether 625 5
4-Bromophenyl phenyl ether 625 5
bis(2-Chloroisopropyl) ether 625 5
bis(2-Chloroethoxy) methane 625 5
Hexachlorobutadiene 625 5
Hexachlorocyclopentadiene 625 5
Isophorone 625 5
Naphthalene 625 5
Nitrobenzene 625 5
2-Nitrophenol 625 5
4-Nitrophenol 625 5
2,4-Dinitrophenol 625 25
4,6-Dinitro-o-cresol (4,6-dinitro-2-methylphenol) 625 25
n-Nitrosodimethylamine 625 5
n-Nitrosodiphenylamine 625 5
n-Nitrosodi-n-propylamine 625 5
Pentachlorophenol 625 5
Phenol 625 5
bis(2-Ethylhexyl) phthalate 625 5
Butyl benzyl phthalate 625 5
Di-n-butyl phthalate 625 5
Di-n-octyl phthalate 625 5
Diethyl phthalate 625 5
Dimethyl phthalate 625 5
1,2-Benzanthracene (benzo(a) anthracene) 625 5
Benzo(a)pyrene (3,4-benzo-pyrene) 625 5

182 Industrial Waste Treatment Handbook
Table 6-2 Priority Pollutants (continued)
PARAMETER USEPA Method #
Typical LaboratoryPQL
3,4-Benzofluoranthene (benzo(b) fluoranthene) 625 5
11,12-Benzofluoranthene (benzo(k) fluoranthene) 625 5
Chrysene 625 5
Acenaphthylene 625 5
Anthracene 625 5
1,1,2-Benzoperylene (benzo(ghi) perylene) 625 5
Fluorene 625 5
Phenanthrene 625 5
1,2,5,6-Dibenzanthracene (dibenzo(a,h) anthracene) 625 5
Indeno(1,2,3-cd) pyrene (2,3-o-pheynylene pyrene) 625 5
Pyrene 625 5
PESTICIDES/PCBs Ug/L
Aldrin 608 0.05
Dieldrin 608 0.1
Chlordane (technical mixture and metabolites) 608 0.05
4,4’-DDT 608 0.1
4,4’-DDE (p,p-DDX) 608 0.1
4,4’-DDD (p,p-TDE) 608 0.1
Alpha-endosulfan (Endosulfan I) 608 0.05
Beta-endosulfan (Endosulfan II) 608 0.05
Endosulfan sulfate 608 0.1
Endrin 608 0.1
Endrin aldehyde 608 0.1
Heptachlor 608 0.05
Heptachlor epoxide (BHC-hexachlorocyclohexane) 608 0.05
Alpha-BHC 608 0.05
Beta-BHC 608 0.05
Gamma-BHC (lindane) 608 0.05
Delta-BHC (PCB-polychlorinated biphenyls) 608 0.05
PCB-1016 (arochlor 1016) 608 0.5
PCB-1221 (arochlor 1221) 608 1.0
PCB-1232 (arochlor 1232) 608 0.5
PCB-1242 (arochlor 1242) 608 0.5
PCB-1248 (arochlor 1248) 608 0.5
PCB-1254 (arochlor 1254) 608 0.5
PCB-1260 (arochlor 1260) 608 0.5
Toxaphene 608 1.0
METALS Mg/L
Antimony 200.7 0.008
Arsenic 200.7 0.005

Wastes Characterization 183
Notes:40 CFR Part 423-126 Priority Pollutants, Appendix A.PQL = Practical Quantitation LimitLaboratory limits are from a commercial laboratory, Katahdin Analytical Services, Inc., Westbrook, Maine.Laboratory limits are 3- to -5 times higher than actual detection limits.
COD
Chemical oxygen demand (COD) is a secondmethod of estimating how much oxygen wouldbe depleted from a body of receiving water as aresult of bacterial action. Whereas the BODtest is performed by using a population of bac-teria and other microorganisms to attempt toduplicate what would happen in a naturalstream over a period of 5 days, the COD testuses a strong chemical oxidizing agent, potas-sium dichromate or potassium permanganate,to chemically oxidize the organic material inthe sample of wastewater under conditions ofheat and strong acid. The COD test has theadvantage of not being subject to interferencefrom toxic materials as well as requiring only 2or 3 hours for test completion, as opposed to 5days for the BOD test. It has the disadvantageof being completely artificial, but is neverthe-less considered to yield a result that may beused as the basis on which to calculate a rea-sonably accurate and reproducible estimate of
the oxygen-demanding properties of a waste-water. The COD test is often used inconjunction with the BOD test to estimate theamount of nonbiodegradable organic materialin a wastewater. In the case of biodegradableorganics, the COD is normally in the range of1.3–1.5 times the BOD. When the result of aCOD test is more than twice that of the BODtest, there is good reason to suspect that a sig-nificant portion of the organic material in thesample is not biodegradable by ordinary micro-organisms. [It is noted here that the sample vialresulting from a COD test can contain leach-able mercury above regulatory limits. If such isthe case, the sample must be managed as atoxic hazardous waste.]
Ultimate BODThe term “ultimate BOD,” designated byBODu, refers to the quantity of oxygen thatwould be used by microorganisms in convert-ing the entire amount of organic material in a
Table 6-2 Priority Pollutants (continued)
PARAMETER USEPA Method #
Typical LaboratoryPQL
Beryllium 200.7 0.005
Cadmium 200.7 0.010
Chromium 200.7 0.015
Copper 200.7 0.025
Lead 200.7 0.005
Mercury 245.1 0.2 ug/L
Nickel 200.7 0.040
Selenium 200.7 0.010
Silver 200.7 0.015
Thallium 200.7 0.015
Zinc 200.7 0.025
OTHER
2,3,7,8-tetrachloro-dibenzo-p-dioxin (TCDD) 613 10 ppt
Cyanide, total 335.4 0.2mg/L
Asbestos 100.2 7MF/L >10um

184 Industrial Waste Treatment Handbook
given volume of wastewater to carbon dioxideand water, given unlimited time, as opposed toa time limit of 5 days. The BODu of a knownsubstance can be estimated as shown in the fol-lowing example.
Example 6-1:
Estimate the BODu of a waste stream contain-ing 100 mg/L of pure ethanol.
Solution:
The first step is to write out and balance anequation depicting the complete oxidation,
with oxygen, of a molecule of the appropriatesubstance, ethanol in this case:
(6-2)
Next, using the mole ratio of oxygen to etha-nol as calculated by balancing the equation, aswell as the respective molecular weights ofeach substance, multiply the concentration, inmg/L, of ethanol in the wastewater by this moleratio, and by the molecular weight of oxygendivided by the molecular weight of ethanol, toobtain the BODu of that wastewater:
Table 6-3 Heavy Metals Regulated by the Clean Water Act (CWA)
Current reference list: 40CFR Part 136, Inorganic Test Procedures.PQL = Practical Quantitation Limit.PQLs are from Katahdin Analytical Services, Inc., Westbrook, Maine.Other Approved USEPA Methods are available; please refer to the regulation for optional methods.
C2H5OH 2O2+ 2CO2 3H2O+→
PARAMETERUSEPA Method
No. (4)Priority Pollutants
List (1)Typical Laboratory
PQL (2)
METALS MG/L
Aluminum, total 200.7 0.10
Antimony, total 200.7 X 0.008
Arsenic, total 200.7 X 0.005
Barium, total 200.7 0.005
Beryllium, total 200.7 X 0.005
Boron, total 200.7 0.10
Cadmium, total 200.7 X 0.010
Chromium, total 200.7 X 0.015
Cobalt, total 200.7 0.030
Copper, total 200.7 X 0.025
Iron, total 200.7 0.025
Lead, total 200.7 X 0.005
Magnesium, total 200.7 0.050
Manganese, total 200.7 0.015
Mercury, total 245.1 X 0.20 ug/L
Molybdenum, total 200.7 0.10
Nickel, total 200.7 X 0.040
Sodium, total 200.7 0.010
Selenium, total 200.7 X 0.005
Silver, total 200.7 X 0.015
Thallium, total 200.7 X 0.005
Tin, total 200.7 0.10
Titanium, total 200.7 0.015
Vanadium, total 200.7 0.025
Zinc, total 200.7 X 0.025
Wastes Characterization 185
Mole ratio, oxygen / ethanol = 2/1 = 2.0
mol. wt. of ethanol = 38
mol. wt. of oxygen = 16
Therefore, ratio of molecular weights,oxygen/ethanol = 0.42and the BODu of the solution ofethanol is calculated by:
(6-3)
pH, Acidity, and AlkalinityThe term pH refers to the concentration ofhydrogen ions in an aqueous solution, where“aqueous solution” means either pure water orwater with small (in terms of molar amounts)quantities of substances dissolved in it. Strongsolutions of chemicals such as one molar sulfu-ric acid or a saturated solution of sodiumchloride do not qualify as aqueous solutions. Inthose solutions the normal pH range of 0 to 14,which equals the negative logarithm of thehydrogen ion concentration in moles per liter,has no meaning. Because the pH of an aqueoussolution is numerically equal to the negativelog of the hydrogen ion concentration (in molesper liter) and can be readily calculated usingthe following equation,
1pH = log ____ (6-4)
[H+]
it is therefore indicative of the acidic or basiccondition of a wastewater (pH values between0 and 7.0 indicate acidic conditions, and pHvalues between 7.0 and 14 indicate alkalineconditions). However, pH is not equivalent toacidity or alkalinity. A wastewater may have apH of 2.0 but have lower acidity than anotherwastewater having a pH of 4.0. Likewise, awastewater having a pH of 9.0 may, or may not,have more alkalinity than a wastewater havinga pH of 10.6.
Alkalinity and acidity are defined as the abil-ity of an aqueous solution to resist a change inpH. Alkalinity and acidity are measured bydetermining the quantity of a solution of acid
or base, as appropriate, of known concentra-tion, that is required to completely neutralizeits alkalinity or acidity.
Aqueous solutions (wastewaters, for exam-ple) that are high in either acidity or alkalinityare said to be highly buffered and will notreadily change in pH value as a result ofinfluences such as bacterial action or chemicalreaction. Depending on the anion speciesinvolved in the alkalinity or acidity, an aqueoussolution can be buffered in low pH ranges, highpH ranges, or neutral (near pH 7) pH ranges.
D.O.Dissolved Oxygen (D.O.) concentration is usu-ally determined by either a wet chemistrymethod known as “the azide modification ofthe Winkler method,” or by use of a probe andmeter. The wet chemistry method is consideredto be the standard for comparison, when thecolor and other properties of the aqueous solu-tion (industrial waste, etc.) do not preclude itsuse; however, the probe and meter method isthe most commonly used.
The standard D.O. probe consists of twosolid electrodes emersed in an electrolyte andseparated from the solution being tested by aplastic membrane that is permeable to oxygen.The oxygen can be in the dissolved state or thegaseous state. When the probe is emersed inthe test solution, oxygen passes from the solu-tion, through the membrane, and into the elec-trolyte in direct proportion to its concentrationin the solution. As the oxygen enters the elec-trolyte, it changes the conductivity. Thischange is detected by the two electrodes, andthe change is registered on the meter.
Oxygen is only sparingly soluble in water,and its solubility decreases with increasingtemperature. Increasing dissolved solids con-centrations also decrease the solubility of oxy-gen. The saturation concentration of oxygen indeionized water at 1ºC and standard air pres-sure is 14.2 parts per million (ppm), equivalentto about 200 feet of the distance between NewYork City and Los Angeles. This compares tothe concentration of oxygen in air, which isabout 230,000 ppm. Still, the species that live
100 mg L 2 mole O2 mole ethanol×⁄
0.42 84 mg L⁄=×

186 Industrial Waste Treatment Handbook
in water are sensitive to relatively smallchanges in the already extremely low quantityof oxygen available to them. Trout, forinstance, do very well when the D.O. concen-tration is 7 ppm but die when the D.O. concen-tration falls below 5 ppm. The microorganismsin activated sludge thrive when the D.O. con-centration is 1.5 ppm, a seemingly negligibleamount (equivalent to less than 1 mile of thetrip to the moon). Moreover, small differencesin D.O. concentration in aerobic wastewatertreatment systems, such as activated sludge,result in significant changes in the populationsof different species of microorganisms. Thesechanges, in turn, change the settleability of thesludge, the clarity of the treated effluent, andthe overall performance of the treatmentsystem.
MetalsThe heavy metals are those elements located inor near the middle of the periodic table. Figure6-4 shows the periodic chart with the elementsconsidered heavy metals highlighted. Many ofthese heavy metals are toxic to living entities,including humans and bacteria. For this reason,heavy metals are regulated through the variousenvironmental laws.
Table 6-1 shows the heavy metals that areregulated by the Clean Water Act (CWA),RCRA, and the SDWA. Table 6-2 lists all themetals that are regulated by the CWA, as wellas the applicable U.S. EPA Method Number,and the corresponding “Practical QuantitationLimit,” which is essentially the limit of detec-tion for that method. The standard method formeasuring the concentration of all of the heavymetals listed in Table 6-3 is by atomic adsorp-tion analysis (AA).
Color
Color is measured using visual comparison toan arbitrary standard. The standard is normallymade by dissolving potassium chloroplatinate(K2PtCl6) and cobalt chloride in deionizedwater. The color produced by 1 mg/L of potas-sium chloroplatinate is taken as one standard
unit of color. The cobalt chloride is used invery small amounts to tint the color standard tomatch the test solution. The cobalt chloridedoes not affect the intensity of the color of thestandard.
In some cases, an agreement can be madewith regulatory authorities to make the arbi-trary standard by simply diluting the receivingwater serially with deionized water or by seri-ally diluting the effluent in question withdeionized water.
TurbidityTurbidity refers to the light-scattering proper-ties of a sample. Turbidity can be described as“haziness” or “milkyness” and is caused byfine particles scattering light at more or less 90degrees to the direction from which the lightenters the sample. Turbidity is not to be con-fused with color, nor color with turbidity.
Turbidity is normally measured using anelectronic device in which a beam of ordinarywhite light is directed through a certain pathlength of the sample. Photometers placed atright angles to the direction of travel of thelight beam detect the amount of light diverted,which is directly proportional to the turbidity,expressed in Nephelometric Turbidity Units(NTUs).
Compounds Containing Phosphorus
When treated wastewaters are discharged tonatural water systems, various effects canresult, depending on what substances remain inthe treated effluent and in what form. One ofthe more significant effects is enhancement ofeutrophication within the receiving water sys-tem, if significant quantities of phosphorus, informs available to algae, are discharged.
Eutrophication, or the growth and prolifera-tion of plant life, including algae, is alwaysunder way in any natural water system (e.g.,rivers, streams, ponds, or lakes) but is limitedby the scarcity of nutrients such as phosphorusand nitrogen. At a minimum, plants, includingalgae, need carbon, nitrogen, and phosphorusin relatively abundant amounts, and potassium,

Wastes C
haracterization187
Figure 6-4
The periodic table.
H1
1
2
3 4 5 6 7 8 9 10 11 12
Hydrogen
I A
1
2
4
3
5
6
7
6
7
1.00794
2.1 1+
6.941
1.0 1+
9.012182
1.5 2+
22.989768
0.9 1+
24.3050
1.2 2+
Fr 87
Francium
Ra 88
Radium
Ac 89
Actinium
Cs 55
Cesium
Ba 56
Barium
La 57
Lanthanum
Th 90
Thorium
Ce 58
CeriumPa 91
Protactinium
Pr 59
PraseodymiumU 92
Uranium
Nd 60
NeodymiumNp 93
Neptunium
Pm 61
PromethiumPu 94
Plutonium
Sm 62
SamariumAm 95
Americium
Eu 63
EuropiumCm 96
Curium
Gd 64
Gadolinium
Rb 37
Rubidium
Sr 38
Strontium
Y 39
Yttrium
K 19
Potassium
Ca 20
Calcium
Na 11
Sodium
39.0983
0.8 1+
40.078
1.0 2+
44.955910
13 3+
47.88
1.5 4+
50.9415
1.6 3+
51.9961
1.6 3+
54.93805
1.5 3+
55.847
1.8 3+
58.9332
1.8 2+
58.6934
1.8 2+
63.546
1.9 2+
65.39
1.6 2+
10.811
2.0 3+
12.011
2.5 4+,4-
14.00674
3.0 3+,3-
15.9994
3.5 2-
18.9984032
4.0 1-
20.1797
- -
4.002602
- -
26.981539
1.5 3+
28.0855
1.8 4+
30.973762
2.1 5+
32.066
1.8 4+
35.4527
3.0 1-
39.948
- -
83.80
- -
131.29
- -
222.0176
- -
69.723
1.6 3+
72.61
1.6 4+
74.92159
2.0 3+,3-
78.96
2.4 4+
79.904
2.8 1-
121.757
1.9 3+,3-
127.60
2.1 4+
126.90447
2.5 1-
114.82
1.7 3+
118.71
1.8 4+
106.422.2 2+
107.86821.9 1+
112.4111.7 2+
196.966542.4 3+
200.591.9 2+
204.38331.8 1+
207.21.8 2+
208.980371.9 3+
208.98242.0 2+
209.98712.2 1-
101.57
2.2 3+,4+
102.9055
2.2 3+
192.22
2.2 4+
195.08
2.2 4+
190.2
2.2 4+
95.94
1.8 6+
98.9063
1.9 7+
186.207
1.9 7+
183.85
1.7 6+
92.90638
1.6 5+
180.9479
1.5 5+
91.224
1.4 4+
178.49
1.3 4+
85.4678
0.8 1+
87.62
1.0 2+
88.90585
13 3+
138.9055
1.1 3+
132.90543
0.7 1+
137.327
0.9 2+
223.0197
0.7 1+
226.0254
0.9 2+
227.0278
1.1 3+
140.115
1.1 3+
140.90765
1.1 3+
144.24
1.1 3+
144.9127
1.1 3+
150.36
1.2 3+
151.965
1.2 3+
157.25
1.2 3+
168.92534
1.2 3+
162.50
1.2 3+
164.93032
1.2 3+
167.26
1.2 3+
168.93421
1.2 3+
173.04
1.1 3+
174.967
1.2 3+
258.01
1.3 -
259.1009
1.3 -
260.1053
- -
244.0642
1.3 4+
243.0614
1.3 3+
247
1.3 3+
247.0703
1.3 3+
251.0796
1.3 3+
252.03
1.3 -
257.0951
1.3 -
237.082
1.3 5+
231.03588
1.5 5+
238.0289
1.4 6+
232.0381
1.3 4+
Rf 104
Rutherfordium
261.11
- -
Mg 12
Magnesium
Li 3
H1
Hydrogen
1.00794
2.1 1+
Lithium
Be 4
Beryllium
II A
Sc 21
Scandium
Hf 72
Hafnium
Ta 73
Tantalum
262.11
- -
Db 105
Tantalum
263.12
- -
Sg 106
Seaborgium
W 74
Tungsten
Zr 40
Zirconium
Nb 41
Niobium
Mo 42
Molybdenum
Ti 22
Titanium
V 23
Vanadium
Cr 24
Chromium
Re 75
Rhenium
262.12
- -
Bh 107
Bohrium
264
- -
Hs 108
Hassium
266.1378
- -
Mt 109
Maitnerium
Tc 43
Technetium
Mn 25
Manganese
Os 76
Osmium
Ru 44
Ruthenium
Fe 26
Iron
Ir 77
Iridium
Rh 45
Rhodium
Co 27
Cobalt
III B IV B V B VI B VII B VIII
Bk 97
Berkelium
Tb 65
TerbiumCf 98
Califomium
Dy 66
DysprosiumEs 99
Einsteinium
Ho 67
HolmiumFm 100
Fermium
Er 68
ErbiumMd 101
Mendelevium
Tm 69
ThuliumNo 102
Nobelium
Yb 70
YtterbiumLr 103
Lawrencium
Lu 71
Lutetium
Tl 81
Thallium
In 49
Indium
Ga 31
Gallium
Al 13
Aluminum
B 5
Boron
III A13 14 15 16 17
18
Pb 82
Lead
289- -
Uuq 114
Ununquadium
Sn 50
Tin
Ge 32
Germanium
Si 14
Silicon
C 6
Carbon
IV A
Bi 83
Bismuth
Sb 51
Antimony
As 33
Arsenic
P 15
Phosphorus
N 7
Nitrogen
V A
Po 84
Polonium
289--
Uuh 116
Ununhexium
Te 52
Tellurium
Se 34
Selanium
S 16
Sulfur
O 8
Oxygen
VI A
At 85
Astatine
I 53
Iodine
Br 35
Bromine
Cl 17
Chlorine
F 9
Fluorine
VII A
VIII A
Rn 86
Radon
293
--
Uuo 118
Ununoctium
Xe 54
Xenon
Kr 36
Krypton
Ar 18
Argon
Ne 10
Neon
He 2
Helium
Pt 78
Platinum
269
- -
Uun 110
Ununnilium
Pd 46
Palladium
Ni 28
Nickel
Au 79
Gold
272- -
Uuu 111
Unununium Ununbium
Ag 47
Silver
Cu 29
Copper
I B
Hg 80
Mercury
277- -
Uu 112
Cd 48
Cadmium
Zn 30
Zinc
II B
Mokeur's Periodic table of the elements
Symbol Atomic number
Name
Relativeatomic mass
Most frequentoxidation number
Electronegativity
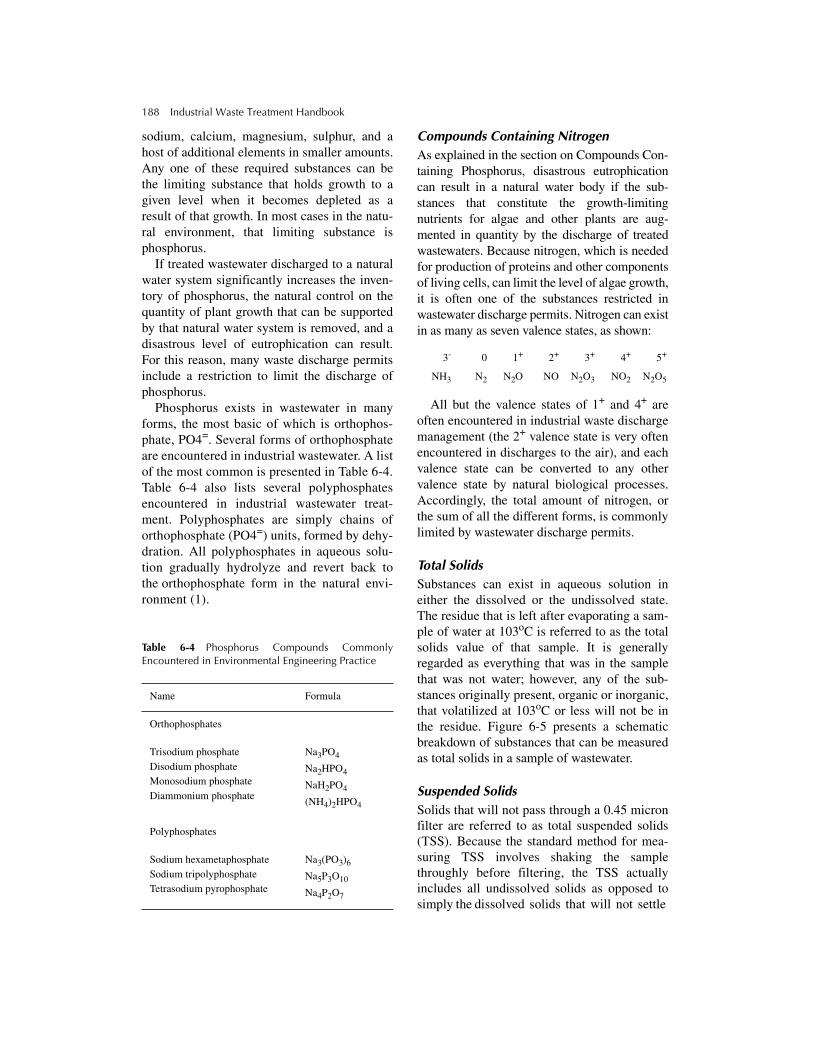
188 Industrial Waste Treatment Handbook
sodium, calcium, magnesium, sulphur, and ahost of additional elements in smaller amounts.Any one of these required substances can bethe limiting substance that holds growth to agiven level when it becomes depleted as aresult of that growth. In most cases in the natu-ral environment, that limiting substance isphosphorus.
If treated wastewater discharged to a naturalwater system significantly increases the inven-tory of phosphorus, the natural control on thequantity of plant growth that can be supportedby that natural water system is removed, and adisastrous level of eutrophication can result.For this reason, many waste discharge permitsinclude a restriction to limit the discharge ofphosphorus.
Phosphorus exists in wastewater in manyforms, the most basic of which is orthophos-phate, PO4=. Several forms of orthophosphateare encountered in industrial wastewater. A listof the most common is presented in Table 6-4.Table 6-4 also lists several polyphosphatesencountered in industrial wastewater treat-ment. Polyphosphates are simply chains oforthophosphate (PO4=) units, formed by dehy-dration. All polyphosphates in aqueous solu-tion gradually hydrolyze and revert back tothe orthophosphate form in the natural envi-ronment (1).
Table 6-4 Phosphorus Compounds CommonlyEncountered in Environmental Engineering Practice
Compounds Containing NitrogenAs explained in the section on Compounds Con-taining Phosphorus, disastrous eutrophicationcan result in a natural water body if the sub-stances that constitute the growth-limitingnutrients for algae and other plants are aug-mented in quantity by the discharge of treatedwastewaters. Because nitrogen, which is neededfor production of proteins and other componentsof living cells, can limit the level of algae growth,it is often one of the substances restricted inwastewater discharge permits. Nitrogen can existin as many as seven valence states, as shown:
All but the valence states of 1+ and 4+ areoften encountered in industrial waste dischargemanagement (the 2+ valence state is very oftenencountered in discharges to the air), and eachvalence state can be converted to any othervalence state by natural biological processes.Accordingly, the total amount of nitrogen, orthe sum of all the different forms, is commonlylimited by wastewater discharge permits.
Total SolidsSubstances can exist in aqueous solution ineither the dissolved or the undissolved state.The residue that is left after evaporating a sam-ple of water at 103oC is referred to as the totalsolids value of that sample. It is generallyregarded as everything that was in the samplethat was not water; however, any of the sub-stances originally present, organic or inorganic,that volatilized at 103oC or less will not be inthe residue. Figure 6-5 presents a schematicbreakdown of substances that can be measuredas total solids in a sample of wastewater.
Suspended SolidsSolids that will not pass through a 0.45 micronfilter are referred to as total suspended solids(TSS). Because the standard method for mea-suring TSS involves shaking the samplethroughly before filtering, the TSS actuallyincludes all undissolved solids as opposed tosimply the dissolved solids that will not settle
Name Formula
Orthophosphates
Trisodium phosphateDisodium phosphateMonosodium phosphateDiammonium phosphate
Na3PO4
Na2HPO4
NaH2PO4
(NH4)2HPO4
Polyphosphates
Sodium hexametaphosphateSodium tripolyphosphateTetrasodium pyrophosphate
Na3(PO3)6
Na5P3O10
Na4P2O7
3- 0 1+ 2+ 3+ 4+ 5+
NH3 N2 N2O NO N2O3 NO2 N2O5
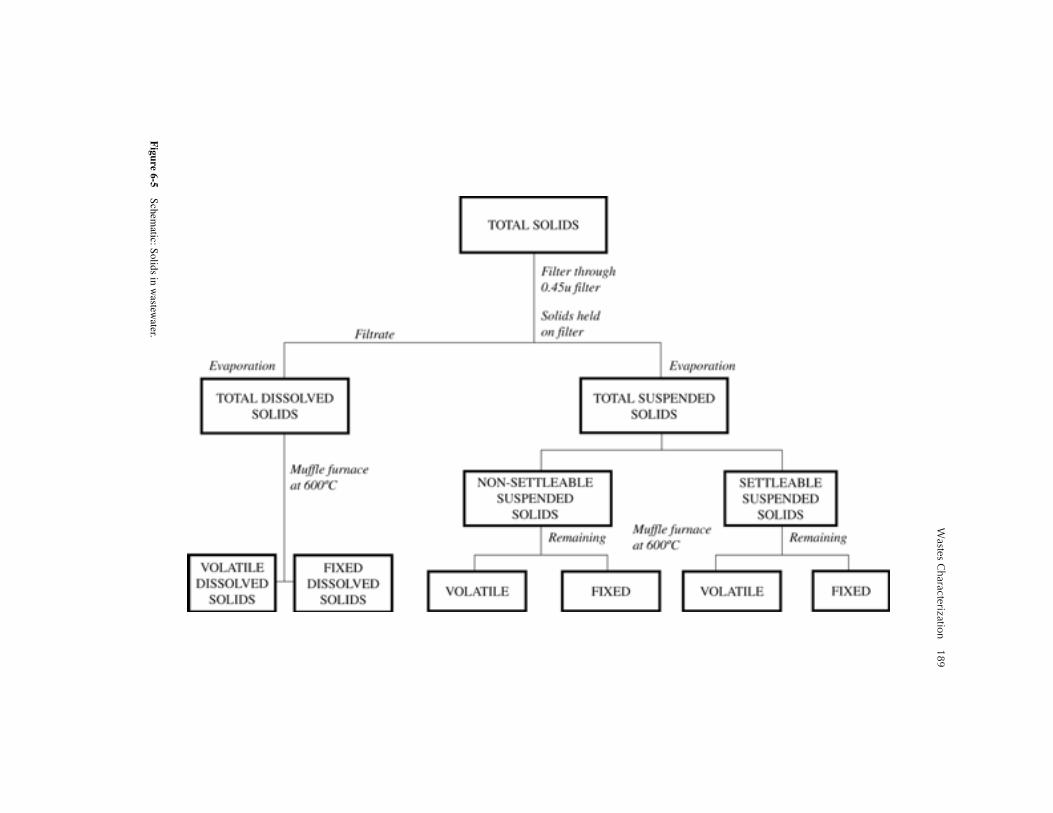
Wastes C
haracterization189
Figure 6-5
Schem
atic: Solids in w
astewater.

190 Industrial Waste Treatment Handbook
under the influence of gravity. Results of thetest for settleable solids cannot be subtractedfrom the results of the test for TSS to obtain thevalue of the quantity of undissolved solids in asample that will not settle under the influence ofgravity, because the standard test for settleablesolids yields a value in terms of ml/L, whereasthe standard test for TSS yields a value in termsof mg/L. If it is desired to estimate the quantityof nonsettleable TSS, a special procedure mustbe devised and then described thoroughly in thepresentation of results.
Settleable SolidsSettleable solids are undissolved solids that set-tle to the bottom of a container under theinfluence of gravity. The standard device formeasuring settleable solids is the Imhoff cone,pictured in Figure 6-6. The standard test forsettleable solids involves shaking a samplethoroughly, filling the 1-liter Imhoff cone to thefull mark, and allowing the sample to settle for1 hour under quiescent conditions. Settleablesolids is reported as milliliters of settleablematerials per liter of sample (ml/L). In order toobtain a value of the weight of settleable mate-rial, it would be necessary to remove thesupernatant and to evaporate to dryness thatvolume of sample that contained the settleablesolids. The result will include the dissolvedsolids contained in the liquid remaining withthe settled solids. If this volume is small com-pared to the total (1-liter) sample, the “error”will be small. This procedure is never done inthe context of a wastewater discharge permit,but may be done for the engineering or plan-ning purposes of the discharger.
Figure 6-6 Imhoff cones used to measure settleable solids.(Courtesy of Wheaton Science Products.)
Total Volatile Suspended Solids (TVSS)The standard method for estimating the quan-tity of undissolved organic material in awastewater sample is to perform a TSS test, asexplained previously, and then to place the 0.45micron filter with the solids deposited thereonin a furnace at 600oC for a sufficient time to“burn” all of the material that will oxidize tocarbon dioxide at that temperature. The mate-rial that remains on the filter after thisprocedure will not combine with oxygen andvolatilize as carbon dioxide at 600oC. Thesesolids are referred to as “fixed” solids and areconsidered to be the inorganic portion of thesuspended solids in the wastewater sample.This value, subtracted from the TSS value, pro-duces the TVSS portion of the wastewatersample and is an estimate of the quantity ofundissolved organic material in the originalwastewater sample.
Oil and GreaseThere are three methods, each of which is con-sidered a standard method for estimating thequantity of oil and grease in a wastewater sam-ple. When reporting results, however, themethod used is actually part of the result. Inother words, as stated in “Standard Methods,”“. . . oils and greases are defined by the methodused for their determination.” The three meth-ods are:
1. Partition-gravimetric method2. Partition-infrared method3. Soxlet method
All three methods involve extracting the oiland grease substances from the raw sample byuse of a solvent. Also, all three methods requirethat the sample be acidified to pH 2.0 or lower,by adding hydrochloric or sulfuric acid, beforethe extraction process takes place.
The Partition-Gravimetric MethodThe partition-gravimetric method involves
extracting dissolved or emulsified oil and greaseby intimate contact with an extracting solvent,which can be one of the following:
Wastes Characterization 191
• n-Hexane• Methyl-tert-butyl ether (MTBE)• Solvent mixture, 80% n-hexane/20%
MTBE, v/v
The sample and the solvent are placedtogether in a separatory funnel and shaken.Then, the solvent (with dissolved oil and greasefrom the sample) is drawn off and passedthrough a funnel containing filter paper and10 g sodium sulfate. The solvent is evaporatedat 85oC, and the quantity of oil and grease isdetermined gravimetrically.
The Partition-Infrared MethodThe partition-infrared method makes use of
trichlorofluoroethane as the extraction solvent.Use of this solvent allows use of infrared,which is absorbed by the carbon-carbon doublebond that is characteristic of oil and grease sub-stances. Thus, substances that are dissolved byn-hexane and trichlorofluoroethane and arevolatilized at 85oC are detected by this method.The extraction procedure is the same as for thepartition-gravimetric method. Following theextraction, the quantity of oil and grease isdetermined using photometric techniques withlight in the infrared zone (3200 cm-1 to 2700cm-1).
The Soxlet Extraction MethodThe Soxlet extraction method uses the same
three choices of solvent as for the partition-gravimetric method (n-hexane, MTBE, or an80/20 v/v mixture of the two. The extractionprocedure, however, is carried out in a refluxapparatus as opposed to a separatory funnel.After extraction, the quantity of oil and greaseis determined gravimetrically.
The oil and grease tests are subject to largeerror because anything that will dissolve in theextraction solvent, whether it is truly oil orgrease or not (in the sense that it will causeproblems by coating sewerage, forming grease-balls, or exhibiting resistance to biodegreda-tion), will be measured as oil and grease. Inaddition to this problem, the difficulty ofobtaining a representative sample of the waste-water for measurement of oil and grease
content must be kept in mind when interpretingor evaluating laboratory results. The reason forthis is that oil and grease substances are onlysparingly soluble in water and tend to eitherfloat on the surface, as is the case with animalfat, or sink to the bottom, as is the case withtrichloroethylene. Accordingly, an automaticsampler that takes samples from the bulk flowis not useful. To take samples for laboratorydetermination of fats, oil, and grease (FOG)content, it is necessary to hand dip to obtaingrab samples, and in doing so, attempt toobtain portions of the flow from throughout thedepth of wastewater flow.
“Other Characteristics” (Pollutants)
Chlorine Demand And Chlorine ResidualChlorine, in the form of either chlorine gas orone of the hypochlorites, is routinely added towastewaters for disinfection. However, if thereare substances in the wastewater that willquickly react with chlorine or hypochlorite,becoming oxidized themselves and reducingthe chlorine to chloride ion (Cl-), which is non-reactive, disinfection will not take place. Thesesubstances are “reducing agents,” relative tochlorine. Therefore, enough chlorine must beadded to react with all of the reducing agentsbefore any chlorine becomes available for dis-infection. “Contact time” is then required forthe chlorine to kill the microorganisms andthus accomplish disinfection. The amount ofcontact time required is in inverse proportion tothe concentration of chlorine residual, which isthe concentration of chlorine that remains atany point after reactions with other chemicalsor substances (reducing agents) have takenplace. The mathematical relationship betweenchlorine dose, chlorine residual, and chlorinedemand is as follows:
chlorine residual = chlorine dose − chlorine demand
(6-5)
The quantity of chlorine “used up” as a resultof the disinfection process is considered part ofthe chlorine demand. Therefore

192 Industrial Waste Treatment Handbook
chlorine demand = chlorine reacted with reducing agents +chlorine used for disinfection
(6-5.5)
ChloridesThe importance of the presence of chlorides inwastewaters relates to their ability to partici-pate in the conduction of electric current and,therefore, their active role in enhancing corro-sion, particularly galvanic corrosion. Chloridesare otherwise benign, being unreactive, andunlikely to participate in any precipitationactivity, except the salting out process. Chlo-rides do affect the osmotic pressure of anaqueous solution and, as such, can have a dele-terious effect on a biological wastewatertreatment system. It has been determinedthrough both laboratory experimentation andfull-scale treatment plant operation that biolog-ical treatment systems are able to operate underconditions of chloride concentrations up to2,000 mg/L, but the chloride concentrationmust be reasonably stable. Once the populationof microorganisms acclimates to a given rangeof chloride concentration, a significant increaseor decrease in chloride concentration adverselyaffects the treatment process, probably becauseof the change in osmotic pressure and its effecton the microbial cell membranes.
HardnessThe test for hardness in water was originallydeveloped to determine the soap-consumingproperties of water used for washing. Theoriginal test involved placing a measuredamount of a standard soap in a bottle contain-ing the water being tested, shaking the mixturein a standard manner, then observing thenature of the suds, if any, on the surface of thewater. Then, more soap was added, using astep-by-step procedure, until a permanentlayer of suds remained on the surface of thewater. The total quantity of soap required toproduce the stable suds layer was propor-tional to the hardness of the water. It waseventually realized that the hardness resultedalmost entirely from the presence of calciumand magnesium ions in the water, and as soon
as analytical procedures were developed thatwould analyze for the concentrations of theseions directly, rather than indirectly as with theshaking bottle test, the newer analytical proce-dures became the standard for the hardnesstest. In the context of water use in industrialprocesses, however, and especially the reuseof treated wastewaters in a recycle and reusesystem, the significance of hardness is in thescale-forming properties of calcium and mag-nesium salts.
Iron and Manganese Iron and manganese are normally consideredtogether as problems in raw water supplies forindustrial process use, as well as in processeffluents, because these metals are very oftenfound together in groundwater supplies and insome surface water supplies under certain con-ditions. Iron and manganese are objectionablefor two principal reasons. First, iron can be oxi-dized by oxygen in water to insoluble ferricoxide, which precipitates to form fine granulesthat can foul distribution systems and coolingdevices. Second, both iron and manganesereact with chlorine to form highly colored chlo-rides that stain many of the objects with whichthey come in contact.
Characteristics of Discharges to the Air
There are three categories of air pollutant char-acterization work: (1) stack discharge character-ization, (2) fugitive emissions characterization,and (3) ambient air quality characterization.The three categories involve quite differentsampling procedures but similar, and in mostcases identical, analysis methods. Stack dis-charge and fugitive emission characterizationwork are done primarily to determine the stateof compliance with one or more discharge per-mits. Ambient air quality characterization isdone primarily to determine the quality of air ina given area.
Ambient air quality data is used for manypurposes, including:
• Issuance of construction permits for indus-trial projects
Wastes Characterization 193
• Determination of state of compliance withNational Ambient Air Quality Standards(NAAQS)
• Determination of the effectiveness of ame-liorating activities
• Establishment of baseline informationbefore construction of a significant contrib-utor of substances to the atmosphere
Stack Sampling The most common reason for conducting astack sampling program is to determine thestate of compliance with regulatory require-ments. As such, the substances sampled for areusually dictated by the list of substancesincluded in the air discharge permits issued tothe facility.
The purpose of stack sampling is to deter-mine, with as much accuracy as is practicable,the quantity (magnitude) of the total gas sourceflow rate and the quality (types and amounts ofair contaminants) of the total source gas dis-charge. The equipment included in a typicalstack sampling station includes devices to mea-sure characteristics from which gas flow ratecan be calculated, devices to measure certaincharacteristics directly, and equipment to col-lect and store samples for subsequent analysesin the laboratory.
In general, the equipment used to obtain datafrom which to calculate gas flow rate includespitot tubes to measure gas velocity, a device tomeasure the static pressure of the stack gas,and devices to measure barometric pressure,moisture content, and temperature. Equipmentused to characterize stack discharges in termsof specific substances is classified in two broadcategories: particulate and gaseous. The objec-tive of this equipment in both categories is toquantitatively remove air contaminants in thesame condition as they occur when they aredischarged to the air. Many individual devicesas well as integrated systems are commerciallyavailable to accomplish this objective.
Sample CollectionSamples of ambient air or gas streams (includ-ing stack emissions and fugitive emissions) are
sampled to determine the presence of, and con-centrations of, particulate and gaseouspollutants by use of the following equipmentand mechanisms:
• Use of a vacuum pump, hand-operated orautomatic
• Vacuum release of an evacuated collectioncontainer
• Tedlar bags
• Adsorption on a solid
• Condensation (freeze-out) in a trap
Vacuum PumpsVacuum pumps are the standard type of equip-ment used to draw samples of ambient air ofstack gas or another gas stream through orinto collection devices. Hand-operated vac-uum pumps are used extensively to obtaingrab samples. Motor-driven vacuum pumpsare the standard for continuous or intermittentmonitoring. Vacuum pumps can be fitted with,or connected in series with, gas flow meters toobtain data for calculation of concentrations.
Vacuum Release of an Evacuated Collection ContainerContainers (having appropriate linings) can beevacuated by use of a vacuum pump beforetraveling to sampling locations. The collectionapparatus (soil gas sampling well, for instance)can be connected to the evacuated container,the valve on the container can be opened, and asample of known volume is collected.
Tedlar BagsTedlar bags are made of a nonreactive, non-adsorbing (relatively) material and are standardequipment for sampling for gaseous substancesin air of a stack or other emission. They arepurchased as a completely empty bag and areinflated with the collected sample of air orother gas. Samples should be analyzed as soonas possible after being collected in the Tedlarbag. Tedlar bags can be purchased in differentvolume capacities, including 1-liter and 10-liter bags.
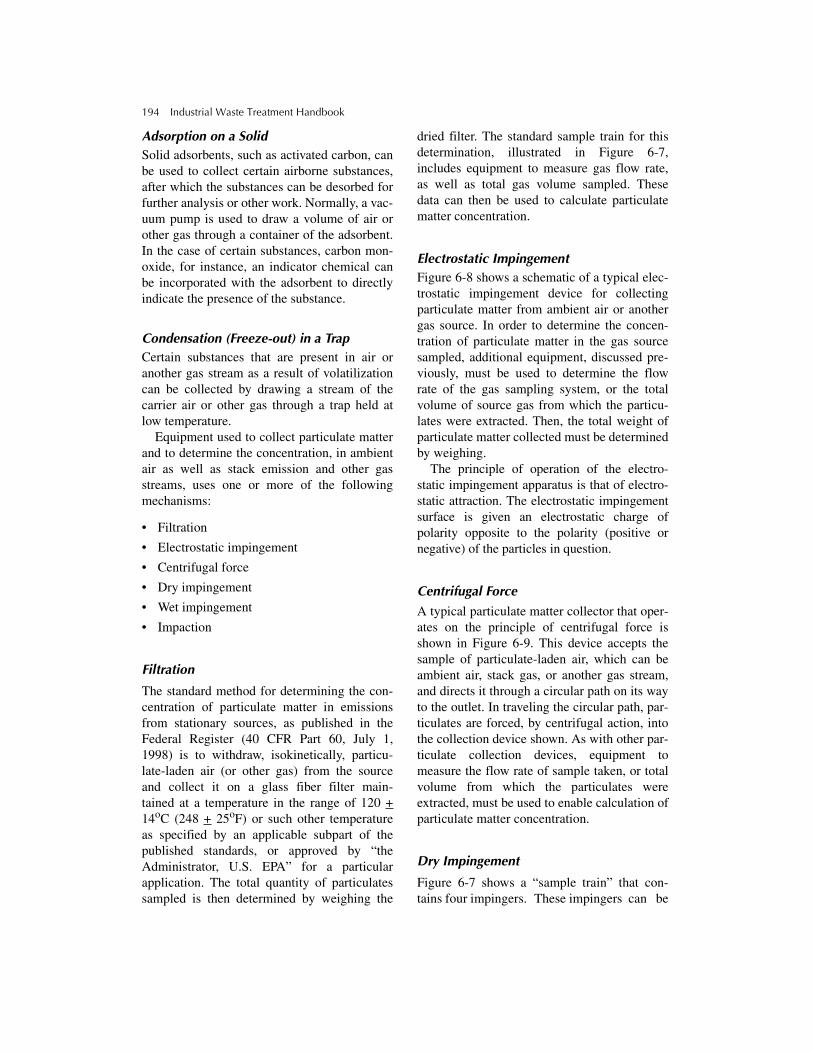
194 Industrial Waste Treatment Handbook
Adsorption on a SolidSolid adsorbents, such as activated carbon, canbe used to collect certain airborne substances,after which the substances can be desorbed forfurther analysis or other work. Normally, a vac-uum pump is used to draw a volume of air orother gas through a container of the adsorbent.In the case of certain substances, carbon mon-oxide, for instance, an indicator chemical canbe incorporated with the adsorbent to directlyindicate the presence of the substance.
Condensation (Freeze-out) in a TrapCertain substances that are present in air oranother gas stream as a result of volatilizationcan be collected by drawing a stream of thecarrier air or other gas through a trap held atlow temperature.
Equipment used to collect particulate matterand to determine the concentration, in ambientair as well as stack emission and other gasstreams, uses one or more of the followingmechanisms:
• Filtration
• Electrostatic impingement
• Centrifugal force
• Dry impingement
• Wet impingement
• Impaction
Filtration
The standard method for determining the con-centration of particulate matter in emissionsfrom stationary sources, as published in theFederal Register (40 CFR Part 60, July 1,1998) is to withdraw, isokinetically, particu-late-laden air (or other gas) from the sourceand collect it on a glass fiber filter main-tained at a temperature in the range of 120 +14oC (248 + 25oF) or such other temperatureas specified by an applicable subpart of thepublished standards, or approved by “theAdministrator, U.S. EPA” for a particularapplication. The total quantity of particulatessampled is then determined by weighing the
dried filter. The standard sample train for thisdetermination, illustrated in Figure 6-7,includes equipment to measure gas flow rate,as well as total gas volume sampled. Thesedata can then be used to calculate particulatematter concentration.
Electrostatic ImpingementFigure 6-8 shows a schematic of a typical elec-trostatic impingement device for collectingparticulate matter from ambient air or anothergas source. In order to determine the concen-tration of particulate matter in the gas sourcesampled, additional equipment, discussed pre-viously, must be used to determine the flowrate of the gas sampling system, or the totalvolume of source gas from which the particu-lates were extracted. Then, the total weight ofparticulate matter collected must be determinedby weighing.
The principle of operation of the electro-static impingement apparatus is that of electro-static attraction. The electrostatic impingementsurface is given an electrostatic charge ofpolarity opposite to the polarity (positive ornegative) of the particles in question.
Centrifugal Force
A typical particulate matter collector that oper-ates on the principle of centrifugal force isshown in Figure 6-9. This device accepts thesample of particulate-laden air, which can beambient air, stack gas, or another gas stream,and directs it through a circular path on its wayto the outlet. In traveling the circular path, par-ticulates are forced, by centrifugal action, intothe collection device shown. As with other par-ticulate collection devices, equipment tomeasure the flow rate of sample taken, or totalvolume from which the particulates wereextracted, must be used to enable calculation ofparticulate matter concentration.
Dry Impingement
Figure 6-7 shows a “sample train” that con-tains four impingers. These impingers can be

Wastes C
haracterization195
Figure 6-7
Particulate sampling train.

196 Industrial Waste Treatment Handbook
Figure 6-8 Schematic of a typical electrostatic impingement collector.
used either wet or dry and can be used tocollect particulates from ambient air ofstack gases or particulates from other gasstreams.
Wet ImpingementWet impingement methods for collectingparticulate samples from ambient air, a stackemission, or another gas train operate bytrapping the particulates in a liquid solution.The total weight of particulate matter is thendetermined by filtration and weighing theentire volume of the liquid, or by evaporat-ing the liquid and weighing. A volume offresh liquid is also evaporated, and theresidual (if any) is weighed and compared tothe weight of the dried sample to determinethe actual weight of particulate matter.Again, equipment to measure the sampleflow rate or the total volume sampled is nec-essary in order to determine particulateconcentration.
ImpactionFigure 6-10 shows a schematic of a typicalimpaction particulate collector. The principle
on which this collection device operates is thatof entrapment on a plate having a film of stickymaterial on its surface. Collection of pollen forassay purposes makes use of this type ofequipment.
Particulates can be physically extractedfrom glass fiber filters or from the other col-lection devices for analysis as to individualconstituents, such as metals, radioactiveelements, or other materials. The analystshould consult the appropriate Code of Fed-eral Regulations to determine acceptableprocedures.
Figure 6-11 presents a schematic exampleof a stack sampling system and illustrates sev-eral of the methods employed for datamanagement.
Figure 6-9 Schematic diagram of a centrifugal particlecollector.
Figure 6-10 Schematic of a typical impaction particle collector.
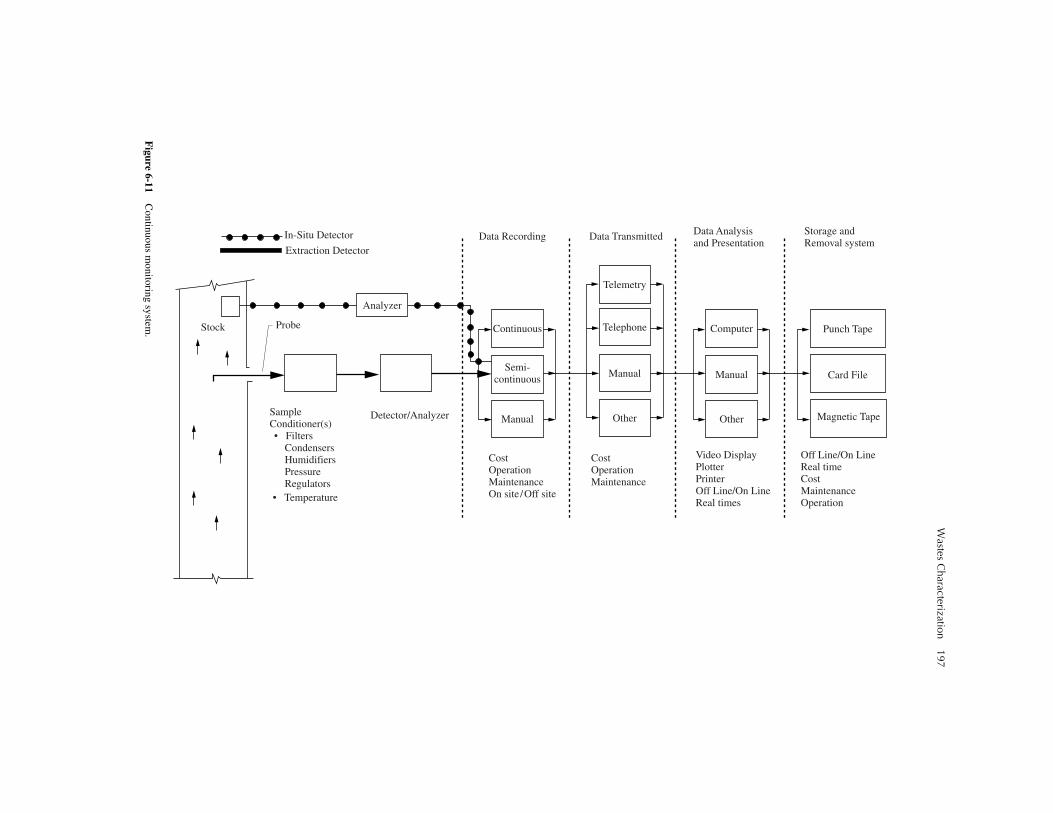
Wastes C
haracterization197
Figure 6-11
Continuous m
onitoring system.
In-Situ Detector
Extraction Detector
Stock Probe
SampleConditioner(s)• Filters Condensers Humidifiers Pressure Regulators• Temperature
Detector/Analyzer
Continuous
Telemetry
Punch Tape
Card File
Telephone
Manual
Other
Semi-continuous
Manual
Computer
Manual
Other
Data TransmittedData Recording Data Analysisand Presentation
Storage andRemoval system
CostOperationMaintenanceOn site /Off site
CostOperationMaintenance
Video DisplayPlotterPrinterOff Line/On LineReal times
Off Line/On LineReal timeCostMaintenanceOperation
Magnetic Tape
Analyzer

198 Industrial Waste Treatment Handbook
Sample Analysis
Although it is realized that, once a sample iscollected, it is subject to change as a result ofchemical reaction, chemical degradation,absorption or adsorption onto the walls of thecontainer or to other substances in the con-tainer, or other phenomena, not much ispresently known with certainty about howmuch change takes place in a sample once it iscollected. Therefore, it is extremely importantto perform the chemical or other analyses assoon as possible after the samples arecollected.
Ambient Air Sampling
Determination of the quality of ambient air asit relates to the presence and concentration ofsubstances regarded as pollutants is the objec-tive of ambient air sampling. The specializeddevices and techniques for carrying out thistask have been developed over half a century.Here, again, obtaining representative samplesis a major objective of the work plan. Deci-sions to be made, which must strike a balancebetween the cost of the characterization pro-gram and the value of the data, include theduration of the sampling period, number ofdiscrete samples taken, the size of each sam-ple, and the number of substances sampledfor.
Particulate matter in ambient air is measuredby use of a “high-volume sampler,” which is anintegrated filter holder–vacuum pump (high-volume). A glass fiber filter is held in the filterholder, and a high flow rate of ambient air isdrawn through it over a measured period. Cal-culations of particulate matter concentration inthe ambient air are carried out using the weightof particulate matter collected on the filter andthe flow rate (or total volume) of air drawnthrough the filter.
Air PollutantsThe following paragraphs present a brief dis-cussion of the major air pollutants that areregulated by the Clean Air Act, as amended.
Air ToxicsControl of the release of so-called air toxicstook on a new importance, in fact, a dominantimportance, with promulgation of Title III ofthe 1990 Clean Air Act Amendments (CAA).Previous to these amendments, the EPA hadissued standards for only eight hazardoussubstances over a 20-year period. The 1990CAA lists 188 substances that must becontrolled.
The designated “air toxics” are required tobe managed by use of Maximum AchievableControl Technology (MACT). In addition,residual risk after implementation of MACTmust be assessed. Industries are also subject toa time schedule, by source category, for imple-mentation of MACT. Seven hundred sourcecategories have been identified, and the EPAwas required to have published MACT stan-dards for all source categories, or subcatego-ries, by November 2000. All sources must be incompliance with the applicable standard withina published time schedule.
There are significantly different require-ments for sources that qualify as a “majorsource” compared to those that do not. A“major source” is any stationary source thatemits in excess of 10 tons per year of any of thelisted 188 hazardous substances, or 25 tons peryear or more of any combination of those sub-stances.
The list of 188 “air toxics” includes pesti-cides, metals, organic chemicals, coke ovenemissions, fine mineral fibers, and radionu-clides. The EPA is required to add to this listpollutants that may be shown to present,through inhalation or other routes of exposure,a threat of adverse effect on human health orthe environment. The EPA may also removesubstances from the list if it can be shown thatthe reasons for placing them on the list were inerror.
There are also significantly elevated controlrequirements for those sources that represent90% of the area sources that emit the 30 haz-ardous air pollutants presenting the greatestthreat to public health in the largest number ofurban areas.

Wastes Characterization 199
OzoneOzone has the chemical formula O3 and is arelatively strong oxidizing agent. Ozone isemitted directly by some sources and is a prod-uct of chemical and/or photochemical reactionbetween other air pollutants in the atmosphere.Ozone is an irritant and can damage sensitivetissues in animals (including humans) and planttissues.
Oxides of SulfurSulfur dioxide is the major sulfur oxide of con-cern in the atmosphere, although sulfurtrioxide (SO3) and sulfate (SO4) are alsoimportant. The primary source of sulfur oxidesin the nation’s atmosphere is the burning offossil fuels (oil and coal) for generation ofelectrical power and heat. Because sulfur is animportant component of protein, and protein isan important component of virtually all plantsand animals, sulfur is consequently a compo-nent of the fossil remains of these once-livingentities. When oil or coal are burned, oxygencombines with the sulfur and the resulting sul-fur oxides are emitted with the gaseousreleases from the combustion process. Theprincipal harmful effects are their eventualreaction with atmospheric moisture and returnto the earth as acid rain and their participationin photochemical reactions in the atmosphereto produce smog.
Oxides of Nitrogen (NOx)
Nitrogen oxides, principally nitrogen dioxide,NO2, and nitric oxide, NO, are produced dur-ing the combustion of all types of fuels. Thesegases are referred to together as NOx. Becauseair consists of nitrogen in the N2 gas form, andabout 21% oxygen in the O2 gas form, there isan unlimited supply of both nitrogen. and oxy-gen available to react with each other, whichthey will do at elevated temperatures.
The other source of nitrogen that results inthe formation of significant amounts of NOx isthe nitrogen content of the fuel itself. Forinstance, Number 6 fuel oil typically containsfrom 3% to 7% by weight of nitrogen. It has
been observed that the NOx content of stackgases increases linearly with a linear increasein the nitrogen content of the fuel oil. It istherefore to be concluded that (1) the nitrogencontent of fuel oil is converted to NOx duringthe combustion process, and (2) a reasonablestrategy for helping to comply with limits onNOx emissions is to obtain and burn fuel oilhaving relatively low nitrogen content.
The source of nitrogen in fossil fuels is simi-lar to that of sulfur; namely, the living tissuefrom which the fossil remains were derived.All living entities, since life began, have haddeoxyribonucleic acid (DNA), ribonucleic acid(RNA), and protein materials as key compo-nents. Nitrogen has always been a componentof these three substances, and the fossilremains contain nitrogen as well.
The principal harmful effect of the nitrogenoxides is their reaction with atmospherichydrocarbons and other substances to formsmog.
Carbon Monoxide (CO)
Carbon monoxide is the product of incompletecombustion of organic matter, including fossilfuels. Whereas complete combustion of mate-rial composed of organic carbon producescarbon dioxide, CO2, incomplete combustioncaused by inadequate supply of oxygen resultsin the production of some carbon monoxide,CO. Carbon monoxide is hazardous to thehealth of humans and other animals.
Carbon Dioxide (CO2)Carbon dioxide is a product of complete com-bustion. The principal sources of carbondioxide in the atmosphere are the respiration ofplants, animals, and microorganisms that useoxygen as an electron acceptor, and the burningof fossil and other fuels for generation of heatand power.
The principal harmful effect of carbon diox-ide in the atmosphere is its contribution, alongwith methane, to the promotion of globalwarming, caused by the so-called greenhouseeffect.

200 Industrial Waste Treatment Handbook
ParticulatesParticulates, known as “fine particulate mat-ter,” or “PM10,” are very small particles of anysubstance. The harmful effects of particulatesare their tendency to lodge in the lungs andtheir objectionable effect on visibility.
The sources of particulate matter in theatmosphere are many and varied. Every timesomething is burned, particulate matter is gen-erated and released. Wind generates particulatematter by blowing dust and other particulatesfrom places of deposition into the ambient air.Automobiles and moving heavy equipment dis-turb land and generate airborne particulatematter.
Volatile Organic Carbon Compounds (VOCs)Volatile organic carbon compounds (VOCs) area class of chemicals that are emitted directly tothe air as a result of evaporation or another typeof volatilization. Sources include stored gaso-line, stored solvents and other industrialchemicals, and certain industrial processes.Incomplete combustion of fuels of many typesis also an important source of VOC dischargeto the ambient air.
The principal harmful effects of VOCs aretoxicity, possible contribution to smog via pho-tochemical reactions in the atmosphere, andpossible contribution to the “greenhouseeffect” and consequent global warming.
Malodorous SubstancesThere are many substances, including com-pounds of sulfur in the reduced state, such ashydrogen sulfide, methyl and ethyl mercapa-tans, and dimethyl sulfide, and degradationproducts of proteins, such as amines, amides,putricine, and cadaverine, that have extremelyobjectionable odors. Many of these com-pounds can be detected by the humanolfactory apparatus in atmospheric concentra-tion ranges of only a few parts per billion byvolume. Although their common objectionableproperty is their bad smell, some of them aretoxic.
Hydrogen Sulfide (H2S)Hydrogen sulfide (H2S) is toxic as well as mal-odorous. Worse yet, it has the characteristic ofbeing able to desensitize the olfactory appara-tus in a few minutes if the concentration ishigher than a few parts per billion by volume.Persons who have entered confined spaces con-taining hydrogen sulfide gas have died becausesoon after entering the space they were unableto smell the H2S, did not realize they werebreathing it, and were overcome by a fataldose.
Other Reduced Sulfur CompoundsA reduced sulfur compound is a chemical sub-stance of low molecular weight that contains oneor more sulfur atoms in the minus two (sulfide)valence state. These substances, along withhydrogen sulfide, are referred to in the aggregateas total reduced sulfer (TRS). Many air dischargepermits contain restrictions on TRS. Some TRScompounds are toxic. All are objectionablebecause of their extremely strong, foul odors.
Common sources of hydrogen sulfide andother reduced sulfur compounds include tan-neries, rendering plants, Kraft pulp mills, andmalfunctioning POTWs.
OrganicsSeveral categories of organic material are regu-lated through restrictions contained in airdischarge permits.
HydrocarbonsLow-molecular-weight organic compoundsconsisting of carbon and hydrogen are dis-charged to the air as a result of incompletecombustion of fossil fuels, including gasoline,and via evaporation. These substances undergophotochemical reactions with other substancesin the atmosphere to form smog.
MethaneMethane, the lowest-molecular-weight hydro-carbon, enters the atmosphere as a resultof natural gas extraction, coal extraction,

Wastes Characterization 201
management of solid waste, anaerobic degrada-tion of organic material in the naturalenvironment, and the gaseous expulsions ofcattle and other animals associated withagriculture.
The principal harmful effect of methanereleased to the atmosphere is its contribution,along with carbon dioxide, to the cause of glo-bal warming, or the “greenhouse effect.”
Sampling Methods for Air ToxicsCompliance with the requirements of Title IIIof the CAA is based on the implementation ofspecified (MACT) control technologies, asopposed to the sampling and analyses of dis-charges; however, sampling and analysis workis required to determine whether or not one ormore of the 189 listed substances are present inthe discharge. This information is needed, insome cases, to determine whether or not agiven MACT must be installed.
The CAA contains no guidance as to whatmethodologies are acceptable for sampling andanalyzing for some of the air toxics. As aresult, it is common to use the sampling andanalysis methods acceptable to the industrialhygiene profession.
Characteristics of Solid Waste Streams from Industries
The Resource Conservation and Recovery Act,(RCRA), as amended, is the primary law gov-erning the handling, transportation, anddisposal of solid and hazardous wastes. Thelaw is contained in its entirety, including theregulations that specifically regulate the sam-pling and analyses of hazardous and non-hazardous solid waste streams, in volume 40 ofthe Code of Federal Regulations. Subtitles Cand D are addressed to the management of haz-ardous and nonhazardous wastes, respectively.
Hazardous Wastes
Any industrial facility that generates 100 kilo-grams of hazardous waste or 1 kilogramof acutely hazardous waste per month is
considered a “generator” and must managethose wastes in compliance with the require-ments of Subtitle C. A very important firstorder of business, then, is to determine whetheror not a given industrial facility qualifies as a“generator,” a situation that could change at anytime because of changes in raw materials used,production chemicals and other materials used,manufacturing processes, and even changes instate or federal laws and/or regulations.
RCRA defines hazardous wastes in terms ofspecific properties. According to RCRA, a solidwaste is hazardous if it meets one of three con-ditions and is not excluded from regulation as ahazardous waste:
1. Exhibits, on analysis, any of the character-istics of a hazardous waste
2. Has been named a hazardous waste andappears on an appropriate list
3. Is a mixture containing a listed hazardouswaste and any other solid waste material
RCRA has identified four characteristics that,if exhibited by a solid waste, designates it as ahazardous waste:
• Ignitable
• Corrosive
• Reactive
• Toxic
These four characteristics are described asfollows:
Ignitable
• A liquid, except aqueous solutions contain-ing less than 24% alcohol, that has a flashpoint of less than 60ºC (140ºF).
• A substance that is ignitable per Departmentof Transportation (DOT) regulations.
• An oxidizer per DOT regulations.
• Examples of ignitable substances are wastesolvents, paints, and some waste oils.
Corrosive
• An aqueous material having a pH less than2.0 or greater than 12.5.

202 Industrial Waste Treatment Handbook
• A liquid that corrodes steel at a rate greaterthan one-quarter inch per year at a tempera-
ture of 55o C (130o F).
• Examples of corrosive wastes are automo-bile battery acid and waste pickle liquorfrom the manufacturing of steel.
Reactive
• Reacts violently with water.
• Normally unstable and reacts violentlywithout detonating.
• Generates toxic gases, vapors, or fumes onmixing with water.
• Forms an explosive mixture with water.
• Contains cyanide or sulfide and generatestoxic gases, vapors, or fumes at a pH ofbetween 2.0 and 12.5.
• Capable of detonation if heated under con-finement or subjected to a strong detonatingforce.
• Capable of detonation at standard tempera-ture and pressure.
• Listed as a Class A or B explosive by DOT.
ToxicThe Toxic Characteristic Leaching Procedure(TCLP) test was developed as a method fordetermining whether a waste material, afterbeing placed in a landfill, would leach metalsor other substances at rates greater than whatwas considered acceptable. The TCLP testattempts to simulate “worst-case” landfillleaching conditions, where low pH precipita-tion (acid rain) would percolate down throughthe landfilled wastes and cause metals to dis-solve into solution.
In performing the TCLP test, the material tobe landfilled is first pulverized to particle sizesno larger than 1 mm in diameter. Then, 5.0grams of the solid phase of the waste is placedin a 500-ml beaker or Erlenmeyer flask; 96.5ml of “reagent water” (deionized water) isadded, the beaker or flask is covered with awatchglass, and the mixture is stirred vigor-ously for 5 minutes. This procedure is normally
carried out in a beaker, with a magnetic stirrerkeeping the granules of waste material sus-pended and well mixed with the reagent water.
After 5 minutes of stirring, the pH of themixture is determined. If the pH is below 5.0,the mixture is subjected to the specified extrac-tion procedure using “extraction fluid #1,” pre-pared by mixing 5.7 ml glacial acetic acid, 500ml of reagent water, and 64.3 ml 1N sodiumhydroxide. The pH of this mixture is 4.93 +0.05. If the pH of the mixture of pulverizedwaste and reagent water (after mixing for 5minutes) is higher than 5.0, the mixture is sub-jected to the specified extraction procedureusing extraction fluid #2, prepared by dilut-ing 5.7 ml glacial acetic acid to a volume of 1liter with reagent water. Extraction fluid #2 hasa pH of 2.88 + 0.05, is thus a stronger acidsolution than extraction fluid #1 (no sodiumhydroxide is added during preparation ofextraction fluid #2), and will more strongly dis-solve metals from the waste material.
It is very important that the instruction“cover with a watchglass” be followed becausecarbon dioxide gas will either escape from, ordissolve into, the mixture, causing the pH tochange and possibly resulting in the require-ment to use the stronger extraction solution.Analysts sometimes do not use the watchglassin order to enable leaving pH probes in themixture during the stirring process.
After the extraction process has been carriedout, the extract is analyzed for suspected orpossible substances. If the results of this analy-sis show that any of the substances are presentin the extract in an amount exceeding the pub-lished limit, the waste is deemed to be “hazard-ous” and must be handled and disposed of inaccordance with all the applicable hazardouswaste laws and regulations.
ExemptionsCertain materials under certain circumstanceshave been specifically exempted from havingto be handled and disposed of as hazardouswaste. When applicable conditions are met,these exempted materials can be handled anddisposed of as ordinary solid wastes.

Wastes Characterization 203
DelistingSome solid wastes can be removed from the“hazardous waste” category by going through aprocess that enables the waste to be “delisted.”Any generator or waste handler can petition theEPA to exclude a listed waste from regulationunder Subtitle C. The petitioner must prove tothe EPA that, because of facility-specific differ-ences in raw materials, processing, or otherfactors, the waste is not hazardous and will notpose a risk to persons, animals, or the environ-ment. If the EPA, after examining all otherfactors in addition to those cited by the peti-tioner, finds no reason for not delisting thewaste, the waste may be handled and disposedof as ordinary solid waste as regulated under 40C.F.R., Subtitle D. It is noted here that thedelisting process can be time consuming andexpensive. Delisting is typically sought forhigh-volume waste streams.
Cradle-to-Grave Manifesting
A significant requirement for all hazardouswastes subject to the regulations of Subtitle Cis that they be accompanied by a written docu-ment called a manifest. Figure 6-12 shows anexample of the standard form titled “UniformHazardous Waste Manifest.” The generator ofany hazardous waste must initiate the manifestby writing in the appropriate information. If thewaste is hauled away from the generator’sfacility by a second party, the hauler assumespossession of and responsibility for the mani-fest, although the generator retains a copy.Then, when the waste reaches the place of ulti-mate treatment, storage, or disposal (the grave)the manifest again changes hands, with thehauler retaining a copy.
As shown on the standard form presented inFigure 6-12, information contained on thecompleted manifest includes the following:
• Name and EPA identification number of thegenerator, the hauler(s), and the facilitywhere the waste is to be treated, stored, ordisposed
• U.S. EPA and U.S. DOT descriptions of thewaste
• Quantities
• Complete address of the treatment, storageor disposal facility
In addition, the manifest must certify that thegenerator has in place a program to reduce thevolume and toxicity of hazardous wastes, to thedegree that is economically practicable, asdetermined by the generator, and that the treat-ment, storage, or disposal method chosen bythe generator minimizes the risk to humanhealth and the environment.
Once the waste is delivered to the final placeof disposition (treatment, storage, or disposalfacility), the owner or operator of that facilitymust sign the manifest, retain a copy, andreturn a copy to the generator of that waste. If35 days pass from the date on which the wastewas signed for by the initial transporter and thegenerator has not received a copy of the mani-fest from the final site of disposition, the gener-ator must contact the initial transporter todetermine the fate of the waste. If 45 days passand the generator still has not received a copyof the manifest, the generator must submit anexception report.
Nonhazardous Solid Wastes from Industries
Some industrial solid wastes can be disposedof in municipal solid wastes landfill facilities(MSWLFs). The federal law that governs suchdisposal is contained in its entirety in 40 CFRpart 258. (Part 257 contains the provisions forhazardous wastes.) Within part 257, “industrialsolid waste” means solid waste generated bymanufacturing or industrial processes that isnot a hazardous waste regulated under SubtitleC of RCRA. Such waste may include, but is notlimited to, waste resulting from electric powergeneration, fertilizer/agricultural chemicalsproduction, food and related products or by-products production, inorganic chemicals man-ufacturing, iron and steel manufacturing,leather and leather products production,nonferrous metals manufacturing, organicchemicals production, plastics and resinsmanufacturing, pulp and paper manufacturing,
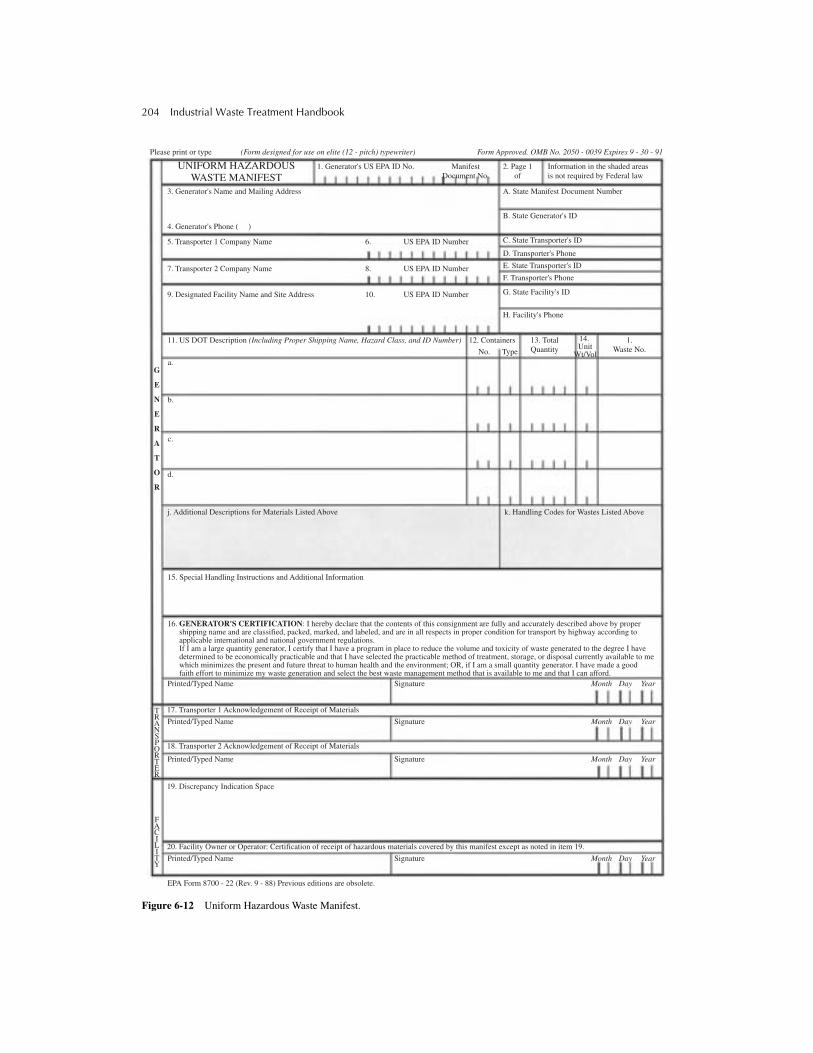
204 Industrial Waste Treatment Handbook
Figure 6-12 Uniform Hazardous Waste Manifest.
Please print or type (Form designed for use on elite (12 - pitch) typewriter) Form Approved. OMB No. 2050 - 0039 Expires 9 - 30 - 91
UNIFORM HAZARDOUSWASTE MANIFEST
1. Generator's US EPA ID No. ManifestDocument No.
2. Page 1of
Information in the shaded areasis not required by Federal law
3. Generator's Name and Mailing Address A. State Manifest Document Number
B. State Generator's ID
C. State Transporter's ID
D. Transporter's Phone
E. State Transporter's ID
F. Transporter's Phone
G. State Facility's ID
H. Facility's Phone
4. Generator's Phone ( )
5. Transporter 1 Company Name 6. US EPA ID Number
7. Transporter 2 Company Name 8. US EPA ID Number
9. Designated Facility Name and Site Address
11. US DOT Description (Including Proper Shipping Name, Hazard Class, and ID Number) 12. Containers
10. US EPA ID Number
No. Type
13. TotalQuantity
1.Waste No.
14.Unit
Wt/Vola.
b.
c.
d.
j. Additional Descriptions for Materials Listed Above
15. Special Handling Instructions and Additional Information
16.
Printed/Typed Name Signature Month Day Year
Signature Month Day YearPrinted/Typed Name
Signature Month Day YearPrinted/Typed Name
Signature Month Day YearPrinted/Typed Name
EPA Form 8700 - 22 (Rev. 9 - 88) Previous editions are obsolete.
17. Transporter 1 Acknowledgement of Receipt of Materials
18. Transporter 2 Acknowledgement of Receipt of Materials
19. Discrepancy Indication Space
20. Facility Owner or Operator: Certification of receipt of hazardous materials covered by this manifest except as noted in item 19.
k. Handling Codes for Wastes Listed Above
G
E
N
E
R
A
T
O
R
TRANSPORTER
FACILITY
GENERATOR'S CERTIFICATION: I hereby declare that the contents of this consignment are fully and accurately described above by propershipping name and are classified, packed, marked, and labeled, and are in all respects in proper condition for transport by highway according toapplicable international and national government regulations.If I am a large quantity generator, I certify that I have a program in place to reduce the volume and toxicity of waste generated to the degree I havedetermined to be economically practicable and that I have selected the practicable method of treatment, storage, or disposal currently available to me which minimizes the present and future threat to human health and the environment; OR, if I am a small quantity generator. I have made a good faith effort to minimize my waste generation and select the best waste management method that is available to me and that I can afford.

Wastes Characterization 205
rubber and miscellaneous plastic products man-ufacturing, stone, glass, and concrete productsmanufacturing, textile manufacturing, transpor-tation equipment manufacturing, and watertreatment. Not included are wastes resultingfrom mining or oil and gas production.
MSWLFs are required by Subtitle D regula-tions to have, as a minimum, a liner systemcomposed of a single composite liner that ispart of a leachate collection and removal sys-tem. A low-permeability cover must beinstalled when the landfill reaches maximumcapacity. In addition, a groundwater monitor-ing system must be used to detect liner failureduring the 30-year mandated post-closure careperiod.
States may promulgate laws and regulationsthat are more restrictive than the federal lawsand regulations. Again, the owner of the facil-ity is responsible for determining which set oflaws and regulations is the most restrictive andshould be used as the basis for design of dis-charge control equipment.
Bibliography
American Society for Testing and Materials, AStandard Guide for Examining the Incom-patibility of Selected Hazardous WasteBased on Binary Chemical Mixtures, Phila-delphia, Pennsylvania, 1983.
De Renzo, D.J., Solvent Safety Handbook,Noyes Publications, Park Ridge, NJ, 1986.
Dyer, J.C., A.S. Vernick, and H.D. Feiler,Handbook of Industrial Wastes Pretreat-ment, Garland STPM Press, New York,1981.
Flick, E.W., Industrial Solvents Handbook, 3rded., Noyes Publications, Park Ridge, NewJersey, 1985.
Grant, D.M., Open Channel Flow Measure-ment Handbook. Instrumentation SpecialtiesCo., Lincoln, Nebraska, 1979.
Harris, J.P., and S.A. Kacmar, “Flow Monitor-ing Techniques in Sanitary Sewers,” Deedsand Data, Water Pollution Control Federa-tion, July 1974.
Higgins, I.J., and R.G. Burns, The Chemistryand Microbiology of Pollution, AcademicPress, New York, 1975.
Jain, R.K., L.V. Urban, G.S. Stacey, andH.E. Balbach, Environmental Assessment,McGraw-Hill, New York, 1993.
Leupold and Stevens, Inc., Stevens WaterResources Handbook, Beaverton, OR, 1975.
The Merck Index, 9th ed., Merck and Co., Inc.,Rahway, New Jersey, 1976.
Merrill, W.H. Jr., “Conducting a Water Pollu-tion Survey,” Plant Engineering, October 15,1970.
Merrill, W.H. Jr., “How to Conduct an InplantWastewater Survey,” Plant Engineering, Jan-uary 7, 1971.
Sax, N.I., Dangerous Properties of HazardousMaterials, 6th ed., Van Nostrand Reinhold,New York, 1984.
Shelley, P.E, Sampling of Wastewater, U.S.Environmental Protection Agency, Technol-ogy Transfer, June 1974.
Shelley, P.E., An Assessment of AutomaticSewer Flow Samplers, U.S. EnvironmentalProtection Agency, Office of Research andMonitoring, EPA-R2-73-261, June 1973.
Shelley, P.E., and G.A. Kirkpatrick, “SewerFlow Measurement—A State of the ArtAssessment,” EPA 60012-75-027, 1975.
Sittig, M., Handbook of Toxic and HazardousChemicals and Carcinogens, 2nd ed., NoyesPublications, Park Ridge, New Jersey, 1985.
Sittig, M., Priority Toxic Pollutants—HealthImpacts and Allowable Limits, Noyes Publi-cations, Park Ridge, New Jersey, 1980.
Standard Methods for the Examination ofWater and Wastewater, 20th ed., AmericanPublic Health Association, New York, 1998.
Thompson, R.G., “Water-Pollution Instrumen-tation,” Chemical Engineering, June 21,1976, pp. 151–154.
U.S. Department of the Interior, Methods forCollection and Analysis of Water Samplesfor Dissolved Minerals and Gases, Tech-niques of Water Resources Investigations ofthe United States Geological Survey, Book5, Chapter Al, 1970.

206 Industrial Waste Treatment Handbook
U.S. Department of the Interior, Bureau ofReclamation, Water Measurement Manual,Denver, Colorado, 1979.
U.S. Environmental Protection Agency, Man-ual of Methods for Chemical Analysis ofWater and Wastes, Methods Developmentand Quality Assurance Research Laboratory,National Environmental Research Center,Cincinnati, Ohio, 1974.
U.S. Environmental Protection Agency,Method for Chemical Analysis of Water andWaste, EPA 600/4-79/020, Washington,D.C., 1979.
U.S. Environmental Protection Agency,“Announcement of the Drinking WaterContaminant Candidate List,” 63 FR 10273,U.S. Government Printing Office, Washing-ton, D.C., March 1998.
U.S. Environmental Protection Agency, “Des-ignation of Hazardous Substances,” Code ofFederal Regulations, Title 40, Part 116, U.S.Government Printing Office, Washington,D.C., 1980.
U.S. Environmental Protection Agency,“Drinking Water Program Redirection Strat-egy,” Office of Water, EPA 810-R-96-003,Washington, D.C., June 1996.
U.S. Environmental Protection Agency, “Gen-eral Provisions for Effluent Guidelines andStandards,” Code of Federal Regulations,Title 40, Part 401, U.S. Government Print-ing Office, Washington, D.C., 1997.
U.S. Environmental Protection Agency,“Guidelines Establishing Procedures forAnalysis of Pollutants,” Code of FederalRegulations, Title 40, Part 136, U.S. Govern-ment Printing Office, Washington, D.C.,1979.
U.S. Environmental Protection Agency, “Haz-ardous Waste Management System:General,” Code of Federal Regulations, Title40, Part 260, U.S. Government PrintingOffice, Washington, D.C., 1980.
U.S. Environmental Protection Agency, “Iden-tification and Listing of Hazardous Waste,”Code of Federal Regulations, Title 40, Part261, U.S. Government Printing Office,Washington, D.C., 1980.
U.S. Environmental Protection Agency,“Interim Status Standards for Owners andOperators of Hazardous Waste Treatment,Storage, and Disposal Facilities,” Code ofFederal Regulations, Title 40, Part 265, U.S.Government Printing Office, Washington,D.C., 1987.
U.S. Environmental Protection Agency,“National Primary Drinking Water Regula-tions,” Code of Federal Regulations, Title40, Part 141, U.S. Government PrintingOffice, Washington, D.C., 1975.
U.S. Environmental Protection Agency,“National Secondary Drinking Water Regu-lations,” Code of Federal Regulations, Title40, Part 143, U.S. Government PrintingOffice, Washington, D.C., 1988.
U.S. Environmental Protection Agency, “Stan-dards Applicable to Transporters ofHazardous Waste,” Code of Federal Regula-tions, Title 40, Part 263, U.S. GovernmentalPrinting Office, Washington, D.C., 1986.
U.S. Environmental Protection Agency, “ToxicPollutant Effluent Standards,” Code of Fed-eral Regulations, Title 40, Part 129, U.S.Government Printing Office, Washington,D.C., 1977.
U.S. Environmental Protection Agency, “Stan-dards Applicable to Generators ofHazardous Waste, “Code of Federal Regula-tions, Title 40, Part 262, U.S. GovernmentPrinting Office, Washington, D.C., 1980–1987.
U.S. Environmental Protection Agency, AMethod for Determining the Compatibility ofHazardous Wastes, Office of Research andDevelopment, EPA 60012-80/076, Cincin-nati, Ohio, 1980.
U.S. Environmental Protection Agency, Analyt-ical Methods for Determination of AsbestosFiber in Water, Washington, D.C., 1983.
U.S. Environmental Protection Agency, Hand-book for Monitoring Industrial Wastewater,Technology Transfer, August 1973.
U.S. Environmental Protection Agency, Hand-book for Monitoring Industrial Wastewater,Technology Transfer, Washington, D.C.,1973.
Wastes Characterization 207
U.S. Environmental Protection Agency, Hand-book for Sampling and Sample Preservationof Wastewater, EPA 60014-82/029, Washing-ton, D.C., 1982.
U.S. Environmental Protection Agency, Hand-book for Sampling and Sample Preservationof Water and Wastewater, Office of Researchand Development, Environmental Monitor-ing and Support Laboratory, EPA 60014-82/029, Cincinnati, Ohio, 1982.
U.S. Environmental Protection Agency, Micro-biological Methods for Monitoring theEnvironment, EPA 60018-78/017, Washing-ton, D.C., 1978.
U.S. Environmental Protection Agency, Officeof Public Awareness, “Hazardous WasteInformation,” SW-737, Washington, D.C.,1980.
U.S. Environmental Protection Agency, Officeof Water and Waste Management, “Hazard-ous Waste Information—Identification andListing,” SW-850, Washington. D.C., 1980.
U.S. Environmental Protection Agency, Officeof Water and Waste Management, “Hazard-ous Wastes Information—Transporters,”SW-830, Washington, D.C., 1980.
U.S. Environmental Protection Agency, Officeof Water and Waste Management, “Hazard-ous Waste Information—Facility Permits,”SW-852, Washington, D.C., 1980.
U.S. Environmental Protection Agency, Officeof Water and Wastes Management,
“Hazardous Wastes Information—Genera-tors,” SW-839, Washington, D.C., 1980.
U.S. Environmental Protection Agency, Sam-plers and Sampling Procedure for HazardousWaste Streams, EPA 60012-80/018, Wash-ington, D.C., 1980.
U.S. Environmental Protection Agency, Sam-pling and Analysis Procedure for Screeningof Industrial Effluents for Priority Pollutants,Effluent Guidelines Division, Washington,D.C., 1977.
U.S. Environmental Protection Agency, TestMethods for Evaluating Solid Waste—Physi-cal/Chemical Methods, 2nd ed., SW-846,Washington, D.C., 1985.
U.S. Environmental Protection Agency, WaterQuality Standards Handbook, Second Edi-tion., EPA 823-B-94-005a, Washington,D.C., 1994.
U.S. Environmental Protection Agency, “Stan-dards for Owners and Operators of HazardousWaste Treatment, Storage, and DisposalFacilities,” Code of Federal Regulations, Title40, Part 264, U.S. Government PrintingOffice, Washington, D.C., 1980–1987.
Vernick, A.S., “How to Conduct a WastewaterSurvey,” Plant Engineering, July 7, 1977.
Vernick, A.S., “How to Conduct a WastewaterSurvey,” Plant Engineering, August 4, 1977.
Weiss, G., Hazardous Chemical Data Book,2nd ed., Noyes Publication, Park Ridge,New Jersey, 1986.

208
7 Pollution Prevention
Wastes minimization has been a primary objec-tive of wastewater, air discharge, and solidwastes management since the earliest days ofindustrial wastes treatment. Many academicprograms have taught, either overtly or inad-vertently, that the first duty of an environmentalengineer is to reduce, to an absolute minimum,those pollutants that require treatment beforedischarge. The ultimate goal, of course, is“zero discharge,” as required in the UnitedStates by the 1972 amendments to the CleanWater Act (Public Law 92-500).
What has not been included in many of theenvironmental engineering curricula is the con-cept of decreasing overall costs with a conse-quent increase in profitability as a result ofreducing wastes generation. During the 1980s,the U.S. Congress authorized in-depth studiesof the financial impacts on U.S. businesses andindustries of wastes minimization and otheractivities related to reducing the quantity ofpollutants released to the environment. Theresult was the development of the concept ofpollution prevention.
Pollution prevention includes all of theaspects of wastes minimization, whereby pol-lutants are generated during the manufacturingprocess, plus all of the effects of the productthroughout its life cycle from initial productdevelopment to final disposal. Minimization ofthe flows and loads, and especially the toxicity,of wastes discharged from any industrial facil-ity to the atmosphere, the nation’s water bod-ies, or the land are to be considered in allcontexts of the life cycle of any given product.Existing processes and facilities must minimizeflows and loads wherever possible, and non-toxic substances must be substituted for toxicsubstances wherever possible.
The “findings and policy” that resulted fromthe investigative work on these matters is statedin Chapter 133, “Pollution Prevention,” of Title42 of the United States Code of Federal
Regulations, and is quoted (as of January 2000)as follows.
§ 13101. Findings and Policy
FindingsThe Congress finds that:
1. The United States of America producesmillions of tons of pollution and spendstens of billions of dollars per year con-trolling this pollution.
2. There are significant opportunities forindustry to reduce or prevent pollution atthe source through cost-effective changesin production, operation, and raw materi-als use. Such changes offer industrysubstantial savings in reduced raw mate-rial, pollution control, and liability costs aswell as help protect the environment andreduce risks to worker health and safety.
3. The opportunities for source reductionare often not realized because existingregulations, and the industrial resourcesthey require for compliance, focus upontreatment and disposal, rather thansource reduction; existing regulations donot emphasize multi-media managementof pollution; and businesses need infor-mation and technical assistance toovercome institutional barriers to theadoption of source reduction practices.
4. Source reduction is fundamentally differ-ent and more desirable than wastemanagement and pollution control. TheEnvironmental Protection Agency needsto address the historical lack of attentionto source reduction.
5. As a first step in preventing pollutionthrough source reduction, the Environ-mental Protection Agency must establish

Pollution Prevention 209
General Approach
Whenever a pollution prevention program isimplemented in an existing industrial facility,whether for its own sake or because of chang-ing discharge requirements, or the need forsignificant upgrade or retrofit work on the end-of-pipe treatment system, the general approachthat has become recognized as standardincludes the following key elements:
1. Unequivocal support from top management2. An explicit scope and clear objectives3. An accurate cost accounting system4. A companywide philosophy of waste
minimization5. An effective technology transfer program
Support from Top Management
Any program as far-reaching and all-inclusiveof the raw materials, equipment, wastes, andproducts as a pollution prevention programmust have the enthusiastic, active support ofthe top managers of an industrial facility inorder to succeed. In cases when top manage-ment has assigned or delegated the“responsibility” for wastes reduction or anothercomprehensive endeavor, little real progresshas resulted. There have been numerousattempts to institute wastes minimization pro-grams in the absence of overt support from topmanagement. Typically, significant progress ismade soon after implementation of a program,only to gradually reverse and revert to formerwastefulness and inefficiency. The unequivocaland visible support of top management, to thepoint where those who are instrumental inhelping the program succeed are rewarded andthose who hinder progress are penalized, is
a source reduction program, which col-lects and disseminates information,provides financial assistance to States,and implements the other activities pro-vided for in this chapter.
Policy
The Congress hereby declares it to be thenational policy of the United States that pol-lution should be prevented or reduced at thesource whenever feasible; pollution that can-not be prevented should be recycled in anenvironmentally safe manner, whenever feasi-ble; pollution that cannot be prevented orrecycled should be treated in an environmen-tally safe manner whenever feasible; anddisposal or other release into the environmentshould be employed only as a last resort andshould be conducted in an environmentallysafe manner.
During the 1990s, it became well-estab-lished that conscientious application of pollu-tion prevention, including all of theinfluences and activities and their costs,resulted in increased profitability to industriesand the business community as a whole,rather than a net cost. Environmental engi-neers, environmental scientists, and all othersin the field of environmental protection areobliged to bear this message to clients, regu-lators, the business community, and the gen-eral public. It must be realized that emissionsof all forms (i.e., water pollutants, air pollut-ants, or solid wastes) are, in fact, materialsthat have been paid for as raw materials, andthat the emission represents an actual loss.The cost of environmental protection cannotbe viewed as simply the cost to treat and dis-pose. It is the net cost (or, rather, the net resultof complete accounting) after completeaccounting for costs and savings resultingfrom recycle and reuse and costs notexpended for treatment and disposal. Forinstance, a pound of hydrocarbon that mighthave gone out the stack at a power-generatingstation was previously paid for as a pound ofcoal or oil. If it can be for as a pound of coal
or oil. If it can be captured and burned, ratherthan lost as a consequence of less than 100%combustion performance of the burner, thecost for a pound of fuel is saved plus the costfor treating to prevent the hydrocarbon frombeing emitted from the stack and becomingair pollution.

210 Industrial Waste Treatment Handbook
required to make the paradigm shifts that areneeded to implement an effective pollution pre-vention program.
The key to gaining enthusiastic support ofthe top management of an industrial facility isto educate those top managers regarding poten-tial increased profitability. Managers must betaught that emissions of “pollutants” are moreproperly regarded as lost materials that havebeen paid for. Once pollutants are placed on theaccounting ledger as lost resources, theirreduction shows up as a smaller loss. Managersmust also be coached into realizing that thecosts for treatment and disposal of pollutantsdecreases as the quantity and especially thetoxicity of those pollutants decreases. Again,environmental management professionals mustcarry this message forward and spearhead theparadigm shift from pollution control as a bot-tomless pit of expense to pollution preventionas a way to increase company profits.
Explicit Scope and Clear ObjectivesA clear road map is needed by anyone travelingin unfamiliar territory to ensure that the correctturns are taken and that the travelers do not getlost. Pollution prevention, unfortunately, doesnot come naturally to everyone involved inindustrial production. If it did, the pollutionprevention initiative would not exist; it wouldbe unnecessary.
Significant work is involved in developingan explicit scope for a pollution prevention pro-gram. In fact, it is best to go through, step bystep, at least two successive times, the entireprogram initially envisioned, in order todevelop the scope. The first time throughreveals activities that are more difficult thanoriginally thought and opportunities for wastesminimization that were not thought of duringconcept development. The second iteration isneeded as a check on feasibility, value, andcompleteness.
It is critically important that all of the“stakeholders” be actively involved in develop-ment of the scope. The worst approach is foran individual to be assigned the task of devel-oping the scope. Not only will it forever be
regarded as that individual’s demands on theother stake-holders, but worse, the individualassigned the task may not be sufficiently famil-iar with the industrial processes that createthe pollutants as, say, the superintendent ofproduction would be. The entire cast of stake-holders includes all those managers whosework influences the quantity and characteris-tics of wastes produced. Each and all of thosestakeholders must be involved in developingan explicit scope and clear objectives of thepollution prevention program for their facility.The team of stakeholders must be completelycross-functional, thus representing all of theactivities at the facility that in any way affectthe quantity and characteristics of wastes pro-duced. At a typical industrial facility, thestakeholders would include:
• The plant manager
• Middle management
• Operations managers
• Engineering
• Maintenance
• Purchasing
• Environmental management
• Operators of waste treatment systems
The following example explains how pur-chasing, for instance, can be directly involvedin the wastes minimization aspect of pollutionprevention. Purchasing is directly involved incommunicating with suppliers regarding pack-aging of items that are delivered to the indus-trial facility. On one end of the scale there arereturnable (and reusable) containers. On theother end of the scale are multilayered, nonre-cyclable packages characterized by excessivebulk that must all be discarded and disposed of.For instance, it is not unusual for electronicequipment to be delivered in plastic wrapping,surrounded by foam blocks, packed inside abox, covered by paper, covered in turn by plas-tic, and all bound by plastic or metal strapping.In many cases, purchasing agents must beguided to “think outside the box” (so to speak)and to demand packaging from suppliers thatminimizes creation of solid wastes.

Pollution Prevention 211
After a detailed scope has been worked out,a clear set of objectives for the pollution pre-vention program can be developed. Here, it isimportant to shoot high, but not so high asto intimidate those who will carry out theprogram. It is imperative that the stated objec-tives can be understood, achieved, and evalu-ated by readily understood measurements andcomparisons.
Once a clear set of objectives has beendeveloped and measurement methods deter-mined and agreed upon, action must begin andbe sustained. Measurements that are trulyindicative of success or failure must betaken. “What gets measured gets done” is agood guiding rule. A meaningful reward sys-tem should be implemented to acknowledgesuccess and to encourage continuousimprovement.
Accurate Cost Accounting SystemFor a pollution prevention program to be suc-cessful, prevailing attitudes that wastesreduction and environmental compliance costmoney and cut into company profits must bereplaced with an understanding that a well-designed and executed pollution preventionprogram can reduce costs, add value to theproduct, and thus bolster company profits. Anaccounting system that can accurately track allthe true costs of production, distribution, andfinal disposal of the product, as well as thecosts of handling and disposal of all wastes(i.e., solid, liquid, and air), is essential to con-vince both management and production peopleof the true value of a pollution preventionprogram.
In order to enable advantageous applicationof an accurate cost accounting system, an accu-rate materials balance inclusive of the entirelife history of a product is needed. Althoughthis may seem a daunting task, and costly initself, a materials balance is a necessary ingre-dient in the total picture of cost effectiveness. Itis another example of an investment that leadsto significant savings in the long run.
Another necessity is establishing a base-linefrom which to evaluate the degree of success
or failure of the pollution prevention program.Whatever accounting system is agreed uponmust be applied to the facility before imple-mentation of the pollution prevention program.The cost accounting system must also beapplied at regular intervals in order to keeptrack of progress, or lack of progress.
Employing activity-based costing (ABC) toevaluate the degree of success or failure of agiven pollution prevention program has beenfound to be highly advantageous. ABCinvolves meticulous identification of each ofthe cost items within the general ledger thatare related in any way to a given activity. Forexample, in identifying all costs related topollution prevention, the costs for chemicalsused in wet scrubbers are identified. Wetscrubbers are part of the air pollution controlsystem; they are, therefore, part of the overallpollution control system, and thus are part ofthe pollution prevention program. As anotherexample, the proportion of each person’s timespent performing duties related to pollutioncontrol is determined. Then, that proportion ofthe individual’s salary and benefits is allo-cated to the pollution prevention program.
Companywide Philosophy of Waste MinimizationIn addition to the absolute requirement forunequivocal support from top management fora pollution prevention program to succeed, it isequally important that everyone involved inreceiving, preparation, production, packaging,storage, and shipping believe in wastes mini-mization as a necessary component to thefinancial success and thus the security of theirjobs. As explained later, a pollution preven-tion program consists of active wastesminimization at each stage of the life of aproduct, from initial development, throughmanufacturing, and on to final disposal of theproduct at the end of its life. Every personinvolved in every stage of the product has aninfluence on the efficiency of use of raw mate-rials, leaks and spills, clean-up, and damageto raw materials, intermediate stages, orfinal product, and containment of wastes. A

212 Industrial Waste Treatment Handbook
pervasive, companywide belief in the directinfluence of a well-executed pollution preven-tion program on the security of each person’sjob is needed for success of the program.
An Active Technology Transfer ProgramNew technology is being developed andbrought to light through various publicationson a continuing basis. New and improvedtechniques and technologies for enhancingefficiencies in product production, materialshandling, substitution of nontoxic substancesfor toxic substances, and wastes handling anddisposal can significantly aid in furthering theobjectives of a pollution prevention program.Key participants in an industry’s pollutionprevention program should attend seminars,short courses, and regional and national meet-ings at which new techniques andtechnologies are presented. These key partici-pants should then hold in-house seminars andmeetings in which the new information isshared with other participants in the pollutionprevention program.
Source Reduction
There are two types of wastes minimizationthat should take place at the source of theirgeneration to further the goals of a pollutionprevention program:
1. Minimize the total quantity, or mass, ofwastes.
2. Minimize the toxicity of wastes.
In general, reduction of wastes, both inquantity and toxicity, at the source is done bythorough and intense application of the follow-ing techniques:
• Immaculate housekeeping
• Substitution of nontoxic substances fortoxic substances
• Changing manufacturing processes and/orequipment
• Recycle (and reuse)
• Waste exchanges
Immaculate HousekeepingThe adjective “immaculate” is used here toemphasize that extra effort, beyond the daily“good” category, is required to achieveand maintain the levels of performance inhousekeeping that are expected for an effectivepollution prevention program. Constant atten-tion must be given to avoiding leaks throughpreventive maintenance before they occur.Spills must be minimized and cleaned upimmediately if they occur (then an analysisshould be conducted to determine why the spilloccurred, followed by action taken to preventthe same type of spill from occurring again),and procedures must be developed wherebyspills are cleaned using as little water as possi-ble. Also, spill containment and isolationtechniques must be devised and continuallyimproved.
A key characteristic of “immaculate” house-keeping is that no leak, spill, or correctableinefficiency occurs more than once. An effec-tive program must be in place, whereby eachundesirable occurrence is reported, analyzed,its cause determined, and a corrective actiondevised and implemented.
Substitution of MaterialsThere are many, many instances where non-toxic substances can be substituted for toxicsubstances in industrial processes. Many moresubstitutions will be available in the future, asresearch and development efforts producealternatives to former processes that use toxicmaterials. Keeping up with these new develop-ments is the purview of the technology transferprogram, described previously.
A few highly successful examples of non-toxic or less toxic materials replacing toxicmaterials throughout industry are as follows:
• The use of ozone, rather than chlorine diox-ide, to bleach wood pulp.
• The use of alcohol rather than acid forpickling in the manufacture of copperwire.
• The use of ozone or ultraviolet light ratherthan chlorine for disinfection.

Pollution Prevention 213
• The use of water-based rather than oil-basedpaints. (Eliminates the need for hydrocar-bons for clean-up.)
• The use of nonphenolics containing indus-trial detergents rather than those that containphenolics.
• The use of water-soluble cleaning agentsrather than organic solvents.
Changing Manufacturing Processes and/or EquipmentMany products can be manufactured by use oftwo or more alternative processes. Often, oneof the process types involves the use of sub-stances of less toxicity than the others. Inaddition, within any single process type, thereis usually a choice to make among severalsources for the equipment, and one type maybe more desirable from a pollution preventionstandpoint than others. For instance, an item ofequipment that is air-cooled might perform aswell as an item that is water-cooled, and wouldthus preclude the need to discharge wastedcooling water. Of course, it should be ascer-tained that the air used to cool the equipmentwould not become degraded in quality before adecision is made regarding replacement.
In cases where equipment is old, worn, andsubject to leaks, spills, and inefficient use ofmaterials, it might be cost effective to replaceit, based on the savings in cost of materials,cost of operation, and cost of handling and dis-posing of the wastes. Here, again, a compre-hensive and accurate materials balance aroundthe entire life cycle of the product, from initialdevelopment to final disposal, is needed tomake the correct decisions.
Cleaning is one of the processes within anindustrial system that almost always produceswastes that must be handled and disposed of.Often, the clean-up wastes contain the samesubstances as the production wastes, plus what-ever substances the cleaning agent(s) are com-posed of.
Recycle (and Reuse)Parentheses are placed around the words “andreuse” here because, although it is recognized
that these words have traditionally been used inconjunction with recycle, it is difficult to imag-ine allowing recycled process water, forinstance, to simply pile up after being recycled,for want of being reused. At any rate, recyclingof process materials, such as water, after non-consumptive use in one or more processes, iscertainly superior to once-through use.
Even if some degree of treatment is requiredbefore a second or many reiterative uses, thatmay be much less costly than the once-through-use approach. The quality of water, in terms ofconventional and/or priority or other pollutants,may not need to be nearly as “good” for theindustrial process as for discharge within com-pliance regarding an NPDES or other permit.Therefore, treatment for recycle purposes mightbe less costly than treatment for discharge.
Additionally, if the plant’s freshwater supplyhas to be treated before use in the process, itmight be less expensive to treat the wastewaterand reuse it rather than treat the wastewater fordischarge, in addition to treating more freshwater for once-through use.
There is a limit to the extent to which water,or any other substance, can be recycled becausewater evaporates and leaves non-volatile sub-stances, such as salts, behind. The result is thatnonvolatile substances build up, increasing oneor more undesirable characteristics such as cor-rosivity and/or scaling.
Example 7-1 illustrates a methodology fordetermining the rate of blow-down required tomaintain a minimum desired level of waterquality for the water undergoing recycle forreuse.
Example 7-1:The schematic diagram presented in Figure 7-1shows a water recycle loop in use at a factory.There is a treatment system for removal oforganics and TSS; however, dissolved inorgan-ics, such as chlorides, are not removed. Thesedissolved inorganics, therefore, build up in therecycle loop and can be prevented from build-ing to above a desired maximum concentrationonly by use of a blow-down, also illustrated inFigure 7-1.

214 Industrial Waste Treatment Handbook
Figure 7-1 Example of a water recycle loop with treatment and blow-down.
Problem:
For a blow-down rate of 10%, calculate theequilibrium concentration of chloride ion in thewater in the recycle loop, given the followinginformation:
• Total volume of water in the entire factoryrecycle loop, including the in-line treatmentsystem, equals 1.0 million gallons.
• Chloride ion (Cl−) concentration in raw
water supply equals 10 mg/L as Cl−.
• Chloride ion (Cl−) added by factory equals90.5 lb/day.
• Zero mg/L Cl− removed by in-linetreatment.
• Blow-down equals 10% equals 100,000gpd.
• Evaporative loss equals 5% equals 50,000gpd.
Solution:
Chloride in system on first day:
10 mg/L × 8.34 × 1.0 = 83.4 lbs
Chloride added each day in makeup water:
10 mg/L × 8.34 × (0.1 + 0.05) = 12.5 lb/day
Chloride removed each day via blow-down:
X mg/L × 8.34 × 0.1 = 12.5 + 90.5 = 103 pounds
The concentration, X, of chloride ion in theblow-down must equal the concentration (x) inthe recycle loop:
X = = 123 mg/L
Segregation of Waste Streams
In many cases it is advantageous to isolate one(or more) waste streams in an industrial plantand treat it separately from the other wastestreams (i.e., gaseous, liquid, or solid, as thecase may be) rather than allowing it to mixwith other waste streams before treatment. Thesegregated waste stream can then be treatedand recycled, mixed with other treated efflu-ents for discharge to the environment, or
1038.34 0.1×------------------------

Pollution Prevention 215
discharged separately. The following areamong many advantages of wastes segregation:
• Many substances are readily removed byspecialized techniques when they are in therelatively pure and relatively concentratedstate but are difficult to remove after beingmixed with other substances and dilutedby being mixed with other waste streams.For instance, certain organics such aschlorophenols that are very slowly biode-gradable are efficiently removed by activatedcarbon. Treating a waste stream containingthese substances at the source may well bemore cost effective than mixing with othersubstances that are biodegradable and ontheir way to a biological treatment system.
• There is more likelihood of producing ausable by-product from a segregated, rela-tively pure waste stream.
• There is more likelihood that the stream canbe recycled if it has not been mixed withother waste streams.
• The segregated stream can be treated on abatch basis, or other campaign basis,depending on the operating schedule of theprocess.
Selective Mixing of Waste StreamsA variation of the wastes segregation approach,selective mixing of certain waste streams cantake advantage of commonality in compatibil-ity to certain treatment processes. Also, acidwaste streams can be mixed with caustic wastestreams for mutual neutralization before addi-tional treatment.
Waste ExchangesOne industry’s waste might be a valuableresource for another. For instance, waste acidfrom one industry might be suitable either for aprocessing step or for neutralization of causticwastes from another industry. Participation inwaste exchanges is an attractive alternative towastes treatment and disposal. Many networksof business are constantly seeking uses forthe wastes they generate. In addition, waste
exchange brokers may be operating in a givenindustry’s geographic area.
The Waste Audit
Whereas an environmental audit (Chapter 6)assesses a company’s compliance (or risk ofnoncompliance) with environmental regula-tions, and a waste minimization audit assessesopportunities to improve materials utilizationefficiency at an operating industrial facility orindividual process, a waste audit is a morecomprehensive program, conceived todetermine each source at which hazardouswastes are generated, from product develop-ment through manufacturing, use of theproduct, and through to the end of the life ofthe product. The general approach of a wastesaudit has two phases. The first is to identify andquantify the types of waste generated and toanalyze the manner in which those wastes aregenerated. The second phase involves perform-ing a materials balance on each of thosesources and to determine alternatives for reduc-ing or eliminating those wastes and to analyzethe benefits and costs of each alternative. Thefollowing step-by-step process outlines thesequence of a wastes audit program.
Phase I
1. Identify the hazardous substances involvedin the life cycle of the product beinganalyzed.
2. Identify all wastes or emissions (i.e., air,liquid, and solid) from initial productdevelopment through manufacturing tofinal disposal of product.
3. Identify each waste stream at each stage ofthe life of the product.
4. Identify the sources of these hazardoussubstances.
Phase II
1. Quantify each source and perform a com-prehensive materials balance around eachstage of the life of the product.

216 Industrial Waste Treatment Handbook
2. Prioritize the sources.3. Analyze the technically and economically
feasible alternatives for eliminating orminimizing those source waste streams by:
a. elimination of the sourceb. substitution of nonhazardous for haz-
ardous substancesc. improved housekeeping d. increased efficiency of use of
materials
4. Perform a life cycle cost-benefit analysison the complete set of feasible alternatives.
Summarized Procedure for Achieving Reduction of Wastes at the SourceFigure 7-2 presents a flowchart that summa-rizes a methodology for achieving effectivereduction of wastes at the source. This flow-chart is a modified version of the flowcharttitled “The Waste Minimization Procedure,”presented in the EPA’s Waste MinimizationOpportunity Manual.
Once a need to minimize wastes is fully rec-ognized by top management, the focus ofwastes discharge reduction is moved from theend-of-pipe treatment back into the process andprocess equipment within the plant. Here, theterm “end of pipe” is expanded to include airand solid wastes streams as well as wastewater.The next step is to embrace the principles ofpollution prevention, which moves the focusanother level to include all contributions ofwastes to all environmental media (i.e., air,water, land) from initial phases of productdevelopment, through manufacturing, to finaldisposal of the product.
The planning and organization stage may beinitiated by staff personnel or top management.Whichever is the case, the first requirement isto obtain the unequivocal commitment and sup-port of top management. The required result ofthe planning and organization stage is anexplicit scope and a clear set of objectives forthe waste minimization or source reductionprogram.
The assessment process can begin only afterthe Assessment Program Task Force has
completed organization of the process itselfand has obtained unequivocal commitment toproceed. The assessment program and the sub-sequent stage, “feasibility analysis,” follow thegeneral procedure outlined previously for awastes audit.
The product of the wastes audit is a finalreport presenting details, data, and results of thewastes audit procedure. The feasible optionsshould be discussed in detail, including a fulldescription of each option, the requirements forimplementation, and the costs and benefits.Implementation of the option or options finallyagreed upon must include a thorough and accu-rate performance evaluation. An accurate costaccounting system must be in place for this pro-cess to produce results of value.
Benefits of Pollution Prevention
In addition to satisfying key policy require-ments of federal and state regulatory agencies,an effective pollution prevention program canhave major benefits. A new look at existing andtraditional production methods can lead toimprovements in production efficiencies,reduced costs for treatment and disposal, andreduced risk. Other benefits can include thefollowing:
• Reduced liability as a potentially responsi-ble party (PRP) at off-site final disposallocations
• Improved relations with customers seekingassociations with environmentally con-scious or “greener” suppliers
• Improved public image
• Increased production capacity
• Reduced costs for handling and storage ofwastes
Bibliography
Miller, H., “In-Plant Water Recycling—Indus-try’s Answer to Shortages and Pollution,”Design News—Original Equipment Manufac-turer (OEM), November 5, 1973, pp. 81–88.

Pollution Prevention 217
Figure 7-2 Procedure to assess and implement source reduction.
The recognized need to minimize waste
Adopt the principles of pollution prevention
PLANNING AND ORGANIZATION
• Get commitment from top management• Set overall assessment program goals• Organize assessment program task force• Develop scope and objectives
ASSESSMENT
• Collect data on process, facility, use, and disposal• Develop materials balances• Prioritize and select assessment targets• Select people for assessment teams• Review data and inspect site• Generate options• Screen and select options for further study
FEASIBILITY ANALYSIS
• Technical evaluation• Economic evaluation• Select options for implementation
IMPLEMENTATION
• Justify projects and obtain funding• Installation (equipment)• Implementation (procedure)• Evaluate performance
Organization of assessment processand commitment to proceed
Final report, includingrecommended options
Repeat the process
Report ofselected options
WASTESAUDIT

218 Industrial Waste Treatment Handbook
Schmidheiny, S., Business Council for Sustain-able Development (BCSD), ChangingCourse: A Global Business Perspective onDevelopment and the Environment, MITPress, Cambridge, Massachusetts, 1992.
U.S. Environmental Protection Agency, RCRAWaste Minimization National Plan, EPA530-D-94-001, Washington, D.C., 1994.
U.S. Environmental Protection Agency, Sum-mary of the RCRA Hazardous WasteMinimization National Plan-Draft, EPA530-5-94-002, Washington, D.C., 1994.
U.S. Environmental Protection Agency, WasteMinimization National Plan, EPA 530-F-97-010, Washington, D.C., 1997.
U.S. Environmental Protection Agency, WasteMinimization Opportunity Assessment Man-ual, Hazardous Waste Engineering ResearchLaboratory, EPA 625n-881003, Cincinnati,Ohio, 1988.
U.S. Environmental Protection Agency, WasteMinimization—Environmental Quality withEconomic Benefits, EPA 530-SW-87-026,Washington, D.C., 1987.

219
8 Methods for Treating Wastewaters from Industry
General
Technologies for treating industrial wastewa-ters can be divided into three categories:chemical methods, physical methods, and bio-logical methods. Chemical methods includechemical precipitation, chemical oxidation orreduction, formation of an insoluble gas fol-lowed by stripping, and other chemicalreactions that involve exchanging or sharingelectrons between atoms.
Physical treatment methods include sedi-mentation, flotation, filtering, stripping, ionexchange, adsorption, and other processes thataccomplish removal of dissolved and undis-solved substances without necessarily chang-ing their chemical structures. Biologicalmethods are those that involve living organismsusing organic, or in some instances, inorganic,substances for food, completely changing theirchemical and physical characteristics.
Most substances found as pollutants inindustrial wastewaters can be categorized as towhether chemical, physical, or biological treat-ment should be the most appropriate. Forinstance, dairy wastewater should most appro-priately be treated by biological means becausethe bulk of the pollution load from a typicaldairy is organic material from whole milk,which is readily biodegradable. As a generalrule, biological treatment is more economicalthan any other type of treatment, when reason-ably complete treatment is required, and when-ever it can be made to work successfully.
It is often possible to make preliminaryselections of candidate treatment technolo-gies based on fundamental properties of thepollutants and experience. For instance, whenconsidering candidate treatment technologiesto treat wastewaters from a metal-platingoperation, any of the biological treatment
technologies would be inappropriate becausemetal ions are not biodegradable; however,both chemical precipitation, a chemical treat-ment technology, and ion exchange, a physi-cal treatment technology, should work well,based on the fundamental properties of thesubstances to be removed (dissolved inor-ganic cations and anions). The question thenreduces to a comparison between the advan-tages and disadvantages of these two technol-ogies, and experience provides much of theinformation appropriate to this evaluation.
For example, experience has shown that, formost metal-plating wastewaters:
1. Chemical precipitation is far less costlythan ion exchange; however,
2. Chemical precipitation is not reliablycapable of reducing metal concentrationsto less than 5 or so mg/L.
3. A principal reason for the previous point isthat the process of removing precipitatedmetals by settling in a clarifier typicallydoes not remove the very small particles ofprecipitate.
4. Sand (or other) filtration effectivelyremoves most of those particles of metalprecipitate that will not settle.
5. The concentrations of dissolved metalseven after chemical precipitation and sandfiltration are still no lower than 1 to 2 mg/L, at best. Furthermore,
6. Ion exchange can “polish” the effluentfrom chemical precipitation and sand fil-tration to very low concentrations (20 to50 ppb).
7. Ion exchange could do the entire job ofremoving metals from industrial wastewa-ter to very low concentrations withoutbeing preceded by chemical precipitationand sand filtration, but, usually, at a cost

220 Industrial Waste Treatment Handbook
much higher than for the three processes incombination.
It follows, then, that it would not be prudentto spend effort, time, and money to conduct alarge-scale investigation into technologies fortreating wastewaters from metal plating,beyond the line of thinking outlined previously.The pollutants in these wastewaters are notorganic, are, therefore, not biodegradable, andextensive experience has shown that:
1. Chemical precipitation is the most cost-effective method for removing the bulk ofthe dissolved metals.
2. Sand, diatomaceous earth, or other mediafiltration is the most cost-effective “nextstep” to follow the chemical precipitationprocess.
3. If still further reduction in metals concen-tration is required, ion exchange is the bestcandidate.
Having said that, it must now be said that, inmany cases, substances in certain metal-platingwastewaters require more than straightforwardalkaline precipitation, filtration, and ionexchange. For instance, if chelating agents arepresent, it may be necessary to destroy orotherwise inactivate them, in order to exposethe metal ions to the full effect of the precipi-tating anions. In other cases, if the concentra-tion of organic matter is high, it may interferewith the precipitation process and have to beremoved by biological or other treatmentbefore the metals removal steps.
Figure 8-1 presents a categorization of thecomponents of industrial wastewater and prelim-inary selections of treatment technologies, basedon the appropriateness of the mechanism of eachtechnology compared to the fundamental prop-erties of the pollutants. Different versions ofFigure 8-1 could be generated by beginning witha characterization other than dissolved or undis-solved; for instance, organic or inorganic, but allversions would ultimately result in the same listof appropriate treatment technologies.
In Figure 8-1, the first level of categoriza-tion of pollutant characteristics is that of dis-solved or undissolved state. For instance,
trichloroethylene as a pollutant in wastewaterwould be dissolved (albeit to only very lowconcentrations), organic, nonbiodegradable,and volatile. Candidate technologies, then,would be stripping, activated carbon adsorp-tion, and chemical oxidation.
Figure 8-2 presents a schematic of “the indus-trial waste system,” showing that raw materials,water, and air enter the system, and as a result ofthe industrial process(es), products and by-products exit the system, along with airbornewastes, waterborne wastes, and solid wastes.Because discharge permits are required for eachof the waste-bearing discharges, treatment sys-tems are required. Each of the treatment sys-tems has an input, the waste stream, and one ormore outputs. The output from any of the treat-ment systems could be an air discharge, a water-borne discharge, and/or a solid waste stream.
Principle and Nonprinciple Treatment Mechanisms
Most treatment technologies remove sub-stances other than the target substances. Forinstance, “biological treatment” can effectivelyremove a certain amount of metal ions fromwastewater. Because metal ions do not particu-larly like to be dissolved in water (they arehydrophobic), they are driven by the secondlaw of thermodynamics to be adsorbed on thesurface of solids—just about any solid—including activated sludge solids.
This mechanism for removing metals fromwastewater is often undesirable because thepresence of the metal ions in the waste sludgemay render the sludge unsuitable for a desireddisposal method. Composting with wood chipsto produce a horticultural soil conditioner is anexample. Another example is simple disposalin an ordinary municipal landfill. In otherinstances, the removal of metal ions by absorp-tion on biological solids from a wastewater thathas very low concentrations of them may serveas a fortuitous polishing step. In any case, bio-logical treatment is a “principle” technologyfor removing organics from wastewaters, andits unintended removal of metal ions is a “non-principle” mechanism.

Methods for Treating W
astewaters from
Industry221
Figure 8-1
Candidate treatm
ent technologies, based on fundamental characteristics of pollutants.

222Industrial W
aste Treatment H
andbook
Figure 8-2
The “industrial w
aste system.”

Methods for Treating Wastewaters from Industry 223
Waste Equalization
Among the most effective waste managementprocedures is equalization of the waste stream.Equalization can be of two types: flow equal-ization and constituent equalization. Flowequalization refers to changing the variations inrate of flow throughout the processing andclean-up cycles to a more steady flow rate thatis more nearly equal to the average flow ratefor that period. Constituent equalization refersto the concentration of the target pollutants inthe waste stream. Throughout the 24-hour day,the concentrations of individual constituents ina given industrial waste stream typically varyover wide ranges as processes are started up,operated, shut down, and clean-up takes place.Waste treatment systems that are designed forgiven ranges of concentration of target pollut-ants often do not perform well when thoseconstituents are in concentrations significantlydifferent from the design values.
Equalization can be either online, as dia-grammed in Figure 8-3(a), or offline, as dia-grammed in Figure 8-3(b). Online flowequalization is accomplished by allowing the
waste stream to flow into a basin. The waste isthen transferred from the basin to the treatmentsystem at a constant, or more nearly constant,rate. The basin must be sufficiently large that itnever overflows and must always containenough waste that it never becomes empty,causing the flow to the treatment system to stop.
As shown in Figure 8-3(b), offline equaliza-tion is accomplished by restricting the flowinto the treatment system by means of either aflow-regulating valve or a constant speed, posi-tive displacement pump. When there is excesswaste flow, it is directed to the equalizationtank. When there is insufficient flow, it is madeup from the equalization tank.
With respect to constituent equalization, off-line equalization can be used advantageouslywhen wastes generation at night is significantlyless than during the day. A portion of the strongdaytime wastes can be stored in the equaliza-tion facility, then directed to the treatment sys-tem at night. The treatment system can besignificantly smaller because it is not requiredto treat wastes at the high rate that they are gen-erated during the daytime.
Figure 8-3 Flow equalization configurations.
224 Industrial Waste Treatment Handbook
A certain amount of constituent equalizationwill take place as a consequence of flow equal-ization, but this amount will not be optimal.Flow equalization is best done within a cycle inwhich the equalization basin is close to over-flowing during highest flows and close toempty during lowest flow rates. Constituentequalization, in contrast, is best done by dilu-tion. There are several different approaches toconstituent equalization by dilution, rangingfrom dilution to a constant concentration of thetarget substance with clean water to simplyretaining the waste stream in a completelymixed basin of constant volume.
The following are alternative approaches toconstituent equalization:
1. Batch treatment. This is the ultimate inconstituent equalization. The processingand clean-up wastewaters are collected ina well-mixed basin that is large enough tocontain the entire processing and clean-upflows. Treatment can take place subse-quently, either in the same tank, or bybeing pumped at a constant rate through acontinuous flow treatment system.
2. Offline equalization tank. As describedpreviously, a portion of the flows contain-ing high concentrations of pollutants arediverted to an offline equalization basinand are mixed with less concentrated flowsat a later time.
3. Completely mixed, inline equalizationtank. A tank equipped with sufficient mix-ing capability to maintain completelymixed conditions and having sufficientvolume to hold the flow between peakhigh and low flow rates is the most com-mon type of constituent equalizationdevice. The larger the volume, the betterthe constituent equalization, but the higherthe cost to both construct, maintain, andmix. The tank is maintained full; therefore,flow equalization is not achieved by thisdevice.
4. Dilution with clean water or treated efflu-ent. Stormwater runoff, cooling water, orother previously used but clean water rela-tive to the wastewater being treated may
be used. Target substances that can readilybe measured with a probe and meter, suchas a specific ion probe and meter, are thebest candidates for this type of substanceequalization. This method of constituentequalization, of course, increases the totalflow through the treatment system.
As mentioned earlier, the principal value ofwaste equalization is that, in most cases, thetreatment system can be made smaller becausethe maximum values for both flow rate andconstituent concentration are reduced (methodNo. 4 is an exception). The treatment systemwill, therefore, have a lower capital cost aswell as lower operating and maintenancecosts; hence, by definition, a lower life cyclecost.
Flow EqualizationFigure 8-3(a) illustrates flow equalization bymeans of an online flow equalization basin.Flow into the basin is by gravity and varies asthe waste generation rate varies. Flow out ofthe basin to the treatment system is made con-stant by either an appropriate valve or apositive displacement pump. An aerator and/ora mixer are provided to prevent undesirableoccurrences such as settling out of solids orbiological activity that would result in anaero-bic conditions with consequent odor problemsor chemical or biological reactions that wouldchange the nature of the wastes.
The principal design parameter of a flowequalization basin is size. Because the cost ofthe basin is a direct function of its size, andbecause operation of the basin, in terms ofmaintaining complete mixing and aerobic con-ditions, is also a direct function of basin size,the flow equalization basin should be no largerthan necessary to accomplish the requireddegree of equalization.
Development of a “mass diagram” is anexcellent method for determining the requiredsize of a flow equalization basin. A mass dia-gram is developed by plotting accumulatedquantity of flow of the waste stream versustime.

Methods for Treating Wastewaters from Industry 225
A truly representative period may be oneday, one week, or even longer. Then, as illus-trated in Figure 8-4, the line that represents aconstant rate of flow for the accumulated vol-ume flowing at a steady rate over the totaltime period is drawn. Then, lines are drawnthat are (1) parallel to the line that representsthe average rate of flow and (2) tangential tothe mass diagram at points that are the maxi-mum distances above and below the averagerate of flow line. The storage volume requiredfor the equalization basin is that volume rep-resented by the vertical distance between thetwo tangent lines. In some cases, the massdiagram may be at all points below, or in
other cases, at all points above, the average rateof flow line. In these cases, only one tangentline will be drawn at the point on the mass dia-gram that is farthest from the average rate offlow line. The volume required for the equal-ization basin in these cases is that volumerepresented by the vertical distance betweenthe single tangent line and the average rate offlow line.
As with many other unit processes, it is usu-ally prudent to increase the size of the equaliza-tion basin by 10% to 20% over that determinedby the mass diagram method, to account forchanges in flow rate greater than experiencedwhen the data was taken for the mass diagram,
Figure 8-4 Mass diagram with illustration of the method used to determine the required volume of equalization basin.

226 Industrial Waste Treatment Handbook
or other uncertainties. In fact, the percentincrease in size should be inversely propor-tional to the degree of confidence the designengineer has in how accurately the dataobtained is representative of the full range ofconditions to be experienced by the treatmentsystem.
Example 8-1 illustrates the procedure fordetermining the size of a flow equalizationbasin. Example 8-2 illustrates how a flowequalization basin can significantly reduce thesize of treatment facility required for a givenindustrial facility.
Example 8-1: Flow Equalization
The flow of wastewater from a poultry pro-cessing plant is shown in the following table. Ifit is desired to pump this flow at a constant rateover a 24-hour day, what is the minimum sizerequired for an online flow equalization tank?
Hour Ending Cumulative flow,Thousands of gallons
0100 5
0200 11
0300 14
0400 20
0500 25
0600 31
0700 62
0800 120
0900 200
1000 240
1100 309
1200 320
Example 8-2:
Determine the size in terms of design flow rateof a dissolved air flotation (DAF) system totreat the wastewater described in Example 8-1:(a) without an equalization tank and (b) withthe equalization tank of 310,000 gallons, plus10% to 20%.
a. The data presented in Example 8-1 anddiagramed in Figure 8-5 show that the
maximum hourly rate of flow occursbetween 9:00 and 10:00 p.m. whenclean-up operations and probablydumping baths are taking place. Thisequates to 154,000 gallons per hour or2,600 gpm. Thus, a DAF facility wouldhave to be sized for at least 2,600 gpmif no flow equalization is provided.
b. If an inline tank of at least 310,000 gal-lons is provided, the design flow for theDAF system should be that of the aver-age rate of flow for the 24-hour period,or 1.2 mg/24 hr. = 834 gpm. Thus, theinclusion of a flow equalization tankallows the treatment facility to be 68%smaller.
Constituent Equalization
As stated previously, some amount of constitu-ent equalization always takes place during flowequalization. In fact, it is standard practice todesign for flow equalization, then operate toattain the degree of constituent equalizationneeded to achieve treatment objectives. Oneway this is done is to manually, or automati-cally, decrease rates of flow during periodswhen constituent concentrations are high. Thesimple dilution equation shown as equation 8-1can be used to calculate concentrations of con-stituents that result when volumes of a givenconcentration of that constituent are mixedwith known volumes of the same constituent ata different concentration.
(8-1)
where:
C1 = Concentration of constituent in questionin the first considered volume.
V1 = First considered volume.C2 = Concentration of constituent in question
in the second considered volume.V2 = Second considered volume.
C3 = Concentration of the constituent in ques-tion when the volumes V1 and V2 aremixed together.
C1 V1( ) C2 V2( )+
V1 V2+------------------------------------------- C3=

Methods for Treating Wastewaters from Industry 227
Figure 8-5 Mass diagram of cumulative volume of wastewater flow over time.
pH Control
Although pH control is a form of chemicaltreatment, it is presented here in the generalsection because, like flow equalization, it isused with biological and physical treatmentsystems as well as with chemical treatmentsystems.
Water, the basic substance of all industrialwastewaters, is composed of hydrogen andoxygen. Water dissociates into hydrogen ionsand hydroxide ions, as shown in equation 8-2.
(8-2)
In accordance with the law of mass action,discussed in the section entitled Reaction toProduce an Insoluble Solid, the quantities ofhydrogen and hydroxide ions are such that themathematical product of the hydrogen ion con-centration, expressed as moles per liter ( [H+] ),
and the hydroxide ion concentration ( [OH−] )is always 10−14, as shown in equation 8-3.
(8-3)
The hydrogen ion concentration is thus afundamental property of any aqueous solution.Any liquid for which equation 8-3 does nothold is not an “aqueous solution.” A strongsolution of sulfuric acid is an example. It is astrong acid solution, not an aqueous solution,and its pH value really has no meaning.
The hydrogen ion concentration of anaqueous solution, such as an industrial waste-water, has a major influence on its characteris-tics. What substances will dissolve in a givenwastewater, as well as how much of a givensubstance can be dissolved, is one importantcharacteristic. Another is that pH stronglyinfluences the corrosivity of wastewater. Thevalue of the pH of an aqueous solution must be
H2O H+
OH–
+↔
H+[ ] OH
–[ ] 1014–
=

228 Industrial Waste Treatment Handbook
within a certain range for bacteria and othermicroorganisms to live and thrive, and for fishand plants to live and thrive. A host of othercharacteristics that influence the success ofwastewater treatment methods, such as chemi-cal coagulation, activated carbon adsorption,ion exchange, chemical oxidation, and therelease of gases such as hydrogen sulfide andammonia are absolutely dependent for successon the proper range of pH.
Because the hydrogen ion concentration ofwastewaters is so commonly dealt with, andbecause it is cumbersome to express hydrogenion concentration in terms of molar concentra-tions, the concept of pH was developed. Verysimply, the term “p” preceding any item means“the negative logarithm of that item.” Thus,pKa means “the negative log of the numericalvalue of Ka, and pH means “the negative log ofthe numerical value of the hydrogen ion con-centration, in moles per liter.” Equation 8-4illustrates the pH concept.
Example 8-3:
Calculate the pH of an aqueous solution thathas a concentration of hydrogen ions equal to2.3 × 10−3 moles per liter.
Solution:
Example 8-4:
Calculate the hydroxide ion concentration of anindustrial waste having a pH of 5.4.
Solution:
The concentration of hydrogen ion in thiswastewater, then, is 10−5.4 moles/liter
but,
Thus, it is seen that the pH scale, which, inaccordance with equation 8-3, is a logarithmicscale, ranges between the values of 0 and 14,and a change in pH value of 1.0 equates to achange in concentration of hydrogen ion of afactor of ten. If the pH of a wastewater changesfrom 5.1 to 7.1, the molar concentration ofhydrogen ions will have decreased by twoorders of magnitude.
Typically, industrial waste discharge per-mits require that the pH be within the values of6.5 and 8.5, and many industrial waste treat-ment processes require that the pH be heldwithin a range of plus or minus 0.5 pH units.Some treatment processes require an evensmaller pH range for successful operation. Forthese reasons, pH control is one of the mostimportant aspects of industrial wastewatertreatment.
The standard procedure used to control pHin industrial waste treatment is illustrated inFigure 8-6. Basically, a mixing chamber isused to mix acidic and/or basic reagents withthe wastewater. pH electrodes are placedeither in the discharge from the mixing cham-ber or, in some cases, in the chamber itself.The electrical signal from the pH electrodesis amplified and relayed to a controller, whichactivates valves or pumps to regulate the flowof acidic or basic reagent into the mixingtank.
Many pH control applications are simple,straightforward, and require only that the elec-trodes be kept clean and well calibrated andthe control system well maintained for suc-cess. If the system is “well behaved” (the pHof the wastewater entering the mixing tankdoes not change very often, or very much),then a simple control system such as thatshown in Figure 8-6 is adequate; however, ifthe pH, as well as the acidity and/or the alka-linity of the wastewater entering the mixingtank do change appreciably throughout the
pH = –log[ H+] = log 1/[H+] (8-4)
pH = log = log = 2.64 [H+]
12.3 × 10⁻³
1
pH = log[H+] = −log(2.3 × 10⁻³) = 2.64or,
pH = log = –log[H+] = 5.4[H+]
1
(10–5.4) × [OH−] = 10–14
OH− = 10–14 = 10–8.6 moles/ liter
or,
10–5.4

Methods for Treating Wastewaters from Industry 229
processing and clean-up day, then the simplecontrol system depicted in Figure 8-6 may beinadequate. In fact, pH control can beextremely difficult and require a much moreextensive control system than that shown inFigure 8-6.
A basic reason for the potential difficultywith satisfactory pH control relates to theextremely large range of values of hydrogenion concentration within the 0 to 14 pH scalerange. Fourteen orders of magnitude is a rangethat few, if any, other detection devices mustcontend with. Another reason relates to thehigh sensitivity of commonly available pHdetection electrodes. These electrodes typicallycan respond to changes in pH as small as0.001.
The extremely large range of the substancedetected (hydrogen ion), coupled with the highsensitivity of detection capability, must berelayed electronically and, ultimately, mechan-ically to a control system that regulates theflow of reagent to the mixing tank. If the sys-tem is not well behaved, two complete controlsystems in series, and, in some cases, three, arerequired to attain satisfactory results. The mul-tiple systems should have successively smallercontrol valves or pumps in order to overcomethe difficulty in translating, on the one hand, achange of several orders of magnitude inhydrogen ion concentration, and on the otherhand, a very small change in a valve setting.Figure 8-7 illustrates a pH control system withtwo control subsystems in series.
Figure 8-6 Diagram of a pH control system.
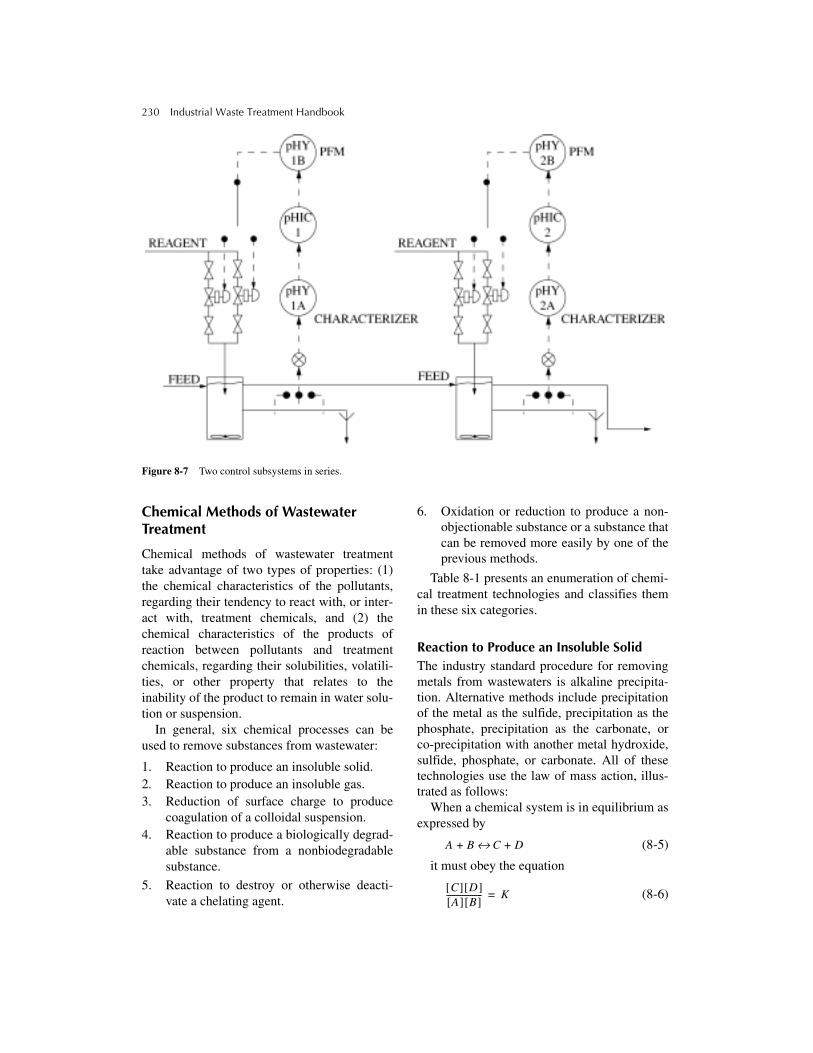
230 Industrial Waste Treatment Handbook
Figure 8-7 Two control subsystems in series.
Chemical Methods of Wastewater Treatment
Chemical methods of wastewater treatmenttake advantage of two types of properties: (1)the chemical characteristics of the pollutants,regarding their tendency to react with, or inter-act with, treatment chemicals, and (2) thechemical characteristics of the products ofreaction between pollutants and treatmentchemicals, regarding their solubilities, volatili-ties, or other property that relates to theinability of the product to remain in water solu-tion or suspension.
In general, six chemical processes can beused to remove substances from wastewater:
1. Reaction to produce an insoluble solid.2. Reaction to produce an insoluble gas.3. Reduction of surface charge to produce
coagulation of a colloidal suspension.4. Reaction to produce a biologically degrad-
able substance from a nonbiodegradablesubstance.
5. Reaction to destroy or otherwise deacti-vate a chelating agent.
6. Oxidation or reduction to produce a non-objectionable substance or a substance thatcan be removed more easily by one of theprevious methods.
Table 8-1 presents an enumeration of chemi-cal treatment technologies and classifies themin these six categories.
Reaction to Produce an Insoluble Solid The industry standard procedure for removingmetals from wastewaters is alkaline precipita-tion. Alternative methods include precipitationof the metal as the sulfide, precipitation as thephosphate, precipitation as the carbonate, orco-precipitation with another metal hydroxide,sulfide, phosphate, or carbonate. All of thesetechnologies use the law of mass action, illus-trated as follows:
When a chemical system is in equilibrium asexpressed by
(8-5)
it must obey the equation
(8-6)
A B+ C D+↔
C[ ] D[ ]A[ ] B[ ]
------------------ K=
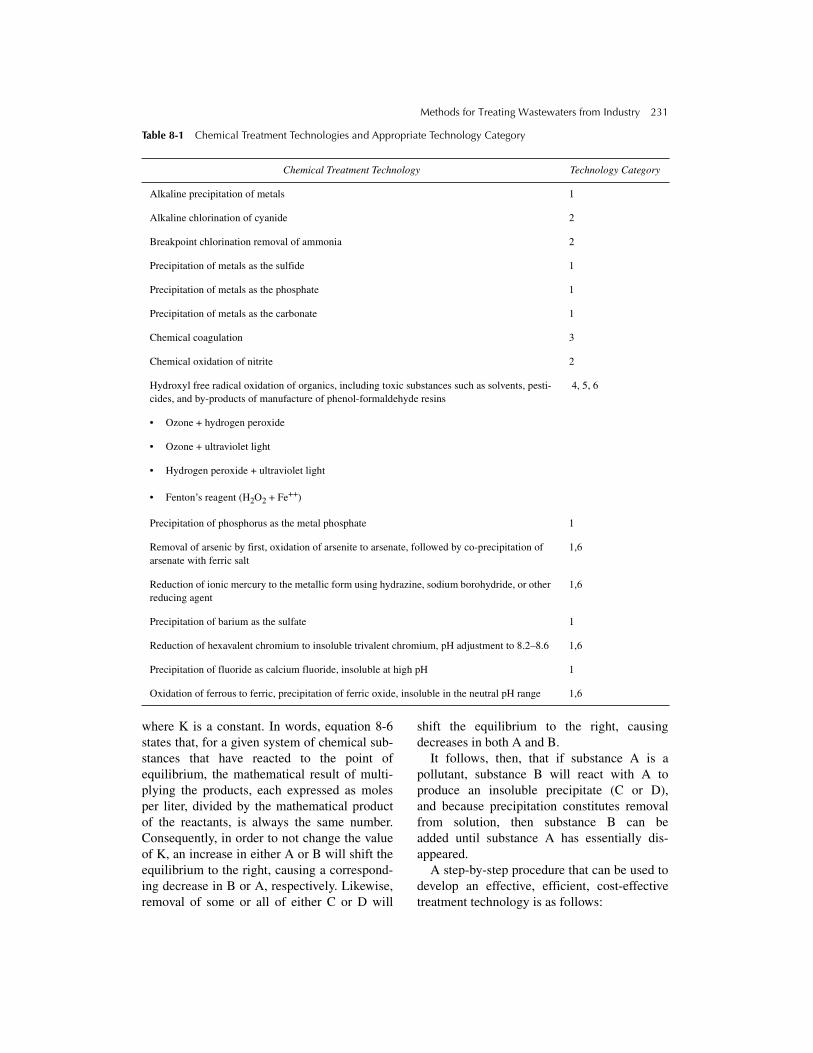
Methods for Treating Wastewaters from Industry 231
Table 8-1 Chemical Treatment Technologies and Appropriate Technology Category
where K is a constant. In words, equation 8-6states that, for a given system of chemical sub-stances that have reacted to the point ofequilibrium, the mathematical result of multi-plying the products, each expressed as molesper liter, divided by the mathematical productof the reactants, is always the same number.Consequently, in order to not change the valueof K, an increase in either A or B will shift theequilibrium to the right, causing a correspond-ing decrease in B or A, respectively. Likewise,removal of some or all of either C or D will
shift the equilibrium to the right, causingdecreases in both A and B.
It follows, then, that if substance A is apollutant, substance B will react with A toproduce an insoluble precipitate (C or D),and because precipitation constitutes removalfrom solution, then substance B can beadded until substance A has essentially dis-appeared.
A step-by-step procedure that can be used todevelop an effective, efficient, cost-effectivetreatment technology is as follows:
Chemical Treatment Technology Technology Category
Alkaline precipitation of metals 1
Alkaline chlorination of cyanide 2
Breakpoint chlorination removal of ammonia 2
Precipitation of metals as the sulfide 1
Precipitation of metals as the phosphate 1
Precipitation of metals as the carbonate 1
Chemical coagulation 3
Chemical oxidation of nitrite 2
Hydroxyl free radical oxidation of organics, including toxic substances such as solvents, pesti-cides, and by-products of manufacture of phenol-formaldehyde resins
4, 5, 6
• Ozone + hydrogen peroxide
• Ozone + ultraviolet light
• Hydrogen peroxide + ultraviolet light
• Fenton’s reagent (H2O2 + Fe++)
Precipitation of phosphorus as the metal phosphate 1
Removal of arsenic by first, oxidation of arsenite to arsenate, followed by co-precipitation of arsenate with ferric salt
1,6
Reduction of ionic mercury to the metallic form using hydrazine, sodium borohydride, or other reducing agent
1,6
Precipitation of barium as the sulfate 1
Reduction of hexavalent chromium to insoluble trivalent chromium, pH adjustment to 8.2–8.6 1,6
Precipitation of fluoride as calcium fluoride, insoluble at high pH 1
Oxidation of ferrous to ferric, precipitation of ferric oxide, insoluble in the neutral pH range 1,6
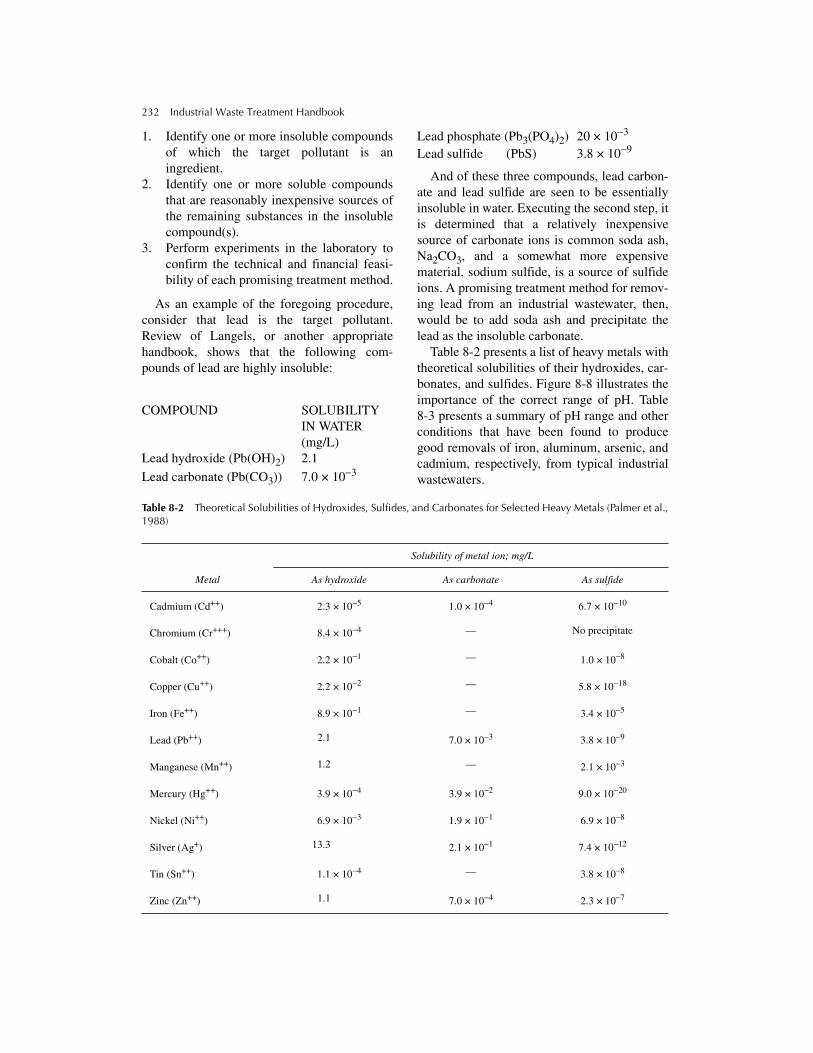
232 Industrial Waste Treatment Handbook
1. Identify one or more insoluble compoundsof which the target pollutant is aningredient.
2. Identify one or more soluble compoundsthat are reasonably inexpensive sources ofthe remaining substances in the insolublecompound(s).
3. Perform experiments in the laboratory toconfirm the technical and financial feasi-bility of each promising treatment method.
As an example of the foregoing procedure,consider that lead is the target pollutant.Review of Langels, or another appropriatehandbook, shows that the following com-pounds of lead are highly insoluble:
COMPOUND SOLUBILITY IN WATER (mg/L)
Lead hydroxide (Pb(OH)2) 2.1
Lead carbonate (Pb(CO3)) 7.0 × 10⁻³
Lead phosphate (Pb3(PO4)2) 20 × 10−3
Lead sulfide (PbS) 3.8 × 10⁻⁹
And of these three compounds, lead carbon-ate and lead sulfide are seen to be essentiallyinsoluble in water. Executing the second step, itis determined that a relatively inexpensivesource of carbonate ions is common soda ash,Na2CO3, and a somewhat more expensivematerial, sodium sulfide, is a source of sulfideions. A promising treatment method for remov-ing lead from an industrial wastewater, then,would be to add soda ash and precipitate thelead as the insoluble carbonate.
Table 8-2 presents a list of heavy metals withtheoretical solubilities of their hydroxides, car-bonates, and sulfides. Figure 8-8 illustrates theimportance of the correct range of pH. Table8-3 presents a summary of pH range and otherconditions that have been found to producegood removals of iron, aluminum, arsenic, andcadmium, respectively, from typical industrialwastewaters.
Table 8-2 Theoretical Solubilities of Hydroxides, Sulfides, and Carbonates for Selected Heavy Metals (Palmer et al.,1988)
Solubility of metal ion; mg/L
Metal As hydroxide As carbonate As sulfide
Cadmium (Cd++) 2.3 × 10⁻⁵ 1.0 × 10⁻⁴ 6.7 × 10⁻¹⁰
Chromium (Cr+++) 8.4 × 10⁻⁴ — No precipitate
Cobalt (Co++) 2.2 × 10⁻¹ — 1.0 × 10⁻⁸
Copper (Cu++) 2.2 × 10⁻² — 5.8 × 10⁻¹⁸
Iron (Fe++) 8.9 × 10⁻¹ — 3.4 × 10⁻⁵
Lead (Pb++) 2.1 7.0 × 10⁻³ 3.8 × 10⁻⁹
Manganese (Mn++) 1.2 — 2.1 × 10⁻³
Mercury (Hg++) 3.9 × 10⁻⁴ 3.9 × 10⁻² 9.0 × 10⁻²⁰
Nickel (Ni++) 6.9 × 10⁻³ 1.9 × 10⁻¹ 6.9 × 10⁻⁸
Silver (Ag+) 13.3 2.1 × 10⁻¹ 7.4 × 10⁻¹²
Tin (Sn++) 1.1 × 10⁻⁴ — 3.8 × 10⁻⁸
Zinc (Zn++) 1.1 7.0 × 10⁻⁴ 2.3 × 10⁻⁷

Methods for Treating Wastewaters from Industry 233
Figure 8-8 Precipitation of heavy metals as hydroxides. (From Lanouette, 1977.)
Table 8-3 Summary of pH Ranges and Conditions Found to Produce Good Removals of Indicated Metals
SUBSTANCE TO BE REMOVED
Table 8-4 presents treatment methods thatare most commonly used for removing ninemetals in addition to those shown in Table 8-3.Figure 8-8 presents relationships between pHvalue and solubility for six common heavy
metals. Notice that Figure 8-8 shows that chro-mium and zinc exhibit optimum pH values of7.5 and 10, respectively, whereas iron, copper,nickel, and cadmium show ever-decreasing sol-ubility with increasing pH.
Iron Aluminum Arsenic Cadmium
pH and other condition
7–8 all Fe oxidized to Fe+++
6–7, but up to 8.5 may be o.k.
co-ppt w/ iron, therefore, pH 7–8
10 or so, but pH 8 w/ carbonate is best

234 Industrial Waste Treatment Handbook
Table 8-4 Common Methods and pH Values for Removal of Heavy Metals
When an insoluble precipitate is formed,individual atoms share electrons to build acrystal lattice structure that results in particlesthat “grow” to a size that will settle in a clari-fier under the influence of gravity. Often, twodistinct processes take place. The first is theformation of small crystals of the substancebeing precipitated. The second is coagulationof the small crystalline particles, which is theclumping together of many small particles toform larger particles that settle well. Some-times a coagulant or a coagulant aid can assistwith this process.
It is common practice to include a deepbed granular filter, or, in some cases, ultrafiltra-tion, as the final step in removing substancesby forming an insoluble solid. Typically, chem-ical precipitation followed by sedimentationresults in 10 mg/L or less of the target sub-stance remaining in the treated effluent. Polish-ing this effluent normally reduces the residualto 1 to 3 mg/L.
It is always necessary to confirm a chemicaltreatment process by laboratory experimenta-tion. Even though there are voluminousbooks and research papers that describe how
various substances, such as heavy metals “areremoved,” the presence of interfering sub-stances such as chelating agents, complexingsubstances, and substances that will competefor the proposed treatment chemical can some-times render a given method ineffective in anygiven application.
A suggested procedure for determining, inthe laboratory, optimum doses of reagentchemicals and ranges of pH is as follows:
Using a “jar test apparatus,” shown in Figure8-9:
1. Place wastewater, pretreated by sedimenta-tion or otherwise, as anticipated for a full-scale treatment plant, in “jars” of about1200 ml volume. 1000-ml beakers can beused, but jars of square cross-section pro-duce better mixing action.
2. Determine reagent doses to bracket theanticipated optima, regarding;
a. pH b. Precipitant c. Coagulant (if any) d. Coagulant aid (if any)
Chromium Reduction to trivalent state by bisulfite or metabisulfite, followed by precipitation at pH 8–9.5.
Copper pH 10–12, or as the sulfide (by adding sodium sulfide). Evaporative recovery, or ion exchange forrecovery.
Lead pH 10–11, or precipitation as the carbonate (by adding soda ash) or as the phosphate (by addingphosphoric acid or a soluble phosphate).
Manganese Oxidation to insoluble manganous dioxide by chemical oxidants (free chlorine residual, ozone,potassium permanganate), ion exchange.
Mercury Precipitation as the sulfide, at pH values between 5 and 8. Also, ion exchange, coagulation, and acti-vated carbon.
Nickel Generally, pH 11–12. In some cases, pH values ranging from 5–10 have produced good results. Pre-cipitation as the carbonate or sulfide has worked well at pH values close to neutral.
Selenium Dissolved selenium is removed by precipitation at pH 11–12, or by co-precipitation with iron at pH5.5–8, or with alum at pH 6 or so. Undissolved selenium is removed by sedimentation and/or filtra-tion.
Silver Because of the value of silver, ion exchange removal followed by recovery of the silver is very com-mon.
Zinc Wide range of pH values, depending on other substances in the wastewater. Phosphate precipitationat pH 8–9 has worked well.

Methods for Treating Wastewaters from Industry 235
Figure 8-9 Jar test apparatus. (Photo courtesy of ©Phipps & Bird, Inc., 2000.)
(These determinations have to be made onthe basis of (1) experience, (2) the litera-ture, or (3) educated guesses.)
3. With all stirrers in the “rapid mix” mode,add the decided-on doses to each jar asnearly simultaneously as possible. Onemethod is to place each dose in a smallbeaker and have several people, each witha beaker in each hand, dose each jar at thesame time.
4. “Rapid mix” for 30 seconds.5. “Slow mix” to achieve good coagulation.
Observe the coagulation process (appear-ance of particles in the test solutions) andthe flocculation process (building of parti-cles into large, flocculent solids withattendant decrease in the turbidity of thetest solution). Record observations. Carryon for up to 30 minutes.
6. Allow to settle. Observe flocculationand settling characteristics. Recordobservations.
7. Measure results of the following:
a. Target substance concentration
b. pH
c. Turbidity
d. TSS
e. Residual reagents, if desired
Table 8-5 presents a listing of chemicals thathave been used successfully to produce insolu-ble precipitates and thus effect removal of pol-lutants such as metals, phosphorus, sulfide, andfluoride.
The Use of CarbamateCarbamates, a class of organic compounds thatwas developed for use as pesticides during the1940s and later, have been found to functionextremely well as precipitants for certain met-als. In some cases, one or more carbamateshave been found to be capable of precipitatingmetals in the presence of chelating agents and

236 Industrial Waste Treatment Handbook
Table 8-5 Chemical Substances Commonly Used forIndustrial Wastewater Treatment by Removal of TargetPollutants as a Precipitate
other substances that interfered with removalof the metals using more conventional meth-ods such as pH adjustment. Several chemicalmanufacturers now market proprietary sub-stances, which are carbamates, as effectiveprecipitants.
Figure 8-10 presents a suggested sequentialprocedure for developing a treatment system,from initial concept to the point of initiatingfinal design documents. Although the processdepicted in Figure 8-10 is addressed to developa treatment system for removing target sub-stances by forming an insoluble substance, itcan be easily adapted to the development ofmany other types of treatment systems.
Disadvantages of Treatment by Production of an Insoluble CompoundCertain problems are common to treatmentprocesses wherein the mechanisms of removalare formation of an insoluble solid, followed byseparation of the solids from the liquid by sedi-mentation. One problem is the occasional
inability of the precipitated solid to build intoparticles that are sufficiently large to settle,under the influence of gravity, in the clarifier.Another is the often voluminous sludge that isdifficult to dewater.
Often, sludge produced by precipitation ofheavy metals must be handled and disposed ofas “hazardous waste” because of its inability to“pass” the TCLP test (see Chapter 6), althoughthere are methods of treating or conditioningthese sludges to render them capable of pass-ing. Some of these methods are proprietary;some are not. For instance, under certain cir-cumstances, the phosphate precipitate of zincwill pass the TCLP test. Each individual sludgemust be experimented with in the laboratory,using principles discussed in this text, todevelop a precipitation process that yields asludge that can be dewatered economically toproduce a residual that can be disposed of asnonhazardous.
One method of avoiding the expense andfuture liability of disposing of sludge as haz-ardous waste is to dewater, dry, then store thedried material for later recycle and reuse. Eventhough this would require licensing as a haz-ardous material storage facility, it might proveto be the most cost-effective option.
Suggested Approach for Treatment of Industrial Wastewater by Formation of an Insoluble Substance
Figure 8-11 presents a suggested approach, ormodel, for treatment of industrial wastewatersfor removal of substances by formation of aninsoluble substance. First, as in all industrialwastewater treatment applications, the costeffectiveness of primary treatment, includingplain sedimentation, should be evaluated. Thesecond step should be pH adjustment to thatrange required for optimum effectiveness ofthe third step, which should include whateverconditioning steps are to take place before theprincipal treatment process. Examples arereduction of hexavalent chromium to the triva-lent state, oxidation of arsenite to arsenate, anddestruction of chelating agents by oxidationwith Fenton’s reagent.
CHEMICAL APPLICATION
Lime Heavy metals, fluoride, phosphorus
Soda ash Heavy metals
Sodium sulfide Heavy metals
Hydrogen sulfide Heavy metals
Phosphoric acid Heavy metals
Fertilizer grade phos-phate
Heavy metals
Ferric sulfate Arsenic, sulfide
Ferric chloride Arsenic, sulfide
Alum Arsenic, fluoride
Sodium sulfate Barium
Carbamates Heavy metals

Methods for Treating Wastewaters from Industry 237
Next, a second pH adjustment step maybe required for optimum performance of theprincipal treatment process, shown in Figure
8-11 to be chemical precipitant addition, mix-ing, flocculation, sedimentation, and finally,filtration.
Figure 8-10 Suggested procedure for developing a treatment system.

��� �������� ���� �������� ��������
Figure 8-11 Schematic of suggested model for design of facility for removal by forming an insoluble substance.
��������� �� ����� �� �������� ���
Considering, again, equations 8-5 and 8-6, itcan be seen that if product C or D is a gas thatis very poorly soluble in the wastewater beingtreated, it will remove itself from solution as itis formed, thus forcing the equilibrium to theright until the target substance (A or B) hasessentially disappeared. An example of thistreatment technology is the removal of nitriteion by chlorination, as shown by equation 8-7.
As chlorine is added in the form ofchlorine gas or hypochlorite, or another chlo-rine compound that dissolves in water to yieldfree available chlorine, the nitrite ions are oxi-dized to nitrogen gas and water. Nitrogen gas,being only sparingly soluble in water, automat-ically removes itself from the chemical system,driving the equilibrium to the right until all ofthe nitrite ion has been removed.
Table 8-6 presents a listing of chemical sub-stances that can be added to remove the appro-priate pollutants as an insoluble gas.
��������� ���������� � ������������
For many years, breakpoint chlorination hasbeen used to produce a free chlorination resid-ual in drinking water. The basic process ofbreakpoint chlorination is that chlorine reactswith ammonia in four different stages to ulti-mately produce nitrogen gas, hydrogen ions,
����� ��� ������� ���������� ���� ��� �� �������� ������ �������� ����� ���������� �� �� �������
��� ���
chloride ions, and possibly some nitrous oxide,and some nitrate, as shown in equations 8-8through 8-12.
First, chlorine reacts with water to yieldhypochlorous and hydrochloric acids:
(8-8)
Then, hypochlorous acid reacts withammonia:
(8-9)
(8-10)
(8-11)
(8-12)
+ +2NO2– (8-7) Cl2 + 8H+ N2 4H2O + 2Cl –→ ↑
CHEMICAL SUBSTANCE
TREATMENT TECHNOLOGY
Chlorine gas or other chlorine compound (hypochlorite, or chlo-rine dioxide, for instance)
(1) Breakpoint chlorina-tion to remove ammonia
(2) Alkaline chlorination of cyanide
Sulfuric or hydrochloric acids (technical grade or waste acids)
Removal of sulfide as hydrogen sulfide gas
Cl2 H2O+ HOCl Cl–
H+
+ +↔
HOCl NH3+ NH2Cl H2O+↔
HOCl NH2Cl+ NHCl2 H2O+↔
HOCI NHCl2+ NCl3 H2O+↔
HOCI NCl3+ N2 N2O NO3–
+ +↔

Methods for Treating Wastewaters from Industry 239
Breakpoint chlorination can be used to con-vert ammonia to nitrogen gas in wastewatertreatment; however, because many substancesthat are stronger reducing agents than ammoniawill exert their demand, this method is suitableonly if such substances are not present in sig-nificant amounts.
Alkaline Chlorination of CyanideCyanide has been used for many years as theanion to associate with metals used in metalplating baths because many metal cyanides aresoluble in water to relatively high degrees.Because of the extreme toxicity of cyanide, itsremoval from industrial wastewaters was oneof the earliest industrial wastewater treatmentprocesses to be developed and used widely.
Chlorine reacts instantaneously with cya-nide, at all pH levels, to produce cyanogenchloride, as follows:
(8-13)
At pH levels other than alkaline, that is,below 8.5, the cyanogen chloride persists as avolatile, toxic, odorous gas. In the presence ofhydroxide alkalinity, however, cyanogen chlo-ride is converted to cyanate, which is a thou-sand times less toxic than cyanide:
(8-14)
If chlorine is present in excess, that is, in anamount significantly greater than that requiredfor stochiometric completion of the reactionindicated in equation 8-13, plus that chlorinethat will be consumed in reactions with reduc-ing reagents and organics present in the waste-water (side reactions), it will oxidize thecyanate (produced as shown in equation 8-14)to carbon dioxide and nitrogen gasses, bothonly sparingly soluble in water:
(8-15)
which accounts for the effectiveness of the so-called alkaline-excess chlorine process fordestruction of cyanide.
Because chlorine is subject to side reactionsas indicated previously, the chlorine doserequired to produce satisfactory destruction ofcyanide must be determined in the laboratory,and extreme caution must always be exercisedto never allow the cyanide solution to attain anacidic pH, which will allow development ofcyanide gas:
(8-16)
another sparingly soluble gas, but an extremelytoxic one.
Usually, the caustic-excess chlorine processfor destruction of cyanide is carried out at pH8.5. Automatic pH control is normallyemployed, with suitable fail-safe processes.Automatic chlorine dosing can be accom-plished by use of an ORP probe and controller.
Reduction of Surface Charge to Produce Coagulation of a Colloidal SuspensionA very high percentage of industrial wastewa-ters consists of colloidal suspensions. In fact, itis often possible to destabilize industrialwastewaters by chemical coagulation, allowseparation of the destabilized colloidal materialfrom the water, further treat the water to dis-charge quality by a polishing step, if necessary,and then recover the coagulant from the sepa-rated waste substances. The coagulant can bereused, and the waste substances can be furthertreated, if necessary. The advantage is that thepolishing step can be significantly more eco-nomical than if it were used to treat the rawwastewater, and, in some cases, the separatedcolloidal material can be recovered as aby-product.
A colloidal suspension consists of one sub-stance in a fine state of aggregation evenly dis-persed throughout a second. The first phase,which may consist of single polymers or aggre-gates of smaller molecules, is called the dis-persed or discontinuous phase, and the secondphase is called the dispersing medium or con-tinuous phase. The distinguishing characteris-tics of a colloid system are the size of thedispersed particles and the behavior of the sys-tem, which is governed by surface phenomena
CN–
Cl2+ CNCl Na+
Cl–
+ +→
CNCl 2OH–
+ CNO–
H2O Cl–
+ +→
2CNO–
4OH–
3Cl2+ + 2CO2 6Cl–
+→
N2 2H2O+ +
CN–
H+
+ HCN→

240 Industrial Waste Treatment Handbook
rather than the chemical properties of the com-ponents. The size of the dispersed particlesranges between 1 and 100 mυ, placing thembetween molecules and true particles. Colloidalsystems can be further classified into emul-sions, gels, or sols. Emulsions consist of twoimmiscible liquids, one being finely dispersedthroughout the other. They must be stabilizedby a surface-active agent, called an emulsifier,which reduces the surface tension at the inter-face between the two phases. Free energy fromthe increased surface area otherwise wouldtend to destabilize the emulsion. When anemulsifier is present, the repulsive forcescaused by like electrostatic charges on each ofthe dispersed aggregates exerts the principalstabilizing force. These charges arise by severaldifferent means, depending on the nature of theemulsion. The principal destabilizing forcesare the Brownian movement, which causes theaggregates to come into contact with eachother, and the London–van der Waal forces ofattraction, which tend to cause the emulsifiedaggregates to coalesce after moving to within acritical distance from each other.
A gel results when organic colloids of long,thin dimensions are dispersed in a liquidmedium, with the resulting formation of a non-uniform lattice structure, when suitable groupson the colloidal particles come into contact.The dispersed phase is like a “brush heap” inthis respect, and the gel assumes a semi-solidtexture. Gelatin is a familiar example of a sub-stance that forms a gel.
The most common colloidal system encoun-tered in industrial wastes consists of organicparticles or polymers, and/or inorganic parti-cles, dispersed in a liquid to yield a fluid systemknown as a sol. This differs from an emulsion inthat an emulsifying agent is not required. Theparticles or polymers belong to one of twoclasses, depending on whether or not they havean attraction for the dispersing medium. Theseclasses are lyophobic (solvent-hating), for thosesubstances that do not have an attraction, andlyophillic (solvent-loving), for those substancesthat do. In the case of industrial wastes for whichthe dispersion medium is water, the classes arecalled hydrophobic and hydrophillic.
Lyophobic SolsGiant molecules or polymers that have noattraction for a particular liquid, and thus pos-sess no tendency to form a true solution withthe liquid, can be induced to form a hydropho-bic sol by applying sufficient energy touniformly disperse the particles throughout theliquid medium. If the dispersed particles con-tain groups that are ionizable in the dispersingmedium, or if certain electrolytes are present inthe dispersing medium, the anion or cation ofwhich is preferentially adsorbed by the dis-persed particles, the sol will be stabilized bymutual repulsion of like electrostatic chargeson each of the particles of the dispersed phase.
Figure 8-12 illustrates a colloidal suspensionwherein particles (which can be organic orinorganic, macromolecules or aggregates ofsmaller molecules, or finely divided solids) aredispersed in water. The dispersed particles havea surface charge, negative in all cases, whichcan have resulted from ionization of certaingroups, breaking of covalent bonds, or adsorp-tion of previously dissolved ions from thewater medium.
An example of a hydrophobic sol, whichowes its surface charge to selective adsorptionof ions from solution, is the silver bromide sol,which results from mixing potassium bromideand silver chloride in water. Both potassiumbromide and silver chloride are soluble inwater. Silver bromide is not. Therefore, whenpotassium bromide and silver chloride aremixed together in water, silver bromide isformed as an insoluble product and precipitatesfrom solution in the form of many tiny silverbromide crystals in accordance with equation8-17:
(8-17)
When potassium bromide is in excess, thesilver ions are all tied up as the silver bromideprecipitate. There are therefore unprecipitatedbromide ions in solution, which are adsorbedto the precipitated silver bromide crystallineparticles. The sol, consequently, possesses anegative surface charge. At the exact equiva-lence point (equivalent silver and bromide), the
K+
Br–
Ag+
Cl–
+ + + AgBr K+
Cl–
+ +→

Methods for Treating Wastewaters from Industry 241
silver bromide precipitates from solutionbecause neither bromide ions nor silver ionsare present in excess. When silver nitrate is inexcess, the sol posesses a positive charge.Mutual electrostatic repulsion results wheneither silver or bromide is present in excess.
Soap micelles are examples of colloid sys-tems whose stabilizing surface charge arisesfrom ionization of certain groups on themicelles. Long hydrocarbon “tails” of the soapmolecules clump together to escape water, asillustrated in Figure 8-13 (the absence of the
Figure 8-12 Illustration of a colloidal suspension.
Figure 8-13 Colloidal suspension of soap micelles.
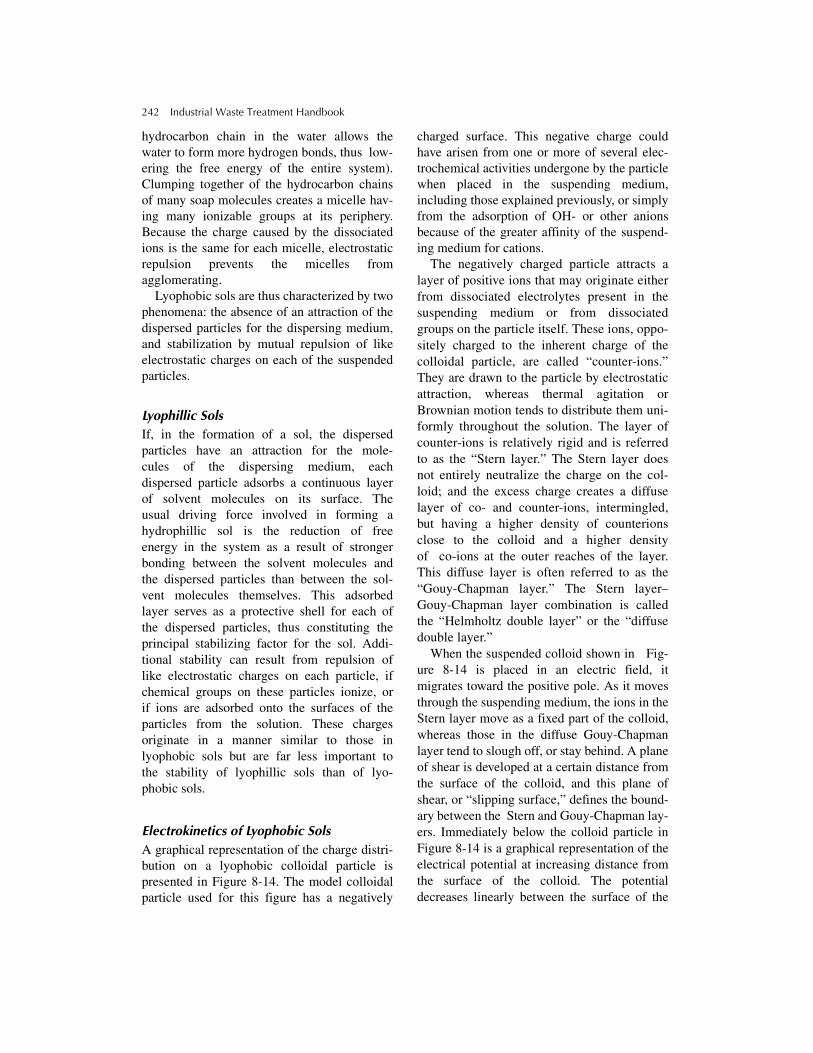
242 Industrial Waste Treatment Handbook
hydrocarbon chain in the water allows thewater to form more hydrogen bonds, thus low-ering the free energy of the entire system).Clumping together of the hydrocarbon chainsof many soap molecules creates a micelle hav-ing many ionizable groups at its periphery.Because the charge caused by the dissociatedions is the same for each micelle, electrostaticrepulsion prevents the micelles fromagglomerating.
Lyophobic sols are thus characterized by twophenomena: the absence of an attraction of thedispersed particles for the dispersing medium,and stabilization by mutual repulsion of likeelectrostatic charges on each of the suspendedparticles.
Lyophillic SolsIf, in the formation of a sol, the dispersedparticles have an attraction for the mole-cules of the dispersing medium, eachdispersed particle adsorbs a continuous layerof solvent molecules on its surface. Theusual driving force involved in forming ahydrophillic sol is the reduction of freeenergy in the system as a result of strongerbonding between the solvent molecules andthe dispersed particles than between the sol-vent molecules themselves. This adsorbedlayer serves as a protective shell for each ofthe dispersed particles, thus constituting theprincipal stabilizing factor for the sol. Addi-tional stability can result from repulsion oflike electrostatic charges on each particle, ifchemical groups on these particles ionize, orif ions are adsorbed onto the surfaces of theparticles from the solution. These chargesoriginate in a manner similar to those inlyophobic sols but are far less important tothe stability of lyophillic sols than of lyo-phobic sols.
Electrokinetics of Lyophobic SolsA graphical representation of the charge distri-bution on a lyophobic colloidal particle ispresented in Figure 8-14. The model colloidalparticle used for this figure has a negatively
charged surface. This negative charge couldhave arisen from one or more of several elec-trochemical activities undergone by the particlewhen placed in the suspending medium,including those explained previously, or simplyfrom the adsorption of OH- or other anionsbecause of the greater affinity of the suspend-ing medium for cations.
The negatively charged particle attracts alayer of positive ions that may originate eitherfrom dissociated electrolytes present in thesuspending medium or from dissociatedgroups on the particle itself. These ions, oppo-sitely charged to the inherent charge of thecolloidal particle, are called “counter-ions.”They are drawn to the particle by electrostaticattraction, whereas thermal agitation orBrownian motion tends to distribute them uni-formly throughout the solution. The layer ofcounter-ions is relatively rigid and is referredto as the “Stern layer.” The Stern layer doesnot entirely neutralize the charge on the col-loid; and the excess charge creates a diffuselayer of co- and counter-ions, intermingled,but having a higher density of counterionsclose to the colloid and a higher densityof co-ions at the outer reaches of the layer.This diffuse layer is often referred to as the“Gouy-Chapman layer.” The Stern layer–Gouy-Chapman layer combination is calledthe “Helmholtz double layer” or the “diffusedouble layer.”
When the suspended colloid shown in Fig-ure 8-14 is placed in an electric field, itmigrates toward the positive pole. As it movesthrough the suspending medium, the ions in theStern layer move as a fixed part of the colloid,whereas those in the diffuse Gouy-Chapmanlayer tend to slough off, or stay behind. A planeof shear is developed at a certain distance fromthe surface of the colloid, and this plane ofshear, or “slipping surface,” defines the bound-ary between the Stern and Gouy-Chapman lay-ers. Immediately below the colloid particle inFigure 8-14 is a graphical representation of theelectrical potential at increasing distance fromthe surface of the colloid. The potentialdecreases linearly between the surface of the

Methods for Treating Wastewaters from Industry 243
particle and the inner periphery of the Sternlayer of counter-ions. From the inner peripheryof the Stern layer outward, the potential dropsat a decreasing rate. The potential at the outerperiphery of the Stern layer, that is, at the sur-face of shear, is termed the “zeta potential.”The value of the zeta potential directly dependson the same factors that determine the thickness
of the Stern layer, namely, the strength of thecharge at the surface of the colloid; thenature—especially the value of the ioniccharge—and degree of solvation of the ions inthe Stern layer; and the frictional drag exertedby the suspending medium on the double layeras the particle migrates under the influence ofan applied electric field.
Figure 8-14 “Layers” or “shells” surrounding a negatively charged colloid.
– – – ––
–––––
––
––––
–––––
––
–––––
– – – –
+ ++
+++
++
+++
+
++
+
+
+
+ ++
+
+
+
+
+
+
+
++
+
++
++++
++
+ +
+–
–
–
–
– –
–
–
––
–
– ––
–
––
–––
–––
–
–
––
––
–
–
–
–
–
–
ELECTRIC POTENTIALSURROUNDING THE PARTICLE
BULK OF SOLUTION
EXTENT OF DIFFUSE LAYEROF COUNTERIONS
CONCENTRATION OF POSITIVE IONS
CONCENTRATION OF NEGATIVE IONS
ZETA POTENTIAL
RIGID LAYER ATTACHED TOPARTICLE
ELECTRO-NEGATIVEPARTICLE

244 Industrial Waste Treatment Handbook
Each of the ions in the Stern layer is sol-vated; thus, a layer of tightly bound solventmolecules surrounds each lyophobic colloid. Incontrast to the water layer associated withhydrophillic colloids (a detailed discussion ofwhich follows), the water layer in the case of ahydrophobic colloid is bound only by attractionto the ions in the Stern layer and not by attrac-tion to the colloid surface itself. The zetapotential in the case of hydrophobic colloidsgives a direct indication of the distance overwhich the colloidal particles can repel eachother and thus of the stability of the colloidsystem.
Electrokinetics of Lyophillic SolsWhen an organic macromolecular solid isplaced in a given liquid, one of three possiblestates of solute-solvent interaction results (sol-ubility in this instance is defined as a limitedparameter indicating compatibility with thesolvent but not true solubility in the strict senseof the definition):
1. The macromolecular solid is insoluble inthe liquid.
2. The solid swells but has a limitedsolubility.
3. The substance is soluble in the liquid.
In cases 1 and 2, the systems are always lyo-phobic, whereas in case 3, the only possibilityis that of a lyophillic sol. As an example ofcase 3, when amylose is placed in water, hydro-gen bonds are formed between molecules ofwater and the hydroxyl groups on amylose thatare at least as strong or stronger (that is, involveat least as much or more bond energy) thanhydrogen bonds between the molecules ofwater itself. If a charge exists on the macromol-ecule because of factors similar to thoseaccounting for the charge on lyophobic col-loids, and if an electric field is applied across aportion of the sol, the particle will migratetoward one of the poles. As the particle moves,water molecules that are bound to the macro-molecules by hydrogen bonds plus those inter-laced, again by hydrogen bonding, migrate asan intergral part of the particle. This layer of
water, usually monomolecular, defines what isknown as the “solvated solvent layer” aroundthe macromolecules and serves as a protectiveshell against influences that could be exertedby the chemical and physical properties of thesuspending environment.
Secondary stabilizing forces possessed by acharged hydrophillic colloid arise principallyfrom ionic dissociation of constituent groupson the macromolecule rather than by adsorp-tion of ions. It is convenient to picture acharged lyophillic colloid as having a diffusedouble layer of ions collected around it. Thezeta potential is interpreted in the same manneras for lyophobic colloids, being the potential atthe surface of shear in the diffuse double layer,and is measured in the same way, that is, by useof a zeta potential meter or by electrophoresistechniques.
Coagulation of Colloidal Waste Systems
Lyophobic ColloidsCoagulation, or agglomeration of the parti-
cles in a lyophobic colloidal system, can bebrought about by neutralization of the surfacecharge on each particle to the point where therepulsive forces will be less than the London–van der Waal forces of attraction. Because thezeta potential directly indicates the strength ofthe net charge on each particle, a reduction ofthe zeta potential is synonymous with a reduc-tion of the stabilizing forces of the sol. A zetapotential of zero (the isoelectric point of thesystem) corresponds to minimum stability;however, the zeta potential need not be zero forcoagulation to take place. It must be reducedonly to within a certain minimum range,referred to as the “critical zeta potential zone.”
The zeta potential can be reduced by one or acombination of several methods, includingincreasing the electrolyte concentration of thesol, reducing the potential on the surface of thedispersed solid by external manipulation ofthe pH, and/or by adding multivalent counter-ions. The Schulze-Hardy rule states that thesensitivity of a colloid system to destabilizationby addition of counter-ions increases far more

Methods for Treating Wastewaters from Industry 245
rapidly than the increase of the charge of theion. That is, in increasing from a divalentcharge to a trivalent charge, the effectiveness ofa coagulant increases far more than a factor of3/2. Overbeek illustrated this rule by showingthat a negatively charged silver iodide colloidwas coagulated by 140 millimoles per liter ofNaNO3, 2.6 millimoles per liter of Mg(NO3)2,0.067 millimoles per liter of Al(NO3)3, and0.013 millimoles per liter of Th(NO3)4.
The distinction between primary stability,imparted by the surface charge, and secondarystability, pertaining to the effective repulsion ofcollodial particles because of the magnitude ofthe zeta potential, is useful for interpreting thecoagulation of these particles by the addition ofmultivalent ions counter to the surface chargeof the colloid. The presence of the multivalentcounter-ions brings about a condition wherebythe charges in the double layers are so com-pressed that the counter-ions are eventuallycontained, for the most part, within the waterlayers that originally contained the solvatedions in the double layer. The primary stabilityis thus reduced as a consequence of neutraliza-tion of the charge on the surface of the colloid,and the secondary stability is reduced becausethe particles can now approach each other towithin a distance corresponding to coalescenceof their water sheaths (water solvating thecounter-ions and co-ions in the diffuse doublelayer) (recall that, if an ion is dissolved, it has,by definition, many water molecules surround-ing it and “bonded” to it by “hydrogen bond-ing”) without prohibitive repulsion betweentheir respective diffuse double layers of ions.
Lyophillic ColloidsThe principal stabilizing factor in the case of
lyophillic sols is the solvating force exerted onthe particles (not on the ions in the diffuse dou-ble layer) by the suspending medium. Electro-lytic repulsion between the particles, althoughof lesser importance to the total stabilizingforce, must also be dealt with for the ultimatecoagulation of a lyophillic colloid system. Twomethods can be employed to desolvate lyophil-lic colloids. In the first method, a liquid can beadded to the system that is both a poor solvent
for the suspended particle and highly misciblewith the suspending medium. When this isdone the colloid is no longer able to formbonds with the medium that are stronger thanthe internal bonds between elements of themedium, and the principal stabilizing factor isremoved.
This process is called “coacervation.” Theother method is to add a substance, such as asulfate salt, which can form stronger solvationbonds with the solvent than the solvent canwith the suspended colloids. When this is done,the added salt effectively pulls the hydratedwater layer from the surface of the colloid,again, destroying the principal stabilizing fac-tor. This process is known as “salting out.” Theactual destabilizing mechanism as well as theoverall effect of both of these methods is thesame. In each case, the dispersing medium isable to form stronger bonds (thus decrease itsfree energy more) with the additive than withthe dispersed phase. If the previously solvatedparticles carry no net charge at this point, thatis, have either zero, or very small zeta poten-tial, they will flocculate and separate from thedispersing phase, once coacervation has beenaccomplished.
If they do possess a net charge, resulting in asignificant zeta potential and thus repulsiveforces stronger than the London–van der Waalforces of attraction, the colloids will not coagu-late but will remain in suspension as a lyopho-bic sol. Coagulation must then be effectedaccording to the methods presented in the sec-tion on Lyophobic Sols.
Figure 8-15 presents a diagrammatic repre-sentation of the various types of colloidal sys-tems and how destabilization results inremoval.
Coagulants such as alum, ferric sulfate, andcationic polyelectrolytes all work by supress-ing the zeta potential of the colloidal system toa value sufficiently low that the colloidal parti-cles will collide, and then coalesce, under theinfluence of slow stirring. Anionic and non-ionic polyelectrolytes can greatly aid in build-ing much larger flocculated particles that willboth settle faster and produce a less turbideffluent. Used in this manner, the anionic and

246 Industrial Waste Treatment Handbook
nonionic polyelectrolytes are referred to as“coagulant aids.”
When alum (Al2(SO4)3.18H2O) dissolves in
water, some of the aluminum goes into truesolution as the trivalent aluminum ion, Al+++.If some colloidal particles have a negative sur-face charge, the trivalent aluminum ions, plusother aluminum species such as Al(OH)++ andAl(OH)2
+, will be attracted to these negativelycharged surfaces and will suppress the net neg-ative surface charge, which is to say they willsuppress the zeta potential. Other metal saltsthat dissolve to yield trivalent ions, such as fer-ric sulfate, ferric chloride, and aluminum chlo-ride, coagulate colloidal suspensions witheffectiveness similar to that of alum.
Salts that dissolve to yield divalent ions,such as calcium chloride or manganous sulfate,also reduce the zeta potential and eventual
coagulation, but with an efficiency far less thanthe difference in ionic charge might indicate.As explained previously, the Shultz-Hardy rulestates this effect.
Laboratory experimentation is alwaysrequired to determine the optimum doses ofcoagulants and coagulant aids. There is nocharacteristic, substance, or property of awastewater that can be measured, then used asan indicator of the quantity of coagulantrequired. There is no substitute for performing“jar tests.”
A suggested procedure for conducting a jartest program to determine the optimum quanti-ties of reagents and pH range is presented inthe section on Reactions to Produce an Insolu-ble Solid. This procedure is identical to thatrecommended for determining the optimumdoses of coagulants. The observations made
Figure 8-15 Diagrammatic representation of the various types of colloids. The colloids in the upper row are lyophillic;those below are lyophobic. pH increases from right to left.

Methods for Treating Wastewaters from Industry 247
during steps 5 and 6 will be oriented toward thedisappearance of the turbidity originallypresent in the test solution, as opposed to theturbidity caused by the initial appearance ofprecipitated target substances as in the case ofthe reactions to produce an insoluble solid.
Reaction to Produce a Biologically Degradable Substance from a Nonbiodegradable SubstanceSome substances that are resistant to biodegra-dation can be chemically altered to yieldmaterial that is biodegradable. Examples arelong-chain aliphatic organics made soluble byattachment of ionizable groups, and celluloseor cellulose derivatives.
Hydrolysis, under either acidic or alkalineconditions, can be used to break up many largeorganic molecules into smaller segments thatare amenable to biological treatment. Heat maybe required for effective hydrolytic action, andconsideration of proper reaction time is veryimportant.
Certain fats and oils are made water solubleby chemically attaching ionizable groups suchas sulfonates or ammonium groups to theirlong-chain hydrocarbon structures, for use inleather tanning, conditioning and finishing, andother industrial uses. These water-soluble fatsand oils are found in wastewaters from theindustries that produce them, as well as inthe wastes from the industries that use them.They are characteristically resistant to biodeg-radation, which is one of the reasons for theirusefulness.
Hydrolysis of these water-soluble fats andoils can break them into small segments thatare still soluble in water and readily degradableby anaerobic microorganisms, aerobic microor-ganisms, or both. Laboratory experimentationis required to determine the technologicalfeasibility for a given industrial waste, as wellas a cost-effective process.
Substances that are made from cellulose orderivatives of cellulose are resistant to biologi-cal degradation, even though the basic buildingblock for cellulose is glucose, a substance that isamong the most readily biodegraded substances
in existence. The reason for the nonbiodegrad-ability of cellulose is that microorganisms foundin aerobic biological treatment systems are notcapable of producing an enzyme that can breakthe particular linkage structure, known as the“beta link,” that joins the individual glucosemolecules end-to-end to produce the very longchain that ultimately winds around itself tobecome cellulose.
Acid hydrolysis, usually requiring someheat, is capable of breaking cellulose into smallsegments. Just how small depends on the con-ditions of the hydrolysis process, as regardsacidity, heat, catalysts, and reaction time. Ingeneral, anaerobic microorganisms are capableof rapidly biodegrading segments of cellulosethat are in the size range of a few hundred glu-cose units, whereas aerobic microorganismsrequire that the cellulose be broken down intomuch smaller units.
A patented process that is based on the prin-ciples described earlier uses hydrolysis to alterthe structures of refractive organics that remainin wasted biological treatment sludge after aer-obic or anaerobic digestion has been carriedout to essential completion. As an alternative todewatering and disposing of this digestedsludge, which, by definition, is not biodegrad-able, it can be broken into smaller organic unitsby hydrolysis, then sent back through theindustry’s biological treatment process fromwhence it came. Advantage can be taken ofperiods of low loading, such as weekends, holi-days, periods of plant shutdown for mainte-nance, or during shifts when loadings to thetreatment plant are low.
Reaction to Destroy, or Otherwise Deactivate, a Chelating AgentOften, removal of metals from an industrialwastewater by simple pH adjustment, with orwithout addition of sulfide, carbonate, phos-phate, or a carbamate, is ineffective because ofthe presence of chelating agents. Chelatingagents, discussed in Chapter 2, are of variousmakeup and include organic materials, such asEDTA, or inorganic materials, such as poly-phosphates. The following sections enumerate

248 Industrial Waste Treatment Handbook
methods that are candidates for solving thistype of wastewater treatment problem.
Organic Chelating Agents
1. Destroy the chelating agent by acidhydrolysis.
2. Destroy the chelating agent by hydroxylfree radical oxidation, using one of the fol-lowing technologies, as discussed in thesection entitled Oxidation or Reduction toProduce a Nonobjectionable Substance.
a. Fenton’s reagent (H2O2 + Ferrousions)
b. Hydrogen peroxide + Ultravioletlight
c. Ozone + Hydrogen peroxided. Ozone + Ultraviolet light
3. Destroy the chelating agent by addingpotassium permanganate and heating. (Themanganese ions will then have to beremoved along with the target metals.)
4. Pass the wastewater through granular acti-vated carbon. In some cases, the chelatingagent will adsorb to the carbon. In some ofthose cases, the chelated metal will remainchelated and thus be removed on the car-bon. In other cases, adsorption to thecarbon effects release of the metals, whichcan then be precipitated without interfer-ence from the chelating agents.
Inorganic Chelating Agents
1. Add a stronger chelating agent, such asheptonic acid, or EDTA, both of which areorganic. Then, use one of the methodsgiven in step 1 for organic chelatingagents.
2. Add a stronger chelating agent, such asheptonic acid or EDTA. Then it is some-times possible to remove the metals bypassing the wastewater through a strongcationic exchange resin generated on thehydrogen (acid) cycle.
3. If the chelating agent is polyphosphate, itmay be feasible to hydrolyze it withacid and heat.
As with most cases involving industrialwastewater treatment, a proper program oflaboratory experimentation, followed by trulyrepresentative pilot plant work, must be con-ducted to develop a cost-effective treatmentscheme. The “throwsome method,” whereinone throws some of a candidate reagent into asample of wastewater to “see if anythinggood happens,” is perfectly proper to doduring periods of break or frustration, butmust never be used to forever eliminate con-sideration of a reagent or technology thatcomes to mind based on fundamental proper-ties or chemistry.
Oxidation or Reduction to Produce a Nonobjectionable SubstanceSome highly objectionable substances can bechemically oxidized and some can be reducedto produce nonobjectionable substances suchas carbon dioxide and water. An example is thedestruction of the common rodenticide war-farin by potassium dichromate, acid, and heat,as represented by equation 8-18.
As shown in equation 8-18, highly toxicwarfarin is oxidized to harmless carbon dioxideand water. Also shown in equation 8-18 is thepresence of Cr+++ in the effluent, which mayhave to be removed in a subsequent step.
The removal of chromium from industrialwastewaters by chemically reducing hexavalentchrome ions, which are soluble in water andhighly toxic, to the trivalent state, which is nei-ther soluble (in the correct pH range) nor toxic,is another example of treatment by chemicaloxidation or reduction to produce nonobjec-tionable substances. Reducing agents that have
O
CHCH2COCH3
C6H5
O
OH
+ 134H+ + 4K2Cr2O7 19CO2 + 24H2O + 8Cr+++HEAT
(8-18)

Methods for Treating Wastewaters from Industry 249
been found to work well include sulfur dioxide,sodium or potassium bisulfite, or metabisulfite,and sodium or potassium bisulfite plus hydra-zine. The correct range of pH, usually in theacid range, must be maintained for each ofthese chemical reduction processes to proceedsuccessfully.
Table 8-7 presents additional examples oftreatment of industrial wastewater by oxidationor reduction of an objectionable substance to pro-duce one or more nonobjectionable substances.
Oxidation of (soluble) Ferrous Ions to (insoluble) Ferric Ions by Oxygen
Iron is soluble in water in the +2 (ferrous)valence state. Ferrous ions are very easilyoxidized to the +3 (ferric) valence state,soluble only in strongly acidic aqueous solu-tions. The oxygen content of air is a suffi-ciently strong oxidizing agent to effect thisoxidation.
Aeration, followed by sedimentation, hasbeen used successfully to remove iron fromindustrial and other wastewaters, includinglandfill leachate. The aeration step accom-plishes conversion of the dissolved ferrous ionsto the insoluble ferric state. The ferric ionsquickly and readily precipitate from solution asferric oxide (Fe2O3), which forms a crystal lat-tice that builds to particle sizes that settle wellunder the influence of gravity. Coagulants and/or coagulant aids are often used to assist thecoagulation and flocculation process, and thus,produce a higher-quality effluent.
A benefit that often results from removingiron by oxidation followed by sedimentation isthat other metal ions, all of which are inher-ently hydrophobic, “automatically” adsorb tothe particles of ferric oxide as they are formingvia precipitation. They are thus removed fromsolution along with the iron. This process,known as “co-precipitation,” is sometimes aug-mented by actually adding more ferrous ions to
Table 8-7 Examples of the use of chemical oxidation or reduction to produce non-objectionable substances
1. Alkaline chlorination of cyanide to produce carbon dioxide, nitrogen gas, and chloride ion.
2. Chemical reduction of hexavalent chromium (toxic) to produce insoluble, less-toxic trivalent chromium.
3. Oxidation of (soluble) ferrous ions to the insoluble ferric state by exposure to oxygen (air).
4. Destruction of organic materials such as toxic substances (solvents and pesticides, for example) and malodoroussubstances (methyl mercaptan and dimethyl sulfide, for instance) by oxidation by free radicals.
a. Hydrogen peroxide + Ultraviolet light
b. Fenton’s reagent (H2O2 + Ferrous ions)
c. Ozone + Hydrogen peroxide
d. Ozone + Ultraviolet light
5. Oxidation of organics with ozone, which may or may not involve free radicals.
6. Oxidation of organics with hydrogen peroxide, which may or may not involve free radicals.
7. Destruction of toxic organics by oxidation with heat, acid, and either dichromate or permanganate. Products arecarbon dioxide, water, and some nonobjectionable refractory compounds. Just about any organic compound canbe destroyed by this method.
8. Wet air oxidation of various organics such as phenols, organic sulfur, sulfide sulfur, and certain pesticides. Thisprocess takes place under pressure, with oxygen supplied as the oxidizing agent by compressed air.
9. Chlorination of hydrogen sulfide to produce elemental sulfur. Subsequent neutralization is usually required.

250 Industrial Waste Treatment Handbook
the wastewater in the form of ferrous sulfate orother ferrous salt in an amount sufficient to co-precipitate other metals.
Oxidative Destruction of Organics by Free RadicalsFree radicals are powerful oxidizers that can
convert many organics all the way to carbondioxide, water, and fully oxidized states ofother atoms that were part of the originalorganic pollutants, including sulfates andnitrates. Free radicals can be generated in acontrolled manner to destroy a host ofobjectionable organic substances, includingpesticides, herbicides, solvents, and chelatingagents. As discussed previously, chelatingagents interfere with the mechanismsemployed to remove metals (by precipitation,for instance).
A free radical is an atom, or group ofatoms, possessing an odd (unpaired) electron(has no partner of opposite spin). A free radi-cal has such a powerful tendency to obtain anelectron of opposite spin, and thus attain ther-modynamic stability that it will easily extractone from an organic molecule. When thishappens, the organic molecule, or a portionof it, becomes a free radical itself, goes afteranother molecule, organic or otherwise, form-ing another free radical, and so on. A chainreaction is thus set up and, if managed prop-erly, can be induced to continue until nearlyall of the target substance has been removed.
Management of the chain reaction consistsof maintaining the pH of the system within arange favorable for the reaction and supplyingenough of the free radical–generating sub-stance (discussed as follows) to keep theprocess going. Side reactions (with reducingagents) “kill” free radicals. If the rate of “kill-ing” free radicals exceeds the rate of generationof free radicals for a long enough time, thetreatment process terminates.
A free radical, then, has one unpaired elec-tron and has the same number of electrons asprotons. A negatively charged ion, in contrast,has an even number of electrons, each pairedwith another electron of opposite spin, and hasmore electrons than protons.
Free radicals can be generated by the follow-ing methods:
1. Adding hydrogen peroxide.
2. Adding hydrogen peroxide to a solutionthat contains ferrous ions, either present inthe wastewater or added along with thehydrogen peroxide (Fenton’s reagent).
3. Adding hydrogen peroxide, then irradiat-ing with ultraviolet light.
4. Adding ozone and hydrogen peroxide.
5. Adding ozone and irradiating with ultraviolet light.
Oxidation with Hydrogen PeroxideHydrogen peroxide has the chemical formulaH2O2 and is an oxidizing agent that is similarto oxygen in effect but is significantly stronger.The oxidizing activity of hydrogen peroxideresults from the presence of the extra oxygenatom compared to the structure of water. Thisextra oxygen atom is described as a “peroxidicoxygen” and is otherwise known as “activeoxygen.”
Hydrogen peroxide has the ability to oxi-dize some compounds directly; for instance,alkenes, as shown following. Peroxidic oxy-gen adds to the double bond, producing ahydroperoxide as shown in equation 8-19:
The hydroperoxide then autooxidizes toalcohols and ketones.
Hydrogen peroxide consists of twohydrogen atoms and two oxygen atoms,bonded by shared electron pairs as shown inFigure 8-16.
CH2C CCH2 + H2O2 CH2 CCH2
O
+ H2O (8-19)
a hydroperoxide
→

Methods for Treating Wastewaters from Industry 251
Figure 8-16 Structure of hydrogen peroxide.
The oxygen — oxygen single bond is rela-tively weak and is subject to break-up to yield•OH free radicals:
H – O – O – H → •OH + •OH
or,
peroxide → Rad•
The two •OH free radicals sometimes simplyreact with each other to produce an undesirableresult; however, the radical can attack a mole-cule of organic matter, and in so doing, produceanother free radical. This is called a chain-initi-ating step:
•OH + RH → H2O + R•
Chain-initiating step
As previously discussed, in free radical oxida-tion of organics, this process continues in sucha way that the organics are broken down all theway to carbon dioxide and water.
R• + R – C → R + R• + C•Chain propagation steps
RH + R• + O → CO2 + H2O
RH + C• + O → CO2 + H2O
Hydrogen Peroxide Plus Ferrous Ion (Fenton’s Reagent)Hydrogen peroxide will react with ferrous
ions to produce ferric ions, hydroxide ions,and hydroxyl free radicals, as shown in equa-tion 8-20:
Fe++ + H2O2 → Fe +++ + OH− + •OH
(8-20)
The hydrogen peroxide thus dissociates intoone hydroxide ion (nine protons and ten elec-trons [OH−]) and one hydroxyl free radical(nine protons and nine electrons [•OH]), asshown in equation 8-21:
uvH2O2 + e− → •OH + OH− (8-21)
In this case, there is only one •OH free radical,as opposed to two •OH free radicals, whenhydrogen peroxide breaks down in the absenceof ferrous ions as discussed previously. The sin-gle •OH then attacks a molecule of organicmaterial, also previously discussed, initiating achain reaction (chain-initiating step) with theresult that the organic material is eventually oxi-dized all the way to carbon dioxide and water.
Hydrogen Peroxide Plus UV LightWhen hydrogen peroxide is added to an aque-
ous solution, which is simultaneously irradiatedwith ultraviolet light (UV), the result is that thehydrogen peroxide breaks down more readilyinto •OH free radicals than when the UV is notpresent, as illustrated in equation 8-22:
uvH2O2 → 2 •OH (8-22)
There are, therefore, significantly morehydroxyl free radicals to enter into chain-initi-ating steps, as discussed previously, than is thecase without UV.

252 Industrial Waste Treatment Handbook
Ultraviolet light greatly increases theoxidative power of hydrogen peroxide, in amanner similar to that of metal activation(Fenton’s reagent). Although it has not beenmade clear how the reaction proceeds, itseems likely that the ultraviolet energyenables hydrogen peroxide to either separateinto two hydroxyl free radicals, each havingnine protons and nine electrons, as suggestedby equation 8-23:
or to obtain an electron from some source,probably the target organic compounds, andthus dissociate into one hydroxide ion (nineprotons and ten electrons (OH–)) and onehydroxyl free radical (nine protons and nineelectrons (•OH)), as shown in equation 8-24:
The hydroxyl free radicals then go on toenter or perpetuate a chain reaction, as shownpreviously.
Oxidation with OzoneOzone, having the chemical formula, O3, is agas at ambient temperatures. Ozone has physi-cal characteristics similar to oxygen but is a farstronger oxidizing agent. Ozone reacts withorganic compounds in a manner similar to thatof oxygen, adding across double bonds andoxidizing alcohols, aldehydes, and ketones toacids. Ozone requires less assistance than doesoxygen, as from heat, catalysts, enzymes, ordirect microbial action.
Ozone Plus Hydrogen PeroxideAddition of both ozone and hydrogen perox-
ide has the effect of oxidizing to destruction
many organics much more strongly and effec-tively than by adding either ozone or hydrogenperoxide alone. When both ozone and hydro-gen peroxide are present in water containingorganics, •OH free radicals are formed througha complex set of reactions. The result of thecomplex reactions is that two •OH radicals areformed from one hydrogen peroxide and twoozone molecules:
The •OH radicals then react with organicsto form harmless carbon dioxide, water, andother smaller molecules. As an example, •OHradicals react with trichloroethylene and pen-tachlorophenol. The products in both casesare carbon dioxide, water, and hydrochloricacid:
The ozone plus hydrogen peroxide systemhas the advantage, compared to, say, Fenton’sreagent, that ozone itself will react in a first-order reaction with organics, resulting in fur-ther reduction of pollutants.
In addition to the formation of •OH radi-cals, as shown by equation 8-26, there mayalso be formation of oxygen free radicals, asfollows:
Oxygen free radicals may then enterinto chain reactions to break up organics inequations 8-29 and 8-30:
(8-23) H2O2 2 •OHuv→
+ (8-24)e–H2O2 OH –+•OH→
+ +H2O2 (8-25)2O3 3O22(•OH)→
+ + +C2HCl3 (8-26)6 •OH 2H2O 3HCl2CO2→
+ + +C6HCl5O
(8-27)18 •OH 7H2O 5HCl6CO2→
+ +H2O2 (8-28)O3 H2O2 (•O)→
CH2C CCH2 CCH2+ •O (8-29)CH2C→
(8-30)CH2 •O
O
CH2C CH2 + •CCH2+→

Methods for Treating Wastewaters from Industry 253
This chain reaction may continue to destroymany organics in addition to those destroyedby ozone and the •OH radicals.
Ozone Plus UV LightOzone can be used in combination with
ultraviolet light to, in some cases, producemore rapid and more complete oxidation ofundesirable organic matter than with eitherozone or ultraviolet light alone. Equation 8-31illustrates this alternative process:
Organic matter + ozone + UV light →C02 + H2O + O2
(8-31)
Here, again, free radicals may or may not beinvolved.
Chlorination of Hydrogen Sulfide to Produce Elemental SulfurHydrogen sulfide is objectionable for several
reasons, including its contribution to crowncorrosion in sewers and its malodorous charac-ter. Hydrogen sulfide can be oxidized to ele-mental sulfur as shown in equation 8-32:
(8-32)
It may then be necessary to neutralize thehydrochloric acid by one of the usual methods.
Additional methods of oxidizing hydrogensulfide to either sulfate ion or elemental sulfur(both odor free) include the following:
1. Raising the level of dissolved oxygen(beyond the level of saturation at atmo-spheric pressure) by adding oxygen underpressure.
2. Adding hydrogen peroxide.3. Adding potassium permanganate.
In the cases of oxygen under pressure orhydrogen peroxide, oxygen oxidizes (takeselectrons away from) sulfur atoms. Normally,if the pH is in the alkaline range, the sulfuratoms will be oxidized to elemental sulfur, and1 gram of hydrogen sulfide will require about2.4 grams of H2O2, depending on side reac-tions. If the pH is in the acid range, the sulfurwill be oxidized all the way to sulfate ion, and
each gram of hydrogen sulfide will require fourtimes more, or about 9.6 grams of hydrogenperoxide as the pure chemical. In contrast, eachgram of hydrogen sulfide will require about 4.2grams of chlorine (as C12) or 11.8 grams ofpotassium permanganate (KMnO4) to oxidizethe sulfur to elemental sulfur.
Co-PrecipitationAlthough technically a physical treatmentmethod because adsorption is the mechanism,co-precipitation is discussed here because it isoften brought about as a result of chemicaltreatment to produce an insoluble substance ofanother target pollutant. For instance, botharsenic and cadmium are effectively co-precip-itated with aluminum or iron. If there isdissolved iron (the soluble form is the ferrous,or +2 state) and arsenic and/or cadmium in anindustrial wastewater, oxygen can be added toform insoluble ferric oxide, which then builds arather loose crystal lattice structure. This pre-cipitate exists in the wastewater medium as asuspension of particulate matter. As these parti-cles are building, arsenic and/or cadmium ions,which are relatively hydrophobic, adsorb tothem, effectively removing them from solution.As the particles settle to the bottom of the reac-tion vessel, and the resulting “sludge” isremoved, the treatment process is completed;however, the removed sludge must now bedealt with. As discussed in the section entitledPhysical Treatment Methods, the usual proce-dure is to separate the water from the particles,using vacuum filtration, sludge pressing, oranother physical separation process, followedby evaporation. The resulting dry mixed metalscan be subjected to metal recovery processes,stored for later metals recovery, or properlydisposed of.
Table 8-8 presents an enumeration of suc-cessful applications of co-precipitation forindustrial wastewater treatment.
Solvent ExtractionSolvent extraction operates on the principle ofdifferential solubilities. When a substance (sol-ute) is dissolved in one solvent and a solvent
H2S Cl2+ 2HCl So
+→

254 Industrial Waste Treatment Handbook
Table 8-8 Applications of Co-precipitation of Metals as a Wastewater Treatment Method
in which that substance is more soluble than itis in the first solvent is added, and the two sol-vents that are not miscible with each other (notsoluble in one another) are mixed vigorouslytogether, the dissolved substance will passfrom the first solvent into the second. The driv-ing force is the second law of thermodynamics,as explained in Chapter 2. The stronger bondenergies that result when the substance is dis-solved in the second solvent result in a lowerlevel of free energy than was the case with thefirst solvent.
Thermal OxidationCertain highly toxic organics, such as PCBsand dioxin, are best destroyed by thermal oxi-dation. Dow Chemical Co., as well as others,constructed incinerators in the 1940s to safelydispose of wastes from the manufacture ofmany different chemicals.
PCBs, which are resistant to biodegradation(meaning that they are biodegraded veryslowly), are destroyed completely by incinera-tion, but temperatures of 2300ºF or more arerequired. Other organics are destroyed at lowertemperatures, and each application must betested and proven.
Thermal oxidation has often been used toremediate contaminated soil. The mechanismand products of thermal oxidation are the sameas for chemical oxidation with oxygen. Themechanism is electrophyllic attack, and theproducts are carbon dioxide, water, and oxi-dized ions and molecules such as sulfate, sulfuroxides, and nitrogen oxides. Equation 8-33 rep-resents the thermal oxidation process.
(8-33)
When thermal oxidation is required, asopposed to chemical oxidation, it is becausethe energy of activation required for the reac-tants shown in equation 8-33 is too great for thereaction to proceed without heat, which sup-plies the energy of activation needed.
Catalytic OxidationWhen the energy of activation required foroxygen, or another oxidizing agent, to reactwith a certain organic substance is too greatfor the reaction to proceed under normal con-ditions, two ways to overcome this deficiencyare (1) to add heat to supply the energy ofactivation, and (2) to add a catalyst, whichreduces the energy of activation. When heat isadded, the process is called thermal oxida-tion. When a catalyst is added, the process iscalled catalytic oxidation. The principal prod-ucts are the same, namely, carbon dioxide andwater (when the oxidation process is allowedto go to completion), and the mechanism ofoxidation is basically the same, except for theeffect of the catalyst in reducing the activa-tion energy. In many cases, the catalyst is notconsumed in the process, as illustrated inequation 8-34:
(8-34)
1. In wastewaters containing iron plus other metals, the wastewater can be aerated to oxidize soluble ferrous ionsto insoluble ferric ions. As the ferric ions precipitate from solution, dissolved species of other metals willadsorb to the growing crystalline precipitates and will thus be removed from solution.
2. In wastewaters of low pH that contain aluminum ions, adjusting the pH to 6.3 or so will cause the aluminum toprecipitate. The aluminum precipitate particles, which include oxides and hydroxides, act as effective adsorp-tion sites for other metals.
3. One of the most effective methods for removing arsenic from wastewaters is to oxidize all of the arsenic toarsenate, then add a source of ferrous ion, such as ferrous sulfate. Then, by maintaining the pH in the neutralrange, and allowing oxygen to react with ferrous ions and precipitate as Fe2O3 crystals, the arsenate will adsorb
to the growing crystals, become entrapped, and be effectively removed.
heat
Organic matter O2+ CO2 H2O+→
SOX NOX+ +
Organic matter O2 catalyst+ + CO2→
H2O catalyst+ +

Methods for Treating Wastewaters from Industry 255
Biological Methods of Wastewater Treatment
Biological treatment of industrial wastewater isa process whereby organic substances are usedas food by bacteria and other microorganisms.Almost any organic substance can be used asfood by one or more species of bacteria, fungi,cilliates, rotifers, or other microorganism. Inbeing so used, complex organic molecules aresystematically broken down, or “disassem-bled,” then reassembled as new cellprotoplasm. Oxygen is required in either thedissolved molecular form or in the form ofanions such as sulfate and nitrate. The endresult is a decrease in the quantity of organicpollutants, and an increase in the quantity ofmicroorganisms, carbon dioxide, water, andother by-products of microbial metabolism.
The following relationship describes the bio-logical treatment process (equation 8-35)where:
Organic matter
1. Is regarded as pollution before the treat-ment process.
2. Is used as food by the microorganisms.3. Might have been formed by a natural pro-
cess, by a living plant or animal, orsynthetically by a chemical manufacturingprocess.
4. Is composed of the elements carbon,hydrogen, oxygen, nitrogen, phosphorus,and many additional elements in muchsmaller amounts. These elements are con-nected by chemical bonds, each of whichis characterized by a certain quantity ofenergy called “bond energy.” As themicroorganisms disassemble the organicmatter, they are able to capture much ofthis energy and use it to make new chemi-cal bonds, in the synthesis of newprotoplasm; however, the process is lessthan 100% efficient. Fewer chemicalbonds can be assembled in the process of
cell synthesis than were disassembledduring the microbial degradation process.Because of this, the microorganisms needa way to get rid of carbon, hydrogen, andother atoms that result from the process ofdegradation but for which there is not suf-ficient energy to form carbon-carbon andother high-energy bonds required in thecell synthesis process. Because relativelylow-energy bonds can be formed with oxy-gen, the microorganisms expel excesscarbon atoms as CO2 and excess hydrogen
atoms as H2O. Other elements, if inexcess, can be combined with oxygen aswell and passed off into solution as theoxide. Nitrate and sulfate are examples.
Microorganisms
1. Include bacteria, fungi, protozoa, nema-todes, and worms.
2. Exist in a hierarchical food chain withinwhich bacteria and fungi feed directly onthe organic matter (pollutants), and thehigher life forms (protozoa, nematodes,etc.) feed on the bacteria.
OxygenIs referred to as:
a. a hydrogen acceptor b. an electron acceptor
More microorganisms
1. Are the result of growth of the microor-ganisms originally present.
2. Must be handled and disposed of as wastesludge.
3. Typically amount, in mass, to one-third toone-half the amount of organic matter (pol-lutants) originally present in the untreatedwastewater, when the organic material ismeasured as BOD and the microorganismsare measured as dried solids.
Organicmatter
Micro-organisms
moremicro-organisms
oxidizedorganicmatter
(8-35)CO2 H2Ooxygen+ + + + +→
256 Industrial Waste Treatment Handbook
C02
1. Is a waste product, in that it is a methodused by the microorganisms to expel car-bon atoms that have resulted fromdegradation of the organic pollutants, butfor which there is not sufficient energy tomake carbon-carbon and other higher-energy bonds needed to make new cellmaterial in the cell growth process.
2. Microorganisms do not disassembleorganic molecules for the fun of it. Theydo it because they have a compulsion togrow (i.e., increase in numbers).
H2O
1. Is a waste product.2. Is the mechanism used by microorganisms
to expel excess hydrogen atoms, derivedduring the process of disassemblingorganic matter.
With respect to oxidized organic matter:
1. The degradation of organic matter by themicroorganisms is not 100% complete.
2. The organic matter in the untreated waste-water may contain some organicmolecules that the microorganisms areunable to degrade.
All biological treatment processes—aero-bic, anaerobic, suspended growth, and fixedgrowth (also referred to as “fixed film”)—areaccurately represented by this relationship. Thedifferences in the various configurations ofprocesses are in the speed of reaction, form ofoxygen used, relative amounts of “more micro-organisms” and “oxidized organic matter” pro-duced, and in the types of tankage andequipment and amount of land required.
The overall process depicted by equation8-31 involves diffusion of the molecules oforganic matter through the aqueous medium(the wastewater itself), and adsorption (or othertype of attachment) of these organic moleculesonto the surface of the microorganisms. Then,the microorganisms to which the molecules, orparticles, of organic matter are attached mustmanufacture enzymes capable of breaking the
organic molecules or particles down intoelementary segments that can pass throughthe microorganism’s cell membranes. Then,the cells’ metabolic machinery “metabolizes”the elementary segments of organic material,rearranging molecular structures and buildingmore cell protoplasm in order to grow bybinary fission, and “wasting” a certain amountof the food as carbon dioxide, water, and somelow-molecular-weight organics (oxidizedorganic material).
Bacteria and fungi are the primary convertersof whatever organic materials are in thewastewater to new cell protoplasm and wastematerials; however, these single-celled micro-organisms make up only a portion of themultitudinous diverse life forms that populate abiological treatment system. In a mature treat-ment system, a food chain hierarchy becomesestablished that ranges from the single-celledprimary converters through several species ofprotozoa, rotifers, worms, and, in some cases,algae, and many other types of microscopiclife forms. The rotifers and successivelyhigher life forms graze on one or more ofthe lower life forms (the primary converters),and the trick to managing a well-operating bio-logical treatment system is to manipulate the“feeding” of the microorganisms and removalof certain quantities of the microorganisms on aperiodic basis (wasting), in order to maintainoptimum relative numbers of the various lifeforms. In activated sludge systems, this is bestdone by controlling sludge age to within a rangethat works best for each individual system.
Development of Design Equations for Biological Treatment of Industrial Wastes
Two equations are used to mathematicallydescribe the fundamental kinetics of the“treatment” that takes place as a result ofmicroorganisms converting organic material tonew cell mass, carbon dioxide, water, andresidual material, referred to as “oxidizedorganic material,” “other low-molecular-weight compounds,” or “refractory organics.”

������� ��� ����� ��������� ���� �������� ���
These equations are empirical, are applicableto the treatment of wastes in all environmentalmedia (as examples, activated sludge treatmentof wastewater containing organics, biofiltrationof air streams containing hydrogen sulfide, andbiodegradation of organics in landfilledsludge), and are stated as follows:
(8-36)
(8-37)
where:
X = Mass of microorganisms (grams orpounds).
F = Mass of organic matter used as food by themicroorganisms (normally expressed asBOD) (milligrams or pounds).
Y = Constant. Represents the proportion oforganic matter that gets converted to newmicroorganism cell material (dimension-less).
kd= Constant. Represents the proportion of the
total mass of microorganisms that self-degrade (endogenous respiration) per unittime (inverse days).
K = Maximum rate at which the microorgan-isms represented by the symbol X are ableto degrade the organic matter, no matterhow much organic matter is present.
Se= Mass of F at the conclusion of the degra-dative process. Equivalent to mass of BODin the treated effluent.
Ks= Mass of organic matter, F, that induces themicroorganisms, X, to degrade thatorganic matter at a rate equal to one-halfthe maximum possible rate, k.
Two additional parameters are defined asfollows:
where:Θc = the average amount of time a compo-
nent of the microbial population spends in thereactor before exiting as effluent solids orbeing removed as daily wasting in order tomaintain a constant amount of microorganismsin the reactor.
(8-39)
Figure 8-17 illustrates the parameters k andKs. As shown, when the concentration of food,or substrate (designated by F, S, BOD, etc.), isvery low, it is therefore limiting, and anincrease in concentration of food results in aproportionate (described by the slope of theline that extends from the origin in a straightmanner) increase in utilization (eating) rate.When the concentration of substrate reaches acertain level (Smax), and from that concentra-tion on, food is not limiting, and the microor-ganisms utilize the food at their maximum rate,k. At the concentration of substrate equal toone-half Smax, the rate of substrate utilizationis equal to Ks. The numerical value of k, asdescribed previously, is specific for a givenpopulation of microorganisms feeding on agiven type, or mixture, of organic substances.As will be shown later, the value of k that ischosen by a design engineer has a direct effecton the size of treatment system, and thereforethe cost, not to mention performance. The
Figure 8-17 Specific utilization vs. substrateconcentration.
dXdt------- Y
dFdt------- kdX–=
dFdt-------
kXSe
Ks Se+-----------------=
Θc = (8-38)
= mean cell residence time = sludge age
X∆X/day
U dF dt⁄X
----------------=

258 Industrial Waste Treatment Handbook
appropriate value of k for given treatment sys-tems has been the subject of heated debate andeven lawsuits. More appropriately, however, ithas been the subject of considerable research.Values of k have been reported throughout theenvironmental engineering literature and haveranged from 0.01 to 5.0, a difference of a factorof 5,000! It is always necessary to understandthe conditions under which a value of k wasdetermined before using that value for any kindof size calculation for a treatment facility.
In the case of a mixture of substances suchas is typical of industrial wastewater, a k rate isapplicable to each individual substance. More-over, when a mixture of substances is utilizedby a population of microbes, those substancesthat are most readily utilized—glucose, forinstance—exhibit the highest value of k. Aseach of the more easily utilized substances inthe original mixture is depleted, the apparentvalue of k decreases. Figure 8-18 illustrateshow the apparent value of k changes with time,as a mixture of substances is utilized.
As shown in Figure 8-18, as a population ofmicroorganisms begins utilizing a mixture ofsubstances, the apparent value of k for the mix-ture is relatively high. As the most easilyutilized substance becomes scarce, the micro-organisms begin utilizing, successively, thosesubstances that are more difficult to utilize, andthe apparent value of k decreases. For the mix-ture as a whole, then, the most appropriatevalue for k is an approximate “average” value,or one that is observed over a lengthy period.
In fact, all of the rate constants in the previ-ous equations are specific for the particularpopulation, or “mix,” of the microbes presentat any given time, as well as for the type ormixture of types of organic matter. These equa-tions were developed using completely solublesubstrate (food) and pure cultures of bacteria.Monod, who developed equation 8-37, usedpure cultures of E. Coli and B. Subtilis inbroths of glucose and mannose.
Dividing dF/dt by X normalizes the rate ofsubstrate removal to a unit weight of microor-ganisms, enabling comparison of performanceamong systems having different food-to-micro-organism mass loading parameters. The result
Figure 8-18 Apparent value of k vs. time for a mixture ofsubstances.
of this mathematical operation is U, the spe-cific substrate utilization rate, as shown inequation 8-39. The parameter Ub would beequal to the food-to-microorganism ratio, F/M,if 100% treatment were taking place.
The fundamental relationships given earliercan be rearranged to develop equations, whichcan be used for design purposes. Table 8-9 pre-sents several versions of design equationsderived from one or more of the basic relation-ships shown previously. The parameters X, Xo,t, F, and Se are measured directly. Θc can becalculated, and the parameters Y, kd, k, and Kscan be determined from the results of eitherbench scale pilot plant data or data from full-scale treatment systems, as shown following.
Development of Biological Treatment Kinetics in the LaboratoryBench scale pilot treatment systems can beused to generate values for the kinetic coeffi-cients and constants needed in designequations as follows; four or more treatmentsystems are operated for several days atsteady state and are identical in all respectsexcept for food-to-microorganism ratio (F/M),and those parameters that F/M affects. Thoseparameters include mixed liquor volatile sus-pended solids concentration (MLVSS), whichis directly related to the value of X. As the
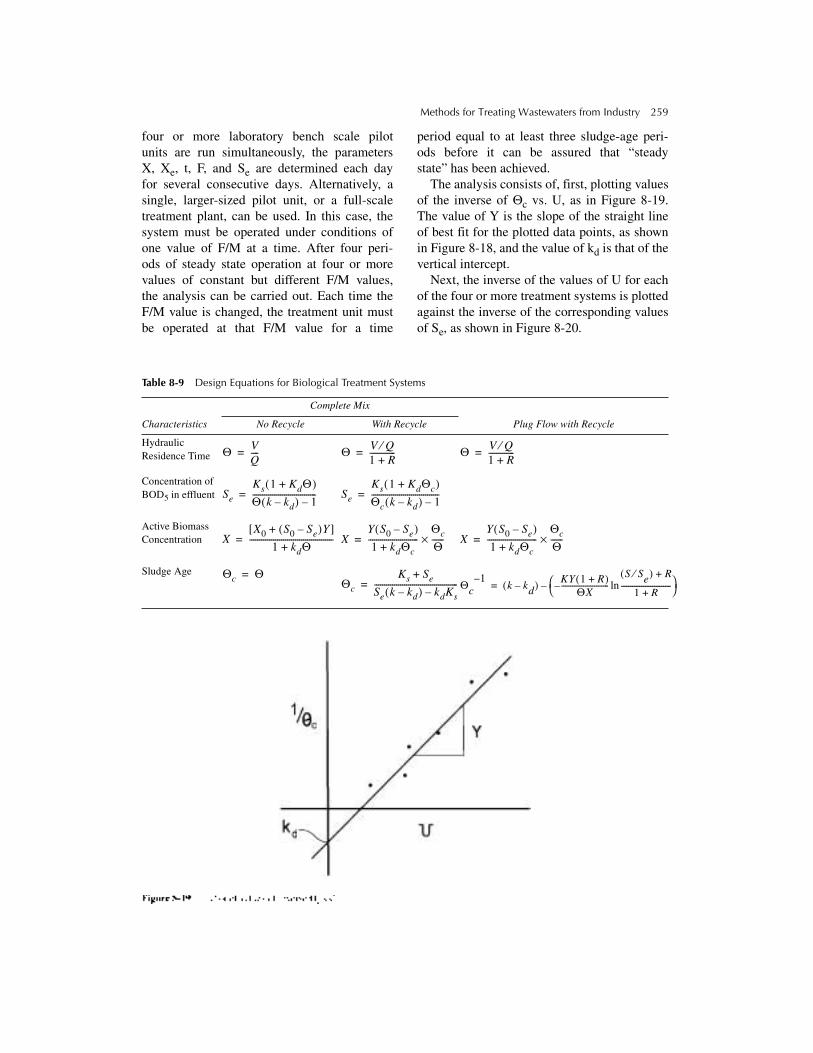
Methods for Treating Wastewaters from Industry 259
four or more laboratory bench scale pilotunits are run simultaneously, the parametersX, Xe, t, F, and Se are determined each dayfor several consecutive days. Alternatively, asingle, larger-sized pilot unit, or a full-scaletreatment plant, can be used. In this case, thesystem must be operated under conditions ofone value of F/M at a time. After four peri-ods of steady state operation at four or morevalues of constant but different F/M values,the analysis can be carried out. Each time theF/M value is changed, the treatment unit mustbe operated at that F/M value for a time
period equal to at least three sludge-age peri-ods before it can be assured that “steadystate” has been achieved.
The analysis consists of, first, plotting valuesof the inverse of Θc vs. U, as in Figure 8-19.The value of Y is the slope of the straight lineof best fit for the plotted data points, as shownin Figure 8-18, and the value of kd is that of thevertical intercept.
Next, the inverse of the values of U for eachof the four or more treatment systems is plottedagainst the inverse of the corresponding valuesof Se, as shown in Figure 8-20.
Table 8-9 Design Equations for Biological Treatment Systems
Complete Mix
Characteristics No Recycle With Recycle Plug Flow with Recycle
Hydraulic Residence Time
Concentration of BOD5 in effluent
Active Biomass Concentration
Sludge Age
Θ VQ----= Θ V Q⁄
1 R+-------------= Θ V Q⁄
1 R+-------------=
Se
Ks 1 KdΘ+( )Θ k kd–( ) 1–--------------------------------= Se
Ks 1 KdΘc+( )Θc k kd–( ) 1–----------------------------------=
XX0 S0 Se–( )Y+[ ]
1 kdΘ+------------------------------------------= X
Y S0 Se–( )1 kdΘc+
-------------------------Θc
Θ------×= X
Y S0 Se–( )1 kdΘc+
-------------------------Θc
Θ------×=
Θc Θ=Θc
Ks Se+
Se k kd–( ) kdKs–------------------------------------------= Θc
1–k kd–( ) KY 1 R+( )
ΘX--------------------------
S Se⁄( ) R+
1 R+---------------------------ln–⎝ ⎠
⎛ ⎞–=

��� �������� ���� �������� ��������
The vertical intercept in Figure 8-20 is thevalue of k, and the slope of the line of best fit(Figure 8-20) is equal to Ks/k. Having thusdetermined values for all of the parameters thatappear in the design equations presented inTable 8-9, the design of a new or modifiedmicrobiological treatment system, or trouble-shooting an existing treatment system,can proceed.
������� ��
Design an aeration tank to reduce the BOD5 ofan industrial wastewater to below 50 mg/L.The BOD5 of the raw wastewater averages1,714 mg/L. Primary treatment is expected toremove 30% of the BOD5. The average rate offlow is 250,000 gallons per day.
Solution:Use complete mix with recycle.The first step is to determine design values forthe appropriate kinetic constants:
k = 0.51 hr−1
Ks = 325 mg/L BOD
Y = 0.57
kd = 2.4 × 10⁻³ hr−1
Θ = 12 hrs. = HRTΘc = 10 days = Sludge Age
a = 1.5 mg COD/mg MLVSS
b = COD/BOD = 1.4
1. Estimate the soluble BOD of the treatedeffluent using the following relationship
Note that this is soluble BOD, which shouldalways be 10 mg/L or less if biological treat-ment is reasonably complete. It would not beuncommon that the total 5-day BOD would bein the range of 30 to 50 mg/L for a wastewaterhaving a BOD as high as 1,714 mg/L.
2. Reactor Volume:
V = Q × Θ = 250,000 gal/day × 1ft3/7.48 gal × 12/24
= 16,700 ft3
3. Required MLVSS concentration:
SKS 1 kdΘc+( )
Θc k0 kd–( ) 1–--------------------------------------=
325 1 2.4 103–
10 24×××+( )
10 24 0.51 2.4 103–×–( ) 1–×
-------------------------------------------------------------------------=
4.24mg L⁄=
XY S0 Se–( )1 kdΘc+-------------------------
Θc
Θ------×=
0.57 1200 4.24–( )
1 2.4 103–
10 24×××+---------------------------------------------------------- 10 24×
12------------------×=

Methods for Treating Wastewaters from Industry 261
4. Calculate the recycle ratio if the concentra-tion of solids in the recycle is 20,000 mg/L:
Qr = 0.84Q
5. Calculate the solids generation rate:
6. Calculate the oxygen consumption rate:
Because the volume of the reacter is 16,700 ft3:
The Role of Oxygen in Wastewater TreatmentAll forms of biological metabolism involve thedisassembly of organic compounds (the food)and reassembly into new cell protoplasm(growth) and waste products. Not all of thefood can be converted to new cell protoplasm,however. It takes a certain amount of energy, inthe form of chemical bond energy, to assemble
new protoplasm; that is, to complete the chemi-cal bonds that hold the carbon, hydrogen, andother elemental units together. The source ofthat energy is the relatively high-energy bondsin the molecules of the organic matter that isused as food. For instance, when a molecule ofglucose is disassembled to obtain energy tobuild protoplasm material, carbon-carbonbonds are broken, with the consequent releaseof 60 to 110 kcal/mole of bond energy, depend-ing on what atoms are bonded to the carbonatom being worked on.
Having obtained the energy from the carbon-carbon bond (and other bonds the carbon atomswere involved in), the organism has no furtheruse for the carbon atoms. These “waste” car-bon atoms cannot simply be discharged to theenvironment by themselves, however. Theymust be attached to other atoms and dischargedto the environment as simple compounds.Because this process also requires energy, the“waste” compounds must be of lower bondenergy than those of the food that was disas-sembled. The balance is then available for con-structing new cell protoplasm.
The atoms to which the “waste” atoms arebonded are known as “ultimate electron accep-tors.” This name arises from the fact that theelectrons associated with the waste carbonatoms are paired with electrons of the “ultimateelectron acceptor” in constructing the moleculeof waste substance.
The function of oxygen in cell metabolism(any cell—animal, plant, or bacterial) is that ofultimate electron acceptor. If the source of oxy-gen is molecular 02 dissolved in water, the pro-cess is termed “aerobic,” and is depicted inequation 8-40:
(bacterial growth not shown here) Notice that equation 8-40 shows that
unwanted hydrogen atoms from the “food” are
8 655mg LMLVSS⁄,=
MLSS 8 655 0.92÷,=∴ 9 400mg L⁄,=
R
1ΘΘc------–
Xr
X----- 1–
----------------1
1210 24×------------------–
20 000,9 400,
------------------ 1–--------------------------- 0.84= = =
Recycle Q 0.84 influent Q×=∴
XWVXΘc-------=
16 700 f t3
8 655mg L1lb
454 103×
------------------------×⁄ 3.78Lgal
--------------7.48gal
ft3
-------------------××,×,
10days--------------------------------------------------------------------------------------------------------------------------------------------=
900lb day⁄=
OXYGEN DEMANDVOLUME TIME–
-----------------------------------------------------
S0 Se–
Θ---------------- 1 ay–( ) 0.9a kd X••+=
1.4 1200 4.24–( )12
----------------------------------------- 1 1.5 0.57( ) 0.921.4
----------×–⎝ ⎠⎛ ⎞=
0.9 1.5 2.4 103–
8 655,××ו+
182 mgO2 L hr⁄⁄=
16 700ft3, 7.48gal
ft3
-------------------3.78Lgal
--------------0.182gL hr–----------------× 1lb
454g------------×××
190 lb Oxygen per day=
R C
H
H
C
H
H
C
H
H
C
H
H
R + O2 CO2 + H2O→
organic matter + dissolved oxygen →carbon dioxide + water
(8-40)

262 Industrial Waste Treatment Handbook
wasted by attaching them to oxygen and dis-charging them to the environment as water(H2O).
If the source of oxygen is one or more dis-solved anions, such as nitrate (NO3), or sulfate(SO4) and if there is no (or very little) dissolvedmolecular oxygen present, the process is termed“anoxic,” and is depicted in equation 8-41:(microbiological growth not shown here)
If there is no oxygen present, either in themolecular O2 form or in the form of anions, thecondition is said to be “anaerobic.” Underanaerobic conditions, cell metabolism takesplace as a result of substances other than oxy-gen functioning as the ultimate electron accep-tor. Equation 8-42 depicts this type ofmicrobiological treatment.
The microorganisms involved in the processdepicted by equation 8-42 are extremely usefulin certain industrial waste treatment applica-tions; for instance, treatment of sugar refinerywastes and fruit-processing wastes, whichcharacteristically contain very low quantitiesof nitrogen and phosphorus compared to theamount of BOD. In a properly designed andoperated facultative lagoon, in which there isenough mixing to maintain movement ofessentially all the liquid (to enhance contactbetween dissolved organics and to reduceshort-circuiting), but not enough aeration isapplied to maintain more than the upper 2 or 3feet of the lagoon in an aerobic state, incomingdissolved BOD is rapidly “sorbed” ontomicrobial cells, which eventually settle to thelagoon bottom. Then, within the sludge layers
at the lagoon bottom, anaerobic degradationtakes place, whereby the sorbed organics aremetabolized, and new (anaerobic) bacterialcells are produced as a result of bacterial“growth.” The production rate of new cells, interms of pounds of new cells produced perpound of organic matter treated (measured asBOD) is significantly less than is the normalcase for aerobic treatment. The advantageousresult is significantly less waste sludge requir-ing disposal.
As indicated in the parenthetical notes, equa-tions 8-35, 8-40, and 8-41 show only the pro-cess of wasting excess carbon, hydrogen, and,in the case of equation 8-41, sulfur atoms, anddo not include the growth process wherebysome of the carbon, hydrogen, sulfur, nitrogen,and other atoms are reassembled to producenew cell protoplasm. These equations showonly that the energy recovered from some ofthe disassembly process must be used to createbonds for waste products, such as carbon diox-ide, water, and other compounds or anions.
Biological Treatment TechnologiesFigure 8-21 presents an enumeration of theprincipal variations of biological methods ofwastewater treatment. As seen in Figure 8-21,it is convenient to classify biological treatmentprocesses as either aerobic or anaerobic (noticethat, as used in this sense, the term, “anaero-bic” includes both anoxic and anaerobic).Within each of those two major categories,there are two principal types of systems:
R C
H
H
C
H
H
C
H
H
C
H
H
R + SO4 CO2 + H2O + H2S + CH4 (8-41)
organic matter + sulfate anions carbon dioxide + hydrogen sulfide + methane
→
→
R C
H
H
C
H
H
C
H
H
C
H
H
R + e− (8-42)reduced organic compounds + CH4→

Methods for Treating W
astewaters from
Industry263
Figure 8-21
Aerobic and anaerobic m
ethods of wastew
ater treatment.
BIOLOGICAL METHODS OFWASTEWATER TREATMENT
Aerobic Anaerobic
SuspendedGrowth
Activated Sludge Lagoon
Conventional Aerated
Extended
High Rate
ContactStabilization
SequencingBatch Reactor
PASVEERDITCH
DEEPSHAFT
PACTOxidation
Pond
FacultativeLagoons
Attached Growth
Trickling Filter Conventional StationaryPacked Bed
Sludge Blanket Fluidized Bed
Lagoons Expanded Bed
RBC
Fluidized Bed
SuspendedGrowth
Attached Growth

264 Industrial Waste Treatment Handbook
suspended growth and attached growth. Thesuspended growth systems all have diversepopulations of microbes suspended in a mix-ture of liquid that includes the wastewaterbeing treated. When the concentration ofmicrobes is relatively high, as in the case ofactivated sludge, the mixture of suspendedmicrobes, wastewater being treated, and othersubstances, both dissolved and suspended, isreferred to as “mixed liquor suspended solids”(MLSS). The term “MLVSS” is used to desig-nate that portion of the MLSS that is activemicrobes. The V in this term stands for “vola-tile.” That the MLVSS concentration is only anapproximate indicator of the actual concentra-tion of active microbes in a mixture ofactivated sludge is discussed in Chapter 6.
Attached growth systems all have masses ofmicrobes attached to a medium. Wastewater tobe treated flows in contact with this mediumand, especially, the attached microorganisms.The microbes are able to access the organicmatter in the wastewater as a result of the waste-water flowing over, around, and through themedia to which the microbes are attached. The
trickling filter and the rotating biologicalcontactor are familiar examples of fixedgrowth systems.
As explained earlier, aerobic wastewatertreatment systems require that dissolvedmolecular oxygen, as the molecule O2, bepresent and available to the microbes as theydisassemble organic pollutant molecules. It isconvenient to categorize aerobic wastewatertreatment systems according to their relative“intensity of treatment.” A treatment system ofhigh intensity is one in which the concentra-tions of both pollutants and microorganismsare high. Oxygen must be added in high quan-tity to maintain aerobic conditions, and the sys-tem is said to be relatively highly stressed.Aerobic biological treatment systems range inintensity from high-rate activated sludge, hav-ing MLVSS concentrations as high as 10,000mg/L and hydraulic retention times as low as afew hours, to very low-stressed aerobic or fac-ultative nonaerated lagoons having MLVSSconcentrations of less than 100 mg/L andhydraulic retention times of more than100 days. Figure 8-22 presents an ordering of
Figure 8-22 Distribution of various types of activated sludge treatment systems, based on treatment intensity, in terms ofmass loading of BOD (lbs/BOD/ft3/day).

Methods for Treating Wastewaters from Industry 265
aerobic, suspended growth wastewater treat-ment systems ranging from stabilization pondsto high-rate activated sludge. Fixed growth sys-tems also vary in treatment intensity butnormally over a smaller range than suspendedgrowth systems.
Development of the most cost-effective sus-pended growth system is usually a matter oftradeoff between capital cost and operation andmaintenance (O&M) costs. The present valueof the total capital cost spread over the usefullife of the facility and the O&M costs, alsoexpressed as present value in order to allowdirect comparison, often change in inverse pro-portion to each other. Low-intensity systemsrequire larger tankage and more land area butfewer O&M costs in terms of electrical powerfor aeration and labor costs for operators.High-intensity systems require more skilledoperators and significantly more oxygen sup-plied by mechanical means but smaller tankageand land area.
Treatment of Industrial Wastewaters Using Aerobic Technologies
Suspended Growth Systems: Activated SludgeAn activated sludge wastewater treatment
system has at least four components, as shownin Figure 8-23; an aeration tank and a settlingtank (clarifier), a return sludge pump, and ameans of introducing oxygen into the aerationtank. Wastewater, sometimes pretreated andsometimes not, enters the aeration tank (and is,therefore, the “influent”) and is mixed with a
suspension of microbes in the presence of oxy-gen. This mixture is referred to as “mixedliquor.” The microbes “metabolize” the organicpollutants in the wastewater, converting themto more microbes, carbon dioxide, water, andsome low-molecular-weight organics, asdepicted in equation 8-35. After spending, onaverage, an amount of time equal to thehydraulic residence time (ϑ) in the aerationtank, the mixed liquor flows into the clarifier,where the solids (MLSS) separate from thebulk liquid by settling to the bottom. The clari-fied “effluent” then exits the system. Thesettled solids are harvested from the clarifierbottom and are either returned to the aerationtank or are “wasted.” Those MLVSS solids thatare returned to the aeration tank are microbesin a starved condition, having been separatedfrom untreated wastewater for an extendedperiod, and are thus referred to as “activated.”This process of returning microbes from theclarifier to the aeration tank enables buildup oftheir concentrations to high levels (1,800 to10,000 mg/L), and that, indeed, characterizesthe activated sludge process itself.
Those MLSS that are taken out of the sys-tem, and are therefore referred to as “wasted,”represent the main means of controlling the“mean cell residence time,” or “sludge age.”Sludge age is an extremely important parame-ter in the successful operation of an activatedsludge treatment system. Activated sludge sys-tems that are maintained at a very low sludgeage, on the order of two days or so, containwhat is known as a very young population,which is typically highly active and mobile and
Figure 8-23 Basic components of an activated sludge system.

266 Industrial Waste Treatment Handbook
difficult to induce to settle well in the clarifier.Activated sludges having somewhat longersludge ages, between 7 and 15 days, have manymore microorganisms per unit of organic“food.” They are, therefore, in a much morestarved condition than a sludge of youngsludge age and tend to predation and cannibal-ism. When food becomes very scarce, themicroorganisms themselves become food. Thelive bacteria and fungi are food for higher lifeforms, and those that die, break apart, and spewtheir cell contents into the fluid medium arefood for other bacteria and fungi.
In order to defend themselves against pre-dation and cannibalism, some microbialspecies are able to exude and surround them-selves with a protective mass of a polysaccha-ride material. In addition to affordingprotection, this gelatinous material helps toflocculate the microbes that make up theMLVSS, enabling better settling characteris-tics in the clarifier.
When the sludge age increases to more than20 days or so, the microbes become soadvanced in predatory behavior that theydevelop the ability to manufacture enzymesthat can break down the polysaccharide protec-tive material. The sludge thus loses its excel-lent flocculent nature and, consequently, itsgood settling characteristics.
The best settling activated sludge and, there-fore, the system that produces the clearesteffluent, is that system in which the gelatinouspolysaccharide protective material is main-tained in optimum amounts.
In terms of treated effluent quality, the efflu-ent from activated sludge systems having verylow sludge ages is typically high in suspendedsolids; those having sludge ages of around 10days have low suspended solids, and those hav-ing a very high sludge age are often very highin suspended solids.
An excellent tool for use in maintaining anoptimum activated sludge culture, in terms oftreatment performance, settleability, and lowconcentration of solids in the effluent, is themicroscope. The usefulness of microscopicexamination of activated sludge as an aid forprocess control can be explained as follows.
Consider a container of fresh, biodegradablewastewater, inocculated with a “seed” of acti-vated sludge from a well-operating treatmentsystem. The container is aerated, well-mixed,and receives a steady supply of biodegradableorganics, but at a rate that is slower than thegrowth rate of the microbial population thatdevelops. Figure 8-24 depicts such a system.Initially, there is a very high concentration of“food” compared to the numbers of microor-ganisms. Under this condition, bacteria multi-ply at their maximum rate. Each individualbacterial cell “grows,” and by the process ofbinary fission, becomes two cells within a timeperiod corresponding to the maximum attain-able growth rate of that particular species,which can be as short a time as 20 minutes. Alogarithmic increase in numbers of the fastest-growing bacteria that can readily metabolizethe organics in the wastewater takes place, andthose bacteria dominate the population duringthe first few hours. Examination of a sample ofthe contents of the container, using a micro-scope, shows this to be the case.
Figure 8-24 depicts the relative numbers ofseveral of the major types of microbes, as theyincrease and decrease, with time, under theconditions described in the preceding para-graph. As shown in Figure 8-24, during the ini-tial hours, there is not much growth ofanything, while the microbes with which thecontainer was “seeded” become adjusted to thenew environment. They need to manufacturethe appropriate enzymes for the particular mol-ecules of food available. This period is referredto as the “lag phase of growth.”
As the first individual bacteria develop theseenzymes and begin to grow, the phase ofincreasing growth rate occurs, and, eventually,full logarithmic growth takes place and contin-ues as long as food is unlimited and predationdoes not occur. Figure 8-25 shows the so-calledgrowth curve that applies to each individualspecies of microbe within the container. Thisfigure shows that, sooner or later, within anybiological system that can be described by thepreceding paragraphs, food becomes limitedand the rate of growth declines. Some individ-ual microbes grow and some die. Normally,

Methods for Treating Wastewaters from Industry 267
Figure 8-24 Progressive growths and deaths of microorganisms in activated sludge.
Figure 8-25 Typical growth curve.

268 Industrial Waste Treatment Handbook
there is a period when the growth rate equalsthe death rate, and the population is stable.Finally, as the food supply runs out, and/or pre-dation exceeds growth, the population declines.
Returning to Figure 8-24, and consideringthe microbial population within the containeras a whole, as the bacteria that first begin grow-ing reach high numbers, microbes that prey onthem begin to grow. Then, in succession,higher forms of microorganisms that can feedon the microorganisms that grow earlier (andare thus said to be higher on the food chain) gothrough their own growth curve process. In abiological treatment system, that successionis typically flagellated bacteria (bacteriaequipped with a “tail” that propels them), free-swimming ciliates, stalked ciliates, rotifers,and finally, worms. Microscopic examinationof a sample of the microbial population from agiven treatment system, then, can reveal thecurrent stage of development of the system, interms of “young sludge” or “old sludge.”
Experience has shown that, usually, opti-mum operation of activated sludge occurswhen the relative proportions of amoeboids,flagellated bacteria, free-swimming ciliates,stalked ciliates, and rotifers are as shown inFigure 8-26. Figure 8-26 shows that, whenactivated sludge is in a young condition, therelative numbers of flagellated bacteria andfree-swimming bacteria are high, and thereare almost no stalked ciliates. The effluentfrom the secondary clarifier is high in sus-pended solids, and many of those solidsconsist of long, thin bits and pieces of ill-formed activated sludge, referred to as“stragglers.” The cure for this condition is todecrease the food-to-microorganism ratio bywasting less sludge and allowing the concen-tration of MLVSS in the aeration tank toincrease.
Figure 8-26 shows further that when the rel-ative proportions of rotifers, stalked ciliates,and nematodes becomes high, compared to theflagellated bacteria and free-swimming cili-ates, there will again be high solids in theeffluent from the secondary clarifier. In thiscase, the solids appear as tiny, more or lessspherical bits and pieces of activated sludge,
referred to as “pin floc.” The cure for this con-dition is to increase the rate of sludge wasting,thus increasing the food-to-microorganismratio.
Unfortunately, it is not always the case thatadjusting the rate of sludge wasting cures prob-lems of high suspended solids in the treatmentsystem effluent. Conditions other than sludgeage that can affect effluent quality are concen-tration of dissolved oxygen in the aerationtank, degree of mixing, the changing nature ofthe influent to the aeration tank, temperature,and the presence of toxic materials. High num-bers of filamentous organisms within the acti-vated sludge community, as explained in thesection titled Selectors, is a common cause ofpoor effluent quality.
Selectors. Among the most common problemsassociated with activated sludge treatment sys-tems is the poor settling of the activated sludgeitself, referred to as “bulking sludge,” causedby the presence of so-called filamentousmicroorganisms. Filamentous microorganisms,sometimes called “filaments,” are characterizedby long strands of “hairlike filaments.” A smallamount of these microbes is good to havebecause they help to produce clarity in theeffluent, but too many lead to an unacceptablyslow settling rate.
There are three principal causes for thedevelopment of excess numbers of filamentousmicrobes within an activated sludge system:(1) low concentrations of nutrients, especiallynitrogen and/or phosphorus; (2) low levels ofdissolved oxygen, either throughout the aera-tion tank or in pockets within the aeration tank(resulting from inadequate mixing); and (3)low levels of organic loading (low F/M ratio).So-called selectors have been very effective inpreventing the development of dominant popu-lations of filamentous microorganisms fromoccurring.
A selector is a device that counteracts thethird of these causes. It is basically a chamberin which the activated sludge experiences highF/M conditions for a period that is shortcompared to the time spent in the aeration tank.
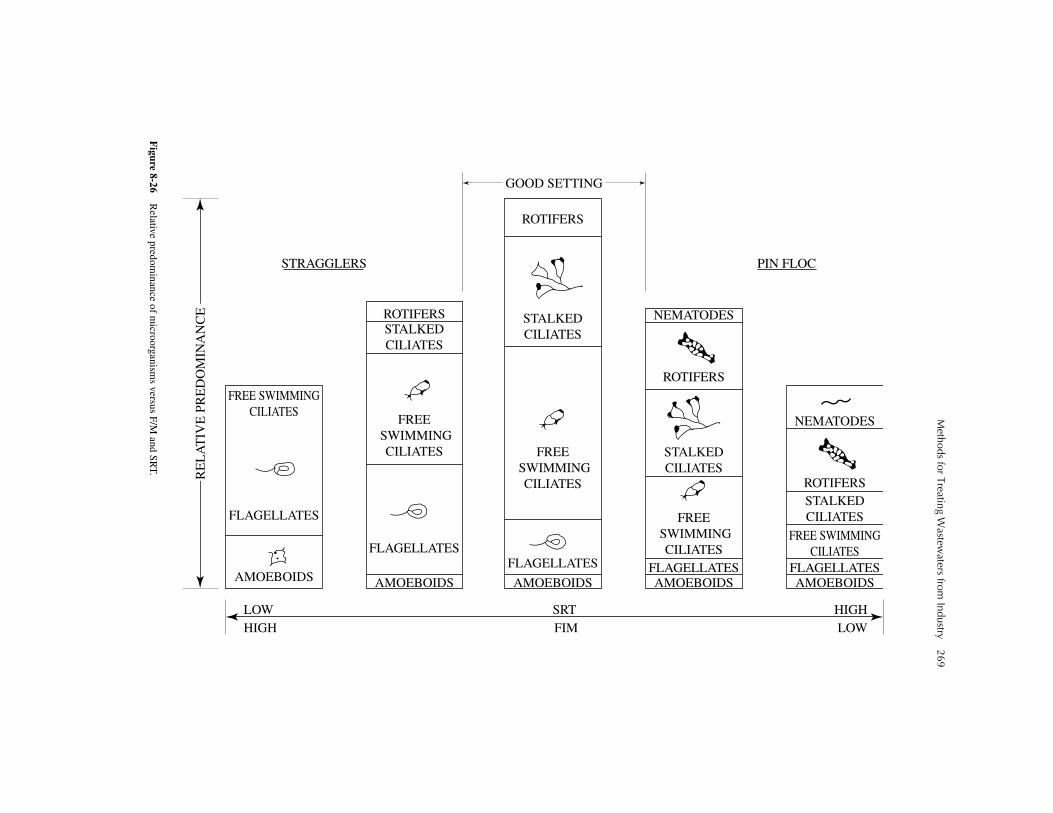
Methods for Treating W
astewaters from
Industry269
Figure 8-26
Relative predom
inance of microorganism
s versus F/M and SR
T.
HIGHLOW
LOW
AMOEBOIDS
FLAGELLATES
HIGHSRTFIM
FREE SWIMMINGCILIATES
AMOEBOIDS
FLAGELLATES
FREE SWIMMING
CILIATES
STALKEDCILIATES
ROTIFERS
AMOEBOIDS
FLAGELLATES
FREE SWIMMING
CILIATES
STALKEDCILIATES
ROTIFERS
AMOEBOIDSFLAGELLATES
ROTIFERS
NEMATODES
FREE SWIMMING
CILIATES
STALKEDCILIATES
AMOEBOIDSFLAGELLATES
ROTIFERS
NEMATODES
FREE SWIMMINGCILIATES
STALKEDCILIATES
RE
LA
TIV
E P
RE
DO
MIN
AN
CE
PIN FLOCSTRAGGLERS
GOOD SETTING

270 Industrial Waste Treatment Handbook
Under the high F/M conditions, the “good”microbes outcompete the bad (filamentous)microbes, preventing their growth. In thehigh F/M environment, the nonfilamentousmicrobes adsorb most of the dissolved organics,leaving insufficient food for the filamentousorganisms in the more dilute environment of theaeration tank.
The most common type of selector is a tankof 10 to 30 minutes hydraulic retention time,completely mixed, in which return sludge anduntreated wastewater are commingled beforeproceeding to the aeration tank. This tank canbe separate from the aeration tank, or it can bea compartment within the aeration tank. Often,the latter can be done at lower constructioncost. Figure 8-27 shows two general variationsof construction of selectors.
Selectors can be aerobic, anoxic, or anaero-bic but must always be well mixed. Therefore,a selector should be equipped with bothmechanical mixing and aeration, in order toprovide the flexibility to operate aerobically orotherwise, as experience indicates which pro-duces the best results.
VARIATIONS OF THE ACTIVATED SLUDGE PROCESS.Activated sludge is essentially a biologicalwastewater treatment process in which micro-organisms feed on waste organic matter in anaeration tank, grow in numbers as a result, areseparated from the treated wastewater in a clar-ifier that follows, hydraulically, the aeration
basin, and are then returned to the aerationbasin in a starved condition in order to greatlyincrease the numbers of microorganisms in theaeration tank. The basic process is extremelyflexible and capable of many different configu-rations. Table 8-10 lists eight alternativeconfigurations and presents comments regard-ing the characteristics and appropriate use ofeach.
CONVENTIONAL PLUG FLOW. If there is a stan-dard of reference for the activated sludgewastewater treatment process, it is the conven-tional plug flow system; however, conventionalplug flow is by no means the most commonvariation of biological treatment system usedfor industrial wastes. Figure 8-23 presentsa schematic of conventional plug flow.Table 8-10 notes several important features orcharacteristics that distinguish this systemfrom other variations of the activated sludgeprocess. As shown in Figure 8-28, and noted inTable 8-10, the most outstanding characteris-tic of plug flow is the long, narrow pathwaythe wastewater must traverse in flowing fromthe inlet to the outlet of the aeration tank. Thereason for this is to ensure that the microbes,having entered the aeration tank as returnsludge at the tank inlet, have sufficient time tobe in contact with the organic matter containedin the volume of wastewater they originallymixed with, in order that as little mixed liquoras possible gets through the tank in a period
Figure 8-27 Variations in selector configuration.

Methods for Treating Wastewaters from Industry 271
TABLE 8-10 Variations of the Activated Sludge Process
Figure 8-28 Basic flow pattern of the conventional plug flow variation of the activated sludge process.
Process Variation Comment
Conventional plug flow Aeration tanks are long and narrow to minimize short-circuiting. Operational parametersrange as follows: HDT; 4-6 hrs, F/M; 0.3-0.6, MCRT; 7-14 days, F/M is high at head of tank,low at effluent end.
Conventional complete mix
Aeration tanks square or circular, conc. of substances everywhere equal to conc. in effluent,shock effects minimized, operational parameters as for conventional plug flow.
PACT process Aeration tanks either plug flow or complete mix. Powdered act. carbon added to aerationtank to remove nonbiodegradable organics. Operational parameters as for other variations.
Extended aeration Aeration tanks as for either plug flow or complete mix, sludge wasting rate low, MCRT 20days or more, MLVSS 1,600-2,200 mg/L, F/M 0.05-0.1. Hydraulic retention time 20 hoursor more.
High rate aeration Aeration tanks as for complete mix, F/M; 0.8-1.2, MLVSS; 5,000-10,000 mg/L, aeration ratevery high, HRT; 3-6 hrs, MCRT; 15-25 days.
Contact stabilization Aeration tank as for plug flow or complete mix, contact tank precedes clarifier, sludge flowsto aeration tank, MLSS in aeration tank (called stabilization tank) 3,000-6,000 mg/L, HRT;contact tank 30 min or so, HRT; stab. tank 3-8 hrs.
Sequencing batch reactor
Aeration tank as for complete mix, operational parameters as for conventional, aeration tankand clarifier are one and the same.
Pasveer ditch Aeration tank unique configuration, see description below. Operational parameters similar toconventional plug flow.
Deep shaft Aeration tank unique configuration, see description below. Operational parameters similar toconventional plug flow.

272 Industrial Waste Treatment Handbook
shorter than the theoretical detention time. Animportant design objective, then, is to mini-mize short-circuiting.
Several different approaches have beenused to create a long, narrow flow paththrough the aeration tank. The most commonapproach has been to make use of baffles in arectangular tank as shown in Figures 8-29 (a)and (b); however, research has shown thatbaffles create dead volumes, as depicted inFigure 8-30. Figure 8-30 shows that, as the
mixed liquor flows from the inlet to theoutlet, dead volumes exist in the regions ofcorners and wherever flow proceeds aroundthe end of a baffle. The undesirable effects ofthe dead volumes are (1) reduction of theworking volume of the aeration tank, withconsequent reduction of actual HRT, and (2)development of anaerobic conditions in thedead volumes with consequent bad odorsand development of filamentous bacterialpopulations.
Figure 8-29 Baffle arrangements in a flow-through tank.
Figure 8-30 “Dead volume” in a baffled, flow-through tank.

Methods for Treating Wastewaters from Industry 273
CONVENTIONAL COMPLETE MIX. The “completemix” variation of the activated sludge processis modeled after the familiar completely mixedcontinuous flow reactor, which is used in manymanufacturing processes. The mathematicalrelationships that were developed many yearsago and published in the chemical engineeringliterature can be used for design as well as foroperation. For instance, the “standard” equa-tion that relates the change in concentration ofa given substance entering a completely mixedreactor to the concentration leaving the reactoras influenced by the theoretical hydraulicretention time and the reaction rate is given by:
(8-43)
where:
Coi = Concentration of substance i enter-ing the reactor.
Cei = Concentration of substance i exit-ing the reactor.
k = Rate of reaction of substance i inthe reactor.
t = Amount of time, on the average,molecules or other elementalquantity of substance i spend in thereactor.
Stated in terms of kinetic parameters, asdeveloped earlier in this chapter, the concentra-tion of BOD5 (for instance) in the effluent from
a completely mixed activated sludge system isgiven by:
(8-44)
where:
S = Concentration of substrate (i.e., BOD5)in the effluent.
Ks = Mass of organic matter that induces the
microorganisms to degrade that organicmatter at a rate equal to one-half themaximum possible rate, k.
kd = Constant. Represents the proportion ofthe total mass of microorganisms thatself-degrade (endogenous respiration)per unit time (inverse days).
k = Maximum rate at which the microor-ganisms represented by the symbol Xare able to degrade the organic matter,no matter how much organic matter ispresent.
Figure 8-31 is a diagrammatical representa-tion of a wastewater treatment plant designedto operate in the completely mixed mode.
One of the major differences between theconventional plug flow system and the com-plete mix system is in regards to short-circuit-ing. In the plug flow variation, the objective ofboth design and operation is to keep short-cir-cuiting to an absolute minimum. As little as
Figure 8-31 Schematic diagram of a complete-mix activated sludge system.
Cei
Coi
1 kt+-------------=
SKs 1 kdΘc+( )Θc k kd–( ) 1–----------------------------------=

274 Industrial Waste Treatment Handbook
possible of the incoming pollutants shouldreach the effluent in amounts of time shorterthan the theoretical hydraulic retention time,calculated by dividing the volume of the tankby the flow rate. In the case of the completemix system, the objective is to manage short-circuiting, recognizing that a certain quantityof the pollutants will reach the effluent almostimmediately after entering the aeration tank.
Figure 8-31 illustrates that when an elemen-tal volume of flow enters the reactor, it isimmediately dispersed throughout the reactor.The effluent, at any instant in time, is simply aninstantaneous sample of the completely mixedcontents of the reactor. Therefore, the concen-tration of any given substance in the effluent isthe same as its concentration in the reactor, andthe effluent necessarily contains a smallamount of unreacted substance.
The primary advantages, then, of the com-plete mix variation of the activated sludge pro-cess, are:
1. Slug doses of any given constituent arequickly diluted to the maximum extentafforded by the aeration tank.
2. The amount of short-circuiting and, there-fore, the amount of unreacted pollutant canbe controlled in a direct manner, by manip-ulation of the flow rate (for a given volumeof aeration tank), and determined bycalculation.
The complete mix variation of the activatedsludge process is often favored for applicationto industrial wastewaters, largely because of itsability to dilute slug doses of substances and towithstand periodic changes in wastewater char-acteristics because of changes in activity withinthe manufacturing plant. Either diffused ormechanical aeration can be used, and, in somecases, when the concentration of substances tobe treated is low (relatively, volume of aerationtank is high), a combination of mechanicalmixing devices plus diffused or mechanicalaeration is the least costly system.
THE PACT MODIFICATION OF ACTIVATED SLUDGE.The powdered activated carbon technology(PACT) modification of the activated sludge
process is a proprietary process that was devel-oped during the mid-1970s to solve problemsthat related to the nonbiodegradability of cer-tain synthetic organics. The PACT process isessentially one of the familiar variations of theactivated sludge process with the additionalfeature that powdered activated carbon isadded to the aeration tank. The activated car-bon is incorporated into the MLSS to adsorborganics that are dissolved in the wastewater.The activated carbon adsorbs almost anyorganic, whether biodegradable or not, but theadsorbed biodegradable organics tend to beremoved by microbial action, whereas the non-biodegradable organics do not. The result isthat the activated carbon becomes saturatedwith nonbiodegradable organics and eventuallymust be removed from the system. Figure 8-32shows, diagrammatically, the PACT modifica-tion of activated sludge in the complete mixmode.
Because the powdered activated carbon isincorporated into the MLSS within the acti-vated sludge system, it is removed as a conse-quence of normal sludge wasting that is done tocontrol the mean cell residence time (sludgeage). The wasted sludge can then be inciner-ated to reduce the volume of excess biologicalsolids and, at the same time, regenerate theactivated carbon. Experience has shown thatabout 20% of the adsorptive capacity of theactivated carbon is lost with each regeneration;therefore, continual makeup with new activatedcarbon is required.
The appropriate quantity of powdered acti-vated carbon must be determined, first, by lab-oratory experimentation, then by operatingexperience. To prevent discharge of excessivenonbiodegradable organics during start-up andduring the first few weeks of operation of aPACT system, an excessive quantity of acti-vated carbon should be added, then the concen-tration reduced gradually until one or more ofthe target substances begins to be detected.
PREDICTIVE MATHEMATICAL MODEL OF THE PACTPROCESS. A predictive mathematical model thatcan be used to analyze laboratory scale pilot
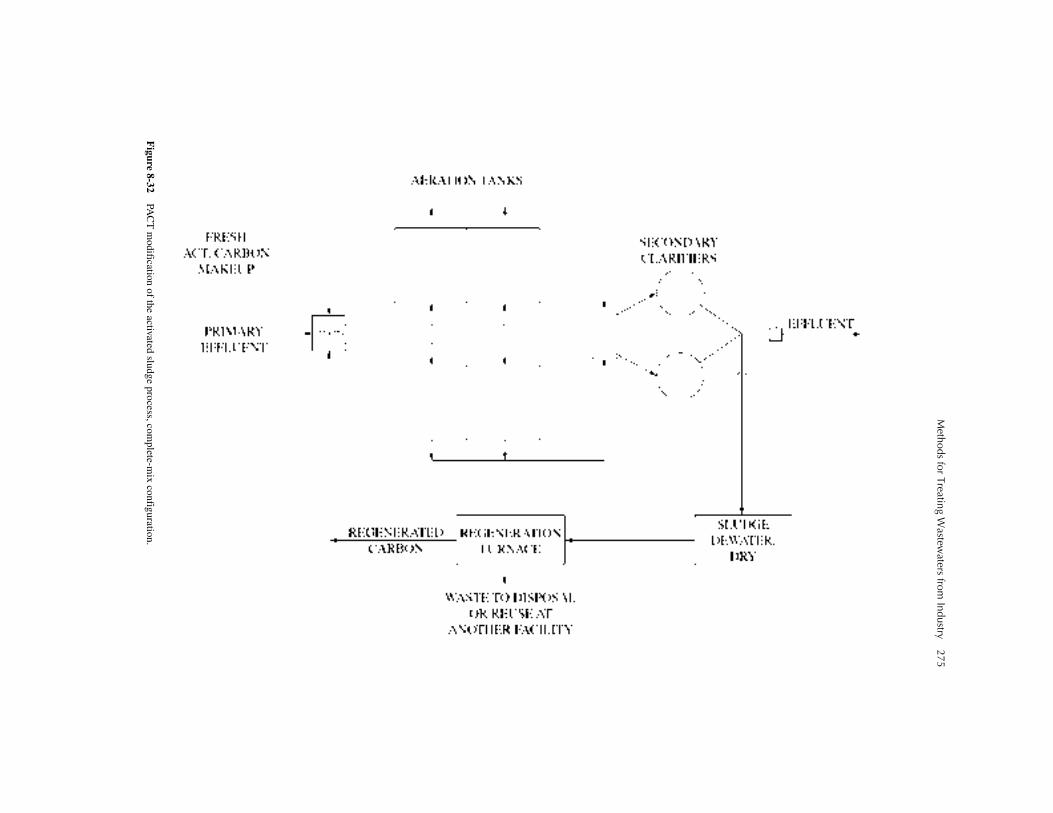
Methods for Treating W
astewaters from
Industry275
Figure 8-32
PAC
T m
odification of the activated sludge process, complete-m
ix configuration.

276 Industrial Waste Treatment Handbook
data to develop design parameters for a full-scale PACT system is presented as follows.
The parameters needed to design the biolog-ical portion of the PACT process are the sameas for ordinary activated sludge; namely, thecoefficients Y, kd, k, and Ks, as explained pre-viously. Furthermore, the laboratory proce-dures to use to develop values for theseparameters are the same as presented earlier;namely, the use of “block aerators,” and thedaily monitoring of food in, food out, sludgegrowth, and oxygen utilized. In the case of thePACT process, however, it is necessary todetermine, and then subtract, the influences oforganic matter removed and daily sludgeincrease, in order to determine those values thatwere caused by biological activity.
EXTENDED AERATION ACTIVATED SLUDGE. Theextended aeration modification of activatedsludge has the design objective of lower costsfor waste sludge handling and disposal, at asacrifice of higher capital costs because oflarger tankage and more land area per unit ofBOD loading. There may be a savings in O&Mcosts resulting from a lower level of intensityrequired from the operators, but there is anincrease in the amount of oxygen required perpound of BOD in the influent because of theincreased amount of autooxidation (there issome increase in aeration via the surface of theaeration tank because of the larger surfacearea). The reduction in amount of wastedsludge to be disposed of per pound of BODremoved results from the increase in autooxi-dation (use of the contents of the cells of deadmicrobes for food) because of a longer sludgeage. Table 8-10 shows the range of values forF/M loading, hydraulic detention time, sludgeage, and MLVSS concentrations appropriate tothe extended aeration modification of the acti-vated sludge process.
HIGH-RATE MODIFICATION OF ACTIVATED
SLUDGE. The high-rate modification of the acti-vated sludge process is simply one ofthe previously described modifications (plugflow, complete mix, or other) in which theMLVSS concentration is maintained at a signif-icantly higher concentration than is normal for
conventional processes, and hydraulic retentiontime is significantly shorter than “normal.” Thehigh-rate process can be used to treat readilybiodegradable wastes such as fruit-processingwastewaters, but effective equalization isrequired to prevent short-term changes in wastecharacteristics.
Advantages of the high-rate process are that itis effective in overcoming the problem of the ten-dency toward bulking caused by dominance offilamentous organisms in complete mix systems,as well as lower construction costs because ofsmaller tankage. Disadvantages include rela-tively intense operational control requirements,as well as relatively large quantities of wastesludge because of less autooxidation.
CONTACT STABILIZATION MODIFICATION OF
ACTIVATED SLUDGE. The contact stabilizationmodification differs from the conventional pro-cess in that the activities that normally take placein the aeration tank—adsorption of substancesonto the microorganisms, then metabolism, orconversion of these substances to more micro-organisms plus waste products—are separated.As shown in Figure 8-33, the untreated waste-water is mixed with return sludge in a relativelysmall “contact tank.” The rapid process ofadsorption of pollutants takes place here. Themixture then moves on to an aeration tank, or“stabilization tank,” where microbial metabo-lism takes place. The aeration tank is alsorelatively small, compared to conventional acti-vated sludge, because only the sludge, afterseparating from the bulk liquid in the clarifier,proceeds to the aeration tank. The bulk liquid iseither discharged from the clarifier as final efflu-ent or is subjected to further treatment, such asdisinfection, sand filtration, or another process.Because only the sludge (with its load ofadsorbed organic material) proceeds to the aer-ation tank, energy requirements for mixing arelower.
The principal advantage of contact stabiliza-tion is the lower capital cost because of smallertankage; however, this modification is useful ononly wastes that are rapidly adsorbed. In general,those wastes are characterized by a high propor-tion of dissolved, relatively simple organics.

Methods for Treating Wastewaters from Industry 277
Figure 8-33 Schematic of contact stabilization modification of activated sludge.
SEQUENCING BATCH REACTOR MODIFICATION OF
THE ACTIVATED SLUDGE PROCESS. The sequenc-ing batch reactor (SBR) process is amodification of complete mix activated sludge.As diagrammed in Figure 8-34, the two princi-pal sequential processes of activated sludge—aeration and settling—take place in the sametank. Settling occurs, after sufficient aerationtime for treatment has taken place, after turningoff all aeration and mixing. Then, clarifiedsupernatant is decanted, the reactor is refilledwith fresh, untreated wastewater, and thecycle is repeated. Waste sludge is withdrawnimmediately after the react phase has beencompleted.
An SBR is normally operated in six sequen-tial stages, or phases, as follows:
1. Fill phase. The reactor is filled until thedesired F/M ratio has been reached.
2. React phase. The reactor is mixed and aer-ated. Treatment takes place.
3. Sludge wasting phase. A quantity of mixedliquor that corresponds to the quantity of
solids, on a dry basis, is withdrawn fromthe completely mixed contents of the reac-tor. For instance, if a 10-day sludge age isdesired, one-tenth of the volume of thereactor is withdrawn each day.
4. Settle phase. Aeration and mixing are ter-minated, and the reactor functions as aclarifier.
5. Decant phase. Clarified, treated wastewa-ter is withdrawn from the top one-quarterto one-third of the reactor.
6. Idle phase. The system can be mixed andaerated at a low rate for a few days at atime needed between periods of wastegeneration.
There are several modifications to the basicprocedure outlined previously. For instance, ithas been found advantageous in some cases toeither mix, aerate, or both, while filling is tak-ing place. In these cases, the first one or twostages are referred to as the “mixed fill phase,”followed by the “react fill phase” (stages 1 and2), or just “the react fill phase” (phase 1). Also,

278 Industrial Waste Treatment Handbook
Figure 8-34 Schematic of sequencing batch reactor process.
some operators have found it acceptable towaste sludge from the bottom of the reactorafter settling has taken place. Although thispractice results in handling less water with thewaste sludge, it does not ensure the removal ofthe same fraction of the active microbial solidseach day, as does the practice of wasting acertain fraction of the mixed reactor contentseach day.
Among the several important advantages ofthe SBR process is its capability of having thereact phase extended for as long as is neces-sary to achieve the desired degree of treat-ment. In this respect, it is good designpractice to have at least two parallel SBRunits, each of at least half the design capac-ity. In the absence of a parallel unit, a collec-tion tank, designed and operated as anequalization basin, can receive and storewastewater until the SBR unit is able toreceive more wastewater.
With two parallel SBR units, the followingtroubleshooting procedures are available to theoperator:
1. If one of the units receives a large slugdose, the second unit can be used to per-form double duty while the first unit isallowed to continue to react until thesupernatant is suitable for discharge.
2. If one of the SBR units becomes upsetbecause of toxicity, or another reason, thesecond unit can be placed in “double-dutymode,” then the contents of the upset unitcan be bled into the operating unit at asslow a rate as is necessary for completetreatment and recovery of the upset unit totake place. During extended periods of lowwaste generation, such as for yearly main-tenance shutdown of the processing plant,all of the MLSS can be placed in one ofthe SBR units. It can then be “fed” a smallamount of synthetic waste to maintain via-bility of the microbes.
3. As is the case for duplicate systems ofany unit process, one can be used for treat-ment while the other is emptied formaintenance.
In short, the operator has more flexibilityand control with SBR technology than withflow-through technology. Any or all of thecycle stages can be lengthened or shortened toachieve desired treatment. The “idle phase”allows taking up the slack between the totallengths of time of the other five phases and the24-hour day.
SBR technology has successfully, and verycost effectively, been used for removal of nitro-gen (by the nitrification-denitrification process).
High Level
(React)
Low Level
Aerators
DecantSystem
EFF.
DecantPump
Raw
PrimaryEffluentIn
or

Methods for Treating Wastewaters from Industry 279
It has also, but less frequently, been used toremove phosphorus.
The nitrification-denitrification process canbe incorporated into the operation of an SBRsystem as follows:
1. Allow nitrification to take place during thereact phase by:
a. maintaining dissolved oxygen (DO)level above 2 mg/L
b. maintaining the temperature within thereactor higher than 17º C
c. maintaining sufficient react time
If these conditions are maintained, and if nosubstances in the wastewater are toxic to thenitrosomonas species, nitrification of theammonia released from the organic matter in“treating” the BOD will take place. Then, deni-trification (conversion of the nitrate ions tonitrogen gas) can be induced by:
2. Discontinue aeration, but maintain mixingafter the react phase.
During this period, the contents of the reac-tor become anoxic. Facultative bacteria (nitro-bacter) continue to oxidize organic matter(BOD) and use the oxygen atoms from thenitrate ions for an electron acceptor.
There are “tricks” to achieving successfulnitrification-denitrification as well as desiredBOD removal using SBR technology. One trickis to maintain the proper amounts of time foreach phase. Another is to manage the amountof BOD remaining after the react cycle (byaddition of methanol, if necessary) so there isenough to support the denitrification process,but not enough to cause noncompliance.
SBR technology can be used to achieve alower quantity of phosphorus in the industrialwaste discharge, but only with the successfulapplication of more operator skill than for ordi-nary operation. Some phosphorus will alwaysbe removed with the waste sludge because allanimal and plant cells contain phosphorus. Themicrobial cells of the activated sludge can beinduced to take up more than the normal amountof phosphorus (referred to as “luxury uptake ofphosphorus”). If this is done successfully, more
phosphorus than normal is included with eachpound of waste sludge. The procedure forinducing luxury uptake of phosphorus in anSBR system is as follows:
3. Allow anaerobic conditions to developwithin the contents of the reactor by theabsence of aeration during the fill cycle.As soon as the small amount of nitratethat is contained in the MLSS at this pointhas been used up for its oxygen (electronacceptor) content, the microbes that arecapable will turn to phosphate ions. Themicrobes will absorb and/or adsorb phos-phate ions at this point, effectivelyremoving them from the bulk liquid.
4. Allow sufficient time during and possiblyafter the fill phase for the “luxury uptake”of phosphorus to take place to the maxi-mum. Experimentation that is carefullycontrolled and with observations recordedis required.
5. Conduct the sludge-wasting phase at thispoint, before the react phase.
6. Begin aeration and, consequently, the reactphase.
The contents of the reactor should be wellmixed, in order to maintain contact betweenthe microbes and the dissolved phosphate ions,throughout steps 1 through 4.
PROCEDURE FOR DESIGN OF AN SBR SYSTEM. Thefollowing procedure can be used to design anSBR wastewater treatment system. In allinstances where the word, “select” appears, thedesign engineer must have available eitherextensive experience with the wastewater inquestion, or the results of extensive laboratoryand/or pilot treatability studies.
1. Select a hydraulic retention time.
2. Select an F/M loading.
3. Obtain the kinetic coefficients.
4. Select a value for the concentration of set-tled sludge.
5. Select a value for the specific gravity ofthe settled sludge.
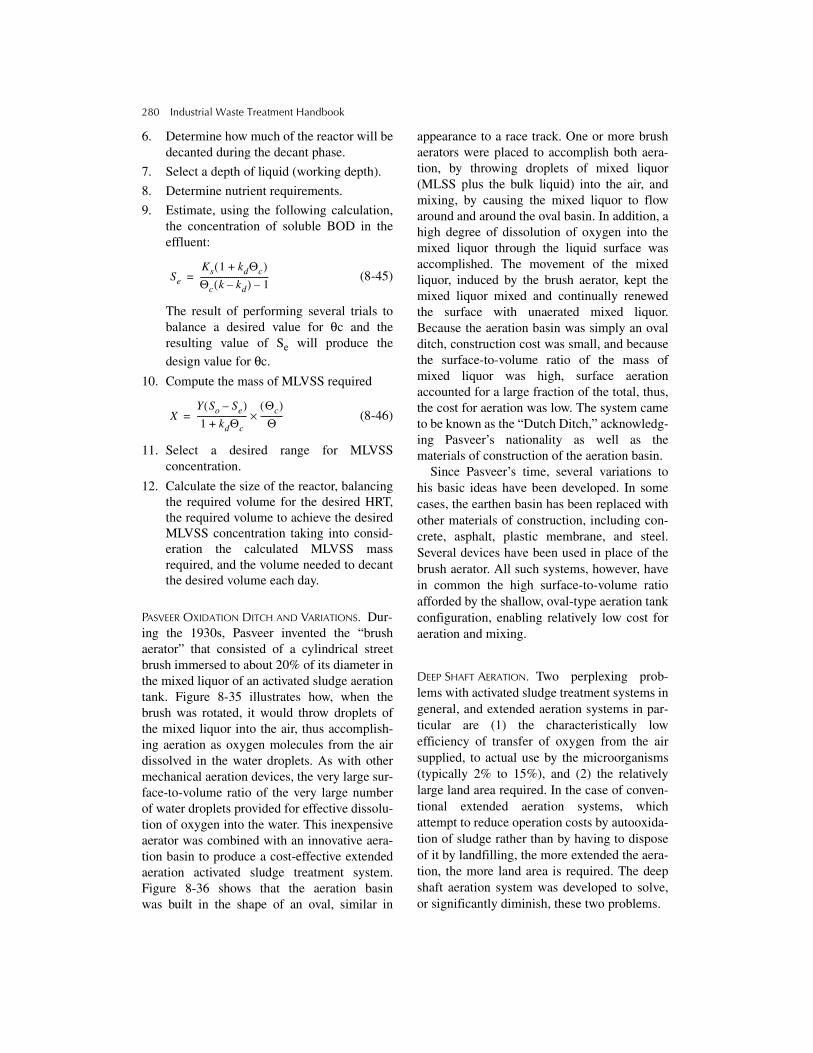
280 Industrial Waste Treatment Handbook
6. Determine how much of the reactor will bedecanted during the decant phase.
7. Select a depth of liquid (working depth).
8. Determine nutrient requirements.
9. Estimate, using the following calculation,the concentration of soluble BOD in theeffluent:
(8-45)
The result of performing several trials tobalance a desired value for θc and theresulting value of Se will produce thedesign value for θc.
10. Compute the mass of MLVSS required
(8-46)
11. Select a desired range for MLVSSconcentration.
12. Calculate the size of the reactor, balancingthe required volume for the desired HRT,the required volume to achieve the desiredMLVSS concentration taking into consid-eration the calculated MLVSS massrequired, and the volume needed to decantthe desired volume each day.
PASVEER OXIDATION DITCH AND VARIATIONS. Dur-ing the 1930s, Pasveer invented the “brushaerator” that consisted of a cylindrical streetbrush immersed to about 20% of its diameter inthe mixed liquor of an activated sludge aerationtank. Figure 8-35 illustrates how, when thebrush was rotated, it would throw droplets ofthe mixed liquor into the air, thus accomplish-ing aeration as oxygen molecules from the airdissolved in the water droplets. As with othermechanical aeration devices, the very large sur-face-to-volume ratio of the very large numberof water droplets provided for effective dissolu-tion of oxygen into the water. This inexpensiveaerator was combined with an innovative aera-tion basin to produce a cost-effective extendedaeration activated sludge treatment system.Figure 8-36 shows that the aeration basinwas built in the shape of an oval, similar in
appearance to a race track. One or more brushaerators were placed to accomplish both aera-tion, by throwing droplets of mixed liquor(MLSS plus the bulk liquid) into the air, andmixing, by causing the mixed liquor to flowaround and around the oval basin. In addition, ahigh degree of dissolution of oxygen into themixed liquor through the liquid surface wasaccomplished. The movement of the mixedliquor, induced by the brush aerator, kept themixed liquor mixed and continually renewedthe surface with unaerated mixed liquor.Because the aeration basin was simply an ovalditch, construction cost was small, and becausethe surface-to-volume ratio of the mass ofmixed liquor was high, surface aerationaccounted for a large fraction of the total, thus,the cost for aeration was low. The system cameto be known as the “Dutch Ditch,” acknowledg-ing Pasveer’s nationality as well as thematerials of construction of the aeration basin.
Since Pasveer’s time, several variations tohis basic ideas have been developed. In somecases, the earthen basin has been replaced withother materials of construction, including con-crete, asphalt, plastic membrane, and steel.Several devices have been used in place of thebrush aerator. All such systems, however, havein common the high surface-to-volume ratioafforded by the shallow, oval-type aeration tankconfiguration, enabling relatively low cost foraeration and mixing.
DEEP SHAFT AERATION. Two perplexing prob-lems with activated sludge treatment systems ingeneral, and extended aeration systems in par-ticular are (1) the characteristically lowefficiency of transfer of oxygen from the airsupplied, to actual use by the microorganisms(typically 2% to 15%), and (2) the relativelylarge land area required. In the case of conven-tional extended aeration systems, whichattempt to reduce operation costs by autooxida-tion of sludge rather than by having to disposeof it by landfilling, the more extended the aera-tion, the more land area is required. The deepshaft aeration system was developed to solve,or significantly diminish, these two problems.
Se
Ks 1 kdΘc+( )Θc k kd–( ) 1–----------------------------------=
XY So Se–( )1 kdΘc+
-------------------------Θc( )Θ
-----------×=

Methods for Treating Wastewaters from Industry 281
Figure 8-35 Pasveer’s “brush aerator.”
Figure 8-36 Schematic of Pasveer oxidation ditch.
With respect to low efficiency of oxygentransfer, one of the basic causes is the low driv-ing force for dissolution of oxygen, which, asexplained earlier, is simply the differencebetween the saturation concentration in themixed liquor and the concentration that actu-ally exists. This driving force can be increasedin direct proportion to the value of the satura-tion concentration for any given value of theactual concentration. The saturation concentra-tion can be increased in direct proportion to thepressure of oxygen in the gas volume that is incontact with the mixed liquor, and this pressurecan be increased in direct proportion to thedepth beneath the surface of the aeration basin
at which bubbles of gas containing oxygenexist. These facts led to the realization that ifan aeration basin were configured as a verylong U-tube of small diameter, and if this U-tube-shaped basin were oriented vertically toattain very high hydraulic pressure at the bot-tom, because of the very deep column of liquidabove it, the saturation concentration of oxy-gen would be many times higher than usuallyexperienced with activated sludge. The resultwould be a driving force many times greater,and transfer efficiency would increase accord-ingly. Thus, the deep shaft aeration system,shown diagrammatically in Figure 8-37, wasdeveloped.

282 Industrial Waste Treatment Handbook
Figure 8-37 Schematic of a deep shaft treatment system.
Figure 8-37 shows a deep shaft aerationsystem consisting of a 20-foot diameter bor-ing into the earth, similar to a mine shaft. Apartition separates the shaft into two compart-ments. Raw or, in some cases, pretreated,wastewater enters the compartment on the leftand is drawn down toward the bottom of theshaft by a small difference in hydrostatic headbetween the two sides. Air bubbles are blowninto the compartment containing “fresh”wastewater, only a few feet below the sur-face. Thus, the pressure against which theblowers work to force air into the mixedliquor is small. These air bubbles are carrieddown to the bottom of the shaft with themixed liquor because the velocity of the fluidtoward the bottom of the shaft is greater than
the rise rate of the bubbles. As the bubbles arecarried deeper into the shaft, the hydrostaticpressure becomes greater, thus the pressurewithin the bubbles becomes greater. Thegreater pressure in the bubbles causes the sat-uration concentration of oxygen in the mixedliquor to increase proportionately; thus, thedriving force for dissolving oxygen into waterincreases.
Pressure does not influence microbial activ-ity; therefore, the bacteria and other microbesthroughout the full depth of the shaft can utilizethe oxygen within the air bubbles that wereintroduced into the mixed liquor under low-pressure conditions. The result is a profoundincrease in the efficiency of the transferof oxygen.
Raw orPrimary Effluent
Blower
Air in
R.A.SWaste Sludge
Clarifier Effluent

Methods for Treating Wastewaters from Industry 283
Design and Operational Characteristics ofActivated Sludge Systems. Table 8-11 presentsimportant design and operational characteris-tics of five alternative configurations of theactivated sludge method of wastewatertreatment.
The parameters presented in Table 8-11 are“average” values, applicable to wastewatersthat have concentrations of BOD, TSS, FOG,and other common parameters that are not faroutside the normal ranges found in municipalwastewater. In cases of activated sludge treat-ment systems for industrial wastewaters havingconcentrations of BOD or other characteristicsthat are significantly outside these ranges, labo-ratory and/or pilot studies must be conducted.There is no reliable way to transpose, or inter-polate, performance characteristics of one ofthese biological treatment processes asachieved with one type of wastewater onanother, unless the fundamental characteristicsof the pollutants in the wastewater are similar.
Aeration Systems for Activated Sludge. Airmust be supplied to activated sludge systems
for mixing and to provide oxygen for microbialrespiration. There is a wide range of alternativeair supply systems available, and there can beas much as a 150% difference in totalannual costs from one system to another.Figure 8-38(a)–(p) presents an enumeration ofthe major types of aeration devices available.
As shown in Figure 8-38, the two principaltypes of aeration device are mechanical anddiffuser. The basic difference between the twois that the mechanical aerators cause smalldroplets of the mixed liquor to be thrown upout of the aeration tank, through the air abovethe tank, and back down into the tank. Thesemechanical devices also mix the contents of theaeration tank, with the objectives of (1) therebeing no “dead zones,” and (2) each portion ofthe liquid mass in the aeration tank beingthrown into the air every few minutes. Oxygentransfer takes place through the surface of eachdroplet. For this reason, the more efficientmechanical aerators are those that create thelargest surface-to-volume ratio of the activatedsludge mass per unit of energy expended perunit of time, explained as follows.
Table 8-11 Design and Operational Characteristics of Activated Sludge Systems
Figure 8-38(a) Alternative device for diffusion: Aerationpanel. (Photo courtesy of Parkson Corporation.)
Figure 8-38(b) Alternative device for diffusion: Flexiblemembrane diffuser. (Photo courtesy of ParksonCorporation.)
ParameterSystem Type
HRT SludgeAge
MLVSSmg/L
Conventional 6–8 hrs 7–12 days 2,000–3,000
Extended 20 hrs 20 days 1,200–2,500
High Rate 3–4 hrs 6–10 days 2,500–4,000
Contact Stabilization 0.5 hrs 7–12 days 2,000–3,000
Sequencing Batch Reactor 6–8 hrs 7–12 days 2,000–3,000
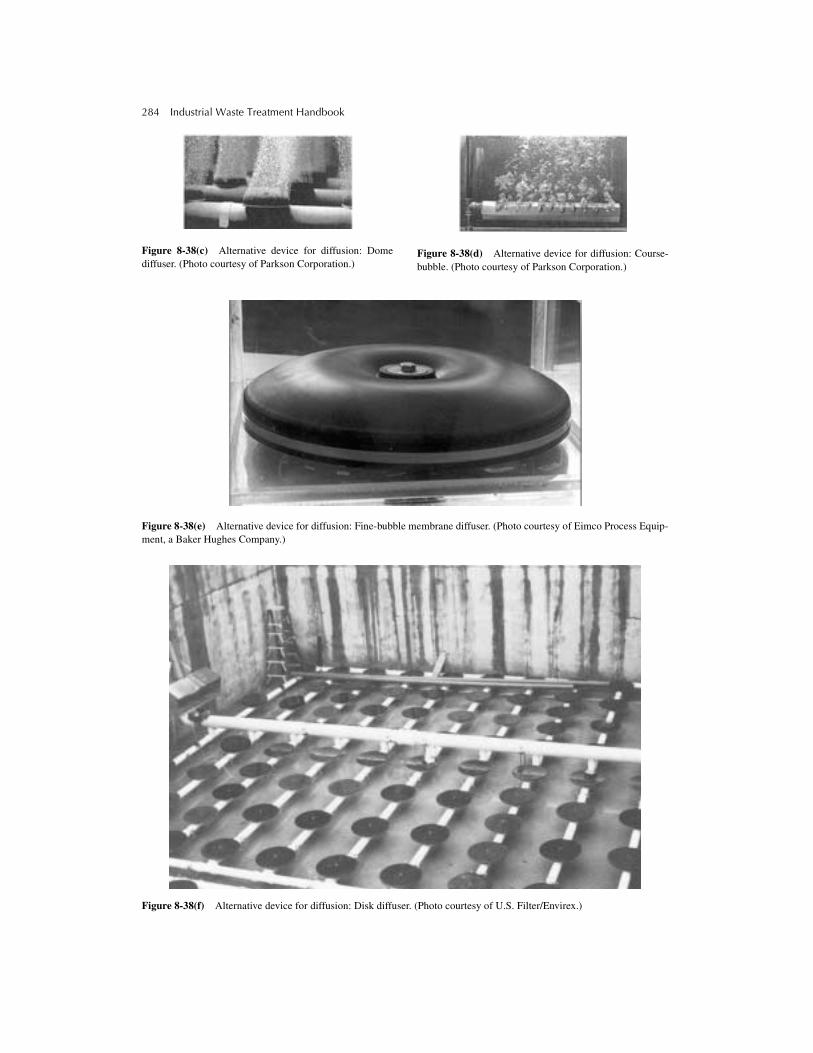
284 Industrial Waste Treatment Handbook
Figure 8-38(c) Alternative device for diffusion: Domediffuser. (Photo courtesy of Parkson Corporation.)
Figure 8-38(d) Alternative device for diffusion: Course-bubble. (Photo courtesy of Parkson Corporation.)
Figure 8-38(e) Alternative device for diffusion: Fine-bubble membrane diffuser. (Photo courtesy of Eimco Process Equip-ment, a Baker Hughes Company.)
Figure 8-38(f) Alternative device for diffusion: Disk diffuser. (Photo courtesy of U.S. Filter/Envirex.)
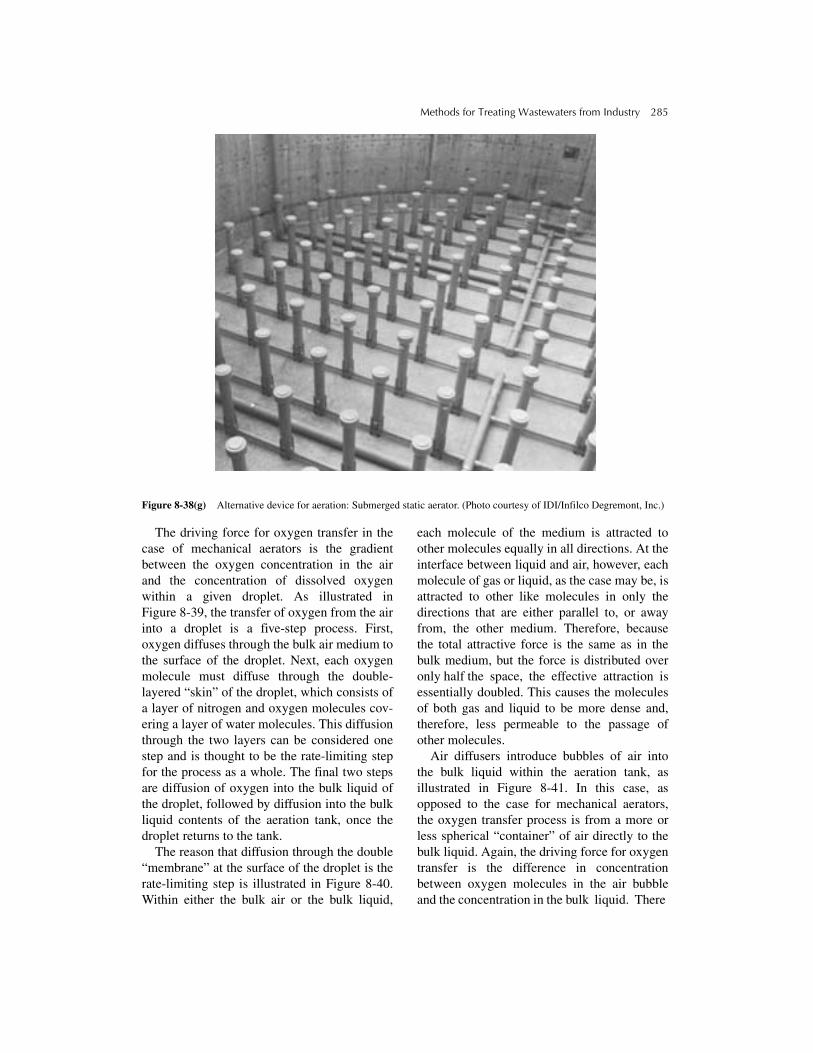
Methods for Treating Wastewaters from Industry 285
Figure 8-38(g) Alternative device for aeration: Submerged static aerator. (Photo courtesy of IDI/Infilco Degremont, Inc.)
The driving force for oxygen transfer in thecase of mechanical aerators is the gradientbetween the oxygen concentration in the airand the concentration of dissolved oxygenwithin a given droplet. As illustrated inFigure 8-39, the transfer of oxygen from the airinto a droplet is a five-step process. First,oxygen diffuses through the bulk air medium tothe surface of the droplet. Next, each oxygenmolecule must diffuse through the double-layered “skin” of the droplet, which consists ofa layer of nitrogen and oxygen molecules cov-ering a layer of water molecules. This diffusionthrough the two layers can be considered onestep and is thought to be the rate-limiting stepfor the process as a whole. The final two stepsare diffusion of oxygen into the bulk liquid ofthe droplet, followed by diffusion into the bulkliquid contents of the aeration tank, once thedroplet returns to the tank.
The reason that diffusion through the double“membrane” at the surface of the droplet is therate-limiting step is illustrated in Figure 8-40.Within either the bulk air or the bulk liquid,
each molecule of the medium is attracted toother molecules equally in all directions. At theinterface between liquid and air, however, eachmolecule of gas or liquid, as the case may be, isattracted to other like molecules in only thedirections that are either parallel to, or awayfrom, the other medium. Therefore, becausethe total attractive force is the same as in thebulk medium, but the force is distributed overonly half the space, the effective attraction isessentially doubled. This causes the moleculesof both gas and liquid to be more dense and,therefore, less permeable to the passage ofother molecules.
Air diffusers introduce bubbles of air intothe bulk liquid within the aeration tank, asillustrated in Figure 8-41. In this case, asopposed to the case for mechanical aerators,the oxygen transfer process is from a more orless spherical “container” of air directly to thebulk liquid. Again, the driving force for oxygentransfer is the difference in concentrationbetween oxygen molecules in the air bubbleand the concentration in the bulk liquid. There
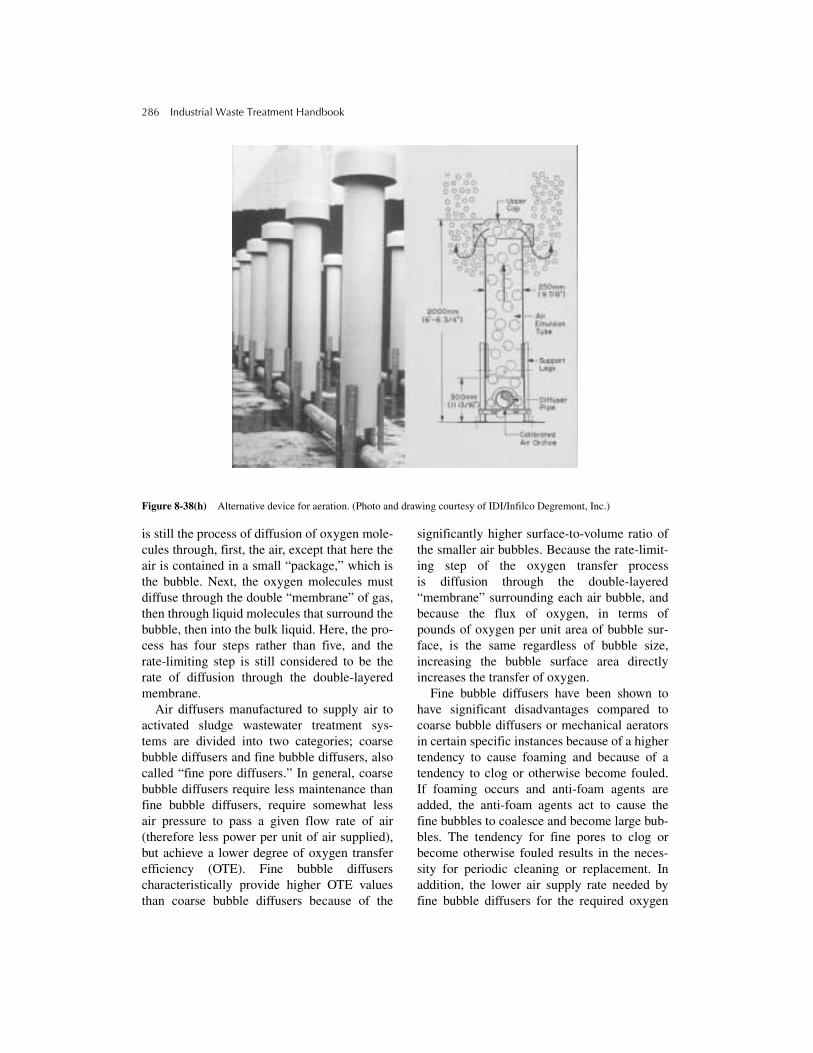
286 Industrial Waste Treatment Handbook
Figure 8-38(h) Alternative device for aeration. (Photo and drawing courtesy of IDI/Infilco Degremont, Inc.)
is still the process of diffusion of oxygen mole-cules through, first, the air, except that here theair is contained in a small “package,” which isthe bubble. Next, the oxygen molecules mustdiffuse through the double “membrane” of gas,then through liquid molecules that surround thebubble, then into the bulk liquid. Here, the pro-cess has four steps rather than five, and therate-limiting step is still considered to be therate of diffusion through the double-layeredmembrane.
Air diffusers manufactured to supply air toactivated sludge wastewater treatment sys-tems are divided into two categories; coarsebubble diffusers and fine bubble diffusers, alsocalled “fine pore diffusers.” In general, coarsebubble diffusers require less maintenance thanfine bubble diffusers, require somewhat lessair pressure to pass a given flow rate of air(therefore less power per unit of air supplied),but achieve a lower degree of oxygen transferefficiency (OTE). Fine bubble diffuserscharacteristically provide higher OTE valuesthan coarse bubble diffusers because of the
significantly higher surface-to-volume ratio ofthe smaller air bubbles. Because the rate-limit-ing step of the oxygen transfer processis diffusion through the double-layered“membrane” surrounding each air bubble, andbecause the flux of oxygen, in terms ofpounds of oxygen per unit area of bubble sur-face, is the same regardless of bubble size,increasing the bubble surface area directlyincreases the transfer of oxygen.
Fine bubble diffusers have been shown tohave significant disadvantages compared tocoarse bubble diffusers or mechanical aeratorsin certain specific instances because of a highertendency to cause foaming and because of atendency to clog or otherwise become fouled.If foaming occurs and anti-foam agents areadded, the anti-foam agents act to cause thefine bubbles to coalesce and become large bub-bles. The tendency for fine pores to clog orbecome otherwise fouled results in the neces-sity for periodic cleaning or replacement. Inaddition, the lower air supply rate needed byfine bubble diffusers for the required oxygen

Methods for Treating Wastewaters from Industry 287
transfer results in less air for mixing, which isan important component of aeration. The addi-tion of one or more alternatives to satisfy mix-ing requirements—for instance, by supplyingmore air than is required for oxygen transfer, orby making use of mechanical mixers alongwith the fine bubble aerators—sometimesresults in the long-term economics favoringcoarse bubble diffusers.
Some industrial wastes have chemical orphysical characteristics that result in theirbeing bad candidates for fine bubble diffusers.Sometimes, the reason is obvious. Treatmentsystems for potato starch processing wastewa-ter, which foams copiously because of thetypes of proteins present, and treatment of pulpmill wastewaters, which contain chemical com-ponents (possibly including sulfonated rem-nants of lignin) that cause small bubbles tocoalesce, are examples.
Basics of Oxygen Transfer. The basic relation-ship that describes the oxygen transfer processis as follows:
(8-47)
where:
dC = Change in concentration of oxygenwith time dt.
KLa = Overall mass transfer coefficient.
Made up of the coefficients KL, theliquid film coefficient, and a, the unitinterfacial area.
C*inf = The saturation concentration for oxy-
gen in water. It is the concentration towhich oxygen would become dis-solved in water if a gas containingoxygen is in contact with water for aninfinite period. Its value is propor-tional to the mole fraction of oxygenin the gas that is in contact with water.
C = Concentration of dissolved oxygen attime t.
The value of KLa in this equation is nor-mally determined by experiment. C*inf and Care measured directly, and KLa is determinedby performing a regression analysis of oxygenuptake data obtained by conducting experi-ments during which oxygen concentration ismeasured at progressive times after aeration of
Figure 8-38(i) Alternative device for aeration: Typical deep basin flow pattern. (Drawing courtesy of IDI/Infilco Degre-mont, Inc.)
dCdt------- KLa Cinf
∗ C–( )=

288 Industrial Waste Treatment Handbook
Figure 8-38(j) Alternative device for aeration. (Courtesy of IDI/Infilco Degremont, Inc.)

Methods for Treating Wastewaters from Industry 289
Figure 8-38(k) Alternative device for aeration: Pontoon-mounted, aspirating aerators. (Photo courtesy of Eimco ProcessEquipment, a Baker Hughes company.)
Figure 8-38(l) Alternative device for aeration: Fixed-mounted, aspirating aerators. (Photo courtesy of Eimco ProcessEquipment, a Baker Hughes Company.)
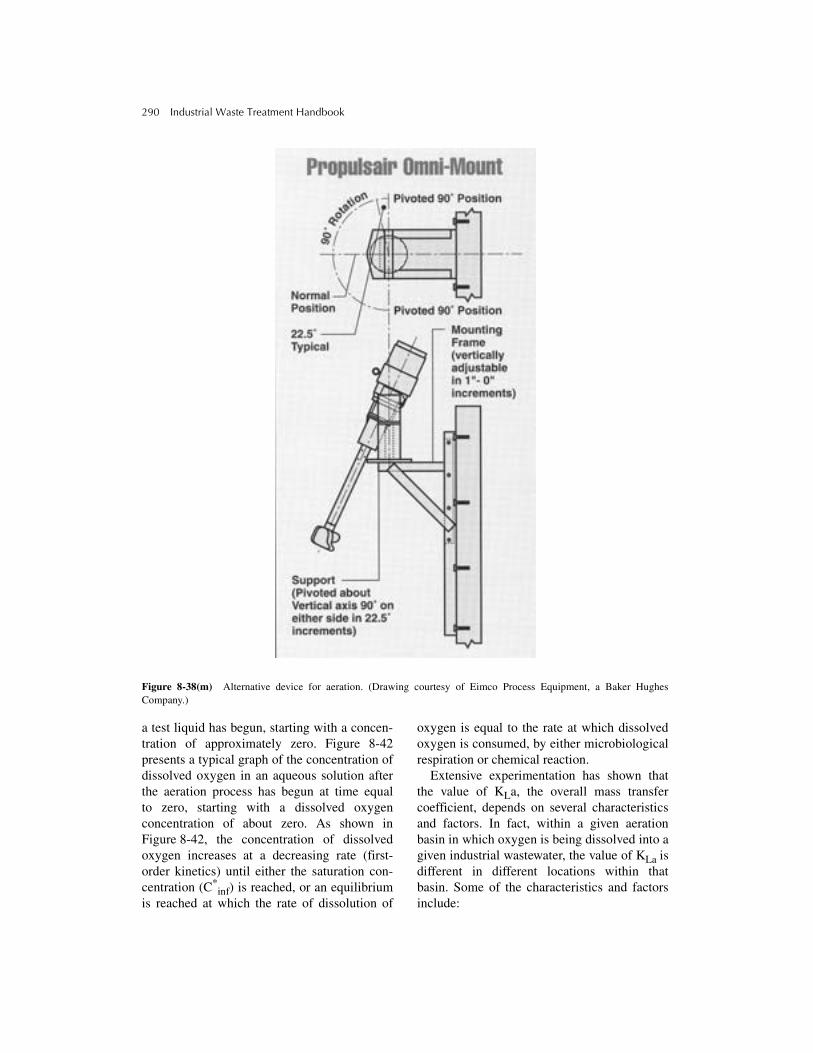
290 Industrial Waste Treatment Handbook
Figure 8-38(m) Alternative device for aeration. (Drawing courtesy of Eimco Process Equipment, a Baker HughesCompany.)
a test liquid has begun, starting with a concen-tration of approximately zero. Figure 8-42presents a typical graph of the concentration ofdissolved oxygen in an aqueous solution afterthe aeration process has begun at time equalto zero, starting with a dissolved oxygenconcentration of about zero. As shown inFigure 8-42, the concentration of dissolvedoxygen increases at a decreasing rate (first-order kinetics) until either the saturation con-centration (C*
inf) is reached, or an equilibriumis reached at which the rate of dissolution of
oxygen is equal to the rate at which dissolvedoxygen is consumed, by either microbiologicalrespiration or chemical reaction.
Extensive experimentation has shown thatthe value of KLa, the overall mass transfercoefficient, depends on several characteristicsand factors. In fact, within a given aerationbasin in which oxygen is being dissolved into agiven industrial wastewater, the value of KLa isdifferent in different locations within thatbasin. Some of the characteristics and factorsinclude:
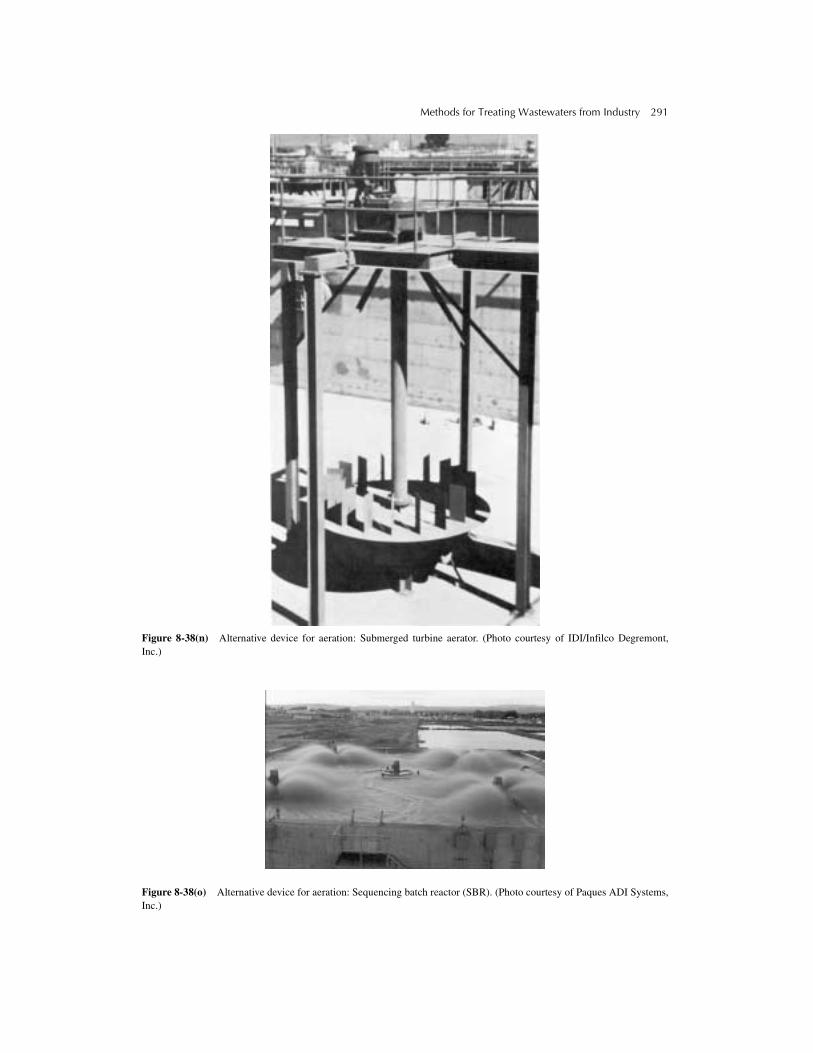
Methods for Treating Wastewaters from Industry 291
Figure 8-38(n) Alternative device for aeration: Submerged turbine aerator. (Photo courtesy of IDI/Infilco Degremont,Inc.)
Figure 8-38(o) Alternative device for aeration: Sequencing batch reactor (SBR). (Photo courtesy of Paques ADI Systems,Inc.)
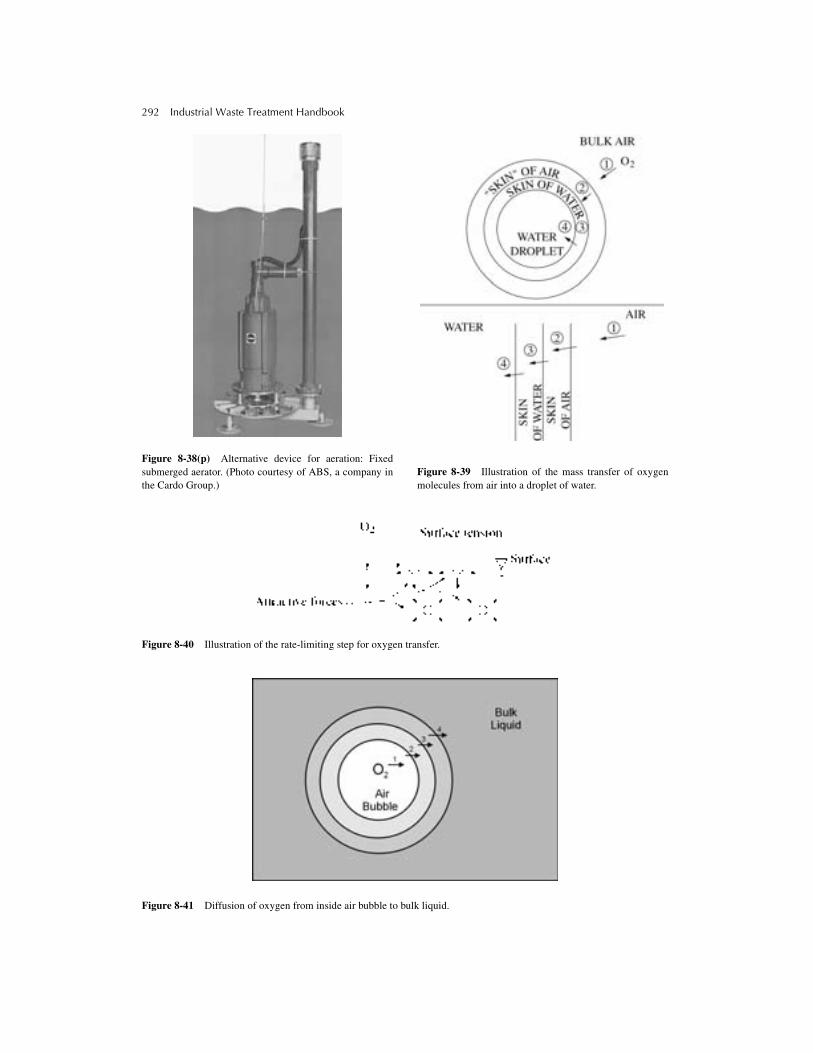
292 Industrial Waste Treatment Handbook
Figure 8-38(p) Alternative device for aeration: Fixedsubmerged aerator. (Photo courtesy of ABS, a company inthe Cardo Group.)
Figure 8-39 Illustration of the mass transfer of oxygenmolecules from air into a droplet of water.
Figure 8-40 Illustration of the rate-limiting step for oxygen transfer.
Figure 8-41 Diffusion of oxygen from inside air bubble to bulk liquid.

Methods for Treating Wastewaters from Industry 293
Figure 8-42 Determination of the value of KLa.
• Temperature
• Chemical makeup of the wastewater as itchanges from one location to another withinthe basin. The principal reason for thischange is the treatment process itself.
• Liquid depth
• Barometric pressure
• Relative humidity
• Intensity of mixing or turbulence
• Variation in physical characteristics of theaeration devices at different locations withinthe basin (If there is, indeed, a variation.Usually, significant variation is caused bydifferent degrees of clogging and other wearand tear effects of service).
It is not possible, therefore, to compare theeffectiveness of one aeration device withanother, unless all of the influencing character-istics are equal except the aerators themselves,
or unless procedures are applied to account forthe differences. Such procedures have beendeveloped and are described in “StandardGuidelines for In-Process Oxygen TransferTesting,” published by the American Society ofCivil Engineers (ASCE) publication No.ASCE-18-96. Two approaches are described inthis publication. The first is referred to as the“nonsteady state method.” The second is calledthe “off-gas method.” A summary of these pro-cedures is as follows.
NON–STEADY STATE METHOD. This method deter-mines the average oxygen transfer coefficient(KLa) under actual process conditions by mea-suring the change in dissolved oxygen (DO)concentration over time after producing a sud-den change in the prevailing steady stateconditions. DO concentrations are then taken atsuccessive time intervals, at one or more loca-tions within the operating aeration basin. The

294 Industrial Waste Treatment Handbook
DO concentration versus time characteristics, asthe contents of the basin progress toward a newequilibrium condition, are thus determined.The following assumptions accompany thisprocedure:
• The system is completely mixed.
• The oxygen uptake rate and KLa valuesremain constant during the test.
• DO probes are located so that each detects aDO concentration that is representative ofequal basin volumes.
One of two methods is used to produce thesudden change in (departure from) steady stateconditions. The first is to (as suddenly as possi-ble) change the level of power supplied to theaerators. The second is to quickly pour a vol-ume of hydrogen peroxide (H2O2) into theoperating basin. When the level of power isincreased, the value of KLa is determined byanalysis of the increase in DO concentration asit approaches the new equilibrium value. Whenthe hydrogen peroxide method is used, theexcess DO is stripped out in a manner equiva-lent to the manner in which it would increase.KLa is thus determined by use of a curve thatmirrors the expected characteristics of increaseto the equilibrium value. A nonlinear regres-sion (NLR) technique is used to determine thevalues of KLa.
It is important to maintain constant load andoxygen uptake conditions throughout the test.This can be managed by either diverting someof the load or by conducting the test duringperiods when the load is expected to beconstant.
OFF-GAS METHOD. This method employs atentlike hood to capture and measure gas-phase oxygen emerging from the surface ofan operating aeration basin. The mole frac-tion of oxygen in the off-gas is thencompared to the mole fraction of oxygen inthe air supplied to the basin. A gas-phasemass balance is then used to directly deter-mine the oxygen transfer efficiency of thediffused air aeration devices in service at the
time the test was conducted. Devices formeasuring the oxygen content of air and theflow rate of air are used to determine themass of oxygen that enters the aeration basinover a defined period. Equivalent devices areused to measure the mass of oxygen exitingthe basin through the surface of the liquidover the same period. This ratio is used tocalculate the mass rate of oxygen input to theaeration basin. Typically, the performancecurves supplied with the air blower equip-ment (mass of air per horsepower-hour, forinstance) are used to determine (or to check,if a flow meter is used) the mass of air sup-plied to the aeration basin.
The tentlike device, or, hood, is equippedwith pressure-sensing devices, as well as oxy-gen concentration–sensing equipment, and gasflow rate measurement capability. The oxygenconcentration–sensing equipment is used todetermine the mole fraction of oxygen in thegas that is exiting the aeration basin via thesurface of the mixed liquor. The pressure-sensing devices are used to determine whenthe flow of gas into the hood is equal to theflow exiting the hood. This flow equilibrium isshown to be the case when the pressure withinthe hood remains constant over a period. (It isrecommended that the hood be maintainedunder a slight positive pressure, with respectto the atmosphere outside the hood; i.e., +1.27 to 2.54 mm [0.05 to 0.10 in.] watergauge.)
The area of the base of the hood, expressedas a ratio of the total area of the aeration basin,is used to calculate the total mass rate of oxy-gen exiting the aeration basin. The differencebetween the quantity of oxygen entering theaeration basin in a unit time and the quantityexiting the basin in the same unit of time isthen used to determine the oxygen transfercharacteristics of the particular aeration system(blowers, air delivery system, and diffusers)used for that test.
A gas-phase mass balance of oxygen overthe liquid volume is written as:
Oxygen removed from gas stream =oxygen dissolved into the liquid

Methods for Treating Wastewaters from Industry 295
or,
(8-48)
where,
ρ = Density of oxygen at temperatureand pressure at which gas flow istaking place.
qi, qe = Volumetric rate of gas flow intoand out of the volume of liquid,respectively.
Yi, Ye = Mole fraction of oxygen in gas(air) flow into and out of the liquid,respectively.
C = Concentration of dissolved oxygenin the liquid (aqueous solution).
V = Volume of basin.
as illustrated in Figure 8-43.The value of KLa, then, is calculated directly
by rearrangement of equation 8-48:
(8-49)
As was the case with the nonsteady statemethod described previously, the resulting esti-mates of the value of KLa, oxygen transfer effi-ciency, and other characteristics are applicable,strictly speaking, to only those particular condi-tions of temperature, atmospheric pressure,chemical characteristics of the mixed liquor, andall other variables that existed when the test wasconducted. The standard oxygen transfer rate(SOTR) equation has been developed to providea method to enable comparison, on a best esti-mate basis, of the performances of different aer-ation devices by adjusting, mathematically, thevalue of KLa to account for nonstandard condi-tions when actual tests were conducted.
The standard oxygen transfer rate (SOTR) isdefined as:
(8-50)
Standard conditions are considered to be asfollows in the United States:
• Temperature = 20o C
• Barometric pressure = 760 mm Hg
• Tap water
Figure 8-43 Gas phase mass balance.
In Europe, standard conditions are consid-ered to be as follows:
• Temperature = 10oC
• Barometric pressure = 760 mm Hg
• Tap water
In the United Kingdom, a surfactant (com-mercial detergent) is added to the tap water.
Three factors, α, β, and θ, are used to mathe-matically adjust the value of KLa to account forthe effects of differences in wastewater charac-teristics (chemical content, etc.), differences inthe saturation value of dissolved oxygen, andthe effects of temperature, respectively. Thealpha factor (α) is used to compare the oxygentransfer effectiveness in a given wastewater toits effectiveness in clean water:
(8-51)
where:
KLaww = The value of KLa, the overall masstransfer coefficient, in the wastewa-ter that is under consideration.
KLacw = The value of KLa in clean water,under the same conditions of tem-perature, barometric pressure, and
ρ qiYi qeYe–( ) KLa C∗inf C–( )V=
KLaρ qiYi qeYe–( )
C∗inf C–( )V-----------------------------------=
SOTR KLa C∗inf( )=
α KLaww KLacw⁄=

296 Industrial Waste Treatment Handbook
relative humidity that prevailed forthe determination of KLa.
In other words, then, the value of alpha (α) isthe ratio of the rate of oxygen transfer in thewastewater under consideration to the rate ofoxygen transfer in clean water, when all otherphysical and environmental characteristics areequal.
Usually, the value of alpha is less than one,meaning that there are few substances normallyfound in wastewater that enhance the dissolu-tion of oxygen. If one aeration device is able,somehow, to “produce” an alpha value that ishigher than that “produced” by another (severalhave been reported in the literature), and if thedifference in the values of KLa does not negatethis effect, the aerator producing the higheralpha value is shown to be the better performer.
The beta (β) factor, used to account for thedifference in the saturation value of dissolvedoxygen in a given wastewater as opposed tothe saturation value in clean water, isexpressed as:
(8-52)
The saturation concentration of the wastewa-ter in question in contact with air can be deter-mined by testing the wastewater in thelaboratory. Published tables are used to obtainthe appropriate value for the saturation concen-tration of oxygen in tap water that is in contactwith air.
A reasonably accurate correction for differ-ences in temperature is as follows:
(8-53)
where:
KLa (T) = Value of ΚLa at temperature T
T = Temperature, °C
Θ = 1.024
“Standard” correction factors for differ-ences in barometric pressure and relativehumidity are presented in Guidelines for Qual-ity Assurance of Installed Fine Pore AerationEquipment (ASCE, 1998).
The standard oxygen transfer rate (SOTR) isused to estimate the actual oxygen transfer rate(OTR) under actual (as opposed to standard)conditions by use of equation 8-54:
(8-54)
where
C*walt = The saturation concentration of
oxygen (from ambient air) in tapwater, corrected for the increasedsaturation concentration at thedepth of operation of the aerationdevices; i.e., C*
walt = C*TP × fd.
where:
C*TP = The saturation concentration of
oxygen (from air) in water at theprevailing temperature and atmo-spheric pressure.
fd = Factor accounting for increasedsaturation concentration at depth.
C20 = Saturation concentration at the sur-face, under standard conditions.
CL = The target value of dissolvedoxygen under normal operatingconditions.
Progressing one step further, it is convenientto determine air flow requirements for anygiven wastewater treatment process by use ofequation 8-55:
(8-55)
Where:
SOTR = Oxygen transfer rate under standardconditions, lb O2 /hr.
SOTE = Oxygen transfer efficiency understandard conditions, %.
Q = Rate of flow of air under standardconditions, SCFM.
β C∗inf ww C∗inf TP⁄=
KLa T( ) KLa 20( ) ΘT 20–( )=
OTR αβC∗walt CL–
C∗inf20--------------------------------
⎝ ⎠⎜ ⎟⎛ ⎞
θT 20–SOTR=
fd
C∗inf20
C20-----------------=
QSOTR
SOTE ρa× f×a
60×-------------------------------------------------- 100( )=

Methods for Treating Wastewaters from Industry 297
ρa = Density of air at standard condi-tions = 0.075 lb/ft3.
fa = Weight fraction of oxygen in air,decimal (0.231).
60 = Minutes per hour.
100 = Conversion from percent to decimal.
Under standard conditions, then,
(8-56)
SHOP TESTS. An alternative method for estimat-ing the value of KLa, as well as otherparameters and characteristics of oxygen trans-fer effectiveness by various aeration devices, isthe so-called shop test.
A given vessel is filled with a given liquid(water or an industrial wastewater). The aeratorbeing evaluated is activated, with the dissolvedoxygen concentration equal to zero. Measure-ments of dissolved oxygen concentration aremade at periodic time intervals, and a plot ofthe data as shown in Figure 8-42 enables deter-mination of the value of KLa at the tempera-ture, barometric pressure, and relative humiditythat prevailed at the time of the testing. Theaeration device that produces the highest valueof KLa is shown to be the most effective, as faras oxygen transfer is concerned, of those evalu-ated under the specific, identical conditions.
As another alternative, a slight modificationof the shop test, is to make use of a cylinder, 2feet or so in inside diameter, mounted along-side the aeration basin, on site. The aerationdevice(s) to be evaluated is installed at the bot-tom of the cylinder; the cylinder is fitted withair flow rate, gas phase oxygen, and dissolvedoxygen–sensing equipment; and the cylinder isfilled with mixed liquor from the aerationbasin. Tests as described previously are run todetermine values of both alpha and KLa. Theprimary advantages of this system are that thetests can be run on fresh MLVSS and wastewa-ter, as opposed to having to transport these sub-stances to the shop, and the close control overchemical and physical conditions, as opposedto the lack of control that attends the off-gasmethod described earlier.
Aerated Lagoons. Aerated lagoons usually con-sist of earthen basins equipped withmechanical or diffused aeration equipment.There is no secondary clarifier except for a qui-escent zone at the outlet. There is no controlledsludge return from the bottom of this quiescentzone.
As an alternative to the quiescent zone, aseparate pond is sometimes used, in whichcase the pond is referred to as a polishingpond. In other cases, a mechanical clarifiercan be used. A considerable number of pulpand paper mills, in fact, have installedmechanical clarifiers as part of aerated lagoonsystems. These alternatives are desirable ifthe design of the lagoon makes use of com-plete mix conditions as a method to avoidshort-circuiting.
There are two distinct types of aeratedlagoon systems: (1) aerobic and (2) partiallymixed, facultative.
An aerobic lagoon must have sufficient mix-ing to suspend all of the solids and must haveenough aeration capacity to satisfy all of theBOD removal aerobically.
A partially mixed, facultative lagoonrequires only enough mixing to keep all of theliquid in motion. A significant portion of thebiological and other solids resides at the lagoonbottom and undergoes anoxic and anaerobicdegradation. Enough aeration is applied tomaintain aerobic conditions in only the upper 2to 3 feet of liquid in a partially mixed, faculta-tive lagoon.
The advantage of a partially mixed, faculta-tive lagoon over an aerobic lagoon is signifi-cantly lower operating cost. In a properlyoperated partially mixed, facultative lagoon,much of the dissolved BOD in the raw waste-water is “sorbed” (via adsorption and absorp-tion) onto and into the microbial cells, whichthen settle to the bottom and undergo anoxicand anaerobic degradation. There is no require-ment to supply oxygen for this degradationprocess. Furthermore, anoxic and anaerobicmetabolisms result in the generation of far lesssludge, in the form of growth of new microbialcells, per unit of BOD degraded, than is thecase with aerobic metabolism.
Q96.62 SOTR×
SOTE-----------------------------------=

298 Industrial Waste Treatment Handbook
The advantage of an aerobic lagoon over apartially mixed, facultative lagoon is in the pro-cess control. There is no positive control overhow much sludge settles and how much stays insuspension in a partially mixed lagoon. Becausethere is no settling out of sludge solids in a prop-erly operated aerobic lagoon, there is no lack ofcontrol. There is, however, a significant price topay for the extra aeration capacity required foran aerobic lagoon over that required for a par-tially mixed, facultative lagoon.
The anoxic and anaerobic microbial activitythat takes place at the bottom of a properlyoperated partially mixed, facultative lagoonconverts organic solids within the sludge to sol-uble organic acids, which diffuse into the upperstrata of the lagoon. These compounds are vol-atile and highly odorous, and constitute apotential odor problem; however, if there issufficient aerobic microbial activity in theupper strata of the lagoon, the organic acidswill be converted to carbon dioxide, water, andmicrobial cell protoplasm. Properly designedand operated partially mixed, facultativelagoon systems do not emit noticeable odors.
Aerated lagoons require relatively little oper-ator attention because there is no wasting orreturning of sludge to manage sludge age.Technically, sludge age is infinite, and autooxi-dation is at the maximum. Therefore, the efflu-ent TSS concentration is typically high(relatively, compared to activated sludge). Aer-ated lagoons eventually collect sufficient inertsolids that sludge removal is required.
The frequency of sludge removal can varyfrom yearly to once every 10 or so years. Thehigh cost (relatively) aspects of lagoon systemsinclude large land area as well as the cost ofconstructing a liner system to protect thegroundwater, including the (substantial) cost ofgeotechnical and hydrogeologic investigationsof alternative sites. These investigations andcollected data are necessary to determinewhether on-site soils can be re-compacted asan earthen liner. If a synthetic liner is needed,determine whether embankment toe drainsare required. Among other considerations arepermissible slopes, define embankment and
earthen liner construction details, permissiblelift height and compaction requirements.
In the case of partially mixed, facultativelagoons, periodic losses of solids (via the efflu-ent) that had previously settled to the bottom,plus periodic episodes of algae blooms withinthe lagoon, combine to make them unreliablein complying with effluent TSS restrictions.Some facultative lagoon installations haveincorporated additional facilities that are usedonly when needed, such as a sand filter, or afinal, settling lagoon, to ensure compliancewith discharge permits. Here, again, a well-developed life-cycle cost analysis is needed todetermine the wisdom of selecting any of thevarious lagoon alternative configurations.
Nonaerated Facultative Lagoons. Nonaeratedfacultative lagoons are designed and con-structed similarly to aerated lagoons, but thereis no aeration other than that which diffusesnaturally through the surface. These systemsare termed “facultative” because, properlyoperated, the upper one-third, or so, of thedepth is aerobic, the lower one-third, or so, isanoxic to anaerobic, and the middle one-thirdphases in and out of the aerobic and anoxicstates and is therefore facultative. In order toachieve aerobic conditions throughout a signif-icant portion of the depth (one-third, or so), theorganic loading must be sufficiently low thatthe rate of diffusion of oxygen from the airabove the lagoon is as high or higher than therate of oxygen utilization by the aerobic micro-bial population. As with other types of lagoons,anoxic and anaerobic degradation take placewithin the sludge at the bottom. Organic solidsare converted to dissolved organic acids, whichdiffuse into the aerobic region near the surface,presenting a potential odor problem. In a prop-erly designed and operated system, however,these volatile organic acids are converted tocarbon dioxide, water, and microbial cell proto-plasm by the aerobic microbial population inthe aerobic zone. Well-functioning facultativelagoon systems, aerated or not, do not give offsignificant objectionable odors.

Methods for Treating Wastewaters from Industry 299
Again, there is a cost trade-off between aer-ated and nonaerated facultative lagoons. Aer-ated lagoons require substantial cost forpower to operate the aeration system. Nonaer-ated lagoons require substantially more landarea and therefore, higher cost for liner sys-tems, including geotechnical and hydrogeo-logic investigations for several alternativesites.
Oxidation Ponds. Oxidation ponds aredesigned and constructed similarly to faculta-tive lagoons, in that they are usually earthenbasins of very long hydraulic detention time.The design objective is different from that offacultative lagoons, however. Oxidation pondsmust be sufficiently shallow and have suffi-ciently low organic loading that aerobicconditions are maintained everywhere. In thisrespect, “everywhere” means the liquid con-tents of the lagoon and not the sludge volumethat accumulates at the bottom. For this condi-tion to hold, the rate of production of oxygenby algae, plus the rate of diffusion of oxygenthrough the surface and from there to the bot-tom of the pond, must always be greater thanthe rate of utilization of oxygen by themicrobes within the system as they metabolizethe organic pollutants.
Because of their shallow construction, oxi-dation ponds are useful only in warm climates.Also, because algae are usually a principlesource of oxygen, sunlight intensity is animportant design consideration. The require-ment for liner systems to protect the groundwa-ter is a major cost consideration becauseoxidation ponds typically have the highestarea-to-volume ratio of the commonly usedbiological treatment systems.
DESIGN OF LAGOON SYSTEMS. The foregoing dis-cussions have shown that, in general, there is atradeoff between detention time and aerationcapacity in the design of aerobic biologicaltreatment systems. The question, then, is,“What combination of detention time and aera-tion capacity produces the desired quality ofeffluent for the lowest life-cycle cost?” Factorson which the answer bears include wastewaterstrength, characteristics relating to biodegrad-ability of the organics in the wastewater, costfor land, soil type as it relates to constructioncosts, and temperature, as well as others.
Whereas activated sludge systems for treat-ment of industrial wastes are best designedusing the procedures presented previously,lagoon systems have been most successfullydesigned using one of the empirical approachespresented and discussed briefly in Table 8-12.
Table 8-12 Alternate Approaches to Design of Lagoon Systems
Approach Comment
Areal loading Lagoon system size is determined by simply applying an area loading rate of, for instance, 15 lbBOD/ac/d, with no more than 40 lb/ac/d in any one of several lagoons in series. Depth is a separatedesign parameter, which increases with colder climates. Depth is first determined to provide requireddetention time, then is increased to accommodate anticipated ice thickness, sludge storage, andaccommodation of direct rainfall, if significant. Experience is the principal design guide.
Plug flow Useful when long, narrow ponds can be constructed. Construction cost is relatively high because of thehigh perimeter-to-volume ratio. If baffles are used to create a long, narrow flow path, considerable deadspace results and must be taken into consideration regarding hydraulic detention time.
Complete mix Complete mix operation is useful for controlling short-circuiting. Best treatment results when three ormore ponds are operated in series. Successful design depends on selecting the correct reaction rateconstant, k. Value of k decreases with consequent increase in lagoon system size with decreasingoperating temperature.
Marais and Shaw A variation of the complete mix method approach. Design considerations are identical to completemix approach.
Gloyna method Applicable to warm climates with high solar radiation. Assumes solar energy for photosynthesis isabove saturation.
Wehner-Wilhelm Requires knowledge of hydrodynamic equation characteristics of each pond as well as reaction rate.

300 Industrial Waste Treatment Handbook
In general:
• Temperature affects both the rate of micro-bial respiration and the rate at which oxygendissolves in the bulk liquid in the lagoon.
• Algae affect the quality of the effluent froma lagoon by:
1. Adding to the TSS of the lagooneffluent.
2. Adding oxygen to the bulk liquid of thelagoon during the daylight hours.
3. Depleting the oxygen in the bulk liquidof the lagoon during the nondaylighthours.
Experience has shown that the amount ofalgae present in lagoon systems increases fromaerobic to partially mixed facultative to nonaer-ated facultative to those highest in algae mass,oxidation ponds. In all but complete mix aero-bic systems, algae are integral parts of thetreatment system and must be expected. Fur-thermore, lightly loaded (relative to design)systems are likely to have significantly morealgae. The U.S. EPA has recognized that com-pliance with typical secondary permit limits fortotal suspended solids (TSS) may be impossi-ble for certain lagoon systems, and have pro-vided for “equivalent to secondary” alternativeTSS limits on a case-by-case basis.
In the course of the normal daily operationof a lagoon system over the full calendar year,solids, including those that were contained inthe raw wastewater and the microbial solidsthat result from the microbial purificationaction of the lagoon system, and algae settle tothe bottom of the lagoon to form a sludgedeposit, referred to as the benthic deposit, orbenthos. Anoxic/anaerobic conditions developin the benthos, and anoxic/anaerobic bacterialaction reduces the volume of the benthos andreleases volatile acids to the overlying bulk liq-uid. This adds to the BOD load to be treated bythe lagoon system. During the spring months,lagoons located in cold climates experience anoverturn when the benthos rises into the bulkliquid. This is known as a “benthal release.”The BOD of the bulk liquid increasessignificantly during these periods, typically
causing nearly complete depletion of the dis-solved oxygen supply. When this happens, aer-obic biological treatment is limited to what canbe supported by the immediate dissolution ofoxygen by the aerators and by diffusionthrough the surface. In some locations, a simi-lar benthal release occurs during the autumnmonths. Very often, under these conditions,concentrations of both BOD and TSS in thelagoon effluent rise to exceed permit limita-tions. It is extremely important to include theeffects of benthal release in the design ofa lagoon system as well as in the plan ofoperation.
One solution is to design and build a three-lagoon system. Treat with two lagoons and usethe third lagoon to store effluent not suitablefor release (have a high and a low dischargepipe). The stored wastewater can be routedthrough the two treatment lagoons during peri-ods of low wastewater flow.
LOW-ENERGY COMPLETE MIX APPROACH. Experi-ence has shown that the most significant causeof failure of lagoon systems to perform asintended has been short-circuiting. Many tech-niques have been used to solve short-circuitingproblems, including use of baffles and strategicplacement of inlet and outlet devices. However,perhaps the most positive approach has been toemploy a low-energy, complete mix technique.In this approach, the shape of the individualponds that make up the lagoon system, com-bined with the type of aeration device, hasenabled complete mix hydrodynamics, as eval-uated using chemical tracer studies.
BOD TEST CONSIDERATIONS When aerobic treat-ment systems, especially lagoons, are operatedin an underloaded (relative to design) condi-tion, there is a potential problem with use ofthe standard 5-day biological oxygen demand(BOD5) test for determining plant performanceas well as compliance with permit limits. Whenthe carbonaceous BOD (CBOD) has beenremoved, the microorganisms within the treat-ment system (lagoon), under certain condi-tions, begin oxidizing ammonia that has been

Methods for Treating Wastewaters from Industry 301
liberated from proteins and other substances.This “extra treatment” leads to the develop-ment of a robust population of nitrifying bacte-ria (nitrosomonas and nitrobacter), which arepresent in the treated effluent. Consequently,when samples of the treated effluent are placedin BOD bottles, nitrification of ammonia(including that introduced with the dilutionwater) takes place during the 5-day BOD test.The result is that the BOD5 test will includeboth CBOD from the treated wastewater and anamount of nitrogenous oxygen demand(NBOD) (about 4.6 mg of oxygen are requiredto oxidize one mg of ammonia). Experienceshows that a treated effluent having a CBOD ofless than 10 mg/L can exhibit a BOD5 of morethan 50 mg/L using the standard 5-day BODtest. For this reason, an alternative BOD testhas been developed in which nitrificationinhibitors are added to the BOD bottle in thestandard 5-day BOD test. This test is referredto as the CBOD test and is authorized to beused instead of the standard BOD5 test, on a
case-by-case basis, by the U.S. EPA as well asessentially all state environmental agencies. Infact, some state agencies have authorized theCBOD test to be used at the choice ofthe analyst.
Attached Growth SystemsAttached growth wastewater treatment pro-
cesses are characterized by a microbiologicalslime mass attached to a solid surface. As thewastewater flows over the slime mass, organicsubstances and other nutrients diffuse into it,providing food for growth of the microbes. Inthe case of aerobic systems, oxygen also dif-fuses into the slime mass. Typically, themicrobes grow, increasing the mass (referred toas the “slime layer”), and the slime layer devel-ops as shown in Figure 8-44.
As depicted in Figure 8-44, organics, othernutrients, and oxygen diffuse from wastewater,which is moving over the surface of the slimelayer. As the slime layer grows, it becomes so
Figure 8-44 Characteristics of attached growth slime layer.
SOLID
MEDIUM
O2
SLIMELAYER
LIQ
UID
FIL
M
NUTRIENTS
ORGANICS
Ano
xic/
anae
robi
czo
neZ
one
ofac
tive
resp
irat
ion

302 Industrial Waste Treatment Handbook
thick that oxygen becomes consumed before itcan diffuse more than a few millimeters intothe slime layer. An anaerobic zone thusbecomes established, even though the process,as a whole, is said to be aerobic. The anaerobiczone is usually a fortuitous development, how-ever, because the anoxic and anaerobic activityact to consume microbes that have grown in theaerobic zone, as well as some of the organicsthat have diffused in from the wastewater. Thisactivity reduces the quantity of waste sludgethat must be handled and disposed of. There isalmost always some sloughing off of excessslime layer, however, and therefore a clarifier isusually included in the attached growth treat-ment system.
Three aerobic attached growth wastewatertreatment processes that are in common use, asshown in Figures 8-45(a)–(c), are the tricklingfilter, the rotating biological contactor (RBC),and the fluidized bed.
Trickling Filters. Trickling filters make use ofsolid “media,” usually contained in a steel orconcrete tank, round, square, rectangular, orother shape, with a perforated bottom. Waste-water is applied to the top of the media by dis-tribution devices, and, under the influence ofgravity, trickles down over the surfaces of themedia. Air flows from the bottom, up throughthe media to supply oxygen. Air blowers can beused for this purpose, but normally, sufficientair flows by gravity because the biologicalactivity in the filter gives off enough heat tocause the air to expand, thus becoming lighterand buoyant compared to the ambient air.
The earliest trickling filters (from the early1900s through the 1950s) made use of stones of1 to 4 inches in size for the medium over whichthe wastewater was caused to flow, or “trickle.”Stone, or in some cases slag or coal, is stillused, but many trickling filter systems usemedia manufactured from plastic. Also, some
Figure 8-45(a) Aerobic fixed film systems; trickling filter. (Photo courtesy of NSW Corporation.)

Methods for Treating Wastewaters from Industry 303
Figure 8-45(b) Aerobic fixed film systems; rotating biological contactor (RBC). (Photo courtesy of U.S. Filter/Envirex.)
Figure 8-45(c) Aerobic fixed film systems; fluidized bed. (Photo courtesy of NSW Corporation.)

304 Industrial Waste Treatment Handbook
trickling filter systems employ horizontal flow,referred to as “cross flow.” Figures 8-46(a)–(c)show photographs of stone media as well asrepresentative types of plastic media. The plas-tic media are often referred to as “packing.”Filters making use of stone media are normally3 to 8 feet in depth. Plastic media trickling fil-ters have been built as shallow as 6 feet and asdeep as 40 feet.
The system used to distribute wastewaterover the top of the media can be either movableor stationary. A grid of stationary nozzles sup-plied with wastewater by pumps is common inthe case of plastic media filters. So-calledrotary distributors, shown in Figure 8-47, arenormally used with stone media filters as wellas with plastic media. The rotary distributor isfed from the center of the circular filter. Theaction of the wastewater issuing from one sideof the distributor arm supplies what is neededto turn the distributor, thus spreading an evenapplication of wastewater over the top of thebed of media.
RECIRCULATION. It is important to manage theoperation of a trickling filter to control thethickness of the slime layer. If the slime layer istoo thin, there will be insufficient microorgan-isms to accomplish the desired degree of treat-ment. Also, a slime layer that is too thin allowsthe applied wastewater to flow too quicklythrough the filter and thus receive insufficienttreatment. If the slime layer becomes too thick,the flow of air becomes impeded because ofinsufficient open space between adjacent sur-faces of the filter media. Successful operationalperformance of a trickling filter results whenthe organic loading rate and the hydraulic load-ing rate are in proper balance. The ability torecycle wastewater that has already passedthrough the trickling filter is the operator’s bestmeans to control this balance, as illustrated inFigure 8-47.
Figure 8-47 shows a trickling filter fol-lowed by a clarifier. A recycle pump isincluded so that varying rates of flow of efflu-ent from the clarifier can be recycled back tothe influent to the trickling filter, thus afford-ing the operator a means of controlling the
hydraulic loading rate to the trickling filter-clarifier system. The hydraulic loading rate isthe sum of the influent plus the recycled flowrates. As this flow rate increases, increasedquantity of water flushing through the filterincreases. This increase has the effect of phys-ically shearing the slime layer, reducing itsthickness.
During normal operation, trickling filters arenot significant sources of odors, even though,as described previously, significant anoxic andanaerobic activity takes place within the slimelayer. Normally, the aerobic microbiologicalactivity within the few millimeters closest tothe surface of the slime layer oxidizes the odor-ous and other products of anoxic and anaerobicmetabolism. However, if the organic loadingrate is too high with respect to the hydraulicloading rate, the slime layer grows too thick,the rate of flow of air becomes insufficient tosupply enough oxygen to accomplish theneeded aerobic oxidization, and an odor prob-lem develops. Often, treatment performancebecomes insufficient, as well. The problem canbe corrected by increasing the recycle rate andcausing hydraulic shearing of the slime layer,reducing its thickness.
DESIGN. Several different approaches are incurrent use for designing trickling filter sys-tems. If at all possible, it is best to takeadvantage of what has been learned by oper-ating an existing system on a wastewater withas close to identical characteristics as possi-ble. Although this may be feasible for munic-ipal wastewaters, it is often impossible in thecase of an industrial wastewater. Here, again,there is no substitute for a well-designed andexecuted laboratory study, followed by a pilotscale program. Several manufacturers oftrickling filter systems have pilot scale treat-ment units that can be moved to an industrialsite on a flatbed trailer and operated for peri-ods of up to several months to obtain realis-tic design criteria and other valuableinformation. As a preliminary step in the caseof design of a trickling filter system for anindustrial application, the following methodscan be used:

Methods for Treating Wastewaters from Industry 305
Figure 8-46(a) Various types of trickling filter media. (Photo courtesy of NSW Corporation.)
Figure 8-46(b) Various types of trickling filter media. (Courtesy of Marley Cooling Tower, a United Dominion IndustriesCompany.)
Figure 8-46(c) Various types of trickling filter media. (Courtesy of Marley Cooling Tower, a United Dominion IndustriesCompany.)

306 Industrial Waste Treatment Handbook
Figure 8-47 Photograph of rotary distributor for tricking filter. (Courtesy of U.S. Filter/General Filter.)
1. NRC equationsAn empirical approach to design of trickling
filters was developed in the 1940s by analyzingrecords from several military installations. Thisapproach is, therefore, more applicable todomestic wastewater, but some industrialwastes, such as certain food-processing waste-waters, might be sufficiently similar in charac-teristics to warrant its use. It behooves thedesign engineer to give careful and thoroughconsideration to such similarities and possibledifferences before proceeding very far. Thebenefit of the NRC equation approach, ofcourse, is the quickness and low cost of devel-oping an initial estimate of cost for a tricklingfilter treatment system.
The BOD removal efficiency can be esti-mated by:
(8-57)
where:
E = BOD removal efficiency (%)W = Organic loading rate (lb BOD/day)V = Volume of filter media, thousands of ft3
F = Recirculation factor (dimensionless)
The recirculation factor is determined by:
(8-58)
where:
R = Recirculation ratio (Qr/Q)
Qr = Rate of recycle flow (GPM)
Q = Rate of flow of wastewater to filter(GPM)
Usually, the organic loading rate can bedetermined by a wastewater characterizationstudy, as described in Chapter 6. In the case ofan industrial plant yet to be built, the organicloading rate can be estimated using informationobtained from an existing facility, where it isreasonable to expect that wastewater character-istics would be similar. Caution is warranted,however. The NRC equations have been shownto yield reasonably good estimates whenapplied to municipal wastewater having atemperature close to 20ºC. If the wastewater tobe treated is expected to be of a significantlylower temperature, then the expected treatmentefficiency would be significantly less for agiven organic loading rate.
E100
W1 0.0561VF+---------------------------------
--------------------------------------=
F 1 R+=
1R10------+⎝ ⎠
⎛ ⎞ 2
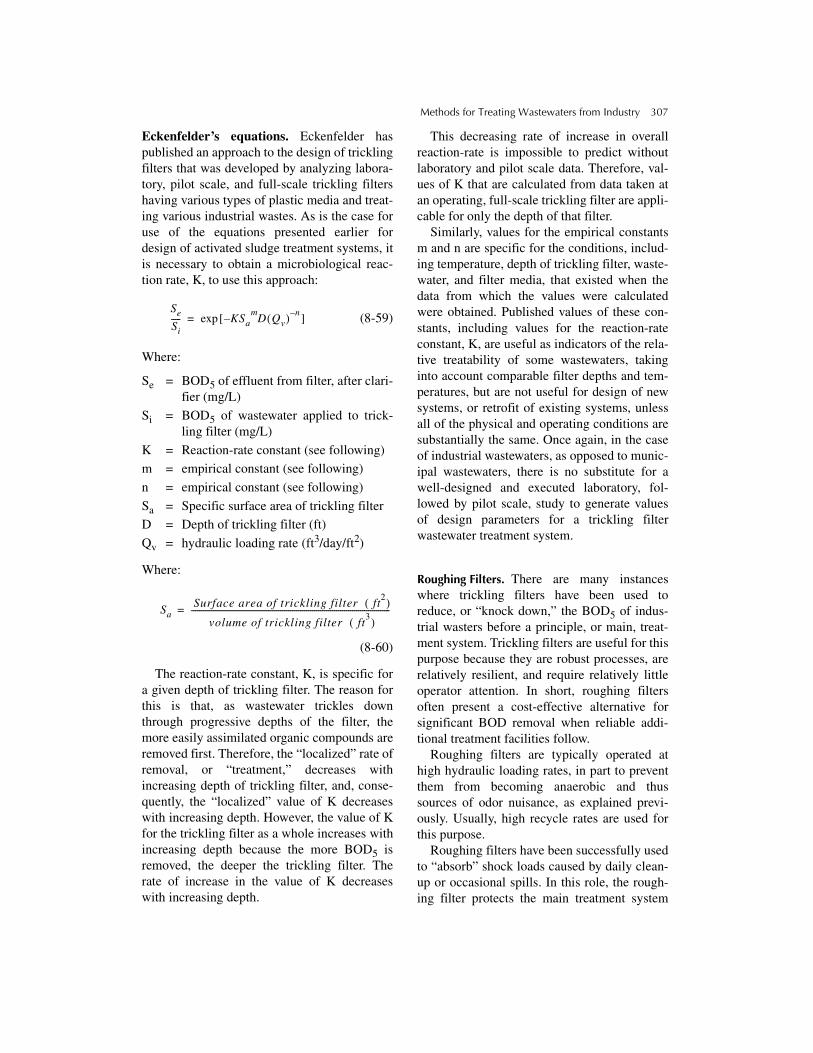
Methods for Treating Wastewaters from Industry 307
Eckenfelder’s equations. Eckenfelder haspublished an approach to the design of tricklingfilters that was developed by analyzing labora-tory, pilot scale, and full-scale trickling filtershaving various types of plastic media and treat-ing various industrial wastes. As is the case foruse of the equations presented earlier fordesign of activated sludge treatment systems, itis necessary to obtain a microbiological reac-tion rate, K, to use this approach:
(8-59)
Where:
Se = BOD5 of effluent from filter, after clari-fier (mg/L)
Si = BOD5 of wastewater applied to trick-ling filter (mg/L)
K = Reaction-rate constant (see following)
m = empirical constant (see following)
n = empirical constant (see following)
Sa = Specific surface area of trickling filter
D = Depth of trickling filter (ft)
Qv = hydraulic loading rate (ft3/day/ft2)
Where:
(8-60)
The reaction-rate constant, K, is specific fora given depth of trickling filter. The reason forthis is that, as wastewater trickles downthrough progressive depths of the filter, themore easily assimilated organic compounds areremoved first. Therefore, the “localized” rate ofremoval, or “treatment,” decreases withincreasing depth of trickling filter, and, conse-quently, the “localized” value of K decreaseswith increasing depth. However, the value of Kfor the trickling filter as a whole increases withincreasing depth because the more BOD5 isremoved, the deeper the trickling filter. Therate of increase in the value of K decreaseswith increasing depth.
This decreasing rate of increase in overallreaction-rate is impossible to predict withoutlaboratory and pilot scale data. Therefore, val-ues of K that are calculated from data taken atan operating, full-scale trickling filter are appli-cable for only the depth of that filter.
Similarly, values for the empirical constantsm and n are specific for the conditions, includ-ing temperature, depth of trickling filter, waste-water, and filter media, that existed when thedata from which the values were calculatedwere obtained. Published values of these con-stants, including values for the reaction-rateconstant, K, are useful as indicators of the rela-tive treatability of some wastewaters, takinginto account comparable filter depths and tem-peratures, but are not useful for design of newsystems, or retrofit of existing systems, unlessall of the physical and operating conditions aresubstantially the same. Once again, in the caseof industrial wastewaters, as opposed to munic-ipal wastewaters, there is no substitute for awell-designed and executed laboratory, fol-lowed by pilot scale, study to generate valuesof design parameters for a trickling filterwastewater treatment system.
Roughing Filters. There are many instanceswhere trickling filters have been used toreduce, or “knock down,” the BOD5 of indus-trial wasters before a principle, or main, treat-ment system. Trickling filters are useful for thispurpose because they are robust processes, arerelatively resilient, and require relatively littleoperator attention. In short, roughing filtersoften present a cost-effective alternative forsignificant BOD removal when reliable addi-tional treatment facilities follow.
Roughing filters are typically operated athigh hydraulic loading rates, in part to preventthem from becoming anaerobic and thussources of odor nuisance, as explained previ-ously. Usually, high recycle rates are used forthis purpose.
Roughing filters have been successfully usedto “absorb” shock loads caused by daily clean-up or occasional spills. In this role, the rough-ing filter protects the main treatment system
SeSi----- KSa D
mQv( ) n–
–[ ]exp=
SaSurface area of trickling filter ft
2( )volume of trickling filter ft
3( )----------------------------------------------------------------------------------------------------=

308 Industrial Waste Treatment Handbook
and, thus, provides effective protection againstnoncompliance episodes.
Two very important effects of roughing fil-ters on the overall wastewater treatment systemare: (1) The roughing filter removes the mosteasily assimilated organic material. The effecton the reaction-rate constant of downstreamtreatment facilities must be considered in thedesign and operation of the main treatment sys-tem. (2) Because of the high hydraulic loadingrates and the high microbiological growth rates(because of the easily assimilated organics),sloughing from roughing filters is typically rel-atively high. This must also be considered inthe design of the main treatment system.
Usually, plastic filter media are used. Depthsof roughing filters can range up to 40 feet. Thepotential for roughing filters to become an odornuisance is often present. The most effectivemeans the operator has to solve an odor nui-sance problem is the recycle rate.
Rotating Biological Contactors. Rotating bio-logical contactors (RBC) are attached growthprocesses consisting of a series of parallel discsmade of highly resilient plastic. The discsrotate about a metal rod whose ends areattached to the ends of a basin that contains thewastewater to be treated. As the discs rotate,only a portion of the disc assembly is emersedin the wastewater. While the discs are emersed,microbes that have attached themselves to thediscs adsorb and absorb organic material andother nutrients from the wastewater. As eachportion of each disc rotates out of the wastewa-ter, it comes into contact with air, thus supply-ing oxygen for microbial assimilation of theorganic substances. The depth of emersiondetermines the relative amounts of time thediscs with their attached growth are in contactwith wastewater and air. The speed of rotationdetermines the actual amounts of time. Usually,the depth of emersion is both a design and anoperation parameter, whereas the speed ofrotation is only a design parameter. The opera-tor can vary the depth of emersion by adjust-ment of overflow weirs on the basin but seldomhas the capability to vary the speed of rotation.
RBC systems can consist of a single basincontaining one or more rotating disc assem-blies, or can be arranged such that two or morebasins, each containing one or more rotatingdisc assemblies, are in series. When two ormore basins are in series, each is called a“stage.” Because the stages are separate, andbecause the most easily assimilated organicsare removed in the first stage, and so onthrough the final stage, a different populationof microbes is established on each one. Also,reaction kinetics are successively slower fromthe first stage to the last. This characteristic ofRBC systems has been used advantageously intreatment systems where nitrification musttake place. The final stage(s) can be managedto maintain an optimum environment fornitrosomonas organisms.
As an additional note, one or more RBCstages can be operated in the anoxic mode, fol-lowing the nitrification stage, by completelyimmersing the rotating disc assembly in a basinof effluent from the nitrification stage. Thedenitrification stage, of course, should be cov-ered. The denitrification stage can be preventedfrom becoming anaerobic, and thus an odornuisance, by controlling the hydraulic resi-dence time by use of recycle. As odors arenoticed, the recycle rate can be increased,preventing anoxic respiration from going tocompletion.
Two problems that RBC systems have expe-rienced, and that can be prevented by appropri-ate design and operation, are (1) physicalfailure of the shaft and/or the drive assemblythat turns the shaft and (2) odor nuisance.
Experience with many RBC systems hasresulted in knowledge of what is required withrespect to materials of construction and appro-priate equipment sizing to prevent shaft failure.The treatment process design engineer mustaggressively ensure that the equipment supplieris well aware of past shaft failure problems andhas specifically designed the equipment towithstand all conceivable stresses. Writtenguarantees are no conciliation for the devastat-ing disruptiveness of having to replace a rotat-ing disc assembly.

Methods for Treating Wastewaters from Industry 309
Experience has shown that addressing theroot cause of the problem can prevent odor nui-sance problems, which have plagued someRBC systems. In some cases, severe odor prob-lems have resulted from excess growth of themicrobiological slime layer. The slime layerbecomes so thick that it bridges across thespace between the discs, preventing air fromflowing in these spaces. The consequentabsence of oxygen results in anoxic and anaer-obic conditions and the production of volatileacids, hydrogen sulfide, and other reduced sul-fur compounds, all of which are strongly mal-odorous. At the lowered pH caused by thevolatile acids, the hydrogen sulfide becomesinsoluble and passes into the atmosphere.Hydrogen sulfide can be smelled by humans inthe low parts per billion ranges and can quicklycause an intolerable odor problem. This prob-lem can be prevented by keeping the slimelayer from bridging across the space betweenthe discs. Techniques that have been success-fully applied include installing a course bubbleair diffuser (holes drilled in a pipe) at the lowpoint of the emersion of the discs so thatthe bubbles travel up through the wastewaterbetween the discs. This technique also acts tosupply additional oxygen to the microbeswithin the slime layer.
A second technique that has been helpful insolving odor nuisance problems associatedwith RBC wastewater treatment systemsaddresses the fact that free molecular oxygen ispoisonous to the microorganisms that producethe odorous substances. Adding a small quan-tity of hydrogen peroxide to the influent to anRBC stage that appears to be developing anodor nuisance problem has worked well. Thistechnique can be used while a permanent solu-tion is being developed and implemented.
DESIGN. In practice, the design of an RBCwastewater treatment facility is carried out byselecting one or more proprietary systemsand working through the design proceduressupplied by vendors of those systems. Typi-cally, the design engineer will work with arepresentative of the manufacturer of the pro-prietary system to first establish the necessary
characteristics of the wastewater. In the case ofan existing facility, it will probably be neces-sary to carry out a full-scale wastewater charac-terization study, as presented in Chapter 4,making sure to include the pollution preventionphases. In the case of a new industrial produc-tion facility, it will be necessary to estimate thewastewater characteristics, making maximumuse of data from existing plants reasonablyexpected to be similar.
After design values of wastewater character-istics have been selected, the design parametersfor the treatment system are determined. Theseparameters include the following:
1. Organic loading rate (lb BOD5 per 1000ft2 of disc surface per day)
2. Hydraulic loading rate (gal per ft2 of discsurface per day)
3. Number of stages4. Number of shafts per stage5. Diameter of discs6. Number of discs per shaft 7. Depth of submergence of each rotating
disc assembly8. Rate of rotation of each shaft 9. Hydraulic retention time for each stage
The organic and hydraulic loading ratesusually follow the recommendations of themanufacturer, but the design engineer, whoassumes ultimate responsibility for the success-ful operation of the system, must be aware ofthe reasonableness of the manufacturer’s rec-ommendations. The best way to do this is tobecome familiar with existing installations andthe degrees of success and the problems thosesystems have had.
The number of stages is determined by mak-ing an estimate, using all of the available infor-mation, including the experience of otherdesign engineers, of the efficiency of removal(% removal of BOD5) in each successive stage.The first stage, of course, removes the mosteasily assimilated organics and requires themost oxygen. The succeeding stages arecharacterized by successively slower treatmentkinetics, and the hydraulic residence times,depths of submergence, and disc rotation ratesshould be appropriate.

310 Industrial Waste Treatment Handbook
Fluidized Bed. Attached growth fluidized bedsystems for treatment of industrial wastewaterconsist of a bed of granular material in a tankequipped with a hydraulic distribution systemat the bottom and a treated effluent collectiondevice at the top, very similar to an upflow sandfilter. (In fact, upflow sand filters function asfluidized bed treatment systems when theiroperation results in an attached growth ofmicroorganisms [slime layer] on the sandmedia.) Wastewater to be treated is caused toflow up through the media, usually with apump. As the wastewater flows up through thebed, its velocity and consequent drag forceovercome gravity and lift the granules of media.The higher the velocity, the greater the lift.
A slime layer consisting of microorganismscapable of assimilating the organics in thewastewater becomes attached to the granules ofmedia. Oxygen is made available to thesemicroorganisms by adding air, air enriched inoxygen, pure oxygen, or another source of oxy-gen to the influent flow.
Because wastewater generation within amanufacturing or other industrial facility isnever steady throughout the calendar year, it isnecessary to use an effluent recycle system tomaintain a constant velocity of flow. A clarifierfollows the fluidized bed to separate biologicalmaterial that has sloughed off from the media,as well as particles of the media itself that getscarried over the effluent weir.
DESIGN. Design of an attached growth fluid-ized bed wastewater treatment system is neces-sarily based on laboratory and pilot scalestudies.
The choice of media should take intoaccount surface-to-volume ratio, potential reac-tivity with substances in the wastewater, andspecific weight. Heavier media require morepump energy to attain fluidization.
Treatment of Industrial Wastewaters Using Anaerobic Technologies Anaerobic wastewater treatment, accom-plished through microbiological degradation oforganic substances in the absence of dissolved
molecular oxygen, has undergone a completechange in role since the mid-1980s. Used fordecades as a slow-rate process requiring longretention times and elevated temperatures, itwas considered economically viable for onlywastes of high organic strength. Its principalrole in wastewater treatment was for stabiliza-tion of waste biosolids from aerobic treatmentprocesses, or as a treatment step preceding aer-obic treatment in which large, complexmolecules were broken down to more readilybiodegradable substances. It is now used rou-tinely, at ambient temperatures, on industrialwastewaters having organic strengths as low as2,000-5,000 mg/L COD. In fact, there is cer-tainly the potential to turn the wastewatertreatment world upside down because of theeconomic attractiveness of treating wastewatersusing anaerobic technology first, then polishingwith one of the aerobic technologies.
More recent developments have enabled useof anaerobic treatment at cold temperatures forwastewaters having COD values as low as 100to 200 mg/L. Research conducted sincethe mid-1970s has shown that, by addressingthe fundamental reasons for the apparentlyslow treatment capability of anaerobic systems,modifications could be developed to overcomethem. The result has been the development ofanaerobic technologies that are capable oftreatment performance comparable to aerobicsystems, at significantly lower overall cost.Additionally, anaerobic systems are capable oftreating some substances that are not readilytreated by aerobic systems, such as cellulosicmaterials, certain aromatic compounds, andcertain chlorinated solvents.
In this chapter, all microbiological mecha-nisms carried out in the absence of dissolvedmolecular oxygen (O2), whether anoxic ortruly anaerobic, are referred to as anaerobic. Inthis sense, then, the term “anaerobic” simplymeans “in the absence of free, molecularoxygen.”
Although it can be argued that conclusiveproof has yet to be produced, it is useful, ininterpreting the performance of modern anaer-obic treatment technologies, to assume that thefundamental reason for the apparently slow

Methods for Treating Wastewaters from Industry 311
kinetics of anaerobic treatment is just that—itis a slow microbiological process. On anindividual microorganism-to-organic moleculebasis, anaerobic degradation is slower than aer-obic degradation. The method by which anaer-obic treatment was made capable of competingwith aerobic treatment was to greatly increasethe numbers of anaerobic organisms per unit oforganic matter to be treated. For instance, ifaerobic metabolism is 10 times faster thananaerobic metabolism, then the time requiredfor complete treatment by either process can bemade nearly equal by increasing the number ofactive anaerobic organisms to 10 times thenumber of aerobic organisms, for a given vol-ume of wastewater.
Figure 8-48 illustrates the means by whichanaerobic treatment was successfully trans-formed from a slow process, compared toaerobic treatment, to one that has a requiredhydraulic retention time that is essentially thesame as what is considered normal for aerobictreatment. Figure 8-48(a) illustrates the “old”type of suspended anaerobic culture, character-ized by large clumps of biological solids. Theactive microorganisms can be found withinonly a limited thickness of active biofilm on thesurface. Because the surface-to-volume ratio issmall, the total number of active anaerobicmicroorganisms is small for a given volume ofreactor.
Figure 8-48(b) illustrates two of the newertypes of suspended microbiological cultures.
Anaerobic microorganisms are induced to growon the surfaces of particles that are very smallcompared to the clumps of biosolids shown inFigure 8-48(a), or are induced to develop smallbeads rather than large clumps. The surface-to-volume ratios in the (b) illustrations are ordersof magnitude greater than in the (a) illustration.The result is that there are several orders ofmagnitude more active microbes in a given vol-ume of reactor in the newer anaerobic treat-ment systems.
The question arises, then, as to whether thissame strategy could be used to make aerobictreatment even faster. The answer is thatfor aerobic treatment, the rate-limiting stepbecomes oxygen transfer, or getting oxygenfrom the outside air, or in some cases, from asource of pure oxygen, to the inside of eachmicrobe. There is no such limitation in the caseof anaerobic treatment. For anaerobic treat-ment, the sources of oxygen are nitrate, sulfate,and other anions already present in the waste-water, and water itself.
The principle cost-saving characteristics ofthe newer anaerobic treatment technologies,compared to aerobic technologies such as acti-vated sludge, are (1) the absence of need foraeration, which represents the largest portionof O&M costs for aerobic systems and (2) thefact that the amount of waste biosolids (sludge)that must be handled, dewatered, and disposedof is less than that for aerobic systems byapproximately a factor of ten. Added to these
Figure 8-48 Illustration of the increase in active biomass with decreased size of film support media.
Film ofActive Biomass
Growth onsmall particles
Anaerobicorganismsgrown ascolonies ofsmall beads
(a) (b)

312 Industrial Waste Treatment Handbook
advantages is the cost-recovery capability rep-resented by methane. Methane recovered fromanaerobic treatment processes has routinelybeen used as a source of energy to operatemotors for pumps, or for space heating, eitherat the treatment plant itself, or in another loca-tion. As a general rule, about 5.62 ft3 ofmethane can be harvested as a result of anaero-bic degredation of 1 pound of COD.
The reason for the smaller quantity of wastebiosolids is that anaerobic metabolism is muchless efficient, in terms of units of cell growthper unit of organic matter metabolized, than isaerobic metabolism. Consequently, more of theorganic matter being treated is used for energy,and correspondingly less is used for cellgrowth. For the same reason, correspondinglyless nitrogen, phosphorus, and other nutrientsare needed per unit of organic matter removed,for treatment to take place. For most anaerobictreatment applications, approximately 80% to90% of the COD removed is converted tomethane and carbon dioxide. Five percent orless becomes incorporated into new cell proto-plasm, and the balance is lost as heat or refrac-tory organic “junk.”
A corollary to the characteristics of low rateof conversion of organic material to new cellsand low rate of excess biosolids production isthe characteristic of very long mean cell resi-dence times, compared to aerobic treatmentsystems. In many anaerobic treatment systems,mean cell residence times, otherwise known as“sludge age,” are on the order of 100 to 200days or more.
Two important characteristics of industrialwastewaters regarding their suitability ascandidates for treatment by one of the anaero-bic technologies are alkalinity and sulfur con-tent. As explained following, the anaerobicdegradation of organic substances in industrialwastewaters includes conversion of complexmaterials to organic acids. If the alkalinitywithin the treatment system is insufficient, thepH will decrease to the point of toxicity to thesystem’s microbial population. Similarly, if thesulfate content of an industrial wastewater ismore than about 200 mg/L, the concentrationof hydrogen sulfide, which is a by-product of
the anaerobic degradation process, willincrease to the range of toxicity to the system’smicrobial population.
Development of Anaerobic TechnologiesThe development of anaerobic wastewater
treatment, from a very slow process to a veryfast treatment process, is illustrated in Figure8-49. Hydraulic retention time is used as theindication of treatment speed. The earliestanaerobic reactors were open tanks or openearthen ponds. There was no attempt to controlanything. The contents of the reactors was sim-ply allowed to react at its own speed, at what-ever temperature resulted, and to develop itsown characteristics of biosolids, gas produc-tion, and inert solids buildup. Eventually, theorganic material would become stabilized, wit-ness the absence of massive accumulations oforganics after many years.
Taking advantage of the fact that, in general,all biochemical reactions double in rate,approximately, for every 10°C increase in tem-perature, the next generation of anaerobic reac-tors were managed to attain faster treatmentperformance by heating. Usually, a degree ofmixing was accomplished, either as a separateobjective or as a fortuitous consequence of theheating process, which also added to theincrease in treatment efficiency by increasingthe effectiveness of contact between themicrobes and the organic material.
Mechanisms of Anaerobic Metabolism Anaerobic treatment of organic wastes can
be described as a progression of events thatstarts with hydrolysis, proceeds through acido-genesis, and ends with methanogenesis. Theseprocesses are symbiotic, in the sense that nonecan proceed for very long without one or moreof the others, explained as follows.
As illustrated in Figure 8-50, complexorganics, such as lipids (fats), proteins,polysaccharides, polynucleotides, and aromat-ics, are first broken down to their elementalbuilding blocks. Hydrolysis is the principalmechanism for this process, and there is noreduction of COD. Exoenzymes secreted by a

Methods for Treating Wastewaters from Industry 313
variety of anaerobes carry out this hydrolysis.The basic building blocks include fatty acids inthe case of lipids, amino acids in the case ofproteins, simple sugars for polysaccharides,nucleic acids for nucleotides, and benzenederivatives for aromatic compounds. Thesebasic building materials are further broken
down, again by hydrolysis, to alcohols, andthen to fatty acids of relatively small molecularsize. Acetic acid, plus smaller amounts of prop-rionic, butyric, and valeric acids are the prod-ucts of this process, which is known as“acidogenesis.” Molecular hydrogen is alsoproduced during this process.
Figure 8-49 Development of anaerobic technologies.
Influent Effluent
SEPTIC TANK
Sludgeinlets
Gas storageScum layer
Gas removal
Supernatantoutlets
Sludgeoutlets
Supernatantoutlets
Sludgeoutlets
Floating cover
Supernatant layer
Activelydigesting sludge
Digested sludge
Gas storageScum layer
Supernatant layer
Digested sludge
Fixedcover
Sludgeinlets
Influent
Influent
Influent
Primary Influent
SeperatorGas-SolidsMixed
Liquid
Effluent
Effluent
EffluentRock
Support media
Effluent
Sludge Bed
Return
WasteSludge
ANAEROBIC ACTIVATED SLUDGE
UPFLOW SLUDGE BLANKET
ANAEROBIC FILTER
Sludgeinlets
Sludgeheater
Sludgeoutlets
Mixing CH4+CO2
CH4+CO2
CH4+CO2
CH4+CO2
Mixer
Gas storage
First stage(completely mixed)

314 Industrial Waste Treatment Handbook
Figure 8-50 The groups of bacteria and the principal transformations performed in converting organic particulates tomethane and carbon dioxide during anaerobic digestion. (After Mosey and McInerny and Bryant. Each rectangle representsa bacterial group).
The final steps include conversion of theproducts of hydrolysis and acidogenesis tomethane and carbon dioxide. This process isknown as “methanogenesis.”
The portion of organic matter that is con-verted to new microbial cells is not necessarilyrepresented in Figure 8-50. Some of the inter-mediate and some of the final products of
hydrolysis and acidogenesis are diverted tovarious metabolic pathways of cell materialconstruction. Probably, most of the new cellmaterial is made via the two-carbon precursorof acetate, which is ethanol, being carried intothe cells, then acted on by the cell’s construc-tion machinery, which includes the RNA, theDNA, and the mitochondria.

������� ��� ����� ��������� ���� �������� ���
The primary product of the hydrolytic break-down of complex organic substances is etha-nol. At this point, very little, if any, COD hasbeen removed from the wastewater, and verylittle, if any, energy has been captured by theanaerobes for use in reassembling some of theorganic breakdown products into new cell pro-toplasm. The method used by most anaerobesto liberate this needed energy is to convert theethanol to methane and carbon dioxide, aprocess that, overall, releases almost 21 kcalper mole of ethanol converted. The anaerobescannot convert ethanol directly to methane andcarbon dioxide, however, but must first convertethanol to acetic acid, with the consequentrelease of molecular hydrogen:
The acetic acid is converted to methane andcarbon dioxide:
The energy made available by this transfor-mation, 6.77 kcal/mole of acetate converted(minus losses because of inefficiencies), isused by the anaerobes to make new chemicalbonds in the assembly of new cell protoplasm.There are many products of hydrolysis and aci-dogenesis other than acetic acid, however,including ethyl alcohol, propyl alcohol, propi-onic acid, butyl alcohol, and others. Many ofthese substances cannot be converted directlyto methane and carbon dioxide. Current think-ing is that at least three species of anaerobicorganisms are involved in a three or more stepprocess, at least one of which is an energy-con-suming process. The three-step process forconversion of ethanol is shown in equations 8-63 through 8-65. Equation 8-63 shows thatfirst, ethanol is converted to acetate and molec-ular hydrogen, a process that consumes 1.42kcal of energy per mole of ethanol converted:
Then, both the acetate and the hydrogen areconverted to methane and carbon dioxide, eachby a different species of anaerobe:
(8-64)
(8-65)
As shown, 6.77 kcal of energy per mole ofacetate converted is made available (minuslosses because of inefficiencies) from the con-version of acetate to methane and carbon diox-ide. Two and a half times more than that, 15.63kcal/mole, are made available by the conver-sion of hydrogen and carbon dioxide to meth-ane and water.
As is the case with many microbiologicalmetabolic processes, one of the products ofmetabolism, as shown in equation 8-63, ishighly toxic to the species that carries out theprocess. In the case shown by equation 8-63,the substance that is toxic to the species thatcarries out that reaction is molecular hydrogen.Consequently, in order for the process to con-tinue in an anaerobic reactor, the hydrogenmust be removed by the species responsible forthe reaction, represented by equation 8-65,almost as soon as it is formed. The two anaero-bic species are thus symbiotic because onedepends on the other for food (molecularhydrogen) and the other depends on the first toremove the hydrogen, which is toxic to it. Inaddition, the two species are symbiotic in that,by a means that is not fully understood at thistime, some of the energy released by the reac-tion shown in equation 8-65 is made availableand used by the species that carries out thereaction shown in equation 8-63.
In a manner similar to that shown in equa-tions 8-64 and 8-65, propionic, butyric, andother alcohols and acids are converted to meth-ane and carbon dioxide with the release ofenergy that can be used for cell synthesis. As anexample, equation 8-66 illustrates the break-down of propionate to acetate and hydrogen,
CH3CH2OH + H2O → (8-61)CH3COO− + H+ + 2H2
CH3COO− + H+ → (8-62)CH4 + CO2 + 6.77kcal/mole
(8-63)CH3CH2OH + H2O +
CH3COO− + H+ + 2H2
1.42 kcal/mole→
CH3COO–
H+
+ →
CH4 CO2 6.77 kcal mole⁄+ +
2H2 1 2⁄ CO2+ →
2⁄ CH4 H2O 15.63 kcal mole⁄+ +
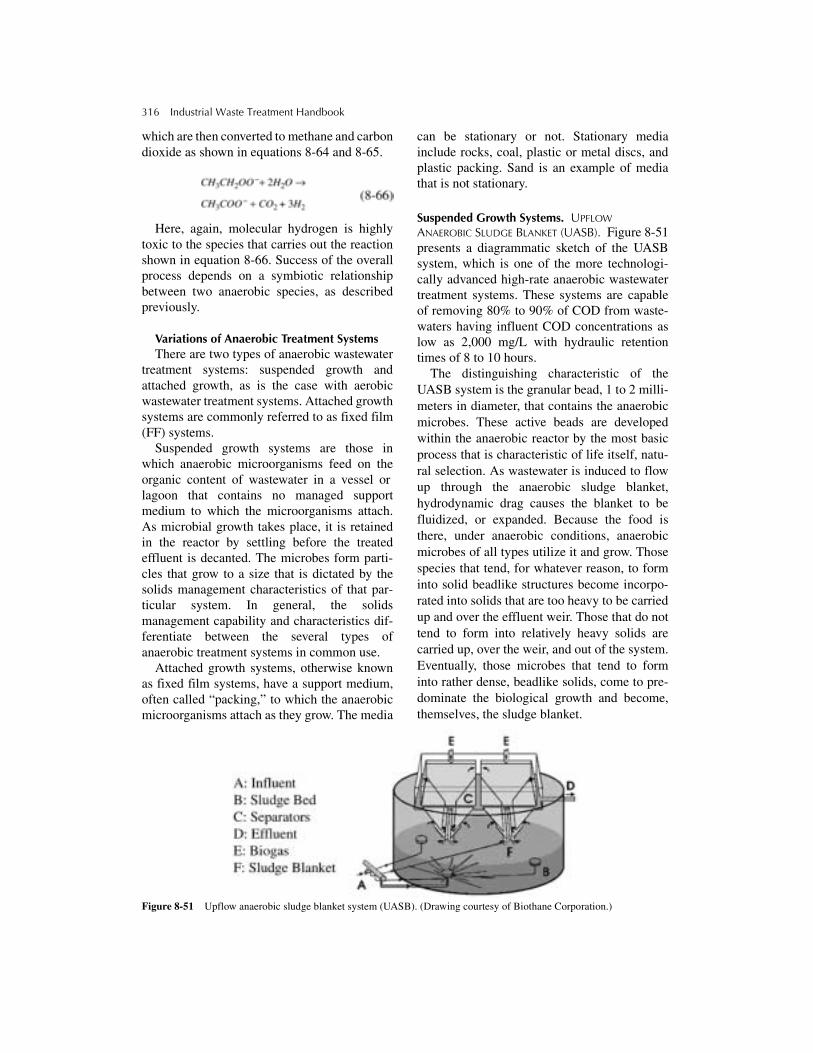
316 Industrial Waste Treatment Handbook
which are then converted to methane and carbondioxide as shown in equations 8-64 and 8-65.
Here, again, molecular hydrogen is highlytoxic to the species that carries out the reactionshown in equation 8-66. Success of the overallprocess depends on a symbiotic relationshipbetween two anaerobic species, as describedpreviously.
Variations of Anaerobic Treatment SystemsThere are two types of anaerobic wastewater
treatment systems: suspended growth andattached growth, as is the case with aerobicwastewater treatment systems. Attached growthsystems are commonly referred to as fixed film(FF) systems.
Suspended growth systems are those inwhich anaerobic microorganisms feed on theorganic content of wastewater in a vessel or lagoon that contains no managed supportmedium to which the microorganisms attach.As microbial growth takes place, it is retainedin the reactor by settling before the treatedeffluent is decanted. The microbes form parti-cles that grow to a size that is dictated by thesolids management characteristics of that par-ticular system. In general, the solidsmanagement capability and characteristics dif-ferentiate between the several types ofanaerobic treatment systems in common use.
Attached growth systems, otherwise knownas fixed film systems, have a support medium,often called “packing,” to which the anaerobicmicroorganisms attach as they grow. The media
can be stationary or not. Stationary mediainclude rocks, coal, plastic or metal discs, andplastic packing. Sand is an example of mediathat is not stationary.
Suspended Growth Systems. UPFLOW
ANAEROBIC SLUDGE BLANKET (UASB). Figure 8-51presents a diagrammatic sketch of the UASBsystem, which is one of the more technologi-cally advanced high-rate anaerobic wastewatertreatment systems. These systems are capableof removing 80% to 90% of COD from waste-waters having influent COD concentrations aslow as 2,000 mg/L with hydraulic retentiontimes of 8 to 10 hours.
The distinguishing characteristic of theUASB system is the granular bead, 1 to 2 milli-meters in diameter, that contains the anaerobicmicrobes. These active beads are developedwithin the anaerobic reactor by the most basicprocess that is characteristic of life itself, natu-ral selection. As wastewater is induced to flowup through the anaerobic sludge blanket,hydrodynamic drag causes the blanket to befluidized, or expanded. Because the food isthere, under anaerobic conditions, anaerobicmicrobes of all types utilize it and grow. Thosespecies that tend, for whatever reason, to forminto solid beadlike structures become incorpo-rated into solids that are too heavy to be carriedup and over the effluent weir. Those that do nottend to form into relatively heavy solids arecarried up, over the weir, and out of the system.Eventually, those microbes that tend to forminto rather dense, beadlike solids, come to pre-dominate the biological growth and become,themselves, the sludge blanket.
Figure 8-51 Upflow anaerobic sludge blanket system (UASB). (Drawing courtesy of Biothane Corporation.)

Methods for Treating Wastewaters from Industry 317
If the velocity of upflow through thesludge blanket is managed, by use of effluentrecycle when wastewater flow rate decreases,the beadlike microbial solids that make upthe sludge blanket rub against one anotherand continually roll and abrade each other’ssurfaces. This action keeps the sizes of theindividual beads to within the desired rangeand maintains the desired high value of“active microorganism-to-organic substance,”which accounts for the high performance ofthe system.
As illustrated in Figure 8-51, the principlecomponents and operational characteristics ofthe UASB system are:
• An influent distribution system
• A sludge “blanket” consisting of beads ofactive anaerobic (and/or anoxic) microor-ganisms, formed as described previously
• A gas collection system• An effluent collection and discharge system
that excludes air from the interior of thereactor
As influent wastewater enters the reactor viathe influent distribution system, it flows upthrough the sludge blanket. Depending on therate of flow, the velocity of the rising influentcauses a certain amount of expansion of thesludge. Furthermore, depending on the cross-sectional area of the sludge blanket, there is a
certain variability in the distribution of theinfluent wastewater. There is a choice to bemade here. For a given volume of sludge blan-ket (i.e., quantity of active microorganisms),the smaller the ratio of the cross-sectional areaof sludge blanket to its depth, the more uniformthe distribution of influent, but the greater thehead against which the influent wastewaterpump(s) must pump. Recently, design practicehas favored deeper sludge blankets of relativelysmall cross-section.
MIXED, HEATED ANAEROBIC DIGESTER Themixed, heated anaerobic digester, usuallyarranged in two stages as illustrated in Figure8-52, is what could be called “the typical ‘high-rate’ sludge digester.” It represents anadvanced version of the “old” anaerobic treat-ment technology, in which only mixing andtemperature elevation were used to reducerequired hydraulic retention time. The princi-pal objective of mixing was to improve contactbetween active microbes and organic material,often in solid form. The objective of heatingwas simply to take advantage of the fact thatalmost all microbial metabolism doubles in ratefor each 10°C rise in temperature. As anattending benefit, some organics, more solubleat the elevated temperature, are more readilymetabolized because of their more direct avail-ability to the microorganisms.
Figure 8-52 Mixed heated anaerobic digester.
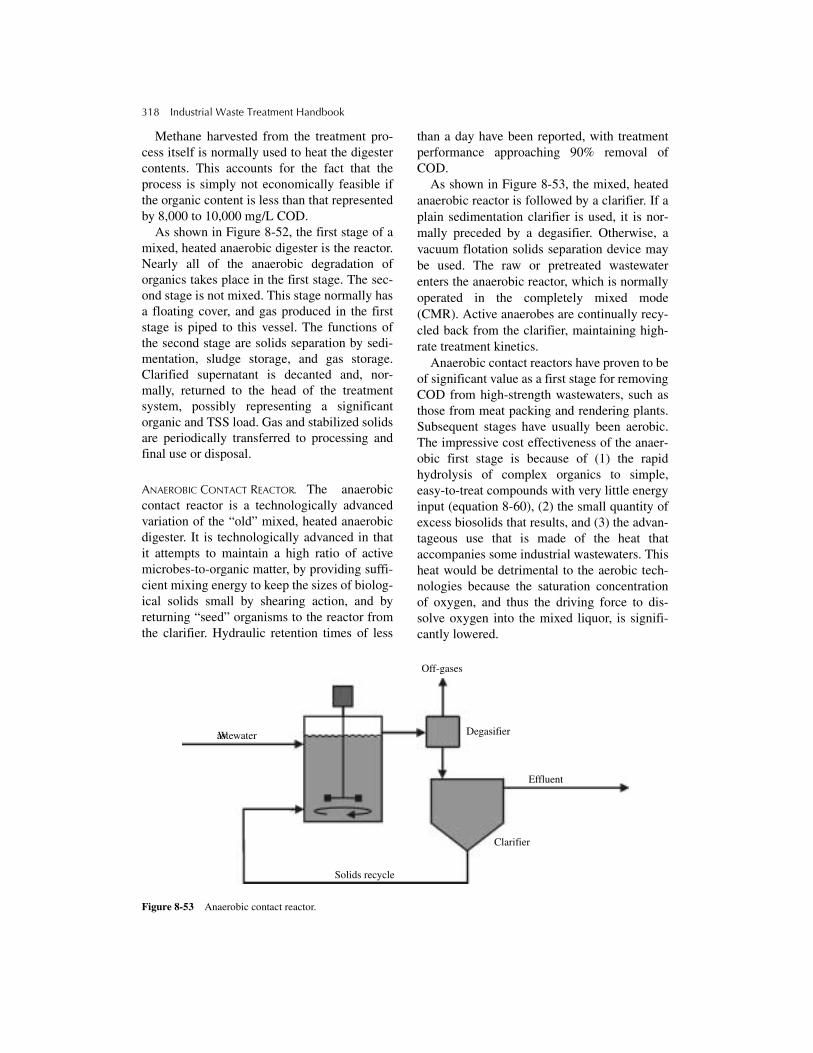
318 Industrial Waste Treatment Handbook
Methane harvested from the treatment pro-cess itself is normally used to heat the digestercontents. This accounts for the fact that theprocess is simply not economically feasible ifthe organic content is less than that representedby 8,000 to 10,000 mg/L COD.
As shown in Figure 8-52, the first stage of amixed, heated anaerobic digester is the reactor.Nearly all of the anaerobic degradation oforganics takes place in the first stage. The sec-ond stage is not mixed. This stage normally hasa floating cover, and gas produced in the firststage is piped to this vessel. The functions ofthe second stage are solids separation by sedi-mentation, sludge storage, and gas storage.Clarified supernatant is decanted and, nor-mally, returned to the head of the treatmentsystem, possibly representing a significantorganic and TSS load. Gas and stabilized solidsare periodically transferred to processing andfinal use or disposal.
ANAEROBIC CONTACT REACTOR. The anaerobiccontact reactor is a technologically advancedvariation of the “old” mixed, heated anaerobicdigester. It is technologically advanced in thatit attempts to maintain a high ratio of activemicrobes-to-organic matter, by providing suffi-cient mixing energy to keep the sizes of biolog-ical solids small by shearing action, and byreturning “seed” organisms to the reactor fromthe clarifier. Hydraulic retention times of less
than a day have been reported, with treatmentperformance approaching 90% removal ofCOD.
As shown in Figure 8-53, the mixed, heatedanaerobic reactor is followed by a clarifier. If aplain sedimentation clarifier is used, it is nor-mally preceded by a degasifier. Otherwise, avacuum flotation solids separation device maybe used. The raw or pretreated wastewaterenters the anaerobic reactor, which is normallyoperated in the completely mixed mode(CMR). Active anaerobes are continually recy-cled back from the clarifier, maintaining high-rate treatment kinetics.
Anaerobic contact reactors have proven to beof significant value as a first stage for removingCOD from high-strength wastewaters, such asthose from meat packing and rendering plants.Subsequent stages have usually been aerobic.The impressive cost effectiveness of the anaer-obic first stage is because of (1) the rapidhydrolysis of complex organics to simple,easy-to-treat compounds with very little energyinput (equation 8-60), (2) the small quantity ofexcess biosolids that results, and (3) the advan-tageous use that is made of the heat thataccompanies some industrial wastewaters. Thisheat would be detrimental to the aerobic tech-nologies because the saturation concentrationof oxygen, and thus the driving force to dis-solve oxygen into the mixed liquor, is signifi-cantly lowered.
Figure 8-53 Anaerobic contact reactor.
Wastewater
Off-gases
Degasifier
Effluent
Clarifier
Solids recycle
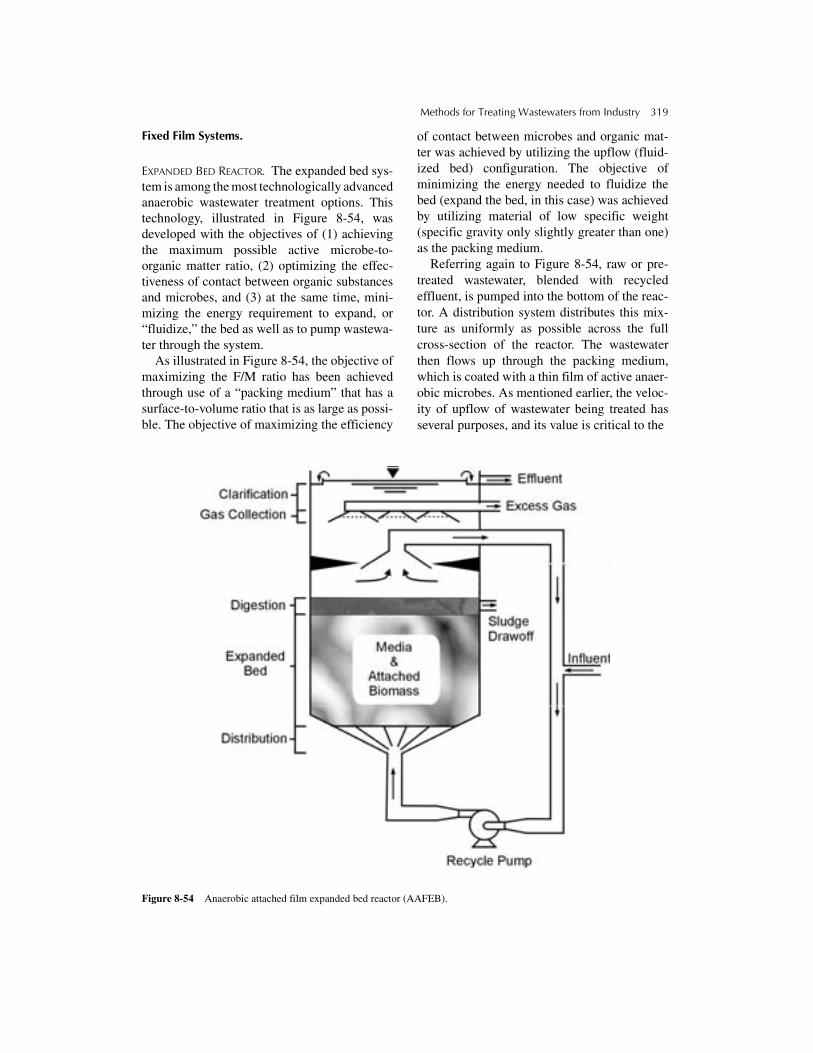
Methods for Treating Wastewaters from Industry 319
Fixed Film Systems.
EXPANDED BED REACTOR. The expanded bed sys-tem is among the most technologically advancedanaerobic wastewater treatment options. Thistechnology, illustrated in Figure 8-54, wasdeveloped with the objectives of (1) achievingthe maximum possible active microbe-to-organic matter ratio, (2) optimizing the effec-tiveness of contact between organic substancesand microbes, and (3) at the same time, mini-mizing the energy requirement to expand, or“fluidize,” the bed as well as to pump wastewa-ter through the system.
As illustrated in Figure 8-54, the objective ofmaximizing the F/M ratio has been achievedthrough use of a “packing medium” that has asurface-to-volume ratio that is as large as possi-ble. The objective of maximizing the efficiency
of contact between microbes and organic mat-ter was achieved by utilizing the upflow (fluid-ized bed) configuration. The objective ofminimizing the energy needed to fluidize thebed (expand the bed, in this case) was achievedby utilizing material of low specific weight(specific gravity only slightly greater than one)as the packing medium.
Referring again to Figure 8-54, raw or pre-treated wastewater, blended with recycledeffluent, is pumped into the bottom of the reac-tor. A distribution system distributes this mix-ture as uniformly as possible across the fullcross-section of the reactor. The wastewaterthen flows up through the packing medium,which is coated with a thin film of active anaer-obic microbes. As mentioned earlier, the veloc-ity of upflow of wastewater being treated hasseveral purposes, and its value is critical to the
Figure 8-54 Anaerobic attached film expanded bed reactor (AAFEB).
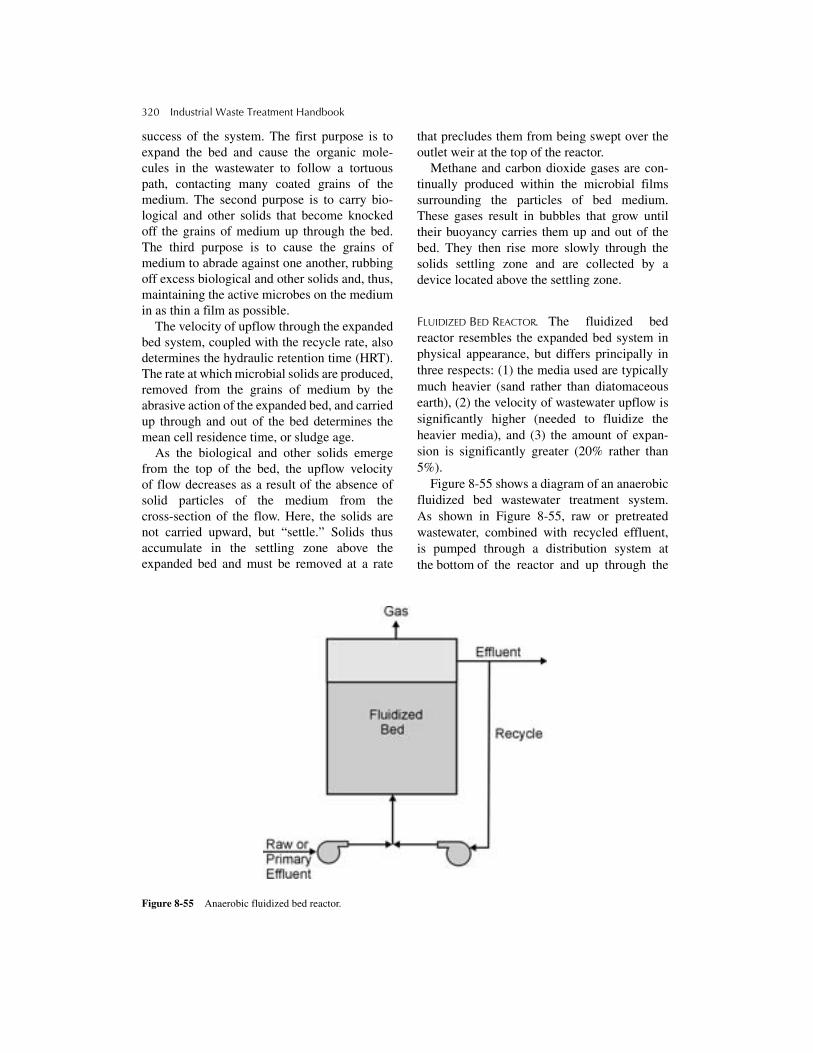
320 Industrial Waste Treatment Handbook
success of the system. The first purpose is toexpand the bed and cause the organic mole-cules in the wastewater to follow a tortuouspath, contacting many coated grains of themedium. The second purpose is to carry bio-logical and other solids that become knockedoff the grains of medium up through the bed.The third purpose is to cause the grains ofmedium to abrade against one another, rubbingoff excess biological and other solids and, thus,maintaining the active microbes on the mediumin as thin a film as possible.
The velocity of upflow through the expandedbed system, coupled with the recycle rate, alsodetermines the hydraulic retention time (HRT).The rate at which microbial solids are produced,removed from the grains of medium by theabrasive action of the expanded bed, and carriedup through and out of the bed determines themean cell residence time, or sludge age.
As the biological and other solids emergefrom the top of the bed, the upflow velocityof flow decreases as a result of the absence ofsolid particles of the medium from thecross-section of the flow. Here, the solids arenot carried upward, but “settle.” Solids thusaccumulate in the settling zone above theexpanded bed and must be removed at a rate
that precludes them from being swept over theoutlet weir at the top of the reactor.
Methane and carbon dioxide gases are con-tinually produced within the microbial filmssurrounding the particles of bed medium.These gases result in bubbles that grow untiltheir buoyancy carries them up and out of thebed. They then rise more slowly through thesolids settling zone and are collected by adevice located above the settling zone.
FLUIDIZED BED REACTOR. The fluidized bedreactor resembles the expanded bed system inphysical appearance, but differs principally inthree respects: (1) the media used are typicallymuch heavier (sand rather than diatomaceousearth), (2) the velocity of wastewater upflow issignificantly higher (needed to fluidize theheavier media), and (3) the amount of expan-sion is significantly greater (20% rather than5%).
Figure 8-55 shows a diagram of an anaerobicfluidized bed wastewater treatment system.As shown in Figure 8-55, raw or pretreatedwastewater, combined with recycled effluent,is pumped through a distribution system atthe bottom of the reactor and up through the
Figure 8-55 Anaerobic fluidized bed reactor.

Methods for Treating Wastewaters from Industry 321
media, which might be sand. The upflowvelocity expands the bed, which allows anygiven molecule of water or organic material totake a tortuous path through the bed, contactingmany grains of medium and, consequently, themicrobial film attached thereto. The upflowvelocity of the wastewater also causes thegrains of the medium to constantly rub againsteach other, and the abrasive action keeps themicrobial film from growing too thick andfrom bridging between grains to form block-ages to flow. Biological and other solids thatare knocked loose from the media are carriedup through the media by the relatively highvelocity of the upflowing wastewater.
As the wastewater emerges from the topof the bed of sand (or other medium), the effec-tive cross-sectional area for the flow increasesgreatly as a result of the absence of solidmedium. Consequently, the upflow velocitydecreases, so that it no longer can carry solidsupward. The solids thus “settle” in the zonejust above the bed.
As methane and carbon dioxide gases areproduced within the microbial films on the sur-faces of the media, bubbles form and growuntil their buoyancy carries them up through
and out of the bed. These gas bubbles then risethrough the solids settling zone and arecollected at the top of the reactor. The type ofgas collection device is one of the characteris-tics that distinguishes among different propri-etary fluidized bed systems.
PACKED BED REACTOR. An anaerobic packedbed reactor consists of a vessel (round steeltank, rectangular concrete basin, earthenlagoon, etc.) that is filled with a stationarysolid medium to which microbes can attachand through which wastewater flows andcomes into contact with the microbes. Ananaerobic packed bed reactor can be operatedin either the upflow or downflow mode, andeffluent recycle can be used to even out varia-tions in raw wastewater flow rate. Many differ-ent types of packing can be used, but the mostcommon are stones and plastic devices of vari-ous shapes. The design objectives of the plas-tic media include high surface-to-volume ratio,structural strength, and to be nonreactive withany chemical that might be in the wastewater.Figure 8-56 shows a diagram of a packed bedreactor.
Figure 8-56 Anaerobic packed bed reactor.

322 Industrial Waste Treatment Handbook
ANAEROBIC LAGOONS. Anaerobic lagoons aresubjected to such a high organic loading thatanoxic or anaerobic conditions prevail through-out the entire volume. The biological treatmentprocesses that take place are the same as thosethat take place in anaerobic digesters; however,there is no mixing, no heating, and no attemptto control or manage either the size or locationof the “clumps” of biological solids thatdevelop. Consequently, the progress of treat-ment is relatively slow, although highly costeffective in many applications.
Basically, the typical anaerobic lagoon is anearthen basin having an inlet, outlet, low sur-face-to-volume ratio, and is relatively deep. Ifthe basin is not excavated from soil of very lowpermeability, it must be lined to protect thegroundwater below. Because of the ever-present potential for problems caused by odors,it is usually necessary to cover anaerobiclagoons. Covers have been manufactured fromsynthetic membranes and Styrofoam. In somecases, the layer of solids that forms on the sur-face of the lagoon as a result of floatinggreases, oils, and the products of microbialmetabolism (scum layer) has successfully pre-vented intolerable odor problems.
Organic loading rates reported for anaerobiclagoons have varied from 54 to 3,000 poundsof BOD5 per acre per day. BOD5 removal per-formance has varied from 50% to 90%. Lagoondepths have varied from 3.5 to 7 feet, andhydraulic detention times have varied from 4 to250 days. More typical organic loadings havebeen in the range of 1,000 pounds of BOD5 peracre per day, with BOD5 removals in the rangeof 70% to 80%. Depths have been typically inthe range of 5 to 7 feet. More typical hydraulicdetention times have been in the range of 30 to50 days, and have varied with climate, beinglonger in colder climates.
Physical Methods of Wastewater Treatment
Physical methods of wastewater treatmentremove substances by use of naturally occur-ring forces such as gravity, electrical attraction,
and van der Waalls forces, as well as by use ofphysical barriers. In general, the mechanismsinvolved in physical treatment do not result inchanges in chemical structure of the targetsubstances. In some cases, physical state ischanged, as in vaporization, and often, dis-persed substances are caused to agglomerate,as happens during filtration.
Physical methods of wastewater treatmentinclude sedimentation, flotation, and adsorp-tion, as well as the use of physical barriers suchas bar racks, screens, deep bed filters, andmembranes.
Separation Using Physical BarriersMany separation processes make use of a phys-ical barrier through which the target pollutantscannot pass, simply because of their size.These physical barriers are classified accordingto the size of the passageways through whichall but the target pollutants (and larger) canpass, and they range from bar racks to reverseosmosis. Bar racks, screens, and sieves are con-sidered to be either part of the headworks orpart of primary treatment, whereas filters,microscreens, dialysis processes, and reverseosmosis are normally considered either second-ary or tertiary treatment, depending on specificuse.
In the cases of the physical barriers withsmaller pores (filters and microscreens, forinstance), particles are often caught on the bar-rier bridge across the openings and form a filterthemselves. For some substances, this surfacefilter is very effective with respect to degree ofsuspended solids removal and builds to appre-ciable thickness. Often, this process contributesto longer filter or screening runs. Somesubstances, however, are prone to clogging thesurface of the filter or screen and are thusnot appropriate candidates for filtration orscreening.
Racks and ScreensScreening is a physical treatment method thatuses a physical barrier as the removal mecha-nism. Screening ranges from coarse bar racks,

Methods for Treating Wastewaters from Industry 323
used to remove objects of 1 inch or more insize, to microscreening, used to remove parti-cles as small as macromolecules (10 or somillimicrons in size).
The success of screening as a treatmentmethod depends on the appropriateness of themesh size of the screening device, compared tothe sizes of the target substances, the cloggingcharacteristics of the material removed on thescreen, and the self-cleaning, or nonclogging,characteristics of the screening device. Barracks can be either equipped with mechanicalself-cleaners or must be periodically cleanedby hand. Smaller screens, including micro-screens, are more difficult to clean, and theclogging characteristics of the wastewater mustalways be taken into account.
Screening is not to be confused with filtra-tion in regards to mechanism of removal.Screening employs the mechanism of physicalbarrier as the primary removal method. Filtra-tion employs adsorption, sedimentation, andcoagulation, in conjunction with the physicalbarrier.
All screening devices that have mesh sizessmaller than ½ inch must be pilot tested beforedesign. The objectives of the pilot test programshould include the clogging characteristics ofboth the screen and the materials in the waste-water, the buildup of head loss over time, andthe potential for damage to the screen.
Bar RacksBar racks, often the first treatment devices to
be encountered by wastewaters en route to ren-ovation, protect pumps and other equipmentfrom damage. These devices remove objectssuch as pieces of product or raw material, bro-ken or dropped items of maintenance equip-ment, gloves, plastic wrapper material, or otherforeign objects that inadvertently gain access tothe industry’s system of drains and sewers. Aself-cleaning feature is considered well worththe extra cost because organic and other mate-rials that are objectionable in many ways,including production of odors, tend to accumu-late on these types of equipment. Materials ofconstruction, as they relate to corrosiveness of
both the wastewater and the atmospheric envi-ronment in which the equipment must operate,are vitally important design considerations.
Two types of bar racks in general use includeracks with stationary bars equipped with amoving automatic mechanical cleaning systemand so-called filter screens, which have a slot-ted conveyor that passes all but the targetobjects. These objects are conveyed away fromthe wastewater by a moving slotted conveyor.Figures 8-57 and 8-58 show examples of a barrack with an automatic moving mechanicalcleaning system and a filter screen, respec-tively. Filter screens have been used withexemplary success at fish-processing plants,tanneries, woolen mills, and sugar refineries, toname a few.
Vibrating ScreensAn example of a vibrating screen, used
widely and successfully at vegetable-process-ing plants, metal-milling shops, and poultry-processing plants, is the so-called Swecoscreen, pictured in Figure 8-59. This screenoperates by receiving a wastewater stream at itscenter. The vibrating action of the screencauses particles or objects larger than the meshsize of the screen to migrate to the periphery,while everything else goes through the screen.Alternative types of vibrating screens includeinclined vibrating screens and drum-typevibrating screens.
Tangential ScreensTangential screens, also known as “sidehill
screens,” have the advantage of having nomoving parts. Various devices have been usedto clean these screens while in use, includingwater sprays, steam blasts, and air blasts.
The tangential screen shown in Figure 8-60operates in the following manner: Wastewaterenters the reservoir at the back of the screen,and after filling the reservoir, overflows overthe top of the screen and flows down over theinclined face of the screen. Water and solidssmaller than the mesh size of the screenproceed through the screen to the collection

324 Industrial Waste Treatment Handbook
Figure 8-57 Bar rack with automatic moving mechnical cleaning system. (Photo courtesy of U.S. Filter.)
device, and are then conveyed to the next treat-ment step. All other solids slide down theincline to be collected at the bottom. The namederives from the fact that the wastewater actu-ally approaches the screen tangentially, as itoverflows the reservoir at the top of the screenand down the incline until it proceeds throughthe screen.
Rotating Cylindrical ScreensRotating cylindrical screens are designed to
continuously clean themselves, using the flush-ing action of the screened water itself.Figure 8-61 shows a photograph of a typicalrotating cylindrical screen. Figure 8-62 illus-trates how the self-flushing action cleans therotating screen on a continuous basis. Asshown in Figure 8-62, wastewater enters thereservoir on one side of the rotating screen.Water and solids that are smaller than the meshsize of the screen flow through the screen,while larger solids are carried on the surface ofthe rotating screen, over the top, down the side,and are removed by the doctor blade located onthe side of the screen cylinder opposite the raw
wastewater reservoir. Small solids that arecaught in the spaces between the wedge-shapedbars that make up the screen are knocked looseand reenter the wastewater (downstream of thescreen itself) via the wastewater that has justgone through the screen, as shown in Figure8-62. The wedge-shaped bars of the screen andthe action of the screened wastewater flushingback through the screen in the direction oppo-site to that of the screening action accomplishthe continuous cleaning as the screen operates.
MicroscreeningMicroscreening, often called microstrain-
ing, is a physical treatment process that closelyresembles the rotating screen, described previ-ously. The major differences are in the size ofthe screen mesh openings and in the flow pathtaken by the wastewater being screened. Screenmesh openings used by microscreens are in therange of 20 to 35 µm. The filter medium is usu-ally a fabric made of synthetic fiber.
As shown in Figure 8-63(a) and (b), themicroscreen is a rotating drum having filter fab-ric around its periphery. The drum is mounted
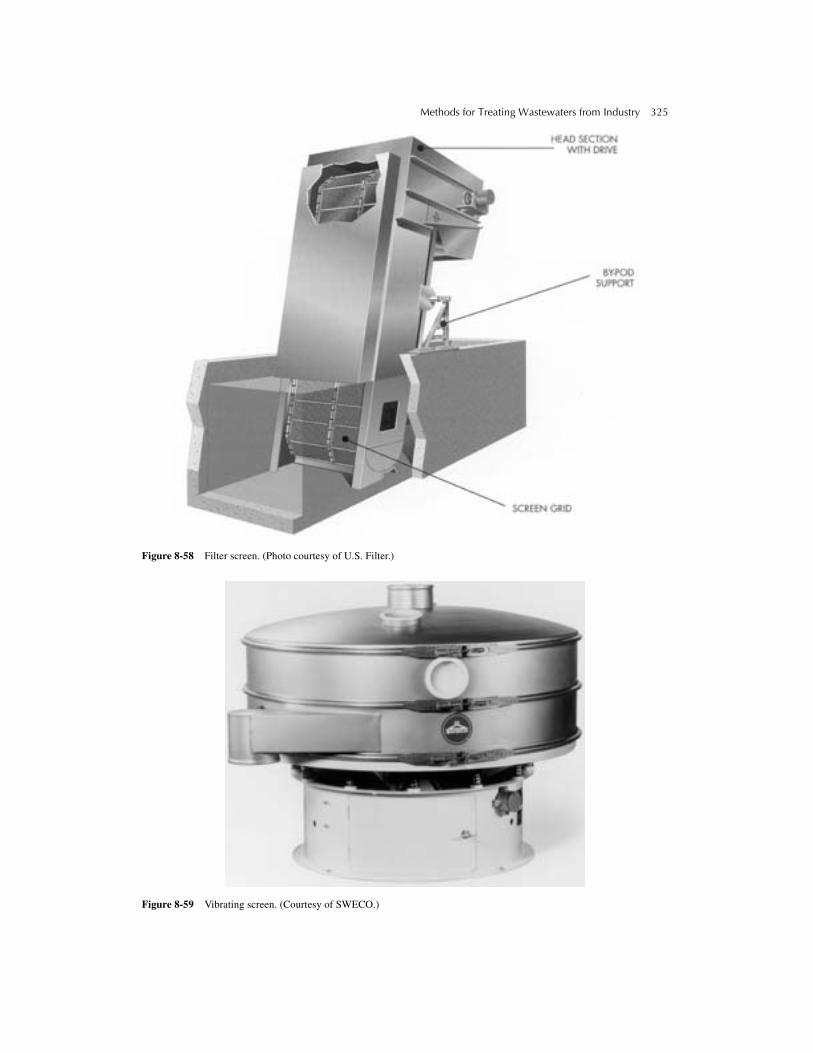
Methods for Treating Wastewaters from Industry 325
Figure 8-58 Filter screen. (Photo courtesy of U.S. Filter.)
Figure 8-59 Vibrating screen. (Courtesy of SWECO.)

326 Industrial Waste Treatment Handbook
into one wall of a reservoir of wastewater,which enters the drum through that end. Thewastewater then flows through the filter fabricfrom the inside to the outside of the drum. Sol-ids that are too large to pass through the filterfabric are removed from the fabric by a mecha-nism at the highest part of the rotating drum.These collected solids flow via a trough toa collection tank. The screened wastewaterflows over a weir, which, as illustrated inFigure 8-63(a) and (b), maintains a certaindegree of submergence of the microscreen.Because of this submergence, a certain amountof screened wastewater flows back through thefilter fabric (from the outside to the inside), dis-lodging particles that have been wedged intothe mesh. In addition to this filter fabric clean-ing action, a system of spray nozzles usuallycleans the fabric. In total, the fabric-cleaningprocess consumes from 2% to 5% of the waste-water flow that has already been screened.
Microscreens have been used to removealgae and other solids from oxidation pondeffluents as well as other types of wastewatertreatment lagoons. Reported removal perfor-mance has usually been in the range of 50%.Hydraulic loading rates have been in the rangeof 75 to 150 gallons per square foot of filtermedium per minute (gal/ft2/min.).
Plate and Frame Filters
Plate and frame filter presses, normally thoughtof in the context of waste treatment as sludgedewatering devices, have been used with excel-lent results as separation processes forprecipitated metals and other substances,immediately following flocculation. A plateand frame filter can also be used sometimeswith and sometimes without precoat and/orbody feed, as shown in Figure 8-64.
Figure 8-64 presents an illustration of a plateand frame filter press. The feed slurry, whichmay contain diatomaceous earth or another“body feed” such as “pearlite,” enters the cen-ter of each framed cavity. The liquid is forcedby pressure created by the feed pump to pro-ceed through the filter medium, which can con-sist of fabric made of natural, synthetic, or
metal fibers. The target particles that, by virtueof their size, cannot go through the filter media(fabric plus body feed, if any) accumulatewithin the framed cavities until the cavities arefull, or until the resistence to flow equals, ornearly equals, the pressure created by thepump. At this point, the filter run is stopped,and the plates are opened to discharge the accu-mulated cake.
A principle advantage of using a plate andframe filter press immediately following floc-culation of a precipitated or coagulated sub-stance is that the product is in an easily handledform. It is also a noteworthy advantage that nogravity settling device is used, thus eliminatingthe expense and labor needed to operate andmaintain that unit process.
Membrane SeparationMembrane separation processes include microfil-tration (MF), ultrafiltration (UF), nanofiltration(NF), reverse osmosis (RO), dialysis, and elec-trodialysis. They use one or more membranes,which can be thought of as physical barriersbetween phases, through which only limitedcomponents of the phases can pass. These pro-cesses are used to separate molecular or ionicspecies from waste streams. The properties ofpollutants to be removed that bear on the appro-priateness of these processes, or, indeed, thatinfluence the selection of one of these processesover the others, are particle size, diffusivity,and/or ionic charge. Each of these membraneprocesses functions by way of something in thewastewater stream passing through one or moremembranes and being concentrated in a streamknown as the “reject.” The treated effluent isless concentrated in the target pollutants thanthe influent by an amount that is proportional tothe driving force as well as to the length of timeover which the treatment takes place.
The rejection (removal) capability of a givenmembrane is rated on the basis of its nominalpore size or molecular weight cutoff (MWCO).MF, UF, and NF membranes typically havepore sizes that allow them to effectivelyremove micron-sized (10−6 m) substances fromwater. UF membranes remove substances thatare 10−9 m and larger.

Methods for Treating Wastewaters from Industry 327
Nanofilters are usually rated by the smallestmolecular weight substance that is effectivelyremoved. These substances include organicmolecules. Molecular shape and polarity areinfluential, as well as molecular size, in deter-mining removal effectiveness.
Reverse osmosis, also referred to as “hyper-filtration,” effectively removes ion-sized sub-stances such as sodium, calcium, sulfate,chloride, and nonpolar organic molecules.
Membrane materials are made from organicpolymers, such as cellulose acetate, polysulfone,
Figure 8-60 Tangential screen. (Courtesy of Hycor.)
Figure 8-61 Rotating cylindrical screen. (Courtesy of Hycor.)

328 Industrial Waste Treatment Handbook
Figure 8-62 Self-flushing action of a typical rotating cylindrical screen.
Figure 8-63(a) Microscreening process. (Courtesy of U.S. Filter/Envirex Products.)
polycarbonate, and polyamide, and inorganics,including aluminum oxide (ceramic) andporous carbon. The preparation of a givenpolymer can be varied to produce membranesof different porosity or MWCO. These mem-branes can be configured in stacks of plates,
spiral-wound modules, or bundles of hollowfibers. Figures 8-65(a)–(d) show several differ-ent configurations in which commercialmembranes can be obtained.
Probably the greatest deterrent to morewidespread use of membrane processes is the
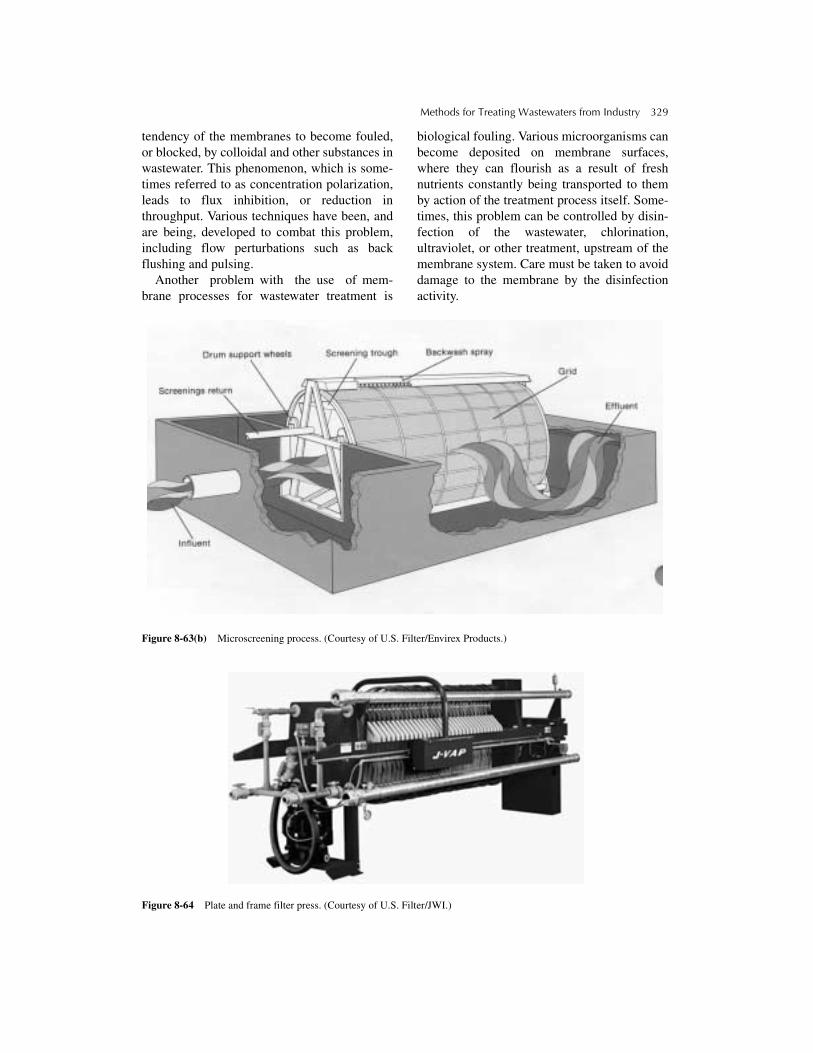
Methods for Treating Wastewaters from Industry 329
tendency of the membranes to become fouled,or blocked, by colloidal and other substances inwastewater. This phenomenon, which is some-times referred to as concentration polarization,leads to flux inhibition, or reduction inthroughput. Various techniques have been, andare being, developed to combat this problem,including flow perturbations such as backflushing and pulsing.
Another problem with the use of mem-brane processes for wastewater treatment is
biological fouling. Various microorganisms canbecome deposited on membrane surfaces,where they can flourish as a result of freshnutrients constantly being transported to themby action of the treatment process itself. Some-times, this problem can be controlled by disin-fection of the wastewater, chlorination,ultraviolet, or other treatment, upstream of themembrane system. Care must be taken to avoiddamage to the membrane by the disinfectionactivity.
Figure 8-63(b) Microscreening process. (Courtesy of U.S. Filter/Envirex Products.)
Figure 8-64 Plate and frame filter press. (Courtesy of U.S. Filter/JWI.)

330 Industrial Waste Treatment Handbook
There has been significant research anddevelopment recently to produce mem-branes that resist fouling of any type. Thisdevelopment has enabled potential use ofmembrane technologies to be used aswaste treatment at the source, as part ofan overall waste minimization (pollutionprevention) program. In some cases, it mayalso be feasible to replace clarifiers withinwastewater treatment systems with one ormore membrane technology systems, thusgreatly simplifying solids separation. Theproduct water may be suitable for reuse inone or more processes (including wash-down water), and the solids may be suit-able for reclamation.
Figure 8-65(a) Commercial membrane configurations.(Courtesy of U.S. Filter/Memcore.)
Figure 8-65(b) Commercial membrane configurations.(Courtesy of U.S. Filter/Memcore.)
Removal MechanismsAs explained earlier, microfiltration, ultrafil-
tration, and nanofiltration are membrane sepa-ration processes that differ principally in the sizerange of the target substances. These filtrationprocesses involve physical filtration of wastewa-ter by forcing, by use of pressure, water mole-cules through a membrane that is not permeableto the target substances. These target substancescan vary in size from small particles to mole-cules. Although this description can be appliedequally well to reverse osmosis, the two pro-cesses differ with respect to the types of mem-branes used. There is only very small osmoticpressure to overcome in the case of ultrafiltra-tion, for instance.
The membranes used for ultrafiltration arenot of the “semipermeable” types that areassociated with osmosis. Therefore, althoughpressure is the principal driving force for bothreverse osmosis (RO) and ultrafiltration (UF),the required pressure is significantly less, andthe cost for power is less for UF. Typical oper-ating pressures for ultrafiltration systems varyfrom 5 to 100 psig, compared to 300 to 1,500psig for RO systems. Whereas RO has the abil-ity to remove dissolved ions such as sodium
Figure 8-65(c) Commercial membrane configurations.(Courtesy of IDI/Infilco Degremont, Inc.)
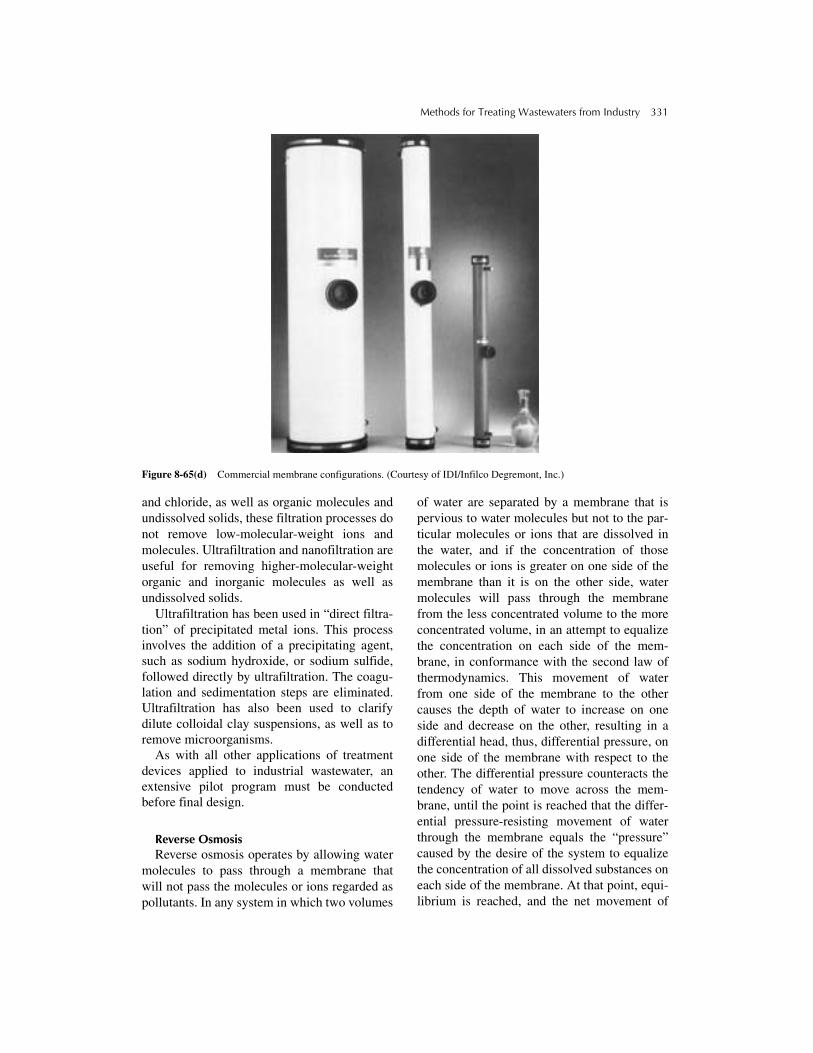
Methods for Treating Wastewaters from Industry 331
Figure 8-65(d) Commercial membrane configurations. (Courtesy of IDI/Infilco Degremont, Inc.)
and chloride, as well as organic molecules andundissolved solids, these filtration processes donot remove low-molecular-weight ions andmolecules. Ultrafiltration and nanofiltration areuseful for removing higher-molecular-weightorganic and inorganic molecules as well asundissolved solids.
Ultrafiltration has been used in “direct filtra-tion” of precipitated metal ions. This processinvolves the addition of a precipitating agent,such as sodium hydroxide, or sodium sulfide,followed directly by ultrafiltration. The coagu-lation and sedimentation steps are eliminated.Ultrafiltration has also been used to clarifydilute colloidal clay suspensions, as well as toremove microorganisms.
As with all other applications of treatmentdevices applied to industrial wastewater, anextensive pilot program must be conductedbefore final design.
Reverse OsmosisReverse osmosis operates by allowing water
molecules to pass through a membrane thatwill not pass the molecules or ions regarded aspollutants. In any system in which two volumes
of water are separated by a membrane that ispervious to water molecules but not to the par-ticular molecules or ions that are dissolved inthe water, and if the concentration of thosemolecules or ions is greater on one side of themembrane than it is on the other side, watermolecules will pass through the membranefrom the less concentrated volume to the moreconcentrated volume, in an attempt to equalizethe concentration on each side of the mem-brane, in conformance with the second law ofthermodynamics. This movement of waterfrom one side of the membrane to the othercauses the depth of water to increase on oneside and decrease on the other, resulting in adifferential head, thus, differential pressure, onone side of the membrane with respect to theother. The differential pressure counteracts thetendency of water to move across the mem-brane, until the point is reached that the differ-ential pressure-resisting movement of waterthrough the membrane equals the “pressure”caused by the desire of the system to equalizethe concentration of all dissolved substances oneach side of the membrane. At that point, equi-librium is reached, and the net movement of
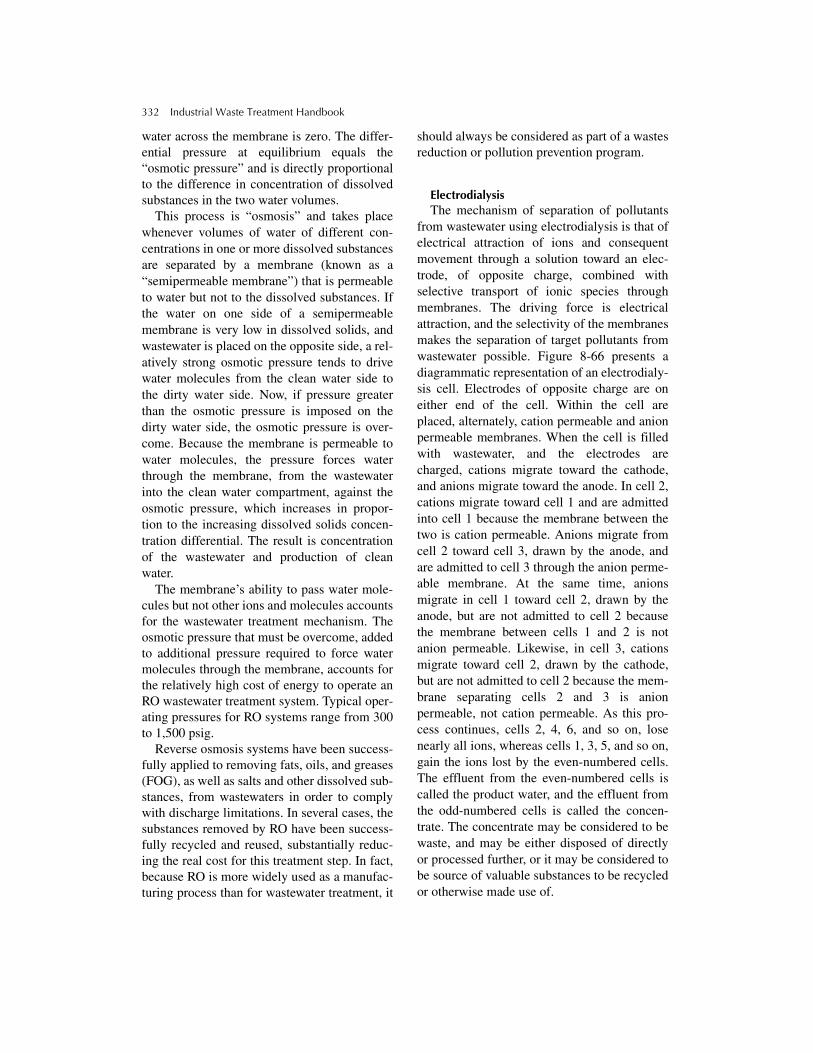
332 Industrial Waste Treatment Handbook
water across the membrane is zero. The differ-ential pressure at equilibrium equals the“osmotic pressure” and is directly proportionalto the difference in concentration of dissolvedsubstances in the two water volumes.
This process is “osmosis” and takes placewhenever volumes of water of different con-centrations in one or more dissolved substancesare separated by a membrane (known as a“semipermeable membrane”) that is permeableto water but not to the dissolved substances. Ifthe water on one side of a semipermeablemembrane is very low in dissolved solids, andwastewater is placed on the opposite side, a rel-atively strong osmotic pressure tends to drivewater molecules from the clean water side tothe dirty water side. Now, if pressure greaterthan the osmotic pressure is imposed on thedirty water side, the osmotic pressure is over-come. Because the membrane is permeable towater molecules, the pressure forces waterthrough the membrane, from the wastewaterinto the clean water compartment, against theosmotic pressure, which increases in propor-tion to the increasing dissolved solids concen-tration differential. The result is concentrationof the wastewater and production of cleanwater.
The membrane’s ability to pass water mole-cules but not other ions and molecules accountsfor the wastewater treatment mechanism. Theosmotic pressure that must be overcome, addedto additional pressure required to force watermolecules through the membrane, accounts forthe relatively high cost of energy to operate anRO wastewater treatment system. Typical oper-ating pressures for RO systems range from 300to 1,500 psig.
Reverse osmosis systems have been success-fully applied to removing fats, oils, and greases(FOG), as well as salts and other dissolved sub-stances, from wastewaters in order to complywith discharge limitations. In several cases, thesubstances removed by RO have been success-fully recycled and reused, substantially reduc-ing the real cost for this treatment step. In fact,because RO is more widely used as a manufac-turing process than for wastewater treatment, it
should always be considered as part of a wastesreduction or pollution prevention program.
ElectrodialysisThe mechanism of separation of pollutants
from wastewater using electrodialysis is that ofelectrical attraction of ions and consequentmovement through a solution toward an elec-trode, of opposite charge, combined withselective transport of ionic species throughmembranes. The driving force is electricalattraction, and the selectivity of the membranesmakes the separation of target pollutants fromwastewater possible. Figure 8-66 presents adiagrammatic representation of an electrodialy-sis cell. Electrodes of opposite charge are oneither end of the cell. Within the cell areplaced, alternately, cation permeable and anionpermeable membranes. When the cell is filledwith wastewater, and the electrodes arecharged, cations migrate toward the cathode,and anions migrate toward the anode. In cell 2,cations migrate toward cell 1 and are admittedinto cell 1 because the membrane between thetwo is cation permeable. Anions migrate fromcell 2 toward cell 3, drawn by the anode, andare admitted to cell 3 through the anion perme-able membrane. At the same time, anionsmigrate in cell 1 toward cell 2, drawn by theanode, but are not admitted to cell 2 becausethe membrane between cells 1 and 2 is notanion permeable. Likewise, in cell 3, cationsmigrate toward cell 2, drawn by the cathode,but are not admitted to cell 2 because the mem-brane separating cells 2 and 3 is anionpermeable, not cation permeable. As this pro-cess continues, cells 2, 4, 6, and so on, losenearly all ions, whereas cells 1, 3, 5, and so on,gain the ions lost by the even-numbered cells.The effluent from the even-numbered cells iscalled the product water, and the effluent fromthe odd-numbered cells is called the concen-trate. The concentrate may be considered to bewaste, and may be either disposed of directlyor processed further, or it may be considered tobe source of valuable substances to be recycledor otherwise made use of.

Methods for Treating Wastewaters from Industry 333
Figure 8-66 Schematic diagram of an electrodialysis cell.
The potential to reduce real costs for treat-ment by realizing value from pollution preven-tion should always be given full consideration.As with reverse osmosis and ultrafiltration,electrodialysis may have its greatest potentialusefulness in purifying isolated waste streamsfor reuse of substances that were previouslyconsidered pollutants, and/or for simple reuse inthe manufacturing process from which it came.
Electrodialysis is applicable to removingonly low-molecular-weight ions from wastewa-ter. Electrodialysis may be used in combinationwith ultrafiltration where dissolved ions wouldbe removed by electrodialysis and organic mol-ecules would be removed by ultrafiltration.
Filtration Using Granular MediaThree principle types of granular filters usedfor industrial wastewater treatment includedeep bed granular filters, precoat filters, andslow sand filters. Filters are physical treatmentdevices, and the mechanisms of removalinclude one or more of physical entrapment,adsorption, gravity settling, impaction, strain-ing, interception, and flocculation. Whereasslow sand filtration accomplishes removalwithin only the first few millimeters of depthfrom the surface of the sand, both deep bedgranular filters and precoat filters (when bodyfeed is used) make use of much more of the fil-ter medium.
There are two distinct operations that char-acterize any granular filter: the filtering phaseand the cleaning phase. With respect to thesetwo phases, operation may be continuous orsemicontinuous. In continuous operation, the
filtering of wastewater and the cleaning of thefilter medium or media take place at the sametime. In semicontinuous operation, these stepstake place in sequence.
Deep Bed Granular FiltersThe intended operational process of a deep bedgranular filter is that solid particles in the sus-pending medium are caused to follow atorturous path through the void spaces betweenthe filter granules until one or more removalmechanisms result in the particle being retainedsomewhere within the depth of the filter. Deepbed granular filters can be (1) of the downflowtype, in which a considerable portion ofremoval takes place on the surface of the filtermedium as well as in the initial few inches, or(2) in the upflow mode, in which the filter bedis expanded, or fluidized, and the initial fewinches of filter medium is not as significant tooverall removal. In fact, the primary removalmechanism involved in an upflow filter appli-cation is likely quite different from thatinvolved in a filter operated in the downflowmode.
Deep bed granular filters use one, two, ormore types of media, including sand, anthracitecoal, and garnet. Figure 8-67 presents a sketchof a multimedia deep bed granular filter inwhich granular anthracite overlays silica sand,which overlays granular garnet. The specificweights of these three materials increase in thesame order, so that during the backwashingpart of the filter’s operational cycle (cleaningphase), a natural separation of the three materi-als takes place.
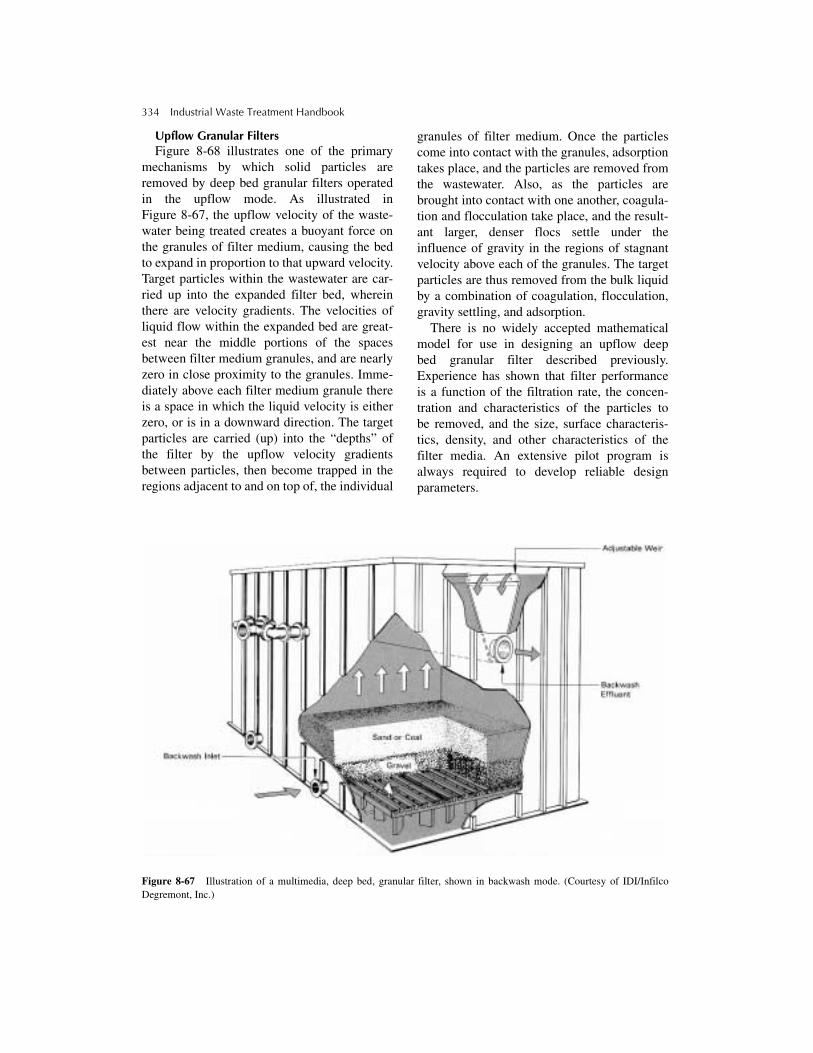
334 Industrial Waste Treatment Handbook
Upflow Granular FiltersFigure 8-68 illustrates one of the primary
mechanisms by which solid particles areremoved by deep bed granular filters operatedin the upflow mode. As illustrated inFigure 8-67, the upflow velocity of the waste-water being treated creates a buoyant force onthe granules of filter medium, causing the bedto expand in proportion to that upward velocity.Target particles within the wastewater are car-ried up into the expanded filter bed, whereinthere are velocity gradients. The velocities ofliquid flow within the expanded bed are great-est near the middle portions of the spacesbetween filter medium granules, and are nearlyzero in close proximity to the granules. Imme-diately above each filter medium granule thereis a space in which the liquid velocity is eitherzero, or is in a downward direction. The targetparticles are carried (up) into the “depths” ofthe filter by the upflow velocity gradientsbetween particles, then become trapped in theregions adjacent to and on top of, the individual
granules of filter medium. Once the particlescome into contact with the granules, adsorptiontakes place, and the particles are removed fromthe wastewater. Also, as the particles arebrought into contact with one another, coagula-tion and flocculation take place, and the result-ant larger, denser flocs settle under theinfluence of gravity in the regions of stagnantvelocity above each of the granules. The targetparticles are thus removed from the bulk liquidby a combination of coagulation, flocculation,gravity settling, and adsorption.
There is no widely accepted mathematicalmodel for use in designing an upflow deepbed granular filter described previously.Experience has shown that filter performanceis a function of the filtration rate, the concen-tration and characteristics of the particles tobe removed, and the size, surface characteris-tics, density, and other characteristics of thefilter media. An extensive pilot program isalways required to develop reliable designparameters.
Figure 8-67 Illustration of a multimedia, deep bed, granular filter, shown in backwash mode. (Courtesy of IDI/InfilcoDegremont, Inc.)

Methods for Treating Wastewaters from Industry 335
Figure 8-68 Illustration of removal mechanism of anupflow granular filter.
Within the limits allowed by the size andnumbers of filter units available, and thequantity of wastewater to be treated, the oper-ator has most control over effluent quality bycontrolling the filtration rate. If the filtrationrate is too high, excess solids will be sweptup and out of the filter. If the filtration rate istoo low, there will not be adequate bed fluidi-zation, and the removal mechanisms describedearlier will not be able to manifest them-selves. The most desirable filtration rate isthat which results in the greatest quantity ofsatisfactory filtrate, on a long-term basis, perunit time of filter use.
Downflow Granular FiltersDeep bed granular filters operated in the
downflow mode remove solid particles bymechanisms that are quite different from thosethat take place in the upflow mode. In thedownflow mode, particles that are smaller thanthe sizes of the pores and passageways betweenfilter medium granules are carried down intothe depths of the filter until they contact, andare adsorbed onto, one of the granules of filtermedium. Figure 8-69 illustrates the currently
accepted model of filtration mechanismswithin downflow granular filters.
Figure 8-69 illustrates that particles aretransported to the vicinity of filter granules(collectors), more or less along the paths offluid streamlines, where attachment, and some-times detachment, occur. Figure 8-69 showsthat several transport mechanisms are opera-tive, including hydrodynamics, diffusion, grav-ity settling, inertia, and interception.
As a deep bed granular filter is operatedin the downflow mode, many of the larger par-ticles are intercepted and removed by sieveaction at the surface of the filter bed. Also,to some extent, these particles bridge acrosseach other and form their own filter, whichfurther filters out new particles brought to thefilter surface. This is the primary removalmechanism in the case of slow sand filters, pre-coat-body feed filters, and other “surface-type”filters. In the case of deep bed granular filters,however, the filtration rate must be sufficientlyhigh that hydrodynamic forces carry most ofthe particles past the media surface and into thedepths of the filter where the mechanisms ofdiffusion, sedimentation, interception, and soon, illustrated in Figure 8-69, lead to attach-ment, and thus, removal.
In the case of precoat-body feed filters,described in more detail following, the filterbed continually builds in depth as the filter runprogresses, and there is a continually renewed“surface” on which particles are collected bysieving action.
Filtration rate, then, is a critical operationalparameter in downflow filters and upflow fil-ters. In the case of downflow filters, too low afiltration rate results in too much removal ofsolids in the upper layers of the filter. The headloss becomes too high for further operationbefore the deeper portions of the filter are madeuse of. Too high a filtration rate, on the otherhand, results in flushing too many solidsthrough the filter, causing the filtrate to beunacceptable.
Headloss is a major operational factor in thecase of downflow granular filters becausehydraulic head, or pressure, is what causesflow through the filter. As particles are

336 Industrial Waste Treatment Handbook
Figure 8-69 Illustration of removal mechanism of a downflow granular filter.
removed on and within the filter, resistance toflow through the filter increases. This resis-tance to flow manifests itself in hydraulicheadloss. Eventually, headloss builds to thepoint where the rate of flow through the filter isunacceptable, and the particles must beremoved by backwashing. Usually, previouslyfiltered water is used for backwashing. Thebackwash water is pumped through a manifoldand distribution system at the bottom of the fil-ter. The backwashing rate of flow is sufficientto expand the bed so that the scouring action ofhydrodynamic forces and the filter mediumgranules bumping and rubbing against eachother dislodge the particles removed during fil-tration. The upflowing backwash then carriesthe removed solids up and out of the filter
media, and into a trough or other collectiondevice above the expanded filter bed.
Auxiliary scouring is sometimes necessaryand is normally provided by one or a combina-tion of high-pressure sprays onto the surfacelayers of the filter medium, mechanical stirringor racking within the filter bed, and/or theintroduction of air bubbles at the bottom of thefilter.
Downflow deep bed granular filters are oper-ated either as constant head with declining rateof flow, or as constant rate of flow with eitherincreasing head or constant headloss. Constantheadloss is achieved by use of an artificialheadloss device, such as a valve on the outlet,that gradually decreases its effect to maintain aconstant total headloss across both the filter
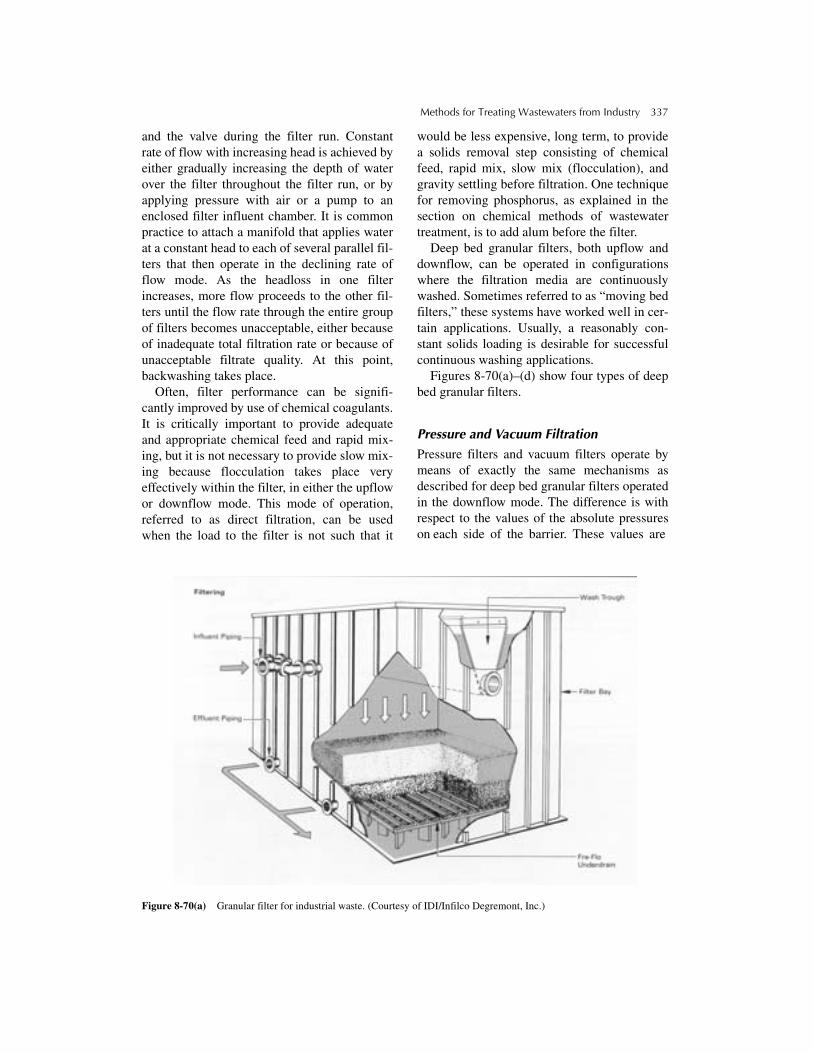
Methods for Treating Wastewaters from Industry 337
and the valve during the filter run. Constantrate of flow with increasing head is achieved byeither gradually increasing the depth of waterover the filter throughout the filter run, or byapplying pressure with air or a pump to anenclosed filter influent chamber. It is commonpractice to attach a manifold that applies waterat a constant head to each of several parallel fil-ters that then operate in the declining rate offlow mode. As the headloss in one filterincreases, more flow proceeds to the other fil-ters until the flow rate through the entire groupof filters becomes unacceptable, either becauseof inadequate total filtration rate or because ofunacceptable filtrate quality. At this point,backwashing takes place.
Often, filter performance can be signifi-cantly improved by use of chemical coagulants.It is critically important to provide adequateand appropriate chemical feed and rapid mix-ing, but it is not necessary to provide slow mix-ing because flocculation takes place veryeffectively within the filter, in either the upflowor downflow mode. This mode of operation,referred to as direct filtration, can be usedwhen the load to the filter is not such that it
would be less expensive, long term, to providea solids removal step consisting of chemicalfeed, rapid mix, slow mix (flocculation), andgravity settling before filtration. One techniquefor removing phosphorus, as explained in thesection on chemical methods of wastewatertreatment, is to add alum before the filter.
Deep bed granular filters, both upflow anddownflow, can be operated in configurationswhere the filtration media are continuouslywashed. Sometimes referred to as “moving bedfilters,” these systems have worked well in cer-tain applications. Usually, a reasonably con-stant solids loading is desirable for successfulcontinuous washing applications.
Figures 8-70(a)–(d) show four types of deepbed granular filters.
Pressure and Vacuum Filtration
Pressure filters and vacuum filters operate bymeans of exactly the same mechanisms asdescribed for deep bed granular filters operatedin the downflow mode. The difference is withrespect to the values of the absolute pressureson each side of the barrier. These values are
Figure 8-70(a) Granular filter for industrial waste. (Courtesy of IDI/Infilco Degremont, Inc.)

338 Industrial Waste Treatment Handbook
Figure 8-70(b) Granular filter for industrial waste. (Courtesy of Parkson Corporation.)
Figure 8-70(c) Granular filter for industrial waste. (Courtesy of IDI/Infilco Degremont, Inc.)

Methods for Treating Wastewaters from Industry 339
Figure 8-70(d) Granular filter for industrial waste. (Courtesy of IDI/Infilco Degremont, Inc.)
normally atmospheric on the low-pressure sideof a pressure filter, and greater than atmo-spheric on the high-pressure, or feed side. Inthe case of the vacuum filter, the pressure onthe feed side of the barrier is normally atmo-spheric, whereas the pressure on the low-pressure side of the barrier is less than atmo-spheric. The principal differences between theequipment, then, are that a liquid pump and air-tight conveying devices are used on the feedside of pressure filters, whereas an air pump(vacuum pump) and air-tight piping and ductwork are used on the low-pressure side of thebarrier in the case of a vacuum filter. The phys-ical barrier can consist of sand or anothergranular material, or fabric made of natural orsynthetic fibers. The fabric can be coated withdiatomaceous earth, or another fine granularmaterial, or used without a granular coatingmaterial.
PrecoatIf the fabric is coated with diatomaceous
earth, pearlite, or another granular material oflow specific gravity, just before each use, the
filter is said to be “precoated.” This “precoat”is applied by simply mixing a predeterminedquantity of the precoat material in clean water,then passing the slurry through the filter just asin a normal filter run. The precoat material,which is the diatomaceous earth, pearlite, orother granular material, will collect in a uni-form layer on the fabric to form a thin granularfilter bed. A valve is then activated, and theprecoat slurry is replaced with wastewater. It isimportant that the hydraulic pressure used forprecoating be maintained continuously fromthe start of the precoat process to the end ofthe filter run, to maintain the integrity of theprecoat.
Body FeedAfter the precoat has been applied, and the
process of filtering the wastewater through theprecoat has commenced, a prescribed concen-tration of the same material as used for precoat(diatomaceous earth, pearlite, or other granularmaterial) is added to the wastewater. Figures8-71(a) and (b) illustrate two methods foraccomplishing this procedure. Figure 8-71(a)

340 Industrial Waste Treatment Handbook
shows that a slurry of filter media can bemetered into the stream of wastewater as it isbeing pumped to the filter. Figure 8-71(b)shows that, alternatively, a predeterminedamount of the filter medium can be mixed into
the wastewater that is to be filtered by use of amixing tank. The mixing tank can be of a sizethat holds one day’s contribution of wastewa-ter, one filter run, or another convenient orcost-effective size.
Figure 8-71(a) Body feed added to precoat filter.
Figure 8-71(b) Body feed added in mixing tank.
Figure 8-72 Body feed increases filter depth.

Methods for Treating Wastewaters from Industry 341
Figure 8-72 illustrates the way in which thegranules of body feed add to the thickness ofthe precoat to develop a filter of increasingdepth as the filtration process proceeds in time.As shown in Figure 8-72, the granules of bodyfeed, which are evenly dispersed throughoutthe wastewater, collect on the outside ofthe precoated filter support surface as thewastewater is forced through. These granulesthus build a filter of ever-increasing thickness,preventing the original precoat from blindingover with suspended solids from the wastewa-ter. Rather, the suspended solids, which are thetarget pollutants intended to be removed by thefilter, are removed in the ever-increasing depthof the body feed filter as it builds.
Pressure or vacuum filters are routinely usedto remove solids from dilute industrial waste-waters, usually with chemical conditioning, aswell as to dewater sludges. One common use ofpressure or vacuum filters is to dewater precipi-tated metals.
Figures 8-73(a)–(f) show six pressure or vac-uum filters that can be used in industrial waste-water treatment.
Swimming Pool Filters In some cases of short-term need, an off-the-
shelf, packaged, automated deep bed granularor septum-type filter assembly, intended forswimming pool use, is a cost-effective alterna-tive to achieve treatment by filtration. Theseitems are inexpensive and are designed andconstructed to provide reliable, automated ser-vice for a few years assuming an unaggressivewater mixture.
Packaged Water Treatment Systems Many packaged treatment systems were
designed and manufactured to treat potablewater. Many of these systems can be used totreat many different industrial wastewaters,with little or no modification. Some wastewa-ters that are candidates for these systems
Figures 8-73(a) Pressure and vacuum filters. (Courtesy of IDI/Infilco Degremont, Inc.)

342 Industrial Waste Treatment Handbook
Figures 8-73(b) Pressure and vacuum filters. (Courtesy of IDI/Infilco Degremont, Inc.)
Figures 8-73(c) Pressure and vacuum filters. (Courtesy of IDI/Infilco Degremont, Inc.)

Methods for Treating Wastewaters from Industry 343
Figures 8-73(d) Pressure and vacuum filters. (Courtesy of Eimco Process Equipment, a Baker Hughes Company.)
Figures 8-73(e) Pressure and vacuum filters. (Courtesy of EIMCO Process Equipment, a Baker Hughes Company.)
include dilute, small-volume process wastes,stormwater runoff, contaminated groundwater,and cooling water.
Several issues must be thoroughly addressedduring the concept or preliminary design phaseof such a project, including corrosivity, effectsof any hazardous materials, or other proper-ties, such as heat, intermittent flow, color,
susceptibility to weather, and variability ofwastewater characteristics.
Slow Sand Filter
Slow sand filters are characterized by a loadingrate that is significantly lower than the moreconventional (sometimes referred to as “rapid
344 Industrial Waste Treatment Handbook
Figures 8-73(f) Pressure and vacuum filters. (Courtesy of Waterlink Separators, Inc.)
sand filters”) filter described earlier. In general,slow sand filters are useful for polishing smallquantities of treated wastewater, water that hasbeen used for scrubbing gases and is to beeither discharged or renovated for another use,or simply as a final “emergency” barrier beforedischarge of water that is normally very clean.
Slow sand filters are loaded at rates between2 and 4 gallons per day per square foot of filtersurface area. Bed depths are typically 2 to 4feet.
The mechanisms of removal in slow sand fil-tration include entrapment, adsorption, biologi-cal flocculation, and biological degradation. Infact, one of the reasons for the very lowhydraulic loading rate of slow sand filters is toallow aerobic conditions within the first inch ortwo of the sand filter surface. The aerobic con-ditions allow for aerobic and, thus, relativelycomplete, biological removal of the organicportion of the material removed from the wastestream. Sand filters are cleaned periodically byremoval of the top one-half to two inches ofsand from the surface.
Plain SedimentationPlain sedimentation can be described as theseparation of particulate materials from waste-water as a result of the influence of gravity. Themore quiescent (nonmoving) the hydraulicregime, the more effective is this removal pro-cess; therefore, a principal objective of plainsedimentation equipment is to produce “quies-cent conditions.” The process of plainsedimentation is often referred to as “clarifica-tion,” and the devices used to accomplish plainsedimentation are called “clarifiers” or “set-tling tanks.”
There are three modes by which particlesundergo the plain sedimentation process: dis-crete settling, flocculent settling, and zone set-tling. Discrete settling is that process by whichindividual particles proceed at a steady veloc-ity, governed principally by the specific grav-ity of the particle and the viscosity of thewastewater, toward the bottom of the settlingdevice. The settling of sand in water is anexample of discrete settling. Flocculent set-tling is undergone by particles, often organic,

Methods for Treating Wastewaters from Industry 345
that agglomerate to larger, faster settling parti-cles as the settling process takes place overtime. The settling of activated sludge in theupper several feet of a secondary clarifier(clarifier that follows, hydraulically, an acti-vated sludge aeration tank or a fixed growthtreatment process) is an example of flocculentsettling. Zone settling is typically undergoneby a suspension of relatively concentratedsolid particles (sludge) as it concentrates evenmore. The vertical distance that an individualparticle moves decreases with increasing depthin the sludge mass itself.
The overall objective of any physical waste-water treatment device, including clarifiers, isto remove as much solid material as possible,as inexpensively as possible, with a resultingsludge that has as low a water content as possi-ble. The final residuals of the treatment pro-cesses must undergo final disposal, and the costof final residuals disposal is usually propor-tional to some degree to the water content.
Discrete Settling Under the influence of gravity, a particleimmersed in a body of fluid accelerates down-ward until the forces relating to viscosity thatresist its downward motion equal the forcecaused by gravity. At this point, the particle issaid to have reached terminal velocity,described by equation 8-67:
(8-67)
where:
vs = velocity of sedimentation (ft/sec)
g = acceleration due to gravity (ft/sec2)
ρs = density of the particle (lb/ft3)
ρl = density of the fluid (lb/ft3)
D = diameter of particle (ft)CD = coefficient of drag
The coefficient of drag, CD, depends on sev-eral factors, including the diameter of the parti-cle, if hydraulic turbulence is significant withinthe settling device. For the small size of
particles usually encountered in clarification ofindustrial wastewater, and the relatively lowturbulence encountered in a well-operatingclarifier, the relationship presented in equation8-68 is considered to hold:
(8-68)
where: NR = Reynolds number Because Reynolds number increases with
increasing turbulence of the fluid, the settlingvelocity, which is analogous to the rate of clari-fication, increases with decreasing turbulence.
There are interesting relationships, as shownby Hazen and Camp, between particle settlingvelocity, the surface loading of a clarifier, andthe theoretical effect of depth of the clarifier onparticle removal efficiency. These relationshipsare based on the conditions of a uniform distri-bution of particles throughout the entire clari-fier at its influent end, and of whether aparticle can be considered to be removed assoon as it reaches the bottom of the clarifier. Ifthe rate of settling, expressed as vertical dis-tance settled per unit of horizontal distance offorward flow in (ft/ft) of a particle in a clarifieris multiplied, top and bottom (numerator anddenominator), by the rate of wastewater flow,in cubic feet per day, the units of gallons perday can be developed in the numerator, and theunits of area, or square feet, can be developedin the denominator.
Therefore, equation 8-69 can be written:
(8-69)
which states that particle settling velocity, inft/ft, is numerically equivalent to a term called“surface loading rate,” having the units, gallons(of wastewater) per square foot (of clarifiersurface area) per day, indicating that only clari-fier surface area, to the exclusion of clarifierdepth, is of significance to the performance ofa clarifier.
Figure 8-74 illustrates that the major effectof increasing clarifier depth is simply toincrease the time it takes to remove a given
Vs
4g ρs ρ1–( )D3CDρ1
---------------------------------
12---
=
CD24NR-------=
Vs ft ft⁄( ) surface loading rate GPD ft⁄ 2( )=

346 Industrial Waste Treatment Handbook
particle, rather than to have any effect onremoval effectiveness or efficiency.
Figure 8-74 illustrates that all particleshaving settling velocities equal to or greaterthan vs will be completely removed. All par-ticles having settling velocities less than vswill be removed as described by the ratiov/vs.
Flocculent Settling Many solid particles found in wastewaters tendto agglomerate as they settle under quiescenthydraulic conditions, and because they becomedenser as they coagulate and agglomerate, theirterminal velocities increase over time. Thepaths followed by solid particles undergoingflocculent settling, then, are illustrated inFigure 8-75.
Often, a given industrial wastewater containsa mixture of solids, some of which settle as dis-crete particles, and others that undergo floccu-lent settling. When sufficient particles reachthe lower portion of the clarifier, the accumu-lated mass (sludge blanket) undergoes zonesettling. Normally, either discrete or flocculentsettling predominates in the upper portion ofthe clarifier and, therefore, becomes the basisfor design. Those gravity clarification devicesthat combine the processes of primary sedi-mentation and sludge thickening are called“clarifier-thickeners.” For these devices, thethickening characteristics of the settled sludgeare also a basis for design.
Sludge ThickeningOnce solids have settled under the influence ofgravity, they must be removed from the bottomof the clarifier and ultimately disposed of. Inorder to reduce the cost of handling this mate-rial, it is desirable to reduce the moisturecontent, and thereby the volume, to a minimumas soon as practicable. To this end, “gravitythickeners” are often designed and built as inte-gral components of wastewater treatmentsystems. Some clarifiers incorporate a thicken-ing capability into the sludge zone, and are thuscalled “clarifier-thickeners.”
Kynch, Talmage and Fitch, Behn andLiebman, and Edde and Eckenfelder havedeveloped various methods for predicting per-formance of thickeners based on results of lab-oratory bench scale tests. These thickeningtests have the common procedure of usingstandard 2-liter graduated cylinders that arefilled with primary clarifier sludge, then therate of downward progress (under the influenceof gravity) of the sludge-water interface isdetermined. The aforementioned researchershave published different methods for analyzingthe data collected using the 2-liter graduatedcylinders.
Kynch’s method uses the assumption that thesettling velocity of a particle is a function ofonly the concentration of particles around thatparticle. A conclusion that resulted from thisanalysis was that waves of constant concentra-tion move upward from the bottom of a settlingsolids concentration, each wave moving at aconstant velocity. Talmage and Fitch used thisanalysis to show that the area of a gravitythickener is a function of the “solids handlingcapacity” of a given zone of constant concen-tration. The unit area (U.A.) required to pass aunit weight of solids through a given concen-tration (Ci) can be expressed as:
U.A. = (8-70)
where:
Vi = settling velocity of the particles at con-centration Ci
Cu = underflow solids concentration
The “underflow solids concentration” isthe suspended solids concentration of thesludge as it is withdrawn from the bottom ofthe clarifier.
Behn and Liebman developed a relationshipfor the depth of the sludge compression zone asa function of the initial sludge concentration,rate of elimination of water from the mass ofcompressing sludge, dilution ratio, specificgravities of the solids and water, underflowconcentration, and thickener area.
1Vi-----
1Ci-----
1Cu------–⎝ ⎠
⎛ ⎞

Methods for Treating Wastewaters from Industry 347
Figure 8-74 Illustration of the effect of increasing clarifier depth.
Figure 8-75 Illustration of settling paths taken by particles undergoing flocculent settling.
Edde and Eckenfelder developed a proce-dure for scale-up from bench scale results todesign parameters for prototype thickeners.Thickener design is based on the followingmathematical model relating thickener massloading (ML) to underflow concentration (Cu),as follows:
(8-71)
The depth of sludge in a batch test (Db) isrelated to depth of sludge in the prototype (Dt)based on conditions observed in the field.
The design procedure presented as followsuses a “settling column” (for discrete and/or
Cu CO⁄( ) 1– D ML( )⁄ n=
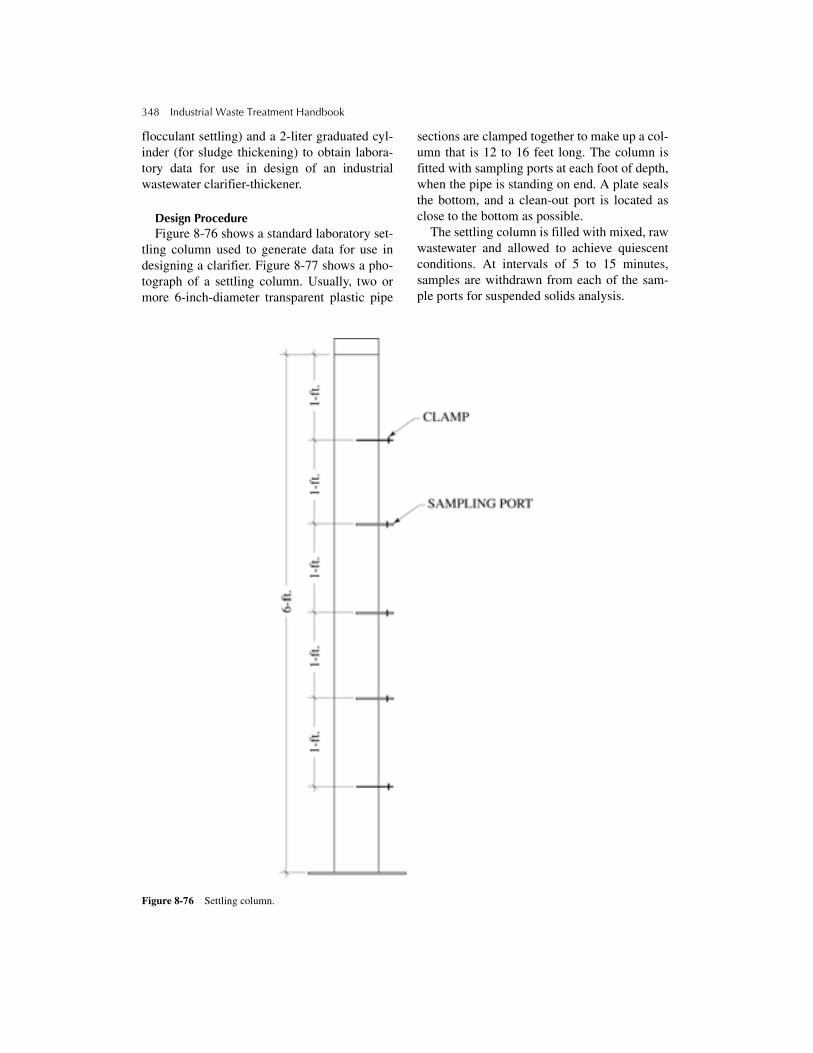
348 Industrial Waste Treatment Handbook
flocculant settling) and a 2-liter graduated cyl-inder (for sludge thickening) to obtain labora-tory data for use in design of an industrialwastewater clarifier-thickener.
Design Procedure Figure 8-76 shows a standard laboratory set-
tling column used to generate data for use indesigning a clarifier. Figure 8-77 shows a pho-tograph of a settling column. Usually, two ormore 6-inch-diameter transparent plastic pipe
sections are clamped together to make up a col-umn that is 12 to 16 feet long. The column isfitted with sampling ports at each foot of depth,when the pipe is standing on end. A plate sealsthe bottom, and a clean-out port is located asclose to the bottom as possible.
The settling column is filled with mixed, rawwastewater and allowed to achieve quiescentconditions. At intervals of 5 to 15 minutes,samples are withdrawn from each of the sam-ple ports for suspended solids analysis.
Figure 8-76 Settling column.

Methods for Treating Wastewaters from Industry 349
Figure 8-77 Settling column.
Figure 8-78 presents a plot of the resultsof suspended solids analyses obtained atprogressive time intervals from each of thesampling ports in the settling column. Linesthat connect the data points from each sam-pling port represent given fractions of TSSremoval and describe the approximate path thatwould be taken by particles settling in an idealsettling tank (no physical or other influences onthe settling particles other than gravity and vis-cous resistance to motion). The data plotted asshown in Figure 8-78 are analyzed, and criteriafor design of a clarifier are developed, asshown in the following example.
Example 8-6: Development of design criteria for a clarifier-thickener By Kurt MarstonUsing a standard settling column, and the pro-cedures described by Eckenfelder and Ford,
develop design criteria for the settling portionof a combination clarifier-thickener to removeand concentrate suspended solids from waste-water from a paper mill. Using standard 2-litergraduated cylinders, develop design criteria forthe sludge thickening portion of the combina-tion clarifier-thickener.
Solution: Clarifier portion of clarifier-thickener
Raw wastewater was collected from the papermill effluent at an integrated Kraft pulp andpaper mill. The standard settling column shownin Figure 8-76 was filled with the (well-mixed)wastewater, and quiescent conditions wereallowed to develop. Then, samples were with-drawn from each of the ports simultaneously atvarious time intervals. Each sample was ana-lyzed for suspended solids concentration. TheBOD5 was determined on samples from the

350 Industrial Waste Treatment Handbook
port located 3 feet below the top of the column.Two of these procedures were carried out, oneat a temperature of 3.5oC and another at18.5oC.
The data thus developed were plotted asshown in Figures 8-79 and 8-80. Figure 8-79presents the results of data from the proce-dure performed at the temperature of 3.5oC.Figure 8-80 presents the results of data takenat 18.5oC. Comparison of these results showsthat higher settling rates were obtained at thehigher temperature, a result to be expectedbecause of the higher viscosity, thus greaterdrag, and thus slower settling of particlesthrough the more viscous medium at thelower temperature.
Figure 8-81 presents suspended solidsremoval versus detention time for the wastewa-ter at 3.5oC and at 18.5oC. The correspondingoverflow rates are presented in Figure 8-82.BOD5 removal as a function of suspended sol-ids removal is presented in Figure 8-83. Theseresults, as expected, show that BOD5 removalincreased with increasing suspended solidsremoval, but at a decreasing rate, as the limit ofBOD5 contributed by suspended solids (asopposed to dissolved organics).
These three figures, then, are the principalproduct of the settling column analysisprocedure. These results, along with appropri-ate scale-up factors (obtained from manufac-turers) can be used to determine the cost forthe different sizes of clarifier, as determinedby overflow rate and the desired percentremoval of suspended solids and/or BOD5.
Thickener Portion of Clarifier-ThickenerSamples of primary clarifier sludge were
collected at a paper mill that was very simi-lar in type of manufacturing process to themill for which the column settling analysespresented previously were being performed.The samples of sludge were diluted (with pri-mary effluent) to the desired initial sus-pended solids concentration, then placed inthe 2-liter graduated cylinders. The initial sus-pended solids concentration, temperature, andspecific weight of the water were determined
for each cylinder. The liquid-solids interfacelevel was recorded at regular intervals untila constant level was reached. The resultsof these data are presented in Figure 8-84,which presents plots of solids-liquid inter-face height versus time for four initial sludgeconcentrations.
Using the mathematical models presentedby Talmage and Fitch and Behn and Lieb-man, the solids concentration, Ci, at the inter-face at time, ti, and the settling velocity, Vi,of the particles at concentration Ci can bedetermined.
Figure 8-85 presents solids concentration,Ci, versus time relationships for the four sludgeslurries examined, and Figure 8-86 presents theconcentration-velocity relationships.
The next step is to determine the unit area(ft.2/lb/day) required for given values ofsludge-liquid interface settling velocities forthree or more different values of initial sludgeconcentrations. These results are presented inFigure 8-87, which shows that for given valuesof initial sludge concentration there is a maxi-mum unit area (high point on each curve). Asdiscussed by Behn and Liebman and Talmadgeand Fitch, the maximum unit area for a givenunderflow (initial sludge) concentration is thetheoretical cross-sectional area required for asludge thickener.
Figure 8-88 is then constructed in order todetermine the depth required for thickenersfor given values of underflow (initial sludge)concentration. As discussed by Behn andLiebman, the depth of a thickener is a frac-tion of the volume represented by a given“dilution” of the solids, or “dilution factor”.Figures 8-88(a) – (d) present plots of dilu-tion factors versus time for the appropriatevalues of sludge underflow concentration.The slopes of the appropriate lines are equalto the values of k in equation 8-72:
(8-72)
Depth H
QoCo tu tc–( ) 1ρs-----
D∞ρw-------+⎝ ⎠
⎛ ⎞
ADc Du–( ) Q0C0( )
ρw kH0( )-------------------------------------------–
-----------------------------------------------------------==

Methods for Treating Wastewaters from Industry 351
Figure 8-78 Plot of percent removal of TSS at given depths vs. time. Settling column analysis.
Figure 8-79 Solids removal for depth vs. time (3.5°C).
10 20 30 40
20% 30% 40% 70%60%50%
DE
PTH
, ft
TIME, MIN.
50 60
d1
d2
d3
d4
d5
100 20
20%
30%
40%
65%
70%
60%
50%
DE
PTH
, ft.
TIME, min.
30 40
0
4
3
2
1
5
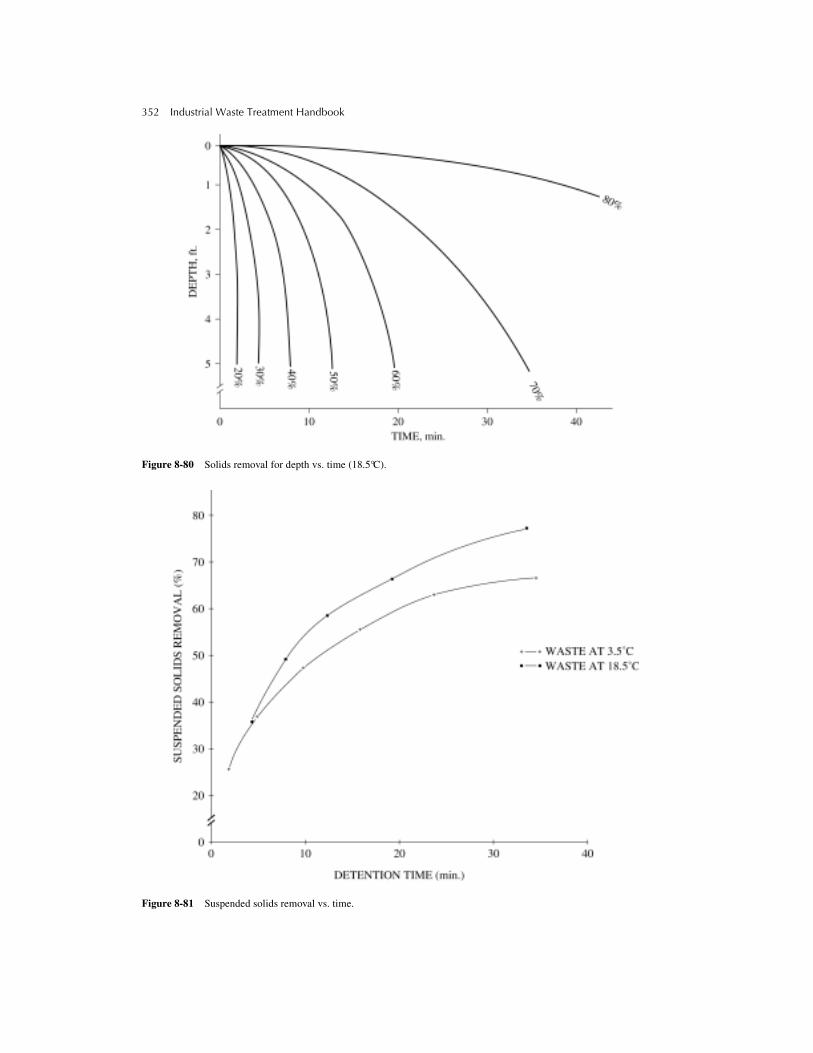
352 Industrial Waste Treatment Handbook
Figure 8-80 Solids removal for depth vs. time (18.5°C).
Figure 8-81 Suspended solids removal vs. time.

Methods for Treating Wastewaters from Industry 353
Figure 8-82 Suspended solids removal vs. overflow rate.
Figure 8-83 BOD5 removal vs. suspended solids removal.

354 Industrial Waste Treatment Handbook
Figure 8-84 Liquid-solids interface height vs. time.
Figure 8-89 can be constructed to illustratethe analysis of data described by Edde andEckenfelder. In this analysis, the results ofsludge-liquid interface height versus time andunit area versus settling velocity are plotted aspresented in Figures 8-84 and 8-87.
Then, the values of maximum unit area fordifferent feed and underflow concentrations areconstructed as shown in Figure 8-89. The nextstep is to construct the semi-log plot of thedepth in the batch test versus original solidsconcentration, as presented in Figure 8-90. Fig-ures 8-89 and 8-90 can be interpolated toobtain values needed for design calculations,which are not identical to those used in the lab-oratory analysis.
Design Calculations
By Kurt MarstonHaving constructed the curves as presented
in Figures 8-79 through 8-90, the appropriatesize of clarifier-thickener for wastewaters of
given solids settling characteristics can bedetermined, as illustrated in the followingdemonstrative calculations.
Example 8-7:
Design a clarifier-thickener for the pulp andpaper wastewater using the testing datadescribed in Figures 8-79 through 8-90 toaccommodate an influent design flow of 10million gallons per day (MGD) and to achieve60% suspended solids removal at 3.5°C with anunderflow concentration of 10,000 mg/L.Influent suspended solids (the raw wastewater)were measured at approximately 300 mg/L.
Clarifier requirements can be derived fromFigures 8-81 and 8-82. Based upon the data curvesfor wastewater at 3.5°C, Figure 8-81 shows a min-imum detention time of approximately 20 min-utes and Figure 8-82 shows a minimum overflowrate of approximately 2500 gpd/ft2 required toachieve 60% suspended solids removal.
Minimum area for clarification =(10,000,000 gpd) / (2500 gpd/ft2) = 4,000 ft2
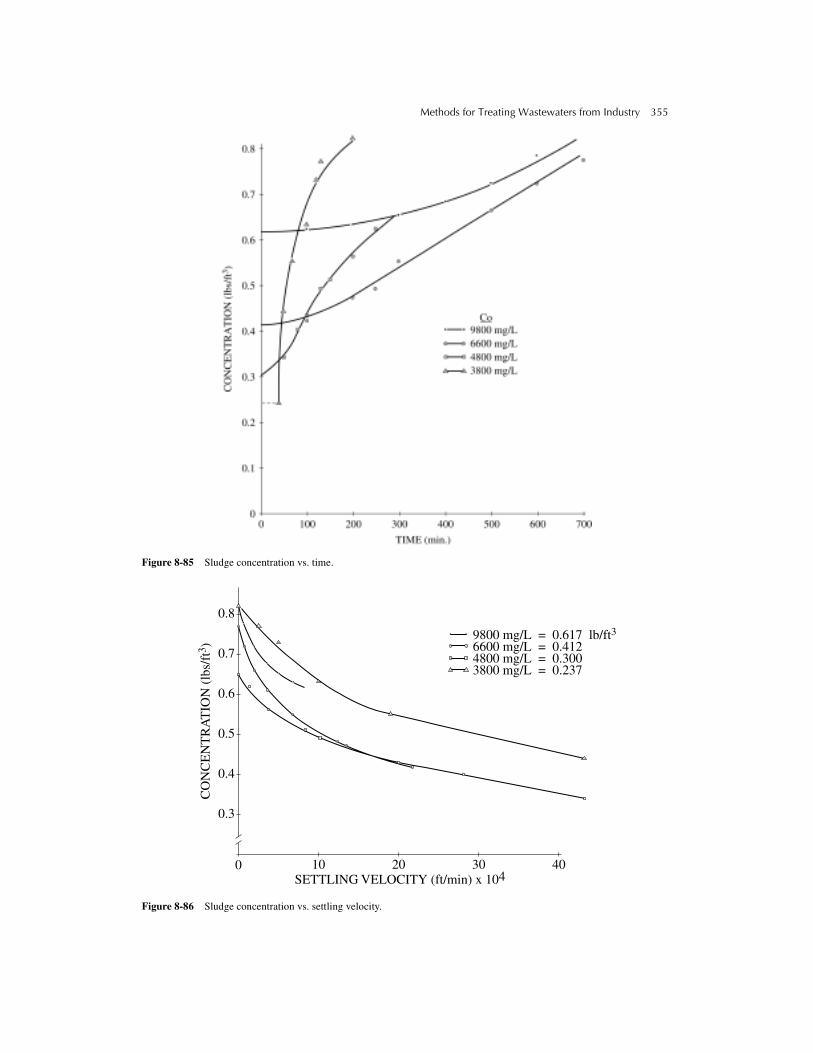
Methods for Treating Wastewaters from Industry 355
Figure 8-85 Sludge concentration vs. time.
Figure 8-86 Sludge concentration vs. settling velocity.
100
0.3
0.4
0.5
0.6
0.7
0.8
20
9800 mg/L = 0.617 lb/ft36600 mg/L = 0.412
3800 mg/L = 0.2374800 mg/L = 0.300
SETTLING VELOCITY (ft/min) x 104
CO
NC
EN
TR
AT
ION
(lb
s/ft
3 )
30 40
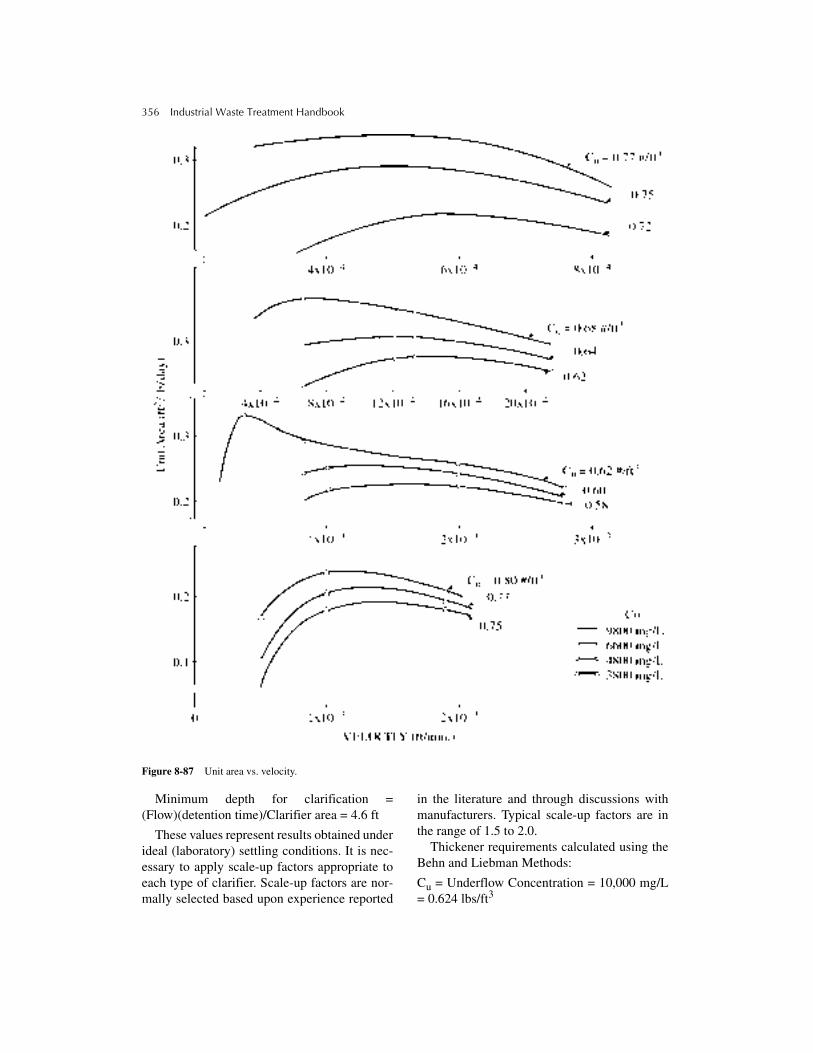
356 Industrial Waste Treatment Handbook
Figure 8-87 Unit area vs. velocity.
Minimum depth for clarification =(Flow)(detention time)/Clarifier area = 4.6 ft
These values represent results obtained underideal (laboratory) settling conditions. It is nec-essary to apply scale-up factors appropriate toeach type of clarifier. Scale-up factors are nor-mally selected based upon experience reported
in the literature and through discussions withmanufacturers. Typical scale-up factors are inthe range of 1.5 to 2.0.
Thickener requirements calculated using theBehn and Liebman Methods:
Cu = Underflow Concentration = 10,000 mg/L= 0.624 lbs/ft3
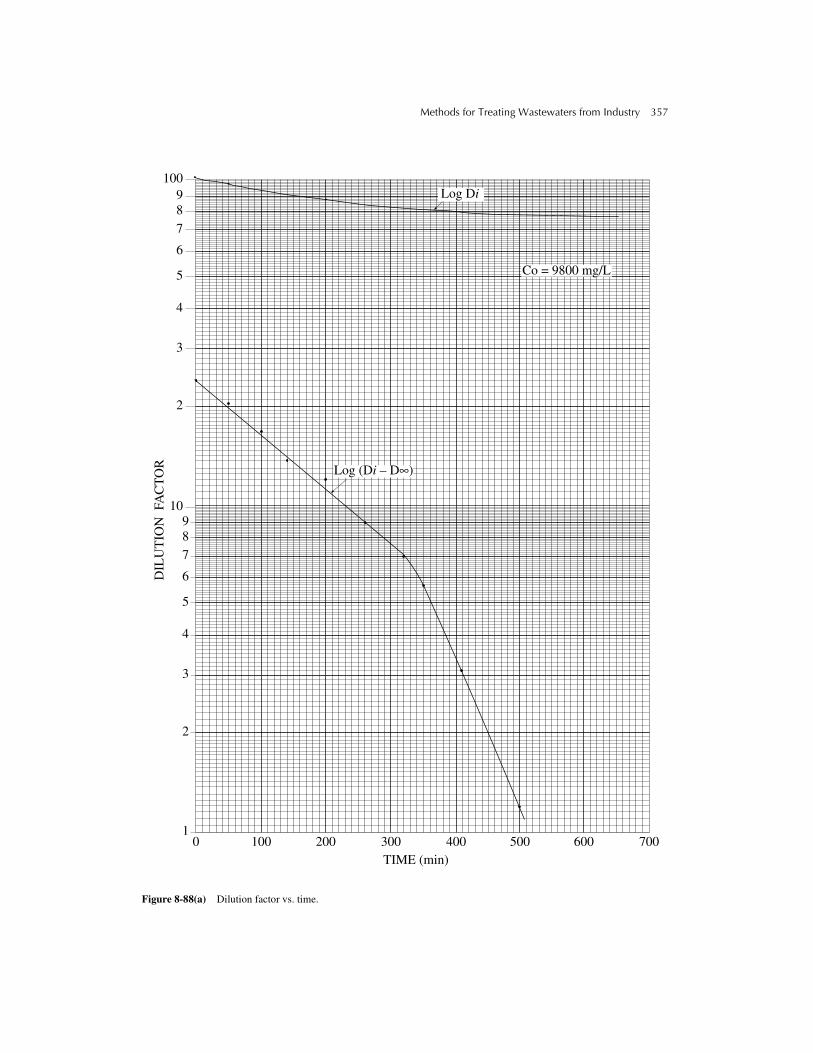
Methods for Treating Wastewaters from Industry 357
Figure 8-88(a) Dilution factor vs. time.
01
2
3
4
5
6
789
10
2
3
4
5
6
789
100
100 200 300 400 500 600 700
DIL
UT
ION
FA
CT
OR
TIME (min)
Log (Di – D∞)
Log Di
Co = 9800 mg/L

358 Industrial Waste Treatment Handbook
Figure 8-88(b) Dilution factor vs. time.
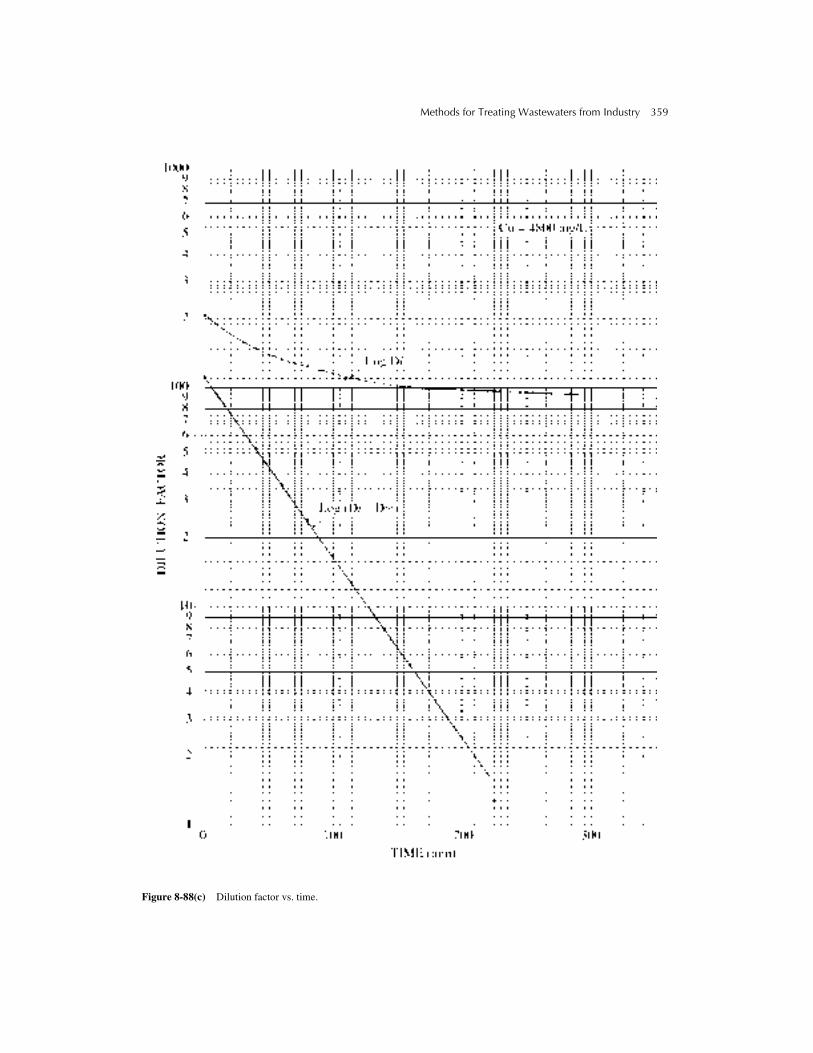
Methods for Treating Wastewaters from Industry 359
Figure 8-88(c) Dilution factor vs. time.
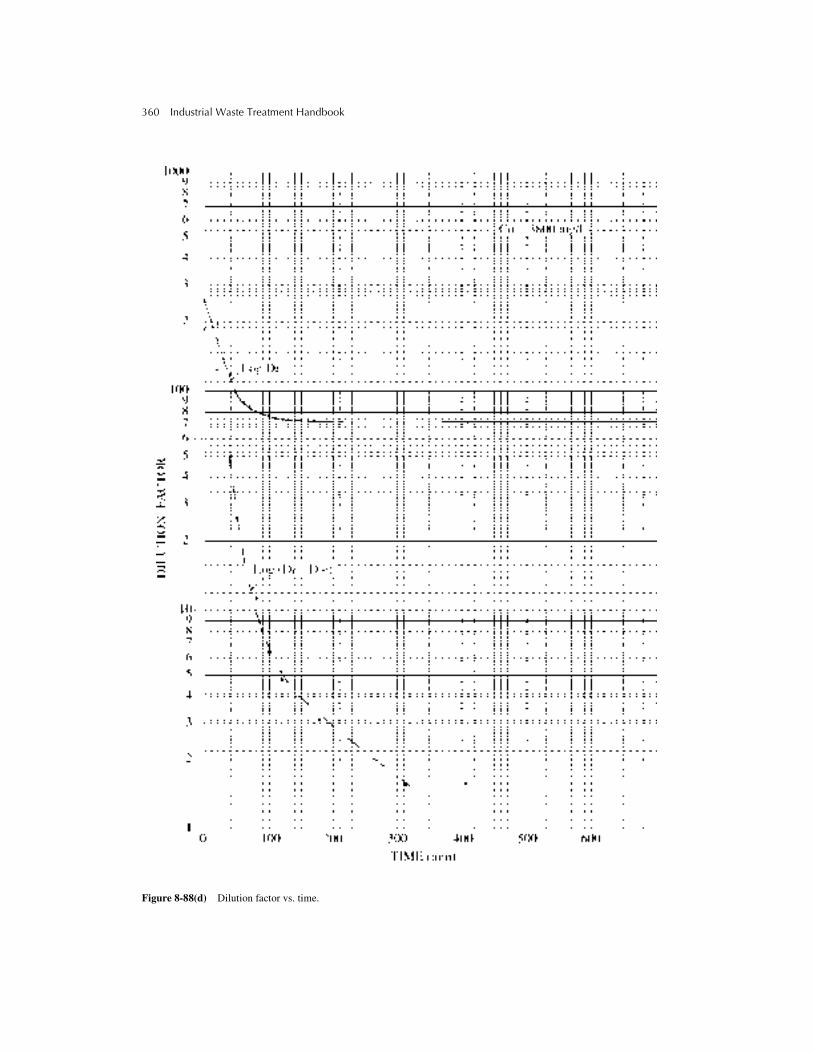
360 Industrial Waste Treatment Handbook
Figure 8-88(d) Dilution factor vs. time.

Methods for Treating Wastewaters from Industry 361
Figure 8-89 Ratio of underflow to feed solids concentration vs. mass loading.
From Figure 8-85 the maximum time for reach-ing a concentration of 10,000 mg/L (tu) is forthe data curve for the 6,600 mg/L test samplewith a value of approximately 440 minutes.
Figure 8-87 shows a maximum Unit Area ofapproximately 0.28 ft2/lb/day for the family ofcurves for the 6,600 mg/L test sample.
Solids loading to the thickener would be 60%of the 300 mg/L entering the clarifier = 180mg/L in 10 MGD = 15,200 lbs/day.
Minimum area for thickening = (15,200 lbs/day) (0.28 ft2/lb/day) = 4260 ft2
Sludge Depth (H) required for thickening iscalculated using equation 8-72.
From Figure 8-88(b), the value for k is theslope of the lower curve or 7.76 × 10⁻³, and,
using the upper curve, Du = 85 for tu = 440minutes, Dc = 118 for tc = 120
= 1.2 feet
Plate, Lamella, and Tube Settlers Examination of Figure 8-74 reveals that a par-ticle settling at terminal velocity, vs, in an idealsettling tank of hydraulic retention time, Q/V(where Q is the flow rate and V is the tank
H
15 200,1440
------------------ 440 120–( ) 11.35( )62.4
--------------------------81.2
61.91-------------+⎝ ⎠
⎛ ⎞
4260118 85–( ) 15 200,
1440------------------⎝ ⎠
⎛ ⎞
61.91 1.33( )7.76 103–( )
--------------------------------------------------------–
---------------------------------------------------------------------------------------------------=

362 Industrial Waste Treatment Handbook
Figure 8-90 Depth vs. concentration.

Methods for Treating Wastewaters from Industry 363
volume), will not become “removed,” until itreaches the end of the tank, if it starts at thesurface. Furthermore, the deeper the tank, thelonger the required HRT to remove the particle.There is a temptation, then, to imagine a veryshallow tank, in which particles would reachthe bottom very quickly, thus being removed ina very short amount of time and with relativelylittle cost (because of the small size of the clar-ifier). Common sense reveals, however, thatturbulence resulting from such a shallow flowpath would prevent effective settling (the clari-fiers would not be able to attain quiescentconditions). The theoretical implication stillremains, however, that the shallower the set-tling tank, the quicker the removal.
What, then, is the optimum depth for a clari-fier, given that, on the one hand, surface load-ing is the only parameter that affects removal inan ideal clarifier and, on the other hand, thathydraulic turbulence affects removal in a nega-tive way in a “real” clarifier?
Looking again at Figure 8-74, it can be seenthat, no matter what the depth of the ideal set-tling tank, removal (by virtue of having reachedthe “bottom”) of solids having settling veloci-ties much slower than vs could theoretically beachieved if a series of false bottoms wereplaced within the tank, similar to a stack oftrays. Figure 8-91 illustrates such a concept.
Although the theoretical validity of the con-cept illustrated in Figure 8-91 is indisputable,the actual occurrence of hydraulic turbulenceimposes limits on application. Several deviceshave been developed and are in wide-spread
use that are based on the theoretical advantageillustrated in Figure 8-91. The device illus-trated in Figure 8-91, known as a “plate settler”or a “lamella separator,” is an example.
Figure 8-92 shows a tank that contains a stackof flat plates that nearly fills the tank. The platesare inclined at an angle of 60º. The influent endof the tank is equipped with a device to distrib-ute incoming flow uniformly across the tank, sothat, to the extent possible, equal amounts ofraw wastewater are caused to proceed throughthe spaces between each of the plates.
It is a fundamental principle of hydraulicflow, in both theory and fact, that fluids flow-ing in contact with a solid surface establish avelocity gradient. The velocity of flow is verysmall close to the solid surfaces and increaseswith distance from solid surfaces. Within thespaces between the plates shown in Figure8-92, then, the velocity of flow from the influ-ent end of the tank to the effluent end is great-est near the midpoints between the plates and isvery small close to the plates. Therefore, if thevelocity of flow of wastewater flowing throughthe “plate settler” shown in Figure 8-92 is lessthan the settling velocity of some of the solidparticles contained in the wastewater, theseparticles will “settle.” As these particles settle,they quickly approach one of the plate surfaces,where the flow velocity steadily decreases.Eventually, the solid particles become veryclose to the plates, where the velocity of flow isalmost zero. These settled particles then slidedown the plates and into the sludge hopper, asillustrated in Figure 8-92.
Figure 8-91 Illustration of conceptual increase in removal efficiency by adding a series of false bottoms to an open, idealsettling tank.

364 Industrial Waste Treatment Handbook
Figure 8-92 Plate or Lamella separator. (Courtesy of Parkson Corporation.)
It is seen, then, that the treatment effective-ness of the simple, open clarifier can beimproved dramatically by adding a series of“false bottoms” that have the effect of greatlydecreasing the distance through which solidparticles must settle before they are “removed”from the bulk liquid. Practical problems suchas clogging of the spaces between the plates,the need for periodic cleaning before resuspen-sion of organic solids by the action of denitrifi-cation or other phenomena, distribution of theflow at the influent end of the tank, collectionof clarified flow at the effluent end, and the
cost of the plate system become the factors thatinfluence design. These practical consider-ations also influence the selection procedurebetween alternative types of false bottom sys-tems, or, indeed, whether it is more desirable touse a simple, open clarifier.
A great deal of experience has shown that,in general, plate settlers, or similar alterna-tives, are the clarifiers of choice for inorganicsolids such as those associated with metalsprecipitation. Plate settlers have not beenshown to be advantageous, however, fororganic solids such as activated sludge. For

Methods for Treating Wastewaters from Industry 365
metals precipitation, for instance, it has beenshown that the required HRT for satisfactoryremoval can be less for plate-type settlers thanfor open clarifiers by factors of six to eight.
Centrifugation Centrifuges, which are devices that amplify theforces at work in gravity separation, are of sev-eral different types. Centrifuges are used forseparation of grit and other relatively heavy sol-ids at the head end of wastewater treatmentfacilities, as well as for sludge thickening and/ordewatering at the “other end” of such facilities.
So-called swirl separators, an example ofwhich is illustrated in Figures 8-93(a)–(b), aredevices that are used to separate grit thatemploy relatively low centrifugal force. Thesource of energy for these devices is normally apump. The pump causes wastewater to flowthrough the swirl separator at a velocity suffi-cient to cause grit, or another high-specific-gravity material, to be thrown to the outside ofthe circular path within the separator (by cen-trifugal force). The solids are then collected atthe outside of the separator, while the degrittedliquid is collected at, or near, the center.
There are three basic types of centrifugesused for concentration of sludges: the solidbowl type, the basket type, and the disk-stacktype. The essential differences are in the methodby which separated solids are harvested. Figures8-94(a)–(c) present illustrations of the threetypes of sludge-concentrating centrifuges.
Centrifuges have also been used to a limitedextent for separation of lighter-than-water sub-stances such as oil. In these cases, the aqueousdischarge is collected at the opposite outletfrom that where solids having a specific gravitygreater than one are the target substances forseparation.
A solid bowl–type centrifuge is diagrammedin Figure 8-95. The horizontal cylindrical-coni-cal bowl rotates to cause solid particles to bethrown against its wall as they enter the bowlwith the liquid to be dewatered at the center ofthe cylinder. A helical scroll within the bowlrotates at a slightly slower rate than the bowlitself and operates in a manner similar to a
screw conveyor to scrape the solids along thewall of the bowl to the solids discharge area.Centrate (the liquid from which solids havebeen removed) is discharged at the oppositeend of the bowl.
The effectiveness of solids concentration issomewhat proportional to the speed of rotationof the bowl and inversely proportional, to a cer-tain degree, to the feed rate. In some instances,chemical conditioning of the feed enhancesoperational effectiveness. Various polymers, aswell as lime, ferric chloride, and other chemi-cal conditioning agents, have proven to be cost-effective performance enhancers in variousapplications. Variations in operating parame-ters of the solid bowl centrifuge can also affectperformance, such as scroll rotation rate andpool volume.
Figure 8-93(a) Swirl separator. (Courtesy of Smith &Loveless.)
Figure 8-93(b) Swirl separator. (Courtesy of Smith &Loveless.)
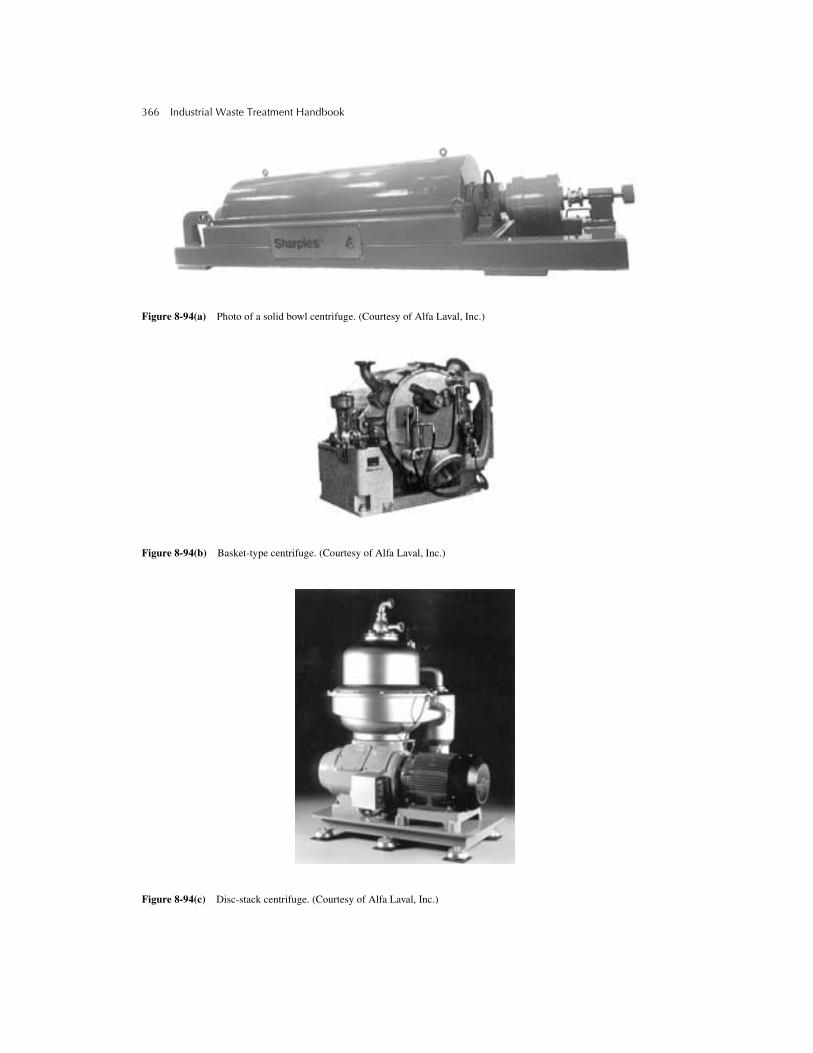
366 Industrial Waste Treatment Handbook
Figure 8-94(a) Photo of a solid bowl centrifuge. (Courtesy of Alfa Laval, Inc.)
Figure 8-94(b) Basket-type centrifuge. (Courtesy of Alfa Laval, Inc.)
Figure 8-94(c) Disc-stack centrifuge. (Courtesy of Alfa Laval, Inc.)

Methods for Treating Wastewaters from Industry 367
Figure 8-95 Diagram of a solid bowl centrifuge. (Courtesy of Alfa Laval, Inc.)
Figure 8-96 shows a diagram of a basket-type centrifuge. Here, feed (liquid plus thesolids to be removed) enters the basket atthe bottom. The basket rotates about its ver-tical axis, and solid particles are caused bycentrifugal force to be thrown against thesides of the basket. The basket gradually fillsup with solids, as liquid spills out over thetop of the basket. When the basket becomessufficiently full of solids, the feed is stopped,and a set of knives removes the solids fromthe basket. Machine variables that affect per-formance include basket spin rate, solids dis-charge interval, and skimmer nozzle dwelltime and travel rate. Performance is nor-mally inversely proportional, to some degree,to feed rate, and conditioning chemicalsoften are not used.
The disc-stack centrifuge, diagrammed inFigure 8-97, is composed of a series of conicaldisks and channels between the cones, whichrotate about a vertical axis. Feed enters the top,and solid particles are forced by centrifugalforce against the cones. Centrate is discharged
as shown in the diagram, and solids exit thebottoms of the conical discs to a compactionzone. A small fraction of the wastewater isused to flush out the compacted solids. Themoisture content of the dewatered solids is pro-portional to the feed rate. Normally, condition-ing chemicals are used to enhance operationalperformance.
Flotation
Gravity FlotationGravity flotation is used, sometimes in combi-nation with sedimentation and sometimesalone, to remove oils, greases, and other flota-bles such as solids that have a low specificweight. Various types of “skimmers” have beendeveloped to harvest floated materials, and thecollection device to which the skimmers trans-port these materials must be properly designed.Figures 8-98(a)–(f) are photographs of differ-ent types of gravity flotation and harvestingequipment.
368 Industrial Waste Treatment Handbook
Figure 8-96 Diagram of a basket-type centrifuge. (After EPA 625/1-74-006.)
Figure 8-97 Disc-stack-type centrifuge. (Courtesy of Alfa Laval, Inc.)

Methods for Treating Wastewaters from Industry 369
Dissolved Air FlotationDissolved air flotation (DAF) is a solids sepa-ration process, similar to plain sedimentation.The force that drives DAF is gravity, and theforce that retards the process is hydrody-namic drag. Dissolved air flotation involvesthe use of pressure to dissolve more air intowastewater than can be dissolved under nor-mal atmospheric pressure, then releasing thepressure. The “dissolved” air, now in a super-saturated state, comes out of solution, or“precipitates,” in the form of tiny bubbles. Asthese tiny bubbles form, they become attachedto solid particles within the wastewater, drivenby their hydrophobic nature. When sufficientair bubbles attach to a particle to make theconglomerate (particle plus air bubbles)lighter than water (specific gravity less thanone), the particle is carried to the watersurface.
A familiar example of this phenomenon is astraw in a freshly opened bottle of a carbonatedbeverage. Before the bottle is opened, its con-tents are under pressure, having been pressur-ized with carbon dioxide gas at the time ofbottling. When the cap is taken off, the pressureis released, and carbon dioxide precipitatesfrom solution in the form of small bubbles. Thebubbles attach to any solid surface, including astraw, if one has been placed in the bottle.Soon, the straw rises up in the bottle.
In a manner similar to the straw, solids hav-ing a specific gravity greater than one can becaused to rise to the surface of a volume ofwastewater. Solids having a specific gravityless than one can also be caused to rise to thesurface at a faster rate by using DAF than with-out it. Often, chemical coagulation of the solidscan significantly enhance the process, and insome cases, dissolved solids can be precipi-tated, chemically, then separated from the bulksolution by DAF.
“Dissolution” of Air in Water Examination of the molecular structures of
both oxygen and nitrogen reveals that neitherwould be expected to be polar, therefore, nei-ther would be expected to be soluble in water.
.. .. .. ..:O::O: :N::N:
.. .. .. ..
Molecular oxygen Molecular nitrogen
The question arises, then, as to how nonpolargases like oxygen and nitrogen can be dis-solved in water. The answer, of course, is thatthey cannot. Nonpolar gases are “driven” into agiven volume of water by the mechanism ofdiffusion. Molecules of nitrogen and oxygen inthe gaseous state create pressure as a result ofconstant motion of the molecules. The general-ized gas law:
(8-73)
where:
p = Pressure, psi
V = Volume, in3
n = Number of moles of gas in a given vol-ume of gas
R = Universal gas constant 0.082 liter atmo-spheres/mole/o Kelvin
T = Temperature, o Kelvin
rewritten as
(8-74)
states that the pressure exerted by a given num-ber of molecules of a gas is directlyproportional to the temperature and inverselyproportional to the size of the volume in whichthose molecules are confined.
Dalton’s law of partial pressures states fur-ther that, in a mixture of gases, each gas exertspressure independently of the others, and thepressure exerted by each individual gas,referred to as its “partial pressure,” is the sameas it would be if it were the only gas in theentire volume. The pressure exerted by themixture, therefore, is the sum of all the partialpressures. Conversely, the partial pressure ofany individual gas in a mixture, such as air, isequal to the pressure of the mixture multipliedby the fraction, by volume, of that gas in themixture.
pV nRT=
pnRT
V----------=
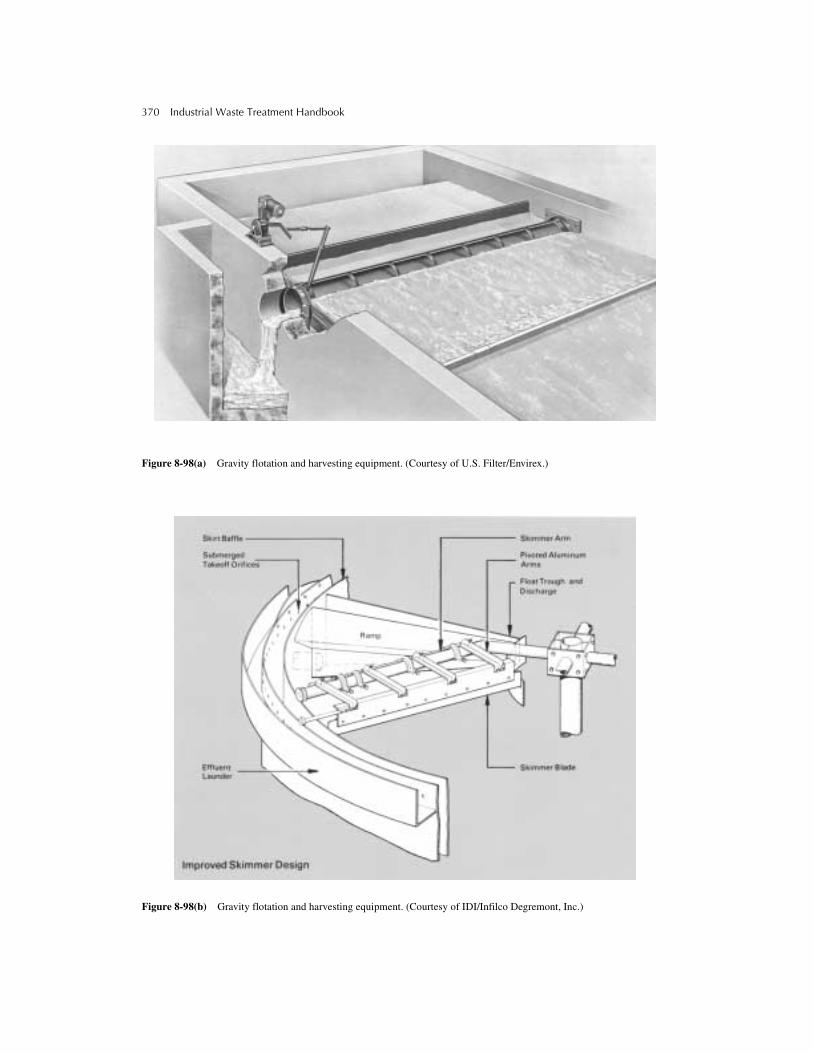
370 Industrial Waste Treatment Handbook
Figure 8-98(a) Gravity flotation and harvesting equipment. (Courtesy of U.S. Filter/Envirex.)
Figure 8-98(b) Gravity flotation and harvesting equipment. (Courtesy of IDI/Infilco Degremont, Inc.)

Methods for Treating Wastewaters from Industry 371
Figure 8-98(c) Gravity flotation and harvesting equipment. (Courtesy of KWI.)
Figure 8-98(d) Gravity flotation and harvesting equipment. (Courtesy of Oil Skimmers, Inc.)
Henry’s law, which describes, mathemati-cally, the “solubility,” in terms of weight perunit volume, of a gas in water, is written as:
(8-75)
where:
C = Concentration of gas “dissolved” inwater (mg/L)
H = Henry’s constant, dimensionless, specificfor a given gas
The consequence of this equation is that, byway of the process of diffusion, molecules ofany gas, in contact with a given volume of
water, will diffuse into that volume to anextent that is described by Henry’s Law, aslong as the quantity of dissolved gas is rela-tively small. For higher concentrations,Henry’s constant changes somewhat. Thisprinciple holds for any substance in the gas-eous state, including volatilized organics. Themolecules that are forced into the water bythis diffusion process exhibit properties thatare essentially identical to those that are trulydissolved. In conformance with the secondlaw of thermodynamics, they distribute them-selves uniformly throughout the liquid vol-ume (maximum disorganization), and they
C Hp=

372 Industrial Waste Treatment Handbook
will react with substances that are dissolved.An example is the reaction of molecular oxy-gen with ferrous ions. Unlike dissolved sub-stances, however, they will be replenishedfrom the gas phase with which they are incontact, up to the extent described by Henry’s
law, if they are depleted by way of reactionwith other substances, or by biological metab-olism. The difference between a substanceexisting in water solution as the result of dif-fusion and one that is truly dissolved can beillustrated by the following example.
Figure 8-98(e) Gravity flotation and harvesting equipment. (Courtesy of U.S. Filter/Envirex.)
Figure 8-98(f) Gravity flotation and harvesting equipment.
UNDERFLOW SCUMBAFFLE
ADJUSTABLEOVERFLOWWEIR PLATE
6"
SKIMMER FLIGHTS(QUANTITY VARIES)
SKIMMER FLIGHTSUPPORTS
12" STATICFREEBOARD
INLET MIXINGCHAMBER
RADIAL HEADER
INFLUENT DISTRIBUTIONBAFFLE
SCUM COLLECTIONTROUGH
3" NPT SCUMOUTLETCOLLECTION
2 1"8
6"45"

Methods for Treating Wastewaters from Industry 373
Consider a beaker of water in a closedspace—a small, airtight room, for instance. Anamount of sodium chloride is dissolved in thewater, and the water is saturated with oxygen;that is, it is in equilibrium with the air in theclosed space. Now, a container of sodiumchloride is opened, and at the same time, apressurized cylinder of oxygen is released.The concentration of sodium chloride will notchange, but, because the quantity of oxygen inthe air within the closed space increases (par-tial pressure of oxygen increases), the concen-tration of dissolved oxygen in the waterincreases. The oxygen molecules are not trulydissolved; that is, they are not held in solutionby the forces of solvation, or hydrogen bond-ing by the water molecules. Rather, they areforced into the volume of water by diffusion,which is to say, by the second law of thermo-dynamics. The molecules of gas are con-stantly passing through the water-air interfacein both directions. Those that are in the waterare constantly breaking through the surface toreturn to the gas phase, and they are continu-ally being replaced by diffusion from the airinto the water. An equilibrium concentrationbecomes established, described by Henry’slaw. All species of gas that happen to exist inthe “air” participate in this process: nitrogen,oxygen, water vapor, volatilized organics, orwhatever other gases are included in the givenvolume of air.
The concentration, in terms of mass of anyparticular gas that will be forced into the waterphase until equilibrium becomes established,depends on the temperature and the concentra-tion of dissolved substances such as salts andthe “partial pressure” of the gas in the gas phase.As the temperature of the water increases, therandom vibration activity, “Brownian motion,”of the water increases. This results in less roombetween water molecules for the molecules ofgas to “fit into.” The result is that the equilib-rium concentration of the gas decreases. This isopposite to the effect of temperature on dissolu-tion of truly soluble substances in water, orother liquids, where increasing temperatureresults in increasing solubility.
Some gasses are truly soluble in waterbecause their molecules are polar, and thesegases exhibit behavior of both solubility anddiffusivity. Carbon dioxide and hydrogensulfide are examples. As the temperatureof water increases, solubility increases, butdiffusivity decreases. Also, because each ofthese two gases exists in equilibrium withhydrogen ion when in water solution, the pH ofthe water medium has a dominant effect ontheir solubility, or rather, their equilibrium con-centration, in water.
In the previous example, where a beaker ofwater is in a closed space, if a flame burning inthe closed space depletes the oxygen in the air,oxygen will come out of the water solution. Ifall of the oxygen is removed from the air, theconcentration of “dissolved oxygen” in thebeaker of water will eventually go to zero (orclose to it), and the time of this occurrence willcoincide with the flame extinguishing becauseof lack of oxygen in the air.
Dissolved Air Flotation Equipment The dissolved air flotation (DAF) process
takes advantage of the principles described ear-lier. Figure 8-99 presents a diagram of a DAFsystem, complete with chemical coagulationand sludge handling equipment. As shown inFigure 8-99, raw (or pretreated) wastewaterreceives a dose of a chemical coagulant (metalsalt, for instance), then proceeds to a coagula-tion-flocculation tank. After coagulation of thetarget substances, the mixture is conveyedto the flotation tank, where it is released in thepresence of recycled effluent that has just beensaturated with air under several atmospheres ofpressure in the pressurization system shown.An anionic polymer (coagulant aid) is injectedinto the coagulated wastewater just as it entersthe flotation tank.
The recycled effluent is saturated with airunder pressure as follows: A suitable centrifu-gal pump forces a portion of the treated efflu-ent into a pressure-holding tank. A valve at theoutlet from the pressure-holding tank regu-lates the pressure in the tank, the flow ratethrough the tank, and the retention time in the

374 Industrial Waste Treatment Handbook
tank, simultaneously. An air compressor main-tains an appropriate flow of air into the pres-sure-holding tank. Under the pressure in thetank, air from the compressor is diffused intothe water to a concentration higher than its sat-uration value under normal atmospheric pres-sure. In other words, about 23 ppm of “air”(nitrogen plus oxygen) can be “dissolved” inwater under normal atmospheric pressure (14.7psig). At a pressure of six atmospheres, forinstance, (6 × 14.7 = about 90 psig), Henry’slaw would predict that about 6 × 23, or about130 ppm, of air can be diffused into the water.In practice, dissolution of air into the water inthe pressurized holding tank is less than 100%efficient, and a correction factor, f, which var-ies between 0.5 and 0.8, is used to calculate theactual concentration.
After being held in the pressure-holding tankin the presence of pressurized air, the recycledeffluent is released at the bottom of the flota-tion tank, in close proximity to where the coag-ulated wastewater is being released. Thepressure to which the recycled effluent is sub-jected has now been reduced to one atmo-sphere, plus the pressure caused by the depth ofwater in the flotation tank. Here, the “solubil-ity” of the air is less, by a factor of slightly lessthan the number of atmospheres of pressure in
the pressurization system, but the quantity ofwater available for the air to diffuse into hasincreased by a factor equal to the inverse of therecycle ratio.
Practically, however, the wastewater willalready be saturated with respect to nitrogenbut may have no oxygen because of biologicalactivity. Therefore, the “solubility” of air at thebottom of the flotation tank is about 25 ppm,and the excess air from the pressurized, recy-cled effluent precipitates from “solution.” Asthis air precipitates in the form of tiny, almostmicroscopic, bubbles, the bubbles attach to thecoagulated solids. The presence of the anionicpolymer (coagulant aid), plus the continuedaction of the coagulant, causes the building oflarger solid conglomerates, entrapping many ofthe adsorbed air bubbles. The net effect is thatthe solids are floated to the surface of the flota-tion tank, where they can be collected by somemeans, thus removed from the wastewater.
Some DAF systems do not have a pressur-ized recycle system, but rather, the entire for-ward flow on its way to the flotation tank ispressurized. This type of DAF is referred to as“direct pressurization” and is not widely usedfor treating industrial wastewaters because ofundesirable shearing of chemical flocs by thepump and valve.
Figure 8-99 Dissolved air flotation system.

Methods for Treating Wastewaters from Industry 375
Air-to-Solids Ratio One of the principle design parameters for a
DAF wastewater treatment system is the so-called air-to-solids ratio (A/S). The mass of airthat must be supplied per day by the compres-sor and air delivery system is calculated bymultiplying the mass of solids to be removedeach day by the numerical value of the A/S. Ifthe A/S is too low, there will not be sufficientflotation action within the treatment system. If,on the other hand, the A/S value is too high,there will be many more air bubbles than canattach to the solids. Many of the unattachedfine bubbles will coalesce; large bubbles willresult, causing turbulence in the flotation tank.Experience has shown that A/S values in therange 0.02 to 0.06 result in optimal flotationtreatment.
Calculations of Recycle Ratio and Quantity of AirThe quantity of air needed for a given indus-
trial waste treatment application can be calcu-lated directly from the A/S ratio, once its valuehas been determined by laboratory and pilotexperimentation:
(8-76)
Optimum Pressure for the Air-Dissolving System The optimum pressure for the air-dissolving
system is determined by balancing the cost foroperating the water-pressurizing pump and thecompressor against the capital costs for theindividual components of the system, whichinclude the pressurization tank. Generally, thehigher the pressure, the greater the cost forpower, but the smaller the recycle flow and,therefore, the smaller the size of the compo-nents. However, as shown by the equation forpump horsepower:
H.P.
(8-77)
where:
H.P. = Horsepower required to operate pump
Q = Rate of flow being pumped (cfs)
Γ = Specific weight of water (lb/ft3)
H = Pressure, or “head” against which thepump is pumping. In this case, Hequals the pressure of the pressuriza-tion tank, ft (of water).
The horsepower required for the pressuriza-tion pump increases directly with increasingpressure, and decreases with decreasing rate offlow. Therefore, there is a compensatingtradeoff. As the pressure is increased to dis-solve more air in a given flow rate of water, orto dissolve a given quantity of air in a smallerflow rate of water, power requirementincreases. Power requirement decreases, how-ever, as the rate of flow decreases as a result ofless water needed by the higher pressure. Thefact that higher pressure results in the need formore heavy-duty equipment, coupled with thefact that higher pressure requires more powerconsumption by the air compressor (the airrequirement is governed by the solids load,which is not related to the pressure), results inincreased costs for increasing pressure.
Because of these counteracting effects oncosts, it is not a simple matter to select an oper-ating pressure that minimizes overall costs. Inmost applications, operating pressures between60 and 120 psig have been used.
Design of the air-dissolving portion of aDAF treatment system includes the following:
1. Determination of the size, i.e., air flowrate, working pressure, and, consequently,the motor horsepower of the compressor.
2. Determination of the water flow rate, totaldynamic head, and, consequently, themotor horsepower of the recycle pump.
3. Determination of the size and pressure rat-ing of the pressure-holding tank.
4. Selection of the appropriate valve for con-trol of flow rate from the pressure-holdingtank as well as the pressure to bemaintained.
5. Selection of the appropriate sizes of pipingand materials of construction.
Weight of air lbs day⁄,lbs solids day⁄ ) A S⁄×(=
QΓH550
------------- pump efficiency×=

376 Industrial Waste Treatment Handbook
Competing considerations that concern theworking pressure for the pressurization air-dis-solving system are that the higher the pressure,the more air can be dissolved, but the higherthe horsepower required, and, therefore, thehigher the operating costs for the recycle pumpmotor and the compressor motor.
AdsorptionAdsorption can be defined as the accumulationof one substance on the surface of another. Thesubstance undergoing accumulation, and thusbeing adsorbed, is called the adsorbate, and thesubstance on which the accumulation is takingplace is called the adsorbent. The adsorbate canbe dissolved, in which case it is called the sol-ute, or it can be of the nature of suspendedsolids as in a colloidal suspension. Colloidalsuspensions of liquids or gases can also beadsorbed. The discussion presented hereaddresses substances such as ions or organiccompounds dissolved in water adsorbing ontosolid adsorbents. However, the principles holdfor solid, liquid, or gaseous adsorbates adsorb-ing onto solid, liquid, or gaseous adsorbents.
The mechanism of adsorption can be one ora combination of several phenomena, includingchemical complex formation at the surface ofthe adsorbent, electrical attraction (a phenome-non involved in almost all chemical mecha-nisms, including complex formation), andexclusion of the adsorbate from the bulk solu-tion, resulting from stronger intermolecularbonding between molecules of solvent (hydro-gen bonding in the case of water) than existedbetween molecules of solvent (water) and thesolute. As is almost always the case, the driv-ing force is explained by the second law ofthermodynamics. The sum total energy of allbonds is greater after adsorption has takenplace than before.
As a wastewater treatment process, adsorp-tion is of greatest use when the substance to beremoved is only sparingly soluble in water.Many organic substances have groups that ion-ize weakly, or have very few ionizable groupsper unit mass of substance. These groups formhydrogen bonds with water molecules that are
of sufficient strength to hold the organic mole-cules in solution, but a good adsorbent reversesthe solvation process because, as stated previ-ously, the sum total of all chemical bonds isgreater after adsorption than before.
The AdsorbentActivated carbon is the most common adsor-bent in use for industrial wastewater treatment.Other adsorbents include synthetic resins, acti-vated alumina, silica gel, fly ash, shreddedtires, molecular sieves, and sphagnum peat.Because adsorption is a surface phenomenon,a desirable characteristic of an adsorbent is ahigh surface-to-volume ratio. Surface-to-volumeratios are increased in two ways, by decreasingthe size of particles of adsorbent and by creatinga network of pores or “tunnels” within the parti-cles of adsorbent.
Activated carbon is manufactured by pyro-lyzing organic materials such as bones, coconutshells, or coal, then oxidizing residual hydro-carbons using air or steam. A granular materialthat has an intricate, interconnected network ofpores ranging in size from a few angstroms toseveral thousand angstroms in diameter results.The pores that are 10 to 1,000 angstroms indiameter are referred to as micropores and areresponsible for most of the adsorptive capabil-ity of the material. The larger pores are rela-tively unimportant in adsorptive treatmentcapability, but are important passagewaysthrough which ions and dissolved organics candiffuse to reach the innermost adsorptivesurfaces.
Most adsorbents have weak negative chargeson their surfaces; therefore, the pH of thewastewater being treated has an influence onthe adsorptive process because hydrogen ionsrepress the negative surface charges at lowerpH values. Also, at low pH conditions, dis-solved or suspended substances that tend tohave a negative surface charge increase inadsorption.
Adsorption EquilibriaWhen wastewater is successfully treated by
adsorption, the substances being removed
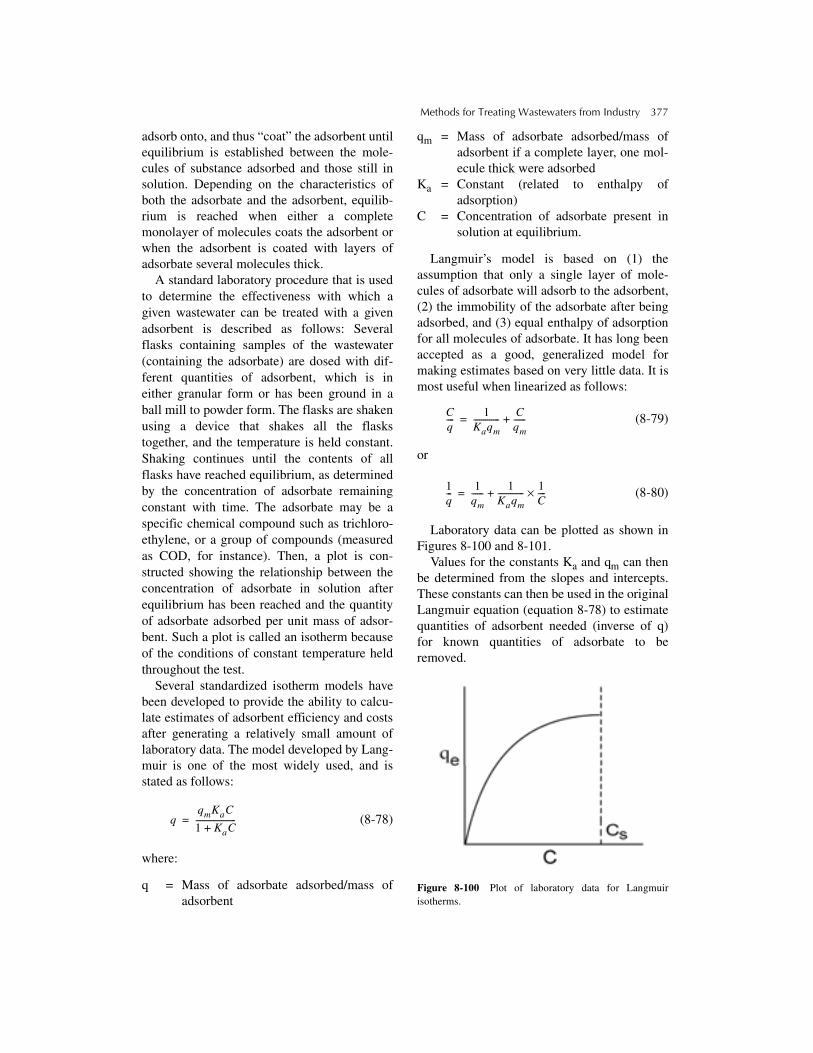
Methods for Treating Wastewaters from Industry 377
adsorb onto, and thus “coat” the adsorbent untilequilibrium is established between the mole-cules of substance adsorbed and those still insolution. Depending on the characteristics ofboth the adsorbate and the adsorbent, equilib-rium is reached when either a completemonolayer of molecules coats the adsorbent orwhen the adsorbent is coated with layers ofadsorbate several molecules thick.
A standard laboratory procedure that is usedto determine the effectiveness with which agiven wastewater can be treated with a givenadsorbent is described as follows: Severalflasks containing samples of the wastewater(containing the adsorbate) are dosed with dif-ferent quantities of adsorbent, which is ineither granular form or has been ground in aball mill to powder form. The flasks are shakenusing a device that shakes all the flaskstogether, and the temperature is held constant.Shaking continues until the contents of allflasks have reached equilibrium, as determinedby the concentration of adsorbate remainingconstant with time. The adsorbate may be aspecific chemical compound such as trichloro-ethylene, or a group of compounds (measuredas COD, for instance). Then, a plot is con-structed showing the relationship between theconcentration of adsorbate in solution afterequilibrium has been reached and the quantityof adsorbate adsorbed per unit mass of adsor-bent. Such a plot is called an isotherm becauseof the conditions of constant temperature heldthroughout the test.
Several standardized isotherm models havebeen developed to provide the ability to calcu-late estimates of adsorbent efficiency and costsafter generating a relatively small amount oflaboratory data. The model developed by Lang-muir is one of the most widely used, and isstated as follows:
(8-78)
where:
q = Mass of adsorbate adsorbed/mass ofadsorbent
qm = Mass of adsorbate adsorbed/mass ofadsorbent if a complete layer, one mol-ecule thick were adsorbed
Ka = Constant (related to enthalpy ofadsorption)
C = Concentration of adsorbate present insolution at equilibrium.
Langmuir’s model is based on (1) theassumption that only a single layer of mole-cules of adsorbate will adsorb to the adsorbent,(2) the immobility of the adsorbate after beingadsorbed, and (3) equal enthalpy of adsorptionfor all molecules of adsorbate. It has long beenaccepted as a good, generalized model formaking estimates based on very little data. It ismost useful when linearized as follows:
(8-79)
or
(8-80)
Laboratory data can be plotted as shown inFigures 8-100 and 8-101.
Values for the constants Ka and qm can thenbe determined from the slopes and intercepts.These constants can then be used in the originalLangmuir equation (equation 8-78) to estimatequantities of adsorbent needed (inverse of q)for known quantities of adsorbate to beremoved.
Figure 8-100 Plot of laboratory data for Langmuirisotherms.
qqmKaC
1 KaC+--------------------=
Cq----
1Kaqm-------------
Cqm------+=
1q---
1qm------
1Kaqm-------------
1C----×+=

378 Industrial Waste Treatment Handbook
If adsorption is known or suspected to takeplace in multiple layers, a more appropriatemodel is given by the Brunauer-Emmett-Teller(BET) equation, equation 8-81:
(8-81)
where:
Cs = Concentration of adsorbate in thewastewater when all layers of adsorbateon the adsorbent are saturated
Kb = Constant related to energy of adsorption
Figure 8-102 shows the approximate rela-tionship between the concentration of adsor-bate in the wastewater after adsorption hastaken place to the point of equilibrium and theamount adsorbed.
As shown in Figure 8-102, this relationshipis not linear; however, the BET model can berearranged to the following linear form:
(8-82)
and the plot of laboratory data shown in Figure8-103 can be used to determine the mathemati-cal value of the constant Kb.
Perhaps the most widely used model for esti-mating adsorbent efficiency and costs is anempirical model developed by Freundlich,stated as follows:
(8-83)
where:
Kf = Constant
n = Empirical constant greater than one
Freundlich’s model requires no assumptionsconcerning the number of layers of adsorbedmolecules, heats of adsorption, or other condi-tions. It is strictly a curve-fitting model andworks very well for many industrial wastewaterapplications.
Freundlich’s model is made linear by takingthe logarithm of both sides:
(8-84)
Plotting q versus C on log-log paper yields astraight line, the slope of which is the inverseof n, and the vertical intercept is the value ofKf, as shown in Figure 8-104.
In practice, candidate adsorbent materials(different types of activated carbon, forinstance) are evaluated for effectiveness intreating a given industrial wastewater by con-structing the Freundlich, Langmuir, or BETisotherms after obtaining the appropriate labo-ratory data. The isotherms provide a clear indi-cation as to which candidate adsorbent wouldbe most efficient in terms of pounds of adsor-bent required per pound of adsorbate removed,as well as provides an indication of the qualityof effluent achievable. Example 8-8 illustratesthis procedure.
Example 8-8:
Wastewater from a poultry-processing plantwas treated to the extent of greater than 99%removal of COD and TSS using chemicalcoagulation, dissolved air flotation, and sandfiltration. The question then arose about theeconomic feasibility of using activated carbonto further treat the water for (re)use in the plantas cooling water or for initial washdown duringdaily plant clean-up. Table 8-13 presents thedata that were obtained from the isotherm testsusing the adsorbate designated Carbon A.
The data shown in Table 8-13 were plottedon a log-log scale as shown in Figure 8-105.
Figure 8-105 shows that the slope of the iso-therm was about 0.899, and the vertical interceptwas about 0.007. Therefore, the value for the con-stant, n, in the Freundlich model is calculated as:
(8-85)
and the value for the constant Kf is calculatedas:
(8-86)
It is now possible to use the Freundlichmodel to calculate the quantity of Carbon Arequired to produce treated effluent of what-ever quality is deemed appropriate, balancingcost against effluent quality:
qqmKbC
CS C–( ) 1 Kb 1–( ) C CS⁄( )+[ ]----------------------------------------------------------------------------=
CCs C–( )q
------------------------1
Kbqm-------------
Kb 1–
Kbqm---------------
C{ }Cs{ }
----------+=
q1 n⁄Kf C----------=
qlog Kflog 1 n⁄( ) Clog×+=
1 n⁄ 0.899 n 1.112=;=
intercept Kflog 0.007 Kf 0.007=;log= =
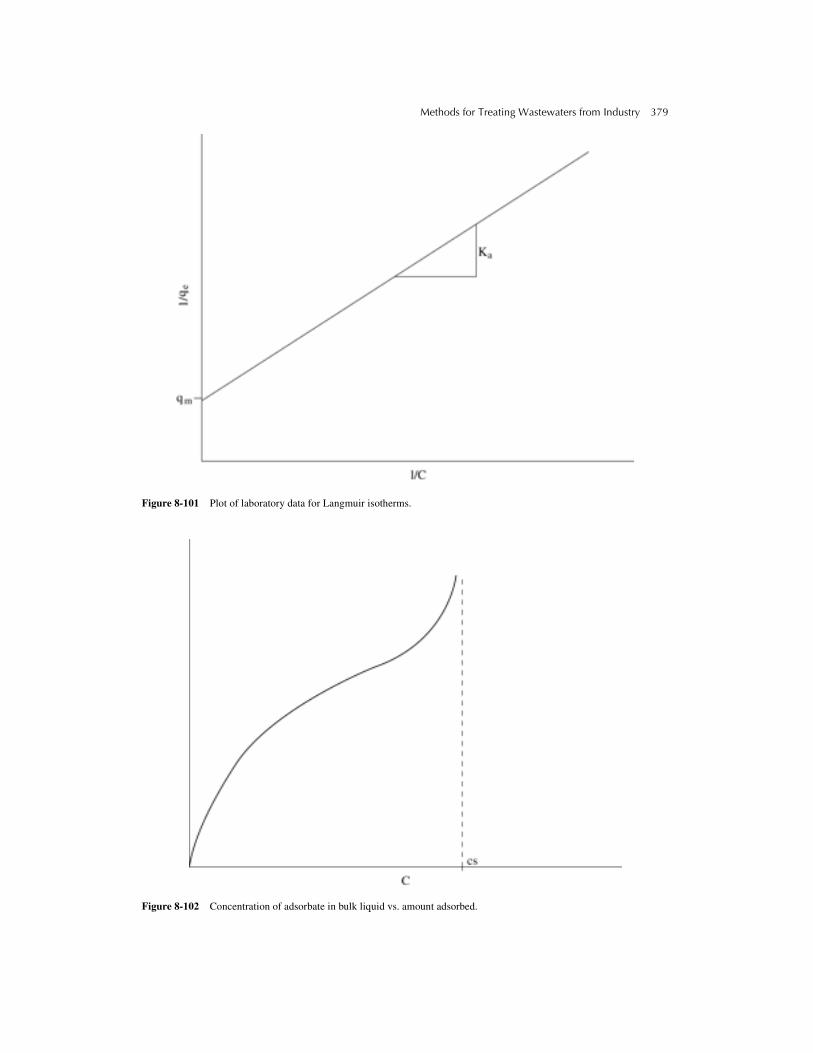
Methods for Treating Wastewaters from Industry 379
Figure 8-101 Plot of laboratory data for Langmuir isotherms.
Figure 8-102 Concentration of adsorbate in bulk liquid vs. amount adsorbed.

380 Industrial Waste Treatment Handbook
Figure 8-103 Plot of laboratory data for BET isotherms.
Figure 8-104 Log-log plot of q vs. C (Freundlich isotherm).
1/n
log
q
log C
logKf

Methods for Treating Wastewaters from Industry 381
For a desired effluent quality of TOC = 10 mg/L = C:
(8-87)
or, 1/0.06 = 18 pounds carbon adsorbentrequired for each pound of TOC removed fromthe sand filter effluent.
Evaluating Relative Effectiveness Among Different Carbon ProductsTwo characteristics of activated carbon can
be evaluated from the Freundlich isotherms.One is the relative capability for removingimpurities from the wastewater to a sufficientlylow level to satisfy requirements for reuse orfor discharge. The second characteristic is therelative efficiency of several different carbonproducts; that is, the quantity of activated car-bon required to remove a given quantity of pol-lutants, as illustrated in Figure 8-106.
Figure 8-106 shows Freundlich isothermsfor three different activated carbon productsplotted on the same graph. In such a compos-ite graph, the further to the right the iso-therm, the less efficient the activated carbonproduct, in terms of pounds of the carbon
product required to remove 1 pound of TOC.Figure 8-106 further shows that if a TOC con-centration of no more that 10 mg/L (forinstance) can be tolerated, Carbons A and Chave potential use, whereas Carbon B neednot be considered further.
As additional notes, it has been found that,in general, high-molecular-weight (greater than45) organics that are not readily biodegradabletend to be good candidates for removal byadsorption on activated carbon or other adsor-bates. Also, certain inorganics that are nothighly soluble in water (some heavy metals,reduced sulfur gases, and chlorine, are exam-ples) are good candidates for removal byadsorption.
Activated carbon can be very effective inremoving metal ions from wastewater by first,chelating the metal ions with an organicchelant such as citric acid or EDTA. When thechelated mixture is treated using activated car-bon, the organic chelant adsorbs to the carbon,removing the chelated metals along with it.
Ion ExchangeIon exchange is a physical treatment process inwhich ions dissolved in a liquid or gas inter-change with ions on a solid medium. The ionson the solid medium are associated with func-tional groups that are attached to the solidmedium, which is immersed in the liquid orgas.
Table 8-13 Data Obtained From Isotherm Tests — Carbon A
1n---
11.112-------------=
q Kf C=
q 0.007 10( )=
0.06 mgTOC=
adsorbed mg⁄ adsorbent
Flask No. Carbon dose (grams) TOC of effluent at equilib-rium (mg/L)
TOC on carbon (mg/mg Carbon)
1 3.2 2.2 18
2 1.8 7.6 0.028
3 1.3 20.1 0.038
4 0.92 22.3 0.052
5 0.55 28.1 0.076
6 0.41 30.2 0.096

382 Industrial Waste Treatment Handbook
Figure 8-105 Log-log plot of data from poultry processing wastewater.
Figure 8-106 Composite plot of isotherms of three different carbon products.

Methods for Treating Wastewaters from Industry 383
Typically, ions in dilute concentrationsreplace ions of like charge that are of lowervalence state, but ions in high concentrationreplace all other ions of like charge. Forinstance, calcium ions or ferric ions in diluteconcentrations in water or wastewater replacehydrogen or sodium ions on the ion exchangemedium. The divalent or trivalent ions movefrom the bulk solution to the surface of the ionexchange medium, where they replace ions oflesser valence state, which, in turn, pass intothe bulk solution. The ion exchange materialcan be solid or liquid, and the bulk solution canbe a liquid or a gas.
However, if a bulk solution has a high con-centration of ions of low valence state, and isbrought into contact with an ion exchangematerial having ions of higher valence state,the higher valence ions will be replaced by thelower valence state ions. For instance, if astrong solution of sodium chloride is broughtinto contact with an anion exchange materialthat has nitrate ions associated with its func-tional groups, the chloride ions will replace thenitrate ions.
In these examples, the ions that exchange arereferred to as mobile, and the functional groupsare referred to as fixed. Ion exchange materialsoccur extensively in nature; ion exchangematerials of high capacity can be manufac-tured. Clays are examples of naturally occur-ring ion exchange materials. Approximatelyone-tenth of a pound of calcium (expressed as
calcium carbonate), for instance, per cubic footof clay is a typical cation exchange capacity fora naturally occurring clay. So-called zeolitesare naturally occurring materials of muchhigher exchange capacity. About 1 pound ofcalcium per cubic foot of zeolite is a good aver-age value for this material. Synthetic ionexchange materials are produced that havecapacities of more than 10 pounds calcium percubic foot of exchange material.
Naturally occuring materials that have ionexchange capability include soils, lignin,humus, wool, and cellulose. The ion exchangecapacity of soils is used by land treatment sys-tems. Synthetic ion exchange resins of highcapacity are manufactured, typically, as illus-trated in Figure 8-107.
As shown in Figure 8-107, a “good” ionexchange material consists of a foundation of aninsoluble, organic, or inorganic three-dimen-sional matrix, having many attached functionalgroups. In the example shown in Figure 8-107,the three-dimensional matrix is formed by poly-merization, in three dimensions, of styrene anddivinylbenzene molecules. The functionalgroups are soluble ions that are able to attractions of opposite charge and are attached byreacting various chemicals with the basic matrixmaterial. In the example shown in Figure 8-107,the soluble ions are sulfonate ions, attached tothe three-dimensional matrix by reacting thematrix with sulfuric acid. The term “resin” isused for the foundation matrix material.
Figure 8-107 Typical process for manufacturing ion exchange resins.
CH = CH2
Styrene Divinylbenzene
H2SO4
CH = CH2 -CH - CH2 -CH - CH2 -CH - CH2
-CH - CH2-CH - CH2
SO3H SO3HSO3H CH2-CH - CH
SO3H SO3H SO3H
-CH - CH2 -CH - CH2 -
CH = CH3 -CH - CH2 -
-CH - CH2 -
+
-CH CH - CH2 -CH - CH2 -CH - CH2 -
-CH - CH2 -

384 Industrial Waste Treatment Handbook
Materials that exchange cations have acidifunctional groups such as the sulfonic group,R-SO3
−; carboxylic, R-COO−; phenolic, R-O−;or the phosphonic group, R-PO3H-. In eachcase the R represents the foundation matrix.Materials that exchange anions have the pri-mary amine group, R-NH+; the secondaryamine group, R-R’N+; or the quarterinaryamine group, R-R’3N+. The tertiary aminegroup can also be used. Cation exchange resinshaving a high degree of ionization are referredto as “strongly acidic,” and those having a lowdegree of ionization are called “weakly acidicexchangers.” Strongly basic and weakly basicanion exchangers are named in the same way.
Strongly acidic or strongly basic ionexchangers normally have greater attraction forthe target ions and are, therefore, more efficientin terms of effluent quality for a given waste-water loading rate, than are weakly acidic orweakly basic ion exchangers. The stronglyacidic or basic exchangers, however, requiremore regenerant than do the weakly ionizedexchangers. In all cases, exchange capacity, interms of mass of ions exchanged per mass ofexchange material, is determined by the num-ber of functional groups per unit mass of thematerial.
Higher numbers of functional groups perunit mass of material are made possible byhigher surface-to-volume ratios for the matrixmaterial. As with all sorption materials, highersurface-to-volume ratios result from the exist-ence of pores throughout the basic material.However, when compared to simple exchangeat the outer surface of a bead of ion exchangematerial, the ion exchange process is slowedsomewhat when ions must diffuse into and outof pores.
The density of cross-linking within the lat-ticework, or matrix, of the exchange material,is what governs the number and size of pores,and, consequently, has a strong influence onexchange capacity. Greater cross-linking pro-duces a stronger, more resilient resin; however,if the degree of cross-linking is too high, poreswill be too small. Larger ions will be physi-cally blocked from entering or moving throughthem.
Mechanisms of Ion ExchangeThe ion exchange process takes place as illus-trated in Figures 8-108(a)–(b).
Figure 8-109(a) shows a cross section of abead of ion exchange material immersed inwastewater containing zinc ions. The func-tional groups (sulfonic groups) are associatedwith hydrogen ions at the start of the exchangeprocess. There is a strong gradient of concen-tration of zinc ions between the bulk solutionand the interior of the pores, which are filledwith water. There is also a strong gradient ofconcentration of hydrogen ions between thesurface of the exchange resin throughout itsporous structure and the water within thepores. Because of this, hydrogen ions have astrong tendency to leave the functional groupsand diffuse throughout the pores, but the stron-ger tendency to maintain electrical neutralityprevents this from taking place. However, asthe zinc ions are driven into the interior of thepores by molecular diffusion, because of theirconcentration gradient (Figure 8-109(b)), theyare available to interchange with the hydrogenions (Figure 8-109(c)). Thus, the force tendingto distribute hydrogen and zinc ions uniformlythroughout the aqueous system (entropy) is sat-isfied, and the tendency to maintain electricalneutrality is also satisfied (Figure 8-109(d)).The tendency to maintain electrical neutralityresults in stoichiometric exchange (i.e., onedivalent ion exchanges with two monovalentions, etc.).
Kinetics of Ion ExchangeAlthough the description given earlier of theexample illustrated in Figures 8-109(a) – (d) isuseful, there is more to the overall ionexchange process. In general, the rate-control-ling process is either the rate of diffusion ofions through the film (the region of water mol-ecules surrounding the ion exchange resinmaterial), or it is the rate of diffusion of theinterchanging ions within the pores. The firstof these processes is called film diffusion, andthe second is termed pore diffusion. If theexchange treatment process is of the batchtype, then higher rates of stirring minimize the

Methods for Treating Wastewaters from Industry 385
retarding effects of film diffusion. In a continu-ous flow column system, higher flow ratesminimize these effects. Larger pores can mini-mize the retarding effects of pore diffusion.
Ion SelectivityIon exchange materials that are selective forspecific ions exist. For instance, Gottlieb hasreported on resins that have a high selectivity fornitrate ions. However, for most ion exchangematerials, a common selectivity sequence isbased on fundamental chemical properties and/or characteristics.
In general, the smaller the mobile ion for agiven charge (valence state), the more stronglyattracted, and thus selective, it is toward a givenion exchange material. Also, in general, thelower the atomic weight of an ion, the smallerits size; however, ions are dissolved in water asa result of water molecules surrounding theion, attracted by electrolytic forces, and held byhydrogen bonding, as described in Chapter 2.The “solvated” ion (ion plus attached layers ofwater molecules) constitutes the mobile unit.Because ions of higher atomic weight hold sol-vated water layers more tightly than do ions oflower atomic weight, the heavier ions make upmobile units that are of smaller radius than ionsof lower atomic weight. The end result is that,
in general, the higher the molecular weight fora given ionic charge, the more highly selectivemost ion exchange materials are for that ion.Monovalent cations, consequently, exhibitselectivity as follows:
Ag+ > Cs+ > Rb+ > K+ > Na+ > Li+
For divalent cations, the order of selectivity is:
Ba++ > Sr++ > Ca++ > Mg++ > Be++
and for monovalent anions the order of selec-tivity is:
CNS− > C104− > I- > N03
− > Br− > CN− >
HS04− > N02
− > Cl− > HC03− > CH3COO− >
OH− > F−
Application of Ion Exchange to Industrial Wastewater TreatmentIon exchange can be used to remove undesirableions from industrial wastewaters as a final, ortertiary, treatment step, as treatment for isolatedprocess streams as part of a waste minimizationprogram, or as a polishing step before recycleand reuse of process water or wastewater. Ionexchange can also be used to recover valuablemetals or other exchangable substances.
Figure 8-108 Schematic diagrams of a cation exchange resin framework with fixed exchange sites before and after anexchange reaction. (a) Initial state before exchange reaction with cation, B
+; (b) equilibrium state after exchange reaction
with cation, B+
.
B+ –
B+ –
B+ –
B+ –
B+ –
–B+
–B+
–B+
A+A+
A+A+ A+
A+
A+ A+A+A+A+
A+A+ A+
A+ A+
A+–
–
B+
B+
–– –––– ––
–– ––––
––
––––––
––––
PoreSpaces
Resin–PhaseIons
(A) Initial State Prior to ExchangeReaction with Cation B+
(B) Equilibrium State After ExchangeReaction With Cation B+
–A+
–A+
–A+
–A+–A+
–A+
–
A+
–A+
–B+
–B+
B+
B+
B+
B+
B+
B+
B+B+
A+
A+
A+A+
A+ A+
A+ A+
ResinLattice
Solution–PhaseIons
–– ––––
––

386 Industrial Waste Treatment Handbook
Figure 8-109 Ion exchange process.
As a process, ion exchange can be operatedin either the batch mode or the continuous flowmode. In the batch mode, a container of fluid tobe treated is dosed, then mixed with an appro-priate quantity of ion exchange “beads.” Beadsof 2–4 mm diameter are the physical form inwhich ion exchange resins are normally used.After the desired amount of exchange of ionshas taken place, the beads of resin are sepa-rated from the treated fluid by sedimentation,filtration, or another solids separation process.The exchange resin is then rinsed and“recharged” with an appropriate solution ofacid, base, or salt.
Far more widely used than the batch processis the continuous flow ion exchange process,illustrated in Figure 8-110.
As shown in Figure 8-110, continuous flowion exchange is carried out by passing the fluidto be treated through one or more cylindricalcontainers (referred to as “columns”) packedwith exchange resin beads, 2 to 8 feet, or more,in depth. The resin is first “charged” with anappropriate solution (as an example, 5% to20% sulfuric acid could be used to charge astrong acid cation exchange resin). Whenessentially all of the functional groups havecharging ions associated with them, the charg-ing cycle is stopped, and the material is rinsedwith water of very low ion content. Then, theremoval cycle is initiated by passing 2 to 5gpm/ft3 (gpm of wastewater per ft3 of ionexchange resin) through the bed. During thiscycle, the target ions diffuse into the pores of

Methods for Treating Wastewaters from Industry 387
the beads of resin and replace the charging ionson the functional groups. The replaced charg-ing ions diffuse out through the pores and intothe bulk solution, then exit the column, as awaste in its own right that must be managed.
As wastewater passes through the column,most of the exchange activity takes place in azone referred to as an “active front,” or “zoneof active exchange.” As resin within the frontbecomes saturated with target ions, the frontprogresses from the top to the bottom of thebed. This active front characterizes the continu-ous flow exchange process. Because the resinahead of the active front is fully charged, thereis always a concentration gradient in terms ofthe target ions, enabling maximum removal.Batch treatment, on the other hand, is limitedby the equilibrium phenomena between theexchange resin and the bulk solution.
It is important to note that maximumremoval is not necessarily synonymous withcomplete removal. In practice, completeremoval of target ions usually occurs during theinitial portion of the treatment phase. How longthis complete removal lasts depends on thehydraulic loading rate of the exchange columnsas well as on the strength of attraction betweenthe exchange sites and the target ions. Sooneror later, target ions begin to bleed through andappear in the effluent (referred to as “break-through”) until, at some point, the effluentbecomes unacceptable. At this point, the treat-ment run is stopped, and the exchange resin isbackwashed with water, to remove debris andto regrade the resin.
If both cations and anions are to be removed,the treatment train is set up as shown in Figure8-111, with the cation exchangers precedingthe anion exchangers. Otherwise, metal cationsthat might appear during incomplete removalwould precipitate with hydroxide ions withinthe anion exchanger and cause fouling.
A familiar example of cation-anion removalis the so-called demineralization of water. Inthis process, the cation exchanger is chargedwith hydrogen ions and is said to be on the acidcycle, or on the hydrogen cycle. The anionexchanger is charged by passing sodium orpotassium hydroxide solution through it, and is
said to be on the hydroxide cycle. Cations(metals, calcium, etc.) are exchanged forhydrogen ions, which then react with hydrox-ide ions exchanged for anions (sulfate, chlo-ride, etc.) to form water, the only intendedsubstance in the effluent from the anionexchanger.
In many cases, a mixed bed process, inwhich the cation and anion exchange resins aremixed and packed into a single column isadvantageous. The two resins must be sepa-rated, however, before recharging, then mixedagain for the next ion exchange cycle.
Often, ions that have just been exchangedare soon replaced by ions for which theexchange material is more highly selective.This process results in the less stronglyselected ions being pushed along at the front ofthe zone of active exchange. When break-through occurs, the effluent is enriched in theless strongly selected ions.
Practical limitations of the ion exchange pro-cess include the following:
1. The fluid to be treated must be reasonablyfree of undissolved solids. The economicsof ion exchange are such that it is costeffective to install and operate solidsremoval facilities before the process, ratherthan lose capacity because of fouling.
2. Corrosion-resistant materials of construc-tion are required for the columncontainers, pumps, and piping.
3. Disposal of spent regenerant (which con-tains the target ions that have been removed)and rinse waters may pose an expensiveproblem, if they cannot be discharged to themunicipal sewer or to the industry’s mainwastewater treatment system.
Significant advantages of ion exchange as aprocess, compared to chemical precipitation,include the following:
1. No significant sludge disposal problem.
2. No chemical feeders, mixers, etc., otherthan what is required to make up and feedregenerant.
3. The systems are simple to operate and donot require much attention.
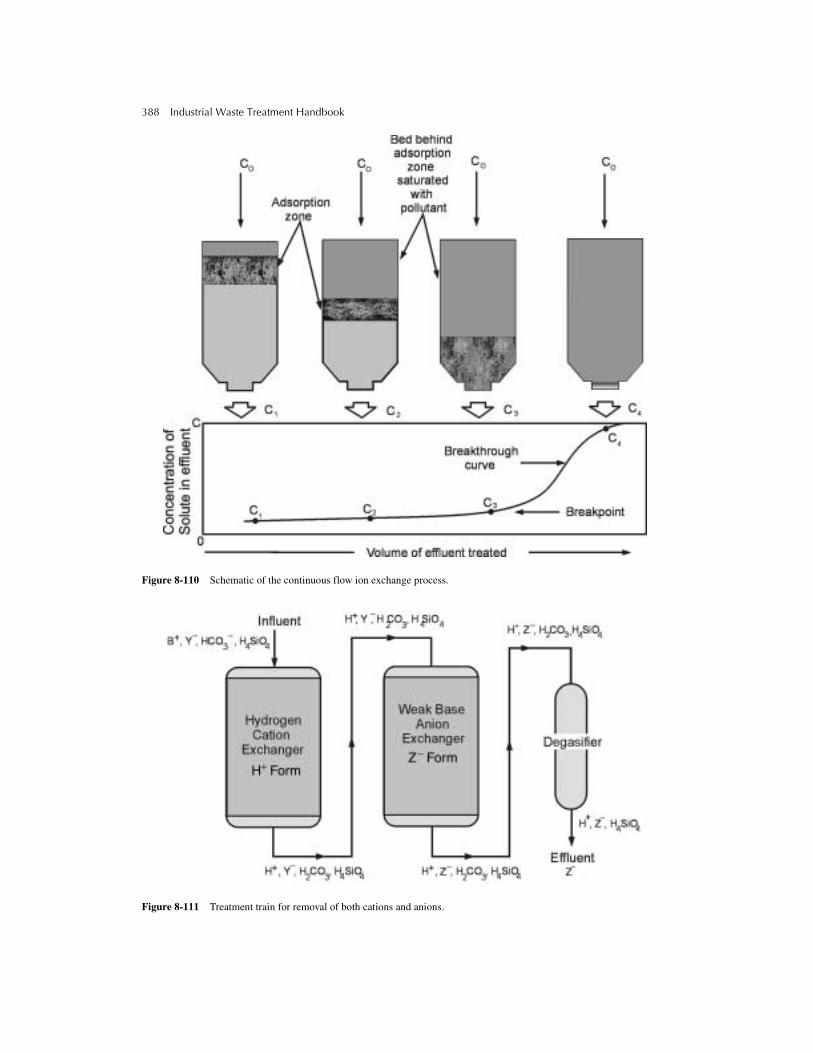
388 Industrial Waste Treatment Handbook
Figure 8-110 Schematic of the continuous flow ion exchange process.
Figure 8-111 Treatment train for removal of both cations and anions.

Methods for Treating Wastewaters from Industry 389
Design Criteria Design criteria, including brand and type ofexchange resins, volumes of resins, treatmenttrain configuration, charging substances, andhydraulic loading rates, are normally generatedin the laboratory. The laboratory bench scaleset-up shown in Figure 1-3(b) is typical ofthose used. Also, it is sometimes cost effectiveto perform a series of batch studies, whereinvarying quantities of a fully charged exchangeresin are placed into Erlenmeyer flasks con-taining the liquid to be treated, then mixed in astandardized manner. Plots are then made inthe same manner as they are made for carbonadsorption isotherms. Although these plotsmay not be able to be used exactly as adsorp-tion isotherms are used, they show importanttrends needed in the design process.
Removal of Specific Organic SubstancesIn general, ion exchange is useful for removinginorganic substances, but not organic sub-stances, and the reverse is normally the casefor activated carbon. However, activated carbon
can be very effective in removing metal ionsfrom wastewater, by simply chelating the met-als with an organic chelant, such as EDTA, andcertain organics can be removed by ion-exchange-type resins manufactured for thatspecific purpose. So-called macroreticular res-ins are available for use in removing specificnonpolar organic materials. Passing a liquidthat is a solvent for the target substance regen-erates these resins.
StrippingStripping is a physical treatment technol-
ogy, in the sense that no chemical reactionsare involved. Stripping is a method of movingone or more chemical substances from onemedium, either liquid or gas, to another, alsoeither liquid or gas, but usually the opposite ofthe first medium. That is, if the first mediumis liquid, the second is gas, and vice versa. Anexample of stripping as a treatment technol-ogy is the stripping of acetone from waterwith air, as described following and illus-trated in Figure 8-112.
Figure 8-112 Illustration of stripping as a waste treatment technology. (a) Air bubble stripping molecules of TCE as itrises through the TCE-bearing water. (b) TCE being stripped out of TCE-bearing water cascading over packing.
AIR
TCE TCE
TCE
H2O
TCE
AirFlow

390 Industrial Waste Treatment Handbook
Acetone is highly soluble in water but can beremoved from water solution by bubblingair through an acetone-water mixture, or bycausing droplets of the liquid mixture to passthrough the air, which takes place duringmechanical aeration.
The mechanism of removal is accounted forby a combination of Henry’s law of solubilityand Dalton’s law of partial pressures. Acetoneis volatile, compared to water; therefore, mole-cules of acetone pass from a container of themixture through the acetone-water surface intothe air until the partial pressure of acetone inthe air is equal to the vapor pressure of the ace-tone. If the container is covered, and there isenough acetone in the mixture, equilibriumwill be reached, and the concentration of ace-tone in the mixture will then remain constant.If the vessel is not covered, equilibrium willnever be reached. This fact alone will result inall of the acetone eventually being removedfrom the water mixture, given enough time.However, because of the length of timerequired, this arrangement hardly qualifies as awastewater treatment method. The process canbe greatly accelerated by greatly increasing thesurface area of the acetone-water mixture. Thiscan easily be accomplished by introducing ahost of air bubbles to the bulk volume of theacetone-water mixture, or by converting thebulk volume of the mixture to a host of tinydroplets.
Either way, the surface area of the acetone-water mixture will be greatly increased, mole-cules of acetone will pass from the mixture,through the surface films of either the air bub-bles or the liquid droplets, into the air phase, inan attempt to raise the partial pressure of ace-tone in the air phase to a value equal to thevapor pressure of acetone (at the prevailingtemperature). The result will be essentiallycomplete removal of the acetone from thewater.
In the case of volatile substances, which aretoxic or otherwise objectionable, they must becontained after stripping and subjected toappropriate reuse or final disposal. In manycases, activated carbon has been used to cap-ture organic substances that have been removed
from aqueous solution (polluted groundwater,for instance). In other cases, stripped organicshave been disposed of directly, by incinerationusing a flame in a conduit leading from theenclosed stripping reactor to the atmosphere.
ScrubbingScrubbing, like stripping, is a physical treat-
ment technology because no chemical reac-tions are involved. Also like stripping, itsmechanism is accounted for by a combinationof Henry’s law of gas solubility and Dalton’slaw of partial pressures. Usually, scrubbing isused to remove one or more target gases from astream of mixed gases, whereas stripping isused to remove one or more substances thathave a higher vapor pressure than water from awastewater stream.
An example of scrubbing as a treatmentmethod is that of removing hydrogen sulfidefrom air using chlorine in a water solution ofhigh pH. Figure 8-113 shows a stream of wasteair being passed through a “scrubber.” Thescrubber resembles a discharge stack and oper-ates as follows: A fan draws the air streamthrough the duct work to the scrubber, forces itup through the scrubbing apparatus, then intothe atmosphere. The scrubbing apparatus con-sists of two parts. The first is a chamber filledwith “telerets,” known as the “packing,” whichare solid objects having a high surface-to-vol-ume ratio. The second part is a system for cir-culating a solution of dissolved chlorine plusdissolved sodium or potassium hydroxide (inwater) through the scrubbing chamber bypumping from the reservoir through spray noz-zles down onto the telerets. The caustic chlo-rine solution flows over the surface of thepacking, where it contacts the air to be treated.During this contact period, the hydrogen sul-fide gas dissolves in the water, where it existsin an equilibrium according to the following:
(8-88)
because the solution is of a high pH, OH− ions“remove” almost all of the H+ ions:
(8-89)
H2S HS–
H+
+⇔
H+
OH–
+ H2O→

Methods for Treating Wastewaters from Industry 391
Figure 8-113 Illustration of the air “scrubbing” process.
Causing the equilibrium (equation (8-88) todisplace to the right. In so doing, essentially allof the hydrogen sulfide that was dissolved outof the stream of contaminated air exists as dis-solved sulfide ion, which reacts with dissolvedchlorine as follows:
(8-90)
Thus, hydrogen sulfide is “scrubbed” from theair and oxidized to soluble, nonodorous sulfateion. Of course, it can be reduced back to the sul-fide state and come out of solution as hydrogensulfide under favorable conditions of neutral tolow pH. Therefore, it is necessary to dispose ofthe waste scrubber solution in an appropriatemanner. In many applications, the “spent” scrub-ber solution is simply discharged to the industrialwastewater sewer, after which it is treated in theindustry’s wastewater treatment system.
HS2 4Cl2 4H2O+ + →
SO4=
9H+
8Cl–
+ +

392 Industrial Waste Treatment Handbook
Other Wastewater Treatment Methods
Land ApplicationThere are several versions of land applicationas a wastewater treatment method, includingspray irrigation, wetlands treatment, overlandflow, hyponics, and a relatively new, propri-etary process called “snowfluent,” in whichpretreated wastewater is made into snow by useof the same equipment used at ski areas. In allland application systems, the treatment mecha-nisms include evaporation, evapotranspiration,microbiological metabolism, adsorption, anddirect plant uptake. Land application systemsalso rely on the groundwater for final disposalof the water, after treatment has taken place.Therefore, land application is appropriate foruse with only those wastewaters having all bio-degradable organics. Bacteria and othermicroorganisms living in the soil use the organ-ics as food for energy and reproduction. To thisextent, a land treatment site is regenerative andcan be used for many years, with appropriaterest periods. To the extent that some substancesare removed by adsorption to soil particles, asis the case for phosphorus, a land applicationsite has a limited life.
Land application systems are subject to limi-tations, some of which are as follows:
1. Land application systems must not be usedif it is unacceptable, or even undesirable,for the wastewater, raw or treated, to enterthe groundwater. The groundwater is theultimate disposal destination of all thewastewater that is not evaporated, tran-spired, or finds its way via overland flowto a surface water body (a form of systemfailure).
2. The hydraulic application rate must bemore than the evapotranspiration rate. Oth-erwise, salts will be left in the soil ratherthan washed down into the groundwater.The consequence will be plugged soil, i.e.,a failed wastewater treatment system.
3. There are many laws and regulations gov-erning rates of application. Factors thatmust be considered include:
a. The hydraulic conductivity of the soil b. The rates of evaporation and transpira-
tion in the geographical area c. The allowable nitrogen loading in the
soil d. The type of cover crop used and
whether or not it is to be harvested on aregular basis (subnote: There MUST be a cover crop)
e. The substances in the wastewater
With respect to allowable application rates,each state has its own regulations. Typically,hydraulic application rates are limited to 5,000 to10,000 GPD/acre (1/4 to 1/2 inch per day). Nitro-gen loading rates are typically limited to 400 lb/acre/yr if the cover crop is harvested, or to 200 lb/acre/yr if the cover crop is not harvested.
Spray IrrigationSpray irrigation sites are used in rural areas forfood-processing wastewaters that are generatedon a seasonal basis, as well as for many otherindustrial wastewaters that contain no nonbio-degradable substances. In arid regions, thewastewater treatment process also supplies thewater needs of appropriate crops. In coldregions, sufficient storage must be providedduring the nongrowing season.
Design criteria for spray irrigation systemsinclude wastewater application rate, distribu-tion system pipe sizing, and storage facilitysizing.
Wastewater Application Rate The water-balance equation, equation 8-91,is used to determine the acceptable rate ofapplication of wastewater, based on soilhydraulic conductivity considerations. In manycases, one of the substances contained in thewastewater—nitrogen, for instance—mightgovern the rate of wastewater application. Thewater balance equation is stated as:
(8-91)
where:
Lw(p)= Wastewater application rate, in/month
Lw p( ) ET p– Wp+=
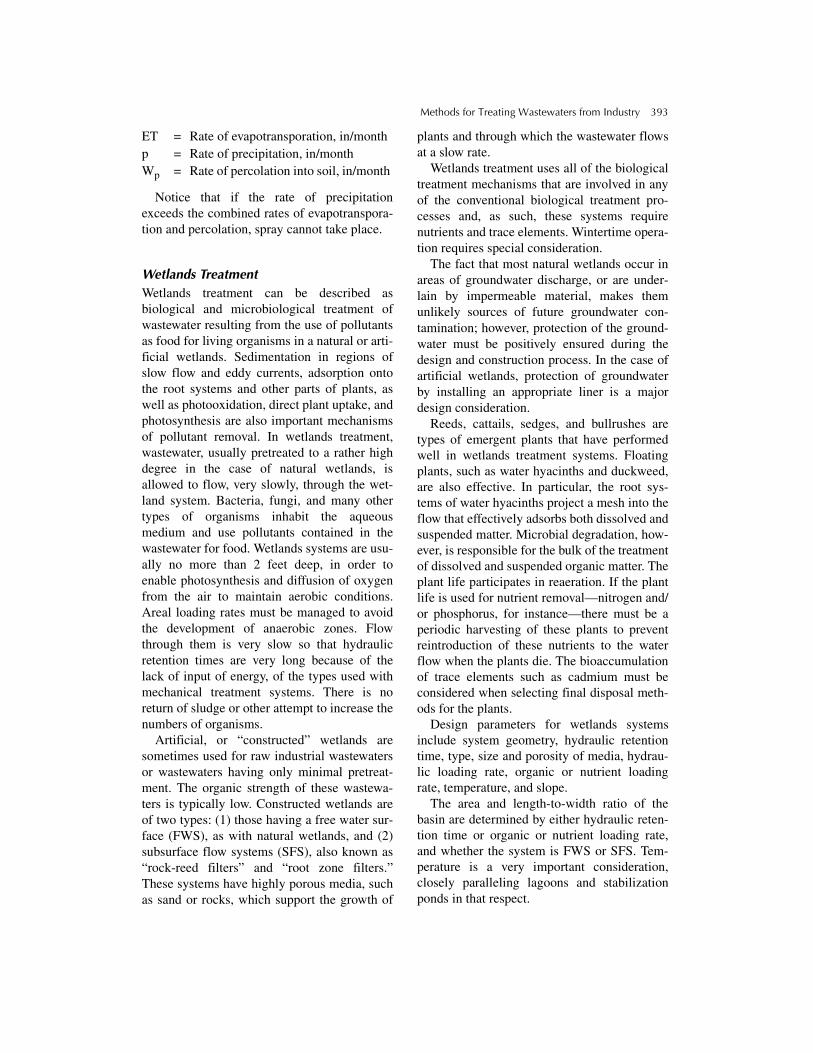
Methods for Treating Wastewaters from Industry 393
ET = Rate of evapotransporation, in/month p = Rate of precipitation, in/month Wp = Rate of percolation into soil, in/month
Notice that if the rate of precipitationexceeds the combined rates of evapotranspora-tion and percolation, spray cannot take place.
Wetlands Treatment Wetlands treatment can be described asbiological and microbiological treatment ofwastewater resulting from the use of pollutantsas food for living organisms in a natural or arti-ficial wetlands. Sedimentation in regions ofslow flow and eddy currents, adsorption ontothe root systems and other parts of plants, aswell as photooxidation, direct plant uptake, andphotosynthesis are also important mechanismsof pollutant removal. In wetlands treatment,wastewater, usually pretreated to a rather highdegree in the case of natural wetlands, isallowed to flow, very slowly, through the wet-land system. Bacteria, fungi, and many othertypes of organisms inhabit the aqueousmedium and use pollutants contained in thewastewater for food. Wetlands systems are usu-ally no more than 2 feet deep, in order toenable photosynthesis and diffusion of oxygenfrom the air to maintain aerobic conditions.Areal loading rates must be managed to avoidthe development of anaerobic zones. Flowthrough them is very slow so that hydraulicretention times are very long because of thelack of input of energy, of the types used withmechanical treatment systems. There is noreturn of sludge or other attempt to increase thenumbers of organisms.
Artificial, or “constructed” wetlands aresometimes used for raw industrial wastewatersor wastewaters having only minimal pretreat-ment. The organic strength of these wastewa-ters is typically low. Constructed wetlands areof two types: (1) those having a free water sur-face (FWS), as with natural wetlands, and (2)subsurface flow systems (SFS), also known as“rock-reed filters” and “root zone filters.”These systems have highly porous media, suchas sand or rocks, which support the growth of
plants and through which the wastewater flowsat a slow rate.
Wetlands treatment uses all of the biologicaltreatment mechanisms that are involved in anyof the conventional biological treatment pro-cesses and, as such, these systems requirenutrients and trace elements. Wintertime opera-tion requires special consideration.
The fact that most natural wetlands occur inareas of groundwater discharge, or are under-lain by impermeable material, makes themunlikely sources of future groundwater con-tamination; however, protection of the ground-water must be positively ensured during thedesign and construction process. In the case ofartificial wetlands, protection of groundwaterby installing an appropriate liner is a majordesign consideration.
Reeds, cattails, sedges, and bullrushes aretypes of emergent plants that have performedwell in wetlands treatment systems. Floatingplants, such as water hyacinths and duckweed,are also effective. In particular, the root sys-tems of water hyacinths project a mesh into theflow that effectively adsorbs both dissolved andsuspended matter. Microbial degradation, how-ever, is responsible for the bulk of the treatmentof dissolved and suspended organic matter. Theplant life participates in reaeration. If the plantlife is used for nutrient removal—nitrogen and/or phosphorus, for instance—there must be aperiodic harvesting of these plants to preventreintroduction of these nutrients to the waterflow when the plants die. The bioaccumulationof trace elements such as cadmium must beconsidered when selecting final disposal meth-ods for the plants.
Design parameters for wetlands systemsinclude system geometry, hydraulic retentiontime, type, size and porosity of media, hydrau-lic loading rate, organic or nutrient loadingrate, temperature, and slope.
The area and length-to-width ratio of thebasin are determined by either hydraulic reten-tion time or organic or nutrient loading rate,and whether the system is FWS or SFS. Tem-perature is a very important consideration,closely paralleling lagoons and stabilizationponds in that respect.

394 Industrial Waste Treatment Handbook
Bibliography
American Society of Civil Engineers, StandardGuidelines for In-Process Oxygen TransferTesting, publication No. ASCE-18-96, 1997.
American Society of Civil Engineers, Waste-water Treatment Plant Design, WaterPollution Control Federation Manual ofPractice No. 8, Manuals and Reports onEngineering Practice No. 36, 1977.
Amirtharajah, Journal of the American WaterWorks Association, December 1988.
Behn, V.C., and J.C. Liebman, “Analysis ofThickener Operation,” Journal of the Sani-tary Engineering Division, ASC, vol. 89,1963.
Burd, R.S., “A Study of Sludge Handling andDisposal,” Federal Water Pollution ControlAdministration, WP-20-4, Washington,D.C., 1968.
Butler, J.N., Ionic Equilibrium—A Mathemati-cal Approach, Addison-Wesley, Reading,Massachusetts, 1964.
Cummins, M.D., and J.J. Westrick, “PackedColumn Air Stripping for Removal of Vola-tile Compounds,” Proceedings of NationalConference on Environmental Engineering,American Society of Civil Engineers, Min-neapolis, Minnesota, 1982.
Eckenfelder, W.W., “Trickling Filter Designand Performance,” Trans. ASCE, 128, PartIII, 1963, p. 371.
Eckenfelder, W.W., and W. Barnhart, “Perfor-mance of a High-Rate Trickling FilterUsing Selected Media,” Journal of theWater Pollution Control Federation, 35(12),1963.
Eckenfelder, W.W., and D.L. Ford, Water Pol-lution Control: Experimental Procedures forProcess Design, Pemberton Press, NewYork, 1970.
Edde, H.J., and W.W. Eckenfelder, “Theoreti-cal Concept of Gravity Sludge Thickening;Scaling-up Laboratory Units to PrototypeDesign,” Journal of the Water PollutionControl Federation, vol. 40, 1968.
Fair, G.M., J.C. Geyer, and D.A. Okun, Ele-ments of Water Supply and WastewaterDisposal, Wiley, New York, 1971.
Gailer, W.S., and H.B. Gotaas, “Analysis ofBiological Filter Variables,” Journal of theSanitary Engineering Division, ASCE,90(6), 1964.
Germain, J.E., “Economical Treatment ofDomestic Waste by Plastic-Medium Trick-ling Filters,” Journal of the Water PollutionControl Federation, 38(2), 1966.
Great Lakes–Upper Mississippi River Board ofState Sanitary Engineers, RecommendedStandards for Sewage Works, Health Educa-tion Service, Inc., Albany, 1978.
Hawkes, H.A., Microbial Aspects of Pollution,Academic, London, 1971.
Kavanaugh, M.C., and P.R. Trussell, “Designof Aeration Towers to Strip Volatile Contam-inants from Drinking Water,” Journal of theAmerican Water Works Association, vol. 72,no. 12, Denver, Colorado, 1980.
Kynch, G.J., A Theory of Sedimentation,Transactions of the Faraday Society, vol.48, 1952.
Lanouette, K.H., “Heavy Removal,” ChemicalEngineering Journal, 84 (10): 73-80, 1977.
McKinney, R.E., Microbiology for SanitaryEngineers, McGraw-Hill, New York, 1962.
Metcalf & Eddy, Inc., Wastewater Engineer-ing-Treatment, Disposal, and Reuse, G.Tchobanoglous and F.L. Burton (eds.),McGraw-Hill, New York, 1991.
National Fire Protection Association, “Recom-mended Practice for Fire Protection inWastewater Treatment and Collection Facili-ties,” NFPA Standard 820, 1992.
National Research Council, “Sewage Treat-ment at Military Installations,” SewageWorks Journal, 18(5), 1946.
Novotny, V., and A.J. Englande, Jr., “Equaliza-tion Design Techniques for ConservativeSubstances in Wastewater Treatment Sys-tems,” Water Research, 8(325), 1974.
Novotny, V., and R.M. Stein, “Equalization ofTime Variable Waste Loads,” Journal of theEnvironmental Engineering Division, ASCE,102(613), 1916.
Paler, S.A.K., M.A. Brenton, T.J. Nunno,F.M. Sullivan, and N.F. Surprenant, Metal/Cyanide Containing Wastes: Treatment
Methods for Treating Wastewaters from Industry 395
Technologies, Noyes Data Corporation, ParkBridge, New Jersey, 1988.
Schulze, K.L., “Load and Efficiency of Trick-ling Filters,” Journal of the Water PollutionControl Federation, 32(3), 1960, p. 245.
Shinskey, F.G., pH and pION Control, Wiley,New York, 1973.
Smith, J.M., Chemical Engineering Kinetics,2nd ed., McGraw-Hill, New York, 1972.
Smith, R., R.G. Eilers, and E.D. Hall, “Designand Simulation of Equalization Basins,”U.S. Environmental Protection Agency,Advanced Waste Treatment Research Labo-ratory, Cincinnati, Ohio, 1973.
Stenstrom, M.K., and R.G. Gilbert, “Effects ofAlpha, Beta and Theta Factor Upon theDesign, Specification and Operation of Aer-ation Systems,”Water Research, vol. 15, 1981.
Sundstrom, D.W., and H.E. Klei, WastewaterTreatment, Prentice Hall, Englewood Cliffs,New Jersey, 1979.
Talmage, W.P., and E.B. Fitch, “Determin-ing Thickener Unit Areas,” Industrial andEngineering Chemistry, vol. 47, 1955.
The American Public Health Association, theAmerican Society of Civil Engineers, theAmerican Water Works Association, and theWater Pollution Control Federation, Glos-sary, Water and Wastewater ControlEngineering, 1969.
The Soap and Detergent Association, Phospho-rus and Nitrogen Removal from MunicipalWastewater: Principles and Practice, 2nd.ed., R. Sedlak (ed.), Lewis Publishers, NewYork, 1991.
U.S. Congress, Office of Technology Assess-ment, “Technologies and ManagementStrategies for Hazardous Waste Control,”U.S. Government Printing Office, Washing-ton, D.C., 1983.
U.S. Environmental Protection Agency, Chemi-cal Aids Manual for Wastewater TreatmentFacilities, EPA 430/9-79-018, MO-25,Washington, D.C., 1979.
U.S. Environmental Protection Agency, Con-trol and Treatment Technology for theMetal Finishing Industry—Sulfide Precipita-tion, Industrial Environmental Research
Laboratory, EPA 625/8-80/003, Cincinnati,Ohio, 1980.
U.S. Environmental Protection Agency, Con-trol and Treatment Technology for the MetalFinishing Industry, Industrial EnvironmentalResearch Laboratory, EPA 625/8-82-008,Cincinnati, Ohio, 1982.
U.S. Environmental Protection Agency, Con-trol of Organic Substances in Water andWaste Water, Office of Research and Devel-opment, EPA 600/8-83/011, Cincinnati,Ohio, 1983.
U.S. Environmental Protection Agency, DesignManual—Phosphorus Removal, EPA/621/1-87/001, Washington, D.C., 1987.
U.S. Environmental Protection Agency, Disin-fection of Wastewater Task Force Report,EPA 430/9-75-012, Washington, D.C.,1976.
U.S. Environmental Protection Agency, Elec-troplating Industry, EPA 625/5-79-016,Washington, D.C., 1979.
U.S. Environmental Protection Agency, Esti-mating Costs of Granular Activated CarbonTreatment for Water and Wastewater, Officeof Research and Development, Washington,D.C., 1983.
U.S. Environmental Protection Agency, Evalu-ation of Sludge Management Systems, EPA430/9-80-001, Washington, D.C., 1980.
U.S. Environmental Protection Agency, FlowEqualization, Technology Transfer, EPA625/4-74-006, Washington, D.C., 1974.
U.S. Environmental Protection Agency, Innova-tive and Alternative Technology AssessmentManual, Municipal Environmental ResearchLaboratory, EPA 430/9-78-009, MCD 53,Cincinnati, Ohio, 1978.
U.S. Environmental Protection Agency, Liningof Waste Impoundment and Disposal Facili-ties, SW-870, Washington, D.C., 1983.
U.S. Environmental Protection Agency, Man-ual for Nitrogen Control, EPA/625/R-93/010, Washington, D.C.
U.S. Environmental Protection Agency, Meet-ing Hazardous Waste Requirements forMetal Finishers, EPA 625/4-87/018, Cincin-nati, Ohio, 1987.

396 Industrial Waste Treatment Handbook
U.S. Environmental Protection Agency, Nitrifi-cation and Denitrification Facilities,Wastewater Treatment, Technology Trans-fer, Washington, D.C., 1973.
U.S. Environmental Protection Agency, Opera-tions Manual for Anaerobic Sludge Digestion,EPA 430/9-76-001, Washington, D.C., 1976.
U.S. Environmental Protection Agency, Oxy-gen Activated Sludge Wastewater TreatmentSystems, Technology Transfer Seminar Pub-lication, Washington, D.C., 1973.
U.S. Environmental Protection Agency, Physi-cal-Chemical Nitrogen Removal, WastewaterTreatment, Technology Transfer, Washing-ton, D.C., 1974.
U.S. Environmental Protection Agency, Pro-cess Control Manual for Aerobic BiologicalWastewater Treatment Facilities, EPA III-A-524-77, Washington, D.C., 1977.
U.S. Environmental Protection Agency, Pro-cess Design Manual for PhosphorusRemoval, Technology Transfer, EPA 625/1-76-001a, Washington, D.C., 1976.
U.S. Environmental Protection Agency, Pro-cess Design Manual for Sludge Treatmentand Disposal, Technology Transfer, EPA625/1-74/006, Washington, D.C., 1974.
U.S. Environmental Protection Agency, Pro-cess Design Manual for Suspended SolidsRemoval, Technology Transfer, EPA 625/1-75/003a, Washington, D.C., 1975.
U.S. Environmental Protection Agency, Pro-cess Design Manual for Upgrading ExistingWastewater Treatment Plants, TechnologyTransfer, EPA 625/1-71/004a, Washington,D.C., 1974.
U.S. Environmental Protection Agency, Pro-cess Manual for Carbon Adsorption,Technology Transfer, Washington, D.C.,1971.
U.S. Environmental Protection Agency,Research Summary—Industrial Wastewater,Office of Research and Development, EPA-60018-80-026, Washington, D.C., June1980.
U.S. Environmental Protection Agency, Ultra-violet Disinfection Technology Assessment,Office of Wastewater Enforcement and Com-pliance, EPA 832-R-92-004, Washington,D.C., 1992.
U.S. Environmental Protection Agency,Upgrading Trickling Filters, EPA 430/9-78-004, Washington, D.C., 1978.
U.S. Environmental Protection Agency, Waste-water Filtration, Design Considerations,Technology Transfer, EPA 625/14-74-007a,Washington, D.C., 1974.
Velz, C.J., “A Basic Law for the Performanceof Biological Filters,” Sewage Works Jour-nal, 20, 1948, p. 607.
Wachinski, A.M., and J.E. Etzel, Environmen-tal Ion Exchange — Principles and Design,Lewis Publishers, New York, 1997.
Wallace, A.T., “Analysis of EqualizationBasins,” Journal of Sanitary EngineeringDivision, ASCE, 94(1161), 1968.
Water Environment Federation, Design ofMunicipal Wastewater Treatment Plants,WEF Manual of Practice No. 8, Alexandria,Virginia, 1992.
Water Environment Federation, Odor Controlin Wastewater Treatment Plants, WEF Man-ual of Practice No. 22, Alexandria, Virginia,1995.
Wei, J., and C.D. Prater, “A New Approach toFirst Chemical Reaction Systems”, Ameri-can Institute of Chemical Engineers Journal,9(77), 1963.
Wei, J., and C.D. Prater, Advances in Catalysis,vol. 13, Academic Press, New York, 1962.

397
9 Treatment and Disposal of Solid Wastes from Industry
Solid wastes from industries include all wastesthat are discharged to places or facilities otherthan to the air or to the water, plus the residualsfrom air and water pollution control systems.They are classified as either industrial wastes,solid wastes, or hazardous wastes, dependingon their characteristics. Disposal methodsinclude landfills, incinerators, and composting.In some cases it is advantageous to subject cer-tain of these wastes to treatment beforedisposal by one of these methods.
Before the Industrial Revolution in the mid-1800s, almost all wastes—industrial, commer-cial, and domestic—were derived from naturalsubstances and were, therefore, biodegradable.Pollution of any portion of the environmentwas caused by pathogens from human wastesor was the result of simply overwhelming theability of the environment to undergo self-puri-fication. Either way, the pollution was tempo-rary, and the self-purification capability of“Mother Earth” would eventually prevail.
The Industrial Revolution was attended bysolid waste and other waste disposal activitiesthat could never be self-purified by the naturalprocesses of microbiological degradation,chemical oxidation and reduction, adsorption,absorption, or other natural phenomena. Asexamples, some open dumps were sites of verylarge amounts of heavy metals pollution. Othersites where coal gasification took place are stillpolluted with tarry residuals that are classifiedas hazardous because of toxic organics.
The problem of soil and groundwater pollu-tion greatly accelerated with the developmentof synthetic organics, beginning a few yearsbefore World War I and greatly increasing dur-ing and after World War II. New synthetics thatwere developed and produced in great quantityduring that period included chlorinated
solvents, synthetic rubber, several pesticidesand herbicides, polychlorinated biphenyls(PCBs), and plastics such as polyethylene,polyurethane, and a host of others. Many ofthese substances are classified as hazardousbecause of toxicity, flammability, reactivity, orcorrosivity. Toxicity, of course, has alwaysbeen synonymous with hazardous. The otherthree characteristics were deemed “hazardous”as a matter of law by the Resource Conserva-tion and Recovery Act (RCRA) in 1986.
Microorganisms did not have the ability toproduce enzymes necessary to degrade thesesynthetic organics because the organics werenot present on the earth during the millions ofyears of development of the microorganisms.Consequently, the earth was unable to undergoself-purification, and these substances werecarried by percolating rainwater and other pre-cipitation to the groundwater.
The result, in the context of solid waste han-dling and disposal, is that extensive and sophis-ticated safeguards have become standardcomponents of landfills, incinerators, compost-ing facilities, or any alternative solid waste dis-posal technology. Modern landfills have doubleliners with leachate collection and treatmentand leak detection. Some landfills have tripleliners. All landfills must be closed according tostrict regulations, on reaching their useful life.Typically, an impermeable cap equipped withgas collection and erosion control means arerequired.
Incinerators have stack emission controlsand are subject to strict regulations regardinghandling and disposal of ash and residuals fromstack emission controls. Composting facilitieshave extensive safeguards to protect againstgroundwater pollution. All three disposaltechnologies are subject to strict and extensive

398 Industrial Waste Treatment Handbook
regulations regarding what is allowed to be dis-posed of using their technology. All three tech-nologies are also subject to the requirement ofgroundwater monitoring at their sites.
Of paramount importance to the area of solidwastes handling and disposal is the mandate forpollution prevention, discussed in Chapter 7.The pollution prevention mandate requires thatindustries develop, plan for, and provide forhandling and disposal of all wastes associatedwith any product throughout its life cycle,including minimizing the sum total of thosewastes. Minimization involves source reduc-tion as well as recycling and reuse.
Among the most desirable methods of wastereduction is the production of a salable sub-stance or material, either by modification of thewaste itself or by combining it with anotherwaste material. Chipboard, which is used as asubstitute for plywood by the constructionindustry, was originally developed using wastesfrom wood-working, for example. Compostedfood-processing wastes, including wastes fromthe processing of fish, poultry, meat, and vege-tables, have been extensively used for soil con-ditioning and fertilization. Rendering plantshave developed capabilities to process manyorganic wastes that were formerly disposed ofinto animal feed supplements. Potato-process-ing wastes are further processed to producestarch. Many industries have constructed andused facilities to store solid wastes that containmetals or other substances of value, until animproved recovery process is developed, oruntil market conditions become more favor-able. These are more examples of a continuingeffort on the part of industry to reduce thequantity of solid wastes that require disposal.
Characterization of Solid Wastes
Each significant solid waste stream shouldundergo characterization in order to determinethe following:
• Opportunities for waste reduction
• Rate of waste generation
• Whether or not the waste is hazardous
• Suitability of the waste for landfilling
• Physical properties as they relate to suitabil-ity for landfilling
• Chemical properties as they relate to suit-ability for landfilling
• Estimation of leachate characteristics
• Suitability of the waste for incineration
• Estimated characteristics of stack emissions
• Estimated requirement for auxiliary fuel
• Estimated characteristics of ash
• Suitability of the waste for composting
Opportunities for Waste ReductionThe first and most important order of businessin a solid waste management program is toidentify any and all opportunities for reducingthe volume, strength, and hazardous nature ofwastes, always with the goal of elimination.For instance, the solid wastes manager shouldconstantly be seeking opportunities for givenwastes to be used as raw material in anothermanufacturing process, even if there is a cost.The cost should be compared to the cost of pro-cessing and disposing of the waste, and anappropriate amount should be added as insur-ance against having to deal with the disposedwaste in the future for one reason or another. Ifthe waste can be safely incorporated intoanother product, a permanent solution willhave been implemented.
As a very simple example, a certain card-board manufacturing plant had a daily produc-tion capacity of 1,000 tons per day of heavybrown paper. The plant had a wastewater treat-ment plant that produces about 3 tons (drybasis) of waste biosolids per day. After years oflandfilling this sludge, the suggestion wasmade to simply incorporate the waste biosolidsinto the brown paper. The relatively tinyamount of biosolids, which had been a sizablesolid waste disposal problem, “got lost” in the1,000 tons of brown paper, forever solving apreviously expensive problem.
As another example, during the 1970s, thenumber of poultry farms and poultry-process-ing facilities increased dramatically in response

Treatment and Disposal of Solid Wastes from Industry 399
to a growing desire on the part of the Americanpublic to reduce intake of cholesterol. Many ofthe poultry-processing plants made use of dis-solved air flotation (DAF) for wastewater treat-ment. The residual from the DAF process is asludge that is very difficult and expensive todispose of. A solution that was developed andused by some of the processing plants was toincorporate the DAF residual into the rawmaterials that were being used to produce feedfor the poultry. Because the DAF residual wasessentially all poultry parts and pieces, it wasperfect as a feed additive to be fed right back tothe chickens. Again, an expensive and prob-lematic solid waste disposal problem wasresolved. In this case, the result was a signifi-cant savings of money for both waste disposaland feed production.
Rate of Waste GenerationOften, rigorous attention paid to managing pro-duction processes to “do it right the first time”and having little or no off-spec product to dis-pose of can significantly reduce the volume ofsolid wastes. Also, improved preventive main-tenance and improved operation andmaintenance (O&M) practices to reduce leaks,spills, and accidents can have the effect of sig-nificant reductions in the volumes of solidwastes, as well as wastewater and air pollutants.
Whether the Waste Is HazardousWhether or not the waste is hazardous has amajor effect on both the cost of solid wastehandling and disposal and the risk of future lia-bility. It is always a good idea to substitutenonhazardous materials for hazardous materi-als used in production, if the resulting wastesbecome nonhazardous. An example is to usehot water and detergent or a hot caustic solu-tion as a degreaser fluid rather than one of thechlorinated organic solvents. In many cases,the hot detergent or caustic solution outper-forms the chlorinated solvent. The principalvalue of this substitution, however, is that thesludge from the hot detergent or caustic pro-cess will likely not require disposal as ahazardous substance.
As another example, certain sludges fromindustrial processes or industrial waste treat-ment facilities are required to be handled anddisposed of as hazardous wastes because, onbeing subjected to the Toxic CharacteristicLeaching Procedure (TCLP) test, the quantityof metals leached is more than is allowed. Ithas been possible, in some instances, to mix“superphosphate” fertilizer into the sludge withthe result that the sludge is then able to “pass”the TCLP test. The treatment mechanism atwork here is that the metal ions become tied upas extremely insoluble metal phosphates. Theacid solution used for the TCLP test is unableto leach the metal ions from the sludge, andrainwater percolating through the landfilledsludge will certainly not be able to leach themetals and become a groundwater pollutionthreat.
Suitability of the Waste for LandfillingWhether or not a particular solid waste is suit-able for landfilling depends on its physicalcharacteristics, chemical characteristics, and itsprobable leachate characteristics (i.e., whetheror not there will be hazardous substances in theleachate).
Physical PropertiesPhysical properties that influence suitability forlandfilling include those that influence struc-tural stability. Often, water content is used todetermine suitability for landfilling in the caseof waste sludges. Another property is physicalsize. Still another relates to the ability of land-fill machinery to handle the waste at the landfillsite.
Chemical Properties Chemical properties that influence suitabilityfor landfilling, in addition to those propertiesthat determine whether a waste is hazardous(i.e., corrosivity, toxicity, ignitability, and reac-tivity) include foaming agents (methylene blueactive substances), iron and manganese, odorand odor, generation potential, for instance,sulfate.
400 Industrial Waste Treatment Handbook
Formal testing procedures for determiningwhether a waste is hazardous are presented inChapter 6.
Suitability of the Waste for Incineration
Whether a waste can be destroyed by incinera-tion (often referred to as “combustion”), andthe quantity of auxiliary fuel that would berequired to maintain a sufficiently high temper-ature in the combustion chamber to accomplishcomplete combustion, depends on several char-acteristics of the waste. Water content andchemical composition are major factors. Watercontent is important because of the demandthat water places on auxiliary fuel usage and,thus, the cost of incineration. Chemical compo-sition influences the following:
• The fraction of the total waste stream thatcan be converted to carbon dioxide and water
• The characteristics of the stack emissions• The characteristics of the ash• The quantity of auxiliary fuel required
Within a total waste stream, the only ele-ments that are converted to carbon dioxide andwater are carbon and hydrogen. All other ele-ments are converted to other substances orremain unchanged. Some elements are con-verted to anions of high oxidation state; forinstance, sulfur is converted to sulfur dioxideor sulfur trioxide. Some elements are liberatedas the free cation; for instance, mercury thathas been incorporated into organic material(methyl mercury) most likely exits the stack asfree Hg+. Chunks of ferrous metals tend toremain unchanged. Sand and other inerts endup in the ash. Some heavy metals end up in theash; a portion exit the stack.
It is critically important, then, to be aware ofthe chemical composition of any waste streamfor which treatment by incineration is beingcontemplated. The word “treatment” is usedhere, rather than “disposal,” because incinera-tion yields residuals from stack emission treat-ment (for instance, electrostatic precipitation)as well as ash. These residuals then become thesubjects of evaluation of alternatives for dis-posal method.
Suitability of the Waste for CompostingCertain industrial solid wastes—vegetable pro-cessing, for instance—may be excellentcandidates for composting. Composting is amethod of converting waste material to usablematerial, and is thus highly desirable. A verylarge composting facility has been operated formany years in the Midwest of the United Statesfor converting meat-processing wastes to a soilenhancement product.
The Solid Waste Landfill
The Conventional LandfillModern landfills are highly secure facilitieswith sophisticated features to prevent pollu-tion of groundwater or soil. Modern landfillsalso have safeguards against blowing trashproblems, odor problems, rodent and fly prob-lems, fires, and contamination of surfacewaters.
There are alternatives, but most modernlandfills are constructed as follows.
First, the site is cleared and grubbed. Topsoilis removed and stored. Access roads are built,and physical facilities, such as an office build-ing, maintenance and storage building, scales,hot load pit with firefighting equipment, andlaboratory facility, are constructed and/orinstalled.
After excavation to provide a basin in whichthe solid wastes will be placed has been com-pleted, the liner system is constructed.
Landfill Liner System
Figure 9-1 presents a cross-section of a landfillliner system that was constructed in 1999, andis discussed as a typical modern landfill linersystem. The landfill liner system shown inFigure 9-1 can be described as a “double com-posite with primary and secondary leachatecollection.” This particular design can also bedescribed as having leak detection because anyleachate collected by the secondary leachatecollection is direct and positive evidence of aleak in the primary liner.

Treatment and Disposal of Solid Wastes from Industry 401
Figure 9-1 Double composite landfill liner system.
It is convenient to describe the landfill linersystem illustrated in Figure 9-1 by describinghow it is constructed. After excavating thelandfill “basin” to the subgrade (shown in Fig-ure 9-1), an 18-inch-thick layer of “secondarybarrier soil” is placed. This material constitutesa liner in its own right because the hydraulicconductivity (the rate at which water can movethrough the soil under the influence of gravity)can be no greater than 10−7 centimeters persecond, equivalent to about 1 foot in 30 years.Federal regulations (Subtitle D) require that asoil liner of not less than 2 feet of soil having acoefficient of permeability (“k”) equal to orless than 1 × 10⁻⁷ be an integral component ofthe liner system for all landfills. In the case ofthe landfill used for this example, the state reg-ulatory agency as well as the U.S. EPA agreedthat 18 inches of soil having a “k” value of1 × 10−7, plus 12 inches of soil having a “k”value of 1 × 10⁻⁵, plus the geosynthetic clayliner as discussed below, more than satisfiedthis requirement.
Some states will not accept a substitute for asoil liner, at least 2 feet thick, having a “k”value of 1 × 10⁻⁷ or less. One solution for thissituation, if enough soil of that low hydraulicconductivity cannot be obtained within a rea-sonable distance of the landfill site, is to
augment native soil (of higher hydraulic con-ductivity [larger value of “k”]) with powderedsodium bentonite. Bentonite is a natural claythat exhibits a high degree of swelling on con-tact with water. In fact, it will swell to 2.5 to 3times its volume when dry. When relativelysmall amounts of this material are mixed intosoil of higher hydraulic conductivity, theparticles of bentonite fit into the void spaces.Then, when a water solution—for instance,leachate—comes into contact with the mixture,the particles of bentonite swell. This swellingaction closes off the void spaces in the morehighly permeable soil, with the result that themixture as a whole has a “k” value that satisfiesthe Subtitle D mandate of 1 × 10⁻⁷ or less.
Next, an impermeable membrane is placedover the secondary soil barrier. In the systemillustrated in Figure 9-1, that membrane con-sisted of 80-mil-thick textured high-densitypolyethylene (HDPE). This barrier is referredto as a “synthetic membrane” and constitutesthe secondary liner for the landfill.
Over the top of the synthetic membrane sec-ondary liner is placed a fabric that is referred toas a “geocomposite.” This fabric, which isloosely woven using threads of synthetic mate-rial, performs two functions. One is to protectthe HDPE membrane from being punctured by
18" SECONDARY BARRIER SOIL(k=1x10⁻⁷ cm/sec)
12" PRIMARY BARRIER SOIL(k=1x10⁻⁵ cm/sec)
12" OF 1-1/2" DIA.CRUSHED STONE
2' MIN.3'
-6"
PRIMARYLINER
SYSTEM
SECONDARYLINER
SYSTEM
MAINTAIN 12" CRUSHEDSTONE ABOVE LCR HEADER
PRIMARY LATERAL LCR PIPE6" PERF. HDPE16 OZ. NONWOVEN GEOTEXTILE
PRIMARY LCR HEADERPIPE 12" PERF. HDPE
80 MIL TEXTURED HDPEPRIMARY GEOMEMBRANE
GEOSYNTHETIC CLAY LINER(GCL) 1/2"
DRAINAGE GEOCOMPOSITESECONDARY LEACHATECOLLECTION
80 MIL TEXTURED HDPESECONDARY GEOMEMBRANE
LANDFILL LINER SUBGRADENOTE:
SPACE PIPING AS SHOWN ONSITE DEVELOPMENT PLAN
402 Industrial Waste Treatment Handbook
anything in the layer of soil above it. The otheris to act as a leachate collection and conduitdevice. Its openly woven texture allows it toperform this function.
Over the top of the geocomposite fabric isplaced a 1-foot layer of compacted soil referredto as the “primary soil barrier.” This layer ofcompacted soil, like the secondary barrier soil,is strictly regulated as to characteristics ofaggregate size and uniformity coefficient, andits hydraulic conductivity must be no higherthan 10−5 centimeters per second.
Over the top surface of the primary barriersoil is placed a sheet of a manufactured mate-rial called a “geosynthetic clay liner” (GCL).This material, which is delivered to the site inlarge rolls and is about one-half inch thick,consists of a matlike fabric that is filled withclay. The clay is used for its impermeabilityand resistance to chemical attack, which is apossibility in the case of HDPE, although avery remote one. The synthetic fabric hasthe function of providing the GCL as awhole with structural strength and the capabil-ity of constructing a layer of clay that is quitethin.
The next layer, which is placed over the topof the GCL, is the primary liner for the land-fill, a sheet of 80-mil-thick textured HDPE.This membrane is constructed by rolling outvery large rolls of the HDPE material as it isdelivered to the site, and welding sheets edgeto edge (actually, the edges overlap) to form acontiguous membrane underlying the entirelandfill. The same procedure is used to con-struct the secondary liner. If everything wereas intended throughout time, there would beno passage of leachate through the primarymembrane, and everything below it would besuperfluous.
The final layer of fabric in the landfill linersystem shown in Figure 9-1 consists of a so-called nonwoven geotextile that is placed overthe top of the primary synthetic liner. The pri-mary function of this layer of synthetic fabric isto protect the primary liner from being punc-tured or otherwise breached by the crushedstone, or anything inadvertently put in thecrushed stone, above it.
A bed of crushed stone consisting of aggre-gates of 1- to 1.5-inch diameter is placed on topof the nonwoven geotextile along with the pri-mary leachate collection system. The crushedstone bed has the multiple functions of (1)holding the leachate collection and transportpipe system in place, (2) providing a highdegree of hydraulic conductivity to enableleachate to flow to the collection and transportsystem, and (3) serving as a bed for the solidwastes placed in the landfill.
The primary leachate collection andtransport system is a grid of plastic pipe(HDPE in the example illustrated in Figure9-1), perforated at all locations within thelandfill and solid outside the landfill. Thelayout of the pipe grid, the size and spacing ofthe laterals and headers, and the material ofconstruction of the pipes themselves aresubject to guidelines and regulations issued byeach state or solid waste authority. Thetreatment and disposal of leachate, oncecollected, is addressed in Chapter 8.
Some landfill liner designs have a layer ofgroundwater protection in addition to the twothat are included in the design illustrated inFigure 9-1. An example is shown in Figure 9-2.The landfill liner system shown in Figure 9-2,which was installed in 1999 in Augusta, Maine,has primary and secondary synthetic mem-brane liners with primary and secondaryleachate collection as shown in Figure 9-2, plusa third synthetic membrane liner below the pri-mary and secondary systems. A system of liq-uid collection and transport piping is locatedjust above the third liner, which is correctlyreferred to as “leak detection” because its func-tion is to show evidence of leaks in the “con-ventional” landfill liner system above it.
Landfill Cover and Cap Systems
Daily and Intermediate CoverAn important feature of any landfill is apractice that began with the earliest landfillsin the 1940s, that of daily, intermediate, andfinal cover. Daily cover consists of soilor other approved material that is placed over

Treatment and Disposal of Solid Wastes from Industry 403
Figure 9-2 Landfill liner with three synthetic membranes and two leachate collection systems.
the deposited wastes as soon as is practicalthroughout, and without fail at the end of, eachday of landfill operation. The purposes of dailycover include control of flies and rodents, fire,odors, volatile organic compound (VOC) emis-sions, scavenging, and the prevention of itemsfrom being blown out of place by wind. A 6inch depth of soil is mandated by the EPA(Title 40, Subpart C, 258.21) for this purpose;however, because of the high value placed onlandfill “air space,” the 6 inches taken up byeach lift when soil is used for the daily coverhas been looked upon as a candidate forreplacement by much thinner alternative mate-rials. Although each time a substitute materialis used it must be approved on a case-by-casebasis, many landfills have been successful indoing so. Alternative materials have includedspecially constructed membranes (referred toas “tarps”), sludge from primary clarifiers, pro-prietary fiber slurries, foam-in-place products,and spray-on asphalt membranes.
Intermediate cover is soil that was removedearlier from the landfill excavation and stock-piled. The same is true for daily cover. In someinstances, another (approved) material has beenused for intermediate cover. An example is
sludge from primary clarifiers at paper millwastewater treatment plants. The frequency ofplacement of intermediate cover depends onthe characteristics of the material being land-filled but is typically required to be placed onany portion of the landfill if it is to be inactivefor 60 or more days. The thickness of interme-diate cover is typically required to be no lessthan 12 inches.
Final Cover and/or CapWhen a landfill, or a discrete segment of alandfill, has reached capacity, it must be“closed” in accordance with applicable regula-tions. Typically, a constructed “cap” isrequired, an example of which is illustrated inFigure 9-3. The primary purpose of the cap isto stop the formation of leachate by preventingrainwater or other precipitation from percolat-ing into the landfilled waste. Therefore, thedesign objective is to provide an impermeablebarrier that is able to dissipate methane andother gases into the ambient air, thus preventingan explosion or fire hazard from developing.
As shown in Figure 9-3, it is first necessaryto completely cover the (compacted) waste
12" SAND
12" SAND
12" SAND
6" SPECIAL FILL
24" CLAY
12" CLAY
PRIMARY LCR ANDCOMPOSITE LINER
FAILUREDETECTION
SECONDARY LCRAND COMPOSITE
LINER
PRIMARY LCR - DRAINAGEPIPE PERFORATED HOPEPIPE, SDR 15.5 (DIA. ASSHOWN ON PLAN)
3/4" CRUSHEDSTONE
2
3 3
TYP.1
1 1
16 OZ. FILTERFABRIC
SECONDARY LCR - DRAINAGEPIPE. PERFORATED HDPE PIPE.6" DIA. SDR 15.5
FAILURE DETECTION - DRAINAGEPIPE, PERFORATED HDPE PIPE6" DIA. SDR 15.5
40 MIL HDPE FML
16 OZ. FILTERFABRIC
8 OZ. FILTERFABRIC
80 MILHOPE FML
8 OZ. FILTERFABRIC
80 MIL.HDPE FML
3/4" CRUSHEDSTONE
3
3"
COMMON BORROW
2'-0" MIN.OVERLAP
12"OVERLAP
12"MIN.
3"
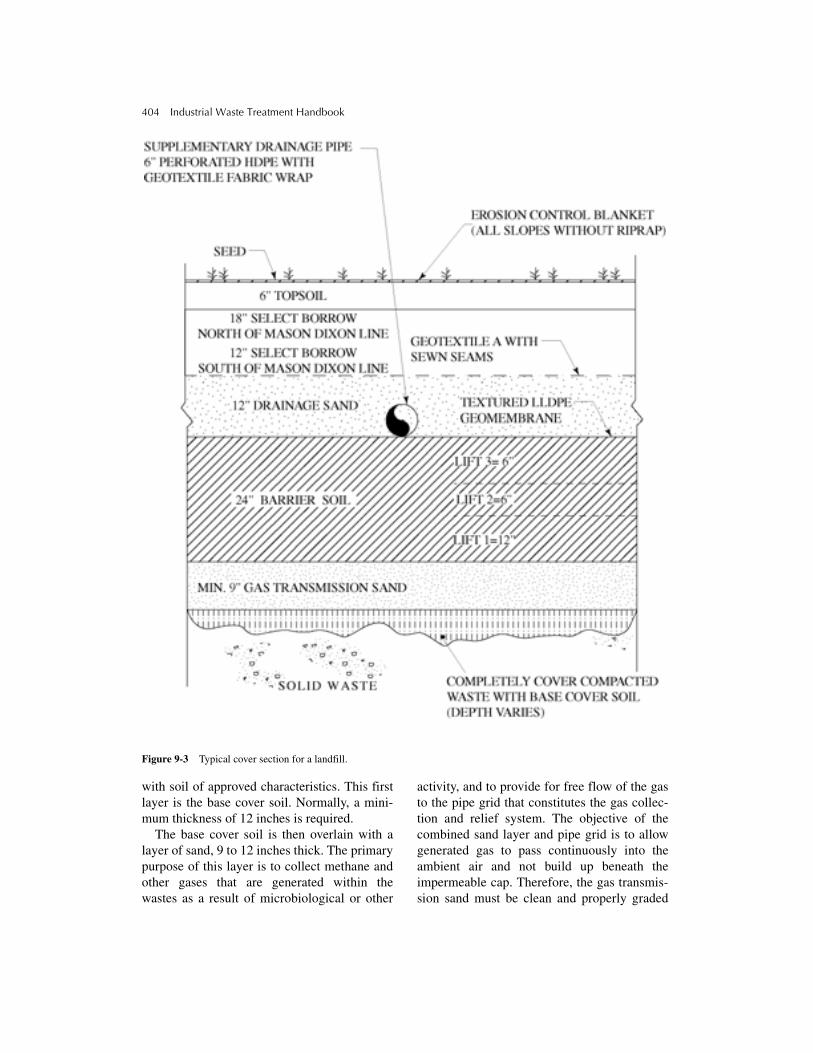
404 Industrial Waste Treatment Handbook
Figure 9-3 Typical cover section for a landfill.
with soil of approved characteristics. This firstlayer is the base cover soil. Normally, a mini-mum thickness of 12 inches is required.
The base cover soil is then overlain with alayer of sand, 9 to 12 inches thick. The primarypurpose of this layer is to collect methane andother gases that are generated within thewastes as a result of microbiological or other
activity, and to provide for free flow of the gasto the pipe grid that constitutes the gas collec-tion and relief system. The objective of thecombined sand layer and pipe grid is to allowgenerated gas to pass continuously into theambient air and not build up beneath theimpermeable cap. Therefore, the gas transmis-sion sand must be clean and properly graded

Treatment and Disposal of Solid Wastes from Industry 405
(high uniformity coefficient) to have high gasconductivity.
Above the layer of gas transmission sand isplaced a 2-foot layer of so-called barrier soil.The barrier soil is placed in three lifts, the firstof 12-inch thickness, the second and third of 6inches each. This layer of soil is then overlainwith a synthetic, impermeable membrane. Theprimary purpose of the combined barrier soil–synthetic membrane system is to prevent waterfrom any source from percolating downthrough the landfilled waste. If the cap is suc-cessful, leachate formation will cease.
What is placed on top of the impermeablemembrane system supports the growth of grassand conducts away rainwater and water fromany other source. In order to support the growthof grass, the system that is constructed over thetop of the impermeable membrane must be ableto allow rainwater to percolate through it, thenbe collected and carried harmlessly off the site.To this end, the synthetic membrane is overlainwith a 12-inch layer of “drainage sand.” Thepurpose of the drainage sand is to provide aneasy flowpath for the percolated water to reachthe drainage piping network. The drainagepipes then conduct this water to the stormwatercollection and retention system to prevent ero-sion or other harmful activity.
Above the drainage sand is a geotextilesheet, and above that is a 12- to 18-inch layerof common borrow. The purpose of the geotex-tile is to prevent percolating water from carry-ing fines from the common borrow into thedrainage sand, thus causing plugging. The pur-pose of the common borrow is to support thetopsoil above it in a way that helps the topsoilretain moisture. If the topsoil were placeddirectly on the sand, it would quickly dry andnot support the growth of grass between peri-ods of rain.
Topsoil is placed in a 6-inch-thick layer overthe borrow. Then, it has been found to be goodpractice to place an erosion control blanketover the topsoil before, or just after, seeding.The erosion control blanket is a fabric of syn-thetic or natural material that resembles finenetting. It allows ready penetration of waterand allows grass to grow up through it.
Gas VentingThe organic material that has been placed in alandfill undergoes anaerobic degradation, withthe consequent generation of methane, hydro-gen, hydrogen sulfide, and other gases,possibly for many years. Explosions haveoccurred when one or more of these gases,principally methane, have migrated through thesoil and entered a building. To prevent such anoccurrence, it is necessary to provide for easyand continuous escape of these gases into theambient air. Therefore a well-designed andinstalled gas venting system is a necessarycomponent of a landfill or portion of a landfillthat has been closed and provided with finalcover or an impermeable cap.
Figure 9-4 presents a drawing of a cross-sec-tion of a landfill cap, including a portion of thegas venting system. The standard installationprocedure for a gas venting system is as fol-lows: A grid system of trenches is excavated aminimum of 5 feet into the final layer of depos-ited and compacted solid waste material. Six-inch-diameter perforated plastic pipe isinstalled in each trench, surrounded by crushedstone. The crushed stone completely fills eachtrench, except for the plastic pipe. The purposeof the crushed stone is to provide for readymigration of the gas generated in the landfilltoward and into the plastic (polyethylene [PE],in the case shown in Figure 9-4) pipe. The pur-pose of the plastic pipe is to collect the gas andallow it to disperse into the ambient air via thevertical vent pipes shown.
The mechanism of gas collection and disper-sion is accounted for by the low specificweight, compared to air, of the mix of gases,which is predominantly methane. When themixed gas reaches the vertical vent pipe, itrises, under the influence of gravity, thus creat-ing a decrease in pressure (partial vacuum)behind it. This lowered pressure draws gaseswithin the solid waste mass toward and into thevent pipe system. These gases rise up the ventpipe and out the 90º bend, as shown, and theprocess perpetuates itself.
In general, each state or solid waste author-ity issues guidelines and regulations regardingthe layout of the gas collection grid and the

406 Industrial Waste Treatment Handbook
Figure 9-4 Cross-section of a portion of a landfill cap shows portion of gas venting system.
number and spacing of vertical vents. Also, thecharacteristics of the industrial solid waste thatis landfilled must be taken into account whendesigning the system regarding how readily gascan move through it to be collected by the vent-ing system.
Stormwater ManagementThe objectives of stormwater management at alandfill site are to prevent runoff from contact-ing the landfilled waste material and to preventerosion. Stormwater management involves theuse of berms, grading, catch basins, a stormsewer system, and retention basins. Rip-rap-lined ditches and channels are also used for
stormwater management and erosion control,during active use of the landfill as well as afterclosure and capping of the landfill. There isalways a slope to the cap to prevent standingwater, as a minimum, but usually as the resultof placing the maximum possible amount ofwaste in the landfill.
Rip-rap-lined ditches and channels are usu-ally designed as an integral component of thefinal cover or cap for control of erosion. Deten-tion basins are used to hold collected stormwa-ter for a period to allow solids to settle outbefore discharge to the receiving water body.
Essentially all solid waste managementfacilities, including transfer stations, incinera-tors, compost facilities, and, certainly, landfills
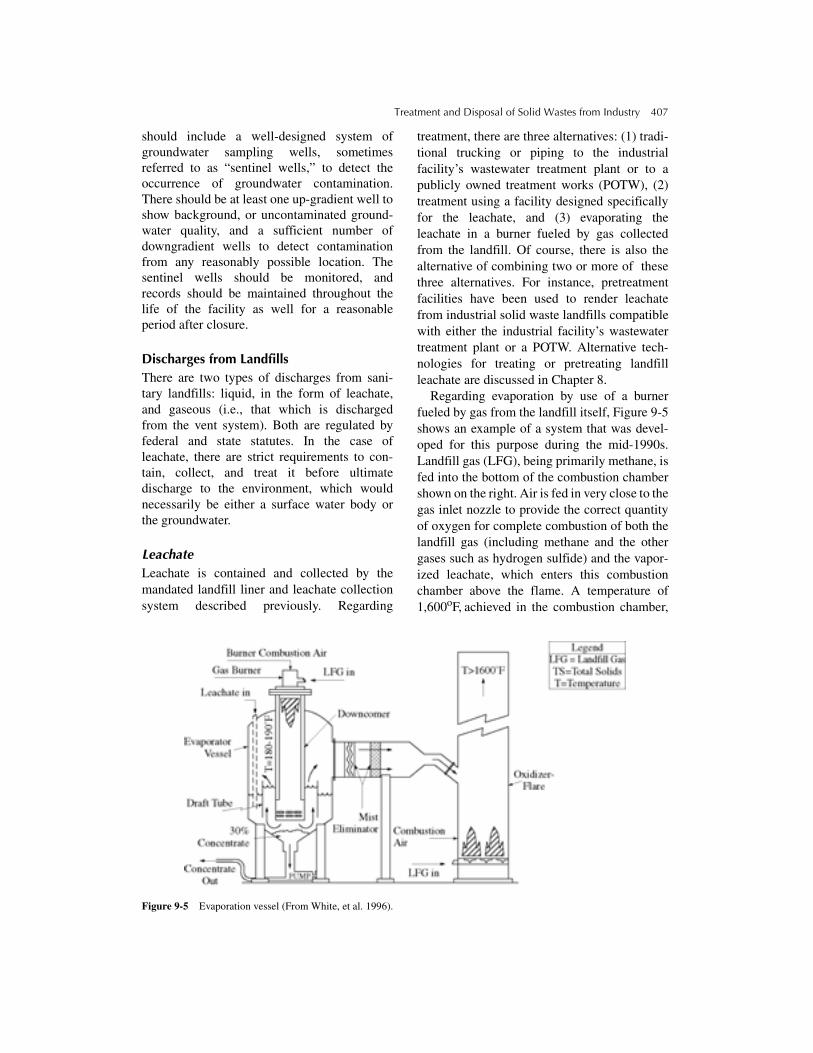
Treatment and Disposal of Solid Wastes from Industry 407
should include a well-designed system ofgroundwater sampling wells, sometimesreferred to as “sentinel wells,” to detect theoccurrence of groundwater contamination.There should be at least one up-gradient well toshow background, or uncontaminated ground-water quality, and a sufficient number ofdowngradient wells to detect contaminationfrom any reasonably possible location. Thesentinel wells should be monitored, andrecords should be maintained throughout thelife of the facility as well for a reasonableperiod after closure.
Discharges from LandfillsThere are two types of discharges from sani-tary landfills: liquid, in the form of leachate,and gaseous (i.e., that which is dischargedfrom the vent system). Both are regulated byfederal and state statutes. In the case ofleachate, there are strict requirements to con-tain, collect, and treat it before ultimatedischarge to the environment, which wouldnecessarily be either a surface water body orthe groundwater.
LeachateLeachate is contained and collected by themandated landfill liner and leachate collectionsystem described previously. Regarding
treatment, there are three alternatives: (1) tradi-tional trucking or piping to the industrialfacility’s wastewater treatment plant or to apublicly owned treatment works (POTW), (2)treatment using a facility designed specificallyfor the leachate, and (3) evaporating theleachate in a burner fueled by gas collectedfrom the landfill. Of course, there is also thealternative of combining two or more of thesethree alternatives. For instance, pretreatmentfacilities have been used to render leachatefrom industrial solid waste landfills compatiblewith either the industrial facility’s wastewatertreatment plant or a POTW. Alternative tech-nologies for treating or pretreating landfillleachate are discussed in Chapter 8.
Regarding evaporation by use of a burnerfueled by gas from the landfill itself, Figure 9-5shows an example of a system that was devel-oped for this purpose during the mid-1990s.Landfill gas (LFG), being primarily methane, isfed into the bottom of the combustion chambershown on the right. Air is fed in very close to thegas inlet nozzle to provide the correct quantityof oxygen for complete combustion of both thelandfill gas (including methane and the othergases such as hydrogen sulfide) and the vapor-ized leachate, which enters this combustionchamber above the flame. A temperature of1,600oF, achieved in the combustion chamber,
Figure 9-5 Evaporation vessel (From White, et al. 1996).

408 Industrial Waste Treatment Handbook
ensures complete destruction of VOCs or otherhazardous substances from either the landfillgas or the leachate.
The leachate is vaporized in the evaporationvessel shown on the left in Figure 9-5. Landfillgas enters the burner at the top of this vessel,and the hot gases from the burning of the LFGare directed down and into the leachate, whichenters the evaporation vessel just outside thedraft tube within the vessel. Evaporatedleachate, plus completely and incompletelyoxidized LFG, exit the liquid surface within thedraft tube, then proceed to the combustionchamber on the right. Those substances in theleachate that will not evaporate sink to the bot-tom of the evaporator vessel to form a concen-trate, reportedly amounting to less than 5% ofthe original leachate volume. This concentratemust be dealt with, and options include return-ing it to the landfill. In order to do this, how-ever, the restrictions and provisions of 40 CFR264.314 and 265.314 (solid waste regulations)must be complied with.
Landfill GasLandfill gas discharges are regulated by Subti-tle D (see Chapter 3) and the Clean Air Act toattempt to control so-called greenhouse gasemissions. Methane is 21 times more potent increating climate change than is carbon dioxide,on a carbon-to-carbon basis, according to the U.S. EPA. Moreover, it is the U.S. EPA’s esti-mate that 40% of the methane emitted to theatmosphere on a yearly basis is from active andclosed landfills. Consequently, the U.S. EPAhas been charged by Congress with enforcingcontrols on methane emissions from landfills.The result is an ever-increasing requirement forlandfill gas collection, with subsequent man-agement to minimize the effect on globalclimate change.
Gas collected from industrial waste landfillsusually requires a certain amount of cleaningbefore use as fuel in a boiler or other burner.Reasons for cleaning include the following:
• Limiting pollutants released to theatmosphere
• Removing corrosive substances
• Increasing the fuel value, in terms of BTUsper cubic foot
Additionally, to limit emissions of NOx andcarbon monoxide (CO), it may be necessary touse catalytic converters to remove these sub-stances from postcombustion gas, as well asother technologies to address VOCs, sulfurcompounds, and silicon-based compounds. Thelatter have been the source of problems withthe catalytic converters used to control emis-sions of NOx and CO.
Alternative LandfillsThe conventional modern landfill, withleachate containment, collection and treatment,and impermeable cap is referred to, afterclosing, as a “dry tomb.” The combination ofimpermeable cap, which prevents moisturefrom reaching the landfilled material via perco-lating precipitation, and the landfill linersystem, which carries away leachate resultingfrom the period when the landfill was active,ensures that the landfill interior will be dry fora long time. The dry conditions effectively pre-vent microbial activity. The advantage of thiscondition is that neither gas nor leachate is pro-duced within the landfill in significant quantity.The disadvantage is that the landfilled materialremains “entombed” for those many years.Although this may be a good thing regardingfuture recycle and reuse of some of the land-filled substances (or for future beings fromouter space to examine to reconstruct our civi-lization), there is a growing sentiment that, onbalance, the disadvantages outweigh theadvantages.
Probably the greatest disadvantage of the drytomb approach is that the closed landfillremains a potential threat to the groundwaterfor as long as it exists. Whenever the integrityof the cap and liner are breached, for whateverreason—earthquakes, tornadoes, accidents, orsimply the passage of enough time—water willreach the landfilled wastes and create leachate.
An alternative to the dry tomb approach is tomanage the closed landfill to encourage
Treatment and Disposal of Solid Wastes from Industry 409
microbial degradation of the landfilled material(i.e., manage the landfill as a biochemical/chemical reactor). One way to do this is to con-tinually recycle leachate back to the top of thelandfilled wastes, and to add water to theleachate to keep the moisture within the landfillat a level that results in maximum generation ofgas. Then, the option of collecting the gas foruse as fuel is available. The decision to managean industrial waste landfill as a biochemical/chemical reactor, possibly for the purpose ofgenerating gas for fuel as well as to address the“time bomb” problem where the landfill sits asa threat to groundwater pollution “in perpetu-ity,” must be based largely on the characteris-tics of the leachate. If hazardous substances arein hazardous concentrations in the leachate, thecost for proper (including legal) managementbecomes of overbearing importance.
Solid Waste Incineration
There are many different types of incinerators,and several different conventions are used toclassify them. One convention is to classifyincinerators as either “mass burn” or “refuse-derived fuel” (RDF). Mass burn technologyinvolves combusting, as completely as possible,all (combustible) substances in a solid wastestream. RDF systems attempt to separate, byvolatilization, as much of the organic portion ofa solid waste stream as possible, then to cleanand otherwise process the resulting mixture ofgases to produce a low-, medium-, or even high-grade fuel. The remaining portion of the solidwaste stream (char and ash) is then disposed ofor further processed, then disposed of.
Another convention used to classify inciner-ators (or “combustors”— the terms “incinera-tor” and “combustor” are used synonymously)is based on the equipment technology itself.The following is a list of incinerator technolo-gies in use:
• Fluidized bed
• Rotary kiln
• Hearth-type
• Liquid injection
Another convention is to classify incinera-tors as either “excess air” or “starved air,” andstill another is to classify incineration systemsas either “hazardous waste incinerators” or“conventional waste incinerators.”
Under any classification system, all incinera-tors (combustors) have the following character-istics in common:
• All solid waste substances must be con-verted to the vapor state before they can beignited and burned.
• Two types of ash leave the system: fly ash andbottom ash. Both must be managed to preventthem from becoming environmental pollu-tion problems. Incineration is therefore to beregarded as a treatment and volume reductionprocess, rather than as a disposal process.
• Solid wastes almost always have to be sub-jected to a conditioning process beforeentering the combustion chamber. Condi-tioning may include one or more ofgrinding, mixing, blending, dewatering, orother treatment.
Fluidized Bed TechnologyFluidized bed technology is considered to havehigh potential for treating industrial wastesbecause of the capability of complete combus-tion and history of relatively low air emissions.Fluidized bed combustion can be combinedwith recovery of heat; therefore, it has potentialas a viable waste-to-energy (WTE) alternative,depending on the overall BTU value and mois-ture content of the waste.
Fluidized bed incineration systems use a bedof sand or sandlike material that is fluidized (sus-pended against the force of gravity) by the dragforce of air and other gases rising up through thebed, as illustrated in Figures 9-6(a) and (b). Thebed is heated to incineration temperature, whichcan range from 650º to over 1,200ºC (1,200º to2,200ºF, or higher), depending on the character-istics of the waste. The heat content of thefluidized bed material, typically sand, is suchthat it provides a substantial heat reservoir tomaintain temperature and combustion as newwaste material is injected into the fluidized bed
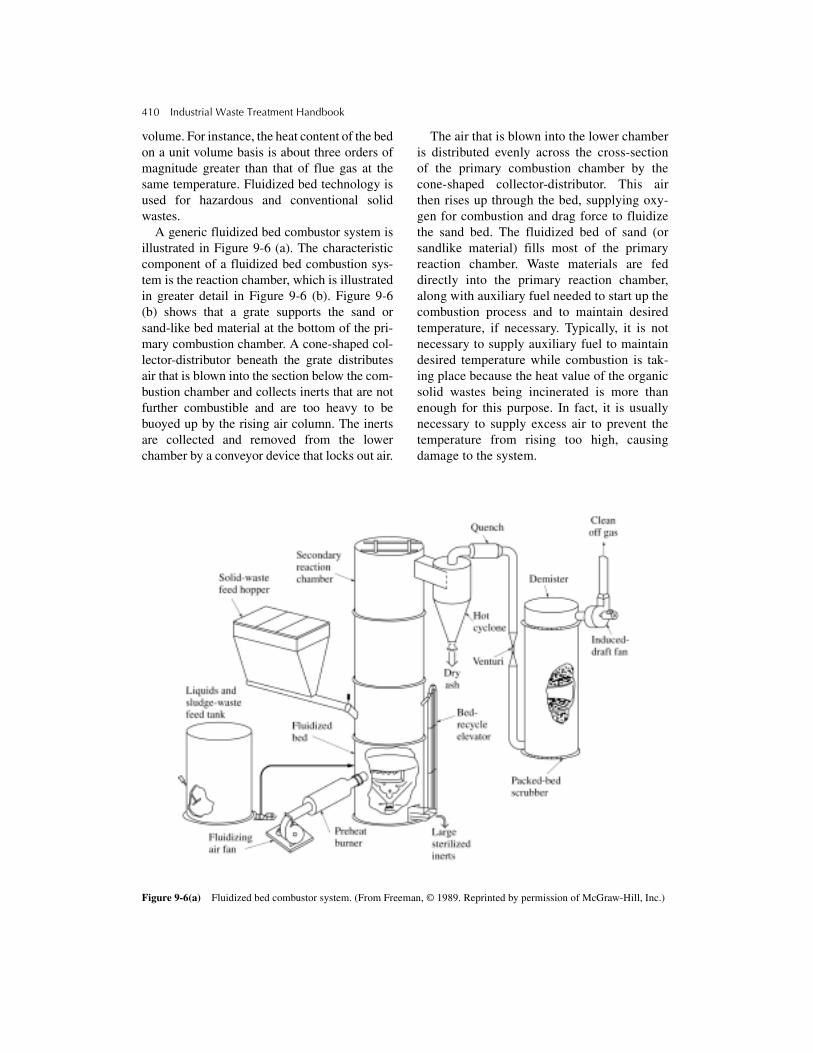
410 Industrial Waste Treatment Handbook
volume. For instance, the heat content of the bedon a unit volume basis is about three orders ofmagnitude greater than that of flue gas at thesame temperature. Fluidized bed technology isused for hazardous and conventional solidwastes.
A generic fluidized bed combustor system isillustrated in Figure 9-6 (a). The characteristiccomponent of a fluidized bed combustion sys-tem is the reaction chamber, which is illustratedin greater detail in Figure 9-6 (b). Figure 9-6(b) shows that a grate supports the sand orsand-like bed material at the bottom of the pri-mary combustion chamber. A cone-shaped col-lector-distributor beneath the grate distributesair that is blown into the section below the com-bustion chamber and collects inerts that are notfurther combustible and are too heavy to bebuoyed up by the rising air column. The inertsare collected and removed from the lowerchamber by a conveyor device that locks out air.
The air that is blown into the lower chamberis distributed evenly across the cross-sectionof the primary combustion chamber by thecone-shaped collector-distributor. This airthen rises up through the bed, supplying oxy-gen for combustion and drag force to fluidizethe sand bed. The fluidized bed of sand (orsandlike material) fills most of the primaryreaction chamber. Waste materials are feddirectly into the primary reaction chamber,along with auxiliary fuel needed to start up thecombustion process and to maintain desiredtemperature, if necessary. Typically, it is notnecessary to supply auxiliary fuel to maintaindesired temperature while combustion is tak-ing place because the heat value of the organicsolid wastes being incinerated is more thanenough for this purpose. In fact, it is usuallynecessary to supply excess air to prevent thetemperature from rising too high, causingdamage to the system.
Figure 9-6(a) Fluidized bed combustor system. (From Freeman, © 1989. Reprinted by permission of McGraw-Hill, Inc.)
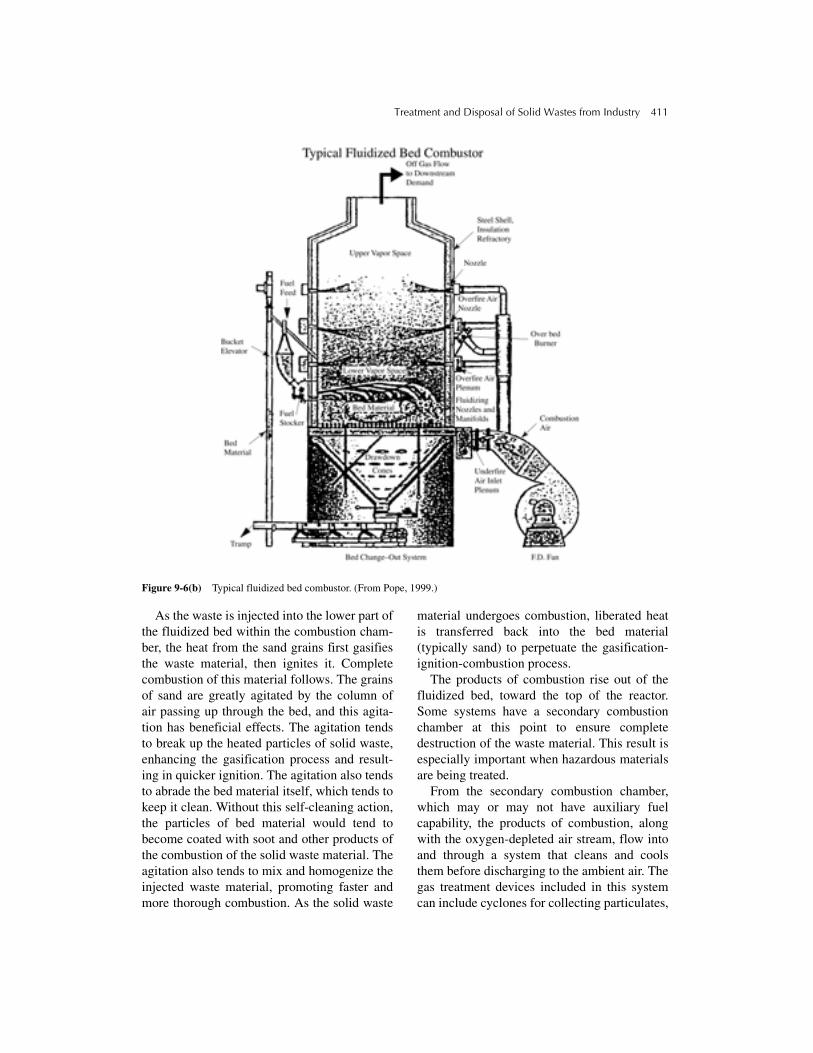
Treatment and Disposal of Solid Wastes from Industry 411
Figure 9-6(b) Typical fluidized bed combustor. (From Pope, 1999.)
As the waste is injected into the lower part ofthe fluidized bed within the combustion cham-ber, the heat from the sand grains first gasifiesthe waste material, then ignites it. Completecombustion of this material follows. The grainsof sand are greatly agitated by the column ofair passing up through the bed, and this agita-tion has beneficial effects. The agitation tendsto break up the heated particles of solid waste,enhancing the gasification process and result-ing in quicker ignition. The agitation also tendsto abrade the bed material itself, which tends tokeep it clean. Without this self-cleaning action,the particles of bed material would tend tobecome coated with soot and other products ofthe combustion of the solid waste material. Theagitation also tends to mix and homogenize theinjected waste material, promoting faster andmore thorough combustion. As the solid waste
material undergoes combustion, liberated heatis transferred back into the bed material(typically sand) to perpetuate the gasification-ignition-combustion process.
The products of combustion rise out of thefluidized bed, toward the top of the reactor.Some systems have a secondary combustionchamber at this point to ensure completedestruction of the waste material. This result isespecially important when hazardous materialsare being treated.
From the secondary combustion chamber,which may or may not have auxiliary fuelcapability, the products of combustion, alongwith the oxygen-depleted air stream, flow intoand through a system that cleans and coolsthem before discharging to the ambient air. Thegas treatment devices included in this systemcan include cyclones for collecting particulates,

412 Industrial Waste Treatment Handbook
heat exchangers or quenchers to lower thetemperature, one or more packed columnscrubbers, activated carbon adsorbers, venturiscrubbers, or other devices. Chapter 10 pre-sents discussions regarding the mechanismsand uses of these air pollution control devices.
Fluidized bed reactors are used in somewaste-to-energy (WTE) systems. In these sys-tems, typically only gasification takes place inthe fluidized bed reactor. The volatilizedorganic substances from this process are eitherburned immediately in a boiler or other energyconversion device, or are captured and storedfor later use. In some cases, the volatilizedproduct (gases) from the fluidized bed reactorare processed to remove substances thatdegrade the fuel value; in other cases, othersubstances of highest fuel value are removedas a valuable by-product. The remaining sub-stances are then burned as a lower-grade fuel.
Advantages
Many years of development and operatingexperience with fluidized bed combustors haveresulted in the following advantages, comparedto other combustion systems for treating solidwastes from industries:
• Air emissions are relatively low, comparedto other incineration systems.
• Generation of nitrogen oxides (NOx) tendsto be significantly less because of lowerexcess air and lower temperatures.
• Carbon monoxide (CO) emissions are lowbecause of relatively quick and relativelycomplete combustion.
• Solids, liquids, and gases can all be burnedsimultaneously.
• Few moving parts are used.
• Maintenance costs are relatively low.
• Large surface area of bed grains and wasteparticles enhances the gasification-ignition-combustion process.
• Large heat capacity of bed tolerates fluctua-tions in solid waste feed rate.
• Size of facility is relatively small.
• High degree of agitation in combustionchamber practically eliminates hot spots andcold spots.
Disadvantages
• Has a low tolerance for items, such as wire,which get stuck in the grate.
• Substances that tend to agglomerate canplug up the sand bed.
• Inerts are difficult to remove from thebed if they are not sufficiently heavy tofall through the grate against the airupflow.
Rotary Kiln TechnologyRotary kilns use an inclined cylinder as thecombustion chamber, which rotates slowly toaccomplish mixing of the materials and toattempt to expose all surfaces and substances tooxygen within the chamber. Auxiliary fuel,mixed with air, can be injected into either endof the rotating combustion chamber, or at oneor more injection nozzles along the side.Rotary kilns have been successfully used totreat hazardous and conventional wastes, solid,semisolid sludges and liquids, either alone orsimultaneously, and have been operated at tem-peratures as high as 1,500oC (3,000oF). Manyrotary kiln combustors have been used to incin-erate hazardous materials at temperatures in the1,100oC (2,000oF) degree range.
As with all incinerator technologies, resi-dence time, temperature, and quantity of oxy-gen made available are important parameters.Among other factors, residence time is influ-enced by the angle of incline, or slope, of therotating combustion chamber, and the rate ofrotation. The slope typically ranges from 0.02ft/ft to 0.04 ft/ft. Speed of rotation ranges from0.5 revolutions per minute (rpm) to 3 rpm. Fig-ures 9-7(a)–(f) illustrate characteristics of therotating combustion chamber. Figure 9-8 illus-trates a typical rotary kiln solid waste incinera-tor system.
Figures 9-7(a)–(f) show that the conditionedsolid waste is fed into the higher end of the

Treatment and Disposal of Solid Wastes from Industry 413
Figure 9-7(a) Elements of a rotary kiln incinerator—axial movement through the reactor. (From Freeman, © 1989.Reprinted by permission of McGraw-Hill, Inc.)
Figure 9-7(b) Elements of a rotary kiln incinerator—the kiln solids flow system—definition of terms. (From Freeman, ©1989. Reprinted by permission of McGraw-Hill, Inc.)
Figure 9-7(c) Elements of a rotary kiln incinerator—ported-kiln concept. (From Freeman, © 1989. Reprinted by permis-sion of McGraw-Hill, Inc.)
Axial movement through the reactor.
The slope of the kiln produces a slight forward movement toward the discharge end.
• FEED RATE• BULK DENSITY• REPOSE ANGLE
• DISCHARGE RATE• BULK DENSITY• REPOSE ANGLE
MATERIAL OUT
MATERIAL IN
SIDE VIEW
CROSS SECTION KILNROTATION
AREA OF BEDTOTAL AREA OF KILN SECTION
LOAD FRACTION = % LOADING =
• DIAMETER• LENGTH• SLOPE S• RPM• MATERIAL CHARACTERISTICS
REACTOR OR KILN
S
= BED ANGLE = DYNAMIC ANGLE OF REPOSEh = BED HEIGHT = BED WIDTH
ψ
ω
h
ωψ
KILN LENGTHTE
MPE
RA
TU
RE
SOLIDFUEL
AIR OFF
AIR ON
SOLID FUEL

414 Industrial Waste Treatment Handbook
Figure 9-7(d) Elements of a rotary kiln incinerator—solids flow in cross section. (From Freeman, © 1989. Reprinted bypermission of McGraw-Hill, Inc.)
Figure 9-7(e) Elements of a rotary kiln incinerator—primary-burner concept. (From Freeman, © 1989. Reprinted by per-mission of McGraw-Hill, Inc.)
Figure 9-7(f) Elements of a rotary kiln incinerator—axial-burner concept. (From Freeman, © 1989. Reprinted by permis-sion of McGraw-Hill, Inc.)
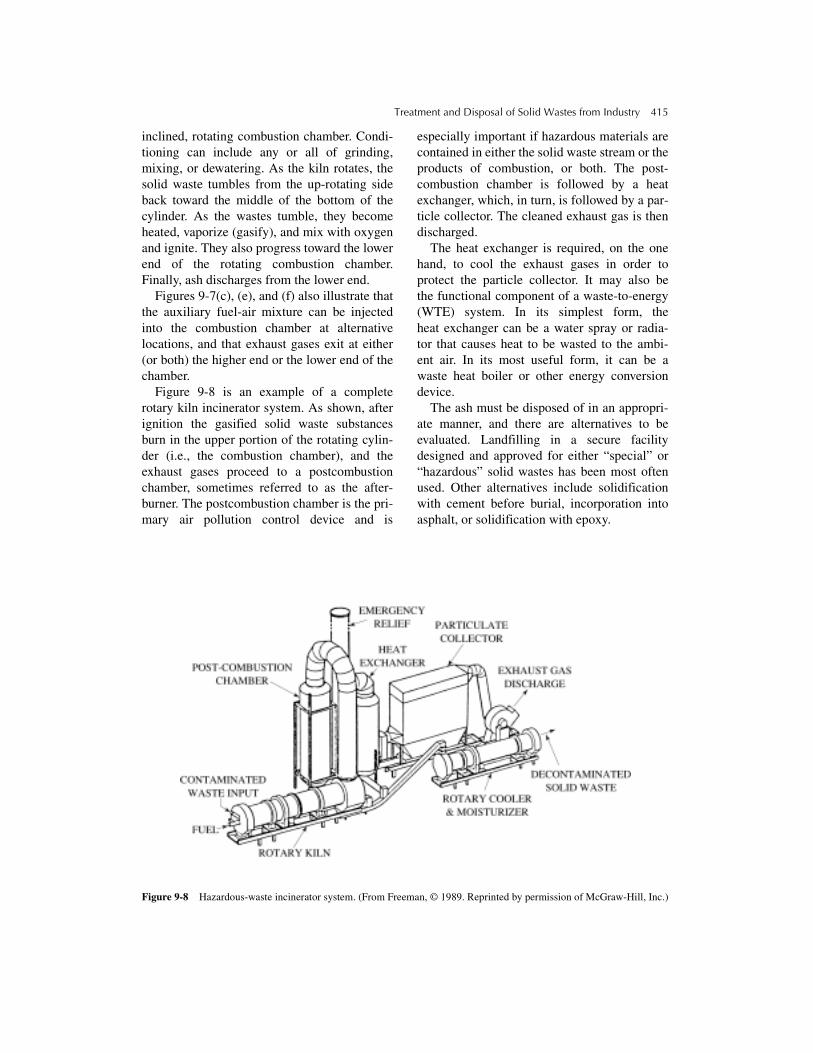
Treatment and Disposal of Solid Wastes from Industry 415
inclined, rotating combustion chamber. Condi-tioning can include any or all of grinding,mixing, or dewatering. As the kiln rotates, thesolid waste tumbles from the up-rotating sideback toward the middle of the bottom of thecylinder. As the wastes tumble, they becomeheated, vaporize (gasify), and mix with oxygenand ignite. They also progress toward the lowerend of the rotating combustion chamber.Finally, ash discharges from the lower end.
Figures 9-7(c), (e), and (f) also illustrate thatthe auxiliary fuel-air mixture can be injectedinto the combustion chamber at alternativelocations, and that exhaust gases exit at either(or both) the higher end or the lower end of thechamber.
Figure 9-8 is an example of a completerotary kiln incinerator system. As shown, afterignition the gasified solid waste substancesburn in the upper portion of the rotating cylin-der (i.e., the combustion chamber), and theexhaust gases proceed to a postcombustionchamber, sometimes referred to as the after-burner. The postcombustion chamber is the pri-mary air pollution control device and is
especially important if hazardous materials arecontained in either the solid waste stream or theproducts of combustion, or both. The post-combustion chamber is followed by a heatexchanger, which, in turn, is followed by a par-ticle collector. The cleaned exhaust gas is thendischarged.
The heat exchanger is required, on the onehand, to cool the exhaust gases in order toprotect the particle collector. It may also bethe functional component of a waste-to-energy(WTE) system. In its simplest form, theheat exchanger can be a water spray or radia-tor that causes heat to be wasted to the ambi-ent air. In its most useful form, it can be awaste heat boiler or other energy conversiondevice.
The ash must be disposed of in an appropri-ate manner, and there are alternatives to beevaluated. Landfilling in a secure facilitydesigned and approved for either “special” or“hazardous” solid wastes has been most oftenused. Other alternatives include solidificationwith cement before burial, incorporation intoasphalt, or solidification with epoxy.
Figure 9-8 Hazardous-waste incinerator system. (From Freeman, © 1989. Reprinted by permission of McGraw-Hill, Inc.)

416 Industrial Waste Treatment Handbook
Advantages
• The technology is proven, having been usedfor incineration of many different industrialwastes over many years.
• Operation is flexible because the rate ofrotation can be varied to suit the needs of alarge variety of solid waste characteristics.
• Has been used to incinerate solids, liquids,and gases, in any combination.
• Requires less preparation (conditioning),such as sorting, grinding, and mixing, thancertain other technologies.
• Not subject to problems such as plugging ofgrates, or from substances melting beforegasification.
• Adaptable to many alternatives for air emis-sion control, including quenchers, venturiscrubbers, wet gas scrubbers, electrostaticprecipitators, and bag houses.
• Provides mixing within the combustionchamber for exposure to heat and oxygen.
• Can receive bulk containers in the feedstream.
Disadvantages
• Subject to formation of hot spots and coldspots.
• High load of particulates on air pollutioncontrol devices.
• Relatively high capital cost.
• High amounts of excess air lead to highdemand for auxiliary fuel.
• Subject to damage to refractory lining ofkiln due to tumbling solids.
Hearth Incinerator Technologies
Hearth incinerators are mass-burn systems inwhich conditioned solid waste materials arespread out on a (nearly) horizontal surface andburned. Auxiliary fuel is used for start-up andas necessary to maintain desired temperatures.In many cases, excess air is used to maintain
desired temperatures. In these situations, theexcess air prevents the burning solid wastesfrom developing excessively high temperaturesthat would damage the combustion chamberand downstream equipment.
The most common type of hearth incineratoris the multiple-hearth incinerator, illustrated inFigure 9-9. The multiple-hearth incinerator sys-tem shown in Figure 9-9 has five hearths,stacked vertically. New, conditioned solid wasteis fed onto the uppermost hearth, where hotgases from materials burning on lower hearthsheat the new material, and volatilize water andthe most volatile of the organic materials in thesolid waste stream. A system of rakes slowlyforces the wastes toward the middle of theuppermost hearth and down through a passage-way to the next lower hearth. The temperatureon this hearth is much higher, and active com-bustion takes place. The rake system forcesburning wastes on this hearth toward the out-side, then down onto the next lower hearth, andso on, until the residual ash is raked from thelowest hearth to a collection and transportdevice that removes the ash from the combus-tion chamber.
As the solid wastes burn on the middlehearths, the gaseous products of combustionflow up to heat materials on the hearths above.Then they exit the combustion chamber andpass through one or more devices to either fin-ish off combustion, especially of toxic or other-wise hazardous substances, or to clean theexhaust gas stream of other emissions such asparticulates, SOx, malodorous gases, or othersubstances. In the case of completing the com-bustion process, a secondary combustionchamber (or postcombustion chamber or after-burner) with its own fans and auxiliary fuelsystem can be used. In the case of cleaning theexhaust gases before release to the ambient air,alternative processes include a quenching sys-tem to cool the exhaust gases to prevent dam-age to particulate collection devices, theparticulate collection devices themselves, elec-trostatic precipitators, and various types of wetscrubbers.
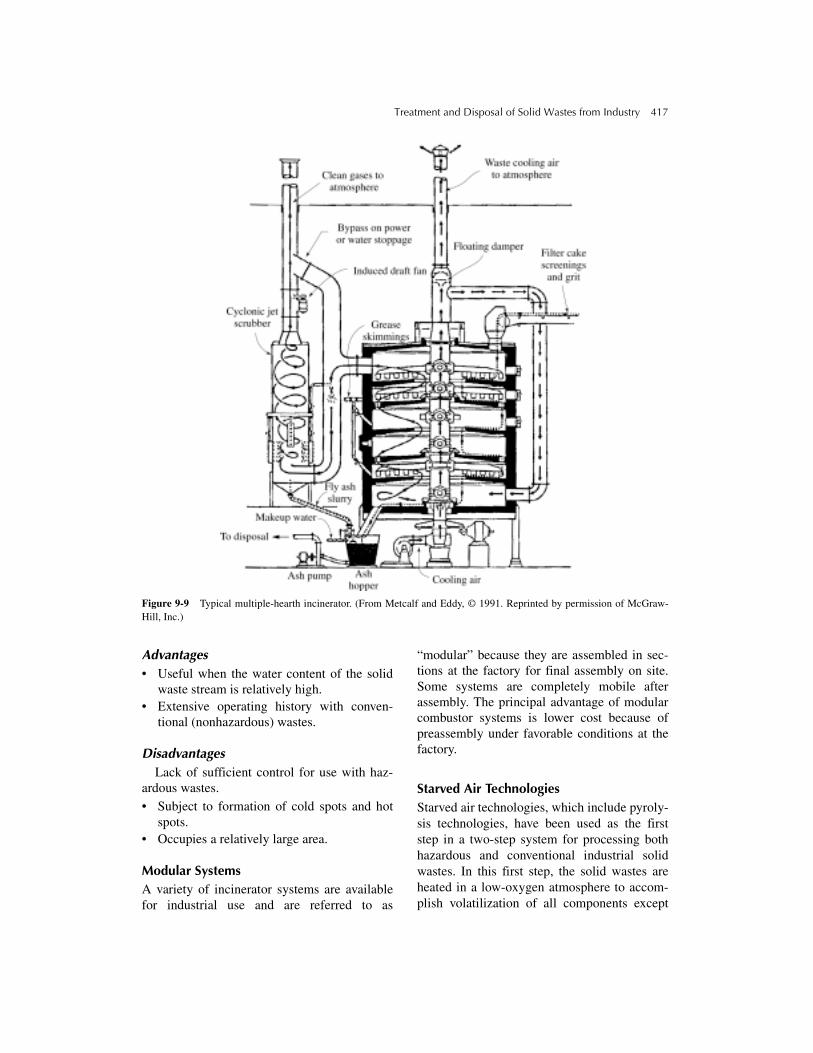
Treatment and Disposal of Solid Wastes from Industry 417
Figure 9-9 Typical multiple-hearth incinerator. (From Metcalf and Eddy, © 1991. Reprinted by permission of McGraw-Hill, Inc.)
Advantages• Useful when the water content of the solid
waste stream is relatively high.• Extensive operating history with conven-
tional (nonhazardous) wastes.
DisadvantagesLack of sufficient control for use with haz-
ardous wastes.• Subject to formation of cold spots and hot
spots.• Occupies a relatively large area.
Modular SystemsA variety of incinerator systems are availablefor industrial use and are referred to as
“modular” because they are assembled in sec-tions at the factory for final assembly on site.Some systems are completely mobile afterassembly. The principal advantage of modularcombustor systems is lower cost because ofpreassembly under favorable conditions at thefactory.
Starved Air TechnologiesStarved air technologies, which include pyroly-sis technologies, have been used as the firststep in a two-step system for processing bothhazardous and conventional industrial solidwastes. In this first step, the solid wastes areheated in a low-oxygen atmosphere to accom-plish volatilization of all components except

418 Industrial Waste Treatment Handbook
char and ash. Then, the volatilized material isburned as in a conventional incinerator. Atsome facilities, the volatilized substances areprocessed to recover one or more componentsbefore the rest is incinerated. The volatilizationprocess is carried out at significantly lowertemperatures than are used for more conven-tional incineration technologies, with theadvantage that equipment life is prolonged andmaintenance costs are lower. More important inthe case of hazardous materials, however, is thefact that the incineration step can be carried outunder very precisely controlled conditionsbecause only gases are being handled in thecombustor phase of the system.
The generally accepted definition of pyroly-sis is chemical decomposition by heating inthe absence of oxygen. Some of the starved airindustrial waste treatment systems do not fitthis definition because they are carried out inatmospheres of up to 2% oxygen by volume(compared to 21% in ambient air); however,some systems in operation are called pyrolysissystems, even though “gasification,” or simply“starved air,” would be more appropriate.
Figure 9-10 is an example of a solid wastestarved air system. In Figure 9-10, the condi-tioned, wet solid wastes enter the dryer,which uses recovered heat from the combus-tion of waste materials downstream in thesame system. The dryer solid wastes arestored for a period (one day, or so), then arefed into the gasification chamber, which ismaintained within a temperature range of425º to 750ºC (800º to 1,400ºF). Residencetimes within the gasification chamber dependon the characteristics of the material in thewaste stream. For instance, chemical makeupand particle size, as well as bed thickness, allhave a significant effect on residence, time.Typical residence times are as short as 2 min-utes and as long as 5 hours. The concentra-tion of oxygen in the gasification chamber ismaintained near zero. Gasification chambersare maintained under slightly negative pres-sure to prevent release of fugitive gasses.
After completing the required residencetime in the gasification chamber, the nonvola-tilized solids (char and ash) are removed andeither further processed or landfilled. Further
Figure 9-10 Battell gasification process. (From Niessen, 1996.)
Gasifier
Waste HeatRecovery
Ash
Combustor
AirCondensedOrganicsInert Gas
System
DailyStorage
Dryer
Wet FeedMaterial
Steam or Recycled Product Gas
Wastewater
SandMake-
up
CycloneSeparators
SurgeTanks
CoolingWater
AshRecoveryCyclone
Medium ProductGas Btu
Product HeatRecovery
Baghouse
Scrubber

Treatment and Disposal of Solid Wastes from Industry 419
processing can be by high-temperature inciner-ation (to further burn the char), solidificationand stabilization using lime, cement, epoxy,asphalt, or another substance, chemical oxida-tion, or another process. The volatilizedmaterial can proceed to incineration in a one-or two-stage combustor, or, preferably, to acleaning and conditioning process for prepar-ing a fuel of reasonably high value. This fuelcan be burned on site or off site in a gas engine,or it can be used in a gas turbine to generateelectricity, or burned in a boiler to generateheat or steam to generate electricity. In the caseof the system illustrated in Figure 9-10, theheat given off by the combusting volatilizedgas stream is recovered and used to dry incom-ing solid wastes as the first step in the system.
It is also possible to separate by condensa-tion, and thus recover, certain components ofthe volatilized gas stream. Some of thesesubstances have considerable value, represent-ing a source of cost recovery for the system asa whole.
Another significant advantage of the starvedair process is that it results in a char or ash thatis concentrated in potentially valuable nonvola-tile substances such as metals. For instance,solid waste streams that contain a significantquantity of lead and/or zinc can cause problemsin conventional combustors because at normalincinerator temperatures lead and zinc, and cer-tain other substances can volatilize and causefouling of heat exchangers and spalling of therefractory linings of the combustion chamber.
Advantages
• The volatilized gas stream can be used asfuel for engines, turbines, or for burning.
• Valuable substances such as lead and zinc canbe recovered from the char and ash residue.
• The vapor stream can be processed torecover substances of value.
• Lower temperatures lead to longer equip-ment life and lower maintenance costs.
• Process control is relatively easy becausethe gasification process is endothermic.There is no danger of self-overheating.
Disadvantages
• One disadvantage of starved air technolo-gies is that the process takes place in areducing atmosphere, with the result that theproducts are highly corrosive. Therefore, thematerials of construction are relativelyexpensive.
• In the case of certain solid waste streams,highly toxic, and in some cases carcino-genic, substances are generated. Thisproblem sometimes requires constructionand operation of very highly reliable andeffective volatilized gas stream incineration.
Design ConsiderationsThere are choices to make regarding the tech-nology to employ for the gasification step aswell as the subsequent processing and ultimatedisposal of the volatilized gas stream and thesolid residuals. The gasification step can beaccomplished in any of several furnace types,including:
• Rotary kiln
• Rotary hearth
• Roller hearth
• Car bottom
Rotary KilnThe rotary kiln reactor for carrying out the
gasification step is essentially the same as wasdiscussed previously for the rotary kilncombustor. Differences include provision toexclude oxygen from the gasification furnace,and different materials of construction becauseof the oxidative environment in the combustorfurnace versus the reducing environment in thegasification furnace. Also, auxiliary fuel mustalways be used in the gasification furnacebecause of the endothermic nature of the pro-cess, whereas provision must be made to sup-ply and control excess air for cooling in thecase of the combustor furnace.
Rotary HearthA typical rotary hearth reactor, illustrated in
Figure 9-11, consists of a doughnut-shaped

420 Industrial Waste Treatment Handbook
hearth that rotates through a stationary heatedgasification chamber. Industrial solid wastes,conditioned as needed, are fed onto the contin-uously rotating hearth ahead of the heatedchamber. As the waste enters the heated cham-ber, the pyrolysis process begins, and continuesafter the wastes leave the heated chamber.Vaporized organics and other gaseous sub-stances are continuously extracted from the topof the enclosure that covers the entire hearth,and proceed to the next step, which, in theexample shown in Figure 9-11, is a reactor thatconditions and ultimately uses the fumes forfuel to fire the waste heat boiler.
Roller HearthThe roller hearth gasification system is used
by individual industries and by centralizedhazardous waste processors to gasify hazard-ous wastes that are brought to the facility incontainers such as 55-gallon steel drums. Thecontainers are opened at the top, usually byremoving the top, and the containers are fed,upright so as not to spill the contents, into theheated chamber. Rollers cover the bottom ofthe heated chamber and allow the open drums
to be pushed along through the heated cham-ber from the entrance to the exit. In somecases, the rollers are motorized such that theypropel the containers through the heatedchamber.
As the containers pass through the heatedchamber, the target substances in those contain-ers volatilize, or “gasify,” char and ash remain-ing in the containers. The vapors are collected,processed, and stored, then used as either fuel oras a source of mixed substances, mostly organic,from which to recover certain substances ofvalue. The remainder is either incinerated, or, ifpossible, used as a (lower grade) fuel.
Car BottomCar bottom gasification furnaces are small,
two-part systems. One part is a mobile “car,”on wheels, on which containerized wastes,often of a hazardous nature, are placed. The caris then rolled into the second part, which is afurnace without a bottom. The car becomes thebottom of the furnace. After the car and the fur-nace have been joined to form the completefurnace, the furnace is heated, and the gasifica-tion process takes place.
Figure 9-11 Rotary-hearth pyrolyzer. (From Freeman, © 1989. Reprinted by permission of McGraw-Hill, Inc.)

Treatment and Disposal of Solid Wastes from Industry 421
As fumes exit the containers, which areoften 55-gallon drums, they are collected,then are usually combusted as a means of dis-posal in a furnace of higher temperature. Thechar and ash that remain in the bottom of thecontainers can then be processed to recovercertain substances. The remaining char andash must then be disposed of using appropri-ate means, which might include incinerating(the char) in a combustor of high tempera-ture, landfilling in an appropriate landfill, orsolidification.
Car bottom gasification technology is nor-mally operated on a batch basis. The advan-tage, as with many other batch technologies, isthat the residence time, or time allowed for thegasification process to take place, can beextended for as long as needed for the processto go to completion.
Two incinerator technologies are in wide usein the United States, being used for treatment(volume reduction and characteristic transfor-mation) of two classifications of solid wastes.The two incinerator technologies are hearthincinerators and rotary kiln incinerators.The two classifications of solid wastes are
hazardous and conventional. Of all incineratorsin use for all purposes, those that are based onliquid-injection technology account for abouthalf, but they are not of use for incineratingsolid wastes.
Generally, incinerators for hazardous materi-als are required to maintain significantly highertemperatures in the combustion chamber thanare incinerators for conventional wastes. Forthis reason, hazardous waste incinerators arerequired to be built using more expensive mate-rials and techniques.
The Process of Composting Industrial WastesSome industrial solid wastes are amenable tocomposting as a treatment process to preparethe waste for future use as a soil conditioner.Typically, these solid wastes are close to 100%organic in composition, are readily biodegrad-able, contain no hazardous materials, contain amoderate amount of moisture, and can be han-dled with conventional equipment such as frontend loaders and belt conveyors. The basic com-posting process is illustrated schematically inFigure 9-12.
Figure 9-12 Basic composting process.

422 Industrial Waste Treatment Handbook
As illustrated in Figure 9-12, microorgan-isms use the organic material within a pile ofmixed solid wastes for food. Initially, the tem-perature is close to the temperature of theambient air, and oxygen is present in the airthat occupies the void spaces between the solidwaste materials. Also, there must be enoughmoisture present for the microorganisms to livein. Bacteria can live only in an aqueous envi-ronment and can metabolize only substancesthat are dissolved in water. As the bacteria andother microorganisms metabolize the food thatis dissolved in the moisture content of the com-post pile, heat is generated. The source of theheat is as follows: As the microorganisms dis-assemble the proteins, carbohydrates, lipids,and other materials that make up the solidwastes in the compost pile, energy from thebreaking of chemical bonds is liberated. Themicroorganisms use some of this liberatedenergy to reassemble atomic and molecularparts and pieces into new cell protoplasm andother materials to make new cells (i.e. growth),but the process is less than 100% efficient, andthe leftover energy is lost as heat. As heat isgenerated, the temperature rises. During theincreasing temperature phase, a continual natu-ral selection process favors those microorgan-isms that thrive at higher temperatures, andthen, as the temperature rises more, still othermicroorganisms are favored that thrive at stillhigher temperatures, and so on, until the rangeof thermophilic microorganisms is reached, atabout 70oC. The composting mass stays atabout this temperature because heat is now lostabout as fast as it is generated.
Regarding the fact that microorganisms can-not ingest “food” unless it is dissolved in water,the reason composting of solid wastes proceedssuccessfully is because of the ability of somemicroorganisms to produce “exoenzymes”(enzymes that are manufactured inside themicroorganism, but are then sent outside, intothe aqueous environment) that can attackundissolved organic solids and cause them todissolve into the water, in parts and pieces.This relatively slow process continues until allof the solid substances have been “disassem-bled and dissolved,” with the exception of that
fraction of the original solid waste mass that isresistant to biodegradation, which is called“humus.”
All of the foregoing processes can, and will,take place naturally; no management isrequired. However, if too much moisture evap-orates and is lost from the system, the microor-ganisms are unable to live, and the process isarrested. If there is too much moisture, waterfills the void spaces between solid waste mate-rials, the dissolved oxygen in the water is soondepleted by the respiring microorganisms, andthe system becomes anoxic or anaerobic. If thesystem becomes anoxic or anaerobic, the tem-perature will not rise to the thermophilic range,bad odors will be created, and the microbialdegradation process will be very slow. Forthese reasons and others, a successful processfor treating solid wastes from industries by useof the composting process to achieve volumereduction, chemical and biochemical stability,and an end product that can be safely and bene-ficially “disposed of” requires a high degree ofmanagement.
Regarding the temperature within the com-posting mass, there are two major benefits toachieving and maintaining the thermophilicrange (about 70oC). The first is that microbialdegradation takes place very fast. In general,the rate of microbial metabolism doubles foreach 10oC rise in temperature. The benefit tosolid waste treatment, of course, is a shortertime required to reach a stable condition.Organic material that has been biologically sta-bilized will not undergo further significant bio-degradation and will, therefore, not become anodor or other nuisance or health problem. Thesecond major benefit of achieving and main-taining the thermophilic range for a significantperiod is that pathogenic organisms, includingbacteria and viruses, are killed. This is espe-cially important if human wastes, usually in theform of sludge from wastewater treatmentfacilities, are included in the mix of solidwastes. In the context of treating solid wastesfrom industries, this ability to kill pathogensmay or may not have value. What is always ofvalue, however, is the ability of the compostingprocess to produce a stable, inoffensive, useful

Treatment and Disposal of Solid Wastes from Industry 423
product from a putrescible material that isinherently a disposal problem. Because sludgefrom industrial wastewater treatment systems isone of the industrial waste candidates for treat-ment by composting, and because toilet wastesmay be treated along with processing wastewa-ters at a given industrial plant, the ability to killpathogens obviously has value in some indus-trial situations.
It is often beneficial to mix fresh solidwastes with a bulking agent, such as woodchips, at the start of the composting process.The bulking agent does not necessarily becomeinvolved in the composting process itself; thatis, the bulking agent does not necessarilyundergo biological degradation. Rather, thebulking agent helps provide spaces for air toreside, and thus provide oxygen for microbialrespiration. A bulking agent also provideschannels for air to move from outside thecomposting mass to the inner spaces whereoxygen is being depleted. In some cases, fullycomposted product from the process is used.When an agent other than the compost itself isused for bulking, it may or may not be sepa-rated from the finished product for reuse.Sometimes it is left in the composted productto enhance the desirability and value of theproduct for certain uses. In other cases it is sep-arated from the final product by screening,stored, then used again with new batches ofsolid wastes.
Because of the continual depletion of oxy-gen, it is necessary to continually renew theoxygen supply by providing fresh air to theentire composting mass. This is accomplishedby either turning and fluffing up the compost-ing mass periodically or by blowing or drawingair through it. Also, if the moisture contentbecomes too low because of evaporation, it isnecessary to add more moisture by spraying orother means.
It is important to maintain the oxygen con-tent in the void spaces within the compostingmass between 5% and 15% by volume(compared to about 21% in ambient air). Lessthan 5% will possibly allow local pockets ofanaerobic or anoxic conditions to develop,leading to an odor problem. More than 15% is
indicative of overaeration, with consequentinability of developing temperatures into thethermophilic range.
Moisture content must also be maintainedwithin a favorable range, but that range is wastespecific and is best determined through experi-ence. The proper procedure is to first conductbench scale laboratory tests, followed by a pilotscale program. Once an optimal range of mois-ture is determined by these studies, the initialcompost process is set up, then observedclosely and compared to the pilot scale results.The objective is to reach thermophilic tempera-tures within a few days and to achieve com-plete composting within 14 to 28 days.
In some cases, it is good practice, and inother cases, it is absolutely necessary, to grindthe solid waste material before composting.Grinding has the beneficial effects of greatlyincreasing the surface area of the organicsubstances, thus enhancing the compostingprocess, and renders the material more easilymixed with the bulking agent. Grinding alsoproduces more uniform moisture contentthroughout the solid waste material. Mechani-cal grinders for this purpose are available fromseveral vendors.
Three general technologies are used in theUnited States for composting: windrow, staticpile, and mechanical. Windrow compostingtypically uses a very large, specialized mobilemachine that straddles a windrow of compost-ing solid wastes and works it over by fluffingand turning the windrow. Static pile technologyalso typically uses a windrow or other type ofpile and uses a blower to either maintain a par-tial vacuum within the pile to cause air to flowfrom the ambient air into the pile, or to blow airout through the pile.
Windrow Composting TechnologySolid wastes to be composted by the windrowmethod are first mixed to produce a reasonablyuniform composition so that the time requiredfor complete composting is close to the samethroughout the windrow. In some cases, agrinding procedure, using specially made solidwaste grinders, either precedes or follows the

424 Industrial Waste Treatment Handbook
mixing procedure. Next, the mixture is pro-cessed to adjust the moisture content to thedesired range, then, typically, mixed thoroughlywith a bulking agent such as wood chips or pre-viously composted material. The next step is toarrange the mixture in a windrow using a front-end loader or other machinery. The windrowsare 5 to 7 feet high and are 10 to 20 feet wide atthe base. Figure 9-13 is an illustration of typicalwindrow dimensions. About once per day or, insome cases, more often, the windrow machinetravels the length of the windrows and mechan-ically works over the composting material and,in some cases, blows air into it. The objective ofworking over, or turning, the composting mate-rial is to expose new portions of the mass to theopen air, thus renewing the oxygen supply. Asexplained previously, it is necessary to maintainan average oxygen concentration in the voidspaces of 5% to 15% by volume (compared to21% in ambient air) within the compostingmass to prevent odor problems and to enablethe composting mass to maintain temperaturein the thermophilic range. Figure 9-14 illus-trates a windrow machine.
A large compost facility in Puyallup, Wash-ington, has modified the windrow turning
machine to include a 10,000-gallon water tankfor adjusting the moisture content of the com-posting mass. This facility uses grass clippingsthat are picked up at curbside throughout thecity as a bulking agent. Because the grass clip-pings have a tendency to settle and mat, it isnecessary to blow (rather than draw) additionalair through the composting mass to reestablishporosity, thus proper oxygenation. The extraair, moved by use of three 50-horsepower cen-trifugal blowers, removes too much moisturefrom the composting mass, thus the need forthe water tank.
Other problems that are unique to the com-posting of a given solid waste or use of a givenbulking agent or other additive can often besolved by taking advantage of simple concepts.As another example, in Rockland, Maine, acompost facility that was used to convert fishprocessing wastes to a soil conditioning agentmade use of leather buffing dust (similar tosawdust, but of almost zero moisture content,[also a troublesome industrial solid waste]) toadjust from too high a moisture content to theoptimum range.
The composting process is normally com-plete in 14 to 21 days (in some cases, as long as
Figure 9-13 Dimensions of typical windrows (from MSW Management, 1996).

Treatment and Disposal of Solid Wastes from Industry 425
Figure 9-14 Windrow composting machine. (Courtesy ofScarab Manufacturing.)
28 days), after which the finished compost isstirred and allowed to “cure” for several weeksor months. During curing, the microbial popu-lation reduces and stabilizes by adjusting itselfto a food-poor environment. Normally, minorodor problems that may have existed at the endof the composting process disappear during thecuring process because the remaining speciesof microbes consume whatever is the source ofthe minor odors.
Static Pile TechnologyStatic pile technology uses a system that sucksair through the composting mass by drawing avacuum at the bottom of the pile. This method,which was originally developed in the mid-1970s to treat sludge from sewage treatmentplants, is illustrated in Figure 9-15.
As shown in Figure 9-15, a grid of perfo-rated pipes supported on the top surface of aconcrete pad is connected to a blower. Thesolid waste to be composted is piled over thepipe grid after first undergoing conditioning bygrinding and mixing with the bulking agent.Then, the pile is covered to insulate it to enablethe temperature to build up to the thermophilicrange (about 70oC). The composting processbegins immediately, because of the presence ofboth bacteria and food; therefore, air flowshould begin immediately to prevent the devel-opment of an odor problem. The blower drawsair through the composting material from theoutside in, to maintain the proper concentrationof oxygen within the voids in the compostingmaterial, as discussed previously. Standard pro-cedure is to discharge the exhaust air from theblower into a pile of finished compost, to filterout fine particulates and to control minorodors.
Mechanical Composting TechnologyMechanical composting technology involvesthe use of a container and mechanical stirringequipment. The solid waste is first conditionedby grinding and mixing with a bulking agent asdescribed for the windrow and static pile tech-nologies. Then, the mixture is placed in thecontainer-stirring system, which maintains even
Figure 9-15 Composting with forced aeration. (From Corbitt, © 1999. Reprinted by permission of McGraw-Hill, Inc.)
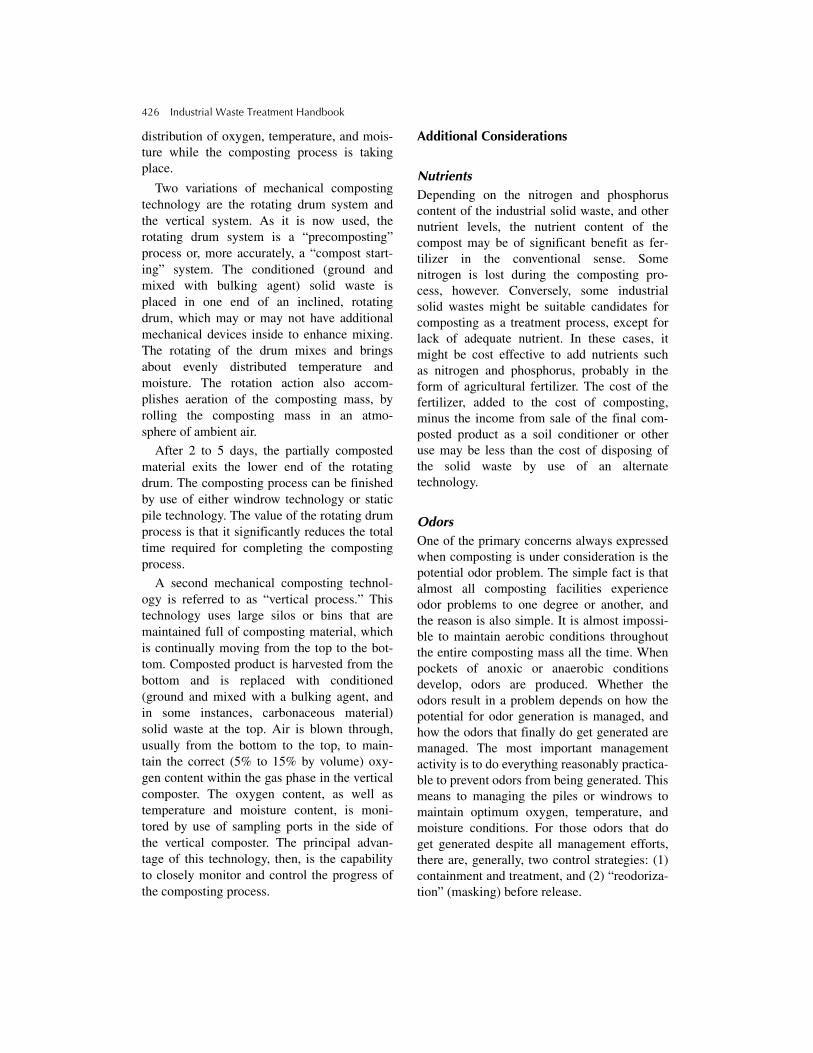
426 Industrial Waste Treatment Handbook
distribution of oxygen, temperature, and mois-ture while the composting process is takingplace.
Two variations of mechanical compostingtechnology are the rotating drum system andthe vertical system. As it is now used, therotating drum system is a “precomposting”process or, more accurately, a “compost start-ing” system. The conditioned (ground andmixed with bulking agent) solid waste isplaced in one end of an inclined, rotatingdrum, which may or may not have additionalmechanical devices inside to enhance mixing.The rotating of the drum mixes and bringsabout evenly distributed temperature andmoisture. The rotation action also accom-plishes aeration of the composting mass, byrolling the composting mass in an atmo-sphere of ambient air.
After 2 to 5 days, the partially compostedmaterial exits the lower end of the rotatingdrum. The composting process can be finishedby use of either windrow technology or staticpile technology. The value of the rotating drumprocess is that it significantly reduces the totaltime required for completing the compostingprocess.
A second mechanical composting technol-ogy is referred to as “vertical process.” Thistechnology uses large silos or bins that aremaintained full of composting material, whichis continually moving from the top to the bot-tom. Composted product is harvested from thebottom and is replaced with conditioned(ground and mixed with a bulking agent, andin some instances, carbonaceous material)solid waste at the top. Air is blown through,usually from the bottom to the top, to main-tain the correct (5% to 15% by volume) oxy-gen content within the gas phase in the verticalcomposter. The oxygen content, as well astemperature and moisture content, is moni-tored by use of sampling ports in the side ofthe vertical composter. The principal advan-tage of this technology, then, is the capabilityto closely monitor and control the progress ofthe composting process.
Additional Considerations
NutrientsDepending on the nitrogen and phosphoruscontent of the industrial solid waste, and othernutrient levels, the nutrient content of thecompost may be of significant benefit as fer-tilizer in the conventional sense. Somenitrogen is lost during the composting pro-cess, however. Conversely, some industrialsolid wastes might be suitable candidates forcomposting as a treatment process, except forlack of adequate nutrient. In these cases, itmight be cost effective to add nutrients suchas nitrogen and phosphorus, probably in theform of agricultural fertilizer. The cost of thefertilizer, added to the cost of composting,minus the income from sale of the final com-posted product as a soil conditioner or otheruse may be less than the cost of disposing ofthe solid waste by use of an alternatetechnology.
OdorsOne of the primary concerns always expressedwhen composting is under consideration is thepotential odor problem. The simple fact is thatalmost all composting facilities experienceodor problems to one degree or another, andthe reason is also simple. It is almost impossi-ble to maintain aerobic conditions throughoutthe entire composting mass all the time. Whenpockets of anoxic or anaerobic conditionsdevelop, odors are produced. Whether theodors result in a problem depends on how thepotential for odor generation is managed, andhow the odors that finally do get generated aremanaged. The most important managementactivity is to do everything reasonably practica-ble to prevent odors from being generated. Thismeans to managing the piles or windrows tomaintain optimum oxygen, temperature, andmoisture conditions. For those odors that doget generated despite all management efforts,there are, generally, two control strategies: (1)containment and treatment, and (2) “reodoriza-tion” (masking) before release.
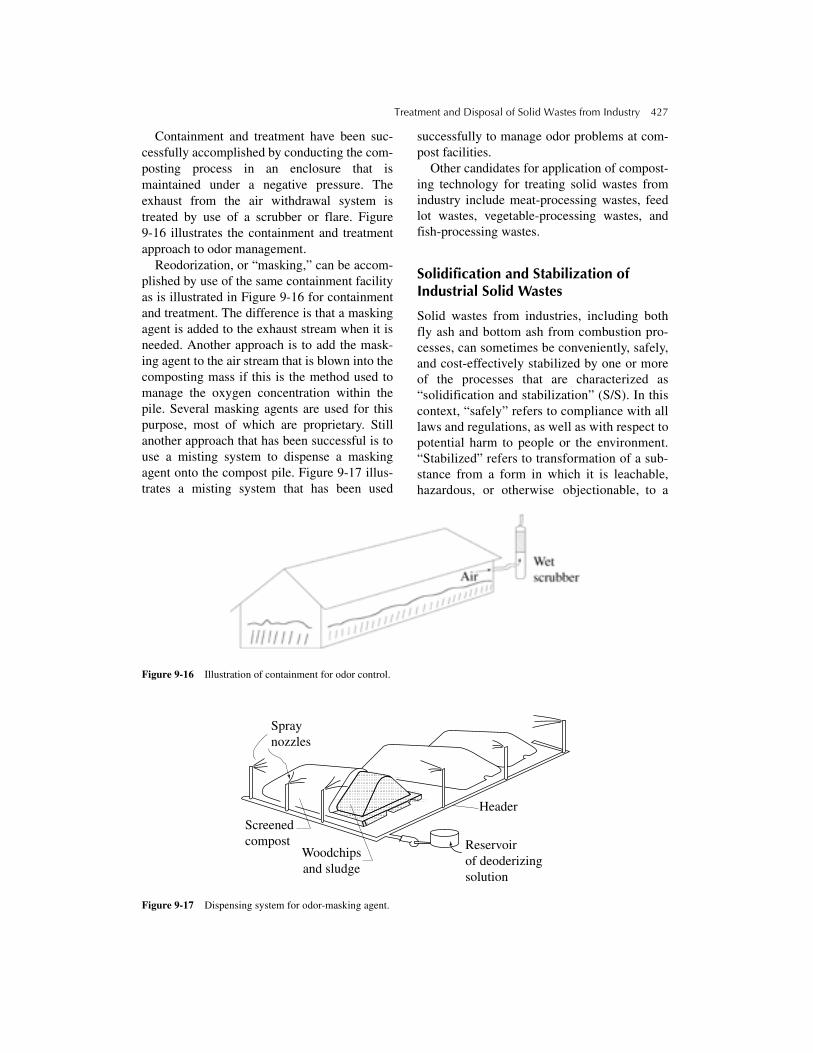
Treatment and Disposal of Solid Wastes from Industry 427
Containment and treatment have been suc-cessfully accomplished by conducting the com-posting process in an enclosure that ismaintained under a negative pressure. Theexhaust from the air withdrawal system istreated by use of a scrubber or flare. Figure9-16 illustrates the containment and treatmentapproach to odor management.
Reodorization, or “masking,” can be accom-plished by use of the same containment facilityas is illustrated in Figure 9-16 for containmentand treatment. The difference is that a maskingagent is added to the exhaust stream when it isneeded. Another approach is to add the mask-ing agent to the air stream that is blown into thecomposting mass if this is the method used tomanage the oxygen concentration within thepile. Several masking agents are used for thispurpose, most of which are proprietary. Stillanother approach that has been successful is touse a misting system to dispense a maskingagent onto the compost pile. Figure 9-17 illus-trates a misting system that has been used
successfully to manage odor problems at com-post facilities.
Other candidates for application of compost-ing technology for treating solid wastes fromindustry include meat-processing wastes, feedlot wastes, vegetable-processing wastes, andfish-processing wastes.
Solidification and Stabilization of Industrial Solid Wastes
Solid wastes from industries, including bothfly ash and bottom ash from combustion pro-cesses, can sometimes be conveniently, safely,and cost-effectively stabilized by one or moreof the processes that are characterized as“solidification and stabilization” (S/S). In thiscontext, “safely” refers to compliance with alllaws and regulations, as well as with respect topotential harm to people or the environment.“Stabilized” refers to transformation of a sub-stance from a form in which it is leachable,hazardous, or otherwise objectionable, to a
Figure 9-16 Illustration of containment for odor control.
Figure 9-17 Dispensing system for odor-masking agent.
Spraynozzles
Screenedcompost
Woodchipsand sludge
Header
Reservoirof deoderizingsolution

428 Industrial Waste Treatment Handbook
form in which it cannot be leached, vaporized,or enter into a reaction with another substance.
Solidification and stabilization (S/S) tech-nologies are used to convert the solid waste,with or without the free-flowing liquid associ-ated with it, to a state such that it can be land-filled or otherwise applied to the land withoutdanger of forming unacceptable leachate orgas. Several technologies can be used,depending on the characteristics of the wastematerial.
It is a problem, regarding S/S methods ofsolid waste treatment before disposal, that lawsand regulations are ever-changing. It can besaid that if the S/S product can “pass” all appli-cable tests, such as the Paint Filter Liquids Test(PFLT) and the Toxic Characteristic LeachingProcedure (TCLP), it is “safe” to be disposedof in an approved landfill; however, the criteriafor passing those tests, as well as the proce-dures of the tests themselves, have been chang-ing over time; thus, the moving target problem.Nevertheless, certain industrial solid wastes,having certain hazardous or otherwise objec-tionable characteristics, can be treated usingcertain S/S techniques, which would seemessentially certain to comply with any presentor future acceptance testing procedure. Forinstance, the objectionable characteristic ofcertain industrial solid wastes that containformaldehyde is that the formaldehyde, whichis toxic, can be leached out by water to repre-sent a threat of groundwater pollution. If thesolid waste mass can be treated by mixing itwith phenol (another toxic substance) to pro-duce (stoichiometrically) a “phenol-formalde-hyde resin,” then the resin is extremelyinsoluble, and that which does dissolve is rela-tively inert and nontoxic. Whether such a treat-ment process can be reliably and cost-effectively (in the context of alternatives) car-ried out largely depends on the characteristicsof the solid waste.
A second problem regarding S/S methodsfor treatment of solid wastes before landfillingis that additional volume is added. As “airspace” at approved landfills increases in itsalready high value, this consideration willincrease in importance.
Notwithstanding the moving target problem,several S/S technologies warrant seriousconsideration, which means a very closeexamination of the characteristics of the solidwaste and the characteristics of the S/S prod-uct. The feasibility of using any given S/S tech-nology for treatment before disposal of a givensolid waste stream must be closely evaluatedusing a four-step process:
1. Evaluate the likelihood of successfulapplication of each alternative S/S technol-ogy on a theoretical basis (basic chemistryand physics). This evaluation shouldinclude a thorough search to determinewhether any of the available alternativeS/S technologies have been used success-fully on a similar waste stream at anotherlocation.
2. Perform bench scale tests using those tech-nologies that appear promising. Testingmust include all product evaluation tests,such as TCLP and PFLT procedures,where applicable.
3. Perform pilot plant evaluations using thoseS/S technologies having the most favor-able bench scale tests. Include productevaluation tests.
4. Perform a detailed preliminary design ofthe prototype treatment system(s). A thor-ough and detailed cost opinion analysismust be included.
There are at least three systems by which S/Stechnologies are categorized:
1. By process system2. By binder used3. By S/S mechanism
S/S Process SystemsThere are at least four systems in use to accom-plish S/S treatment of industrial waste streams:(1) in the 55-gallon drum in which the wastematerials to be treated have been collected; (2)in a specially designed and constructed facilityto carry out the S/S process on site; (3) in amobile facility; or (4) in a sludge pit or lagoonor other collection facility of the solid wastestream.

Treatment and Disposal of Solid Wastes from Industry 429
In the case of the “in-drum” system, treat-ment chemicals or binders are added directlyinto the 55-gallon steel drums used to collect thesolid wastes. Stirring and reaction are carriedout, and the stabilized product is often placed ina landfill or other facility still in the drum.
Specially built S/S plants, similar to inciner-ators, are operated either on site or at centrallocations. The process can be batch-type orcontinuous. These facilities are appropriate forlarge quantities of solid wastes.
In some cases, the reaction chemicals orbinders are added directly into a collectiontank, storage tank, or lagoon in which the targetsolid wastes have collected. In the case oflagoons, it might be feasible, safe, and costeffective to simply close the lagoon, underRCRA or other approved procedures, with thestabilized solid wastes remaining. This type ofprocedure is referred to as in situ treatment anddisposal.
Binders Used for S/S Technologies
Solidification agents that have been success-fully used to stabilize industrial solid wastesinclude both organic and inorganic substances.
Organic binding agents
• Epoxys
• Asphalt
• Urea-formaldehyde
• Polyesters
• Polyolefins
In all of these technologies, appropriate pre-treatment of the solid wastes is very important.
EpoxysSeveral different epoxy mixes have been
used as binders for the S/S treatment of indus-trial wastes, including proprietary substancesand procedures. Epoxys have been successfullyused for S/S treatment in 55-gallon drums, asdiscussed earlier. Epoxys use at least two reac-tants; therefore, mixing must be rapid and thor-ough. If executed properly, the hardened epoxy
incorporates the solid waste substances withinits polymerized matrix, effectively reducing byorders of magnitude the surface area of the tar-get material that can be contacted by water, orother potential leaching liquid. Epoxys arecharacteristically nonreactive and are expectedto prevent leaching or other reaction of the tar-get substances for extremely long periods.
There are different types of epoxy, using dif-ferent reactants and producing polymerizedmatrices having different chemical properties.Some are more resistant to certain organic sol-vents, strong acids, or caustic substances.Therefore, the most appropriate epoxy for agiven application should be the subject of con-siderable research before a given S/S technol-ogy is selected or rejected. The results of benchscale trials should also be evaluated in light ofthese characteristics.
AsphaltMany industrial solid wastes have been suc-
cessfully solidified and stabilized by simplyincorporating them into an asphalt mix at aconventional asphalt batch plant. In other cases,special asphalt mixes using specially designedand constructed mixing equipment have beenused. Factors that must be considered includereactivity potential between the asphalt binderand any of the components of the solid wastestream, the future effects of heat on the physi-cal integrity of the asphalt, the potential forsubstances that are solvents for the asphaltcoming in contact with the disposed products,and the potential for wearing or abrading of theasphalt product.
Urea-formaldehydeAn epoxylike matrix can be formed by the
polymerization that occurs when urea andformaldehyde are mixed in proper proportions.As with the epoxy S/S treatments discussedpreviously, target substances in solid wastescan be incorporated into this matrix, effectivelysolidifying and, thus, stabilizing the target sub-stances. The choice between urea-formalde-hyde and epoxy as the S/S treatment dependslargely on potential reactions between

430 Industrial Waste Treatment Handbook
substances in the solid waste stream and theurea-formaldehyde mixture.
PolyestersSeveral polyesters can be used for S/S treat-
ment of certain solid waste target substances. Aswith epoxy and urea-formaldehyde technolo-gies, the binding effect that polyesters can haveon solid waste target substances results fromincorporation of the target substances (and othersubstances present with the target substances) inthe inner mass of the matrix that forms when thepolymerization process takes place, wherebysmall organic ester molecules combine to pro-duce a relatively huge monolithic mass. It is not(necessarily) that the target substances becomechemically incorporated into the matrix, butrather, that the target substances becomeentrapped within the matrix. Being soentrapped, it is impossible for water or anotherdissolving or reacting substance to come in con-tact with the target substances. Thus, the goal ofthe S/S technology is accomplished.
PolyolefinsPolyethylene and polyethylene-butadiene
are two polyolefins that can be used in thesame way as is described for polyesters tosolidify and thus stabilize certain solid wastestreams. The choice between polyesters andpolyolefins is, again, based on the chemicalproperties of the solid waste substances and thechemical and physical properties and charac-teristics of the environment of the disposal site.The mechanisms of stabilization are essentiallythe same. For example, if a solid waste is firstconditioned by evaporation to dryness andgrinding to a fine granular consistency, it canbe mixed together with appropriate proportionsof ethylene and butadiene, plus a catalyst. Inthe presence of the catalyst, ethylene and buta-diene polymerize to form a monolithic mass.As the polymerization process takes place, thegranules of solid waste material becomeentrapped within the polymeric mass.
Inorganic Binding Agents
• Portland cement
• Pozzolan substances
• Lime
• Gypsum
• Silicates
Portland CementOne of the first S/S techniques to be used
was to simply mix conditioned solid wasteswith Portland cement, sand, and water, thenallow the mixture to harden into concrete. Inmany cases, fly ash has been mixed in. The flyash contains silica, thus enters into a pozzolanreaction that adds to the structure of the con-crete mass. Also, the fly ash may have been adisposal problem in itself. In this case, includ-ing fly ash in the mixture with cement andanother waste material has solved two hazard-ous waste disposal problems concurrently.
Solidification with Portland cement achievesstabilization of solid wastes by preventing waterfrom any source—percolating rainwater orgroundwater, for instance—from being able toleach substances from the solid waste becausethe water can no longer come into contact withthe waste material. In this case, the waste mate-rial has been entrapped within a monolithicblock of relatively high strength. Even if crackseventually develop in the concrete mass, thesurface area of the waste material that can becontacted by water are orders of magnitude lessthan before the solidification process.
At least two stabilization mechanisms areinvolved when Portland cement is used as thesolidification agent:
• Entrapment within a monolithic mass
• Incorporation into the chemical structure ofthe monolithic substance
Any water that is included in the solid wastestream is taken into the structure of the con-crete as the curing process takes place.
Use of Portland cement as the solidificationagent, or “binder,” is relatively safe but rela-tively expensive. The decision to use Portlandcement rather than a less expensive solution isusually made to reduce perceived future risk toa minimum.

Treatment and Disposal of Solid Wastes from Industry 431
Pozzolan SubstancesFly ash, from the burning of fossil fuels and
other substances, contains fine grains of non-crystalline silica. When fly ash is mixed withlime and water, the calcium in the lime reactswith the silica from the fly ash to produce alow-strength cementlike solid substance. Thisreaction is referred to as a “pozzolan” reaction.Conditioned solid wastes can be mixed into thelime–fly ash–water mixture, as was describedfor the Portland cement S/S technology. Theresult is much the same, in that the target sub-stances in the solid waste stream have becomeimmobilized and protected from the leachingprocess. The reactants are less expensive, on theone hand, and one of them, the fly ash, is a solidwaste in its own right. This technology, then,accomplishes treatment for safe disposal of two,or, at least portions of two, solid waste streams.
As was the case with Portland cement as thebinder, at least two stabilization mechanismsare involved when the pozzolan-type solutionis used:
• Entrapment within a monolithic mass
• Incorporation into the chemical structure ofthe monolithic substance
Any water that is included in the solidwaste stream is taken into the structure of themonolithic mass as it forms via the “curingprocess.”
LimeSome solid waste streams, having certain
characteristics of chemical composition andmoisture content, can simply be mixed withlime and allowed to dry. On drying, a low-structural-strength solid mass is formed,which has low solubility in water. Manymetal ion species that were present in thewaste stream will have been precipitated asthe highly insoluble hydroxide, except forthose metal ion species such as lead and zinc,which have lowest solubilities in the lowerpH range. pH, of course, has no meaning in asolid substance; however, a metal that is pre-cipitated as the hydroxide and is then placedin a dry environment will not dissolve intowater that eventually comes into contact with
it to a degree higher than its theoretical solu-bility limit.
If there are significant quantities of lead and/or zinc, or other metal whose hydroxide ismore soluble than desired in the solid wastestream (along with those metals that do precip-itate best at high pH levels), there are at leasttwo alternatives. One is to add a source ofwater-soluble sulfide ions to the lime—forinstance, sodium sulfide; the second is to add asource of soluble phosphate ions—triple-super-phosphate fertilizer, for instance. The sulfide orphosphate ions will precipitate those metal ionsthat remain in water solution after the pH hasbeen raised to the 12 to 13 range by the solubi-lized lime.
The security of a lime-treated solid wastemass can be enhanced significantly by encap-sulating the final product in an impermeablemembrane that is either sprayed onto the sur-faces and allowed to cure, or by wrapping thefinal product in an already formed membrane.
GypsumGypsum is another relatively inexpensive
substance, as is lime, that forms a solid masson drying. Unlike lime, however, gypsum is notan alternative for treating wastes in whichmetal ions are among the target substances.Whereas the anion associated with lime ishydroxide, the anion associated with gypsum issulfate. Metal sulfates are soluble in water.Gypsum is, therefore, an alternative substancefor treating certain solid waste streams whereincorporation into a low-structural-strengthsolid mass is the principle objective. Impor-tantly, gypsum itself (calcium sulfate) is verysparingly soluble in water; therefore, thosesubstances that were components of the origi-nal solid waste stream that are incorporatedinto the dried monolithic mass product are“sheltered” from contact with water. If dis-posed of properly, by placing in a suitableburial facility, the problem of future leachatewill have been solved.
SilicatesAnother category of substances—the sili-
cates—can be mixed as a liquid with properly

432 Industrial Waste Treatment Handbook
conditioned solid wastes, then, on drying, forma monolithic matrix that is:
• Insoluble in water and water repellent
• Relatively inert regarding reaction withmost chemical substances
• Stable over time
• Capable of incorporating the target sub-stances into its monolithic mass
An advantage of the silicates compared topozzolans, lime, and gypsum is that the sili-cates form a gel that is pliable and, therefore,resistant to cracking if physically deformed.The basic objective of treatment is the same asfor pozzolans and gypsum; that is, to make itextremely difficult, if not impossible, forwater to produce leachate from the treatedsolid waste in the future. Treatment using sili-cates is different, however, from treatmentwith lime or Portland cement, in that metalions will not be precipitated as a water-insolu-ble substance by using silicates. Therefore, sil-icate technology would likely not be a goodchoice for treatment before disposal of a solidwaste stream in which metal ions are targetcompounds.
Mechanisms Involved in S/S Treatment Procedures
Some of the mechanisms by which individualS/S technologies accomplish stabilization oftarget substances in solid waste streams havebeen discussed in the preceding paragraphs. Amore thorough discussion of these and othermechanisms is presented as follows.
To restate the overall objective of S/S treat-ment, it is to produce a product that can be reli-ably and safely disposed of, usually in anappropriate landfill, without danger of generat-ing an objectionable leachate in the future. Themechanisms employed by the individual solidi-fication technologies discussed previously, areas follows:
• Incorporation into a monolithic solid mass
• Precipitation of target substances to form non-leaching products
• Adsorption of target substances to form non-leaching products
• Absorption of target substances to form non-leaching products
• Adsorption of water from the solid wastemass
• Absorption of water from the solid wastemass
• Encapsulation
Incorporation into a Monolithic Solid Mass
In order for leachate to form, water must comeinto contact with a soluble material, dissolve anamount of that material, then continue to flowunder the influence of gravity away from thesolid waste material. One effective way to pre-vent leachate formation, then, is to make itimpossible for water from outside a mass ofsolid waste material to contact target sub-stances. One way this objective can beaccomplished is to incorporate the target sub-stances within a monolithic mass of aninsoluble solid. Any water approaching thissolid mass will be forced to flow around it,thus, never achieving contact with the targetsubstances.
The mechanism is simple, but the objectiveis not. The most difficult problem has to dowith all of the counterobjective activities thattake place over a very long period. Destructionof the structural integrity of the monolithicsolid mass, either slowly over time, or as aresult of physical damage, must be prevented.The long-term effects of “natural” phenomena,such as acid rain, must be carefully consideredand designed into the overall technologicalsolution.
There are basically two ways by which tar-get substances can be incorporated into aformed monolithic mass: (1) by chemicalreaction and actual incorporation into the lat-tice structure of the monolithic solid as it isforming, for instance, by polymerization, and(2) by entrapment within the physical struc-ture of the monolithic solid as it is beingformed.

Treatment and Disposal of Solid Wastes from Industry 433
Precipitation of Target Substances to Form Nonleaching ProductsSeveral alternative technologies use precipita-tion of target substances. As discussed earlier,using lime as a binder is one of them. Otheralternatives include mixing with soluble car-bonate, sulfide, or phosphate compounds,usually combined with a substance to form amonolithic solid mass.
Adsorption of Target Substances to Form Nonleaching ProductsCertain adsorbents, such as activated carbon,can be mixed into a slurry of solid waste mate-rials with the result that water is not able todesorb the target substances over time. Beforethis technology can be deemed appropriate fora given waste stream, however, extensive test-ing must be carried out to determine the degreeof adsorption as well as resistance to desorp-tion. Moreover, the optimum adsorbent isseldom selected early in the evaluation proce-dure. There are many different activatedcarbons as well as alternatives to activated car-bon. There are also many different chemicalcharacteristics regarding the potential leachingsolution that must be evaluated; for instance,different values of pH, acidity, alkalinity, oxi-dation-reduction potential (ORP), and TDScontent, to name a few.
Absorption of Target Substances to Form Nonleaching ProductsRegarding S/S technologies, certain materialscan absorb and hold target substances in a solidwaste stream in the manner that a spongeabsorbs and holds water. This technology typehas potential application when the target sub-stances within a solid waste stream are part ofthe liquid portion of the stream.
Adsorption of Water From the Solid Waste MassIn some cases, activated carbon, or anotheradsorbent, has been used to adsorb water froma solid waste mass to change its physicalcharacteristics to a more manageable state.
Substances that are dissolved in the water areoften incorporated into the bulk activated car-bon (or other adsorbent) product, and must bedealt with appropriately. One alternative forthis requirement is incineration to destroy theadsorbed target substances and to reactivate andrecover the activated carbon for extended use.
Absorption of Water from the Solid Waste MassMaterials that are capable of absorbing waterfrom a solid waste stream have been used fortwo purposes: (1) to prepare the solid waste forfurther treatment in a less wet state, and (2) toisolate target substances that are dissolved inthe water phase of the solid waste stream. Onceabsorbed into the absorbing material, thatmaterial can be further processed by treatingthe material, the water, and the dissolved targetsubstances as a whole, or by physically remov-ing the absorbed water phase, then treating thatliquid for recovery (for reuse), fixation, ordestruction of the target pollutants.
EncapsulationEncapsulation prevents contact between waterand target substances by forming a physicalimpermeable barrier around a volume of solidwaste, or a volume of solid waste that has beentreated using one of the technologies discussedearlier. Alternative methods for encapsulationinclude wrapping a volume of the treated or“raw” solid waste in a membrane of high-den-sity polyethylene (HDPE) or other material;spraying one of the commercially availableproducts that then polymerizes to form a seam-less, impermeable coat; or dipping a volume oftreated or “raw” solid waste in a solution thatwill then polymerize to form a seamless,impermeable coating.
Bibliography
Archinger, W.C., and L.E. Daniels, “An Evalu-ation of Seven Incinerators,” Proceedings ofNational Incinerator Conference, AmericanSociety of Mechanical Engineers, New York,1970.

434 Industrial Waste Treatment Handbook
ASHRAE Handbook and Product Directory,American Society of Heating, Refrigeratingand Air Conditioning Engineers, New York,1977.
Baron, J.L., et al., Landfill Methane UtilizationTechnology Workbook, CPE-8 101, U.S.Department of Energy, Washington, D.C.,1981.
Baumeister, T. (ed.), Marks Standard Hand-book for Mechanical Engineers, 8th Ed.,McGraw-Hill, New York, 1978.
Brunner, D.R., and D.J. Keller, “Sanitary Land-fill Design and Operation,” U.S.Environmental Protection Agency, ReportNo. SW65ts, Washington, D.C., 1972.
Campbell, J.A., “Waste Fuel Densification:Review of the Technology and Application,”Proceedings of the International Conferenceon Prepared Fuels and Resource RecoveryTechnology, Argonne National Laboratory,ANL/CNSV-TM-60, Argonne, Illinois, 1981.
Canter, L.W., and R.C. Knox, GroundwaterPollution Control, Lewis Publishers,Chelsea, Michigan, 1985.
Corbitt, R.A., Standard Handbook of Environ-mental Engineering, 2nd Ed. McGraw-Hill,New York, 1999.
Freeman, H.M. (ed.), Standard Handbook ofHazardous Waste Treatment and Disposal,McGraw-Hill, New York, 1989.
General Electric, Solid Waste Management:Technology Assessment, Schenectady, NewYork, 1975.
Hasselriis, F., et al., “Eco-Fuel II: The ThirdGeneration,” Proceedings of the Interna-tional Conference on Prepared Fuels andResource Recovery Technology, ArgonneNational Laboratory, ANL/CNSV-TM-60,Argonne, Illinois, 1981.
Hasselriis, F., Refuse Derived Fuel Processing,Butterworth–Heinemann, Woburn, Massa-chusetts, 1984.
Hollander, H.I., and W.A. Sanders II, “Biom-ass: An Unlimited Resource,” ConsultingEngineer, vol. 55, Barrington, Illinois, 1980.
Keitz, E., “Profile of Existing Hazardous WasteIncineration Facilities and Manufacturers inthe United States,” U.S. Environmental
Protection Agency, EPA 600/2-84/052, Cin-cinnati, Ohio, 1984.
Landfill Leachate Clogging of Geotextile (andSoil) Filters, Risk Reduction EngineeringLaboratory, EPA/600/2-91/025, Cincinnati,Ohio, 1991.
Lawrence Berkeley Laboratory, Characteriza-tion of Solid Waste Conversion andCogeneration Systems, U.S. Department ofEnergy, DOE/EV-0105, Washington, D.C.,1980.
Metcalf and Eddy, Inc., revised by G. Tchoban-oglous and F.L. Burton, WastewaterEngineering: Treatment, Disposal, andReuse, 3rd Ed., McGraw-Hill, New York,1991.
Mitchel, G., et al., Small-Scale and Low-Tech-nology Resource Recovery Study, U.S.Environmental Protection Agency, Washing-ton, D.C., 1979.
MSW Management, p. 44, March/April 1996.National Academy of Sciences of the National
Research Council, The Recovery of Energyand Materials from Solid Waste, NationalAcademy Press, Washington, D.C., 1981.
National Center for Resource Recovery, Waste-to-Energy Compendium, DOE/CE/20167-05, U.S. Department of Energy, Washington,D.C., 1981.
Niessen, W.R., “Evaluating Gasification andAdvanced Thermal Technologies for Pro-cessing MSW,” Solid Waste Technologies,September/October, 1996.
Niessen, W.R., and S.H. Chansky, “The Natureof Refuse,” Proceedings of National Inciner-ator Conference, American Society ofMechanical Engineers, New York, 1970.
Pope, K., “Europe’s Landfill Alternative,”Solid Waste Technologies, June 1999.
Reilly, T.C., and D.L. Powers, “ResourceRecovery Systems, Part 2: Environmental,Energy and Economic Factors,” Solid WastesManagement, New York, June 1980.
Schroeder, P.R., A.C. Gibson, J.M. Morgan,and T.M. Walski, “The Hydrologic Evalua-tion of Landfill Performance (HELP) Model,Volume 1—Users Guide for Version I (EPA/530-SW-84-009), and Volume II—Documen-tation for Version I (EPA/530-SW-84-010),”

Treatment and Disposal of Solid Wastes from Industry 435
U.S. Army Engineer Waterways ExperimentStation, Vicksburg, Mississippi, 1984.
Schroeder, P.R., et al., “The Hydrologic Eval-uation of Landfill Performance (HELP)Model,” U.S. Environmental ProtectionAgency, U.S. Army Engineer WaterwaysExperiment Station, Vicksburg, Mississippi,1988.
Schroeder, R.L., et al., “Raytheon ServiceCompany Experience and Programs inResource Recovery,” Proceedings of theInternational Conference on Prepared Fuelsand Resource Recovery Technology,Argonne National Laboratory, ANL/CNSW-TM-60, Argonne, Illinois, 1981.
Shepherd, K.R., “RDF Fuels in a Waste-To-Energy System—The Teledyne NationalExperience,” Proceedings of the Interna-tional Conference on Prepared Fuels andResource Recovery Technology, ArgonneNational Laboratory, ANL/CNSV- TM-60,Argonne, Illinois, 1981.
Sommerlad, R.E., “Considerations AffectingDedicated Boiler Design for Refuse DerivedFuels (RDF),” Proceedings of the Interna-tional Conference on Prepared Fuels andResource Recovery Technology, ArgonneNational Laboratory, ANL/CNSV-TM-60,Argonne, Illinois, 1981.
Tchobanoglous, G., H. Theisen, and R. Elias-sen, Solid Wastes: Engineering Principlesand Management Issues, McGraw-Hill, NewYork, 1977.
Theodore, L., and J. Reynolds, Introduction toHazardous Waste Incineration, Wiley-Inter-science, New York, 1987.
Tittlebaum, M.E., “Organic Carbon ContentStabilization Through Landfill LeachateRecirculation,” Journal of the Water Pollu-tion Control Federation, vol. 54, no. 5,Washington, D.C., 1982.
U.S. Environmental Protection Agency, Designand Construction of RCRA/CERCLA FinalCovers, Office of Research and Development,EPA 625/4-91/025, Washington, D.C., 1991.
U.S. Environmental Protection Agency,Design, Construction and Evaluation of ClayLiners for Waste Management Facilities,Office of Solid Waste and Emergency
Response, EPA 530/SW-88/007F, Washing-ton, D.C., 1997.
U.S. Environmental Protection Agency, Devel-opment Document for Proposed EffluentLimitations Guidelines and Standards for theLandfills Category, EPA 821-R-97-022,Washington, D.C., 1997.
U.S. Environmental Protection Agency, Eco-nomic and Cost-Effectiveness Analysis forProposed Effluent Limitations Guidelinesand Standards for the Landfills Category,EPA 821-B-97-005, Washington, D.C., 1997.
U.S. Environmental Protection Agency, Envi-ronmental Assessment for Proposed EffluentLimitations Guidelines and Standards for theLandfills Category, EPA 821-B-97-007,Washington, D.C., 1997.
U.S. Environmental Protection Agency, Guideto Technical Resources for the Design ofLand Disposal Facilities, Risk ReductionEngineering Laboratory, Center for Environ-mental Research Information, EPA 625/6-88/018, Cincinnati, Ohio, 1988.
U.S. Environmental Protection Agency, Guideto the Disposal of Chemically Stabilized andSolidified Waste, SW-872, Cincinnati, Ohio,1980.
U.S. Environmental Protection Agency, Hand-book—Remedial Action at Waste DisposalSites (revised), EPA 625/6-85/006, Washing-ton, D.C., January, 1987.
U.S. Environmental Protection Agency,Interim Standards for Owners and Opera-tors of New Hazardous Waste LandDisposal Facilities, Code of Federal Regula-tions, Title 40, Part 267, U.S. GovernmentalPrinting Office, Washington, D.C., 1981.
U.S. Environmental Protection Agency, Man-agement of Hazardous Waste Leachate,Municipal Environmental Research Labora-tory, SW-871, Cincinnati, Ohio, 1980.
U.S. Environmental Protection Agency,Procedures Manual for Groundwater Moni-toring at Solid Waste Disposal Facilities,EPA 530/SW-611, Washington, D.C., 1977.
U.S. Environmental Protection Agency, Pro-cess Design Manual for Sludge Treatmentand Disposal, EPA 625/1-74/006, Washing-ton, D.C., 1974.
436 Industrial Waste Treatment Handbook
U.S. Environmental Protection Agency, Pro-tecting Health and Safety at HazardousWaste Sites: An Overview, TechnologyTransfer, EPA 625/9-85/006, Cincinnati,Ohio, 1985.
U.S. Environmental Protection Agency, Protec-tion of Public Water Supplies from Ground-Water Contamination, Center for Environ-mental Research Information, EPA 625/4-85/016, Cincinnati, Ohio, 1985.
U.S. Environmental Protection Agency,Refuse-Fired Energy Systems in Europe:An Evaluation of Design Practices, AnExecutive Summary, Publication SW 771,Washington, D.C., 1979.
U.S. Environmental Protection Agency,Requirements for Hazardous Waste LandfillDesign, Construction and Closure, Centerfor Environmental Research Information,Office of Research and Development, EPA/625/4-89/022, Cincinnati, Ohio, 1989.
U.S. Environmental Protection Agency, Techni-cal Guidance Document: Final Covers onHazardous Waste Landfills and SurfaceImpoundments, Office of Solid Waste andEmergency Response, EPA 530-SW-89 047F,Washington, D.C., 1999.
U.S. Environmental Protection Agency, Statisti-cal Support Document for Proposed EffluentLimitations Guidelines and Standards for theLandfills Category, EPA 821-B-97-006,Washington, D.C., 1997.
Velzy, C.O., “Energy from Waste Plants—AnOverview of Environmental Issues,” Pre-sented at the Third U.S. Conference ofMayors/National Resource Recovery Asso-ciation Conference, Washington, D.C.,1984.
Velzy, C.O., “State of the Art of EmissionsControl,” Presented at New York Academyof Sciences, New York, 1984.
Velzy, C.O., “The Enigma of IncineratorDesign,” Incinerator and Solid Waste Tech-nology, ASME, New York, 1975.
Velzy, C.R., and C.O. Velzy, “Incineration,”Sec. 7, Marks’ Standard Handbook forMechanical Engineers, 8th ed., McGraw-Hill, New York, 1978.
Vence, T.D., and D.L. Powers, “ResourceRecovery Systems, Part 1: TechnologicalComparison,” Solid Wastes Management,New York, 1980.
Vesiland, P.A., and A.E. Rimer, Unit Oper-ations in Resource Recovery Engineering,Prentice-Hall, Englewood Cliffs, New Jer-sey, 1981.
White, T.M., V.M. Grace, and W.A. Freivald,“Leachate Evaporation Using Landfill Gas,”Solid Waste Technologies, May/June, 1996.
Wilson, E.M., et al., Engineering and Eco-nomic Analysis of Waste to Energy Systems.U.S. Environmental Protection Agency,EPA-600/7-78-086, Washington, D.C.,1978.

437
10 Methods for Treating Air Discharges from Industry
Control of the discharges of air pollutants fromindustries can be organized into threecategories:
1. Reduction at the source2. Containment3. Removal by use of one or more treatment
technologies
Reduction at the Source
Reduction at the source, as an integral part of apollution prevention program, is the preferredcontrol method. Reduction at the source can beaccomplished by the following:
• Identifying each and every source within theentire industrial facility. This must includethe full range of air pollutant generationactivities, from the boilers used for hotwater and space heating, to each separatemanufacturing process step, to dust blowingaround the parking lot.
• Substituting nonpolluting process materialsfor those that are hazardous or otherwiseobjectionable.
• Maintaining vigorous maintenance and pre-ventive maintenance programs to ensurethat all process equipment is generating aminimum of pollutants, that all containmentfacilities are performing as designed to min-imize fugitive emissions, and that alltreatment equipment is operating at top effi-ciency in terms of pollutant removal.
• Ensuring that accident and spill preventionprocedures and facilities are up to date, wellknown to those that should know them, andreviewed and revised at regular intervals.
• Ensuring that emergency response facilitiesand procedures are up to date and well known.
• Maintaining a rigorous program of analyz-ing past spills and emergencies with theobjective of determining: (1) how to preventeach and every spill event from ever hap-pening again, and (2) how to improveresponses to emergency events over pastresponses.
A formal Air Pollution Management Plan(APMP) is a necessity. The APMP must be aliving, active document that is used often andreviewed and revised frequently. The APMP istruly the key to minimizing the cost for air pol-lution control.
Containment
After reduction at the source, containment isthe most cost-effective method of air pollutioncontrol. Containment refers to the absence ofleaks, or of any type of breach in structuralintegrity in buildings, ductwork, storage tanks(i.e., any location or facility from which airpollutants could enter the environment withoutsuch entrance resulting from the express inten-tion of the environmental managers). Suchunwanted discharges are called “fugitive emis-sions” and are the primary target of a pollutantcontainment program.
One of the most effective methods of con-tainment, to prevent release of fugitive emis-sions, is to maintain a “negative pressure”inside buildings; that is, to maintain the atmo-spheric pressure inside the building at a lowervalue than the atmospheric pressure outside thebuilding. This can be accomplished by, forexample, use of one or more wet scrubbersinstalled so that air from any location withinthe plant must go through one of the scrubbersbefore reaching the outside. Induced air fanscontinually evacuate air from the building and

438 Industrial Waste Treatment Handbook
force this air to pass through the scrubbers. Ifthe fans and scrubber systems are sized prop-erly, occasional opening of pass doors as wellas truck doors can take place without signifi-cant release of air pollutants.
Hoods and Isolation ChambersAppropriate and effective use of hoods isimportant to the objective of cost minimization.Hoods and isolation chambers can prevent airpollutants from contaminating large volumesof air. It is always less expensive to treat asmaller volume of more highly concentratedpollutant than to remove the same mass ofpollutant from a larger volume of air or othergas.
Fans and DuctworkProperly designed, operated, and maintainedfans and ductwork are key to successful con-tainment of air pollutants. Fans of too lowcapacity allow air pollutants to drift out of thecontainment system at the source. Fans of toohigh capacity dilute the target pollutantsexcessively, leading to increased cost oftreatment.
Treatment
Properly considered the last resort, butnonetheless the most expensive and importantin terms of compliance with the law, removalof pollutants from gas streams beforedischarge to the air is the major subject of thischapter.
Treatment Systems for Control of Particulates
There are five methods in general use for con-trolling particulate emissions:
• Gravity separators
• Inertial separators
• Electrostatic precipitators• Fabric filters
• Wet scrubbers
Gravity and inertial separators, including so-called cyclones, are dry, “no moving parts”devices. They take advantage of the relativelyhigh specific gravity of certain types of particu-late matter, including fly ash, dust, cementparticles, and organic solids. Electrostatic pre-cipitators take advantage of the electrostaticcharge on the surface of particles, either presentfrom natural phenomena or induced. Fabric fil-ters use physical blocking and adsorption, andwet scrubbers use a liquid to entrap particu-lates, thus removing them from a gas stream.
Gravity SeparatorsGravity separators are devices that provide qui-escent conditions, thus counteracting thetendency of a particulate-laden gas stream tosweep the particulates along with it as a resultof aerodynamic drag. Most gravity separatorsare simple, open chambers, sometimes with amechanism at the bottom to remove collectedmaterial. As is the case with other, rather pas-sive particulate removal devices, gravityseparators are normally used as pretreatmentdevices, upstream of more sophisticated equip-ment. The greatest value of gravity separatorsis to prolong the life of the more sophisticatedequipment. Figure 10-1 shows an example of agravity settling device for removal of particu-lates as an element in an air pollution controlsystem.
Inertial Separators
Inertial separators use the differential specificgravity between particulates and the gas thatcontains them. Inertial separators cause thestream of flowing gas to change directions.The inertia of the particulates, being directlyproportional to the weight of each particle,causes them to resist the change in direction,thus they are propelled out of the stream.Cyclones of various designs are the most com-mon examples of inertial separators. Somedry, venturi devices use the inertia of particu-lates moving along in a gas stream to effectremoval. Figure 10-2 shows a drawing of atypical inertial separator.
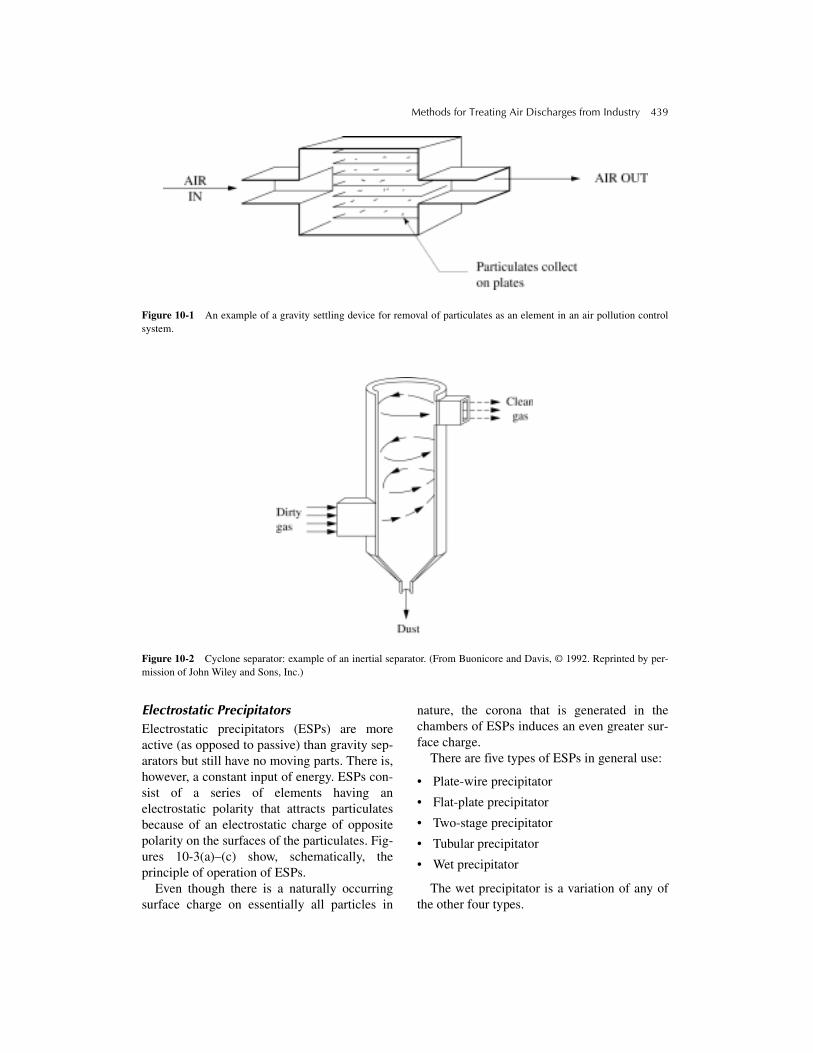
Methods for Treating Air Discharges from Industry 439
Figure 10-1 An example of a gravity settling device for removal of particulates as an element in an air pollution controlsystem.
Figure 10-2 Cyclone separator: example of an inertial separator. (From Buonicore and Davis, © 1992. Reprinted by per-mission of John Wiley and Sons, Inc.)
Electrostatic PrecipitatorsElectrostatic precipitators (ESPs) are moreactive (as opposed to passive) than gravity sep-arators but still have no moving parts. There is,however, a constant input of energy. ESPs con-sist of a series of elements having anelectrostatic polarity that attracts particulatesbecause of an electrostatic charge of oppositepolarity on the surfaces of the particulates. Fig-ures 10-3(a)–(c) show, schematically, theprinciple of operation of ESPs.
Even though there is a naturally occurringsurface charge on essentially all particles in
nature, the corona that is generated in thechambers of ESPs induces an even greater sur-face charge.
There are five types of ESPs in general use:
• Plate-wire precipitator
• Flat-plate precipitator
• Two-stage precipitator
• Tubular precipitator
• Wet precipitator
The wet precipitator is a variation of any ofthe other four types.

440 Industrial Waste Treatment Handbook
Figure 10-3(a) Electrostatic precipitator components. (From Buonicore and Davis, © 1992 by Van Nostrand-Reinhold.Courtesy of the Institute of Clean Air Companies and reprinted by permission of John Wiley and Sons, Inc.)
Figure 10-3(b) Electrostatic precipitator components. (From Buonicore and Davis, © 1992 by Van Nostrand-Reinhold.Courtesy of the Institute of Clean Air Companies and reprinted by permission of John Wiley and Sons, Inc.)

Methods for Treating Air Discharges from Industry 441
Figure 10-3(c) Electrostatic precipitator components. (From Buonicore and Davis, © 1992 by Van Nostrand-Reinhold.Courtesy of McGill Clean Air Corporation. Reprinted by permission of John Wiley and Sons, Inc.)
The Plate-Wire PrecipitatorThe plate-wire precipitator is shown sche-
matically in Figure 10-3(b). This device con-sists of parallel metal plates and wireelectrodes of high voltage. Voltages rangebetween 20,000 and 100,000 volts, as required.As the particulate-laden gas flows between theparallel plates, the particulates are attracted to,and adhere to, the plates. The plates must becleaned periodically, usually by “rapping,” andin some cases by water spray, and the wiresmust be cleaned of collected dust as well. Theplate-wire precipitator is the most commonlyused ESP by industry.
The Flat-Plate PrecipitatorThe flat-plate precipitator is shown schemat-
ically in Figure 10-3(c). The flat-plate ESPconsists of a series of parallel flat platesin which some of the plates serve as the
high-voltage electrodes. Corona, needed toincrease the surface charge on the particles tobe removed, are generated in chambers preced-ing the ESP itself. As with wire-plate ESPs, theplates have to be cleaned periodically.
The Two-Stage PrecipitatorIn the two-stage precipitator, the high-volt-
age electrodes precede the collector electrodes,as opposed to their being arranged in parallel,as is the case with the wire-plate ESP and theflat-plate ESP. The plates are normally cleanedby spraying with water. In some instances,detergents are added to the water.
The Tubular PrecipitatorThe tubular precipitator is named for its
shape and has its high-voltage wire coincidingwith the axis of the tube. Tubular ESPs can fitinto the stack because their shape is similar to

442 Industrial Waste Treatment Handbook
that of the stack. Tubular ESPs are cleanedwith a water spray.
The Wet PrecipitatorIf an ESP—wire-plate, flat-plate, two-stage,
or tubular—is operated with wet walls, it isproperly referred to as a wet precipitator. Wetwalls are used when the increase in particulateremoval efficiency warrants the added cost forcapital, operation, and maintenance.
Fabric FiltersFabric filters use the mechanism referred to as“physical barrier,” aided by a degree of adsorp-tion. Fabric woven from a wide variety ofmaterials collects particulates from a gas that isforced through it. As a coating of filtered-outparticles builds up on the surface of the filterfabric, this layer becomes an additional filter,which is usually more effective than the fabricalone. This is referred to as developing thefilter (Figure 10-4). Eventually, the layerbecomes so thick that the filter as a whole istoo restrictive to pass the desired flow rate ofgas undergoing treatment. At this point, the fil-ter must be taken off line and either cleaned ordisposed of and replaced.
Figure 10-4 Illustrates the process of “developing thefilter.”
Fabric filters can be obtained in many differentconfigurations. Figure 10-5 shows a “baghouse,” which is a type of fabric filter that isused for many industrial applications.
Wet ScrubbersWet scrubbers, used for removal of gases andother chemicals as well as particulates, are themost common type of air pollution control inuse by industries. They are also the mostextensive, in terms of complexity of equip-ment, moving parts, requirement for controls,and operation and maintenance requirements.Wet scrubbers can be designed for a single tar-get pollutant—for instance, particulates—butwhile in operation they will remove, to somedegree, any other pollutant that will react with,or dissolve in, the scrubber fluid. Wet scrubberscan also be designed for multipurpose removal.For instance, a scrubber can be designed toremove both particulate matter and sulfuricacid fumes by using a caustic solution as thescrubbing fluid in a system also configured toremove particulates.
Wet scrubbers that are intended for differenttarget pollutants have several design andconstruction features in common. Figure 10-6presents a schematic drawing of a basic wet“scrubbing tower,” which has physical featuresthat are common to wet scrubbers used formany different target pollutants.
As diagrammed in Figure 10-6, the compo-nents of a basic scrubber include a vessel, sometype of packing (of which there are many dif-ferent types), a fan, or blower, a reservoir forthe scrubber fluid, and a pump for the fluid.There are many options for additional featuresand many optional configurations for the sys-tem as a whole.
Venturi ScrubbersVenturi scrubbers are intended for removal
of only particulates. Figure 10-7 shows a dia-gram of a venturi scrubber, which consists of arestriction in the air transport ductwork andspray nozzles located either in the restrictedzone, referred to as the “throat” of the venturi,or just upstream of the throat. The throat is

Methods for Treating Air Discharges from Industry 443
Figure 10-5 Bag house air filter installation. (From Cooper and Alley, Air Pollution Control: A Design Approach, 2nd Edi-tion, 1986. Reprinted by permission of Waveland Press, Inc., Prospect Heights, Illinois.)
preceded by a “converging section” and is fol-lowed by a “diverging section.” These twosections constitute the venturi.
The mechanism for removing particulatesfrom the air stream with a venturi scrubber is asfollows: As the stream of gas approaches thethroat of the venturi, its velocity increasesdramatically. The kinetic energy imparted bythe high velocity shears the fluid sprayed intothe gas stream into tiny droplets. Particulatesand other substances in the gas stream becomeadsorbed onto the extremely large surface areaof the fluid droplets. Then, as the gas streamslows down to its original velocity in thediverging section and beyond, the droplets coa-lesce, become too heavy to be propelled alongwith the gas stream, and consequently, settleout of the stream under the influence of gravity.
Venturi scrubbers have the advantage ofbeing relatively inexpensive in terms of bothfirst cost and costs for operation and havefew, if any, moving parts other than theblower. On the other hand, venturi scrubbersare relatively low-efficiency treatment devices.They are most often used as pretreatmentdevices, upstream from devices with higherremoval efficiency, such as packed wetscrubbers.
Tray Scrubbers
Tray scrubbers, a diagram of which is shownin Figure 10-8, are somewhat more extensivethan venturi scrubbers. Tray scrubbers may beused for pretreatment or as the only treatmentfor certain air streams.

444 Industrial Waste Treatment Handbook
Figure 10-6 Schematic of a basic wet scrubber.
As shown in Figure 10-8, the basic compo-nents of a tray scrubber include a set of ori-fices, or nozzles, a set of trays that may beperforated, in addition to the basic componentsillustrated in Figure 10-8. The mechanism bywhich tray scrubbers remove particulates fromgas streams is as follows: The orifices or noz-zles direct the gas stream onto the trays, whichare covered with the scrubber fluid. As thestream of gas proceeds through the orifices, thevelocity of the gas increases rather suddenly.The particulates are carried by inertia into the
scrubber fluid and are thus removed from theair stream. The high velocity of the gas as itstrikes the fluid-covered plates serves a secondpurpose, which is to cause the fluid to becomefrothy, greatly increasing the fluid surface areaand thus particle capture efficiency.
Treatment Systems for Control of Gaseous Pollutants
Five methods are in general use for removinggaseous pollutants from gas streams:

Methods for Treating Air Discharges from Industry 445
Figure 10-7 Diagram of a venturi scrubber.
• Adsorption• Absorption• Condensation• Incineration• Biofiltration
Activated carbon is the technology in mostgeneral use for treating gas streams by the
mechanism of adsorption. Those that employthe mechanism of absorption or condensation,or both, often use wet scrubbers as thebasic equipment. Incineration is normallyaccomplished in a chamber of more sophisti-cated design than either carbon columns orscrubbers, and normally requires a high degreeof safety assurance technology.
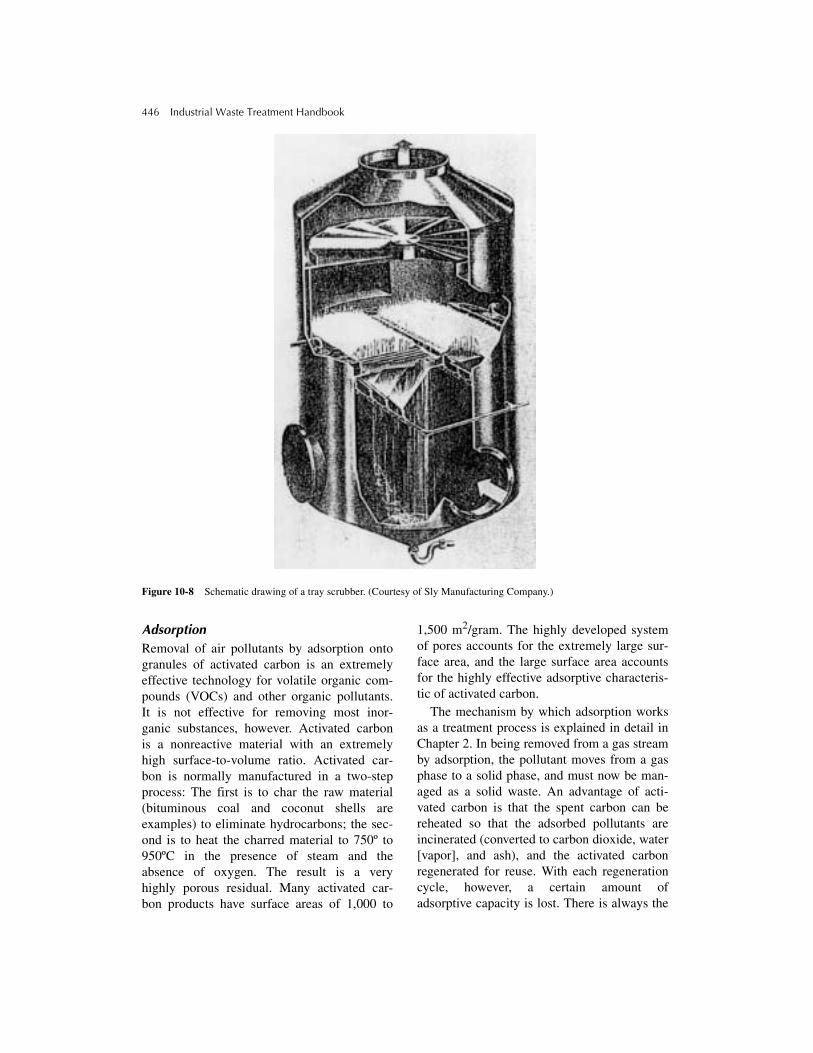
446 Industrial Waste Treatment Handbook
Figure 10-8 Schematic drawing of a tray scrubber. (Courtesy of Sly Manufacturing Company.)
AdsorptionRemoval of air pollutants by adsorption ontogranules of activated carbon is an extremelyeffective technology for volatile organic com-pounds (VOCs) and other organic pollutants.It is not effective for removing most inor-ganic substances, however. Activated carbonis a nonreactive material with an extremelyhigh surface-to-volume ratio. Activated car-bon is normally manufactured in a two-stepprocess: The first is to char the raw material(bituminous coal and coconut shells areexamples) to eliminate hydrocarbons; the sec-ond is to heat the charred material to 750º to950ºC in the presence of steam and theabsence of oxygen. The result is a veryhighly porous residual. Many activated car-bon products have surface areas of 1,000 to
1,500 m2/gram. The highly developed systemof pores accounts for the extremely large sur-face area, and the large surface area accountsfor the highly effective adsorptive characteris-tic of activated carbon.
The mechanism by which adsorption worksas a treatment process is explained in detail inChapter 2. In being removed from a gas streamby adsorption, the pollutant moves from a gasphase to a solid phase, and must now be man-aged as a solid waste. An advantage of acti-vated carbon is that the spent carbon can bereheated so that the adsorbed pollutants areincinerated (converted to carbon dioxide, water[vapor], and ash), and the activated carbonregenerated for reuse. With each regenerationcycle, however, a certain amount ofadsorptive capacity is lost. There is always the
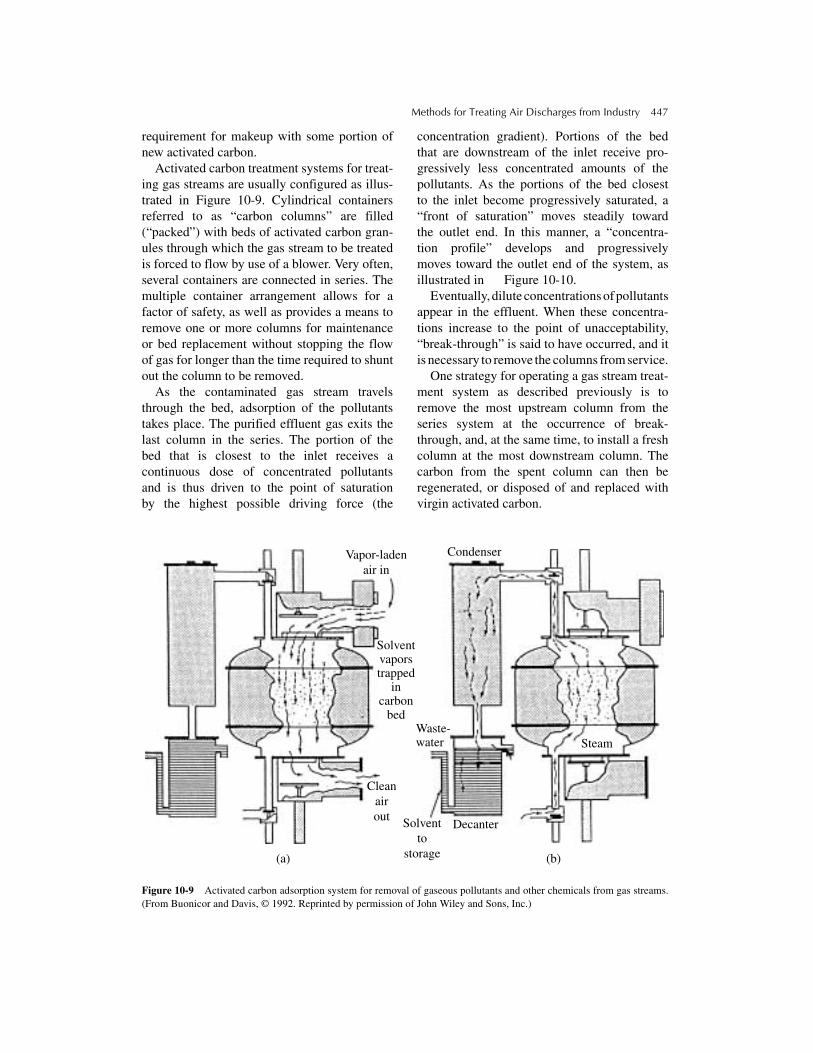
Methods for Treating Air Discharges from Industry 447
requirement for makeup with some portion ofnew activated carbon.
Activated carbon treatment systems for treat-ing gas streams are usually configured as illus-trated in Figure 10-9. Cylindrical containersreferred to as “carbon columns” are filled(“packed”) with beds of activated carbon gran-ules through which the gas stream to be treatedis forced to flow by use of a blower. Very often,several containers are connected in series. Themultiple container arrangement allows for afactor of safety, as well as provides a means toremove one or more columns for maintenanceor bed replacement without stopping the flowof gas for longer than the time required to shuntout the column to be removed.
As the contaminated gas stream travelsthrough the bed, adsorption of the pollutantstakes place. The purified effluent gas exits thelast column in the series. The portion of thebed that is closest to the inlet receives acontinuous dose of concentrated pollutantsand is thus driven to the point of saturationby the highest possible driving force (the
concentration gradient). Portions of the bedthat are downstream of the inlet receive pro-gressively less concentrated amounts of thepollutants. As the portions of the bed closestto the inlet become progressively saturated, a“front of saturation” moves steadily towardthe outlet end. In this manner, a “concentra-tion profile” develops and progressivelymoves toward the outlet end of the system, asillustrated in Figure 10-10.
Eventually, dilute concentrations of pollutantsappear in the effluent. When these concentra-tions increase to the point of unacceptability,“break-through” is said to have occurred, and itis necessary to remove the columns from service.
One strategy for operating a gas stream treat-ment system as described previously is toremove the most upstream column from theseries system at the occurrence of break-through, and, at the same time, to install a freshcolumn at the most downstream column. Thecarbon from the spent column can then beregenerated, or disposed of and replaced withvirgin activated carbon.
Figure 10-9 Activated carbon adsorption system for removal of gaseous pollutants and other chemicals from gas streams.(From Buonicor and Davis, © 1992. Reprinted by permission of John Wiley and Sons, Inc.)
Solventto
storage
Cleanairout
Waste-water
Decanter
Steam
(b)(a)
Solventvaporstrapped
incarbon
bed
Vapor-ladenair in
Condenser

448 Industrial Waste Treatment Handbook
Figure 10-10 Concentration profile along adsorption column.
Adsorbents Other Than Activated CarbonCertainly, activated carbon is the most com-monly used adsorbent for treatment of gasstreams for removal of gaseous pollutants.Other adsorbents that have been successfullyused include a variety of resins, activated alu-mina, silica gel, and so-called molecular sieves.One of the primary characteristics of a goodadsorbent is a high surface area per unit weight.Although no commercially available productscompare to activated carbon in this respect,other characteristics in combination with rea-sonably high surface area per unit weight makesome adsorbents useful for certain applications.
ResinsResins are produced by inducing con-
trolled cross-linking between certain organic
substances. Resins with a surface area of 100to about 700 m2 per gram can be produced toexhibit a high selectivity for certain sub-stances. For instance, phenolic resins havebeen successfully used to remove odoroussubstances from air streams.
Resins can be produced in granular formsuch that they resemble activated carbon inphysical size and shape. Resins can, therefore,be used in a packed bed configuration, usingthe same vessels and equipment as are used foractivated carbon.
Activated AluminaActivated alumina is produced by a special-
ized heat treatment of aluminum trihydrate, aprimary ingredient of bauxite as it is mined. Itcan be obtained in granular form similar in size

Methods for Treating Air Discharges from Industry 449
and shape to activated carbon granules. There-fore, it can be directly substituted for activatedcarbon to use the same physical set-up andequipment. Although activated alumina is mostoften used to remove moisture from air, it hasbeen used, and has potential use, for removalof certain air pollutants from gas streams thatare either being discharged to the air or arebeing recycled. A potential use is in series withanother adsorbent. Surface areas of activatedalumina products are in the range of 300 m2
per gram.
Silica GelSilica gel has been used to remove sulfur
compounds from a gas stream, and to removewater from gas. It is produced by neutralizing,washing, drying, and roasting sodium silicate.It can be obtained in granular form, and as isthe case with resins and activated alumina, itcan be used in the same physical set-up as acti-vated carbon. Silica gel products have surfaceareas of about 700 to 800 m2 per gram.
Molecular SievesMolecular sieves have been effectively used
for removing odorous chemical substances,such as hydrogen sulfide, and methyl and ethylmercaptans from gas streams. They are crystal-line substances manufactured from aluminosil-icate and can be obtained in granular form andused as a substitute for activated carbon, usingthe same equipment in the same configuration.Molecular sieves have surface areas compara-ble to activated carbon. Typically, the surfacearea of molecular sieve products averagesabout 1,200 m2 per gram.
AbsorptionThe chemical mechanism of absorption is thatof dissolution. In a gas stream treatment systemthat employs absorption as the treatmenttechnology, the stream of gas to be dischargedto the air or recycled for reuse is brought intointimate contact with a liquid. Substances dis-solve into the liquid and are thus removed fromthe gas stream. In some cases, the removed
substance changes in character, but in othercases it does not. Either way, the removed sub-stance has been converted from an air pollutantto a potential water pollutant and must be dealtwith further. Absorption systems, then, are notcomplete as treatment systems in themselvesbut are components of treatment systems.
The primary purpose of absorption equip-ment is to first, contain the pollutants, and thento maximize the opportunity for pollutants tomove from the gas phase to the liquid phase.This is accomplished by maximizing the sur-face area of the liquid absorbent and causingthe gas stream to move past as much of the liq-uid surface as possible. Time of contact, ofcourse, is a major parameter.
Where the target pollutants are highly solu-ble in water, the liquid absorbent can be water.However, a chemical substance is usuallypresent in the liquid absorbent that readilyreacts with the target pollutant to form a prod-uct that is either highly soluble in the liquidabsorbent or that forms a precipitate. Forinstance, sulfur dioxide, a gas at ambient tem-peratures, can be removed from a stream of airby contacting it with a solution of sodiumhydroxide. Soluble sodium sulfate will quicklyform and remain in the liquid. As anotherexample, a stream of air containing silver sul-fate in aerosol form can be contacted with anaqueous solution of sodium chloride. Insolublesilver chloride will form and remain suspendedin the liquid until it is removed by an additionaltreatment step.
The “packed tower,” an air pollution treat-ment system that resembles the wet scrubbersystem used for removal of particulates and dis-cussed earlier, is the most common technologyused for removal of gaseous (and aerosol) pol-lutants. The basic components of packed towertechnology are illustrated in Figure 10-11.
The packed tower system, also called a“packed column,” consists of the followingelements:
• A vessel (tower), usually cylindrical, usu-ally constructed of steel and coated asneeded to prevent corrosion or other formsof destruction.

450 Industrial Waste Treatment Handbook
Figure 10-11 Schematic drawing of a packed tower absorber. (From Alley, © 1998. Reprinted by permission of McGraw-Hill, Inc.)
• Packing to promote intimate contact betweenmolecules of target pollutants and the liquidabsorbent.
• A spray distribution system to apply the liq-uid absorbent evenly over the entire topsurface of the packing.
• A reservoir, usually at the bottom of thetower, to serve as a wet well for the pump.
• A pump to transfer liquid absorbent fromthe reservoir to the spray system.
• A blower to force the gas stream from itssource to the packed tower and up throughthe packing.
• A support floor, highly perforated, to holdthe packing above the reservoir to provide
a space for incoming gas (influent) to dis-tribute itself evenly across the cross-sectionof the tower. It also serves as an inletdevice to promote even application of theinfluent gas to the bottom of the column ofpacking. It must also allow the liquidabsorbent to readily drain away from thepacking.
Additional elements that are often includedas components of a packed tower absorptionsystem are the following:
• A packing restrainer to prevent the individ-ual units of packing material from beingcarried up by the gas as it passes through thepacking.
ENTRAINMENT SEPARATOR(DEMISTER)
LIQUID DISTRIBUTOR
PACKING RESTRAINER
SHELL
GAS OUTLET
LIQUIDINLET
RANDOM PACKING
ACCESS MANWAY FORPACKING REMOVAL
LIQUIDREDISTRIBUTOR
ACCESS MANWAY FORPACKING REMOVAL
PACKING SUPPORT
GAS INLET
OVERFLOW
LIQUID OUTLET

Methods for Treating Air Discharges from Industry 451
• A demister to prevent droplets of liquidfrom exiting the tower with the exitingtreated gas stream.
• An overflow device to maintain the properdepth of liquid absorbent in the reservoir.
• A liquid redistributor located within thedepth of the packing to collect liquid absor-bent after it has flowed through a portion ofthe packing and redistribute it over the topsurface of the next portion of packing.
A description of the operation of the packedtower is as follows: The liquid absorbent ispumped continuously from the reservoir to thespray distribution system. After being appliedevenly over the top surface of the packingmaterial, the liquid absorbent flows slowlydown over the surfaces of the packing. As thegas stream, which has entered the tower in thespace between the reservoir and the bottom ofthe packing, flows up through the packing, sub-stances that can dissolve in the liquid do so.These substances have thus been removed fromthe gas stream, which continues its upwardflow and exits the tower at the top. Excessmoisture in the form of aerosol-size droplets orlarger are trapped by the demister as the gasstream passes through.
Design parameters for a packed tower sys-tem include quantity of packing material andthe flow rate capacity of the blower. Theseparameters, in addition to the flow rate capacityof the liquid absorbent pump, determine thetime of contact between the gas stream and theabsorbent. The physical characteristics of thepacking material have a great effect on themass transfer efficiency because the more thinthe film of liquid absorbent as it flows downover the packing, and the more turbulent theflow of this thin film, the greater is the opportu-nity for each molecule of target pollutant tocontact nonsaturated absorbent in which it candissolve or otherwise interact. In the samemanner, the physical characteristics of thepacking material influence the characteristicsof flow of the gas stream up through it. Themore torturous the flow paths and turbulent theflow of the gas, the greater the opportunity isfor individual molecules of target pollutant to
actually physically contact the liquid absor-bent. The greater contact leads to higherremoval efficiency, all other influences beingequal.
CondensationGases can be changed to liquids by decreasingtemperature, increasing pressure, or both.Thus, the mechanism by which condensationtechnology accomplishes air pollutant removalis based on the generalized gas law, stated as:
(10-1)
or,
(10-2)
where:
V = Volume of a given weight of gas, or,
volume /unit wt (m3/g)n = Number of moles of gas in the volume, VR = Universal gas constantP = Pressure exerted on the volume of gasT = Absolute temperature of the gas in
volume, V
which states that the volume that a givenweight of gas occupies decreases as tempera-ture decreases and pressure increases. At somepoint, the gas changes from the gaseous state tothe liquid state, after which it no longer obeysthe gas laws.
The most commonly used equipment thatemploys condensation technology uses temper-ature decrease as the mechanism. Often, water-cooled condensers are used as pretreatmentdevices to remove easily condensed substances(such as vapors of sulfuric acid) to protect orprolong the operating cycle times of down-stream equipment. Figure 10-12 presents sche-matic drawings of three types of condensersused to remove gaseous pollutants from gasstreams.
IncinerationThe fundamental mechanism on which incin-eration technology for air pollution control is
PV nRT=
VnRT
P----------=

452 Industrial Waste Treatment Handbook
based is combustion. Combustion of organicpollutants entails conversion to carbon diox-ide, water, and ash. Some inorganic materials,such as sulfur and nitrogen, are often oxi-dized to problematic substances during thecombustion process. Other inorganic materi-als—for instance, heavy metals—becomeincorporated in the ash and can add to ulti-mate disposal problems.
As an air pollution abatement technology,incineration is used for many purposes, includ-ing odor control, reduction of releases ofhydrocarbons to the air (flares at petroleumrefineries, for example), and destruction of vol-atile organic compounds (VOCs).
In the context of air pollution control, incin-erators are of two types: thermal oxidizers andcatalytic oxidizers. The difference between thetwo is that thermal oxidizers accomplish com-bustion by use of heat alone. Catalytic oxidiz-ers, on the other hand, use a catalyst todecrease the activation energy of the combus-tion process, or to otherwise effect accelerationof the combustion process, and are thus able toaccomplish reasonably complete combustion atsignificantly lower temperatures.
Thermal OxidizersThe basic components of a thermal oxidizer
for air pollution control are illustrated in Figure10-13.
A typical thermal oxidizer consists of a com-bustion chamber in which the combustion pro-cess takes place; a burner, for combusting asupport fuel, needed to elevate the temperaturein the combustion chamber as necessary; aninjection device, used to inject what is to betreated into the combustion chamber; and aflue, used to transport the treated gas stream tothe discharge location.
Additional components that can be added toa thermal oxidizer include heat recovery equip-ment and a system to “preheat” the gas streamcontaining pollutants.
Catalytic OxidizersAs explained previously, the process of cata-
lytic oxidization is essentially the same as ther-mal oxidization except that a catalyst enablesthe combustion process to take place at lowertemperatures. The advantages include lessexpensive construction costs for the equipmentand reduced use of auxiliary fuel.
Figure 10-12 Three types of condensers for air pollution control.

Methods for Treating Air Discharges from Industry 453
A schematic drawing of a typical catalyticoxidizer is shown in Figure 10-14; a photo-graph of a catalytic oxidizer in operation is pre-sented in Figure 10-15.
Biofiltration
GeneralThe removal of air contaminants from air
streams by means of dissolution of those con-taminants into water, followed by biodegreda-tion of the contaminants, has been a usefulconcept for control of air pollutants for manyyears. When a solid phase filter is usedas the medium to contain both the liquid intowhich the contaminants dissolve and the
microorganisms to effect the biodegradation,the process is known as “biofiltration.” Biofil-tration has been used since the mid-1970s fortreatment of malodorous compounds as wellas volatile organic compounds (VOCs). Thistechnology is applicable to the treatment ofcontaminated air that contains the normal con-centration of oxygen and dilute concentra-tions of biodegradable organic gasses.
The solid phase filter is normally compost,sphagnum peat, or soil. The solid media aresurrounded by a film of aqueous liquor, whichis teeming with microorganisms. As the streamof contaminated air flows through the filter,the contaminants dissolve into the aqueousliquor (driven by entropy). These dissolvedcontaminants are then consumed as food by
Figure 10-13 Basic components of a thermal oxidizer for air pollution control. (From Freeman, © 1989. Reprinted by per-mission of McGraw-Hill, Inc.)
Figure 10-14 Schematic drawing of a typical catalytic oxidizer. (From Buonicore and Davis, © 1992. Reprinted by per-mission of John Wiley and Sons, Inc.)

454 Industrial Waste Treatment Handbook
the microorganisms. Carbon dioxide, water,oxidized organic compounds, and more micro-organisms are the end products. When reducedsulfur compounds such as hydrogen sulfide,dimethyldisulfide, and mercaptans are presentas contaminants to be removed from the streamof contaminated air, mineral acids are amongthe end products.
Oxygen contained in the stream of contami-nated air is necessary in order to maintain aero-bic conditions within the biofilter. Also,nitrogen, phosphorus, and other nutrients arerequired to maintain a robust microbial popula-tion. Typically, a solution of water containingsufficient nutrients is sprayed onto the biofilterto supply sufficient moisture as well as nutri-ents. In addition, the stream of contaminatedair is humidified before it is applied to the bio-filter. The drying action (by means of evapora-tion) of the stream of air flowing through thebiofilter must be counterbalanced by thehumidifier and the applied liquid spray.
Figure 10-16 presents a schematic of a typi-cal biofilter system, which consists of a bed offilter material, an air distribution system, a sys-tem to supply nutrients, a humidifier, a blower,and ductwork. The filter material can be com-posed of compost material, sphagnum peat, orhighly porous soil. The filter bed is typicallyabout one meter (3 feet, or so) in depth.
Figure 10-15 Photograph of an operating catalytic oxi-dizer. (Courtesy of Stealth Industries, Inc.)
DesignA primary design parameter of a biofilter
system is residence time (i.e., the stream ofcontaminated air must remain within the filterbed for sufficient time for the contaminants todissolve into the liquid that surrounds the filtermedia). A second design parameter relates tothe quantity of liquid to be maintained withinthe filter bed. If too much liquid is supplied tothe bed, then the pores, or passageways, for airwill be blocked, with the consequence thatanoxic or anaerobic conditions will develop. Ifinsufficient liquid is present within the filterbed, the target contaminants will not dissolveout of the air stream, with the consequence thattreatment will not take place. Other designparameters include quantity and type of nutri-ents to be supplied, temperature control, pHcontrol, and removal of excess liquid.
The residence time for the biofilter is a func-tion of rate of flow of contaminated air as wellas volume of filter media. Because it has beendetermined through operating experience that afilter bed depth of about 1 meter is optimum,the parameter of filter volume reduces to one offilter area; that is, the horizontal dimensions ofthe filter bed. Successful biofilter systems havefilter areas that range from 100 to 22,000 ft2
(10 to 2,000 m2). Flow rates of contaminatedgases have ranged from 600 to 90,000 cfm(1000 to 150,000 m3/hr). These parameters arecompatible with air pollutant treatment rates of10 to 100 g/m3/hr., and surface loads of up to16 scfm/ft2 (300 m3/hr./m2). The optimalvalues for these parameters for any givenapplication depend on the filter media, the con-centration of pollutants, and the nature of thepollutants, as well as the temperature, pH, andalkalinity.
The nature of the filter media has a majorinfluence on the economics of construction andoperation of a biofilter system, in that the cost ofoperation is highly dependent on the amount ofelectrical energy used to blow contaminated airthrough the filter. The amount of electricalenergy, in turn, is a function of the back pressurecreated by the filter. The back pressure increaseswith rate of flow, decrease in filter media poros-ity, increase in filter moisture content, and is

Methods for Treating Air Discharges from Industry 455
Figure 10-16 Schematic of a typical biofilter system.
affected by temperature. Also, increased bio-logical growth on the filter media increases theback pressure.
Sphagnum peat is an excellent medium forbiofilters. This material, when handled andinstalled properly, provides for extremely largesurface area, allows relatively free flow of air,holds moisture well, and provides an excellentmedium for the growth and maintenance of arobust microbial population. In particular, sph-agnum peat harbors microbial populations thathave a high percentage of fungi species, whichare very effective in breaking down certain airpollutants. Sphagnum peat can be obtained inlarge quantities through agricultural supplyoutlets.
Compost material has also proved to be aneffective medium for biofilters. Use of compostderived from municipal solid waste, bark, treetrimmings, and leaves has the additional bene-fit of avoiding the creation of more solid waste.
Eitner has developed values for parametersfor filter material as follows:
• Pore volume > 80%
• pH - between 7 and 8
• d60 > 4 mm
• Total organic matter content > 55%
Operation and MaintenanceOver time, biofilter beds have undergone set-
tling and consolidation to such an extent that
“fluffing” is required in order to avoid excessback pressure and channeling of air flow. Typi-cally, beds have required reworking at 2-yearintervals, with complete replacement every 5 to6 years.
Routine and periodic maintenance of biofil-ters includes:
Daily check of major operating parameters:
• Off-gas temperature
• Off-gas humidity
• Filter temperature
• Back pressure
• Periodic check of filter moisture content andpH
When designed, operated, and maintainedproperly, biofilter technology offers an effec-tive, low-cost solution to control air pollutioncaused by dilute concentrations of malodorusreduced sulfur compounds, certain VOCs, andmany other biodegradable organics. Industriesthat have successfully used biofilters, world-wide, include:
• Fish rendering
• Print shops
• Pet food manufacturing
• Flavors and fragrances
• Residential wastewater treatment plants
• Landfill gas extraction
• Tobacco processing

456 Industrial Waste Treatment Handbook
• Chemical manufacturing
• Chemical storage
• Industrial wastewater treatment plants
Bibliography
Alley, R.E., and Associates, Inc., Air QualityControl Handbook, McGraw-Hill, NewYork, 1998.
Avallone, E.A., and T. Baumeister, III (eds.),Marks’ Standard Handbook for MechanicalEngineers, 9th ed., McGraw-Hill, New York,1987.
Billings, C.E., and J. Wilder, Handbook of Fab-ric Filter Technology, Vol. 1: Fabric FilterSystems Study, GCA Corp., Bedford, Massa-chusetts; PB-200-648, NTIS, Springfield,Virginia, December 1970.
Bilotti, J.P., and T.K. Sutherland, in Air Pollu-tion Control Equipment: Selection, Design,Operation and Maintenance, L. Theodoreand A.J. Buonicore (eds.), Prentice-Hall,Englewood Cliffs, New Jersey, 1982.
Borgwardt, R.H., “Limestone Scrubbing ofS02 at EPA Pilot Plant,” Monsanto ResearchCompany, Progress Report 12, St. Louis,Missouri, 1973.
Buonicore, A.J., and W.T. Davis, Air PollutionEngineering Manual, Van Nostrand Rein-hold, New York, 1992.
Cheremisinoff, P.N., and R.A. Young (eds.),Pollution Engineering Practice Handbook,Ann Arbor Science, Ann Arbor, Michigan,1975.
Control Techniques for Sulfur Oxide Emissionsfrom Stationary Sources, 2nd ed., EmissionStandards and Engineering Division, EPA45013-811064, Research Triangle Park,North Carolina, 1981.
Control Technologies for Hazardous Air Pollut-ants, U.S. Environmental Protection Agency,Office of Research and Development, EPA625/6-91/014, Washington, D.C., 1991.
Cooper, C.D., and F.C. Alley, Air PollutionControl: A Design Approach, WavelandPress, Inc., Prospect Height, Illinois, 1986.
Crawford, M., Air Pollution Control Theory,McGraw-Hill, New York, 1976.
Davis, W.T., and R.F. Kurzynske, “The Effectof Cyclonic Precleaners on the PressureDrop of Fabric Filters,” Filtration Separa-tion, 16(5).
Davis, W.T., and W.F. Frazier, “A laboratoryComparison of the Filtration Performance ofEleven Different Fabric Filter Materials Fil-tering Resuspended Flyash,” Proceedings ofthe 75th Annual Meeting of the Air PollutionControl Association, 1982.
Dennis, R., and H.A. Klemm, Fabric FilterModel Format Change, Vol. 1: DetailedTechnical Report, EPA 600/7-79-0432, U.S.Environmental Protection Agency.
Dennis, R., R.W. Cass, D.W. Cooper, et al., Fil-tration Model for Coal Flyash with GlassFabrics, EPA 600-7-77-084, August 1977.
Donovan, R.P., B.E. Daniel, and J.H. Turner,EPA Fabric Filtration Studies, 3. Perfor-mance of Filter-Bags Made From ExpendedPTFE Laminate, EPA 600/2-76-168c, U.S.Environmental Protection Agency, ResearchTriangle Park, North Carolina, December1976, NTIS PB-263-132.
Durham, J.F., and R.E. Harrington, “Influenceof Relative Humidity on Filtration Resis-tance and Efficiency of Fabric Dust filters,”Filtration Separation, 8:389–393, July/August 1971.
Eitner, D., and H.G. Gethke, “Design Con-struction and Operation of Bio-filters forOdor Control in Sewage Treatment Plants,”80th Annual meeting of the Air PollutionControl Association, New York, 1987.
Ellenbecker, M.J., and D. Leith, “DustRemoval from Nonwoven Fabrics,” AnnualMeeting of the Air Pollution ControlAssociation, Montreal, Quebec, June 22–27,1980.
Evaluation of the Efficiency of IndustrialFlares: Test Results, U.S. EnvironmentalProtection Agency, EPA 600/2784/095,Washington, D.C., 1984.
Fernandes, I.H., “Incinerator Air PollutionControl,” Proceedings of National Incinera-tor Conference, ASME, New York, 1970.
Frazier, W.F., and W.T. Davis, “Effects of Fly-ash Size Distribution on the Performance ofa Fiberglass Filter,” Symposium on the
Methods for Treating Air Discharges from Industry 457
Transfer and Utilization of Particulate Con-trol Technology. Vol. II: Particulate ControlDevices, EPA-600/9-82-0050c, July 1982,pp. 171–180.
Frederick, E.R., Electrostatic Effects in FabricFiltration: Volume 11, Turboelectric Mea-surements and Bag Performance (annotateddata), EPA-600/7-78-142b, NTIS PB-287-207, July 1978.
Freeman, H.M. (ed.), Standard Handbook ofHazardous Waste Treatment and Disposal,McGraw-Hill, New York, 1989.
Greiner, G.P., J.C. Mycock, and D.S. Beachler,“The IBFM, a Unique Tool for Trouble-shooting and Monitoring Baghouses,” Paper85-54.2, Annual Meeting of the Air PollutionControl Association, Detroit, Michigan, June1985.
Hotchkiss, C.B., and L.F. Cox, “Fabric andFinish Selection, Manufacturing Techniquesand other Factors Affecting Bag Life in theCoal-fired Boiler Applications,” Proceed-ings Second EPRI Conference on FabricFilter Technology for Coal-Fired PowerPlants, Electric Power Research Institute,Palo Alto, California, EPRI CS-3257,November 1983.
Katz, J., “The Art of Electrostatic Precipita-tion,” Precipitator Technology, Inc.,Munhall, Pennsylvania, 1979.
Ketchuk, M.M., A. Walsh, O.F. Fortune, et al.,“Fundamental Strategies for CleaningReverse-air Baghouses,” Proceedings FourthSymposium on the Transfer and Utilizationof Particulate Control Technology, Vol. 1:Fabric Filtration, EPA-600/9-84-025a, U.S.Environmental Protection Agency, ResearchTriangle Park, North Carolina, November1984.
Larson, R.I., “The Adhesion and Removal ofParticles Attached to Air Filter Surface,”AIHA Journal, 19 (1958).
Licht, W., Air Pollution Control Engineering,Marcel Dekker, New York, 1980.
Liptak, B.G. (ed.), Environmental Engineers’Handbook, Volume II, Air Pollution, ChiltonBook Company, Radnor, Pennsylvania, 1974.
Lund, H.F. (ed.), Industrial Pollution ControlHandbook, McGraw-Hill, New York, 1971.
Magill, P.L., F.R. Holden, and C. Ackley (eds.),Air Pollution Handbook, McGraw-Hill, NewYork, 1956.
“Menard Cleaning of a Fabric Filter Dust Col-lector,” Proceedings Fourth Symposium onthe Transfer and Utilization of ParticulateControl Technology, Vol. 1: Fabric Filtration,EPA 600/9-84-025a, U.S. EnvironmentalProtection Agency, Research Triangle Park,North Carolina, November 1984.
National Research Council, Odors from Sta-tionary and Mobile Sources, Contract 68-01-4655, U.S. Environmental ProtectionAgency, Washington, D.C., 1979.
Ottmers, D.M., et al., “Evaluations of Regener-able Flue Gas Desulfurization Processes,”Vol. 11, Electric Power Research Institute,EPRI RP-535-1, Palo Alto, California, 1976.
Perry, R., et al. (eds.), Perry’s Chemical Engi-neers’ Handbook, McGraw-Hill, New York,1973.
Rafson, H.J. (ed.), Handbook of Odor and VOCControl, McGraw-Hill, New York, 1998.
Reisinger, A.A., and W.T. Grubb, “Fabric Eval-uation Program at Coyote Unit #1, OperatingResults Update,” Proceedings Second EPRIConference on Fabric Filter Technology forCoal-Fired Power Plants, Electric PowerResearch Institute, Palo Alto, California,EPRI CS03257, November 1983.
Robinson, J.W., R.E. Harrington, and P.W.Spaite, “A New Method for Analysis ofMulticompartmented Fabric Filtration,”Atmospheric Environment, 1(4):499, 1967.
Siebert, P.C., Handbook on Fabric Filtration,ITT Research Institute, Chicago, 1977.
Stern, A.C. (ed.), Air Pollution, 3rd ed., Aca-demic Press, New York, 1977.
Strauss, W., Industrial Gas Cleaning, 2nd ed.,Pergamon Press, Oxford, England, 1975.
The Fabric Filter Manual, C. E. Billings (ed.),McIlvaine Co., Northbrook, Illinois.
Theodore, L., and A. Buonicore, Industrial AirPollution Control Equipment, CRC Press,Cleveland, Ohio, 1976.
U.S. Department of Health, Education andWelfare, Recommended Industrial Ventila-tion Guidelines, Publication No. (NIOSH)76-162, Washington, D.C., 1976.

458 Industrial Waste Treatment Handbook
U.S. Department of the Interior, Methods andCosts for Stabilizing Fine-Sized MineralWastes, Bureau of Mines, RI 7896,Washington, D.C., 1974.
U.S. Environmental Protection Agency, FlueGas Desulfurization System Capabilities forCoal-Fired Steam Generators, Volume 11,EPA 600/7-78/032b, Washington, D.C.,1978.
U.S. Environmental Protection Agency, FlueGas Desulfurization: Lime/Limestone Pro-cesses, Technology Transfer, EPA 625/8-81/006, Research Triangle Park, NorthCarolina, 1981.
U.S. Environmental Protection Agency, Fugi-tive Emissions from Integrated Iron and SteelPlants, EPA 600/2-78/050, Washington,D.C., 1978.
U.S. Environmental Protection Agency, Man-ual of Electrostatic Precipitator Technology,APTD 0610, Washington, D.C., 1970.
U.S. Environmental Protection Agency, “Stan-dards of Performance for New StationarySources,” Code of Federal Regulations, Title40, Part 60, U.S. Government PrintingOffice, Washington, D.C., 1971–1997.
U.S. Environmental Protection Agency, “Stan-dards of Performance for New StationarySources,” Code of Federal Regulations, Title40, Part 60, U.S. Government Printing Office,Washington, D.C., 197l–1988.
U.S. Environmental Protection Agency, Air Pol-lution Engineering Manual, 2nd ed, AP-40,Research Triangle Park, North Carolina, 1973.
U.S. Environmental Protection Agency, AnUpdate of the Wellman-Lord Flue Gas Des-ulfurization Process, EPA 600/2-76/136a,Washington, D.C., 1976.
U.S. Environmental Protection Agency, Assess-ment of the Use of Fugitive Emission ControlDevices, EPA 600/7-79/045, Washington,D.C., 1979.
U.S. Environmental Protection Agency, Capi-tal and Operating Costs of Selected AirPollution Control Systems, EPA 450/5-80/002, Washington, D.C., 1978.
U.S. Environmental Protection Agency, Hand-book Control Technology for HazardousAir Pollutants, Center for Environmental
Research Information, EPA 625/6-86/ 014,Cincinnati, Ohio, 1986.
U.S. Environmental Protection Agency, Com-pilation of Air Pollutant Emission Factors,EPA AP-42, Research Triangle Park, NorthCarolina, 1973.
U.S. Environmental Protection Agency, Con-tinuous Emission Monitoring Systems forNoncriteria Pollutants Handbook, Office ofResearch and Development, EPA 1625/R97/001, Cincinnati, Ohio, 1997.
U.S. Environmental Protection Agency, Con-trol of Volatile Organic CompoundEmissions from Manufacture of High-Den-sity Polyethylene, Polypropylene, andPolystyrene Resins, EPA 450/3-83/008,Research Triangle Park, North Carolina.
U.S. Environmental Protection Agency, Con-trol of Volatile Organic Compound Leaksfrom Synthetic Organic Chemical andPolymer Manufacturing Equipment, EPA450/3-83/006, Research Triangle Park,North Carolina, 1983.
U.S. Environmental Protection Agency, Con-trol of Volatile Organic Emissions fromExisting Stationary Sources—Volume 1:Control Methods for Surface Coating Opera-tions, EPA 450/2-76/028, Research TrianglePark, North Carolina, 1976.
U.S. Environmental Protection Agency, Con-trol Techniques for Nitrogen OxidesEmissions from Stationary Sources, rev. 2nded., Emission Standards and EngineeringDivision, EPA 450/3-83/002, Research Tri-angle Park, North Carolina, 1983.
U.S. Environmental Protection Agency, Con-trol Techniques for Particulate Emissionsfrom Stationary Sources, Volume 1, EPA450/3-8 IA05a, Research Triangle Park,North Carolina, 1982.
U.S. Environmental Protection Agency,Enhanced Monitoring Reference Document,Office of Air Quality and Standards, Emis-sion Measurement Branch, Washington,D.C., 1993.
U.S. Environmental Protection Agency, Evalu-ation of Control Technologies for HazardousAir Pollutants—Appendices, EPA 600/7-86/0096, Washington, D.C., 1985.

Methods for Treating Air Discharges from Industry 459
U.S. Environmental Protection Agency, Eval-uation of the Efficiency of IndustrialFlares: Test Results, EPA 600/2-84/095,Washington, D.C., 1984.
U.S. Environmental Protection Agency, AdipicAcid-Enhanced Lime/Limestone Test Resultsat the EPA Alkali Scrubbing Test Facility,Technology Transfer, EPA 625/2-82/029,Research Triangle Park, North Carolina,1982.
U.S. Environmental Protection Agency, FlueGas Desulfurization and Sulfuric Acid Pro-duction Via Magnesia Scrubbing,Technology Transfer, EPA 625/2-75/077,Washington, D.C., 1975.
U.S. Environmental Protection Agency, FlueGas Desulfurization: Dual Alkali Process,Technology Transfer, EPA 625/8-80/004,Research Triangle Park, North Carolina,1980.
U.S. Environmental Protection Agency, FuelGas and Desulferization Injections and Per-formance Evaluation Manual, EnergyEngineering Research Laboratory, EPA 625/1-85/019, Research Triangle Park, NorthCarolina, 1985.
U.S. Environmental Protection Agency, Fugi-tive and Fine Particle Control UsingElectrostatically Charged Fog, EPA 600/7-79/078, Washington, D.C., 1979.
U.S. Environmental Protection Agency, Fugi-tive Emissions from Iron Foundaries, EPA00/7-79/195, Washington, D.C., 1979.
U.S. Environmental Protection Agency, Fugi-tive Emissions Sources of OrganicCompounds, EPA 450/3-82/010, ResearchTriangle Park, North Carolina, 1982.
U.S. Environmental Protection Agency, Fugi-tive VOC Emissions in the Synthetic OrganicChemicals Manufacturing Industry, Off-iceof Air Quality Planning and Standards, EPA625/10-84/004, Research Triangle Park,North Carolina, 1984.
U.S. Environmental Protection Agency, Guide-lines for Development of Control Strategiesin Areas with Fugitive Dust Problems, EPA45012-77/029, Washington, D.C., 1977.
U.S. Environmental Protection Agency,Handbook of Fabric Filter Technology,
APTD-0690, Research Triangle Park, NorthCarolina, 1970.
U.S. Environmental Protection Agency, Hand-book—Control Technologies for HazardousAir Pollutants, Office of Research andDevelopment, EPA 625/6-86/014, Cincin-nati, Ohio, 1986.
U.S. Environmental Protection Agency, Hand-book—Control Technologies for HazardousAir Pollutants, EPA 625/6-86/014, Cincin-nati, Ohio, 1986.
U.S. Environmental Protection Agency, Hand-book—Permit Writer’s Guide to Test BurnData—Hazardous Waste Incineration, EPA625/6-86/012, Cincinnati, Ohio, 1986.
U.S. Environmental Protection Agency, Indus-trial Guide for Air Pollution Control,Technology Transfer, EPA 625/6-78/004,Washington, D.C., 1978.
U.S. Environmental Protection Agency, Inspec-tion Manual for Evaluation of ElectrostaticPrecipitator Performance, EPA 340/1-79/007, Washington, D.C., 1981.
U.S. Environmental Protection Agency, Inves-tigation of Fugitive Dust—Volume I:Sources, Emissions and Control, EPA 450/3-74/036a, Washington, D.C., 1974.
U.S. Environmental Protection Agency, Opera-tion and Maintenance Manual forElectrostatic Precipitators, Air and EnergyEngineering Research Laboratory, EPA 625/1-85/017, Research Triangle Park, NorthCarolina, 1985.
U.S. Environmental Protection Agency, Opera-tion and Maintenance Manual for FabricFilters, Air and Energy Engineering ResearchLaboratory, EPA 625/1-86/020, Research Tri-angle Park, North Carolina, 1986.
U.S. Environmental Protection Agency,Organic Air Emissions from Waste Manage-ment Facilities, Center for EnvironmentalResearch Information, EPA/625/R-92/003,Cincinnati, Ohio, 1992.
U.S. Environmental Protection Agency,Organic Chemical Manufacturing, Volume4: Combustion Control Devices, EPA 450/3-80/026, Washington, D.C., 1980.
U.S. Environmental Protection Agency, Par-ticulate Control by Fabric Filtration on
460 Industrial Waste Treatment Handbook
Coal-Fired Industrial Boilers, IndustrialEnvironmental Research Laboratory, EPA625/2-79/021, Research Triangle Park,North Carolina, 1979.
U.S. Environmental Protection Agency, Physi-cal Coal Cleaning for Utility Boiler SO.,Emission Control, EPA 600/7-78/034,Washington, D.C., 1978.
U.S. Environmental Protection Agency,Procedures Manual for Fabric Filter Evalu-ation, EPA 600/7-78/113, Washington, D.C.,1978.
U.S. Environmental Protection Agency, Regu-latory Options for the Control of Odors, EPA450/5-85/003, Research Triangle Park,North Carolina, 1980.
U.S. Environmental Protection Agency, Stan-dards Support and Environmental ImpactStatement Volume I: Proposed Standards ofPerformance for Grain Elevator Industry,EPA 450/2-77/001a, Washington, D.C., 1977.
U.S. Environmental Protection Agency, Techni-cal Guidance for Development of Control
Strategies in Areas with Fugitive Dust Prob-lems, EPA 450/3-77/010, Washington, D.C.,1977.
U.S. Environmental Protection Agency, Techni-cal Guide for Review and Evaluation ofCompliance Schedules, EPA 3401I-73/00 la,Washington, D.C., 1973.
U.S. Environmental Protection Agency, WetScrubber Handbook, EPA R/72/118a,Research Triangle Park, North Carolina,1972.
U.S. Environmental Protection Agency, WetScrubber Performance Model, EPA 600/2-77/127, Washington, D.C., 1977.
U.S. Environmental Protection Agency, WetScrubber System Study, EPA R2/72/118a,Research Triangle Park, North Carolina,1972.
Vesilind, P.A., and J.J. Pierce, EnvironmentalEngineering, Ann Arbor Science, AnnArbor, Michigan, 1982.
Zimon, A.D., Adhesion of Dust and Powder,Plenum Press, New York, 1969, p. 112.

461
Index
AA/S (air-to-solids) ratio, 375Above-ground storage tanks (ASTs), 164Absorbent, 376Absorption, 449 –551Accounting system, accurate cost, 211Acid Dip, 67Acidity, 185Activated alumina, 448 –49Activated carbon, 376 –81Activated carbon, adsorbents other than, 448–49Activated sludge, 265
aeration systems for, 283–97contact stabilization modification of, 276extended aeration, 276high-rate modification of, 276PACT modification of, 274
Activated sludge process, variations of, 270Activated sludge systems, characteristics of,
283Adsorbents other than activated carbon, 448–49Adsorption, 376–81, 446–47Adsorption equilibria, 376–81Aerated lagoons, 297–98Aeration activated sludge, extended, 276Aeration, deep shaft, 280–82Aeration systems for activated sludge, 283–97Aerobic technologies, 265–310AFFI (American Frozen Food Institute), 77,
79, 81–83Agents
inorganic binding, 430–32inorganic chelating, 248mixtures made stable by chelating, 44organic binding, 429–30organic chelating, 248reaction to destroying or deactivating
chelating, 247–48Air
characteristics of discharges to, 192–97sample collection, 193–97stack sampling, 193
management of discharges to, 20–28
analysis of manufacturing processes, 20–25bench scale investigations, 26economic comparisons, 28pilot scale investigations, 26–27preliminary designs, 27–28selection of candidate technologies, 26treatment objectives, 26wastes minimization and characterization
study, 25–26quantity of, 375
Air discharges from industry, treating, 437–60containment, 437–38fans and ductwork, 438hoods and isolation chambers, 438reduction at source, 437treatment, 438
Air-dissolving system, optimum pressure for,375–76
Air in water, dissolution of, 369–73Air pollutants, 198–200Air pollution control (APC), 106, 155
law as of Year 2000, 56laws, 55–60
Air Pollution Management Plan (APMP), 437Air sampling, ambient, 198–201
air pollutants, 198–200malodorous substances, 200–201sampling methods for air toxics, 201
Air-to-solids (A/S), ratio, 375Air toxics, 198
sampling methods for, 201Alkaline chlorination of cyanide, 239Alkalinity, 185Alodizing, anodizing and, 99–100
waste treatment and disposal, 103wastes generation, 100–101wastes minimization, 101–3
Alternative landfills, 408–9Aluminum die casting, 93–95Ambient air sampling, 198–201American Frozen Food Institute (AFFI), 77,
79, 81–83

462 Industrial Waste Treatment Handbook
American Society for Testing Materials(ASTM), 62
American Society of Civil Engineers (ASCE),293
Anaerobic contact reactors, 318Anaerobic digesters, mixed, heated, 317–18Anaerobic lagoons, 322Anaerobic metabolism, mechanisms of, 312–16Anaerobic suspended growth systems, 316–18Anaerobic technologies
development of, 312using, 310–22
Anaerobic treatment systems, variations of, 316Analysis, sample, 198Annualized costs, 15–16Anodizing and alodizing, 99–100
waste treatment and disposal, 103wastes generation, 100–101wastes minimization, 101–3
APC (air pollution control), 106, 155law as of Year 2000, 56laws, 55–60
APMP (Air Pollution Management Plan), 437ASCE (American Society of Civil Engineers),
293Asphalt, 429ASTM (American Society for Testing Materials),
62ASTs (above-ground storage tanks), 164Attached growth systems, 301–2Audit
waste, 215–16wastes, 166
Audit, Environmental, 166, 172–79
BBags, Tedlar, 193Bar racks, 323Barriers, separation using physical, 322–33Batteries, manufacture of lead acid, 138–44
wastes generation, 141–42wastes minimization, 142–43wastewater treatment, 143–44
Battery manufacture, lead, 138–41Bayer Reaction, 102Bed, fluidized, 310Bed reactors
expanded, 319–20fluidized, 320–21
packed, 321Bed technology, fluidized, 409–12Beef, production and process of, 124–25
production processes, 126treatment and disposal, 128–30wastes generation, 126–27wastes minimization, 127–28
Bench scale investigations, 4–6, 26Best management practices (BMPs), 150–51BET isotherms, 378Bids for construction, competitive, 17–18Binders used for S/S technologies, 429–32Binding agents
inorganic, 430–32organic, 429–30
Biofiltration, 453–56Biological degradable substances, 247Biological oxygen demand (BOD), 154–55,
159, 164, 179–83, 262, 279, 301Biological treatment, 255
of industrial wastes, 256–62kinetics in laboratory, 258–61technologies, 262–322
BMPs (best management practices), 150–51BOD (biological oxygen demand), 154–55,
159, 164, 179–83, 262, 279, 301BOD test considerations, 300–301BOD5 (biological oxygen demand), 79, 81–83,
127Body feed, 339–41Bonding, hydrogen, 37–38Breakpoint chlorination, 238Bulking sludge, 268–70
CCAA (Clean Air Act), 61, 198Candidate technologies, selection of, 4Carbamates, 235
uses in metals removal, 235Car bottom gasification furnaces, 420–21Carbon, adsorbents other than activated, 448–49Carbon monoxide (CO), 199Carbon products, effectiveness among different,
381Catalytic oxidation, 254Catalytic oxidizers, 452–53Caustic, 62CBOD (carbonaceous BOD), 300–301

Index 463
Cellulose manufacturing plant, pretreatmentfor microcrystalline, 8–10
Cement, Portland, 430Centrifugal force, 194Centrifugation, 365–67Chambers, hoods and isolation, 438Chelating agents
inorganic, 248mixtures made stable by, 44organic, 248reaction to destroying or deactivating, 247–48
Chemical descaling, 61–62Chemical methods of wastewater treatment,
230–55reaction to produce insoluble solids, 230–38
Chemical oxygen demand (COD), 183Chemical structure and polarity of water, 36–37Chlorides, 192Chlorination of hydrogen sulfide, 253Chlorine demand, 191–92Chlorine residual, 191–92Clarifier-thickeners
design calculations, 354–61design criteria for, 349–54
Clean Air Act (CAA), 61, 198Clean Water Act (CWA), 61, 172, 179, 186CMR (completely mixed mode), 318CO (carbon monoxide), 199Coacervation, 245Co-precipitation, 253CO2 (carbon dioxide), 199, 256COD (chemical oxygen demand), 183Coke, production and processing of, 103–7
air pollution control, 106coking process, 103–5sources of wastes, 105–6wastes minimization, 106wastewater treatment, 106–7
Coking process, 103–5Colloidal suspensions, 43–44
producing coagulation of, 239–47Colloidal waste systems, coagulation of, 244–47Colloids, lyophobic, 244–45, 245–47Color, 186Companywide philosophy of waste minimization,
211–12Competitive bids for construction, 17–18Completely mixed mode (CMR), 318Composting industrial wastes, process of, 421–27
mechanical composting technology, 425–26windrow composting technology, 423–25
Composting, suitability of waste for, 400Composting technology
mechanical, 425–26windrow, 423–25
Compounds, disadvantages of treatment byproduction of insoluble, 236
Condensation, 194, 451Constituent equalization, 226Construction, competitive bids for, 17–18Contact reactors, anaerobic, 318Containers, evacuated collection, 193Contamination, prevention of groundwater,
151–52Control laws
air pollution, 55–60groundwater pollution, 52–55
Control subsystems, two, 230Conventional complete mix, 273–74Conventional landfill, 400Conventional plug flow, 270–72Copper-forming industry, 74–77
copper forming process, 74–76wastes generation, 76–77
Copper forming process, 74–76Cost accounting system, accurate, 211Costs, annualized, 15–16Covalent bond, 35–7Crabmeat, use of, 235–36CWA (Clean Water Act), 61, 172, 179, 186Cyanide, alkaline chlorination of, 239
DDAF (dissolved air flotation), 128, 137, 154,
369, 373–74De-inking, wastes from, 86–93
De-inking process - wastes generation, 88–89wastes generation and wastes minimization,
89wastes minimization, 92wastewater characteristics, 89–92wastewater treatment, 92–93
Deep bed granular filters, 333Deep shaft aeration, 280–82Degreasing, 62–64Department of Transportation (DOT), 201Descaling, chemical, 61–62Desmutting, 67

464 Industrial Waste Treatment Handbook
Die casting, 93–99additional waste management considerations,
98–99aluminum, 93–95magnesium, 93, 95waste management, 95–98waste streams, 95–98zinc, 93, 95
Digesters, mixed, heated anaerobic, 317–18Discharges to air, characteristics of, 192–97
sample collection, 193–97stack sampling, 193
Discharges to air, management of, 20–28analysis of manufacturing processes, 20–25bench scale investigations, 26economic comparisons, 28pilot scale investigations, 26–27preliminary designs, 27–28selection of candidate technologies, 26treatment objectives, 26wastes minimization and characterization
study, 25–26Discrete settling, 345–46Disposal of solid wastes from industry, treatment
and, 397–436Disposal of wastes, treatment and, 84–86Dissolution of air in water, 369–73Dissolved air flotation (DAF), 128, 137, 154,
369equipment, 373–74
Dissolved solids (TDS), 154, 159DO (dissolved oxygen), 185–86, 293DOT (Department of Transportation), 201Downflow granular filters, 335–37Drinks, production of bottled soft, 119–22Dry impingement, 194–96Ductwork, fans and, 438
EEckenfelder’s equations, 307Electrical stability, 33–35Electrodialysis, 332–33Electroplating of tin, 65–74
production processes, 65–70sources and characteristics of wastes, 70–72wastes minimization, 72–73wastewater treatment, 73–74
Electrostatic impingement, 194Electrostatic precipitators (ESPs), 439–42
Emulsification, 40–43Emulsions, forming by vigorous mixing, 42–43Emulsions, forming with emulsifying agents,
40–43Environmental Audit, 166, 172–79EPA (Environmental Protection Agency), 111,
301Epoxys, 429Equalization
constituent, 226flow, 224–26waste, 223–26
EquationsEckenfelder’s, 307for treatment of industrial wastes, 256–62
Equipment, DAF (dissolved air flotation), 373–74ESPs (electrostatic precipitators), 439–42Evacuated collection containers, 193Expanded bed reactors, 319 –20Extraction, solvent, 253–54
FF/M (food-to-microorganism), 268F/M (food-to-microorganism) ratio, 258Fabric filters, 442Fans and ductwork, 438Fats, oils and greases (FOG), 79, 154, 157, 191Federal stormwater regulations, 149–51Fenton’s reagent, 251Ferric ions, insoluble, 249Ferrous ions
hydrogen peroxide plus, 251soluble, 249
Film systems, fixed, 319–22Filters
deep bed granular, 333downflow granular, 335–37fabric, 442plate and frame, 326roughing, 307–8swimming pool, 341trickling, 302–6
design, 304–6recirculation, 304
upflow granular, 334–35Filtration, 194
pressure and vacuum, 337–41using granular media, 333–44

Index 465
Fish, rendering of by-products from processingof, 130–38rendering process, 130–32treatment and disposal, 135–38wastes generation, 132–34wastes minimization, 134–35
Fixed film systems, 319–22Flat-plate precipitators, 441Flocculent settling, 346Flotation, 367–69
gravity, 367–68Flow equalization, 224–26Fluidized bed technology, 409–12Fluidized bed, 310Fluidized bed reactors, 320–21FOG (fats, oils and greases), 79, 154, 157, 191Food-to-microorganism (F/M), 268
ratio, 258Foods, prepared frozen, 77–86
treatment and disposal of wastes, 84–86wastes generation, 78–83wastes minimization, 84
Formaldehyde, urea, 429–30Frame filters, plate and, 326Free radicals, oxidative destruction of organics
by, 250Freundlich, model for adsorption, 378Frozen foods, prepared, 77–86
treatment and disposal of wastes, 84–86wastes generation, 78–83wastes minimization, 84
Fundamentals, 29–48characteristics of industrial wastewater,
29–30chemical structure and polarity of water,
36–37colloidal suspensions, 43–44electrical stability, 33–35emulsification, 40–43examples, 45–47forming emulsions with emulsifying agents,
40–43hydrogen bonding, 37–38mixtures made stable by chelating agents, 44polar properties of water, 30–33polar solvents versus nonpolar solvents,
38–40thermodynamic stability, 33–35
Furnaces, car bottom gasification, 420–21
GGalvanizing, wastewater from metal, 47Gaseous pollutants, treatment systems for
control of, 444–56absorption, 449–551adsorbents other than activated carbon,
448–49adsorption, 446–47biofiltration, 453–56condensation, 451incineration, 451–53
Gases, 1–28landfill, 408reaction to produce insoluble, 238–39
Gasification furnaces, car bottom, 420–21Gasification systems, roller hearth, 420GCL (geosynthetic clay liner), 402Gel, silica, 449Geosynthetic clay liner (GCL), 402Granular filters
deep bed, 333downflow, 335–37upflow, 334–35
Granular media, filtration using, 333–44Gravity flotation, 367–68Gravity separators, 438Grease, 190Groundwater contamination, prevention of,
151–52Groundwater pollution control laws, 52–55Growth, lag phase of, 266Growth systems, attached, 301–2Gypsum, 431
HH20 (water), 256–322
chemical structure and polarity of, 36–37dissolution of air in, 369–73polar properties of, 30–33
H2S (hydrogen sulfide), 200Hardness, 192Hazardous substance, determining source of
each, 171Hazardous substances, identifying that are
purchased, 169–70Hazardous substances, identifying that leave
facility, 170–71Hazardous waste, 18–20HDPE (high-density polyethylene), 401–2, 433

466 Industrial Waste Treatment Handbook
Hearth incinerator technologies, 416–17Heavy metals, removal of, 47High-density polyethylene (HDPE), 401–2,
433Hoods and isolation chambers, 438Housekeeping, immaculate, 212HRTs (hydraulic retention times), 280, 320,
365Hydrocarbons, 200Hydrogen bonding, 37–38Hydrogen peroxide
oxidation with, 250–51ozone plus, 252–53plus ferrous ions, 251
Hydrogen peroxide plus UV light, 251–52Hydrogen sulfide, chlorination of, 253
IImmaculate housekeeping, 212Impaction, 196–97Impingement
dry, 194–96electrostatic, 194wet, 196
Incineration, 451–53suitability of waste for, 400
Incineration, solid waste, 409–21fluidized bed technology, 409–12hearth incinerator technologies, 416–17modular systems, 417rotary kiln technology, 412–16starved air technologies, 417–21
Incinerator technologies, hearth, 416–17Industrial solid wastes, S/S of, 427–33
binders used for S/S technologies, 429–32mechanisms involved in S/S treatment
procedures, 432–33S/S process systems, 428–29
Industrial stormwatermanagement, 149–65
design storm, 152–53Federal stormwater regulations, 149–51general, 149prevention of groundwater contamina-
tion, 151–52stormwater retention, 153stormwater segregation, collection,
retention, and treatment, 152stormwater treatment, 153–54
system failure protection, 153as source of process water makeup, 154–64
Industrial waste system, 222Industrial wastes, 18
characteristics of, 179, 179–91equations for biological treatment of,
256–62management of, 1–28
analysis of manufacturing processes, 2–3annualized costs, 15–16bench scale investigations, 4–6competitive bids for construction, 17–18economic comparisons, 8–10final design, 17–18gases, 1–28liquids, 1–28O&M (operational and maintenance)
costs, 10–15pilot scale investigations, 7–8preliminary designs, 8selection of candidate technologies, 4solids, 1–28treatment objectives, 4wastes characterization study, 3–4wastes minimization, 3–4
process of composting, 421–27mechanical composting technology,
425–26windrow composting technology, 423–25
Industrial wastewatercharacteristics of, 29–30
miscellaneous characteristics, 191–92priority pollutants, 179
containing dissolved iron, 47management of, 1–18treated by insoluble substances, 236–38treatment, 265–310, 310–22, 385–88
Industriescharacteristics of solid waste streams from,
201hazardous wastes, 201–3nonhazardous solid wastes from industries,
203–5management of solid wastes from, 18–20methods for treating wastewaters from,
219–396nonhazardous solid wastes from, 203–5treating air discharges from, 437–60
containment, 437–38

Index 467
fans and ductwork, 438hoods and isolation chambers, 438reduction at source, 437treatment, 438
treatment and disposal of solid wastes from,397–436
wastes from, 61–148chemical descaling, 61–62degreasing, 62–64electroplating of tin, 65–74rinsing, 64–65
Inertial separators, 438Inorganic binding agents, 430–32Inorganic chelating agents, 248Insoluble compounds, disadvantages of
treatment by production of, 236Insoluble ferric ions, 249Insoluble gases, reactions to produce, 238–39Insoluble solids, reaction to produce, 230–38Insoluble substances
industrial wastewater treated by, 236–38removal by forming, 238
Investigationsbench scale, 4–6, 26pilot scale, 7–8, 26–27
Ion exchanges, 381–88applications to industrial wastewater
treatment, 385–88breakthrough curve, 388design criteria, 389kinetics of, 384–85mechanisms of, 384removal of specific organic substances, 389scrubbing, 390–91stripping, 389–90
Ion selectivity, 385Ions
hydrogen peroxide plus ferrous, 251insoluble ferric, 249soluble ferrous, 249
Iron, 192industrial wastewater containing dissolved,
47Irrigation, spray, 392Isolation chambers, hoods and, 438
KKiln, rotary, 412–16, 419
Kinetics in laboratory, biological treatment,258–61
KLa, 287, 294
LLag phase of growth, 266Lagoon systems, design of, 299–300Lagoons
aerated, 297–98anaerobic, 322facultative, 298nonaerated facultative, 298–99
Lamella settlers, 361–65Land application, 392Landfill cover and cap systems, 402–6Landfill gas (LFG), 407–8Landfill liner system, 400–402Landfilling, suitability of waste for, 399–400Landfills
alternative, 408–9conventional, 400discharges from, 407–8solid waste, 400–409
alternative landfills, 408–9conventional landfill, 400discharges from landfills, 407–8landfill cover and cap systems, 402–6landfill liner system, 400–402stormwater management, 406–7
Langmuir, model for adsorption, 377–81Laws
air pollution control, 55–60groundwater pollution control, 52–55and regulations, 49–60
air pollution control law as of Year 2000,56
air pollution control laws, 55–60groundwater pollution control laws,
52–55history of permitting and reporting
requirements, 49–50introduction, 49Title I, 58Title III, 58Title IV, 59Title V, 56–58Title VII, 59–60water pollution control laws, 50–52
water pollution control, 50–52
468 Industrial Waste Treatment Handbook
Leachate, 248, 401–8collection, 401incineration, 407treatment, 249
Lead acid batteries, manufacture of, 138–44wastes generation, 141–42wastes minimization, 142–43wastewater treatment, 143–44
Lead battery manufacture, 138–41Leady Oxide, 140LFG (landfill gas), 407–8Lights
hydrogen peroxide plus UV, 251–52ozone plus UV, 253
Lime, 431Liquids, 1–28Low-energy complete mix approach, 300Lyophillic colloids, 245–47Lyophillic sols, 242
electrokinetics of, 244Lyophobic colloids, 244–45Lyophobic sols, 240–42
electrokinetics of, 242–44
MMACT (Maximum Achievable Control
Technology), 198, 201Magnesium die casting, 93, 95Malodorous substances, 200–201Management
of discharges to air, 20–28analysis of manufacturing processes,
20–25bench scale investigations, 26economic comparisons, 28pilot scale investigations, 26–27preliminary designs, 27–28selection of candidate technologies, 26treatment objectives, 26wastes minimization and characterization
study, 25–26of industrial wastewater, 1–18
analysis of manufacturing processes, 2–3annualized costs, 15–16bench scale investigations, 4–6competitive bids for construction, 17–18economic comparisons, 8–10final design, 17–18
O&M (operational and maintenance)costs, 10–15
pilot scale investigations, 7–8preliminary designs, 8selection of candidate technologies, 4treatment objectives, 4wastes characterization study, 3–4wastes minimization, 3–4
of solid wastes from industries, 18–20Manganese, 192Manufacturing plant, pretreatment for
microcrystalline cellulose, 8–10Manufacturing processes
analysis of, 2–3, 20–25changing, 213
Mass diagram, 225, 227Materials, substitution of, 212–13Mathematical model of PACT process, predictive,
274–76Maximum Achievable Control Technology
(MACT), 198, 201Meat
production and processing of red, 124production processes, 126treatment and disposal, 128–30wastes generation, 126–27wastes minimization, 127–28
rendering of by-product from processing ofrendering process, 130–32treatment and disposal, 135–38wastes generation, 132–34wastes minimization, 134–35
rendering of by-products from processing of,130–38
Mechanical composting technology, 425–26Media, filtration using granular, 333–44Membrane separation, 326–33
electrodialysis, 332–33removal mechanisms, 330–31reverse osmosis, 331–32
Metabolism, mechanisms of anaerobic, 312–16Metal galvanizing, wastewater from, 47Metals, 186
removal of heavy, 47Methane, 200–201Methyl-tert-butyl ether (MTBE), 191MF (microfiltration), 326Microcrystalline cellulose manufacturing
plant, pretreatment for, 8–10
Index 469
Microfiltration (MF), 326Microorganisms, 255Microscreening, 324–30Minimization, companywide philosophy of
waste, 211–12Mix approach, low-energy complete, 300Mix, conventional complete, 273–74Mixed liquor suspended solids (MLSS),
264–65, 279–80Mixed liquor volatile suspended solids
(MLVSS), 264–66, 268, 280Mixing, forming emulsions by vigorous, 42–43Mixtures made stable by chelating agents, 44MLSS (mixed liquor suspended solids),
264–65, 279–80MLVSS (mixed liquor volatile suspended solids),
264–66, 268, 280Molecular weight cutoff (MWCO), 326, 328MSGP (Multi-Sector General Permit), 150–51MSWLFs (municipal solid wastes landfill
facilities), 203MTBE (Methyl-tert-butyl ether), 191Multi-Sector General Permit (MSGP), 150–51Municipal solid wastes landfill facilities
(MSWLFs), 203MWCO (molecular weight cutoff), 326, 328
NNAAQS (National Ambient Air Quality
Standards), 193Nanofiltration (NF), 326National Ambient Air Quality Standards
(NAAQS), 193National Pollutant Discharge Elimination
System (NPDES), 4, 150, 155, 162NBOD (nitrogenous oxygen demand), 301Nephelometric Turbidity Units (NTUs), 186NF (nanofiltration), 326Nitrogen, compounds containing, 188Nitrogenous oxygen demand (NBOD), 301NOI (Notice of Intent), 150Non-steady state method, 293–-94Nonaerated facultative lagoons, 298–99Nonbiodegradable substances, biologically
degradable substance from, 247Nonhazardous solid wastes from industries,
203–5Nonobjectionable substances, producing,
248–53
Nonpolar solvents, polar solvents versus,38–40
Notice of Intent (NOI), 150NOx (oxides of nitrogen), 199NPDES (National Pollutant Discharge
Elimination System), 4, 150, 155, 162NTUs (Nephelometric Turbidity Units), 186Nutrients, 426
OO&M (operational and maintenance) costs,
10–15, 265, 399Objectionable substances; See Nonobjectionable
substancesOdors, 426–27Off-gas method, 294–98Oil and grease, 190Oily wastewater pretreatment system (OWPS),
159Oily wastewater treatment plant (OWTP), 155OIT (operator interface terminal), 159Operator interface terminal (OIT), 159Organic binding agents, 429–30Organic chelating agents, 248Organic matter, 255Organic substances, removal of specific, 389Organics, 200
oxidative destruction by free radicals, 250ORP (oxidation-reduction potential), 433OTR (oxygen transfer rate), 296OWPS (oily wastewater pretreatment system),
159OWTP (oily wastewater treatment plant), 155Oxidation
catalytic, 254with hydrogen peroxide, 250–51with ozone, 252Pasveer, 280ponds, 299–301thermal, 254
Oxidation-reduction potential (ORP), 433Oxidative destruction of organics by free
radicals, 250Oxides of sulfur, 199Oxidizers
catalytic, 452–53thermal, 452
Oxygen, 255Oxygen in wastewater treatment, 261–62

470 Industrial Waste Treatment Handbook
Oxygen transfer rate (OTR), 296testing, 287
Ozone, 199oxidation with, 252plus hydrogen peroxide, 252–53plus UV light, 253
PP&M (process and maintenance), 155, 157Packaged water treatment systems, 341–44Packed bed reactors, 321PACT modification of activated sludge, 274PACT (powdered activated carbon technology),
274PACT process, predictive mathematical model
of, 274–76Particulates, 200
treatment systems for control of, 438–44Partition-gravimetric method, 190–91Partition-infrared method, 191Parts cleaning process, wastewater from, 47Pasveer oxidation ditch and variations, 280PCBs (polychlorinated biphenyls), 93, 152,
397Permitting requirements, history of, 49–50Peroxide, oxidation with hydrogen, 250–51PH, 185PH control, 227–30Phase I, 215Phase II, 215–16Phosphorus, compounds containing, 186–88Physical barriers, separation using, 322–33
bar racks, 323membrane separation, 326–33microscreening, 324–30plate and frame filters, 326racks and screens, 322–26rotating cylindrical screens, 324tangential screens, 323–24vibrating screens, 323
Physical methods of wastewater treatment,322–93
Pickling, 61, 67 Pilot scale investigations, 7–8, 26–27Pin floc, 268Plain sedimentation, 344–65Plate and frame filters, 326Plate settlers, 361–65Plate-wire precipitators, 441
PLC (programmable logic controller), 159Plug flow, conventional, 270–72Polar properties of water, 30–33Polar solvents versus nonpolar solvents, 38–40Polarity of water, chemical structure and,
36–37Pollutants, 191–92
air, 198–200treatment systems for control of gaseous,
444–56absorption, 449–551adsorbents other than activated carbon,
448–49adsorption, 446–47biofiltration, 453–56condensation, 451incineration, 451–53
Pollutionair, 55–56, 55–60groundwater, 52–55prevention, 208–18
benefits of, 216benefits of pollution prevention, 216evaluating economics of, 172findings and policy, 208–9waste audit, 215–16
water, 50–52Pollution prevention
general approach, 209–12accurate cost accounting system, 211active technology transfer program, 212clear objectives, 210–11companywide philosophy of waste
minimization, 211–12explicit scope, 210–11support from top management, 209–10
source reduction, 212–15achieving reduction of wastes at the
source, 216changing equipment, 213changing manufacturing processes, 213immaculate housekeeping, 212recycle and reuse, 213–14segregation of waste streams, 214–15selective mixing of waste streams, 215substitution of materials, 212–13waste exchanges, 215
Polychlorinated biphenyls (PCBs), 93, 152,397

Index 471
Polyesters, 430Polyolefins, 430Ponds, oxidation, 299–301Pork, production and processing of, 124
production processes, 126treatment and disposal, 128–30wastes generation, 126–27
Portland cement, 430Potentially responsible party (PRP), 216POTWs (publicly owned treatment works), 29,
86, 200, 407Poultry
processing wastewater, 45–46rendering of by-products from processing of,
130–38rendering process, 130–32treatment and disposal, 135–38wastes generation, 132–34wastes minimization, 134–35
Powdered activated carbon technology (PACT),274
Pozzolan substances, 431Precipitators
flat-plate, 441plate-wire, 441tubular, 441–42two-stage, 441wet, 442
Precoat, 339Precipitation, 62, 231, 249Preclean, 66 Prepared frozen foods, 77–86Preplating, 66Pressure and vacuum filtration, 337–41Pretreatment Regulations, 51–52Prevention, pollution, 208–18
benefits of pollution prevention, 216general approach, 209–12source reduction, 212–15waste audit, 215–16
Process and maintenance (P&M), 155, 157Programmable logic controller (PLC), 159PRP (potentially responsible party), 216Publicly owned treatment works (POTWs), 29,
86, 200, 407Pumps, vacuum, 193
RRatios
A/S (air-to-solids), 375calculations of recycle, 375F/M (food-to-microorganism), 258
RBCs (rotating biological contactors), 302–3,308–9
RCRA (Resource, Conservation and RecoveryAct), 18–19, 172, 179, 201, 203, 397
RDF (refuse derived fuel), 409Reactors
anaerobic contact, 318expanded bed, 319–20fluidized bed, 320–21packed bed, 321rotary hearth, 419–20rotary kiln, 419
Recycle and reuse, 213–14Recycle ratios, calculations of, 375Red meat, production and processing of, 124
production processes, 126treatment and disposal, 128–30wastes generation, 126–27wastes minimization, 127–28
Refuse derived fuel (RDF), 409Regulations
laws and, 49–60air pollution control law as of Year 2000,
56air pollution control laws, 55–60groundwater pollution control laws,
52–55history of permitting and reporting
requirements, 49–50introduction, 49Title I, 58Title III, 58Title IV, 59Title V, 56–58Title VII, 59–60water pollution control laws, 50–52
Regulations, Pretreatment, 51–52Reporting requirements, history of, 49–50Resin, 448Resource, Conservation and Recovery Act
(RCRA), 18–19, 172, 179, 201, 203, 397Reverse osmosis, 331–32Reverse osmosis (RO), 326Rinsewater pretreatment plant (RPP), 155Rinsing, 64–65
472 Industrial Waste Treatment Handbook
RMF (Runoff Management Facility), 155, 157,159, 162
RO (reverse osmosis), 326Roller hearth gasification systems, 420Rotary hearth reactors, 419–20Rotary kiln technology, 412–16, 419Rotating biological contactors (RBCs), 302–3,
308–9Rotating cylindrical screens, 324Roughing filters, 307–8RPP (rinsewater pretreatment plant), 155Rubber
production of synthetic, 111–15synthetic
production of synthetic rubber, 111–15specialty products, 115wastes generation, 115–18wastes minimization, 118wastewater treatment, 118–19
Rubber industry, synthetic, 110–19Runoff Management Facility (RMF), 155, 157,
159, 162
SS/S process systems, 428–29S/S (solidification and stabilization), 427–33S/S technologies, binders used for, 429–32S/S treatment procedures, mechanisms
involved in, 432–33Safe Drinking Water Act (SDWA), 179Sample analysis, 198SBR systems, designing of, 279–80SBRs (sequencing batch reactors), 277Screens; See also Microscreening
rotating cylindrical, 324tangential, 323–24vibrating, 323
Scrubberstray, 443–44venturi, 442–43wet, 442
Scrubbing, 390–91SDWA (Safe Drinking Water Act), 179Sedimentation, plain, 344–65Selectors, 268–70Separation using physical barriers, 322–33
bar racks, 323membrane separation, 326–33microscreening, 324–30
plate and frame filters, 326rotating cylindrical screens, 324tangential screens, 323–24vibrating screens, 323
Separatorsgravity, 438inertial, 438
Settling column, 348Sequencing batch reactors (SBRs), 277Settable solids, 190Settlers
lamella, 361–65plate, 361–65tube, 361–65
Silica gel, 449Silicates, 431–32Sludge
activated, 265aeration systems for activated, 283–97bulking, 268–70contact stabilization modification of
activated, 276extended aeration activated, 276high-rate modification of activated, 276PACT modification of activated, 274thickening, 346–49
Sludge processSBR of activated, 277–79variations of activated, 270
Sludge systems, characteristics of activated,283
Soft drink bottling industry, 119–23production of bottled soft drinks, 119–22wastes generation, 122–23wastes minimization, 123wastewater treatment, 123
Soft drinks, production of bottled, 119–22Solid waste
incineration, 409–21fluidized bed technology, 409–12hearth incinerator technologies, 416–17modular systems, 417rotary kiln technology, 412–16starved air technologies, 417–21
landfills, 400–409alternative landfills, 408–9conventional landfill, 400discharges from landfills, 407–8landfill cover and cap systems, 402–6
Index 473
landfill liner system, 400–402stormwater management, 406–7
Solid waste streams, characteristics of, 201hazardous wastes, 201–3nonhazardous solid wastes from industries,
203–5Solid wastes
characterization of, 398–400opportunities for waste reduction,
398–400rate of waste generation, 399suitability of waste for composting, 400suitability of waste for incineration, 400suitability of waste for landfilling,
399–400whether waste is hazardous, 399
from industriesmanagement of, 18–20nonhazardous, 203–5treatment and disposal of, 397–436
S/S of industrial, 427–33Solidification and stabilization (S/S), 427–33Solids, 1–28
adsorption on, 194reaction to produce insoluble, 230–38settable, 190suspended, 188–90total, 188
Solselectrokinetics of lyophillic, 244electrokinetics of lyophobic, 242–44lyophillic, 242lyophobic, 240–42
Soltex extraction method, 191Soluble ferrous ions, 249Solutions, true, 38–40Solvent extraction, 253–54Solvents, polar solvents versus nonpolar,
38–40SOTR (standard oxygen transfer rate), 295–96Source reduction, 212–15SP3 (stormwater pollution prevention plan),
150–51Special wastes, 18Spray irrigation, 392SRBs (styrene butadiene rubbers), 111, 113Stability
electrical, 33–35thermodynamic, 33–35
Stack sampling, 193Standard oxygen transfer rate (SOTR), 295–96Starved air technologies, 417–21Static pile technology, 425Stormwater
retention, 153as source of process
BOD (biological oxygen demand),154–55
case history, 155–64heat, 155TDS (dissolved solids), 154
as source of process water makeup, 154–64treated, 154
Stormwater management, 406–7Stormwater management, industrial, 149–65
design storm, 152–53Federal stormwater regulations, 149–51general, 149prevention of groundwater contamination,
151–52stormwater, 153–54stormwater retention, 153stormwater segregation, collection,
retention, and treatment, 152system failure protection, 153
Stormwater pollution prevention plan (SP3),150–51
Stormwater regulations, Federal, 149–51background, 149–50construction general permit, 151individual permit, 150–51MSGP (Multi-Sector General Permit), 150SP3 (stormwater pollution prevention plan),
151Stormwater segregation, collection, retention,
and treatment, 152Streams
characteristics of solid waste, 201segregation of waste, 214–15selective mixing of waste, 215waste, 95–98, 171
Stripping, 389–90Styrene butadiene rubbers (SRBs), 111, 113Substances
malodorous, 200–201producing nonobjectionable, 248–53removal by forming insoluble, 238volatile, 169

474 Industrial Waste Treatment Handbook
Subsystems, two control, 230Sulfur
oxides of, 199producing elemental, 253
Sulfur compounds, miscellaneous reduced, 200Sulfuric Acid, 62Suspended growth systems, 265
anaerobic, 316–18Suspended solids, 188–90Suspensions, colloidal, 43–44Swimming pool filters, 341Synthetic rubber industry, 110–19
production of synthetic rubber, 111–15specialty products, 115wastes generation, 115–18wastes minimization, 118wastewater treatment, 118–19
Synthetic rubber, production of, 111–15
TTangential screens, 323–24TCE (trichloroethylene), 169TCLP (Toxic Characteristics Leaching
Procedure), 202, 399TDS (dissolved solids), 154, 159Technologies
aerobic, 265–310binders used for S/S, 429–32biological treatment, 262–322candidate treatment, 221development of anaerobic, 312fluidized bed, 409–12hearth incinerator, 416–17mechanical composting, 425–26rotary kiln, 412–16selection of candidate, 4starved air, 417–21static pile, 425using anaerobic, 310–22windrow composting, 423–25
Technology transfer program, active, 212Tedlar bags, 193Tests, TCLP (Toxic Characteristic Leaching
Procedure), 202Thermal oxidation, 254Thermal oxidizers, 452Thermodynamic stability, 33–35Tin, electroplating of, 65–74
production processes, 65–70
sources and characteristics of wastes, 70–72wastes minimization, 72–73wastewater treatment, 73–74
Total reduced sulfur (TRS), 200Total solids, 188Total suspended solids (TSS), 127, 154, 157,
159, 188, 300Total Volatile Suspended Solids (TVSS), 190Toxicity, 56, 62, 72, 171, 208, 212, 249, 399,
see HazardousToxic Characteristics Leaching Procedure
(TCLP), 202, 399Toxic loads, analyzing feasibility of reducing,
171–72Toxics, sampling methods for air, 201Tray scrubbers, 443–44Treated stormwater, 154Treatment
application of ion exchanges to industrialwastewater, 385–88
biological, 255chemical methods of wastewater, 230–55oxygen in wastewater, 261–62physical methods of wastewater, 322–93systems
for control of gaseous pollutants, 444–56packaged water, 341–44variations of anaerobic, 316
technologiesbiological, 262–322candidate, 221
wastewatermanufacture of lead acid batteries,
143–44soft drink bottling industry, 123synthetic rubber industry, 118–19
wetlands, 393Treatment and disposal, 128–30
production and processing of beef, 128–30production and processing of pork, 128–30production and processing of red meat,
128–30rendering of by-products from processing of
fish, 135–38rendering of by-products from processing of
meat, 135–38rendering of by-products from processing of
poultry, 135–38of solid wastes from industry, 397–436

Index 475
of wastes, 84–86Treatment methods, miscellaneous wastewater,
392–93land application, 392spray irrigation, 392wastewater application rate, 392–93wetlands treatment, 393
Treatment of industrial wastewater, 310–22Treatment of winery wastes, 110Trichloroethylene (TCE), 169Trickling filters, 302–6
design, 304–6recirculation, 304media, 305
TRS (total reduced sulfur), 200True solutions, 38–40TSS (total suspended solids), 127, 154, 157,
159, 188, 300Tube settlers, 361–65Tubular precipitators, 441–42Turbidity, 186TVSS (Total Volatile Suspended Solids), 190Two-stage precipitators, 441
UUASB (upflow anaerobic sludge blanket),
316–17UF (ultrafiltration), 326Upflow anaerobic sludge blanket (UASB),
316–17Upflow granular filters, 334–35Urea-formaldehyde, 429–30UV light
hydrogen peroxide plus, 251–52ozone plus, 253
VVacuum filtration, and pressure, 337–41Vacuum pumps, 193Venturi scrubbers, 442–43Vibrating screens, 323Vitis Vinifera, 107VOCs (volatile organic compounds), 200, 403,
446, 453Volatile substances, 169
WWaste audit, 215–16
Phase I, 215Phase II, 215–16
Waste equalization, 223–26Waste exchanges, 215Waste generation, rate of, 399Waste management, 95–98
considerations, 98–99Waste minimization, companywide philosophy
of, 211–12Waste reduction, opportunities for, 398–400Waste streams, 95–98
characteristics of solid, 201prioritizing to be reduced, 171segregation of, 214–15selective mixing of, 215
Waste systems, coagulation of colloidal,244–47
Waste-to-energy (WTE), 409, 412, 415Waste treatment and disposal, anodizing and
alodizing, 103Wastes
audits, 166analyzing feasibility of reducing toxic
loads, 171–72determining source of each hazardous
substance, 171evaluating economics of pollution
prevention, 172identifying hazardous substances that are
purchased, 169–70identifying hazardous substances that
leave facility, 170–71prioritizing waste streams to be reduced,
171characteristics of industrial, 179characterization, 166–207
ambient air sampling, 198–201characteristics of discharges to air,
192–97characteristics of industrial wastes, 179characteristics of industrial wastewater,
179–91characteristics of solid waste streams from
industries, 201Environmental Audit, 172–79sample analysis, 198wastes audit, 169–72
characterization of solid, 398–400

476 Industrial Waste Treatment Handbook
opportunities for waste reduction,398–400
rate of waste generation, 399suitability of waste for composting, 400suitability of waste for incineration, 400suitability of waste for landfilling,
399–400whether waste is hazardous, 399
characterization study, 166–69choice of sampling location, 166–68sample preservation, 169sampling equipment, 168sampling for oil and grease, 169volatile substances, 169and wastes minimization, 3–4
from De-inking, 86–93De-inking process - wastes generation,
88–89wastes generation and wastes minimization,
89wastes minimization, 92wastewater characteristics, 89–92wastewater treatment, 92–93
equations for biological treatment ofindustrial, 256–62
generation, 76–78,anodizing and alodizing, 100–101manufacture of lead acid batteries,
141–42production and processing of beef,
126–27production and processing of pork,
126–27production and processing of red meat,
126–27rendering of by-products from processing
of fish, 132–34rendering of by-products from processing
of meat, 132–34rendering of by-products from processing
of poultry, 132–34soft drink bottling industry, 122–23synthetic rubber industry, 115–18wastes from De-inking, 88–89
hazardous, 18–20industrial, 18from industries, 61–148
chemical descaling, 61–62degreasing, 62–64
electroplating of tin, 65–74nonhazardous solid, 203–5rinsing, 64–65treatment and disposal of solid, 397–436
management of industrial, 1–28analysis of manufacturing processes, 2–3annualized costs, 15–16bench scale investigations, 4–6competitive bids for construction, 17–18economic comparisons, 8–10final design, 17–18gases, 1–28liquids, 1–28O&M (operational and maintenance)
costs, 10–15pilot scale investigations, 7–8preliminary designs, 8selection of candidate technologies, 4solids, 1–28treatment objectives, 4wastes characterization study, 3–4wastes minimization, 3–4
minimization, 72–73anodizing and alodizing, 101–3and characterization study, 25–26manufacture of lead acid batteries,
142–43prepared frozen foods, 84production and processing of beef,
127–28production and processing of Coke, 106production and processing of pork,
127–28production and processing of red meat,
127–28rendering of by-products from processing
of fish, 134–35rendering of by-products from processing
of meat, 134–35rendering of by-products from processing
of poultry, 134–35soft drink bottling industry, 123synthetic rubber industry, 118wastes characterization study, 3–4wastes from De-inking, 89, 92wine-making industry, 110
process of composting industrial, 421–27mechanical composting technology,
425–26

Index 477
windrow composting technology, 423–25S/S of industrial solid, 427–33
binders used for S/S technologies, 429–32mechanisms involved in S/S treatment
procedures, 432–33S/S process systems, 428–29
solid, 18–20, 400–409sources and characteristics of, 70–72sources of, 105–6special, 18suitability
for incineration, 400for landfilling, 399–400
treatment and disposal of, 84–86treatment of winery, 110wine-making, 108–10
Wastes at source, achieving reduction of, 216Wastewater
application rate, 392–93characteristics, 89–92characteristics of industrial, 29–30, 179–91
pollutants, 191–92priority pollutants, 179
containing dissolved iron, 47management of industrial, 1–18from metal galvanizing, 47from parts cleaning process, 47poultry processing, 45–46
Wastewater treated by insoluble substances,industrial, 236–38
Wastewater treatmentapplication of ion exchanges to, 385–88chemical methods of, 230–55
reaction to produce insoluble solids,230–38
electroplating of tin, 73–74manufacture of lead acid batteries, 143–44oxygen in, 261–62physical methods of, 322–93
adsorption, 376–81centrifugation, 365–67filtration using granular media, 333–44flotation, 367–69ion exchange, 381–88plain sedimentation, 344–65
production and processing of Coke, 106–7soft drink bottling industry, 123
synthetic rubber industry, 118–19wastes from De-inking, 92–93
Wastewater treatment methods, miscellaneous,392–93land application, 392spray irrigation, 392wastewater application rate, 392–93wetlands treatment, 393
Wastewaters from industry, methods for treat-ing, 219–396chemical methods of wastewater treatment,
230–55general, 219–20pH control, 227–30principle and nonprinciple treatment
mechanisms, 220–22waste equalization, 223–26
constituent equalization, 226flow equalization, 224–26
Wastewaters, treatment of industrial, 265–310,310–22
Water (H20)chemical structure and polarity of, 36–37dissolution of air in, 369–73polar properties of, 30–33
Water makeup, stormwater as source of pro-cess, 154–64
Water pollution control laws, 50–52Water treatment systems, packaged, 341–44Wet impingement, 196Wet precipitators, 442Wet scrubbers, 442Wetlands treatment, 393Windrow composting technology, 423–25Wine-making industry, 107–10
treatment of winery wastes, 110wastes minimization, 110wine-making wastes, 108–10wine production process, 107–8
Wine-making wastes, 108–10Wine production process, 107–8Winery wastes, treatment of, 110WTE (waste-to-energy), 409, 412, 415
ZZeta potential, 243Zinc die casting, 93, 95