industrial renewal - etla · jyväskylä, finland), ahti salo (aalto university), teija...
TRANSCRIPT

FINANCIAL TECHNOLOGYINDUSTRIAL
RENEWALfor
Peter AdriaensAntti Tahvanainen


Elinkeinoelämän tutkimuslaitos Etla
Peter Adriaens and Antti Tahvanainen
FINANCIAL TECHNOLOGYINDUSTRIAL
RENEWALfor

Elinkeinoelämän tutkimuslaitos – Etla The Research Institute of the Finnish Economy – Etla
Series B272 ISSN 0356-7443 ISBN 978-951-628-669-6 (printed) ISBN 978-951-628-670-2 (pdf)
Publisher: Taloustieto Oy Cover picture: shutterstock.com Printed in: Next Print Oy, Helsinki, 2016
Suggested citation: Adriaens, Peter, Tahvanainen, Antti (2016). Financial Technology for Industrial Renewal. Helsinki: Taloustieto Oy (ETLA B272). http://pub.etla.fi/ETLA-B272.pdf
“…also known as FinTech, is an economic industry comprised of firms that use information technology to make financial services more efficient.
Initially reserved for financial transactions, the term has been expanded to broader applications of technology – from front-end consumer products,
to digital platforms for fund design and management, and new paradigms such as block chain technology.”
FINANCIAL TECHNOLOGY
INDUSTRIALRENEWAL
“The refocusing or transitioning of an economy and its industry actors to stimulate growth, usually through technology and knowledge innovation by leveraging existing assets, trade relationships, and skill sets. Renewal
explicitly invokes the emergence of new industries as the result of investments in the real economy, at the company, cluster, national or regional level.”
for

AcknowledgementsThe contents of this book represent the fruits of two and a half years of exciting work conducted in collaboration between the Research Institute of the Finnish Economy (Etla) and the University of Michigan, Ross School of Business, under the auspices of the Tekes-funded Finnish Distinguished Professor Project “Towards Value Capture and Investability – A Roadmap for Finnish Cleantech”.
In addition to Tekes (the Finnish Funding Agency for Innovation), we would like to recognize support from Ladec Ltd., the Finnish Innovation Fund (Sitra), CLIC Innovation Ltd., and RYM Ltd. for the generous financial sponsorship of the project. Special thanks go also to Cleantech Invest Ltd., the Centre for Environment and Energy (CEE) at the University of Oulu, and the Ministry for Employment and the Economy for promoting the project.
We have enjoyed the guidance of an excellent expert steering committee. Thank you for your feedback, time commitments, and contributions over the last 30 months Nina Harjula (NIA), Tommy Jacobsson (CLIC Innovation), Sami Tuhkanen (Sitra), Ari Ahonen (RYM), Tarja Teppo (Cleantech Invest), Henri Grundsten (Industry Investment), Pekka Tervonen (CEE), Urpo Hautala (Ministry of Finance, FIN), Pekka Pesonen (Tekes), Kaisu Annala (Ministry for Employment and the Economy, FIN).
We are deeply in debt to a diverse and dedicated international team of developers, analysts and co-authors, who helped along the way with company analysis, product improvement, and writing updates on and digesting learnings from the project.
The development of the Multi-Asset Renewal Fund – and the processes that enable its structuring – were very complex and multi-dimensional. For the initial ideation around the structure of the fund, we thank Sven Adriaens (Michigan State University, Broad School of Business) as our Lego® Serious Play® facilitator, and an engaged team of participants, including Timo Seppälä (Aalto University and Etla), Tim Faley (Professor, University of the Virgin Islands), Alexandre Mercier (Hudson & Yorke, London, UK), Weidi Sun (University of Michigan), and Nelli Valmari (Etla). For help with analysis of emerging businesses, SMEs and corporate enterprises using the Keystone Compact® suite of tools, a heartfelt thanks to Alexandre Mercier, Weidi Sun, Annu Kotiranta (Etla), Juri Mattila (Etla), Nicole Bettè (University of Michigan), Nic Miller (University of Michigan), Joona Widgrén (Etla), Niklas Lundell (Etla), and Kirsi Raukola (Etla). Dimitris Assanis (University of Michigan) and Yuan Liu (University of Michigan)

were instrumental in financial network analysis and ETF portfolio structuring. Thanks for the design of the storyboard video for the fund go to the dedication of Sven Adriaens, Nic Miller, and Maggie Hire. Dimitris Assanis lent his voice as the narrator. Last but not least, the financial risk and return analysis of the fund structure was led by a strong Multidisciplinary Action Program (MAP) finance team from the University of Michigan – Stephen M. Ross School of Business, with support from Agnieszka Soporek (Haaga-Helia University, Helsinki). Thanks for your commitment, Bradford Lynch, Guilherme Teruo Takeo Ishihara, Dave Spallina, Morgan Nagy, Christopher Giovine, and Sanmeet Sajuja.
Many thanks go to Annu Kotiranta and Maria Ritola (Demos Helsinki) for taking the lead on writing the Finnish Cleantech story, and to Tuomo Nikulainen (Omniata Inc, San Francisco, USA) for developing the initial inventory of small and medium enterprises engaged in Cleantech. Mika Pajarinen deserves our appreciation for his support with finding reams of company financial data required for this project and Kimmo Aaltonen is recognized for his professional touch in laying out the book. Both Kirsti Jalaistus and Markku Maula provided us with invaluable administrative support throughout this complex and highly networked endeavor.
The development work of the last two and a half years would not have been feasible without constant feedback from the great number of experts and practitioners at various financial institutions, economic development organizations, dissemination forums and companies. We want to salute HSBC (London, UK), Deutsche Bank (London, UK), P80 Group Foundation (Little Rock, Arkansas, USA), Legg Mason Global Asset Management (London, UK), Estlander & Partners (Vaasa, Finland), Capricorn Venture Partners (Leuven, Belgium), RobecoSAM (Zürich, Switzerland), Total Energy Ventures, MSCI ESG Research (New York, NY), CDP (London, UK), South Pole Carbon Asset Management (Zürich, Switzerland), KBC Bank (Brussels, Belgium), swisscleantech (Bern, Switzerland), the Global Cleantech Cluster Association (Bern, Switzerland), Cleantech San Diego (San Diego, USA), NextEnergy (Dearborn, Michigan, USA), Écotech Québec (Montreal, Quebec, Canada), Flanders Cleantech Association (Berchem, Belgium), Washington Clean Technology Alliance (Seattle, Washington, USA), Taiwan Green Trade Project Office (Taipei, Taiwan), Chinese Society for Sustainable Development (Huangzhou, China), Cleantech Forum Europe (Stockholm, Sweden), i-SUP 2014 (Brussels, Belgium), and Nordic Cleantech Open (Trolleholm, Sweden). Many partners and stakeholder organizations in Finland were consulted and engaged, including Finnish Venture Capital Association,

Nordea, OP, Ilmarinen, Elo, Asiakastieto, State Pension Fund VER, Finnish Industry Investment TESI, Juuri Partners, Tekes, Sitra, Finnvera, Finpro, Ministry of Finance (FIN), Ministry for Employment and the Economy (FIN), Demos Helsinki, and Cleantech Venture Day (Lahti, Finland).
We have also had the luxury of benefiting from a highly knowledgeable and experienced group of international advisors, who have provided us many times with a shortcut to insights and support when our own efforts were at a fork in the road. Thank you for your ideas and contributions Christian Häuselmann (swisscleantech and Global CleanTech Cluster Association), Timothy Faley (University of the Virgin Islands, USA), David Brophy (University of Michigan, USA), Martti Kulvik (Etla), Fabian Sepulveda (Courage Ventures), Vesa Vihriälä (Etla), Petri Rouvinen (Etla), Ari Hyytinen (University of Jyväskylä, Finland), Ahti Salo (Aalto University), Teija Lahti-Nuuttila (Finnish Funding Agency for Innovation), Raine Hermans (Finnish Funding Agency for Innovation), Mari Pantsar (Sitra), and Carine van Hove (Flanders CleanTech Association).
Lastly, a personal note.
The FiDiPro appointment required a commitment of 12 wonderful months in Helsinki over a two-and-half year period. Personally and professionally enriching as it was, this would not have been possible without the dedication, love, and patience of my wife and life partner, Iris. She was single-parenting to Sven and Noelle, and a beacon of support for me during the dark Finnish winters. Despite missed sporting and music events, being disconnected from day-to-day family life, and the transitional state of my living out of a suitcase, their support was key to making this a resounding success. Our shared family experiences in Finland couldn’t have been more exquisite: exploring cultural sites by bike, traveling to the Arctic, and a month of working and living side-by-side with my son. Irreplaceable. All my gratitude, thanks and love.
To the staff and colleagues at Etla: You are fantastic hosts and have become dear friends. Thanks for making me feel part of the team, Petri (Rouvinen). Jyrki (Ali-Yrkkö), the concept of ‘office-planking’ and one-armed pushups is something to carry forward to Michigan. For a quick quip and laugh, digital platform expert Timo (Seppälä) was never lost for words and opinions. Our resident block chain technology guru, Juri (Mattila), is the social glue for the office. Annu (Kotiranta), I enjoyed parking myself in your doorway at the beginning of my day. A very special thanks goes to my dear friend Martti (Kulvik). From day one,

you went out of your way to engage me in local wine tasting events, invited me to the Helsinki Symphony Orchestra, and took us out on the water on your boat. You have this work-life balance thing figured out. I will never forget the cultural-boating event you organized for our Michigan-Etla team in the Summer of 2015, culminating in a gathering at your family cottage on the island.
Peter Adriaens.
The journey this book concludes was one of those that have the potential to change lives. The multitude of inspiring and encouraging encounters, the constant exposure to a myriad of refreshingly different opinions, shoals of seemingly impossible obstacles navigated and the volumes of new lessons learnt have given me the courage to step way beyond the comfort zone and push for what truly matters if a change for the better is what we want. It is really just three things: action, action and action! Everything is possible if you put your back into it and relentlessly try. Thankfully, I didn’t have to face the scary bits on my own. Like on all my previous adventures into the unknown, my wife Tiltu was there, steadfast, for support everytime things got a little desperate. She also shared all the fun along the way. As you well know, journeys – and memories – are best shared. Thank you! We keep going to the moon and back.
Antti Tahvanainen.

Contributions by Chapter
Chapter 1 Peter Adriaens and Antti Tahvanainen
Chapter 2 Adapted from Kotiranta, A., Tahvanainen, A.-J., Adriaens, P. & Ritola, M. (2015). From Cleantech to Cleanweb – The Finnish Cleantech Space in Transition. ETLA Reports No 43. Helsinki, Finland.
Chapter 3 Peter Adriaens and Antti Tahvanainen; original statistics by Annu Kotiranta, ecosystems maps by Dimitris Assanis
Chapter 4 Peter Adriaens and Antti Tahvanainen; original statistics by Annu Kotiranta
Chapter 5 Peter Adriaens and Antti Tahvanainen
Chapter 6 Peter Adriaens and Antti Tahvanainen
Chapter 7 Peter Adriaens based on a report for the Ross School of Business – University of Michigan Multidisciplinary Action Projects (MAP) program, authored by Christopher Giovine, Guilherme Teruo Takeo Ishihara, Bradford Lynch, Morgan Nagy, Sanmeet Sanjuja, and Dave Spallina.
Chapter 8 Peter Adriaens and Antti Tahvanainen


Contents
Acknowledgements
Contributions by Chapter
List of Abbreviations
Vision Statement 16
1 Intro 17 Innovation in Financial Technology Drives Industrial Renewal
2 Setting 33 Nordic Cleantech – An Ideal Testbed for Financial Technology
3 Sourcing 63 Mapping Emerging Ecosystems as a Thematic Sourcing Strategy
4 Company Assessment 93 Value Capture and Investment Grade as Qualitative Filters
5 Asset Allocation 133 Robustness in Combining Financial and Non-Financial Indices
6 Multi-Asset Renewal Fund 163 Form Follows Strategy – The Design of a New Fund Structure
7 Risk: Return Assessment 195 MARFs Provide Enhanced Returns at Moderate Risk Increases
8 Roadmap 245 ‘The Finnish Model’ – A Vaunted Investment Strategy for Green Industrial Renewal
Finnish summary 270

List of AbbreviationsAI Artificial IntelligenceAIFM Alternative Investment Fund ManagerAUM Assets Under ManagementBICS Bloomberg Industry Classification SystemCA Capabilities AdjacencyCAPM Capital Asset Pricing ModelCBE Current Business ExpansionCDS Credit Default SwapCETA Comprehensive Economic and Trade AgreementCIO Chief Investment OfficerCRP Country Risk PremiumDAAS Data-as-a-ServiceDE Debt-to-Equity RatioEBIT Earnings Before Interest and TaxesEBITDA Earnings Before Interest, Taxes, Depreciation and AmortizationEC European CommissionEFSI European Fund for Strategic InvestmentEIB European Investment BankERP Equity Risk PremiumESG Environmental, Social and GovernanceETF Exchange Traded FundETP Exchange Traded ProductETSI European Telecommunications Standards InstituteEU European UnionEVCA European Venture Capital AssociationFDI Foreign Direct InvestmentFNA Financial Network AnalyticsFTE Full Time EmployeeFVM Fair Value MeasurementGCCA Global CleanTech Cluster AssociationGDP Gross Domestic ProductGICS Global Industry Classification SystemGP General PartnerGPS Global Positioning SystemGVC Global Value ChainHCA Hierarchical Cluster AnalysisICT Information and Communications TechnologyIE Interest ExpenseIEA International Energy AgencyIEC International Electrotechnical CommissionIG Investment Grade
IISD International Institute for Sustainable DevelopmentIOT Internet of ThingsIPO Initial Public OfferingIRR Internal Rate of ReturnISIC International Standard Industrial ClassificationIT Information TechnologyITS Intelligent Transportation SystemLED Light Emitting DiodeLOB Line of BusinessLP Limited PartnerLRP Liquidity Risk Premium, LTIF Long-Term Investment FundM&A Mergers and AcquisitionsMA Market AdjacencyMaaS Mobility-as-a-Service MARF Multi-Asset Renewal FundMM Mid-Market companiesMNE Multi-National EnterprisesNACE General Industrial Classification of Economic Activities in the
European CommunitiesNAICS North American Industry Classification SystemNAV Net Asset ValueNGO Non-Governmental OrganizationNPV Net Present ValueOECD Organization for Economic Co-operation and DevelopmentPCA Principal Components AnalysisPE Private EquityPPA Power Purchase AgreementsPRI Principles for Responsible InvestmentPVC Positioning for Value CaptureR&D Research and DevelopmentREACH Registration, Evaluation, Authorization and Restriction of ChemicalsREIT Real Estate Investment TrustRI Responsible InvestmentsROA Return on AssetsROC Receiver Operating CharacteristicROCE Return on Capital EmployedROE Return On EquityROI Return in InvestmentSAAS Software-as-a-ServiceSASB Sustainability Accounting Standards BoardSME Small and Medium EnterprisesSNA Social Network AnalysisSPLC Supply Chain

UN United NationsUSDE United States Department of EducationUSEDA United States Economic Development AdministrationVaR Value-at-RiskVC Venture CapitalWEF World Economic ForumWRI World Resources InstituteXAAS Everything-as-a-ServiceYTC Yield to CallYTM Yield to MaturityYTW Yield to Worst
VISION STATEMENTOur vision is to design a new investment fund instrument. It leverages capital commitments of both large institutional investors and economic developers for fueling the renewal of legacy industries and the growth of emerging industrial ecosystems. By pooling different financial asset classes – such as risk debt, growth equity and corporate bonds – in thematic portfolios, this instrument will address the distinct financial needs of startups, SMEs and enterprises alike.
The timing is right today because (i) institutional investors – frustrated with the dwindling performance of traditional investment models – are on the lookout for financial innovations to meet fiduciary duties and enhance returns; (ii) economic developers around the world are in dire need of efficient means to turn around lackluster economies and to promote industrial renewal; and (iii) growth companies – having limited access to traditional growth debt in the wake of the latest financial crisis – are searching for alternative financing sources to fuel their businesses in promising new industrial ecosystems.
It is challenging to achieve because (i) the institutional investment domain views innovative investment instruments with risk-averse skepticism; (ii) the regulatory thicket governing financial markets is hard to navigate for new investment vehicles; (iii) the identification of emerging industrial ecosystems with true economic growth potential and ability to provide sustainable financial returns is a complex undertaking; and (iv) the management of a multi-asset investment fund requires both a very broad and in-depth professional skillset few finance professionals are endowed with.
By working with asset managers, institutional investors, economic development agencies and other practitioners, we will make this vision real by developing a process for (i) identifying promising new industrial ecosystems, (ii) assessing the respective companies for their investment grade, (iii) designing the structure and investment thesis for a Multi-Asset Renewal Fund (MARF), and (iv) establishing the fund’s investment rating to promote its adoption in the financial markets.
Desperate times call for desperate measures. With his renowned apho-rism, Hippocrates as a physician referred to the necessity of inventive, even radical forms of therapy in combating vicious ailments. Little did he know how throughout the millennia his wisdom would find justifi-cation in much broader contexts. Ours is surely one of them.
As we write this, the global economy is in the throes of widespread po-litical and economic convulsions: Europe is struggling with its lacklus-ter competitiveness and the corresponding effects on unemployment; China has lost its momentum as an economic powerhouse and growth driver; the plummeting oil price has made life for oil producing econ-omies a living nightmare; digitalization and artificial intelligence are threatening to wipe out the jobs of half the world’s population; and Russia is defiantly clawing at old battle scars, sending widespread ripples throughout its sur-rounding economic and political systems.
The world is at a turning point in many ways, there is no question. Successful best practic-es and business models of the last two decades suddenly hemorrhage relevance. As the effects of digital change, demographic forces, politi-cal momentum and ecological concerns are rewriting the rules of glob-al economic competition, individuals, companies, and governments are on the lookout for the appropriate strategies and tools to harness exist-ing and emerging resources for the much needed industrial renewal.
With this book, we want to help economic developers, financiers and companies achieve this goal. In collaboration with practitioners, we have developed an integrated set of analytical tools and financial inno-vations for the promotion of renewal in one thematic industrial eco-system at a time. Let us illuminate and take a closer look at the vision statement on the opposite page.
In collaboration with practitioners, we have developed an integrated set of analytical tools and financial innova-tions for the promotion of renewal
1Intro
Innovation in Financial Technology Drives Industrial Renewal
18Fi
nanc
ial T
echn
olo
gy fo
r Ind
ustri
al R
enew
al Our vision is to…
…design a novel investment fund instrument that will pool capital com-mitments of large institutional investors into thematic, multi-asset funds to fuel the renewal and growth of the real economy while providing at-tractive returns for the investors.
To save you from drowning in jargon and technical cant, let us imme-diately demystify what we just meant with terminology such as “in-stitutional investors”, “thematic”, and “multi-asset funds”. At the same time, let us also explain what is so disruptive about this vision.
Institutional investors look for scale and flexibility
Institutional investors, in this book, refer to organizations such as pen-sion funds, insurance companies, private wealth managers, sovereign wealth funds and large family investment offices. These institutions control and manage tremendous financial assets for various purposes, including meeting fiduciary duties, providing protection from losses,
and generating financial returns, depending on the individual investor’s mandate.
To provide an idea of sheer scale, in 2014 pension funds in OECD countries alone managed invest-ment assets in the total amount of USD 25 trillion.
In comparison, the GDP of the EU economies in 2014 added up to on-ly USD 18.5 trillion1. Insurance companies add another mind-boggling USD 13 trillion to the global assets under management.
Unfortunately, most of the capital committed by institutional investors today has little impact
in the real economy
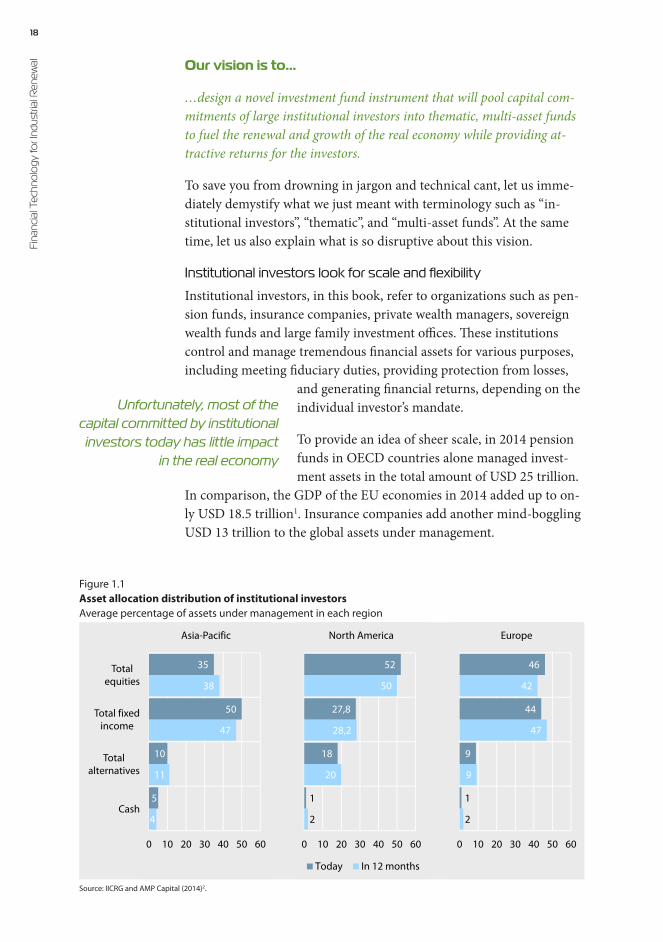
Source: IICRG and AMP Capital (2014)2.
4
11
47
38
5
10
50
35
0 10 20 30 40 50 60
Asia-Pacific
Totalequities
Totalalternatives
Cash
Total fixedincome
2
9
47
42
1
9
44
46
0 10 20 30 40 50 60
Europe
2
20
28,2
50
1
18
27,8
52
0 10 20 30 40 50 60
North America
Today In 12 months
Figure 1.1Asset allocation distribution of institutional investorsAverage percentage of assets under management in each region
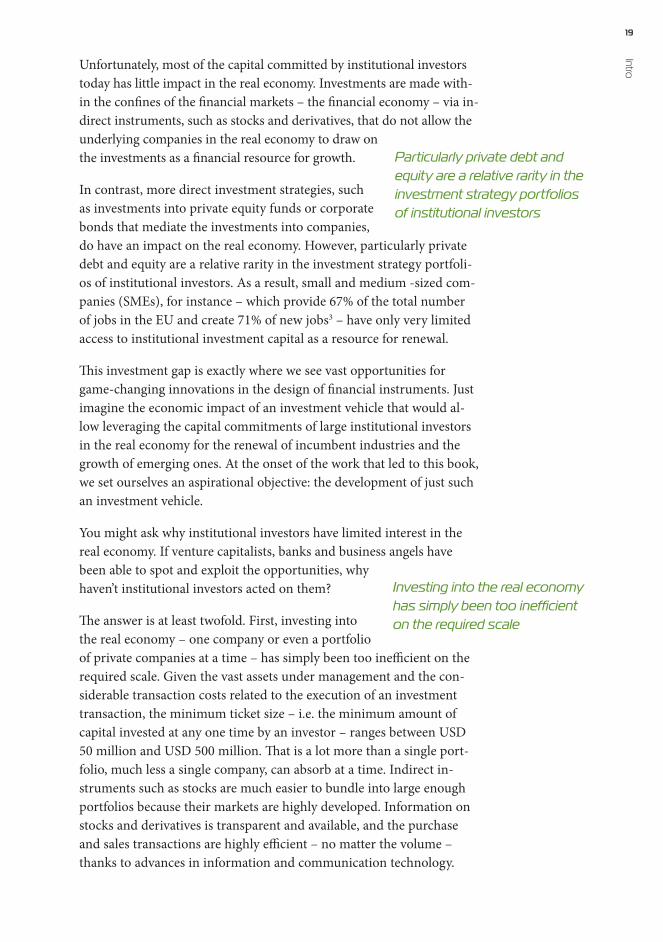
19 IntroUnfortunately, most of the capital committed by institutional investors
today has little impact in the real economy. Investments are made with-in the confines of the financial markets – the financial economy – via in-direct instruments, such as stocks and derivatives, that do not allow the underlying companies in the real economy to draw on the investments as a financial resource for growth.
In contrast, more direct investment strategies, such as investments into private equity funds or corporate bonds that mediate the investments into companies, do have an impact on the real economy. However, particularly private debt and equity are a relative rarity in the investment strategy portfoli-os of institutional investors. As a result, small and medium -sized com-panies (SMEs), for instance – which provide 67% of the total number of jobs in the EU and create 71% of new jobs3 – have only very limited access to institutional investment capital as a resource for renewal.
This investment gap is exactly where we see vast opportunities for game-changing innovations in the design of financial instruments. Just imagine the economic impact of an investment vehicle that would al-low leveraging the capital commitments of large institutional investors in the real economy for the renewal of incumbent industries and the growth of emerging ones. At the onset of the work that led to this book, we set ourselves an aspirational objective: the development of just such an investment vehicle.
You might ask why institutional investors have limited interest in the real economy. If venture capitalists, banks and business angels have been able to spot and exploit the opportunities, why haven’t institutional investors acted on them?
The answer is at least twofold. First, investing into the real economy – one company or even a portfolio of private companies at a time – has simply been too inefficient on the required scale. Given the vast assets under management and the con-siderable transaction costs related to the execution of an investment transaction, the minimum ticket size – i.e. the minimum amount of capital invested at any one time by an investor – ranges between USD 50 million and USD 500 million. That is a lot more than a single port-folio, much less a single company, can absorb at a time. Indirect in-struments such as stocks are much easier to bundle into large enough portfolios because their markets are highly developed. Information on stocks and derivatives is transparent and available, and the purchase and sales transactions are highly efficient – no matter the volume – thanks to advances in information and communication technology.
Investing into the real economy has simply been too inefficient on the required scale
Particularly private debt and equity are a relative rarity in the investment strategy portfolios of institutional investors

20Fi
nanc
ial T
echn
olo
gy fo
r Ind
ustri
al R
enew
al As to the second reason, direct investments into private companies are a lot more illiquid than indirect investments. It takes longer for private investments to generate returns because they are a function of the rise in value of the company, or servicing of its debt obligations. The val-ue, in turn, only rises with the growth and progress of the business of the invested company. Therefore, capital committed via direct invest-ments needs to be patient and wait for the rise in company value be-fore returns can be expected. However, institutional investors want to maintain their flexibility and be able to redirect capital at will. Since the invested capital can’t be traded or withdrawn, investors demand an ad-
ditional liquidity premium on their invest-ments, if they are to invest in the first place.
That all being said, it is clear that if we want to create an investment fund vehicle that
leverages institutional investment capital for direct impact in the re-al economy, we have to be able to address these inefficiencies. Solving the issue will be the first of a number of financial innovations neces-sary to make our vision real. Hence, our solution will involve combin-ing a large enough pool of liquid and illiquid financial instruments in a single vehicle so that they provide both for economic impact, as well as sufficient scale and flexibility to institutional investors.
Conventional industry boundaries give way to cross-industrial, thematic growth
Impact is strongly correlated to thematic growth sectors of the econo-my. To see the connection between the two concepts, we first need to establish how modern industries evolve and grow.
As you will learn in the subsequent chapters, modern growth sectors of the economy are characterized by newly evolving collaborative rela-tionships across conventional industry boundaries. For instance, take Smart Grids, a supply- and demand-side innovation to optimize energy
delivery and consumption. To integrate pre-dictive, autonomous, and user-guided intel-ligence into the production and distribution of energy, energy utilities and grid opera-tors are now actively liaising with industry
sectors they previously had no dealings with. These include – but are not restricted to – telecommunications operators, data analytics com-panies, smart meter manufacturers, system software providers and mo-bile application developers.
It has become clear that many growth sectors of the economy can no longer be properly characterized using conventional industry classifi-cations. On the contrary, never before have such a large number of pre-
Our solution will involve combining a large enough pool of liquid and illiquid
financial instruments in a single vehicle
Growth sectors of the economy can no longer be properly characterized using
conventional industry classifications

21 Introviously unrelated and diverse industry sectors joined forces to create
entirely new types of value-added. Never before have value chains and value networks been this complex and diverse.
If not a certain industry classification, what then is the common denominator for a given emerging ecosys-tem? To put it simply, it is the defining activity of the ecosystem in and by itself; an activity that shares a common theme such as Smart Grids, Smart Mobility or Green Chemistry. When we refer to thematic industries we refer to just these kinds of modern industry eco-systems: they are characterized by cross-industrial value chains and can best be described by their common thematic activity.
Given that thematic ecosystems are the current growth centers of the economy, an investment vehicle that allows for aligning institution-al capital commitments with the emerging structures of new industries constitutes a major financial innovation with unprecedented economic impact potential.
Indeed, many existing investment strategies, by design, are incapable of driving major eco-nomic growth. In the name of risk management, most investment strat-egies prefer to diversify portfolios across a broad palette of unrelated industries, protecting investments from losses in any single sector. For an investor interested only in maximizing monetary returns this is a vi-able strategy, of course. There is no need to take into account whether the investments help to build out the economy.
For someone interested in promoting economic growth – say, the world’s 80 largest pension funds (P804) that have committed 3% of their assets under management (AUM) to promoting green econom-ic growth through infrastructure or project finance – it is awfully inef-fective. Thematically agnostic investment strategies spread capital commitments too thinly across various ecosystems to have focused impact on economic development.
Therefore, it is our objective to develop an investment vehicle that grounds its investment thesis in sourcing invest-ment deals from identified thematic industry ecosystems.
How do we intend to deal with risk? Doesn’t the focus on thematic eco-systems introduce systematic – correlated, or non-diversified – risks that are difficult to offset? The answer is: no. Thematic ecosystems are a collaborative network of companies from a great number of differ-ent industries. For most of these companies, their activities in any sin-gle thematic ecosystem comprise only a fraction of their other exist-
Modern industry ecosystems can best be described by their common thematic activity
Many existing investment strategies, by design, are incapable of driving major economic growth
Our objective is to develop an investment vehicle that grounds its investment thesis in sourcing deals from thematic industry ecosystems
22Fi
nanc
ial T
echn
olo
gy fo
r Ind
ustri
al R
enew
al ing or potential markets. One could consider each ecosystem the com-panies are active within a separate market or line of business. Many of the companies – such as telecommunications operators and application software developers – are active in a number of different ecosystems. Systemic market risks will not impact each industry in the same way. In investment parlance, there is low correlation or a high degree of di-versification across the portfolio of companies included in a thematic fund. Hence, the cross-industrial nature of thematic ecosystems pro-vides for an implicit risk diversification strategy.
The multi-asset fund structure matches the right asset classes with the right companies
Identifying and understanding the industrial structure of thematic eco-systems is insufficient to execute a thematic investment strategy, and allocate investment capital to specific companies. Especially more di-rect investments in private companies – such as unsecured risk debt and private equity – necessitate assessing the ecosystems on the compa-ny-level. We need to understand the risk of the underlying assets.
The challenge here is the vast diversity of companies. As we described earlier, thematic ecosystems are cross-sectoral, providing for a great va-riety of businesses in the different industrial spaces of the ecosystem. Not only do companies vary in their industrial backgrounds, they al-so differ in size, stage of life-cycle, business and revenue models, capital intensity and many other characteristics that investors deem important when assessing a company.
These characteristics determine the financial needs of a company and its fit with the various investment instruments that exist on financial
markets. A young, pre-revenue startup cannot ex-pect to be able to secure a bank loan to fuel its growth because there is no cash flow to cover the fixed installments of the loan. Likewise, most large enterprises are not able – nor willing – to attract
private equity investments because its growth and the scalability of business are not on par with the investors’ expectations.
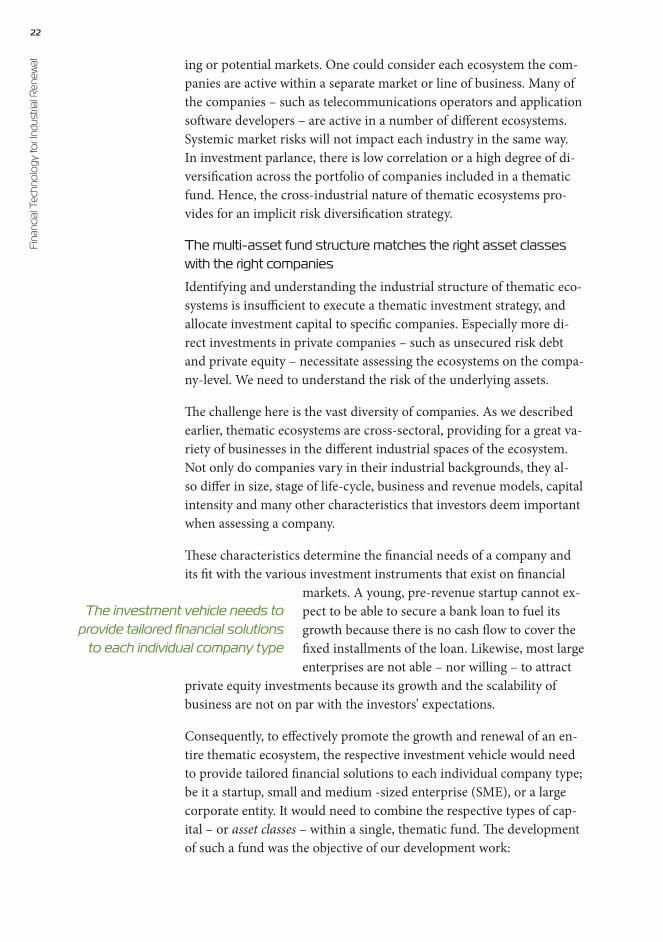
Consequently, to effectively promote the growth and renewal of an en-tire thematic ecosystem, the respective investment vehicle would need to provide tailored financial solutions to each individual company type; be it a startup, small and medium -sized enterprise (SME), or a large corporate entity. It would need to combine the respective types of cap-ital – or asset classes – within a single, thematic fund. The development of such a fund was the objective of our development work:
The investment vehicle needs to provide tailored financial solutions
to each individual company type

23 IntroThe Multi-Asset Renewal Fund
The timing is right…
…because institutional investors – frustrated with the dwindling perfor-mance of traditional investment models – are on the lookout for finan-cial innovations to meet fiduciary duties and enhance returns; econom-ic developers around the world are in dire need of efficient means to turn around lackluster economies and to promote industrial renewal; and, fi-nally, growth companies – having been denied access to traditional bank risk loans in the wake of the latest financial crisis – are searching for al-ternative financing sources to fuel their businesses in promising new in-dustrial ecosystems.
The impetus for developing the Multi-Asset Renewal Fund – or MARF – was given by the combined momentum of several megatrends that threaten the growth of economies and the welfare of societies.
Institutional investors are in need of higher yielding investment opportunities at moderate risk increases
Let’s start with the plight of institutional investors themselves. Pension funds, in particular, are facing dire times as their cash-in – cash-out ratios are shrinking below parity. The reasons are manifold:
1 Exceptionally disadvantageous developments in the demo- graphics of developed countries that have seen the populous baby-boomer generation transition into retirement;
2 The onslaught of digitalization plowing holes into the ranks of employees in previously labor-intensive professions; and
3 The generally very challenging conditions on the capital markets – such as the permanently low interest rates and high volatility – in the post-2008-crisis era.
Pension funds are teetering at the critical breakeven point at which fidu-ciary payout commitments are starting to exceed the value of available investment opportunities. As the former head of sustainable investing at one of Scandinavia’s biggest banks bluntly put it: “The invest-ment model of pension funds is broken.”5
Feeling threatened by the developments, many of the institu-tional investors that along the way helped us in designing the MARF have cautiously explored new ways to steer their investment strategies back on-to a sustainable track. While conventional strategies such as stocks still remain the mainstay of institutional investing, the share of alternative
The investment model of pension funds is broken
24Fi
nanc
ial T
echn
olo
gy fo
r Ind
ustri
al R
enew
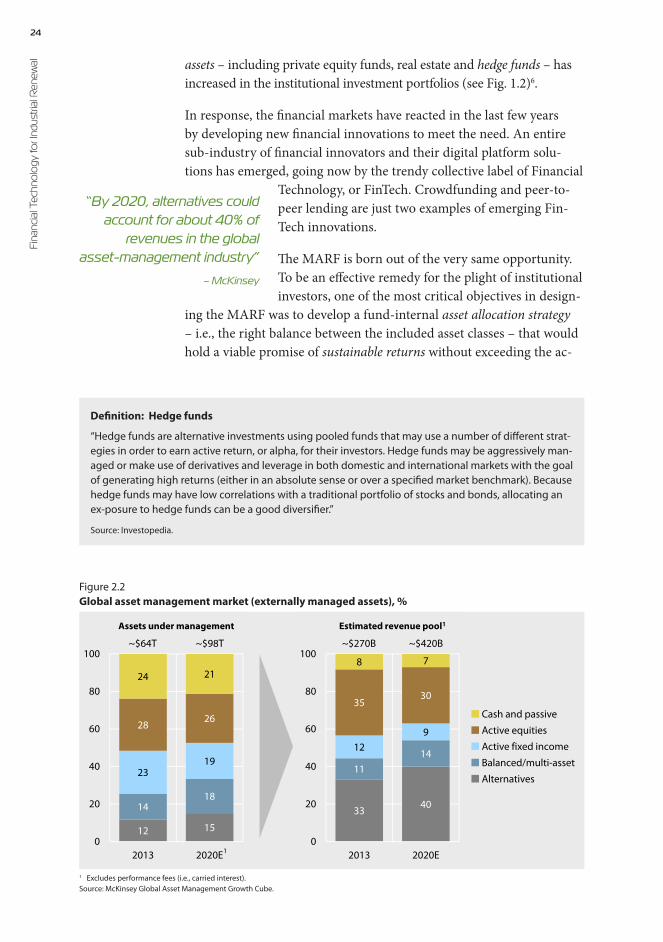
al assets – including private equity funds, real estate and hedge funds – has increased in the institutional investment portfolios (see Fig. 1.2)6.
In response, the financial markets have reacted in the last few years by developing new financial innovations to meet the need. An entire sub-industry of financial innovators and their digital platform solu-tions has emerged, going now by the trendy collective label of Financial
Technology, or FinTech. Crowdfunding and peer-to-peer lending are just two examples of emerging Fin-Tech innovations.
The MARF is born out of the very same opportunity. To be an effective remedy for the plight of institutional investors, one of the most critical objectives in design-
ing the MARF was to develop a fund-internal asset allocation strategy – i.e., the right balance between the included asset classes – that would hold a viable promise of sustainable returns without exceeding the ac-
1 Excludes performance fees (i.e., carried interest).Source: McKinsey Global Asset Management Growth Cube.
Cash and passive
Active equities
Balanced/multi-asset
Active fixed income
Alternatives
12 15
1418
2319
28 26
24 21
0
20
40
60
80
100
2013 2020E
~$64T
Assets undermanagement
~$98T
1
33 40
1114
129
3530
8 7
0
20
40
60
80
100
2013 2020E
~$270B
Estimated revenue pool1
~$420B
Figure 2.2Global asset management market (externally managed assets), %
“By 2020, alternatives could account for about 40% of
revenues in the global asset-management industry”
– McKinsey
Definition: Hedge funds
“Hedge funds are alternative investments using pooled funds that may use a number of different strat-egies in order to earn active return, or alpha, for their investors. Hedge funds may be aggressively man-aged or make use of derivatives and leverage in both domestic and international markets with the goal of generating high returns (either in an absolute sense or over a specified market benchmark). Because hedge funds may have low correlations with a traditional portfolio of stocks and bonds, allocating an ex-posure to hedge funds can be a good diversifier.”
Source: Investopedia.
25 Introceptable boundaries for the associated risks. The more detailed dis-
cussions on the risk-return profile of the MARF and risk management strategies are included in the appropriate chapters.
Economic developers feel pressure to find effective tools for re-kindling the economy
The MARF addresses the needs of yet another group of practitioners on the lookout for hands-on tools: economic developers around the world are desperate to turn around lackluster economies hit by the latest global economic crisis.
Take Finland, for instance. Frequently placed at the very top of WEF’s list of most competitive business environments, the country has now seen its GDP sink for three consec-utive years. The economists talk about a structural problem as the en-gineering-driven, investment goods-heavy export industry has failed to transition into the scalable, digital economy. Stuck with industries slowly becoming obsolete, the country’s industry structure is in dire need of renewal.
Other economies face similar problems for their own reasons. In Ger-many the Energiewende – the strategic commitment to let go of nuclear power altogether in the next few years – will entail massive renewal ef-forts as the energy infrastructure needs to be upgraded for compatibil-ity with alternative and multi-directional energy production and trans-mission technologies.
China, in turn, is feeling massive growing pains as the blindingly fast economic growth of yesteryears has created an ever-growing, affluent middle class that has raised average salaries on the Chinese East coast at a speed of up to 20% annually. China has lost its competitive edge as the world’s inexpensive manufacturer, and has to look for for economic renewal strategies as it is now forced to enter the very same ring with its developed Western com-petitors.
How can the MARF then help economic develop-ers in their efforts to renew industries? After all, economic developers will not have much of a say in how MARF’s will be executed; the instrument is meant to be fully market-driven and pri-vately managed. Where is the connection between financial asset man-agement and economic development?
The instrument will implicitly serve the interests of economic develop-ers. To be more precise, MARFs help to leverage private institutional funds – a previously mostly untapped resource in economic develop-
Economic developers around the world are desperate to turn around lackluster economies
MARFs will directly fuel the growth of companies in the real economy and promote the emergence of entire ecosystems
26Fi
nanc
ial T
echn
olo
gy fo
r Ind
ustri
al R
enew
al ment – for the growth of the real economy. Many of the asset classes in MARFs will more or less directly fuel the growth of existing compa-nies. As we will show later on, the bulk of companies that receive direct investments via MARFs are SMEs; companies that according to central statistics are the engine of economic growth.
The thematic investment strategy of MARFs will further enhance the in-strument’s effectiveness as an economic development tool because it focuses the injection of resources on identified growth sectors of the economy. Thematic MARFs promote the emergence of entire ecosys-tems, of long-term economic structures with lasting value creation po-tential.
Companies looking to reposition themselves into emerging ecosystems are plagued by growth funding shortage
The fallout of the 2008 financial crisis transcended the boundaries of the financial world in many unpredicted ways. Almost a decade later, many of the effects it had on the real economy have long been old news. Thanks to tightened regulations that aimed at reinforcing the balance sheets of financial institutions, banks have clamped down on lending to businesses. Surprisingly, if surveys by the European Central Bank are to be trusted, the share of approved loan applications has not dropped sig-nificantly7. A quick round of interviews on the ground, however, expos-es a fairly disconcerting phenomenon behind the veil of ECB’s statistics:
While companies applying for low-risk operational loans – say, to man-age cash flows and receivables – have little difficulties obtaining credit from banks, agile companies looking to conquer new markets or repo-
sition themselves into new, emerging eco-systems are much worse off.
To provide a quick example, a Finnish jet propulsion developer discovered an op-portunity to utilize their naval jet propul-sion technology in combating floods in the Far East. To do so, the company planned to send a small number of their engineers on-site to investigate both the market poten-tial and technical specifications of a poten-
tial solution for a few months. Unfortunately, despite steady cash flows from the company’s existing lines of business, banks were either unable or reluctant to finance the endeavor; mostly, because there was no tan-gible collateral specific to the purpose the loan was sought for. Provid-ing an unsecured loan would have looked bad in light of the tightened regulations.
“If you listen to the Prime Minister, or the Chancellor, or the Chief Secretary to the Treasury, they say the one thing
that will bring back the economic recovery more quickly is if banks lend to SMEs – and they’re not.”
– Ronel Lehmann, Chief executive, Lehmann Communications @
UK Treasury Select Committee, May 2014

27 IntroIf the anecdote were in any way representative of a funding plight expe-
rienced by growth companies, the worst of consequences of the recent financial crisis is still to be faced: the incapacitation of economies to re-new themselves fast enough. To cut off SMEs from the funding source they have relied on for so long is to deprive them of their ability to experiment, explore and expand; the one ability that makes them so indispensable for industrial change and new job creation.
With the MARF, it was our objective to develop an alternative funding source for growth SMEs. If banks are unable to serve the role due to ever stricter regulations, the MARF is an efficient solu-tion for providing SMEs with an almost direct access to the financial resources of large institutional investors. The same investors, with con-ventional instruments, were previously unable to efficiently commit capital to growing economies.
It is challenging to achieve…
…because the institutional investment domain views innovative invest-ment instruments with risk-averse skepticism; the regulatory thicket gov-erning financial markets is hard to navigate for new investment vehicles; the identification and validation of emerging industrial ecosystems with true economic growth potential is a complex undertaking; and, finally, the management of a multi-asset investment fund structure requires both a very broad and in-depth professional skillset few finance professionals are endowed with.
The implementation of financial innovations lends itself to a compari-son with running the proverbial gauntlet. When risk and return are at stake, particularly where pension funds are involved, any new financial instrument has to pass actuarial muster. The MARF is not exempt in any way.
To start with, institutional investors – those mandated with fiduciary duties, in particular – are highly sceptic with regard to new investment vehicles. And they have good reasons to be so. For instance, the pen-sion fund model is based on very stable, albeit relatively moderate returns, and is therefore vul-nerable to high volatility. The model favors long-term commitments of capital to steadily yield-ing assets. In periods of particularly low returns – such as the current, low interest rate environment – volatility impacts can be dire. Any new investment vehicle candidate needs to pass a test of market validation and actuarial risk and return requirements.
“A bank doesn’t want to be sitting on illiquid assets for a long time, but shadow banks [e.g. pension funds] have a higher capacity to take illiquid assets and sit on them for a very long time”
– Alan Capper, Lloyds
Institutional investors are highly sceptical of new investment vehicles
28Fi
nanc
ial T
echn
olo
gy fo
r Ind
ustri
al R
enew
al Winning over potential asset managers is one challenge, navigating the post-2008-crisis thicket of regulations that govern financial markets is another. Luckily the European Central Bank, the European Union and
various governments have woken to funding the plight of growth companies and have start-ed to create tailored and transparent rules for funding instruments alternative to bank lend-ing. These instruments include the bundling of small business loans into asset-backed securi-ties (ABS), and long-term investment funds8 (LTIF). Both are geared towards enabling large institutional investors to effectively commit their capital while alleviating the problems
caused by a drought in small business funding. The MARF will take ad-vantage the developments and follow the trail blazed by these regulato-ry innovations to access financial markets.
Another challenge relates to the MARF’s thematic investment the-sis. How are emerging ecosystems with enough industrial momentum identified and selected to warrant sustainable financial returns. The big-gest challenge in thematic investing is in choosing a theme that is not a political fad, but rather is grounded in economic reality. Investment strategies indeed need to be aligned with and designed by leveraging verifiable growth signals from the economy. Investments only yield re-
turns if the underlying companies grow and pros-per.
Political vision is a necessary but insufficient pre-requisite for selection of an investable theme. As
we will show in later chapters, the MARF uses quantitative data on ex-isting business relationships between companies to establish wheth-er any given thematic ecosystem truly exhibits industrial momentum. This in and by itself is a novel approach to portfolio design.
Finally, managing a MARF calls for an exceptionally broad skillset that few finance professionals in the industry have. The challenge in the management model is that up to four different asset classes have to be balanced in a single portfolio. Asset managers with a multi-asset back-ground are a true rarity. Why? Conventional finance theory assumes that markets are efficient enough to coordinate investments of any sin-gle investor into separate assets. Consequently, asset managers have largely specialized in managing individual asset classes. There are those specialized in exchange traded funds (ETF), those managing futures and other derivatives, managers in charge of bond portfolios, risk-lov-ing venture capitalists and so forth.
European Central Bank President Mario Draghi is considering plans for
a new model of financing aimed at making it easier for small businesses
to access funding from “non-bank financial institutions” which could
include pension funds and insurers.”
– CNBC
Investment strategies indeed need to be aligned with verifiable
growth signals from the economy
29 IntroWhat a MARF requires, however, is someone who knows how to deal
with a blended mix of different asset classes. For-tunately, with the amount of novel financial in-novations on the rise – including hybrid instru-ments such as the debt-equity vehicle managed by the Finnish boutique asset management com-pany Juuri Partners – the number of suitable managers with multi-asset capabilities will grow as well.
By working with…
…asset managers, institutional investors, economic development agencies and other potential practitioners and adopters, we will make this vision real by developing a process for (i) identifying promising new industri-al ecosystems, (ii) assessing the respective companies for their investment grade, (iii) designing the structure and investment thesis for a Multi-Asset Renewal Fund (MARF), and (iv) establishing the fund’s investment rating to promote its adoption in the financial markets.
We have laid out what we seek to develop in the MARFs, why we think the moment is opportune to do so, and which shoals MARFs need to be navigated around before market rollout. What is still missing from the story is its thread, an exploration of the question how. This is what the bulk of this book is intended to be about. Let’s summarize the three key phases in the design process of a MARF.
First, we need a systemic and data-driven methodology to identify and verify the materiality of emerging industrial ecosystems. As discussed, the methodology needs to distinguish economic momentum from pol-icy fad. Returns can only be expected from growth in the real economy, and therefore we need to make sure that the identified ecosystems are grounded in macro-economic principles. The structure of an emerging industry ecosystem is uncovered by way of financial network maps.
The mapping approach and interpretation are detailed in Chapter 3.
Once the structure of an ecosystem has been confirmed, it is time to separate the companies in terms of their investment grade. Hence, companies need to pass a rigorous due diligence to be considered for inclusion in the MARFs. Our due diligence pro-cess has two phases. In phase one, companies are assessed on their value capture capability. We ask how much of the value a company generates is actually retained – or captured – and how much of it is appropriated by its partners. The intuition is simple: stronger value capture capabilities allow companies to exploit a larger share of
A MARF requires someone who knows how to deal with a blended mix of different asset classes
Companies need to pass a rigorous due diligence to be considered for inclusion in the MARFs
30Fi
nanc
ial T
echn
olo
gy fo
r Ind
ustri
al R
enew
al their upside potential. Given their value capture potential, the second phase of the process then assesses their investment grade. This analysis determines the type of capital suitable to a company’s business model, market proliferation, capital intensity and other factors that determine the speed at which a company can exploit its full potential.
Company assessments are the subject of Chapter 4.
Once a sufficiently large pool of investee candidates has been identi-fied, it is time to structure the actual MARF itself. In Chapter 5, we show how financial metrics and statistical methods are employed to de-termine an optimal, fund-internal asset allocation strategy given the results of the investment grade analysis. The key asset classes of the MARF include unsecured risk -debt, private equity, exchange traded funds, and thematic corporate bonds.
In Chapter 6 we will discuss the fund’s management model, and oth-er distinct features that characterize the MARF as a unique instrument. These include the employment of governmental guarantee instruments for de-risking the riskiest asset classes in the fund, for instance.
Finally, to complete the process, in Chapter 7 we establish the MARF’s investment rating, by adapting accepted rating methodologies from rat-ing agencies.
The design process will be applied to real world cases. Given the re-cent comeback of Cleantech and sustainability onto the agenda of glob-al investors, we test our concepts on three separate ecosystems in the greening spaces of economies: Smart Grid, Smart Mobility, and Green Chemistry. These pilots have generated useful insights with regard to the ecosystems’ various strengths and weaknesses. Therefore, besides offering a thorough treatment of the MARF’s design process, the book provides abundant policy insights and managerial implications to the ambitious business director and the concerned economic develop-er vested in drawing strategic roadmaps. The application of the MARF concepts on the three Cleantech ecosystems is detailed in Chapter 2.
With that, we hope to have piqued your interest and wish you an enjoy-able time exploring the content of this book.
31 IntroReferences
1 World Bank: http://data.worldbank.org/region/EUU2 Institutional Investor Custom Research Group and AMP Capital (2014): Asset
allocation shifts at pension and retirement plans. AMP Capital, Insti-tutional Investor Report 2014/4
3 Eurofound (2016). ERM annual report 2015: Job creation in SMEs, Publications Office of the European Union, Luxembourg.
4 http://www.globalsolutionssummit.com/p-80-group-foundation.html P80’s mission statement: “Our mission is to lead and guide the world toward a path of greater sustainability by developing financial instruments that deploy capital into technology that tackle global challenges.”
5 Antti Savilaakso, Nordea, Corporate Venture Day 2014.6 McKinsey (2014). The Trillion-Dollar Convergence: Capturing the Next Wave of
Growth in Alternative Investments. Financial Services Practice, AUG 2014.7 European Central Bank (2015). The euro area bank lending survey Second quarter of
2015. ECB, Frankfurt, Germany.8 http://www.consilium.europa.eu/en/press/press-releases/2015/04/20-long-term-
investment-funds/


Setting 2Nordic Cleantech – An Ideal Testbed for Financial Technology
34Fi
nanc
ial T
echn
olo
gy fo
r Ind
ustri
al R
enew
al
In the introduction, we promised to keep the real-world application of the Multi-Asset Renewal Fund (MARF) design process close to hand at all times throughout the book. Indeed, novel concepts are easier to ab-sorb when observed in action. Thus, before commencing the deep-dive into the development of MARFs in the sub-sequent chapters, we intro-duce you to our real-world setting – the Finnish Cleantech space.
For those who wonder why we elected the remote Nordics as the test-bed for MARFs, let us briefly illuminate a few reasons behind the choice. Those who are eager to plunge right into the thick and thin of
MARFs are most welcome to take a shortcut and jump over to the next chapter.
The latter be warned, though! You will miss highly interest-ing insights into a returning industrial trend that will soon-
er or later inevitably sweep across economies all around the globe. Ac-cording to recent WWF & the Cleantech Group1, in 2014 Finland was among the top-3 Cleantech economies in the world; it is only a matter of time when the issue becomes serious business in countries that for now still lag behind.
So, why the Nordics? The first and most central of reasons is unhin-dered access to data. The Nordic countries are known for very trans-parent business reporting standards and regulations. Unlike in most other regions of the world, in Finland even private companies – no matter how young or small – submit financial statements on the same level of detail as publicly traded companies to freely and publicly avail-able databases. Unlimited access to financial data, in turn, is crucial to our endeavors as we need to empirically test and simulate the financial performance of MARFs.
A second reason to head north is just as practical. As we will short-ly elaborate on further, the country’s ailing economy is at a crossroads.
In 2014 Finland was among the top-3 Cleantech
economies in the world
Nordic Cleantech – An Ideal Testbed for Financial Technology
“Green technologies – going green –is bigger than the Internet.
It could be the biggest economicopportunity of the 21st century.
– John Doerr, Venture Capitalist

35 S
etting
Economists in Europe have long spoken of a need for the country’s structural renewal as its conventional industry space has lost its mo-mentum. Nokia’s recent demise in the mobile communications indus-try is probably the best-known case in point. And restructuring is pre-cisely what best characterizes Finland’s current state of matters. The country’s strong history in telecommunica-tions, information technology and electronics gives it a formidable pool of resources and skills that are only wait-ing for an opportunity to be employed in new econom-ic growth sectors. The setting serves our purposes well: Finland is a growth bed for new industrial activity and emerging ecosystems; the perfect environment to identify thematic growth spaces and to test our investment vehicle on.
Without further ado, here is the Finnish Cleantech space.
From policy fad to respectable economic activity
In the past decade, Cleantech seems to have graduated from a glorified, policy-driven fad and the scourge of over-zealous venture capitalists to a perceptible, economic megatrend with considerable industrial and fi-nancial momentum.
Only as recently as 2008 did the Economist2 proclaim the “downturn of clean technology” under the “gathering clouds” of the global economic slowdown. Today, Chrysalix EVC3, one of the longest standing venture capital firms in the Cleantech space, estimates that the total addressable market in Cleantech will grow to a size anywhere between three and four trillion USD by 2020; an eight-fold increase since 2005. In 2013, global investments into green energy alone exceeded $200Bn, a figure that is expected to triple until 20304. To put the numbers into perspec-tive, current investments into fossil-fuel-based power generation top out at $270Bn.
The market performance of select vanguard names in Cleantech pro-vides further support for the sector’s long-awaited success story that many are still rather cautious to buy into. According to CapitalIQ and Bloomberg, the present-market-capitalization-over-IPO-value multi-pliers of companies such as Cree, Tesla and Solar City are on par with those of ebay, Google, Linkedin and Facebook. Certainly, one cannot ignore the growing body of economic and financial evidence speaking in favor of Case Cleantech. Nonetheless, the agnostic will still want to know what is driving this surge in Cleantech. What are the incentives? Where are the growth opportunities? How have business models shift-ed? Why is Cleantech back on the agenda?
Finland is a growth bed for new industrial activity and emerging ecosystems
36Fi
nanc
ial T
echn
olo
gy fo
r Ind
ustri
al R
enew
al Threats are effective drivers for the greening of economies
As an incentive, the stick is often mightier than the carrot, they say. In the context of Cleantech, the stick comes in the form of increasing re-source scarcity and global warming (WEF5, PWC6, KPMG7). Already, decision makers in business and politics alike are starting to feel the pain brought on by the foreseeable negative impacts of environmental and social sustainability trends, if neglected:
1 Rapid growth in the planet’s population and the gentrification of developing economies exacerbates the competition for resourc-es as pressures to increase the production of food, energy and minerals rise. According to the UN, the demand for food will in-crease by 30 percent until 2030; and by a staggering 50 percent until 2050. In parallel, crop yield in agriculture grows at an ev-er slowing rate of only 1 percent annually. Four decades ago the rate still was twice as high. With demand outpacing production, prices are bound to soar and weaken the purchasing power of consumers.
2 In the wakes of Fukushima’s nuclear tragedy and Ukraine’s po-litical conflict, businesses and governments are redirecting em-phasis on energy security. Strategies in the energy space focus on diversifying risk by increasing the number of producers and suppliers as well as by accelerating the integration of renewables in the energy mix. The uncertainties in this space are reflected in increasing energy prices that, depending on the sector, already make out 5–20 percent of businesses’ total costs.
3 According to the newest findings by the International Ener-gy Agency (IEA), the cost impact of global warming will ex-ceed 3.2 percent of global GDP by 2030, if attempts at curbing emissions-related increases in the global temperature should fail. Current estimates value present costs at $1200Bn (DARA, 20108). To de-risk potential consequences of climate change on society and the economy, governments are setting in place regu-latory measures that drive sustainable production and consump-tion. These regulations set new strategic and operative bound-aries for businesses, challenge incumbent business models, and provide ample opportunities for new, innovative businesses and incumbents that seek to renew their business practices. Even be-hemoths such as Exxonmobile, Microsoft and General Electric already forge strategies that are compatible with business en-vironments subject to carbon tax – like regulatory innovations (New York Times, 20139).

37 S
etting
4 Regulatory schemes – the governmental armory of sticks – are complemented by more direct measures such as the withdraw-al of current subsidies. The International Institute for Sustain-able Development (IISD) estimates that governments around the world subsidize the production and use of fossil fuels with a compound $600Bn annually. About $100Bn thereof are said to go to the oil producers di-rectly. As outlined by the Global Subsidies Ini-tiative in 201010, decision makers at the G-20 Pittsburgh Summit proclaimed that “inefficient fossil-fuel subsidies encourage wasteful con-sumption, distort markets, impede investment in clean energy sources and undermine efforts to deal with climate change.” The Summit’s yield was a joint decision to phase out inefficient fossil-fuel sub-sidies that encourage dissipative consumption. When and how a phase-out will hit producers, investors, industry, business and other central stakeholders such as consumers is not known, but the impact will be felt widely with great certainty.
5 In many countries, governments and NGOs take on more ag-gressive roles in the promotion of Cleantech related sectors. In Finland, for instance, the Ministry for Employment and the Economy has launched a “Government Strategy to Promote Cleantech Business in Finland”11. By 2020 the strategy aims (i) to raise the compound turnover of Finnish Cleantech compa-nies to €50Bn, of which exports would account for over 75%, (ii) to double the Finnish Cleantech home market to about €20Bn, (iii) to raise the number of Cleantech companies from 2000 to about 3000, and (iv) to create at least 40,000 jobs in clean tech-nology in Finland. To name a few action points of the strategy, the “Ministry of Finance is to annually provide €30M in invest-ment subsidies for Cleantech demonstration and reference proj-ects, which are to catalyze €150M in investments into Finland.” Prize money for companies winning in international Cleantech -related business plan competitions is set to €1M. Furthermore, the “Ministry for Foreign Affairs is to name shared Cleantech envoys to more than 100 countries by 2015.” In the NGO space, the Global Cleantech Cluster Association (GCCA), a meta-clus-ter with the vision “to drive sustainable regional economic de-velopment on a global scale”, has grown in only four years of its existence to encompass 50 clusters from across the world, repre-senting 10,000 Cleantech companies. The GCCA is collaborating with the P80 Group Foundation and Club de Madrid to support the Global Technology Deployment Initiative.
“Inefficient fossil-fuel subsidies encourage wasteful consump-tion, distort markets, impede investment in clean energy sources and undermine efforts to deal with climate change.”
– Global Subsidies Initiative

38Fi
nanc
ial T
echn
olo
gy fo
r Ind
ustri
al R
enew
al 6 In parallel with the corporations and governments, the financial markets are bracing for the impact that regulations and chang-es in consumption will have on the valuation of companies that produce and refine fossil fuels12. The rise of ESG (Environmen-tal-Social-Governance) -indexed funds, impact investing, and responsible investing reflect growing concerns about a shift in the valuation of business models and practices. Pension funds that are by far the largest investors in fossils-based businesses are especially exposed to carbon risk, because of the annual div-idends paid out by oil and gas companies. The question is when do pension funds start repositioning their vast resources towards a green (or better, carbon-free) economy? And where are those funds to be placed? A recent Environmental Finance workshop in London indicated that part of the problem is the dearth of green assets for allocation. The challenge is, pension funds do not like thematic investments. To them themes are policy-driven fads subject to political volatility13.
In summary, commitment to and opportunities in Cleantech seem to finally materialize in tangible form. Hype is being replaced by a grow-ing concern about the sustainability of not only the environment but that of societies. Food, housing and transportation costs are on the rise as resource scarcity is becoming more imminent in a world with a fast growing population but finite assets. Fortunately, driven by this con-cern, governments, businesses and consumers alike seem to share a common view of the necessity to green the world’s economies.
That being said, governments can do only so much. While setting the incentives, they do not produce the solutions. Consumers, on the other hand, are many times told by businesses what they need and what op-tions they can choose from. Hence, companies play a crucial role. The question then is how well is the corporate space positioned to take ad-vantage of Cleantech and drive change? What is the state of Cleantech as a business today? How do Cleantech companies need to restruc-ture their business models to enable scale of adoption and profitability? And most importantly – for the development of MARFs – is the larger Cleantech space really a growth bed for new industrial ecosystems?
What is Cleantech?
To provide some empirical answers to the questions, we take a close-up look at the commercial Cleantech space in Finland. The picture is drawn using numeric, categorized distributions of central economic in-dicators such as turnover, number of employees, profit margin, and re-turn on investments.

39 S
etting
Before diving into the numbers, however, we should first agree on what it is the numbers are depicting. Given the strong sentiments different stakeholder groups have developed towards Cleantech in the past two decades, one is inclined to think that by now it is a well-defined, mani-fest concept.
The truth is somewhat disappointing. Anyone randomly searching for a definition among literature or online sources soon finds that it is ev-erything but well-defined. Existing definitions are extremely vague and ambiguous. They are either too narrow or describe technological, in-dustrial and strategic spaces so vast they lose all functionality as a defi-nition. For the reader’s convenience, a small sample of existing defini-tions for Cleantech is given below:
1 “Clean technology (Cleantech) is the installation or a part of an installation that has been adapted in order to generate less or no pollution. In clean as opposed to end-of-pipe technology, the en-vironmental equipment is integrated into the production pro-cess.” – OECD/UN14.
2 “Cleantech refers to products, services and processes, which pro-mote the sustainable use of natural resources while reducing emissions. Cleantech is not an industrial sector of its own but the markets for the products and services are found in all indus-trial sectors, especially from technology, energy and construc-tion sectors.” – Ministry for Employment and the Economy, Fin-land.
3 “In brief, Cleantech refers to technology, products and services which generate superior commercial benefits to customers while addressing significant environmental concerns such as global warming, sustainability of natural resources and energy securi-ty.” – ecoConnect, UK
4 “A broad base of processes, practices and tools, in any industry that supports a sustainable business approach, including but not limited to: pollution control, resource reduction and manage-ment, end of life strategy, waste reduction, energy efficiency, carbon mitigation and profitability.” – Clean Technology Trade Alliance
5 “Cleantech, also referred to as clean technology, and often used interchangeably with the term greentech, has emerged as an um-brella term encompassing the investment asset class, technology, and business sectors which include clean energy, environmental, and sustainable or green, products and services.” – Neal Dikeman, Jane Capital Partners LLC

40Fi
nanc
ial T
echn
olo
gy fo
r Ind
ustri
al R
enew
al 6 “A shortened form of “clean technologies”, a term used to de-scribe an investment philosophy used by investors seeking to profit from environmentally friendly companies. Cleantech firms seek to increase performance, productivity and efficiency by minimizing negative effects on the environment.” – Investopedia
7 “Cleantech is any product or service that improves operation-al performance, productivity, or efficiency while reducing costs, inputs, energy consumption, waste, or environmental pollution. Its origin is the increased consumer, regulatory, and industry in-terest in clean forms of energy generation – specifically, perhaps, the rise in awareness of global warming, climate change, and the impact on the natural environment from the burning of fossil fuels.” – Wikipedia
Despite their ambiguity, the above definitions converge on a number of issues: First, Cleantech is not an industry in its own right. It is tech-nologies, products, services, processes, practices and investment class-es that promote the sustainable development and greening of incum-bent and emerging industries as well as societies. Second, through effi-ciency gains or entirely novel alternatives it reduces the unsustainable exploitation of natural and societal resources in industry, business and consumption. Third, it provides industries, businesses and consum-ers with superior value propositions when compared to conventional solutions.
So far so good. The definitions do not contradict each other and pro-vide three loose criteria that Cleantech should match to be recognized as such. Again, one might be inclined to think that, in the absence of more definite parameters, one would at least be able to spot a Cleantech company on sight. After all, we know that entire US Supreme Court cases have been decided based on the famous “I know it when I see it”-heuristic15. Before succumbing to the lures of false self-confidence, however, let us first review a few real-world examples.
Example 1: Renewable energy generation. The use of fossil fuels for energy production and transportation has been viewed as the number one driver of global warming and climate change. If using wind, so-lar, wave or hydro power helps to curtail the threats and costs of nat-ural disasters, food shortage, disease, environmental degradation, loss of property and social turmoil then the average person will agree that renewable power generation indeed meets the above criteria of Cleantech. And so agree the authors. Other equally unchallenging ex-amples can be found in the areas of waste water treatment, electric ve-hicles, recycling of materials and many others. This was somewhat triv-ial.

41 S
etting
Example 2: Resource sharing services. Here the problem becomes more complex already. Take a car sharing service provider such as Zip-car or car-pooling service companies the likes of kyyti.net. Sharing the right to use a vehicle or offering redundant seat space to travelers head-ed towards the same destination can very well be argued to fulfill the three criteria:
1 the activity is clearly not a traditional industry of its own, but a service that provides information for the coordination of the ef-ficient exploitation of existing, redundant assets and is built on top of existing industrial infrastructure such as telecom and IT networks, cars, etc.,
2 it generates both natural and societal resource efficiencies as it substitutes for new car manufacturing and related resource con-sumption up the value chain, decreases traffic congestions and pollution, and reduces overall fossil fuel consumption, and
3 it provides new value added to users in the form of (a) foregone insurance, parking and maintenance payments, (b) access to a car for low-income or low-use individuals who could not other-wise afford it, and (c) the convenience of on-demand transpor-tation without the burdens of ownership such as the daily search for parking, which has been argued to make up a forth of the total time spent in a car in metropoli-tan areas.
Apparently, calling car sharing services Cleantech seems not to be too far-fetched. But then again, transportation and its connection to Cleantech are still fairly easy to grasp for most of us; the links between their use and its detrimental impacts to the envi-ronment and (personal) economy are very direct.
What about more indirect links, then? Who, for instance, would say that Airbnb is a Cleantech company; a company that defies the hotel business by facilitating the temporary renting of private homes online? We could run the company through the three criteria and show with ease that both the environment and users gain from the use of the ser-vice. For example, according to Pure Energy Partners, a room booked via Airbnb boasts a 66% reduction in carbon emissions per night over a hotel room16. Many would still argue that “clean” is just a serendipitous by-product that the providers of the service have skillfully harnessed for marketing purposes. We let you decide.
Example 3: Data analytics services. Let us go even further and claim that Google is a Cleantech company. Before dismissing the notion as ri-
Calling car sharing services Cleantech seems not to be too far-fetched
42Fi
nanc
ial T
echn
olo
gy fo
r Ind
ustri
al R
enew
al diculous consider the following: In many Cleantech sectors, especial-ly those that are considered “smart” (e.g., Smart Grid, Smart Mobility, Smart Cities), the entire business model and technology is built on and around increasingly growing masses of user data. In Smart Grid, for in-stance, power utilities want to anticipate peaks in electricity consump-tion well in advance to avoid the very unprofitable use of emergency generation capacity. A growing installed base of smart meters in homes and industrial facilities enables utilities to tap into the power consump-tion patterns of their customers in real time. The hook is that utilities
are not very efficient at interpreting Big Data. Patterns are challenging to identify if you do not know how and what to look for.
Enter data analytics companies. Specialized analytics companies such as Enernoc can
provide utilities and other industries with pre-digested, customized da-ta analyses that turn dumb and messy masses of data into smart action points. Specialized companies are in no way the only ones hungry for a sizable chunk of these fairly virgin, fast growing analytics markets. Google is one of the most aggressive contestants in the field. So is Am-azon. If former search engines and online retail outlets are soon-to-be core players in Cleantech, where do you draw the line? Here comes the cleanweb opportunity: The emergence of new kinds of companies that take advantage of advancements in information technology.
The Finnish Cleantech industry – A de facto definition
The difficulties to provide an explicit definition for Cleantech are inher-ent in its own cross-industrial and cross-technological nature that tran-scends existing demarcations of traditional industries and technologies. In the case of dedicated pure-players, the task is easier but the more diverse and numerous a company’s portfolio of business lines is, the harder it is to identify it as a representative of the Cleantech space.
To add to the difficulty, dedicated and specialized Cleantech companies – designated “pure players” in the book – lean heavily on an entire eco-system of stakeholders that would not explicitly identify themselves as Cleantech organizations. Google, as a big data generalist, would proba-bly not admit to being a Cleantech company; nor would a sub-compo-nent producer for smart meters do so. And yet, they are indispensable players in the Cleantech ecosystem due to their central roles in the val-ue chains of pure players.
We concede that an airtight definition eliminating all room for inter-pretation is next to unattainable. Hence, we addressed the issue of defi-
In many Cleantech sectors, especially those that are considered “smart”, the entire business model and technology
is built on and around user data

43 S
etting
nition by reverting to a de facto approach: We merged lists of Finnish Cleantech companies compiled for internal development purposes and in use by central governmental and non-governmental economic de-velopment organizations such as Cleantech Finland, Confederation of Finnish Industries, Ministry for Employment and the Economy, the Finnish Funding Agency for Innovation, Centre for Environment and Energy, and Lahti Region Development. While not necessarily a high-ly academic solution, it is an empirical, practice-proven approxima-tion of the Finnish corporate Cleantech space as established by some of the most influential economic development organizations in the coun-try. In the remainder of the chapter, we refer to the list of companies and the pool of their respective data points collected from a number of public and private databases as ‘the data’.
Our final set of companies includes more than 750 Finnish Cleantech companies active in 21 different thematic industries. We are primarily interested in those companies that drive these industries in the areas of technology, business models and markets. Hence, the above number is exclusive of companies in support industries. The important support-ing role of infrastructure construction companies, technology- and busi-ness consultancies, financiers, generic component manufacturers, retailers and other stakeholders must be acknowledged from an ecosystem-wide perspective, but are excluded from further analyses in this report.
Industry classification – Manufacturing companies dominate Finnish Cleantech
By now you know that the Cleantech space intrinsically defies any sin-gle industrial or technological definition. One constructive approach to bring structure to the depiction of the space is to break it down by con-ventional industry classifications such as the European industrial activi-ty classification (NACE) used by European statistics authorities.
As Figure 2.1 reveals, the Finnish Cleantech space does not mirror the structure of the Finnish economy as a whole; it is a lot more manufac-turing-centric. According to the data, more than a third of all Cleantech companies in Finland operate in the manufacturing sector. The equivalent figure for the general econo-my is a mere seven percent. The importance of man-ufacturing in the Cleantech space is even more dra-matic when looking at the breakdown by turnover or number of employees. Over 60 percent of the turnover generated in the Cleantech sector is generated in manufacturing. Similarly, more than half of the jobs in the Cleantech space are offered by companies active in the manufacturing sector.
The Cleantech space intrinsically defies any single industrial or technological definition
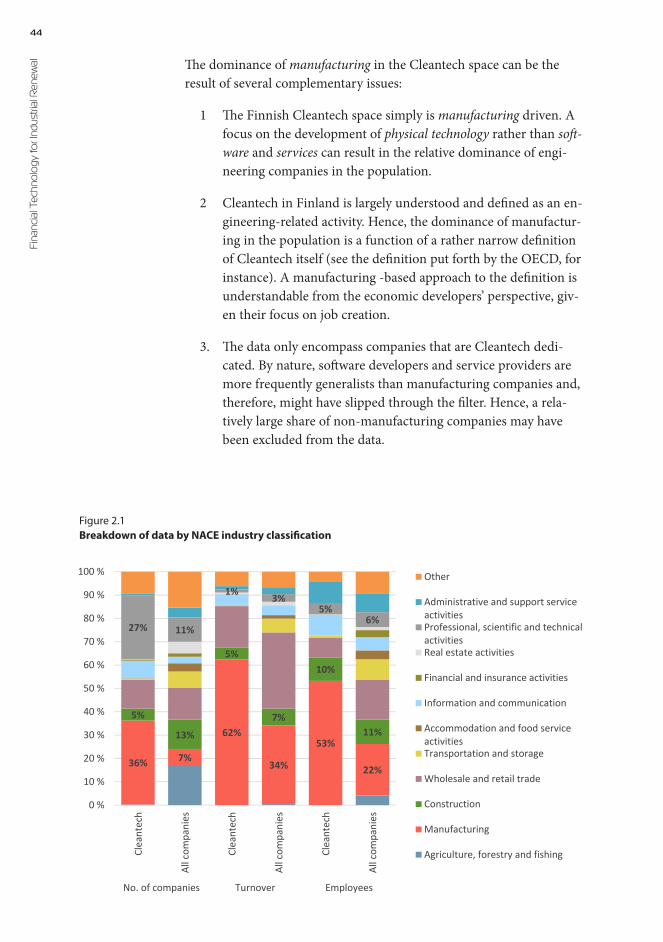
44Fi
nanc
ial T
echn
olo
gy fo
r Ind
ustri
al R
enew
al The dominance of manufacturing in the Cleantech space can be the result of several complementary issues:
1 The Finnish Cleantech space simply is manufacturing driven. A focus on the development of physical technology rather than soft-ware and services can result in the relative dominance of engi-neering companies in the population.
2 Cleantech in Finland is largely understood and defined as an en-gineering-related activity. Hence, the dominance of manufactur-ing in the population is a function of a rather narrow definition of Cleantech itself (see the definition put forth by the OECD, for instance). A manufacturing -based approach to the definition is understandable from the economic developers’ perspective, giv-en their focus on job creation.
3. The data only encompass companies that are Cleantech dedi-cated. By nature, software developers and service providers are more frequently generalists than manufacturing companies and, therefore, might have slipped through the filter. Hence, a rela-tively large share of non-manufacturing companies may have been excluded from the data.
36% 7%
62%
34%
53%
22%
5%
13%
5%
7%
10%
11%
27% 11%
1% 3%5%
6%
0 %
10 %
20 %
30 %
40 %
50 %
60 %
70 %
80 %
90 %
100 %
Clea
ntec
h
All c
ompa
nies
Clea
ntec
h
All c
ompa
nies
Clea
ntec
h
All c
ompa
nies
No. of companies Turnover Employees
Other
Administrative and support serviceactivitiesProfessional, scientific and technicalactivitiesReal estate activities
Financial and insurance activities
Information and communication
Accommodation and food serviceactivitiesTransportation and storage
Wholesale and retail trade
Construction
Manufacturing
Agriculture, forestry and fishing
Figure 2.1Breakdown of data by NACE industry classification
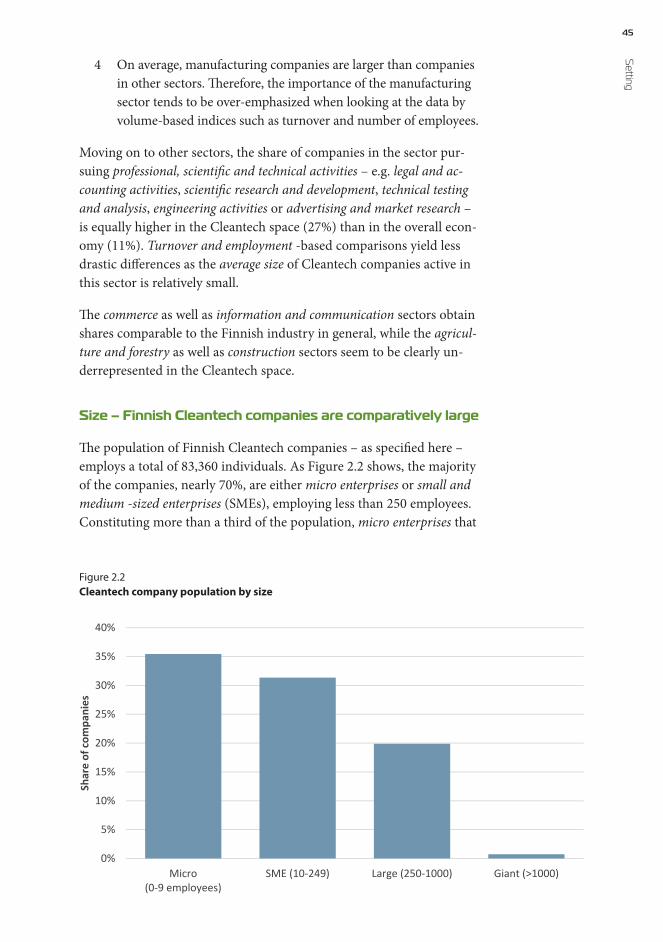
45 S
etting
4 On average, manufacturing companies are larger than companies in other sectors. Therefore, the importance of the manufacturing sector tends to be over-emphasized when looking at the data by volume-based indices such as turnover and number of employees.
Moving on to other sectors, the share of companies in the sector pur-suing professional, scientific and technical activities – e.g. legal and ac-counting activities, scientific research and development, technical testing and analysis, engineering activities or advertising and market research – is equally higher in the Cleantech space (27%) than in the overall econ-omy (11%). Turnover and employment -based comparisons yield less drastic differences as the average size of Cleantech companies active in this sector is relatively small.
The commerce as well as information and communication sectors obtain shares comparable to the Finnish industry in general, while the agricul-ture and forestry as well as construction sectors seem to be clearly un-derrepresented in the Cleantech space.
Size – Finnish Cleantech companies are comparatively large
The population of Finnish Cleantech companies – as specified here – employs a total of 83,360 individuals. As Figure 2.2 shows, the majority of the companies, nearly 70%, are either micro enterprises or small and medium -sized enterprises (SMEs), employing less than 250 employees. Constituting more than a third of the population, micro enterprises that
0%
5%
10%
15%
20%
25%
30%
35%
40%
Micro(0-9 employees)
SME (10-249) Large (250-1000) Giant (>1000)
Shar
e of
com
pani
es
Figure 2.2Cleantech company population by size

46Fi
nanc
ial T
echn
olo
gy fo
r Ind
ustri
al R
enew
al employ less than 10 individuals are particularly frequent. SMEs com-prise 30% of the companies, while large enterprises that employ more than 250 individuals make up another 20%. Companies designated gi-ants occupy a separate category. The reasoning behind this somewhat unconventional classification is a very practical one: a giant, employing more than 1000 individuals and generating annual revenue in excess of 1 billion euros, can significantly distort the descriptive statistics in a small population – especially when subsections of the data are to be ex-amined. For instance, out of the 13 000 patents held by the population of Cleantech companies, more than 9 700 are owned by Nokia. For this
reason, the giants were treated as a separate sample and excluded from the analyses and averages presented hereafter.
We identified six giants in the data, all of which operate in the manufacturing sector:
Wärtsilä Oyj, Neste Oil Oyj, Nokia Oyj, UPM-Kymmene Oyj, Stora En-so Oyj and non-listed ABB Oy. These six companies account for rough-ly 80% of the turnover of all Cleantech companies in the manufacturing sector and more than 65% of the entire Finnish Cleantech space.
Interestingly, the proportion of large and giant companies is notably larger in the Cleantech space than in the Finnish industry as a whole. In 2012, Finland’s total company population mainly consisted of micro- sized companies: more than 90% of the population were micro enter-prises, of which more than 60% employed only one person17. These one-person companies often operate in the services sector, such as edu-cation, personnel services, as well as beauty-, social- and healthcare ser-vices. Comparatively, the 35% of Cleantech companies that employed less than 10 individuals seems a rather small share.
Thematic sectors – Renewable energy, water treatment, and biofuels largest in Finland
Traditional industry classifications do not disclose information on a company’s activities in the Cleantech space, as they are agnostic to most technology-based paradigms such as biotechnology, nanotechnol-ogy or clean technology. To make things even more difficult, Cleantech today permeates through most of the conventional industry sectors, a phenomenon which renders the respective conventional classifications an even poorer indicator.
To exemplify, ask yourself how, for instance, telecommunications pro-viders or local power utilities play the Cleantech-game? Their conven-tional industry classifications – telecommunications and electricity sup-ply, respectively – do not give away much, if anything, on their specific
The six largest companies account for more than 65% of the toal revenue of
the Finnish Cleantech space

47 S
etting
Cleantech activities. A telco operator might play an important role in a regional Smart Grid network or provide the telecommunications infra-structure for a city’s e-mobility platform. Similarly, a power utility might focus on renewable energy sources or apply cutting-edge demand-re-sponse technology in its generation control to stay ahead in the race to-wards sustainability.
To shed light behind the veil of conventional industry classifications, the Cleantech companies were manually examined and classified into thematic Cleantech sectors, such as wastewater treatment, advanced ma-terials, biofuels, recycling systems and solar power generation. The classi-fication yielded 34 different Cleantech sectors or sub-domains.
The results presented in Figure 2.3 show that the sectors water and waste-water treatment (11%), biofuels and bio-chemicals (10%), energy efficiency (9%), as well as recycling and waste treatment (9%) are the most abundant in Finland.18 It is important to highlight that renewable energy generation – combining solar, wind, biomass, hydro and geothermal power genera-tion – would account for 12% of the Cleantech companies and therefore represent the largest single Cleantech sector. To avoid compromising the level of detail, however, we keep the sectors separate. The sector Other Cleantech includes sectors such as mining, hydro and marine power, fuel cells and hydrogen, metals, electronics and environmental services.
Figure 2.3Distribution of companies by Cleantech sectors
5%1%1%
2%2%2%2%2%2%2%
3%5%
5%6%
6%7%
7%9%9%
10%11%
0% 2% 4% 6% 8% 10% 12%
other cleantechconstruction
softwareconventional fuels
geothermalmachinery
instrumentsenergy storage
solaradvanced materialsbiomass generation
airwind
transportationbusiness consulting
smart gridengineering services
recycling & wasteenergy efficiency
biofuels & biochemicalswater & wastewater

48Fi
nanc
ial T
echn
olo
gy fo
r Ind
ustri
al R
enew
al Value added – Smart Grid, biofuels and energy efficiency sectors contribute most to the economy
To gauge the real impact that industrial activities have on a country’s economy one has to look beyond mere company frequencies. The fore-most indicator economists pay attention to is the value added. “The value added measures the total value added produced by the various factors of production in an establishment’s [here the companies’] ac-tual operating activities.”19 In more operational terms, the value added is calculated as the sum of labor costs, depreciation and amortization, rents, and profits. Alternatively, one can subtract the cost of all factors of production that have been produced outside the company – i.e. procure-ments – from a company’s revenue.
The value added can be calculated for entire sectors by adding togeth-er the value added of companies that comprise it. The value added is an important measure for the purposes of economic development because, by definition, it quantifies the net volume of local, regional, or national production. Typically, the value added positively correlates with employ-ment, one of the key metrics keenly monitored by economic developers.
Figure 2.4 reveals that, in absolute volumes, the Smart Grid (€431M), biofuels and biochemicals (€396M) as well as energy efficiency (€380M) -sectors generate the most value added. The eight sectors depict-ed in the figure produce nearly 75% of the value added of the whole Cleantech space captured by the data. The giants, as defined earlier,
- €50 000 000 €100 000 000 €150 000 000 €200 000 000 €250 000 000 €300 000 000 €350 000 000 €400 000 000 €450 000 000 €500 000 000 €
- €20 000 €40 000 €60 000 €80 000 €
100 000 €120 000 €140 000 €160 000 €180 000 €200 000 €
Sum
of v
alue
add
ed in
the
sect
or
Valu
e ad
ded
per e
mpl
oyee
Sum of value added of the sector Value added per person
Figure 2.4Value added by Cleantech sector
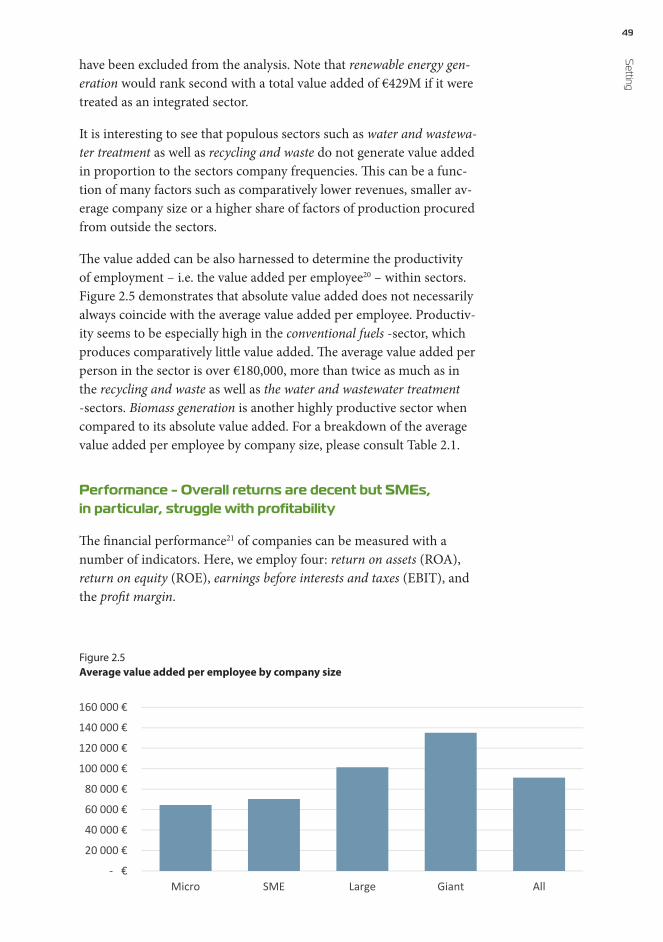
49 S
etting
have been excluded from the analysis. Note that renewable energy gen-eration would rank second with a total value added of €429M if it were treated as an integrated sector.
It is interesting to see that populous sectors such as water and wastewa-ter treatment as well as recycling and waste do not generate value added in proportion to the sectors company frequencies. This can be a func-tion of many factors such as comparatively lower revenues, smaller av-erage company size or a higher share of factors of production procured from outside the sectors.
The value added can be also harnessed to determine the productivity of employment – i.e. the value added per employee20 – within sectors. Figure 2.5 demonstrates that absolute value added does not necessarily always coincide with the average value added per employee. Productiv-ity seems to be especially high in the conventional fuels -sector, which produces comparatively little value added. The average value added per person in the sector is over €180,000, more than twice as much as in the recycling and waste as well as the water and wastewater treatment -sectors. Biomass generation is another highly productive sector when compared to its absolute value added. For a breakdown of the average value added per employee by company size, please consult Table 2.1.
Performance - Overall returns are decent but SMEs, in particular, struggle with profitability
The financial performance21 of companies can be measured with a number of indicators. Here, we employ four: return on assets (ROA), return on equity (ROE), earnings before interests and taxes (EBIT), and the profit margin.
- €
20 000 €
40 000 €
60 000 €
80 000 €
100 000 €
120 000 €
140 000 €
160 000 €
Micro SME Large Giant All
Figure 2.5Average value added per employee by company size

50Fi
nanc
ial T
echn
olo
gy fo
r Ind
ustri
al R
enew
al Breaking down the data by company size, Table 2.1 clearly shows that, on average, small companies in particular struggle with profitability. While the strongly negative results for micro-sized businesses can still be argued to reflect expected patterns for businesses in the pre-revenue phase22, the figures for SMEs are somewhat alarming.
Given that SMEs in general are considered the backbone of econom-ic stability as well as the engine for economic renewal and job creation23, the long-term financial health of SMEs is essential for the buildup of a viable and thriving Cleantech ecosystem in Finland. While investors, in
theory, still have been able to appropriate decent av-erage returns (12% ROE), the financial sustainabili-ty of SMEs in the Cleantech space needs attendance. An average operating margin of -7% is a clear signal
of financial distress unless it is not the random result of normal tempo-ral variation that can occur in cross-sectional, single-year (2012) data such as those used in this report.
The fact that the indicator has been constructed as a weighted aver-age value of all SMEs in the sample, however, clearly argues against this possible explanation. Averages are much less prone to suffer from variation-related effects as the aggregate results tend to converge to-wards the mean. Also, when benchmarked against the excluded cohort of companies in supporting industries, Cleantech-intensive companies indeed fare far worse; another argument in support of the robustness of the overall finding. On a more optimistic note, large companies fare much better which, on the other hand, is quite intuitive given the uni-versal survivor bias that grows with the average age of businesses in sta-tistical datasets: only profitable companies survive in the long-term.
While profitability is seemingly low, the story is not necessarily as gloomy from an investor’s point of view. According to Statistics Fin-land, the average Return on Assets (ROA) percentage of the entire Finn-ish industry in 2012 was 5.4%; for SMEs the figure was 4.4%. The cor-
Table 2.1Financial performance by company size, %
Micro SME Large Giant All Cleantech
Operating margin -42 -7 4 2 0
Profit margin -46 -10 5 6 1
ROI 0 12 16 16 14
ROA 1 7 9 9 8
Asset turnover ratio 2 2 2 1 2
On a more optimistic note, large companies fare much better
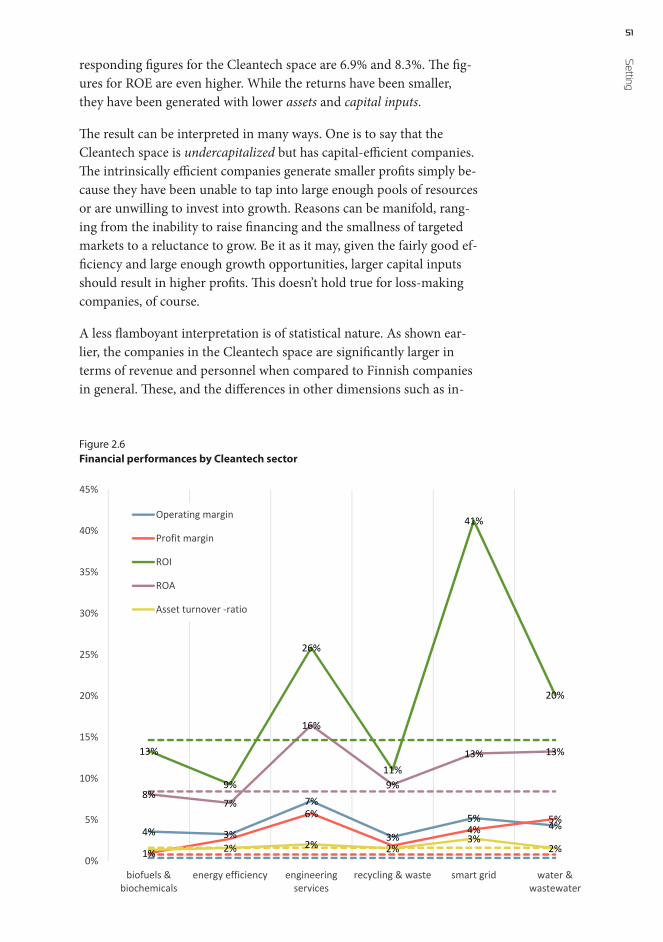
51 S
etting
responding figures for the Cleantech space are 6.9% and 8.3%. The fig-ures for ROE are even higher. While the returns have been smaller, they have been generated with lower assets and capital inputs.
The result can be interpreted in many ways. One is to say that the Cleantech space is undercapitalized but has capital-efficient companies. The intrinsically efficient companies generate smaller profits simply be-cause they have been unable to tap into large enough pools of resources or are unwilling to invest into growth. Reasons can be manifold, rang-ing from the inability to raise financing and the smallness of targeted markets to a reluctance to grow. Be it as it may, given the fairly good ef-ficiency and large enough growth opportunities, larger capital inputs should result in higher profits. This doesn’t hold true for loss-making companies, of course.
A less flamboyant interpretation is of statistical nature. As shown ear-lier, the companies in the Cleantech space are significantly larger in terms of revenue and personnel when compared to Finnish companies in general. These, and the differences in other dimensions such as in-
4% 3%
7%
3%
5%4%
1%
6%4%
5%
13%
9%
26%
11%
41%
20%
8%7%
16%
9%
13% 13%
2% 2% 2%3%
2%0%
5%
10%
15%
20%
25%
30%
35%
40%
45%
biofuels &biochemicals
energy efficiency engineeringservices
recycling & waste smart grid water &wastewater
Operating margin
Profit margin
ROI
ROA
Asset turnover -ratio
Figure 2.6Financial performances by Cleantech sector

52Fi
nanc
ial T
echn
olo
gy fo
r Ind
ustri
al R
enew
al dustry distribution, might play a significant role in the statistical differ-ences in the observed profitability indicators. In order to pin down the causalities behind the differences more profound statistical analysis is needed.
To complement the discussion, we can also look at the financial perfor-mance of Cleantech companies by sector. Figure 2.6 shows the results for the six largest sectors as measured by value added. A closer look re-veals that the companies in these sectors financially outperform the rest of the Cleantech population on average24 (population averages shown in dashed lines). With a six and five percent profit margin, respective-ly, the engineering services and water and wastewater -sectors gener-ate the highest profits. Both are still below the average general industry
benchmark of seven percent. The Smart Grid and energy efficiency -sectors trail in third and fourth places with four and three percent mar-gins, respectively. The lowest profit margins are
found in the agriculture and forestry (-151%), hydro and marine power (-88%), solar power (-47%) and nuclear power (-34%) -sectors that are not reported in the table. Note that some of the latter sectors have very low company frequencies such as agriculture and forestry (6 companies) and hydro and marine power (6 companies).
The investment-related performance indicators show a lot more po-tential. Some of the Cleantech sectors clearly outperform the general Finnish industry, which on average returns 14 percent on investments. Smart Grid (41% ROI), engineering services (26% ROI and 16% ROA) and water and wastewater treatment (20% ROI) are the most nota-ble examples. Again, the agriculture and forestry (-35%) as well as solar power (-12%) are the poorest performing sectors.
Intellectual property rights – Do patents uncover a deficiency in consumer-oriented solutions?
Intellectual property rights are used for a plethora of purposes in re-search. Ranging from a measure of innovativeness to a tangible sup-port in tracking technological evolution, patent data in particular are a widely used resource to probe the inherently fuzzy and ambiguous di-mension of innovation.
Patent data surely have their flaws. Patents are only one form of intel-lectual property protection, and many times companies revert to other methods such as secrecy or lead-time. Hence, patents are in no way an exhaustive, all-encompassing measure. Patenting practices also differ from industrial sector to the other, making comparisons challenging.
The investment-related performance indicators show a lot more potential
53 S
etting
Here, patents are used to describe the technological space of Finnish Cleantech. What specific technological fields does Finnish Cleantech comprise of?
As a word of caution, we need to point out that especially software, data and service-based businesses are strongly underrepresented in the fol-lowing analyses for the sheer fact that they are not patentable in the Eu-ropean context; another flaw of patent data as a statis-tical proxy for innovation and technology.
That being said, 192 out of the 760 Cleantech compa-nies in the data – one quarter of the population – hold at least one patent. For an allegedly technology-driv-en industry it is not an exceptionally high share. It seems that many of the businesses in the Cleantech space are not necessarily built around proprietary technology. In total, the companies hold roughly 13 000 patents, of which more than 9700 are owned by Nokia. The majori-ty of other patent holders in the data hold only a few patents: less than 20% boast more than 10. In the following analyses the giants, including Nokia, are excluded.
To help in a structured analysis, the patents are categorized according to a patent classification. The classification used in this report is de-veloped by Mancusi25 and encompasses six broad technological fields: electronics, instruments, chemicals and pharmaceuticals, processes, ma-chinery as well as consumer goods and civil engineering technologies. These six categories are further divided into 30 technologies.
As Figure 2.7 reveals, the majority of the patents26 re-side in the categories mechanical, process, or electrical engineering. To no surprise, actively patenting companies operate most frequently in the manufacturing industry: out of the 174 companies that have at least one patent, more than 100 are in the manufacturing industry.
Consumer-oriented technologies are clearly underrepresented; a result, which gives rise to a very interesting discussion on the dangers of Finn-ish Cleantech companies missing out on the massive growth opportu-nities that consumer markets currently offer. Let us elaborate:
Three sectors, in particular, put major strain on the sustainability of consumption of planetary resources today: Transportation, food and feeds, and housing. In all three sectors it is consumers that drive the overall consumption. Hence, many companies around the globe that could be branded Cleantech are developing solutions geared towards motivating consumers to adopt more resource-efficient practices (Uber,
It seems that many of the businesses in the Cleantech space are not necessarily built around proprietary technology
Actively patenting companies operate most frequently in the manufacturing industry
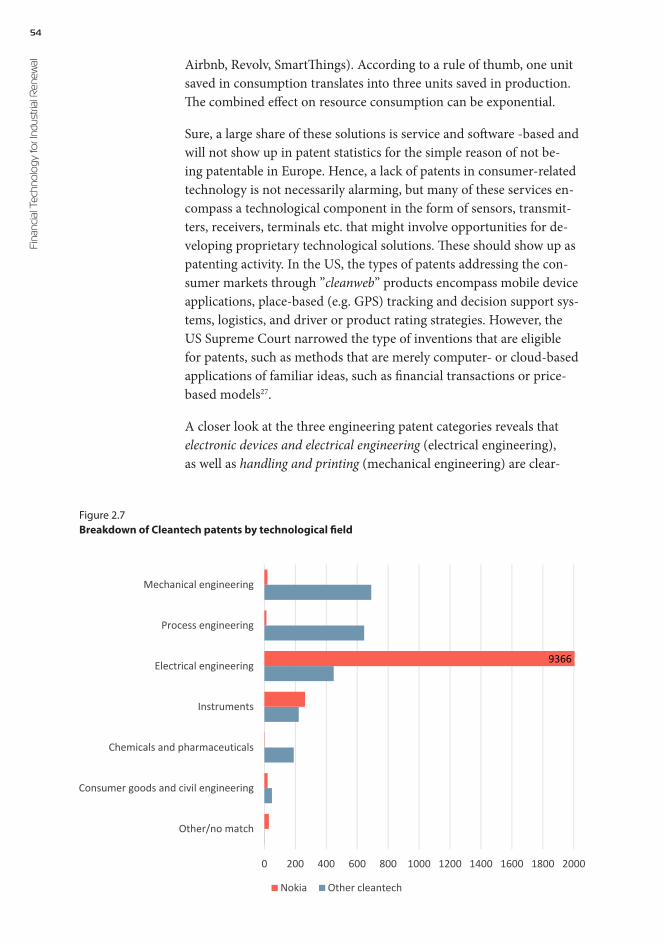
54Fi
nanc
ial T
echn
olo
gy fo
r Ind
ustri
al R
enew
al Airbnb, Revolv, SmartThings). According to a rule of thumb, one unit saved in consumption translates into three units saved in production. The combined effect on resource consumption can be exponential.
Sure, a large share of these solutions is service and software -based and will not show up in patent statistics for the simple reason of not be-ing patentable in Europe. Hence, a lack of patents in consumer-related technology is not necessarily alarming, but many of these services en-compass a technological component in the form of sensors, transmit-ters, receivers, terminals etc. that might involve opportunities for de-veloping proprietary technological solutions. These should show up as patenting activity. In the US, the types of patents addressing the con-sumer markets through ”cleanweb” products encompass mobile device applications, place-based (e.g. GPS) tracking and decision support sys-tems, logistics, and driver or product rating strategies. However, the US Supreme Court narrowed the type of inventions that are eligible for patents, such as methods that are merely computer- or cloud-based applications of familiar ideas, such as financial transactions or price-based models27.
A closer look at the three engineering patent categories reveals that electronic devices and electrical engineering (electrical engineering), as well as handling and printing (mechanical engineering) are clear-
9366
0 200 400 600 800 1000 1200 1400 1600 1800 2000
Other/no match
Consumer goods and civil engineering
Chemicals and pharmaceuticals
Instruments
Electrical engineering
Process engineering
Mechanical engineering
Nokia Other cleantech
Figure 2.7Breakdown of Cleantech patents by technological field
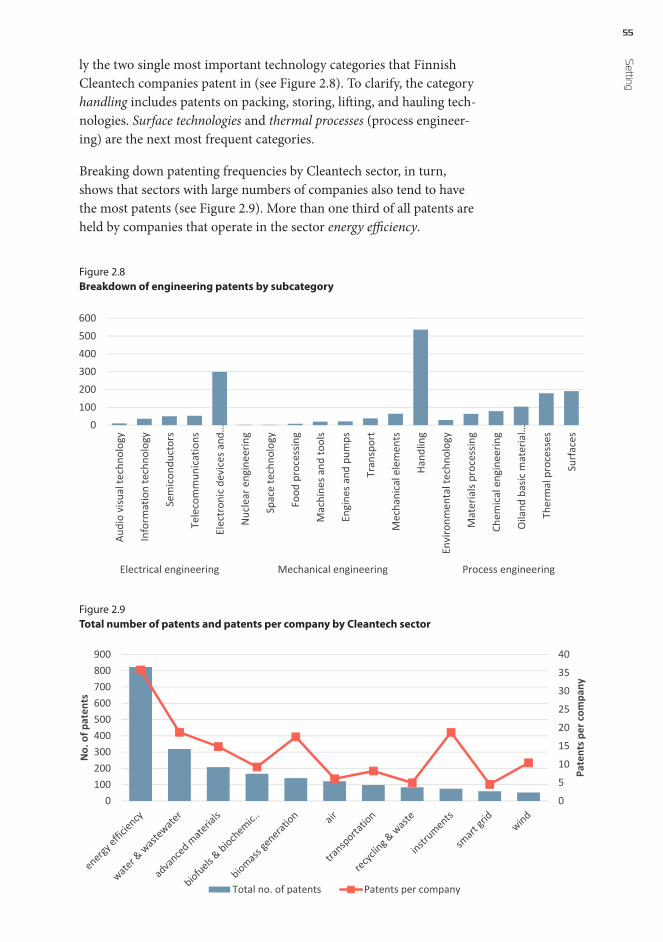
55 S
etting
ly the two single most important technology categories that Finnish Cleantech companies patent in (see Figure 2.8). To clarify, the category handling includes patents on packing, storing, lifting, and hauling tech-nologies. Surface technologies and thermal processes (process engineer-ing) are the next most frequent categories.
Breaking down patenting frequencies by Cleantech sector, in turn, shows that sectors with large numbers of companies also tend to have the most patents (see Figure 2.9). More than one third of all patents are held by companies that operate in the sector energy efficiency.
0100200300400500600
Audi
o vi
sual
tech
nolo
gy
Info
rmat
ion
tech
nolo
gy
Sem
icon
duct
ors
Tele
com
mun
icat
ions
Elec
tron
ic d
evic
es a
nd…
Nuc
lear
eng
inee
ring
Spac
e te
chno
logy
Food
pro
cess
ing
Mac
hine
s and
tool
s
Engi
nes a
nd p
umps
Tran
spor
t
Mec
hani
cal e
lem
ents
Hand
ling
Envi
ronm
enta
l tec
hnol
ogy
Mat
eria
ls pr
oces
sing
Chem
ical
eng
inee
ring
Oila
nd b
asic
mat
eria
l…
Ther
mal
pro
cess
es
Surf
aces
Electrical engineering Mechanical engineering Process engineering
Figure 2.8Breakdown of engineering patents by subcategory
0
5
10
15
20
25
30
35
40
0100200300400500600700800900
Pate
nts p
er c
ompa
ny
No.
of p
aten
ts
Total no. of patents Patents per company
Figure 2.9Total number of patents and patents per company by Cleantech sector
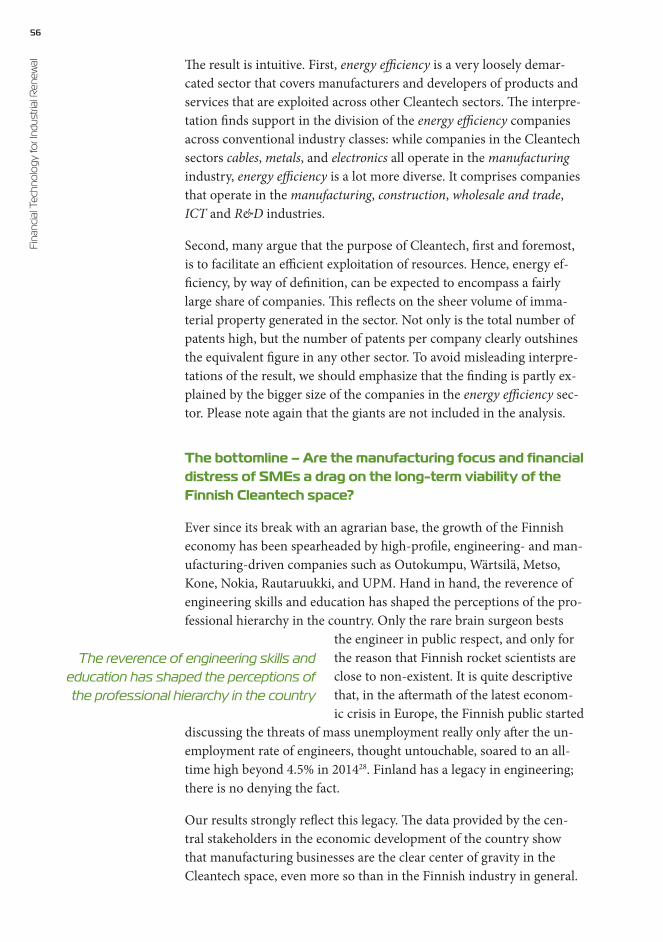
56Fi
nanc
ial T
echn
olo
gy fo
r Ind
ustri
al R
enew
al The result is intuitive. First, energy efficiency is a very loosely demar-cated sector that covers manufacturers and developers of products and services that are exploited across other Cleantech sectors. The interpre-tation finds support in the division of the energy efficiency companies across conventional industry classes: while companies in the Cleantech sectors cables, metals, and electronics all operate in the manufacturing industry, energy efficiency is a lot more diverse. It comprises companies that operate in the manufacturing, construction, wholesale and trade, ICT and R&D industries.
Second, many argue that the purpose of Cleantech, first and foremost, is to facilitate an efficient exploitation of resources. Hence, energy ef-ficiency, by way of definition, can be expected to encompass a fairly large share of companies. This reflects on the sheer volume of imma-terial property generated in the sector. Not only is the total number of patents high, but the number of patents per company clearly outshines the equivalent figure in any other sector. To avoid misleading interpre-tations of the result, we should emphasize that the finding is partly ex-plained by the bigger size of the companies in the energy efficiency sec-tor. Please note again that the giants are not included in the analysis.
The bottomline – Are the manufacturing focus and financial distress of SMEs a drag on the long-term viability of the Finnish Cleantech space?
Ever since its break with an agrarian base, the growth of the Finnish economy has been spearheaded by high-profile, engineering- and man-ufacturing-driven companies such as Outokumpu, Wärtsilä, Metso, Kone, Nokia, Rautaruukki, and UPM. Hand in hand, the reverence of engineering skills and education has shaped the perceptions of the pro-fessional hierarchy in the country. Only the rare brain surgeon bests
the engineer in public respect, and only for the reason that Finnish rocket scientists are close to non-existent. It is quite descriptive that, in the aftermath of the latest econom-ic crisis in Europe, the Finnish public started
discussing the threats of mass unemployment really only after the un-employment rate of engineers, thought untouchable, soared to an all-time high beyond 4.5% in 201428. Finland has a legacy in engineering; there is no denying the fact.
Our results strongly reflect this legacy. The data provided by the cen-tral stakeholders in the economic development of the country show that manufacturing businesses are the clear center of gravity in the Cleantech space, even more so than in the Finnish industry in general.
The reverence of engineering skills and education has shaped the perceptions of the professional hierarchy in the country

57 S
etting
It is fairly irrelevant whether this is because of a perspective econom-ic developers in Finland have adopted or because the majority of Finn-ish Cleantech companies are engineering-driven. What matters is that, in the gold rush era of digitalization, a heavily manufacturing- and en-gineering focused company base can quickly become the ball and chain to the mid-to-long-term growth of the industry.
Let us exemplify. Ford Motor Company, one of the world’s best known car manufactur-ers, is looking ahead: In the light of recent developments in digitaliza-tion, big and open data, and the diminishing interest in owning vehi-cles amongst the younger generations, the company has estimated that in ten years 80 percent of the value of the car will reside outside the car. The vehicle is expected to turn into a commoditized sensor platform, vacuuming data on the vehicle’s environment and the behavior of its passengers, only to be fed to third parties for business development. While the car is turning into a moving hardware platform for the mo-bile office, entertainment center and shopping mall, it is the data ana-lytics businesses, online retail brands, insurance companies and other service providers who will reap the profits generated by business mod-els built on top of the commoditized, low-margin car as a hardware platform. Hence, Ford is asking itself the strategic question wheth-er it should actually move up the vertical and horizontal value chains to position itself as a technology company, as its CEO recently did at the Consumer Electronics Show in Las Vegas. Hanging on to the lega-cy seems to come with the risk of being pushed to the proverbial periphery of the new, emerging e-mobility ecosystem29.
Similar stories could be told about the emerg-ing Smart Grid ecosystem, where telcos and data analytics companies currently fight for dominance of the demand-re-sponse space, an area in which power utilities should reign superior.
That being said, where are all the service businesses in the Finnish Cleantech space? Where are the Finnish equivalents to Lyft, EnerNOC, Stem, Uber, Airbnb, etc.? Not on the lists of Finnish economic develop-ers, it seems. And we cannot blame them. Even for a scholar of indus-trial renewal, these businesses are extremely hard to find. Many of the companies are still in the startup phase. Peloton Club, an accelerator focusing on consumer Cleantech solutions for Finnish efficiency com-panies and run by DEMOS Helsinki, caters to the needs of young com-panies that develop new consumer solutions for more sustainable ener-gy usage: Peer-to-peer courier service provider PiggyBaggy; Fourdeg, an intelligent thermostat company; Weegos, a service that turns city-
In the gold rush era of digitalization, a heavily manufacturing- and engineering focused industry can quickly become the ball and chain to economic growth
Hanging on to the legacy seems to come with the risk of being pushed to the proverbial periphery of new, emerging ecosystems

58Fi
nanc
ial T
echn
olo
gy fo
r Ind
ustri
al R
enew
al owned vehicles into a car fleet in joint use; Sharetribe, a sharing-econ-omy platform enabling peer-to-peer exchanges; Moralguard, an appli-cation to help consumers shop according to their values; and Re-Pack, a packaging system for online retailers and shoppers whereby delivery packages can be returned. These companies are heralds of growing ser-vice-based activity in the Finnish Cleantech space, which clearly needs urgent redefinition to accommodate more businesses outside the engi-neering domain.
These companies have earned the honorary title of pioneer for yet an-other reason: their offering is mainly geared towards consumer mar-kets. As demonstrated earlier, preliminary evidence shows a deficiency
in Finnish innovations in the consumer do-main – a finding that is in support of a dis-proportionately engineering-driven take on Cleantech in the country. Consumer mar-kets should not be neglected in the develop-ment of Finnish Cleantech. Among the four
fastest growing businesses30 in the world, three consumer brands have wedged themselves a position: Apple, Google and Microsoft. With the proliferation and mass adoption of smart consumer technologies as well as global trends such as the quantified self -movement, open data, smart city and the rise of the internet of things, we have barely witnessed the kindling of the potential wildfire that will sweep over our way of living and hopefully will see to wide-reaching improvements to overall eco-nomic, social and ecological sustainability in the very near future.
To ride the Cleantech wave as a global forerunner necessitates catch-ing and harnessing the riptide of change in the consumer domain. In a best possible scenario, it will be an integral part of a Finnish Cleantech
ecosystem that complements the already existing skeleton of manufacturing- and engineering-driv-en company base. What the sector needs now is open-mindedness on part of economic developers for a broader view of Cleantech, adventurous cour-age on part of the existing industry and the govern-
ment for opening its current technology platforms as well as databas-es for new service-based business models, and more growth-oriented businesses which pioneer consumer markets with service-based smart solutions.
To do so means that the industry needs to learn to closely test proto-types with their customers throughout the entire product or service de-velopment process in continuous and iterative validation cycles. Noth-ing drives concept development forward more effectively than time spent with actual customers. The best founders, CEOs and senior man-
With the proliferation of smart consumer technologies we have barely witnessed the kindling of the potential wildfire that
will sweep over our way of living
To ride the Cleantech wave as a global forerunner necessitates
catching and harnessing the riptide of change in the consumer domain
59 S
etting
agers spend significant amounts of time with the clients. It is not an ac-tivity they delegate. Most importantly, however, what is dearly needed, is the creation of new types of cross-industry partnerships that form a solid base for green innovation ecosystems. The state, municipalities and companies, big and small, with a wide range of backgrounds from manufacturing to digital services, need to learn ways and practices to collaborate. This is an absolute prerequisite for the industry’s mid‐ and long‐term devel-opment.
That being said, a more hands-on and ur-gent challenge that needs to be tended to immediately is the poor financial viability of small and medium sized businesses in the Cleantech space. Our results are merely descriptive and do not provide information on the reasons behind the lackluster performance of the most crucial drivers of industrial renewal. Is the problem traceable to the current European-wide economic downturn, perhaps? Are investors overly cautious because of it? Or are Cleantech SMEs in Finland either too young to or still in the process of defining their business models to become profitable? We cannot tell. One thing is certain: a Cleantech ecosystem is unfathomable without a healthy base of SMEs which, many times, are the only trailblazing force across incumbent, locked-in industry structures.
A path forward – Redefining the Finnish Cleantech opportunity in the age of digitalization
Since 2003, when the term Cleantech first came in vogue, it was defined along industrial verticals that relate to physical infrastructure systems and legacy industries, such as energy utilities (e.g. wind power, solar power), water utilities (e.g. water treatment, membranes), and special-ty electronics companies (e.g. solar lighting, LED). The make-and-sell business model, the stalwart of the tradition-al Cleantech economy is slowly being eroded by service models with recurring revenue streams and low capital intensity.
To exemplify, consider how Bloom Energy, a company that makes utility-scale fuel cell energy storage systems, re-placed its revenue and business model from sales transactions, to lease and power purchase agreements, which allowed it to scale its turnover and profit margins. Compare First Energy, a solar panel manufactur-er, and Solar City, a solar energy provider through brokerage and long-term power purchase agreements. In terms of all financial metrics, So-lar City comes out on top: capital efficiency, revenue growth, margins.
A Cleantech ecosystem is unfathomable without a healthy base of SMEs, the only trailblazing force across incumbent, locked-in industry structures
The make-and-sell business model, the stalwart of the traditional Clean-Tech economy is slowly being eroded by service models

60Fi
nanc
ial T
echn
olo
gy fo
r Ind
ustri
al R
enew
al CleanTech 2.0 has been defined by business models that have been built on top of legacy infrastructure, and has given rise to the cleanweb. The cleanweb reflects the convergence of several technology megatrends, in-cluding: The explosive growth of data from sensors and networked de-vices; Increasing connectivity and automation among devices; the falling price of computing power and rise of “big data” analytical capabilities; the growth of smartphone ownership; the emergence of new consumer behavior on social networks and other platforms.
Cleanweb is to be understood very broadly. It is a paradigm shift, not a buzzword referring to the development of nifty smart apps only. Clean-web companies sit at the nexus of traditionally disparate industries and functions, and have resulted in the collapse and cross-integration of value chains. They by-pass traditional market channels and no longer depend on governments for subsidies or tax breaks. If anything, gov-ernment and patenting policies are playing a catch up game in terms of regulation and customer privacy protection. Their business models are
wide and varied, and tend to be tailored to the end-customer, which allow for speed to market and scale.
Cleanweb is driving different consum-er behaviors. It’s making people think
differently about how they interact with devices and legacy industries that are 100 or 150 years old. In the process, they drive adoption of Cleantech products. The consumer drives the adoption of the technolo-gy through a service model.
As stated earlier, Finland has service businesses, but they are all start-ups and not much on the radar of economic developers. The economic driver needs to come from the established Cleantech companies – they clearly have a financial pain point as amply shown in this report. The redefinition that needs to happen is the transition from make-and-sell to digitalized service business models – shifting the cost structure of do-ing business. ICT and network-based technologies are at the core of the transition from Cleantech to cleanweb.
A decade after Cleantech was launched as an innovation space, the con-vergence between ICT and Cleantech holds the key to scale and profit-ability. Given the pre-eminence of Finnish companies in this area, and a rich industry value system in this space, there is clearly an opportuni-ty to be tapped and assets to be leveraged. Fortunately, the sentiment in the Finnish Cleantech space itself is upbeat. In fact, a lot more upbeat than in other sectors of the Finnish economy, as a survey administered to Finnish SMEs in early 2015 reveals31. Motivation and optimism car-ries a long way.
Cleanweb is changing consumer behavior, making people think differently about how
they interact with devices and legacy industries that are 100 years old

61 S
ettingReferences1 WWF & Cleantech Group (2014). Global Cleantech Innovation Index 2014 –
Nurturing Tomorrow’s Transformative Entrepreneurs. Download at: info.cleantech.com/CleantechIndex2014.html
2 The Economist (2008).Clean Technology in the Downturn – Gathering Clouds. NOV6, 2008. Read online at www.economist.com/node/12562281
3 van Lierop, W. (2014). Is cleantech the key to industrial structural change? Presentation at Cleantech Venture Day, Lahti, Finland, OCT28, 2014.
4 Bloomberg New Energy Finance.5 WEF (2014). Global risks 2014. Ninth edition. www3.weforum.org/docs/WEF_
GlobalRisks_Report_2014.pdf. (Last access JUN3, 2016)6 PriceWaterhouseCoopers (2014). Global Top 100 Companies by market capitalization.
31 March 2014 update. IPO Centre, UK.7 KPMG (2014). What are the global megatrends. www.kpmg.com/global/en/
issuesandinsights/articlespublications/future-state-government/pages/what-are-the-global-megatrends. aspx. (Last access NOV 7, 2014). PWC (2014).
8 DARA Group and Climate Vulnerability Monitor (2010). A Guide to the Cold Calculus of a Hot Planet. www.daraint.org.
9 New York Times (2013). Large Companies Prepared to Pay Price on Carbon. www.nytimes.com/2013/12/05/business/energy-environment/large-companies-prepared-to-pay-price-on-carbon.html. (Last access JUN3, 2016).
10 GSI (2010). Delivering on G-20 commitments: The path to fossil-fuel subsidy reform. Policy Brief. IISD, Canada.
11 TEM (2014). Strategic Programme for the Cleantech Business. www.tem.fi/en/current_issues/pending_projects/project_and_programme_archive/strategic_programme_for_the_cleantech_business (Last access JUN3, 2016)
12 Carbon Tracker Initiative (2013). Unburnable Carbon – Are the world’s financial markets carrying a carbon bubble? www.carbontracker.org/report/carbon-bubble/. (Last access JUN3, 2016).
13 The Atlantic (2013). The Carbon Time Bomb in Your Retirement Account – A new financial tool lets Wall Street calculate the climate-change risk of investments. m.theatlantic.com/technology/archive/2013/12/the-carbon-time-bomb-in-your-retirement-account/282139/ . (Last access JUN3, 2016)
14 UN (1997). Glossary of Environment Statistics, Studies in Methods, Series F, No. 67, United Nations, New York, 1997.
15 Gewirtz, P. (1996). On ‘I Know It When I See It’. Yale Law Journal, Vol. 105, pp. 1023–1047.
16 Bunting, J. (2014). The Rise of Cleanweb and the Opportunity for Corporates, Cleanweb White Paper, CleanTech Group, San Francisco, CA.
62Fi
nanc
ial T
echn
olo
gy fo
r Ind
ustri
al R
enew
al 17 Source: Statistics Finland.18 The classification is based on the authors’ views and is therefore subjective. In the case
that a company operates in more than one cleantech sector, the most focal sector was chosen.
19 Source: Statistics Finland.20 As already noted earlier, the productivity index for the different sectors used here is
weighted by the companies’ number of employees.21 The outliers have been treated by using a winsoring method; 2,5% of the extreme
values are set to the value of the 97,5th percentile. The averages are weighted using the number of personnel.
22 In the data, there is significant positive correlation (95% significance level) between company age and size.
23 66,5% of European jobs were provided by SMEs in 2012 (European Commission, 2013).
24 Outliers have been subjected to 90% Winsorization: indicator values below the 5th percentile have been set to the 5th percentile, and values above the 95th percentile have been set to the 95th percentile. In addition, the averages are weighted using the number of personnel. Giants are excluded from the analysis.
25 Mancusi, M. L. (2003). Geographical Concentration and the Dynamics of Countries’ specialization in technologies. Economics of Innovation & New Technology, Vol. 12, No. 3, pp. 269–291.
26 The patents of the ”giants” are excluded from the analysis.27 http://www.supremecourt.gov/opinions/13pdf/13-298_7lh8.pdf; Alice Corporation
PTY. LTD. v. CLS Bank International et al.; October 2013.28 TEK (2015). http://www.tek.fi/tutkimus/tyollisyystilastot (last accessed on JAN 19,
2015).29 Crothers, B. (2015). “Apple Car Is Sign Of Mapping Push By Tech Companies.” FEB
2015, Forbes Magazine. 30 PriceWaterhouseCoopers (2014). Global Top 100 Companies by market capitalization.
31 March 2014 update. IPO Centre, UK.31 31 The Federation of Finnish Enterprises (2015). SME-Barometer, Sector -report,
Cleantech, Spring 2015; Helsinki, Finland.

Sourcing 3Mapping Emerging Ecosystems as a Thematic Sourcing Strategy
64Fi
nanc
ial T
echn
olo
gy fo
r Ind
ustri
al R
enew
al
Growth in the digitalizing world is cross-industrial and is best observed in newly emerging value networks of
transactional relationships
Mapping Emerging Ecosystems as a Thematic Sourcing Strategy
Multi-Asset Renewal Funds enable institutional investors to efficient-ly put their capital to work for the growth of thematic industry sec-tors and the renewal of the real economy. As we argued in the previous chapter, growth in the digitalizing world is cross-industrial and is best observed in newly emerging value networks of transactional relation-
ships between companies. Many employ a more generic term borrowed from nature: the ecosys-tem.
To both efficiently and effectively invest in such ecosystems of companies, we need to establish a valid investment thesis that links emerging indus-
trial ecosystems as an economic phenomenon to the investment model of MARFs as a technical solution and provides the intuition for why it all makes sense from an investor’s point of view.
In the remaining chapters of the book we construct, step by step, the investment thesis for MARFs. To do so we must begin with the foun-dations. If ecosystems are to be the ultimate investment target for MARFs, it is natural to start with the following two questions: What are ecosystems in the first place and how does one go about identifying them?
Definition: Investment thesis
“An investment thesis is the beliefs that investors decide to use when determining what investments to purchase or sell, when to take an action and why. An investment thesis helps investors establish goals for their investments, and measures whether they have been achieved, either in written form or simply as an idea. A sound investment thesis can be a foundation for a profitable portfolio. On the other hand, an incorrect investment thesis can result in sub-par returns or losses.”
Source: Investopedia.
“Growth demands a temporary surrender of security. It may mean giving up familiar but limiting patterns,
safe but unrewarding work, values no longer believed in, and relationships that have lost their meaning.
– John C. Maxwell, Author

65 S
ourcing
In an industrial setting, recycling of materials within and across industries has long been known by the concept of circular economy
Industrial ecosystems borrow from nature for concept
In natural sciences ecosystems are characterized by a network of in-teractions among individual organisms, the elements and the envi-ronments in which they act2. While interactions can be physical en-counters between individual organisms, many of them are indirect ex-changes of material and energy3 that “flow” and are passed on through the ecosystem across time, changing state and form in doing so. Ecosystems are often contained in demarcated geographical spaces and form self-sustaining and intradependent sub-systems of the Earth’s ecology.
Analogies between natural and industrial ecosystems rest on principles that both share on a conceptual level. Korhonen4, for instance, identi-fies four such principles.
The principle of roundput dictates that, in a healthy ecosystem, materi-als are recycled among its actors and, in parallel, energy cascades from one organism to the other via interaction in the environment. In an industrial setting, re-cycling of materials within and across indus-tries has long been known by the concept of circular economy5. In the circular economy, waste and side-products of any one compa-ny serve as factors of production for others. While natural ecosystems are highly efficient at recycling organic and elemental matter, industri-al ecosystems throughout history have produced lots of harmful excess material that has remained unused and is harmful to the environment at worst. With the rise of efforts towards greening economies, the issue of plugging the leaky circulatory systems of material and energy in and between industries has been taken more and more seriously.
The principle of diversity calls for a critical amount of sufficiently different species and organisms in a system. Di-versity increases resource efficiency because individual organisms are able to specialize and become highly adept in utilizing resources. Di-versity also increases the robustness of the entire ecosystem because it becomes less dependent of any one individual or species. Along the same line of argumentation the principle also calls for diversity in in-terdependencies, which introduces redundancy to the system. The ex-tinction of one organism cannot upset the system because the neces-sary resources can be obtained from a number of alternative organisms.
The issue of plugging the leaky circu-latory systems of material and energy in and between industries has been taken more and more seriously
Diversity also increases the robustness of the entire ecosystem because it becomes less dependent of any one individual or species
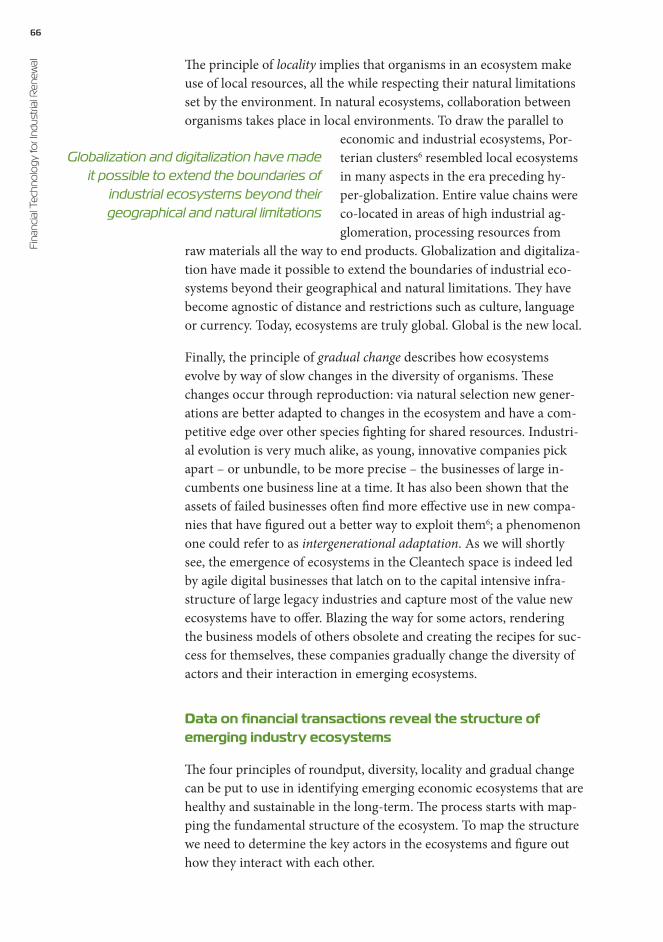
66Fi
nanc
ial T
echn
olo
gy fo
r Ind
ustri
al R
enew
al The principle of locality implies that organisms in an ecosystem make use of local resources, all the while respecting their natural limitations set by the environment. In natural ecosystems, collaboration between organisms takes place in local environments. To draw the parallel to
economic and industrial ecosystems, Por-terian clusters6 resembled local ecosystems in many aspects in the era preceding hy-per-globalization. Entire value chains were co-located in areas of high industrial ag-glomeration, processing resources from
raw materials all the way to end products. Globalization and digitaliza-tion have made it possible to extend the boundaries of industrial eco-systems beyond their geographical and natural limitations. They have become agnostic of distance and restrictions such as culture, language or currency. Today, ecosystems are truly global. Global is the new local.
Finally, the principle of gradual change describes how ecosystems evolve by way of slow changes in the diversity of organisms. These changes occur through reproduction: via natural selection new gener-ations are better adapted to changes in the ecosystem and have a com-petitive edge over other species fighting for shared resources. Industri-al evolution is very much alike, as young, innovative companies pick apart – or unbundle, to be more precise – the businesses of large in-cumbents one business line at a time. It has also been shown that the assets of failed businesses often find more effective use in new compa-nies that have figured out a better way to exploit them6; a phenomenon one could refer to as intergenerational adaptation. As we will shortly see, the emergence of ecosystems in the Cleantech space is indeed led by agile digital businesses that latch on to the capital intensive infra-structure of large legacy industries and capture most of the value new ecosystems have to offer. Blazing the way for some actors, rendering the business models of others obsolete and creating the recipes for suc-cess for themselves, these companies gradually change the diversity of actors and their interaction in emerging ecosystems.
Data on financial transactions reveal the structure of emerging industry ecosystems
The four principles of roundput, diversity, locality and gradual change can be put to use in identifying emerging economic ecosystems that are healthy and sustainable in the long-term. The process starts with map-ping the fundamental structure of the ecosystem. To map the structure we need to determine the key actors in the ecosystems and figure out how they interact with each other.
Globalization and digitalization have made it possible to extend the boundaries of
industrial ecosystems beyond their geographical and natural limitations
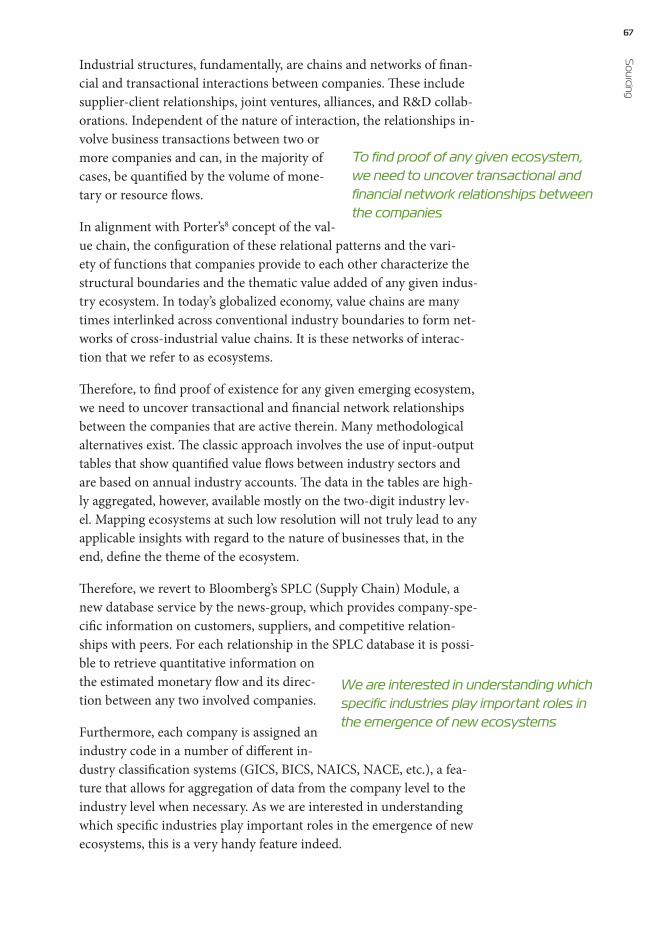
67 S
ourcing
Industrial structures, fundamentally, are chains and networks of finan-cial and transactional interactions between companies. These include supplier-client relationships, joint ventures, alliances, and R&D collab-orations. Independent of the nature of interaction, the relationships in-volve business transactions between two or more companies and can, in the majority of cases, be quantified by the volume of mone-tary or resource flows.
In alignment with Porter’s8 concept of the val-ue chain, the configuration of these relational patterns and the vari-ety of functions that companies provide to each other characterize the structural boundaries and the thematic value added of any given indus-try ecosystem. In today’s globalized economy, value chains are many times interlinked across conventional industry boundaries to form net-works of cross-industrial value chains. It is these networks of interac-tion that we refer to as ecosystems.
Therefore, to find proof of existence for any given emerging ecosystem, we need to uncover transactional and financial network relationships between the companies that are active therein. Many methodological alternatives exist. The classic approach involves the use of input-output tables that show quantified value flows between industry sectors and are based on annual industry accounts. The data in the tables are high-ly aggregated, however, available mostly on the two-digit industry lev-el. Mapping ecosystems at such low resolution will not truly lead to any applicable insights with regard to the nature of businesses that, in the end, define the theme of the ecosystem.
Therefore, we revert to Bloomberg’s SPLC (Supply Chain) Module, a new database service by the news-group, which provides company-spe-cific information on customers, suppliers, and competitive relation-ships with peers. For each relationship in the SPLC database it is possi-ble to retrieve quantitative information on the estimated monetary flow and its direc-tion between any two involved companies.
Furthermore, each company is assigned an industry code in a number of different in-dustry classification systems (GICS, BICS, NAICS, NACE, etc.), a fea-ture that allows for aggregation of data from the company level to the industry level when necessary. As we are interested in understanding which specific industries play important roles in the emergence of new ecosystems, this is a very handy feature indeed.
To find proof of any given ecosystem, we need to uncover transactional and financial network relationships between the companies
We are interested in understanding which specific industries play important roles in the emergence of new ecosystems

68Fi
nanc
ial T
echn
olo
gy fo
r Ind
ustri
al R
enew
al Combined, the features provide a powerful set of tools that enable an-alysts to roam and explore the financial network structures in any the-matic ecosystem (see Fig. 3.1 for a generic example). Starting off with only a handful of companies known to operate in the ecosystem of in-terest, we can follow the links from one company to the next – both upstream and downstream along the various value chains – to unravel the complex relationship structure of the entire ecosystem.
The identification of the initial set of companies to start off with is fair-ly straightforward. For instance, when exploring the Smart Grid eco-system it is safe to assume that power utilities, grid operators, electri-cal system manufacturers, certain telecommunications operators, smart meter developers, and data analytics companies will be involved.
That being said, choosing the actual companies to start the mapping process with involves some amount of qualitative due diligence – detec-tive work including scanning published materials on the candidates’ de-tailed business activities – to make sure they are representative and truly involved in developing their business in the ecosystem of interest. While
Figure 3.1Example of a relational network map
Source: Grandjean, M. (2014)9.

69 S
ourcing
some telecommunications operators, for instance, have developed solu-tions such as machine-to-machine communication services for predic-tive electricity grid maintenance purposes, others have no interest in venturing into the Smart Grid space. To obtain a meaningful represen-tation of the structure in the Smart Grid ecosystem, it is obvious that we have to exclude the latter and start off the analysis with the former.
The granularity in the relationship maps can be adjusted by either in-creasing or decreasing the degree of separation between companies along the value chains. The number of total connections in the map grows exponentially with each additional tier of companies as each newly added one entertains relations with numerous clients and suppli-ers of its own.
Once the total mass of individual companies reaches a satisfactory lev-el, the industry codes associated with each company help in aggre-gating the data by industry. The individual company identifiers – i.e. names or ID numbers – are replaced by their industry classification codes to allow for aggregating individual con-nections between companies on the indus-try level. Based on the amount of individual connections, the respective amounts of finan-cial exposure, and the degree of separation of industries it is possible to determine the connectivity and centrality – the importance, to put it more bluntly – of each involved industry in the ecosystem.
The most valuable feature of the approach is that it is purely data-driv-en. Beyond the selection of the often well-established and validated ini-tial set of companies, there is no need to pre-specify the companies, in-dustries or boundaries that demarcate the ecosystem ex ante.
Network visualization helps in interpreting complex ecosystem structures
Even after data aggregation, the output of the network analysis still re-mains difficult to interpret. Depending on what tools were used to per-form the data aggregation, the results are usually produced in raw nu-meric format, viewable in the form of large, cumbersome tables.
To gain insights from the results, it is advisable to convert them into a more graphical form. To obtain a more spatial representation – such as the one presented in Fig. 3.1 – we utilized an open-source network vi-sualization software called Gephi10.
Most programs provide similar features and allow for a variety of them to be incorporated in the final visualization. As we knew that our maps
The most valuable feature of the approach is that it is purely data-driven
70Fi
nanc
ial T
echn
olo
gy fo
r Ind
ustri
al R
enew
al would have to fit the book format, we opted for a two-dimensional map that expressed the relative roles of and relationships between industries via three key factors: relative distance between industry nodes, rela-tive location of industry nodes, and thickness of the edges representing connections between industries. To avoid an overly technical treatment of the methodology here, we defer the more detailed description of the factors to our empirical showcases later in this chapter.
Beyond its visual features, the software provides the functionality to ap-ply key metrics better known from social network analysis (SNA) on industry network analysis. These metrics include indices for between-ness, network centrality, closeness, clustering, average shortest path, etc. These indices, in turn, help in interpreting the importance and na-
ture of roles that certain companies or industry sectors play in the analyzed ecosystems.
As will shortly be illustrated by means of map-ping three real-world ecosystems, the metrics will identify two types of industries in the network. On the one hand, anchor industries are character-
ized by low network centrality, and a predominance of clustered rela-tionships as opposed to cross-industrial ones. These clusters, similarly to the clusters of nodes in Fig. 3.1, are a representation of the conven-tional and often linear value chains of anchor industries.
The cross-over between these anchor industry clusters occurs via inter-mediary industries, or catalyst industries, as we denote them. These cat-alysts are clusters of nodes that connect multiple anchor industries, are characterized by greater network centrality and maintain multiple fi-nancial relationships outside their own cluster.
Let us demonstrate.
Financial network mapping in action
Nothing helps to understand a methodology better than a practical ap-plication. In the remainder of this chapter we will focus on the appli-cation of the financial network mapping process on three distinct re-al-world cases: the Finnish Smart Grid, Smart Mobility and Green Chemistry ecosystems. For the reader who wants to first establish the larger empirical context of the ecosystems, Chapter 2 provided a gener-al description of the Finnish Cleantech space that our case ecosystems are a part of.
We are by no means the first to use financial network mapping to un-veil monetary flows in economic structures. Financial network maps
Catalyst industries connect multiple anchor industries, are characterized
by greater network centrality and maintain multiple financial relation-
ships outside their own cluster

71 S
ourcing
have been used in a range of financial-economic systems – such as eco-nomic trade and interbank payment systems – to assess robustness and risk in interconnected financial systems. That being said, the applica-tion of financial network mapping to uncover emerging industry struc-tures has, to our knowledge, not been attempted, but ties strongly in-to industrial cluster strategy approaches that have been advocated in economic develop-ment literature.
According to the Brookings Institution, a Washington DC think tank, industry cluster analysis can help diagnose a region’s economic strengths and challenges and identify realistic ways to shape a region’s economic future. Yet many policymakers and practi-tioners have only a limited understanding of what clusters are and how to build economic development strategies around them. To show the potential of network maps in generating novel insights for such strat-egies, we will provide implications for economic development in the concluding chapter.
Case Study 1: Smart Grid – Advancing efficiency, reliability and flexibility over legacy grid paradigm
Let us begin with mapping the Finnish Smart Grid space. Smart Grid as a concept is not a recent one, by any means. Demand-side man-agement of electricity was among the earliest applications of a limited ‘Smart Grid’. The grid has gradually become “smarter” as IT-enabled technology has been integrated into the legacy infrastructure of energy production, transmission, distribution and consumption. The prolifer-ation of functionalities is reflected in many of the complementary defi-nitions put forth by the various actors in the Smart Grid ecosystem:
According to the International Electrotechnical Commission (IEC)11, a Smart Grid “is an electricity network that can intelligently integrate the actions of all users connected to it – generators, consumers and those that do both – to efficiently deliver sustainable, economic and secure electricity supplies. A Smart Grid employs innovative products and ser-vices together with intelligent monitoring, control, communication, and self-healing technologies to: (i) facilitate the connection and oper-ation of generators of all sizes and technologies; (ii) allow consumers to play a part in optimizing the operation of the system; (iii) provide con-sumers with greater information and choice of supply; (iv) significantly reduce the environmental impact of the whole electricity supply system; and (v) deliver enhanced levels of reliability and security of supply.”
The European Commission12 adds that: “Smart Grids are energy net-works that can automatically monitor energy flows and adjust to
The grid has gradually become “smarter” as IT-enabled technology has been integrated into the legacy infrastructure
72Fi
nanc
ial T
echn
olo
gy fo
r Ind
ustri
al R
enew
al changes in energy supply and demand accordingly. When coupled with smart metering systems, Smart Grids reach consumers and suppliers by providing information on real-time consumption. With smart meters, consumers can adapt – in time and volume - their energy usage to dif-ferent energy prices throughout the day, saving money on their ener-gy bills by consuming more energy in lower price periods. Smart Grids can also help to better integrate renewable energy […].”
Compared to the legacy paradigm, Smart Grids offer multiple benefits to their various constituents, some of which are listed by the USDE13. These include “more efficient transmission of electricity; quicker resto-
ration of electricity after power disturbances; re-duced operations and management costs for utili-ties, and ultimately lower power costs for consum-ers; reduced peak demand, which will also help lower electricity rates; increased integration of large-scale renewable energy systems; better inte-
gration of customer-owner power generation systems, including renew-able energy systems; [and] improved security.”
To summarize, Smart Grids create added value in the form of enhanced cost efficiency, greatly improved reliability and unprecedented produc-tion flexibility. Because the related benefits are appropriated by both producers and consumers, the emergence of Smart Grids is driven by forces of both demand pull and supply push.
Smart Grids are cross-industrial ecosystems
The definitions strongly imply that Smart Grids transcend the tra-ditional boundaries of the energy production and transmission val-ue chain. Monitoring, bi-directional data flows, machine-to-machine communication and electronics that enable automated optimization on system level are not in the capability domain of traditional utilities and transmission grid operators. A few years ago, Greentech Media Re-search developed a plot of smart infrastructure layers on top of the tra-ditional infrastructure value chain (Fig. 3.2). While some companies represented in the figure no longer exist, have been acquired, or gone out of business, the structure reveals important features of the industry ecosystem.
While the incumbent energy value chain is represented in the familiar power infrastructure layer (bottom), Smart Grids necessitate the inte-gration of a large number of other functional layers that build on top of the incumbent infrastructure. These include the communication infra-structure across which data is transmitted between the different stake-holders to the system; the meter data management layer; the demand
Smart Grids create added value in the form of enhanced cost efficiency,
greatly improved reliability and unprecedented production flexibility
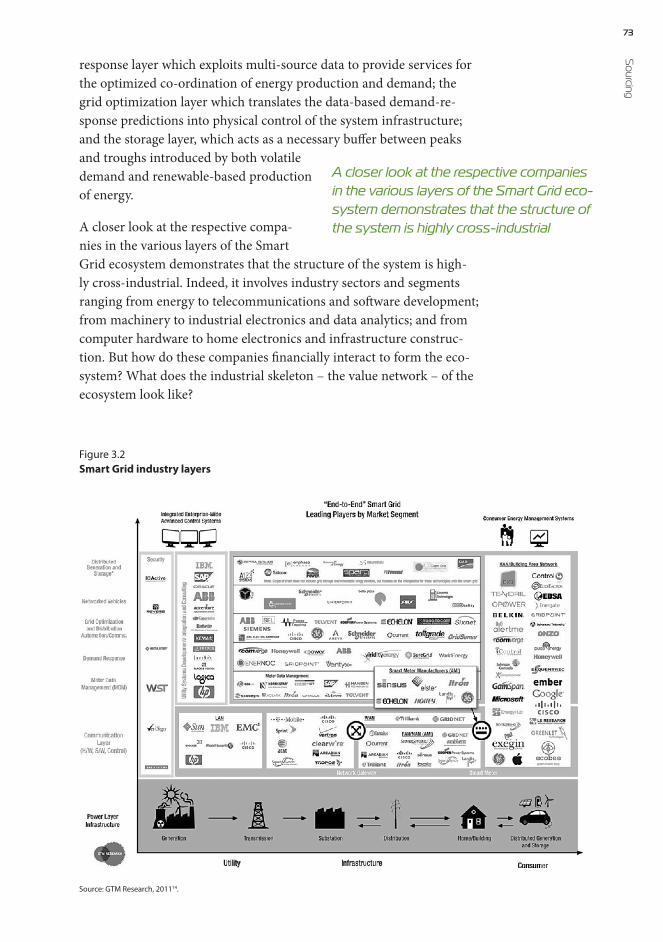
73 S
ourcing
response layer which exploits multi-source data to provide services for the optimized co-ordination of energy production and demand; the grid optimization layer which translates the data-based demand-re-sponse predictions into physical control of the system infrastructure; and the storage layer, which acts as a necessary buffer between peaks and troughs introduced by both volatile demand and renewable-based production of energy.
A closer look at the respective compa-nies in the various layers of the Smart Grid ecosystem demonstrates that the structure of the system is high-ly cross-industrial. Indeed, it involves industry sectors and segments ranging from energy to telecommunications and software development; from machinery to industrial electronics and data analytics; and from computer hardware to home electronics and infrastructure construc-tion. But how do these companies financially interact to form the eco-system? What does the industrial skeleton – the value network – of the ecosystem look like?
Figure 3.2Smart Grid industry layers
Source: GTM Research, 201114.
A closer look at the respective companies in the various layers of the Smart Grid eco- system demonstrates that the structure of the system is highly cross-industrial
74Fi
nanc
ial T
echn
olo
gy fo
r Ind
ustri
al R
enew
al Data, software and IT are the beating heart of the Smart Grid ecosystem
Subjecting the ecosystem to the financial network mapping analysis re-veals the monetary flows between the involved industries and subin-dustries, and shows the intricate industrial structure of the entire sys-tem (Fig. 3.3). It is important to note that the input data employed were selected at the very detailed six-digit GICS (Global Industry Classifi-cation System) level, well below the broad industry sectors. Hence, the network map reflects an integration of value chain data in the context of sub-sector groupings of industries with similar business activities. However, even if business activities are similar, their respective busi-ness models may diverge significantly.
Starting with the top most panel of the figure, the edge thickness of connections between individual industry sectors denotes the relative financial exposure – i.e. the relative flows of money – between them. The thicker the edge, the more significant is the financial exposure – or trade relationship – between the industries. Another key dimension in the map is the positioning of the industries relative to each other. Those positioned closer to the core of the map display a higher connectivity, or network centrality, to all other industries than those located in the periphery of the map. The higher the centrality, the more “important” the respective industry is to the mutual connectivity of the entire eco-system. Industries of high centrality bridge the chasms between sectors that otherwise would have very low connectivity in a given ecosystem.
Aside from social networks15, this observation has been made in financial networks as well.
As displayed in the lower two panels, both more clearly presented abstractions of the original map, we use the centrality of nodes to distinguish be-
tween the roles single industries have in the financial network structure of the Smart Grid ecosystem. Industries of high centrality – encircled in light blue in the figure – are designated catalysts. They are built on the infrastructure of anchor industries – dark blue hexagons in the fig-ure – that stake the perimeter of the ecosystem.
Anchors are less well connected to the emerging ecosystem as they are still relatively contained in their incumbent industrial value chains. However, they serve an extremely important role as the providers of capital-intensive infrastructure and vital technological components. Good examples of essential Smart Grid infrastructure are energy pro-duction facilities and transmission grids maintained by utilities and grid companies as well as the telecommunication networks maintained by both integrated and wireless telecommunication operators. Techno-
Anchors are less well connected to the emerging ecosystem as they
are still relatively contained in their incumbent industrial value chains
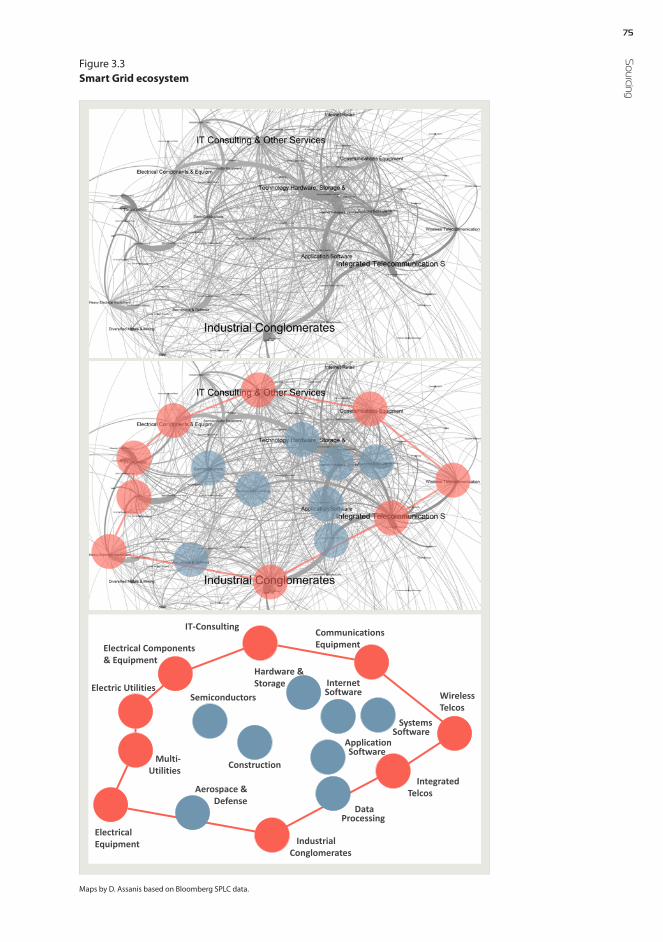
75 S
ourcing
Figure 3.3Smart Grid ecosystem
Maps by D. Assanis based on Bloomberg SPLC data.
IT-Consulting CommunicationsEquipment
WirelessTelcos
IntegratedTelcos
Industrial Conglomerates
ElectricalEquipment
Multi-Utilities
Electric Utilities
Electrical Components& Equipment
Aerospace & Defense
Semiconductors
Construction
Hardware & Storage Internet
Software
Systems Software
Application Software
Data Processing

76Fi
nanc
ial T
echn
olo
gy fo
r Ind
ustri
al R
enew
al logical components, in turn, are provided by electrical component and equipment manufacturers, industrial conglomerates, such as Siemens, Bosch and others, and communications equipment producers.
The role of catalyst industries, in turn, is the integration of the afore-mentioned industries to harness them for creating entirely new type of value that will be offered to users in the form of novel products and services. In the case of Smart Grid, this means increased efficiency, reli-
ability and security through real-time, data-driv-en optimization technologies and services.
One could argue that, in the case of Smart Grids, it is the catalyst industries that make the system intelligent – an Internet of Things (IoT). Catalyst
industries include many software-based sectors such as systems soft-ware, application software and data processing. Semiconductors as well as technology hardware and storage further corroborate the centrality of IT-related solutions in tying together the intricate web of industrial activity in the Smart Grid ecosystem.
Smart Grid ecosystems display true industrial momentum
Our results confirm that a global, economically viable Smart Grid fi-nancial network is a reality. Power utilities, electrical and mechanical component and systems manufacturers, information and communi-cation technology producers as well as telecommunications operators form a strong infrastructure layer that provides the physical foundation for the entire Smart Grid ecosystem. This foundation integrates power generation technology, transmission and distribution grids, the respec-tive electronic and mechanical equipment as well as telecommunica-tion grids and their control technology.
On top of the foundation, data and software -driven companies build scalable, fast growing businesses, leaning on the resources of the entire infrastructure layer. In doing so, cross-industrial value chains emerge and enable the creation of service models that add new value in the
form of improved efficiency, reliability and flexibility. It is these companies that connect the involved legacy industries to form the emerging ecosystem and to make it “smart”. IT-hardware developers, data storage com-panies, application and systems software
developers, as well as data processing and analytics companies are in this growing nexus of the Smart Grid ecosystem. Machine-to-machine communication -enabled grid and facility automation, remote con-
The role of catalyst industries is the integration of the aforementioned
industries to harness them for creating entirely new type of value
Cross-industrial value chains emerge and enable the creation of service models that
add new value in the form of improved efficiency, reliability and flexibility

77 S
ourcing
trolled smart homes and factories, micro-grid integration, demand re-sponse optimization, and predictive grid maintenance services are just few examples of new value added products and services powered by IT- and software-driven solutions.
The multilateral structure allows for abundant roundput, distributing factors of production in the form of raw mate-rials, components, systems, products and services across single indus-try boundaries. As the differences in edge thickness reveal, at least fi-nancial roundput is more intense among catalyst industries in the eco-system, indicating a higher intensity in either activity, volume or both. This corroborates the importance of catalyst industries that seem to constitute the active core of the ecosystem.
As to the outstanding three defining principles of an ecosystem, the principle of diversity surely is satisfied in the case of Smart Grids as the ecosystem seems to feature both a multitude of diverse industries and plenty of redundancy in interaction amongst them. The diversity on the industry level is further reinforced by the diversity of companies within the individual industries that is not graphically represented in the map.
The principle of gradual change, in turn, is implicitly captured in the structure of the ecosystem as it is an emerging and changing ecosys-tem by definition. We all well know the structures of incumbent energy markets – pictured in the bottom layer of Fig. 3.2 – that have been ex-posed to changes via agile, digital service businesses to add intelligence to the legacy infrastructure. In fact, financial network maps are just the tool for uncovering gradual changes in the environment, especially when applied across time in a series of analyses.
The principle of locality is the only one that is less easy to apply to this particular context. As discussed earlier, local has to be understood not in a geographical sense but in an economic one and even there bound-aries have become more and more permeable. Trade agreements be-tween formerly separate economic areas have paved the way for unhindered flow of trade and resources across the globe. One of the most recent examples is the Comprehensive Economic and Trade Agreement (CETA) between the EU and Canada. On a close-ly related note, the map in Fig. 3.3 really is global. Yes, the initial set of companies that was used to start off the network analysis consisted of Finnish companies only, but as soon as the analysis was expanded be-yond that set – to the clients and suppliers of the companies – no na-tional restrictions were applied.
Financial network maps are just the tool for uncovering gradual changes in the environment
Financial roundput is more intense among catalyst industries in the ecosystem

78Fi
nanc
ial T
echn
olo
gy fo
r Ind
ustri
al R
enew
al Telecommunication industries are better positioned to hop on the smart wagon
As an interesting final remark on the ecosystem’s structure, the catalyst sectors seem to be more closely affiliated with telecommunications-re-lated sectors than with energy utilities or component manufacturers. The close relationship is a tangible legacy of the internet era that wit-nessed the convergence of telecommunications providers, software de-velopers, and data analytics services to create the still quickly evolving internet ecosystem.
These relatively close ties will put telecommunications providers in a more advantageous position to capture value in the Smart Grid space as they already form an important part of the respective ecosystem struc-ture. One of their most valuable assets is an existing, proliferated and
captive customer and payment interface that reaches every single individual with a phone or internet connection.
Telcommunications companies such as Nokia and Cisco have indeed engaged in strategic in-vestments or acquisitions of home, local area,
and geographic network and security companies to enable the roll out of new smart, digital services through their interface.
Case study 2: Smart Mobility – Increased safety, lower emissions, new jobs and improved social opportunities
Much in line with the evolution of Smart Grids, the emergence of the Smart Mobility ecosystem is driven by the various negative externalities that accompany the self-reinforcing, global megatrend of urbanization. The World Resources Institute (WRI)16 claims that 70 percent of ener-gy-related greenhouse gas emissions are produced in cities, and that developing cities, in particular, would contribute to the majority of traf-fic crashes that claim 1.2 million lives per year. The WRI explains that congested traffic costs the cities of Rio de Janeiro and São Paulo a com-bined $43 billion in 2013, a whopping 8 percent of the cities’ GDP. The equivalent figure for Beijing, including costs related to air pollution, the Institute estimates at 7–15 percent of GDP. A study by the New Climate Economy17, in turn, finds that Americans bear an extra cost of US$1 trillion related to urban sprawl.
To tackle these externalities, ICT-driven approaches to optimize avail-able resources for moving people and goods in urban areas, in partic-ular, provide for increased efficiency and safety “at a cost much lower than building new infrastructure from the ground up” (World Bank18).
Close ties with catalysts will put tele- communications providers in a more
advantageous position to capture value in the Smart Grid space
79 S
ourcing
According to the US Department of Transportation19, Intelligent Trans-portation Systems (ITS) – the purely technological aspect of Smart Mobility – can be defined as “the application of advanced information and communications technology to surface transportation in order to achieve enhanced safety and mobility while reducing the environmen-tal impact of transportation. The addition of wire-less communications offers a powerful and trans-formative opportunity to establish transportation connectivity that further enables cooperative sys-tems and dynamic data exchange using a broad range of advanced systems and technologies.” The European Telecommunications Standards Insti-tute20, ETSI, adds that ITS include “telematics and all types of communications in vehicles, between vehicles (e.g. car-to-car), and between vehicles and fixed locations (e.g. car-to-infrastructure). However, ITS are not restricted to Road Trans-port – they also include the use of information and communication technologies (ICT) for rail, water and air transport, including naviga-tion systems.”
The benefits are said to be wide-ranging. The European Commission21 claims that ITS “are vital to increase safety and tackle Europe’s growing emission and congestion problems” and that “the integration of exist-ing technologies can create new services, [supporting] jobs and growth in the transport sector.” Tass International22, a Dutch technology devel-opment organization for the mobility sector, explains that a connected, Smart Mobility infrastructure will enable the reduc-tion of the number of traffic accidents as well as the reduction of emissions and fuel consumption while improving traffic flow. In addition to economic and environmental benefits, Smart Mobility will also en-tail social improvements by providing low-income population vastly improved access to urban job markets and educational systems. WRI23 provides an example with Me-dellín’s (Colombia) Metrocable system that “has transformed what was once a day-long journey from the city’s mountainous slums to its urban core into a 30-minute affair, increasing access to daily needs and em-powering the city’s most disadvantaged communities.”
But how do these lofty concepts translate into reality? Toyota Motor Corporation provides an insightful vision of Smart Mobility in a re-al-life setting (Fig. 3.4). Increased safety is enabled by real-time infor-mation sharing among vehicles, infrastructure and pedestrians. The in-formation is used by automated collision prevention systems in vehicles to anticipate and actively avoid accidents. While sensor-based collision prevention systems already exist in contemporary vehicles, even more
Smart Mobility will also entail social improvements by providing low-income population vastly improved access to urban job markets and educational systems
”Wireless communications offers a powerful and transformative oppor-tunity to establish transportation connectivity that further enables cooperative systems and dynamic data exchange”
– US Department of Transportation
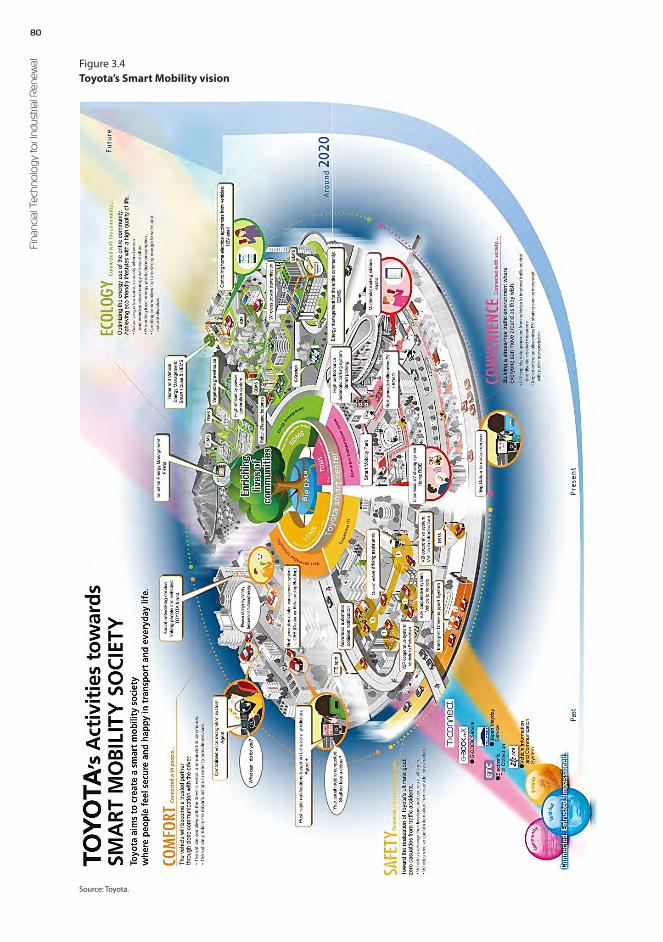
80Fi
nanc
ial T
echn
olo
gy fo
r Ind
ustri
al R
enew
al Figure 3.4Toyota’s Smart Mobility vision
Source: Toyota.

81 S
ourcing
effective solutions will be based on communication between vehicles and the surrounding urban infrastructure.
Increased comfort and ease of use is the result of advanced communi-cation interfaces between the driver and her vehicle that include verbal interaction and predictive information sharing on suggested routing, nearby social events, shopping opportunities, car maintenance and oth-er personal points of interest that the vehicles AI will tailor to the driver’s individual profile.
Heightened convenience comes with the decoupling of ownership and availability of unrestricted trans-portation. Interconnected public and crowd-sourced transportation (ride sharing, car sharing, etc.) systems are envisioned to render privately owned vehicles obsolete, as intelligent multimod-al route guidance applications co-ordinate the availability and access to transportation services anywhere and at any time to anyone. The concept is also known as Mobility as a Service (MaaS). MaaS allows to forego heavy capital costs related to the ownership of cars and to incur only variable costs per use.
Finally, the progressing electrification of transportation systems has a direct impact on the ecological sustainability of traffic and other urban solutions. Electric vehicles not only reduce emissions in the direct ur-ban environment but can be integrated into the larger Smart Grid eco-system to serve as a temporary storage option for demand-response op-timization purposes.
Smart Mobility already boasts an established industry structure
The network mapping analysis for Smart Mobility reveals established, cross-industrial value networks that speak of an ecosystem akin to Smart Grid (Fig. 3.5). Unsurprisingly, the anchor industry foundation features legacy industries that are both manufacturing and capital in-tensive. These include (i) wireless telecommunications as the provid-er of the necessary wireless and mobile data transfer infrastructure, (ii) the transportation industry (logistics) that commands ground, marine and aerial fleet assets to provide transportation services, (iii) internet retail as the sales platform and interface for purchasing mobility ser-vices in real-time on the go, (iv) the application software industry that develops mobile applications (e.g. route guides, navigation apps, and car sharing platforms) for users to navigate the interconnected mobility landscape, and technology component manufacturers, here “industrial conglomerates”, as the providers of system components for the ecosys-tem’s hardware infrastructure.
Heightened convenience comes with the decoupling of ownership and availability of unrestricted transportation
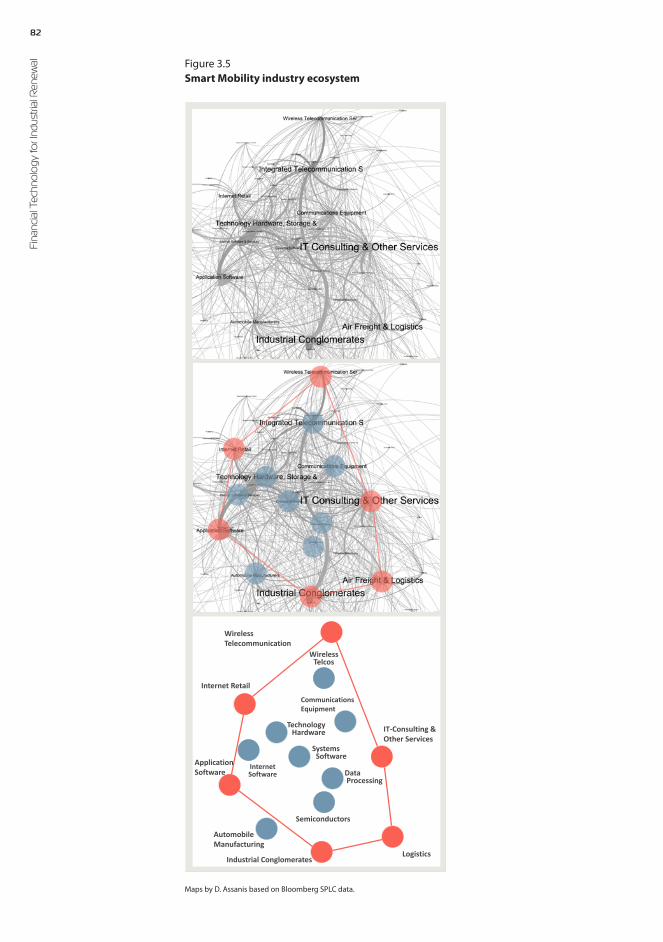
82Fi
nanc
ial T
echn
olo
gy fo
r Ind
ustri
al R
enew
al Figure 3.5Smart Mobility industry ecosystem
Maps by D. Assanis based on Bloomberg SPLC data.
Wireless Telecommunication
Internet Retail
Application Software
Automobile Manufacturing
Industrial ConglomeratesLogistics
IT-Consulting & Other Services
Wireless Telcos
CommunicationsEquipment
Technology Hardware
Internet Software
Systems Software
Data Processing
Semiconductors

83 S
ourcing
The catalyst industries, in turn, include the by now familiar software and IT-driven sectors such as systems software, data processing, and hardware, but now also feature sectors that in Smart Grid played the role of anchors. These are integrated telecommuni-cations and communications equipment. It seems telecommunications operators are intent on lever-aging their strong, direct link to consumers and es-tablished user interfaces to exploit opportunities in the mobility space. It is a brilliant strategy as Smart Mobility really is all about real-time information brokerage that, in contrast to Smart Grid, is easily delivered via mobile devices such as smart phones.
The role of car manufacturing in the Smart Mobility ecosystem is still somewhat uncertain. According to Ford Motor Company’s projections, about 80 percent of the total value of ground vehicles will reside out-side the physical vehicle within a decade if car manufacturers do not take measures to integrate the added value of Smart Mobility-related solutions into the vehicles. Ford itself has declared to pursue a re-posi-tioning strategy that will see a shift away from the drive train and chas-sis to the digital, interconnected dashboard as the most valuable ele-ment in a vehicle. Ford is on route to transform its identity from a car company towards a technology company. If Ford’s case is to be taken as a signal of a trend that will define the future of car manufacturing, then the sector might very well serve the role of integrator in the budding Smart Mobility ecosystem. It might well become a catalyst sector, fight-ing for market share with telecommunications.
In summary we can state that there is clear evidence of industrial mo-mentum in Smart Mobility.
Case study 3: Green Chemistry – A Bioeconomy sector in need of policy intervention
To conclude the chapter on ecosystem mapping by way of providing a contrasting case example to the two “smart” ecosystems, we take a look at a very different, yet equally prospective industry space: the Bioeconomy.
The last few years have witnessed an exponential growth in both po-litical and commercial momentum for the concept of the Bioecono-my. The commitment to designing and supporting policies for the im-plementation of the concept runs high; institutions including national governments, the EU and the OECD have laid out long-term strategies to harness the progress in biological resource technologies for sustain-able economic growth and improvements in physical and socio-eco-nomic welfare (see Box 3.1).
Smart Mobility is about real-time information brokerage that is easily delivered via mobile devices

84Fi
nanc
ial T
echn
olo
gy fo
r Ind
ustri
al R
enew
al
Finnish economic developers have been at the forefront of strategy de-sign and already have something to show for it. Only as recently as 2014 did Finland rank second in WWF’s Global Cleantech Innovation Index24. Led by the Ministry for Employment and the Economy25, Fin-land has crafted national Bioeconomy strategies which are to be im-plemented by national and regional development agencies via various technology programs, such as the new Bioeconomy Development and Growth Programme run by Tekes, the Finnish Funding Agency for In-novation. Efforts between agencies are effectively coordinated via the Team Finland consortium26 that comprises central ministries and eco-nomic development agencies in the country.
Finnish government committed to promotion of Bioeconomy
The strongest of commitments, however, has been made by the Finnish government itself. In a push to turn around a lackluster economy, the government has declared the “Bioeconomy and clean solutions” one of its five strategic priorities (see Box 3.2). In the spirit of the various ex-
Box 3.1Bioeconomy – A sample of definitions
“The bioeconomy comprises those parts of the economy that use renewable biological resources from land and sea – such as crops, forests, fish, animals and micro-organisms – to produce food, materials and energy. It is an essential alternative to the dangers and limitations of our current fossil-based econ-omy and can be considered as the next wave in our economic development. It provides major oppor-tunities for innovation, jobs and growth and as such will help to reindustrialise Europe.”Source: European Commission, Research & Innovation.
From a broad economic perspective, the bioeconomy refers to the set of economic activities relating to the invention, development, production and use of biological products and processes. […] The appli-cation of biotechnology to primary production, health and industry could result in an emerging “bio-economy” where biotechnology contributes to a significant share of economic output. The bioecono-my in 2030 is likely to involve three elements: advanced knowledge of genes and complex cell process-es, renewable biomass, and the integration of biotechnology applications across sectors.Source: The Bioeconomy to 2030: designing a policy agenda. International Futures Programme, OECD.
Box 3.2Bioeconomy and clean solutions
1. Bioeconomy and clean solutions2. Towards carbon-free, clean and renewable energy cost-efficiently3. Wood on the move and new products from forests Breakthrough of a circular economy, getting
waters into good condition4. Finnish food production will be profitable, trade balance on the rise5. Nature policy based on trust and fair means.Source: Finnish Government27.

85 S
ourcing
isting definitions of the Bioeconomy, the Finnish Government defines the concept very broadly, including economic sectors such as energy, forestry and paper, natural resource management, and food and feeds.
Figure 3.6 portrays the circular economy envisioned to constitute the industrial structure of the Bioeconomy. The strategy is broad and rests on the implicit assumption that the conventional industrial pillars of the Finnish industry will interconnect via new value chain segments and integrate innovations in biological materials to provide new eco-nomic value added in the form of sustainable products and process technologies.
The viability of the strategy, then, hinges on whether there is tangible evidence of new inter-industry value chains being formed. This evi-dence would suggest that industries and markets have picked up on the promises of the Bioeconomy and started to adapt to and build out bio-based processes. The question about industrial momentum is pivotal because creating an entire industry ecosystem from scratch – on politi-cal momentum and resources alone – is an extremely costly, inefficient and multi-generational undertaking.
Government policies indeed need to be designed by leveraging prom-ising weak signals from the economy, to reasonably assure the viabili-ty of their outcome or impact. Given the long-lasting global excitement around concepts such as Cleantech and Finland’s economic roots in natural resources and related expertise, it is easy to believe in a Finnish comparative advantage as grounds for industrial policy.
Figure 3.6Bioeconomy value chains
Source: TEM28.
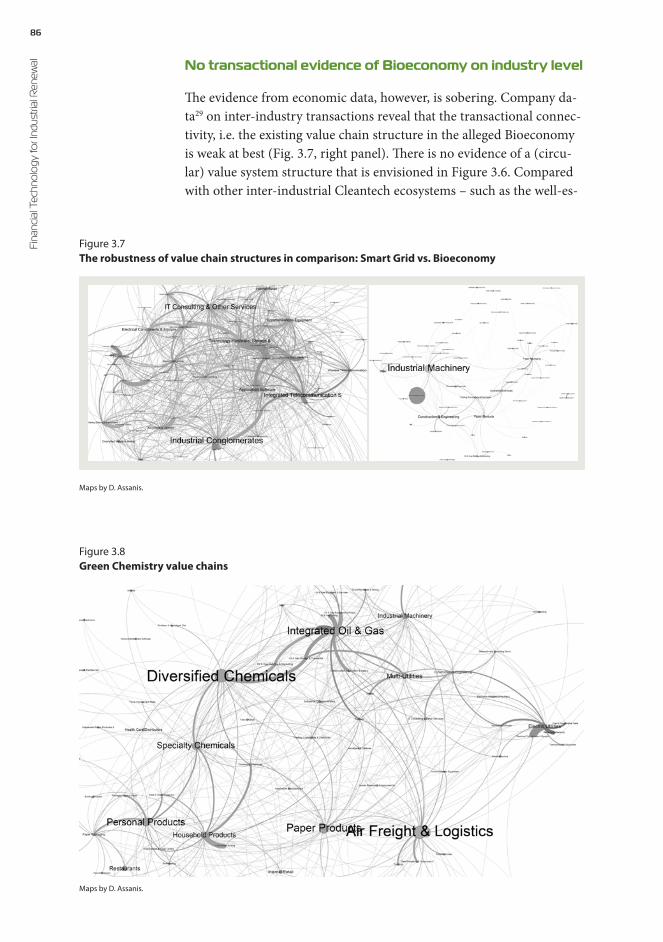
86Fi
nanc
ial T
echn
olo
gy fo
r Ind
ustri
al R
enew
al No transactional evidence of Bioeconomy on industry level
The evidence from economic data, however, is sobering. Company da-ta29 on inter-industry transactions reveal that the transactional connec-tivity, i.e. the existing value chain structure in the alleged Bioeconomy is weak at best (Fig. 3.7, right panel). There is no evidence of a (circu-lar) value system structure that is envisioned in Figure 3.6. Compared with other inter-industrial Cleantech ecosystems – such as the well-es-
Figure 3.7The robustness of value chain structures in comparison: Smart Grid vs. Bioeconomy
Maps by D. Assanis.
Figure 3.8Green Chemistry value chains
Maps by D. Assanis.

87 S
ourcing
tablished Smart Grid sector (Fig. 3.7, left panel) – the focal industry sectors of the Bioeconomy seem to remain transactionally isolated in their conventional legacy value chains.
What could be the problem? Maybe the all-encompassing bird’s eye view on the entire Bioeconomy is too cursory an approach to reveal in-depth economic structures? One could ask whether evidence from eco-nomic actors in Bioeconomy sub-sectors provides more detail of their specific value chain relationships.
For instance, a look at Green Chemistry, an emerging industrial trend that seeks to substitute hazardous and fossil-based raw materials for sustainable and renewable resources such as biomass, provides for more promising results (Fig. 3.8). Robust transactional connectivity be-tween a number of different industry sectors is clearly evident.
An abstraction of the same map (Fig. 3.9, right panel) reveals a multi-industry structure that encompasses sectors such as chemicals, integrated oil and gas, paper, household products, industrial machin-ery and electric utilities. Surely this should be strong enough empirical evidence of a circular economy? Unfortunately, this is a premature con-clusion. Comparing the structures of the Green Chemistry ecosystem to those of the familiar benchmark, Smart Grid (Fig. 3.9, left panel), re-veals decisive structural weaknesses in the Green Chemistry ecosystem.
Evidence shows weak signals of incipient Green Chemistry value chains
Unlike the Smart Grid ecosystem, the Green Chemistry ecosystem al-most entirely lacks meaningful catalyst industry sectors. There are on-ly few existing value chain structures between sectors that provide “green resources” – such as the biomass generating paper industry –
IT-Consulting CommunicationsEquipment
WirelessTelcos
IntegratedTelcos
Industrial Conglomerates
ElectricalEquipment
Multi-Utilities
Electric Utilities
Electrical Components& Equipment
Aerospace & Defense
Semiconductors
Construction
Hardware & Storage Internet
Software
Systems Software
Application Software
Data Processing
SMART GRID GREEN CHEMISTRY
Industrial MachineryIntegrated Oil & Gas
Diversified Chemicals
SpecialtyChemicals
Personal Products
HouseholdProducts
Paper Poducts
Electric Utilities
Multi-Utilities
Figure 3.9Abstractions of value chain structures in comparison: Smart Grid vs. Green Chemistry

88Fi
nanc
ial T
echn
olo
gy fo
r Ind
ustri
al R
enew
al
GREEN CHEMISTRY
Industrial MachineryIntegrated Oil & Gas
Diversified Chemicals
SpecialtyChemicals
Personal Products
HouseholdProducts
Paper Poducts
Electric Utilities
Multi-Utilities
Figure 3.10Incipient value chains between paper and chemicals sectors
and industries that would use them as sustainable inputs. On the con-trary, the structure displayed in Fig. 3.9 (right panel) represents the classical value chain structure of the chemical industry, consisting of its supplier relationships in the fossil raw materials industry, on the one hand, and its client relationships in the household product indus-try on the other. What we see in the picture is the industry’s structure as it has existed for the past few decades already. In short, there is no indication of encouraging trends towards a new, biomass-based circu-lar economy.
That being said, a detailed examination of the map displayed in Fig. 3.10 reveals that there are weak first signals of incipient connec-tions between the paper and chemicals sectors. The three sectors are bridged by a potential catalyst, the commodity chemicals sector (Fig.
3.10, green edges). According to the data at hand, this link is still very weak but could be early indica-tion of an alternative, sustainable, biomass-based re-source sourcing strategy of the chemicals sector. Evi-dence that this signal is at work in the real stocks and
flows of the economy is based on investments made by major chemi-cal giants such as BASF and the Dow Chemical Company in entrepre-neurial startups that have developed processes to generate new cellu-lose-based building blocks as input raw materials for chemical pro-duction.
There are weak first signals of incipient connections between
the paper and chemicals sectors

89 S
ourcing
Promotion of Bioeconomy only viable as long-term, patient strategy with marginal short-term economic impact
What is to be made of the results? Clearly, the existing industrial struc-tures do not promise short-term growth. The necessary circular value chain structures need to be developed first before the ecosystem can be expected to contribute to economic growth on any relevant scale. From emerging industry pilots in the Green Chemistry space – such as the number of rising bio-energy plants in Finland – we know that oppor-tunities to harness the country’s natural resources are seriously being probed. What is not known, however, is whether they will catalyze the much sought after economic growth.
Here, the crucial question is whether renewables-based materials mere-ly substitute for petrochemical raw materials in the economic plumb-ing system of the conventional industry structure, on the one hand, or whether they actually entail the emergence of entirely new econom-ic activity, perhaps even the emergence of entirely new industry sec-tors, on the other. If the former scenario turns out to be the case, the best possible outcome from an economic point of view is an increase in competitiveness – fueled by a global drive towards industrial sustain-ability – of the existing industry. It could provide fading, incumbent in-dustry sectors with enough ammunition to stay in the game. This, of course, is an admirable outcome in and by itself, especially if it helps to sustain ex-isting jobs.
For real economic growth, i.e. new industrial activ-ity and job creation, however, only true industrial renewal is sufficient. The incipient structures between biomass-produc-ing sectors and the chemicals industry could be a seedling of such ac-tivity. New companies are being formed that refine biomass into a form exploitable by the chemicals industry. The biggest threat to the emer-gence of more robust links between biomass producing sectors and chemicals are the long-lived, vested interests between the fossil raw ma-terials sector and the chemicals industry. Evidence from Europe’s larg-est chemical megacluster – the Antwerp-Ruhr-Rhein axis – is not en-couraging. The strength and low cost supply of incumbent fossil fuel industries is at this time relegating bio-based materials to a niche sub-stitute product, rather than displacing existing supply chains.
For an alternative, more sustainable structure to flourish and succeed, this strong link needs to be broken (see green cross in Fig. 3.10). This is a classic case for regulatory government intervention, justified by the environmentally negative externalities that entail the use of fossil raw materials.
The biggest threat to the emergence of robust links between biomass and chemicals are the vested inter-ests between fossil raw materials and chemicals
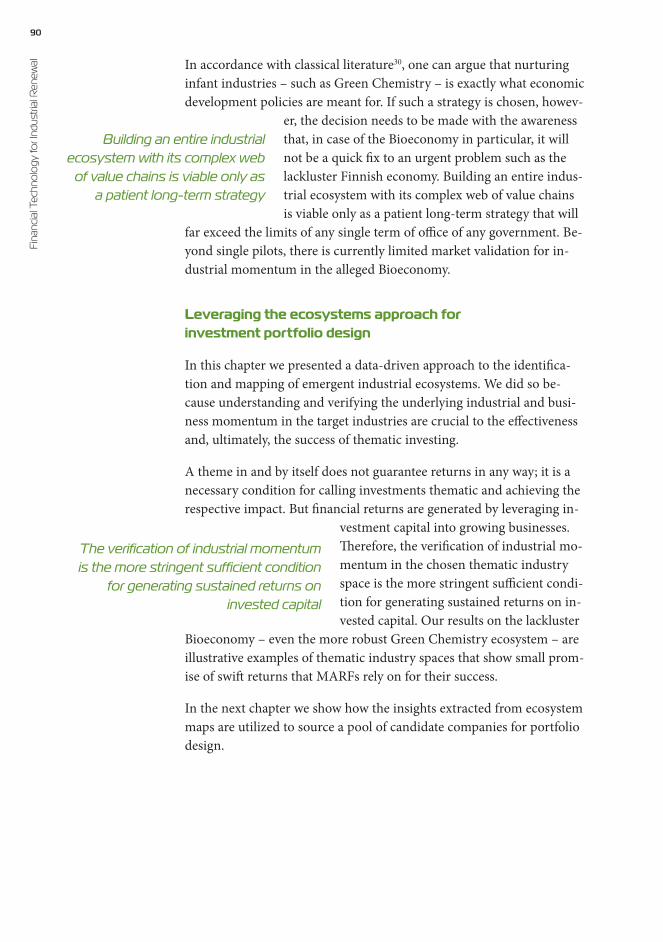
90Fi
nanc
ial T
echn
olo
gy fo
r Ind
ustri
al R
enew
al In accordance with classical literature30, one can argue that nurturing infant industries – such as Green Chemistry – is exactly what economic development policies are meant for. If such a strategy is chosen, howev-
er, the decision needs to be made with the awareness that, in case of the Bioeconomy in particular, it will not be a quick fix to an urgent problem such as the lackluster Finnish economy. Building an entire indus-trial ecosystem with its complex web of value chains is viable only as a patient long-term strategy that will
far exceed the limits of any single term of office of any government. Be-yond single pilots, there is currently limited market validation for in-dustrial momentum in the alleged Bioeconomy.
Leveraging the ecosystems approach for investment portfolio design
In this chapter we presented a data-driven approach to the identifica-tion and mapping of emergent industrial ecosystems. We did so be-cause understanding and verifying the underlying industrial and busi-ness momentum in the target industries are crucial to the effectiveness and, ultimately, the success of thematic investing.
A theme in and by itself does not guarantee returns in any way; it is a necessary condition for calling investments thematic and achieving the respective impact. But financial returns are generated by leveraging in-
vestment capital into growing businesses. Therefore, the verification of industrial mo-mentum in the chosen thematic industry space is the more stringent sufficient condi-tion for generating sustained returns on in-vested capital. Our results on the lackluster
Bioeconomy – even the more robust Green Chemistry ecosystem – are illustrative examples of thematic industry spaces that show small prom-ise of swift returns that MARFs rely on for their success.
In the next chapter we show how the insights extracted from ecosystem maps are utilized to source a pool of candidate companies for portfolio design.
Building an entire industrial ecosystem with its complex web
of value chains is viable only as a patient long-term strategy
The verification of industrial momentum is the more stringent sufficient condition
for generating sustained returns on invested capital
91 S
ourcing
References1 Tahvanainen, A.-J., Adriaens, P., Assanis, D. & Kotiranta, A. (2016). Growing Pains of
Industrial Renewal – Case Nordic Cleantech. ETLA Reports (forthcoming). ETLA, Helsinki.
2 Schulze, E.-D., Beck, B. & Müller-Hohenstein, K. (2005). Plant Ecology. Berlin: Springer.
3 Odum, E. P. (1971). Fundamentals of ecology, third edition, Saunders New York.4 Korhonen, J. (2001). Four ecosystem principles for an industrial ecosystem. Journal of
Cleaner Production Vol. 9, pp. 253–259.5 Pearce, D. & Turner, R. K. (1990). Economics of Natural Resources and the
Environment. Johns Hopkins University Press.6 Porter, M.E. (1998). Cluster and the new economics of competition. Harvard Business
Review. Nov-Dec 1998.7 Kotiranta, A., Kulvik, M., Maijanen, S., Tahvanainen, A.-J., Trieste, L., Turchetti, G. &
Tähtinen, M. (2015). Raiders Of Lost Value. ETLA B267, Helsinki, Taloustieto Oy.8 Porter, M.E. (1985). Competitive Advantage: Creating and Sustaining Superior
Performance. New York.: Simon and Schuster.9 Grandjean, M. (2014). “La connaissance est un réseau”. Les Cahiers du Numérique 10
(3): 37–54. doi:10.3166/lcn.10.3.37-54. Retrieved 2014-10-15.10 Bastian, M., Heymann, S. & Jacomy, M. (2009). Gephi: an open source software for
exploring and manipulat-ing networks. International AAAI Conference on Weblogs and Social Media.
11 www.iec.ch/smartgrid/background/explained.htm (last access Oct 12, 2015).12 ec.europa.eu/energy/en/topics/markets-and-consumers/smart-grids-and-meters (last
access Oct 12, 2015).13 www.smartgrid.gov/the_smart_grid/smart_grid.html (last access Oct 12, 2015).14 GTM Research (2011). Available at http://www.greentechmedia.com/images/wysiwyg/
research-blogs/HAN-Taxonomy.jpg (accessed 07052014).15 Soramäki, K. & Cook, S. (2016). Network Theory and Financial Risk.16 www.wri.org/blog/2015/01/who-needs-cars-smart-mobility-can-make-cities-
sustainable (last access Jun 2, 2016).17 newclimateeconomy.net/content/release-urban-sprawl-costs-us-economy-more-1-
trillion-year (last access Jun 2, 2016).18 blogs.worldbank.org/transport/smart-mobility-developing-cities (last access Jun 2,
2016).19 www.its.dot.gov/standards_strategic_plan/ (last access Jun 2, 2016).20 www.etsi.org/technologies-clusters/technologies/intelligent-transport (last access Jun
2, 2016).21 ec.europa.eu/transport/themes/its/index_en.htm
92Fi
nanc
ial T
echn
olo
gy fo
r Ind
ustri
al R
enew
al 22 www.tassinternational.com/safe-green-smart (last access Oct 22, 2015)23 www.wri.org/blog/2015/01/who-needs-cars-smart-mobility-can-make-cities-
sustainable (last access Jun 2, 2016).24 awsassets.panda.org/downloads/wwf_report___global_cleantech_innovation_
index_2014__final_.pdf25 TEM (2014). Government Strategy to Promote Cleantech Business in Finland.
Ministry of Employment and the Economy, Strategic Programme for the Cleantech Business. Helsinki, Finland. https://www.tem.fi/files/40668/Government_Strategy_to_Promote_Cleantech_Business_in_Finland.pdf (last access May 11, 2015).
26 team.finland.fi/en/team-finland-in-brief (last visited Jan 4, 2016).27 valtioneuvosto.fi/hallitusohjelman-toteutus/biotalous (Last visited Jun 2, 2016).28 TEM (2014). Sustainable growth from bioeconomy – The forest bioeconomy
perspective. www.bioeconomy.fi, Ministry for Employment and the Economy (TEM), Finland (Last access Jun 2, 2016).
29 The Bloomberg SPLC Database.30 Hamilton, A. (1790). Report on the Subject of Manufactures.

Company Assessment 4Value Capture and Investment Grade as Qualitative Filters
94Fi
nanc
ial T
echn
olo
gy fo
r Ind
ustri
al R
enew
al
Box 4.1 Industry classification codes
Industry classification codes are hierarchical numeric indicators, each of which represents a specific in-dustry. With the increasing length of the code – experts speak of the digit level – the specificity and the level of detail of the industry description increases as well.
To provide an example, in the NACE (European Classification of Economic Activities) code system the code 20 – a two-digit level code – represents industrial activity in Manufacture of chemicals and chemical products. Adding numbers to the code improves the level of detail: 20.1 – a three-digit level code – nar-rows the activity down to the Manufacture of basic chemicals, fertilizers and nitrogen compounds, plastics and synthetic rubber in primary forms. Adding yet another number, say 20.1.2, gives us the Manufacture of dyes and pigments. Depending on the classification system and the purpose of use, the interested analyst can go as far as to consider eight- or even ten-digit levels. Our maps have been drawn on the six-digit-level.
Many different classification systems exist with most of them being used by national statistics agencies and global organizations such as the UN or OECD. These include International Standard Industrial Clas-sification (ISIC), European Classification of Economic Activities (NACE), and North American Industry Classification System (NAICS). Some commercial systems exist as well. These include the Global Indus-try Classification Standard (GICS), which we use in this book for its compatibility with the Bloomberg SPLC database.
Value Capture and Investment Grade as Qualitative Filters
Financial network maps are the basis for targeted company sourcing
As a first important financial technology component of the project, the financial network mapping tool constitutes an efficient IT-based sourcing mechanism for financially-related industry sectors and com-panies in new and emerging industries. The argument that the market dynamics can be harnessed by algorithms and models has its limita-tions in that the markets and course of economies are not modelable scientific phenomena. Rather, they are the result of mass human behav-ior and strategic corporate decisions, which are never predictable with any precision. Hence, important turning points in markets (buy-side) and industry responses (sell-side) are never identified with accuracy
“We are in danger of valuing most highly those things we can measure most accurately,
which means that we are often precisely wrong rather than approximately right.
– Sir John Banham, Director General of the Confederation of British Industry
95 C
om
pany Assessm
ent
by experts and policymakers. However, this does not prevent temporal trends and financial structures from revealing themselves in time series of data that can be mapped as ‘snapshots in time’, for the purposes of deal sourcing. By integrating public company disclosures (lagging indi-cators), with data on venture and corporate strategic investments (lead-ing indicators), emerging industry forecasting has probative value in support of models and maps.
Once the structure of an emerging industry ecosystem has been es-tablished, and anchor as well as catalyst industries have been identi-fied using network theory principles, we are ready for company sourc-ing. As we learned in the previous chapter, the financial network map represents a relational database of financial transactions – or exposure – between companies that are representative of specific industry seg-ments. It further indicates where the largest relative retention of val-ue resides based on operational profit margins. As we will show short-ly, this information can be harnessed to source potential companies for inclusion in the Multi-Asset Renewal Fund (MARF) portfolio.
A key objective of the fund is to pool capital allocations to private firms engaged in specific thematic areas and geographical areas. It is thus im-portant to understand how companies in a region or country are rep-resented in the network map, and to identify which segments of the in-dustry ecosystem can be leveraged.
To accomplish this, we use the industry codes of the industry nodes ob-tained from the financial network map and search the respective coun-try’s company registry for representative firms active in these industries. Remember that, since the financial network map is cross-industrial, it would be very inefficient to source individual companies by reach-ing out to specific economic development regions. The corporate regis-try provides for a scalable sourcing mechanism of relevant companies. Even for a small country such as Finland, a database search in the Smart Grid, new mobility or Green Chemistry domains easily yields 1,000+ companies across all industries represented in a financial network map.
Prior to commencing company rating, it is necessary to perform a triage process. We need to boil down the vast number of companies to a man-ageable amount by applying a number of coarse filters. Negative selection criteria, resulting in removal from the target list, include the following:
1 Companies that are less than five years old AND show no reve-nue,
2 Companies that are no longer in business or have been acquired, and duplicates (e.g. doing business under a different name), and
3 Private subsidiaries of multinational or publicly traded firms
96Fi
nanc
ial T
echn
olo
gy fo
r Ind
ustri
al R
enew
al The rationale for this selection process is driven by our investment tar-gets. The illiquid asset class is comprised of growth capital and unse-cured debt, including illiquid credit and mezzanine debt. Companies that would qualify for this type of debt or equity investment would have to be post-revenue, experience market growth, may be engaged in internationalization strategies, and have received prior equity- or non-equity- investments. Given the already substantial availability of early stage equity investment capital in Finland provided by institutions such as Tekes, Tesi, and CleanTech Invest, as well as the availability of low cost debt to early stage firms served by Finnvera and Tekes, we de-cided that follow-on capital in the Finnish context was critical. More-over, given the proof-of-concept stage of the MARF, it was deemed prudent to exclude pre-revenue companies with significant technology and business model risks.
Value capture and investment grade analyses assess Finnish companies in emerging industry ecosystems
Once the public and private companies are selected and triaged from the industry registry, the feasibility and long-term viability of compa-nies to grow in emerging industries needs to be systematically evaluat-ed. Specifically, we ask the following questions:
1 How are companies positioned in the ecosystem in terms of value capture?
2 What type of financing is most viable for the companies to improve their position and grow?
We employ a suite of proprietary, data-driven assessment tools, brand-ed under KeyStone Compact®, and developed by Professors Peter Adri-aens and Timothy Faley at the University of Michigan, Ross School of Business. The development work of the rating methodology is based on studies of over 600 companies and serial entrepreneurs in the US. In its commercial application by the Keystone Compact Group Ltd, the tools are used to empower entrepreneurs and economic developers with business model and investment risk insights that are typically domain knowledge of sophisticated investors and management consultants.
The specific use of KeyStone Compact® for company assessment and in-vestment grade analyses is not exclusive. Most asset management ser-vice providers and portfolio advisors employ their own proprietary models to separate the wheat from the chaff. That being said, what mat-ters more to the construction of a Multi-Asset Renewal Fund is that – irrespective of the particular model or tool employed – you are able to (i) identify investable companies out of the large triaged set of initial candidates, and (ii) structure a process to allocate these companies to
97 C
om
pany Assessm
ent
the four asset classes in the MARF in accordance with their investment grade. KeyStone Compact® tools give us both of these functionalities.
The principle of the KeyStone Compact® suite of tools is to quantify tacit knowledge
The tool subjects companies to two analytical steps: Value capture anal-ysis and investment grade analysis. The risk profiling and ratings meth-odologies employed by the KeyStone Compact® tools are based on pub-licly available, non-financial risk metrics for private and public com-panies, using a proprietary algorithmic approach. The output is a pre-dictive analytical digest of the value capture potential and investment grade of a company given shifting industry structures, government pol-icies, and broader market events or trends. We will explore these fea-tures shortly.
How does this compare to the big ratings agencies? Moody’s, Standard & Poor’s, Morningstar or Fitch use risk rating methodologies that em-ploy fully disclosed algorithms to quantify qualitative and financial risk profiles of publicly traded companies. The risk rating is an outlook for a company or fund, driven by financials, government policies, and broader market events. It is primarily applied to public equities, cor-porate bonds, and various listed investment funds, and used to inform institutional and retail investors about the financial risk and return po-tential of their investments.
The KeyStone Compact® tool was originally conceived for emerging private companies. The developers sought to understand and codify what serial entrepreneurs had learned in the process of moving from company to company, and how they integrated that knowledge in the next venture. The output quantifies this tacit knowledge as a risk rating strategy. Let’s make this more tangible by way of an example.
Consider a mechanical engineer who joins a biotech startup as a product devel-oper and focuses on design and testing of a new piece of hardware focused on detection of nanoparticles in complex fluids. Her knowledge is constrained to technical and performance evaluation issues of the product. She moves on to the next company as head of product development, and is responsible for sup-ply chain management, materials and component sourcing. The knowledge, once steeped in hands-on product design, becomes more that of a systems integrator and resource manager. In the next startup she assumes a role as CEO or COO, and becomes responsible for company strategy or operations. However, because by now she understands the bottlenecks and workings in the industry, she leverages her know-how in product design and supply chain management into corporate strategy and tactics, or in organizing operational efficiency.
This information is cumulative, resulting in experience and what is of-ten referred to as ‘gut-feel’ decisions. What if this information could be organized and codified for entrepreneurs, investors, economic develop-

98Fi
nanc
ial T
echn
olo
gy fo
r Ind
ustri
al R
enew
al ers, or business managers? That is the basis of the KeyStone Compact® suite, which has since expanded with versions for small & medium en-terprises (SMEs) and large corporate entities. The basic tenets of the tools are the following:
1 The strength and investment grade of a company in a particular industry value system depends on the type of activity the com-pany is engaged in.
2 The value capture position depends on how the company’s capa-bilities and resources can be leveraged in the value chain, rela-tive to competition, partners, and buyer/supplier networks.
3 The investment grade of a company – or the profitability of a new line of business (LOB) for a corporation – depends on (i) the upside potential to the investor in the case of private growth companies, and the upside potential of committed corporate debt or equity capital in the case of public corporations or large private enterprises, and (ii) the speed and capital efficiency at which the company or the LOB can be scaled. The investment grade is explicitly and quantitatively tied into the management- and supply chain-driven value capture metrics.
The analysis is based on two sets of 36 dichotomous (yes/no) -ques-tions, the answers of which are algorithmically analyzed to produce a quantitative KeyStone Score® risk profile for a company, comparable to the Myers-Briggs personality test in its purpose. For those not familiar with this test, the Myers-Briggs personality typology is steeped in the theory of Carl Jung, and is structured around the two major attitudes or orientations of personality – extroversion and introversion, and four basic functions (thinking, feeling, sensing, and intuiting).
Demographics: Value distribution for companies across activities in a value chain is industry-dependent
Value Capture Investment Grade
Assets: Physical and intellectual/intangible assets under the company’s control
Product: The type of product, its supply chain, and market maturity affect profitability/scale considerations
Management: Background on founders, management and advisory board members
Sources of Funding: The sources of capital used to date indicate management, market and product risks
Structure and Partnerships: Corporate relationships necessary to bring the product/service to market
Industry Segment: The evolution of industry structure impacts product adoption and cost of goods
Type and External Drivers: Activity of the company and its dependence on policy and market drivers
Marketing and Sales: Comprehensive understanding of sales cycle, adoption rate, and revenue/cost structure
KeyStone Score®: Risk Rating Model for Emerging, Small, Medium, and Corporate Enterprises
Table 4.1Dimensions in the KeyStone Compact® business assessment model

99 C
om
pany Assessm
ent
The test is often dismissed as not being scientific and thus not testable. That is not its purpose. It is based on observations of people. Decades of observations. It really only tells you how you are wired to take in and process data, not your actual skills and abilities. We live in a world of information. The more we accumulate, the more we have to process. All the time. Every day. And in the process we accumulate tacit knowl-edge. Knowledge informs opinions, perspectives, and decisions. Expe-riences influence how we project, market, and identify ourselves.
Tacit knowledge informs how business leaders process and project in-formation, and make decisions for their company. Hence, a business assessment test based on codified tacit knowledge is a reasonable ap-proach to measure investment, strategic and operational elements of a company and its management.
Let us consider value capture first. This analysis focuses on whether the company can capture and retain value from its business, given its po-sition in the value system of the industry in which it seeks to innovate. The analysis focuses on mapping out the ‘differentiation of the firm’s own current capabilities’ against the ‘ease of acquisition of required complementary capabilities’ from the firm’s external environment, i.e. other companies and partners. The assessed capability dimensions in-clude the company’s tangible and intangible assets, the experience of both the management team and the advisory board, the structure of – and dependencies on – partnerships, and the firm’s level of integration on a continuum ranging from the supply of components to being a sys-tems integrator.
The risk rating profile for value capture is translated in a KeyStone Score®, that consists of four components: (i) Dependency on partners and third parties’ capabilities; (ii) Leveragability, i.e. the capability of a company to exploit its industry connections for promoting its offering and market access; (iii) Replicability of its core capabilities, both tangi-ble and intangible; and (iv) Connectivity, i.e. the quality of connections to the relevant industry and market segments.
The scores translate into coordinates on the results matrix (see Figure 4.1). Companies are placed into four value capture quadrants: strong high-growth business potential, unclear value capture, niche business potential, and weak business potential.
1 Companies showing strong business potential command spe-cialized and differentiated capabilities that mainly need generic complementary capabilities that are (relatively) easy to appropri-ate. These companies are expected to capture a lot of value from the ecosystem.
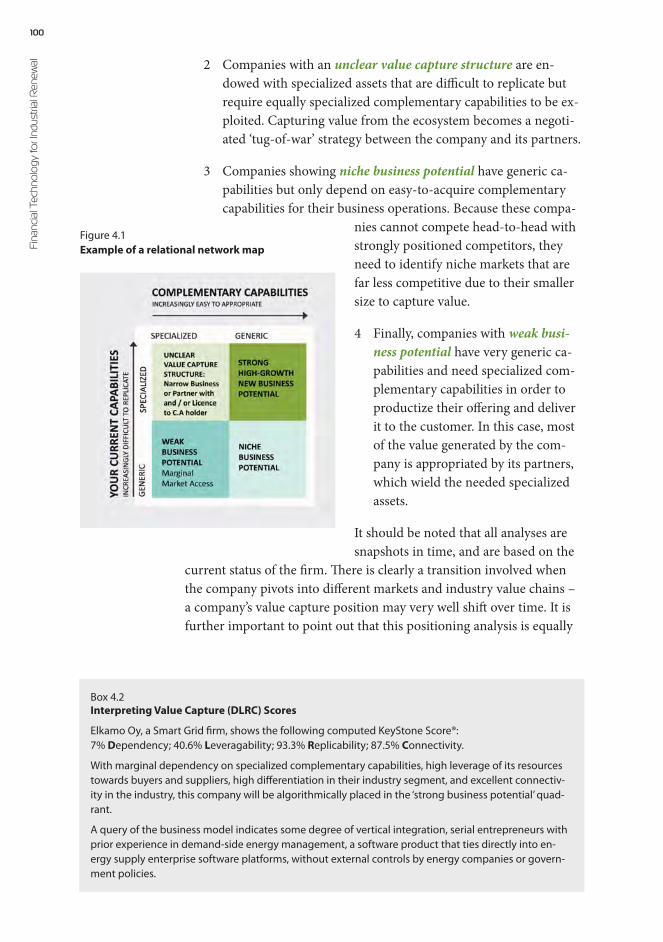
100Fi
nanc
ial T
echn
olo
gy fo
r Ind
ustri
al R
enew
al 2 Companies with an unclear value capture structure are en-dowed with specialized assets that are difficult to replicate but require equally specialized complementary capabilities to be ex-ploited. Capturing value from the ecosystem becomes a negoti-ated ‘tug-of-war’ strategy between the company and its partners.
3 Companies showing niche business potential have generic ca-pabilities but only depend on easy-to-acquire complementary capabilities for their business operations. Because these compa-
nies cannot compete head-to-head with strongly positioned competitors, they need to identify niche markets that are far less competitive due to their smaller size to capture value.
4 Finally, companies with weak busi-ness potential have very generic ca-pabilities and need specialized com-plementary capabilities in order to productize their offering and deliver it to the customer. In this case, most of the value generated by the com-pany is appropriated by its partners, which wield the needed specialized assets.
It should be noted that all analyses are snapshots in time, and are based on the
current status of the firm. There is clearly a transition involved when the company pivots into different markets and industry value chains – a company’s value capture position may very well shift over time. It is further important to point out that this positioning analysis is equally
4.1
Figure 4.1Example of a relational network map
Box 4.2 Interpreting Value Capture (DLRC) Scores
Elkamo Oy, a Smart Grid firm, shows the following computed KeyStone Score®: 7% Dependency; 40.6% Leveragability; 93.3% Replicability; 87.5% Connectivity.
With marginal dependency on specialized complementary capabilities, high leverage of its resources towards buyers and suppliers, high differentiation in their industry segment, and excellent connectiv-ity in the industry, this company will be algorithmically placed in the ‘strong business potential’ quad-rant.
A query of the business model indicates some degree of vertical integration, serial entrepreneurs with prior experience in demand-side energy management, a software product that ties directly into en-ergy supply enterprise software platforms, without external controls by energy companies or govern-ment policies.

101 C
om
pany Assessm
ent
relevant for startups and small and medium-sized enterprises (SMEs) seeking to reposition, as it is for large corporate enterprises considering to expand into new lines of business (LOB).
Investment grade analyses point to the most effective financial instruments to help companies grow
The positioning analysis provides an industry perspective on the com-pany – akin to strategic analysis: It answers questions of where, how, and to what extent a company can exert and maintain its differentiat-ed capabilities in a given industry or ecosystem? What strategy anal-ysis fails to provide is an indication of the investment risk associated with this company. The subsequent investment grade analysis focuses on what type of capital – given their position for value capture – would be most efficiently deployed to build and scale a business. The analysis takes into account whether the scaling is achieved through market or capability adjacenciesa.
To achieve this analysis, the KeyStone Compact® assessment allows for mapping the ‘upside potential’ of the business against the ‘time and capital required to scale’ that potential. This results in a profile consist-ing of four investment grade indices: (i) Diversification of market and capability adjacencies, which indicates whether the company has iden-tified alternative markets and parallel opportunities for its capabilities in the new ecosystem, (ii) Profitability in terms of explicit and implic-it costs and margins, (iii) Scalability of the business model in terms of revenue generation and market access, and (iv) Capital Efficiency, i.e. operational capital efficiency and the relative magnitude of additional capital necessary to drive continued growth.
The investment grade scores translate into coordinates that can be cate-gorized into four matrix quadrants (Figure 4.2, left panel):
1 Traditional equity investable companies show potential for sig-nificant upside relative to the short investment time horizon, and a higher capital investment rate required to scale and grow the business. The rate is important because it indicates how quickly a company can capture market share, relative to the in-vestment capital required. Capital efficiency is often bandied around in this context. However, it does not mean that a tra-ditional equity investable company necessarily implies lower amounts of investment capital relative to other investments.
a A market adjacency is a market in which a company can sell a similar product or service. Typically, market adjacencies follow the adoption curve, from early adopters to 'the laggards' (Moore, 19911). A capability adjacency, on the other hand, is a new market for a company that does not leverage its core capabilities. Thus, the company needs to develop (internally) or acquire (externally) products and/or services it currently does not have.
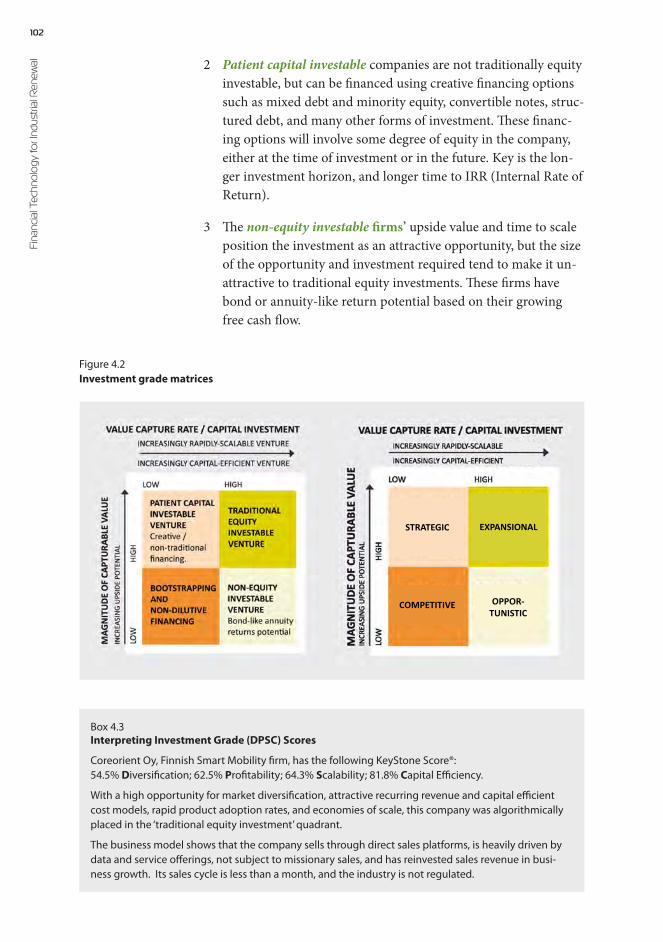
102Fi
nanc
ial T
echn
olo
gy fo
r Ind
ustri
al R
enew
al 2 Patient capital investable companies are not traditionally equity investable, but can be financed using creative financing options such as mixed debt and minority equity, convertible notes, struc-tured debt, and many other forms of investment. These financ-ing options will involve some degree of equity in the company, either at the time of investment or in the future. Key is the lon-ger investment horizon, and longer time to IRR (Internal Rate of Return).
3 The non‐equity investable firms’ upside value and time to scale position the investment as an attractive opportunity, but the size of the opportunity and investment required tend to make it un-attractive to traditional equity investments. These firms have bond or annuity‐like return potential based on their growing free cash flow.
Box 4.3 Interpreting Investment Grade (DPSC) Scores
Coreorient Oy, Finnish Smart Mobility firm, has the following KeyStone Score®: 54.5% Diversification; 62.5% Profitability; 64.3% Scalability; 81.8% Capital Efficiency.
With a high opportunity for market diversification, attractive recurring revenue and capital efficient cost models, rapid product adoption rates, and economies of scale, this company was algorithmically placed in the ‘traditional equity investment’ quadrant.
The business model shows that the company sells through direct sales platforms, is heavily driven by data and service offerings, not subject to missionary sales, and has reinvested sales revenue in busi-ness growth. Its sales cycle is less than a month, and the industry is not regulated.
COMPETITIVE
STRATEGIC EXPANSIONAL
OPPOR-TUNISTIC
4.2Figure 4.2Investment grade matrices
103 C
om
pany Assessm
ent
4 Finally, companies that are currently not attractive to external investors have neither a large upside potential, nor the ability to scale rapidly. Their risk and return profile matches bootstrapped or non-dilutive financing (grants, subsidized loans). Any of these companies can shift from their current position to a more attractive investment grade by way of strategic and tactical piv-ots in their business model.
Investment grade analysis allows corporate enterprises to assess the strategic viability of a new LOB in a changing business environment
How does the KeyStone Compact® assessment framework apply to large corporations? Lessons can be learned from the playbook of mergers and acquisitions (M&A) and corporate strategic investments. Large pri-vate enterprises differ from startups and most SMEs in that they are ac-cessible only by large private equity (PE) firms and private lenders that offer acquisition financing, bridge loans, and recapitalizations intend-ed to position companies for future growth. On the other hand, invest-ments in large public enterprises are restricted to shares and bonds on financial markets, unless buyouts are considered.
Hence, the investment grade analysis in the case of large corporations is not applied to provide information on the compatibility of the busi-ness with certain types of financing, but rather to reveal how attractive the underlying market opportunity – here the Smart Grid space – is as a possible new line of business (LOB) for the company. In the case of an acquisition, the decision is typically based on product or market syn-ergies between the buyer and the seller’s offering, and ultimately a pos-itive impact on the share price or other financial metrics, either by in-creasing market share or revenue enhancement from new LOBs in pre-viously untapped markets.
Corporate investment grade analysis takes the view through a strategic investment lens
That being said, the same principles apply to the value capture and in-vestment grade analysis, and the interpretation of the two dimensions that define the matrices. In the case of value capture, the complemen-tary capabilities are those required to access a new market or build out a new LOB. In the investment grade analysis, the Y-axis denotes the maximum upside potential that companies can exploit given their cur-rent investment strategies, while the X axis measures the speed at which the potential can be exploited and scaled.
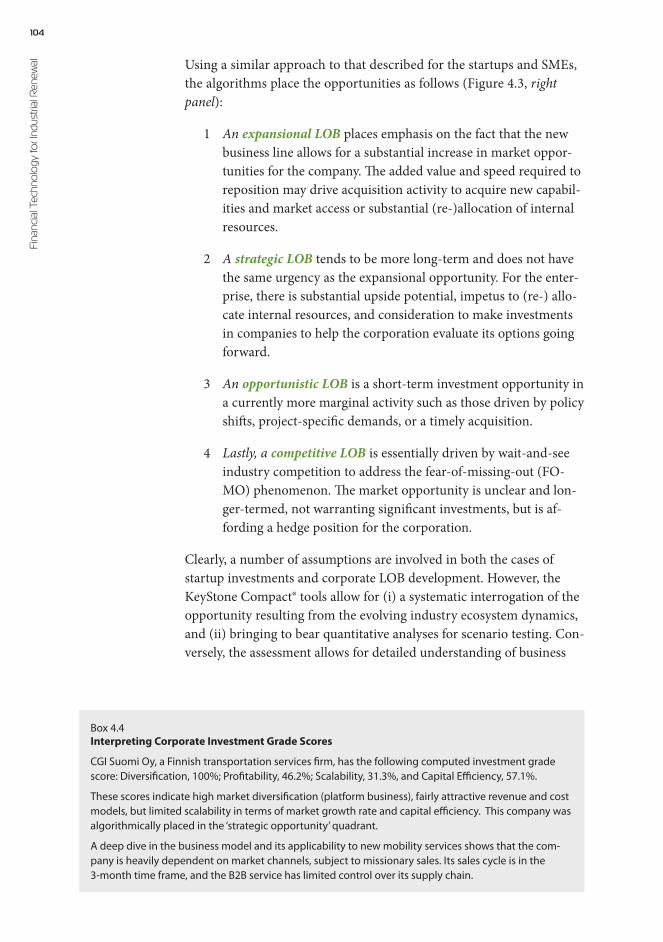
104Fi
nanc
ial T
echn
olo
gy fo
r Ind
ustri
al R
enew
al Using a similar approach to that described for the startups and SMEs, the algorithms place the opportunities as follows (Figure 4.3, right panel):
1 An expansional LOB places emphasis on the fact that the new business line allows for a substantial increase in market oppor-tunities for the company. The added value and speed required to reposition may drive acquisition activity to acquire new capabil-ities and market access or substantial (re-)allocation of internal resources.
2 A strategic LOB tends to be more long-term and does not have the same urgency as the expansional opportunity. For the enter-prise, there is substantial upside potential, impetus to (re-) allo-cate internal resources, and consideration to make investments in companies to help the corporation evaluate its options going forward.
3 An opportunistic LOB is a short-term investment opportunity in a currently more marginal activity such as those driven by policy shifts, project-specific demands, or a timely acquisition.
4 Lastly, a competitive LOB is essentially driven by wait-and-see industry competition to address the fear-of-missing-out (FO-MO) phenomenon. The market opportunity is unclear and lon-ger-termed, not warranting significant investments, but is af-fording a hedge position for the corporation.
Clearly, a number of assumptions are involved in both the cases of startup investments and corporate LOB development. However, the KeyStone Compact® tools allow for (i) a systematic interrogation of the opportunity resulting from the evolving industry ecosystem dynamics, and (ii) bringing to bear quantitative analyses for scenario testing. Con-versely, the assessment allows for detailed understanding of business
Box 4.4 Interpreting Corporate Investment Grade Scores
CGI Suomi Oy, a Finnish transportation services firm, has the following computed investment grade score: Diversification, 100%; Profitability, 46.2%; Scalability, 31.3%, and Capital Efficiency, 57.1%.
These scores indicate high market diversification (platform business), fairly attractive revenue and cost models, but limited scalability in terms of market growth rate and capital efficiency. This company was algorithmically placed in the ‘strategic opportunity’ quadrant.
A deep dive in the business model and its applicability to new mobility services shows that the com-pany is heavily dependent on market channels, subject to missionary sales. Its sales cycle is in the 3-month time frame, and the B2B service has limited control over its supply chain.
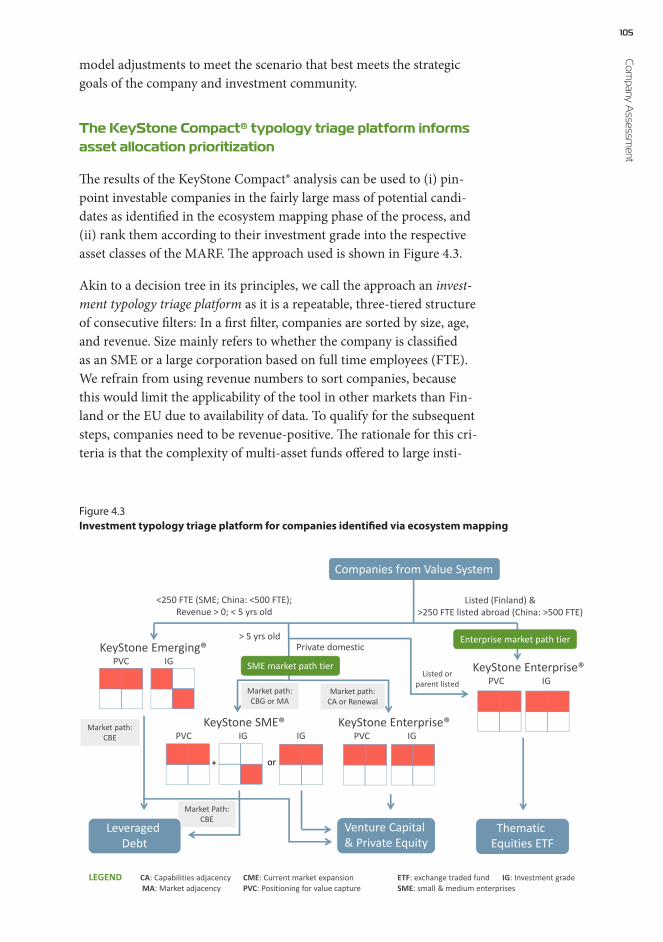
105 C
om
pany Assessm
ent
Market Path:CBE
Companies from Value System
KeyStone Emerging®PVC IG
KeyStone SME® PVC IG IG
KeyStone Enterprise®PVC IG
Listed (Finland) & >250 FTE listed abroad (China: >500 FTE)
<250 FTE (SME; China: <500 FTE); Revenue > 0; < 5 yrs old
Private domestic> 5 yrs old
Thematic Equities ETF
Venture Capital & Private Equity
Leveraged Debt
or
Listed or parent listed
KeyStone Enterprise®PVC IG
SME market path tier
+
Market path:CA or Renewal
Market path:CBG or MA
Market path:CBE
Enterprise market path tier
LEGEND CA: Capabilities adjacency CME: Current market expansion ETF: exchange traded fund IG: Investment grade MA: Market adjacency PVC: Positioning for value capture SME: small & medium enterprises
Market path:CBE
4.3
model adjustments to meet the scenario that best meets the strategic goals of the company and investment community.
The KeyStone Compact® typology triage platform informs asset allocation prioritization
The results of the KeyStone Compact® analysis can be used to (i) pin-point investable companies in the fairly large mass of potential candi-dates as identified in the ecosystem mapping phase of the process, and (ii) rank them according to their investment grade into the respective asset classes of the MARF. The approach used is shown in Figure 4.3.
Akin to a decision tree in its principles, we call the approach an invest-ment typology triage platform as it is a repeatable, three-tiered structure of consecutive filters: In a first filter, companies are sorted by size, age, and revenue. Size mainly refers to whether the company is classified as an SME or a large corporation based on full time employees (FTE). We refrain from using revenue numbers to sort companies, because this would limit the applicability of the tool in other markets than Fin-land or the EU due to availability of data. To qualify for the subsequent steps, companies need to be revenue-positive. The rationale for this cri-teria is that the complexity of multi-asset funds offered to large insti-
Figure 4.3Investment typology triage platform for companies identified via ecosystem mapping

106Fi
nanc
ial T
echn
olo
gy fo
r Ind
ustri
al R
enew
al tutional investors necessitates limitation of high failure rates common in early stage companies with significant technology, management and market risk. In addition, there tend to be a range of other (low-cost) fi-nancing options available for this type of company, through Tekes, Fin-nvera, and other economic development funding.
The second filter considers the market path chosen by a company. The market path reflects the strategic decision made by the company on how it intends to leverage its current differentiation and position of strength for future growth. We consider four alternative paths:
1 Current business expansion (CBE). This refers to a company for which entry in the emerging industry value system is an ex-pansion of its current market. No new technology or business models need to be developed. It is a matter of scale for a prov-en product and market, and hence the market risk tends to be marginal. Typical companies are those, for instance, that expand sales of new energy storage systems for residential applications from a city to an entire region.
2 Market adjacency (MA). In this strategic case, the emerging business opportunity is a new market a company can address using minor modifications of its technology, products, and pro-cesses. The company leverages its current infrastructure and know how to expand into new markets similar to its current market. The market risk to the company is incremental. Illustra-tive examples are companies that develop smart meters for home energy management market, and are expanding in the commer-cial building market.
3 Capability adjacency (CA). Exploiting capability adjacencies is a market strategy, the implementation of which requires the ac-quisition of new technologies and capabilities to address mar-kets that are new to the firm. The company is still operating in the same industry, but the position in the value chain may have shifted, e.g. from design activities to manufacturing activities. Examples include companies that shift from producing geoposi-tioning hardware to mapping features, a data-driven activity.
4 Renewal strategy. This strategic re-positioning is arguably the riskiest move for a company, because it needs to build out en-tirely new capabilities, supply chain partnerships, and product development processes in a new industry and market. The com-pany can – to some extent – leverage management experience and other lessons learned from its prior markets and activities. Consider for example a company that shifts from a data services
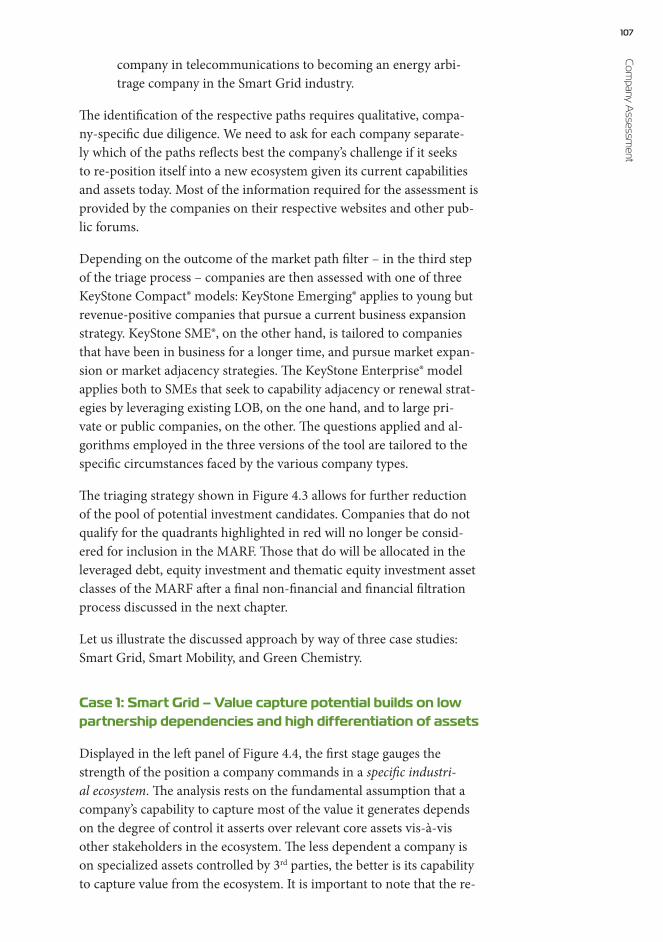
107 C
om
pany Assessm
ent
company in telecommunications to becoming an energy arbi-trage company in the Smart Grid industry.
The identification of the respective paths requires qualitative, compa-ny-specific due diligence. We need to ask for each company separate-ly which of the paths reflects best the company’s challenge if it seeks to re-position itself into a new ecosystem given its current capabilities and assets today. Most of the information required for the assessment is provided by the companies on their respective websites and other pub-lic forums.
Depending on the outcome of the market path filter – in the third step of the triage process – companies are then assessed with one of three KeyStone Compact® models: KeyStone Emerging® applies to young but revenue-positive companies that pursue a current business expansion strategy. KeyStone SME®, on the other hand, is tailored to companies that have been in business for a longer time, and pursue market expan-sion or market adjacency strategies. The KeyStone Enterprise® model applies both to SMEs that seek to capability adjacency or renewal strat-egies by leveraging existing LOB, on the one hand, and to large pri-vate or public companies, on the other. The questions applied and al-gorithms employed in the three versions of the tool are tailored to the specific circumstances faced by the various company types.
The triaging strategy shown in Figure 4.3 allows for further reduction of the pool of potential investment candidates. Companies that do not qualify for the quadrants highlighted in red will no longer be consid-ered for inclusion in the MARF. Those that do will be allocated in the leveraged debt, equity investment and thematic equity investment asset classes of the MARF after a final non-financial and financial filtration process discussed in the next chapter.
Let us illustrate the discussed approach by way of three case studies: Smart Grid, Smart Mobility, and Green Chemistry.
Case 1: Smart Grid – Value capture potential builds on low partnership dependencies and high differentiation of assets
Displayed in the left panel of Figure 4.4, the first stage gauges the strength of the position a company commands in a specific industri-al ecosystem. The analysis rests on the fundamental assumption that a company’s capability to capture most of the value it generates depends on the degree of control it asserts over relevant core assets vis-à-vis other stakeholders in the ecosystem. The less dependent a company is on specialized assets controlled by 3rd parties, the better is its capability to capture value from the ecosystem. It is important to note that the re-
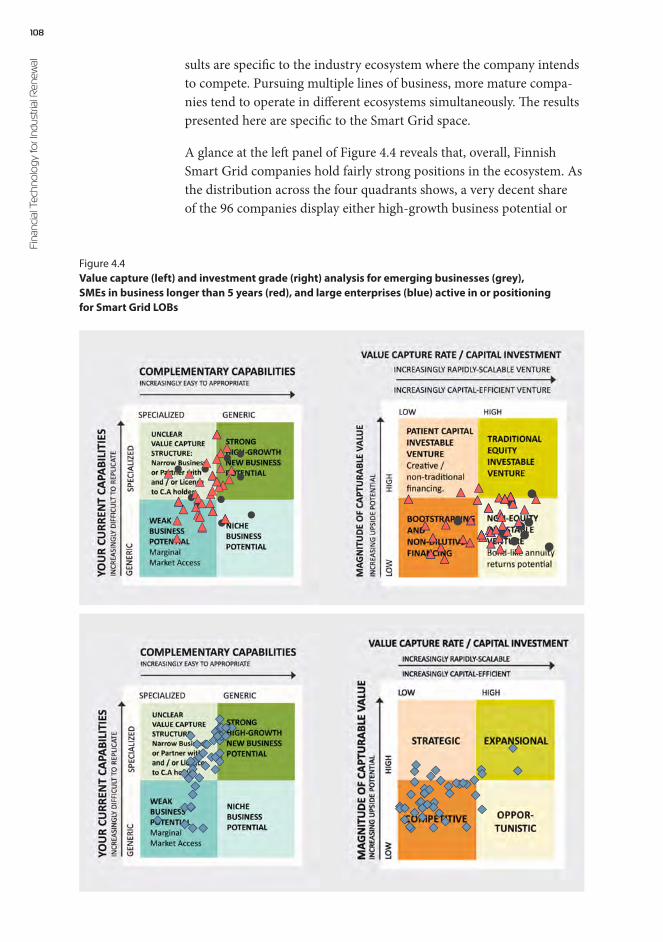
108Fi
nanc
ial T
echn
olo
gy fo
r Ind
ustri
al R
enew
al sults are specific to the industry ecosystem where the company intends to compete. Pursuing multiple lines of business, more mature compa-nies tend to operate in different ecosystems simultaneously. The results presented here are specific to the Smart Grid space.
A glance at the left panel of Figure 4.4 reveals that, overall, Finnish Smart Grid companies hold fairly strong positions in the ecosystem. As the distribution across the four quadrants shows, a very decent share of the 96 companies display either high-growth business potential or
4.4a
Figure 4.4Value capture (left) and investment grade (right) analysis for emerging businesses (grey), SMEs in business longer than 5 years (red), and large enterprises (blue) active in or positioning for Smart Grid LOBs
4.4b

109 C
om
pany Assessm
ent
compete via beneficial partnering and licensing strategies. Differenc-es between company types as defined by size are hard to discern, i.e. neither of the two company types consistently outperforms the other based on the KeyStone metrics. Large enterprises may have a predom-inance in the partnership segment, common to companies with com-plex supply chains and cross-border business activities.
The results presented in Figure 4.5 corroborate the visual observation: the four drivers that determine a company’s value capture potential – dependency on third parties, leveragability of 3rd party assets, replica-bility of the company’s capabilities and the connectivity of the compa-ny to the relevant ecosystem – do not show statistically significantb dif-ferences between startups, SMEs and large enterprises. That being said, the figure does provide insights as to which of the four drivers specifi-cally contribute to the fairly strong positioning of Finnish Smart Grid companies. Two of them stand out in particular:
The first is a generally low dependency on third party assets. This im-plies that the companies exercise control over the relevant core assets – both tangible assets in the form of production facilities, information systems and infrastructure as well as intangible assets such as human capital, trademarks, and patents – needed to create their offering. The companies tend to be either highly integrated or serve as system in-tegrators to generic component suppliers, in which case they have a broad enough choice of partners to avoid lock-in. In parallel, the de-pendency on strong partners for market access is similarly low, which helps to appropriate a larger share of value from end-user markets. The decent overall connectivity to the ecosystem, a separate driver of value capture in itself, further promotes the companies’ freedom to operate in the emerging industry space.
The second driver is the difficulty of competitors and partners to repli-cate the companies’ capabilities in generating value. The positive results with regard to replicability speak of both strong intellectual property protection strategies as well as the presence of experienced and capable management teams that can leverage their accrued skills in navigating the emerging business ecosystem. This human capital is tacit in nature and therefore hard to copy or imitate.
Leveragability is the unfortunate chink in the armor
Of the four drivers presented in the left panel of Figure 4.5, leveraga-bility clearly is the weak spot of Finnish Smart Grid companies. While dependency measures the strength of influence that external parties ex-
b The results shown in Fig. 4.4 are t-tested arithmetic averages of the respective Keystone Compact™ metrics.
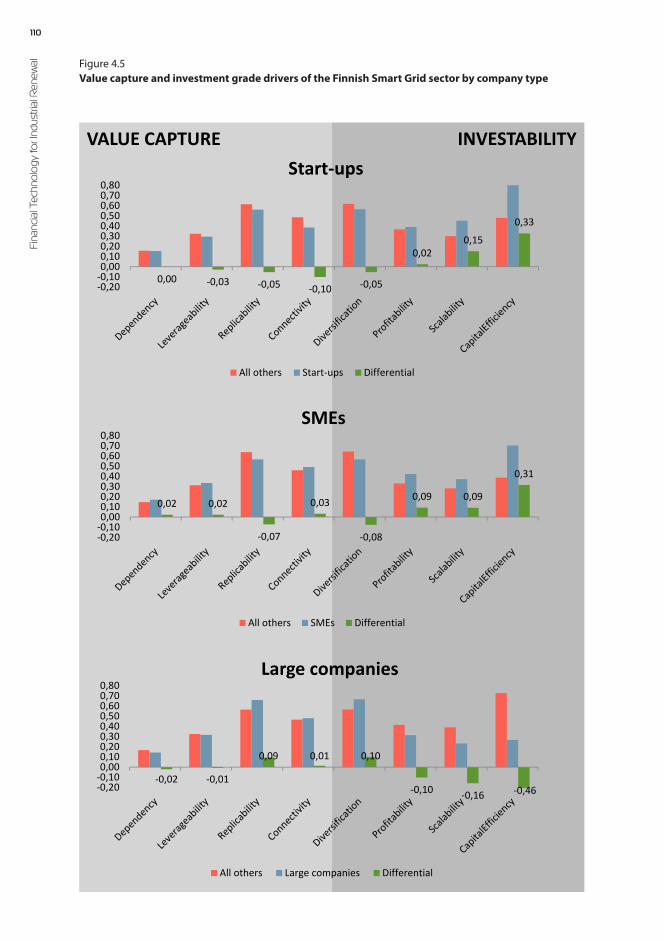
110Fi
nanc
ial T
echn
olo
gy fo
r Ind
ustri
al R
enew
al
INVESTABILITYVALUE CAPTURE
0,00 -0,03 -0,05 -0,10 -0,05
0,020,15
0,33
-0,20-0,100,000,100,200,300,400,500,600,700,80
Start-ups
All others Start-ups Differential
0,02 0,02
-0,07
0,03
-0,08
0,09 0,09
0,31
-0,20-0,100,000,100,200,300,400,500,600,700,80
SMEs
All others SMEs Differential
-0,02 -0,01
0,09 0,01 0,10
-0,10 -0,16 -0,46-0,20-0,100,000,100,200,300,400,500,600,700,80
Large companies
All others Large companies Differential
4.5
Figure 4.5Value capture and investment grade drivers of the Finnish Smart Grid sector by company type

111 C
om
pany Assessm
ent
ercise over a company, leveragability measures a company’s ability to exploit its assets and partners to its own advantage. This includes the tangibility of core partnerships via contracts, joint ventures and oth-er agreements but also the fierceness of the competitive environment and the degree of concentration in the industry, i.e. the market struc-ture. Tough competition, an oligopolistic mar-ket structure and frail partnerships all gnaw at overall leveragability of company assets.
While the relatively weak leveragability does not seem to critically affect overall value capture potential, it has ma-jor indirect impact on the investment grade of the companies, as will be shown shortly. In particular, it has a strong inhibiting effect on the val-ue that companies can normally reap from the diversification of their capabilities and markets.
Low expected profitability and the mediating effect of low leveragability negatively impact the firms’ upside potential
The results for investment grade – see the right panel of Figure 4.4 – provide for striking insights. Across the board, irrespective of com-pany type, the upside potential seems to be limited. Very few startups and SMEs show traditional equity investment grade. The great majori-ty of companies finds itself in the lower two quadrants of the Keystone Compact® investment grade matrix. Supported by the results shown in the right panel of Figure 4.4, two main drivers can be identified for the phenomenon.
The first driver is a relatively low expected profitability c. The expect-
ed profitability of companies depends on a variety factors. These in-clude the competitive structure of the targeted markets, their respective growth rates, the degree of commoditization of the companies’ offering, expected margins typical for the targeted industry, the degree of sepa-ration from the end customer, the degree of recurrence in the revenue model and, finally, the degree of control over the sales channels.
Given these factors, what can companies do to improve their prospec-tive profitability? Many of the listed factors relate to the competitive structures, growth rates and average profitability of the respective mar-kets. These are factors that are in part external to the company and its sphere of influence. They represent market-driven systemic risks. There are two options that any company has when faced with unfavorable market conditions.
c For interpretation’s sake, it is crucial to note at this point that profitability here is not measured based on past or cur-rent performance of the assessed companies. It is an approximation of the average performance of already estab-lished companies running a similar business model in the industry sector that the focal company strives to enter. One could say, profitability here reflects the potential upside that a given company can expect to tap into if the entry into the targeted ecosystem is successful.
Tough competition, an oligopolistic market structure and frail partnerships all gnaw at overall leveragability
112Fi
nanc
ial T
echn
olo
gy fo
r Ind
ustri
al R
enew
al The first is to seek out new markets with more favorable conditions for leverage and value capture. However, pivoting to new, less competi-tive and less concentrated markets with higher average profitability is a daunting task for any organization with a relatively fixed set of often market-specific skills and networks. To use a somewhat loose allegory for support, it is difficult for a lawyer to become a medical doctor be-cause the required assets and skills are quite different and hard to adopt in a strategic move. Hence, companies will attempt to ‘platformize’ (see insert) their offerings to attract broader applicability and easier pivot-ing to new markets, even if this requires setting up new partnerships to access those markets.
The second option is to adapt business models. This could encompass (a) new value chain strategies that emphasize gaining control over and
shortening the relevant channels to the targeted mar-kets, and (b) re-designed business models with a focus on creating multiple and recurring revenue streams.
Amongst many options, new value chain strategies can take advantage of the progress made in digi-
talized technologies, for instance, that help to move from physical dis-tribution networks to generic online distribution platforms. These in-herently have global reach and are not based on exclusive and captive distribution contracts.
As for new business models, moving from classic make-and-sell models to anything-as-a-service (XaaS) models – a manifestation of servitiza-tion – has been somewhat of a trend, which provides for recurrent sales revenues in conventional and emerging industries alike. A XaaS -ap-proach brings particular benefits to manufacturing-driven businesses – such as component or sub-system manufacturers – that produce long-lived capital goods. In these businesses, re-sale cycles are long and, therefore, sales occur sporadically. A component-as-a-service model would provide for valuable customer lock-in effects and generate steady revenue streams, as well as benefit the capital efficiency of the opera-tions. For the customers, on the other hand, the benefit is in not having to make expensive investments into capital goods that will pose a cap-
Box 4.5 Platform business strategy
This is a business model approach that creates value by facilitating exchanges between two or more consumers and producers. Successful platforms facilitate exchanges by reducing transaction costs and/or by enabling externalized innovation. As a byproduct, platforms also create ecosystems and leverage their inherent network effects. With the advent of connected technology, these ecosystems enable platforms to scale in ways that traditional businesses cannot.
New value chain strategies can take advantage of the progress made in digitalized technologies

113 C
om
pany Assessm
ent
ital risk to the liquidity of the business and have a major detrimental impact on key financial metrics such as Return on Capital Employed (ROCE).
The second driver behind the marginal upside potential (Figure 4.4, right panel) is the previously discussed inhibiting effect that the seem-ingly low leveragability of the companies has on the benefits they could reap from their otherwise high degree of market diversification (Fig. 4.5, right panel). Besides measuring the maturity of the industry – here Smart Grid – and the control that large enter-prises have over it, the diversification metric indicates whether companies have identified opportunities to exploit their offering and capabilities on alterna-tive, adjacent markets. These could serve as addition-al growth opportunities either by re-positioning the entire business or through additional lines of business. As asserted by the results, the companies in the Finnish Smart Grid industry fare reasonably well in this dimension.
However, their weak ability to leverage proprietary asset strength against other stakeholders – such as suppliers, customers, and compet-itors – in their industry ecosystem (Fig. 4.5, left panel), significantly hamper their opportunity to take advantage of valuable market diver-sification strategies. Leverage is the benevolent twin of malevolent de-pendency. Companies should avoid strong dependencies on partners to avoid being marginalized or commoditized, but a weak ability to lever-age their strengths for growth is equally detrimental to business. Often, this is the result from competition on price, rather than on value. It is a deterrent to reaching maximum potential, which is captured in the weak results for investment grade in Figure 4.5 (right panel).
Large enterprises exhibit a very cautious approach to enter the Smart Grid space
A final, yet very telling, insight is that large enterprises fare particularly poorly in terms of how they view the Smart Grid opportunity. With few exceptions, the cluster of large enterprises with LOB’s positioned for
Box 4.6 Elisa Oyj and Eltel Networks Oyj
Among all Finnish enterprises, these firms stand out for their expansional perspective on the Smart Grid opportunity. Providing network telecommunications integration, and smart network infrastruc-ture, these companies have invested in platforms and partnerships to grow a new LOB in the Smart Grid industry ecosystem. Though other Finnish companies such as Nokia, Intstream, and Liaison Tech-nologies (all in the data processing, monitoring and management industries) are active in the space as well, their engagement in the Smart Grid is more long-term.
A weak ability to leverage their strengths for growth is equally detrimental to business
114Fi
nanc
ial T
echn
olo
gy fo
r Ind
ustri
al R
enew
al Smart Grid locates mostly in the lower left quadrant of the Keystone Compact™ investment grade matrix (Figure 4.4). Hence, the Smart Grid opportunity is viewed as being either short-term ‘opportunistic’ or lon-ger-term ‘competitive’. In the case of eight companies, the Smart Grid market is viewed as being ‘strategic’ or ‘expansional’.
As a brief review, the upper-right quadrant represents high-potential opportunities that enterprises can turn into value relatively quickly, using strategic acquisitions to acquire new market share, in-licensing and other expansional strategies. The upper-left quadrant represents high-potential opportunities that can be captured via long-term proj-ects and strategic acquisitions to acquire new skills or technologies.
The lower right quadrant is the space of opportunities that will be pur-sued for more opportunistic reasons: the overall value of the opportu-nity may not be particularly high, but it is quick to exploit and will not require large investments, and are often internal ones. Finally, the lower left quadrant, the space in which most Finnish Smart Grid enterprises are positioned, defines prospects that do not show particularly high up-side potential nor are quick to be exploited; the opportunities represent
wait-and-see hedging opportunities and not explored for direct significant financial gain.
The obvious question is, why are Finnish large enter-prises with activities in the Smart Grid space overly conservative? Is the reason capital resource conserva-
tion? Or risk aversion in an uncertain market environment? Perhaps they are cautious to sound out a new opportunity space, the economic prospects of which still remain somewhat vague?
A more tangible indication of possible causes is provided in Figure 4.5 (right panel). The companies’ LOBs score extremely weakly in both scalability and capital efficiency when benchmarked against their small-er counterparts. Average capital efficiency, in particular, is extraordi-narily low. These two drivers determine the speed at which any given opportunity can be exploited and scaled, and push the majority of en-terprises into the lower left quadrant.
To extract insights from the findings, we need to break down the driv-ers in more detail. A low scalability score is indicative of a business model with long sales cycles and limited opportunity for value cap-ture through diverse revenue models. In addition, the degree of syner-gy of the pursued business with the enterprise’s other lines of business, the degree of commoditization of its products and services, the length of the typical sales cycle from sales lead to conversion, the ease of inte-grating the product or service into the customers’ processes, the depen-
The companies’ LOBs score extremely weakly in both
scalability and capital efficiency
115 C
om
pany Assessm
ent
dency on external sales channels, the maturity and concentration of the target market as well as the degree of regulation in the target market af-fect scalability.
Low capital efficiency, in turn, is driven by high investment require-ments in physical assets for growing revenue streams, a focus on the production of physical products, low economies of scale in the produc-tion, and a low asset turnover rate typical for compa-nies operating in the targeted industry segment.
In light of the findings we can then argue that Finn-ish enterprises are seemingly intent on entering the Smart Grid space with a choice of conventional strat-egies, relying on practices and models they know best from their lega-cy businesses: manufacturing-centric, capital intensive business models combined with slow-cycling sales models that are well suited for ma-ture capital good markets, but are too sluggish and inflexible for cap-turing value in the fast growing, data- and analytics-driven smart layers of the emerging Smart Grid ecosystem.
Our earlier work2 shows that manufacturing businesses are the clear center of gravity in the Finnish Cleantech space, even more so than in the domestic industry in general. In the gold rush era of digitalization, a heavily manufacturing- and engineering focused company base can quickly become the ball-and-chain to the mid-to-long-term growth of the industry. Hanging on to the legacy comes with the risk of being pushed to the proverbial periphery of the growing Smart Grid ecosystem. The ecosystem map in the previous chapter provides tangible evidence of this trend: Telcos as well as software and data analytics companies currently fight for dominance over the de-mand-response space, an area in which power utilities could reign su-perior given their control over the most central of physical assets, namely the power generation and transmission infrastructure.
The findings provide for valuable insights that we can use to design a strategic roadmap for the Finnish Smart Grid sector. Investors, compa-ny executives and economic developers can draw implications from the presented results. For a clearer focus on the Multi-Asset Renewal Fund and its design process, however, we defer to a detailed discussion of strategic roadmaps in the concluding chapter of the book.
Finnish enterprises are seemingly intent on entering the Smart Grid space with a choice of conven-tional strategies
A heavily manufacturing- and engineering focused company base can quickly become the ball-and-chain to the mid-to-long-term growth of the industry
116Fi
nanc
ial T
echn
olo
gy fo
r Ind
ustri
al R
enew
al Case study 2: Smart Mobility – Capital intensive business models anchor excellent value capture position of large companies
How well do Smart Mobility businesses fare in the value capture and investment grade analyses? Are they able to take advantage of the emerging opportunities in the ecosystem?
Contrasting the results of value capture and investment grade analyses of Smart Mobility to those from the Smart Grid industry provides for interesting insights (Figure 4.6). Unlike in the Smart Grid ecosystem, there seem to be fairly pronounced differences in value capture capabil-
ities between large incumbent companies and their small-er competitors. Startups and SMEs are predominantly lo-cated in the weak value capture and unclear value capture quadrants typical for early ventures with limited struc-ture and market access opportunities, as well as technolo-
gy-heavy firms with significant supply-chain dependencies. Given that the KeyStone Compact® assessment is a snapshot in time, it indicates the relative immaturity of this sector.
Enterprises are clearly better positioned to exploit Smart Mobility op-portunities. The majority, if not all, of the assessed enterprises reside in the upper quadrants of the value capture matrix (left panel), indicat-ing that they command over rather specialized, leveragable capabilities for the Smart Mobility business. Indeed, Figure 4.7 indicates that large companies beat their smaller peers in both the difficulty to replicate or-ganizational core capabilities and industry connectivity. As discussed earlier, low replicability indicates strong intellectual property protec-tion strategies as well as experienced and capable management teams that can bring to bear their skillsets in exploiting the emerging business ecosystem. This human capital is tacit in nature and therefore hard to imitate.
High connectivity to relevant industry partners, in turn, provides access to assets and capabilities outside the firm that it still needs for the pro-duction of goods and services in the new ecosystem. The exceptional-ly high connectivity – decisively higher than the connectivity of enter-prises in the Smart Grid ecosystem – implies (i) existing partnerships in the form of contracts, joint ventures or other formal agreements and (ii) capabilities to form new partnerships via leveraging the management team’s long-term experience in the relevant industry sectors as well as exploiting existing partnerships with third parties – such as consulting offices and economic development offices – that are well-connected in the new ecosystem.
Enterprises are clearly better positioned to exploit Smart
Mobility opportunities
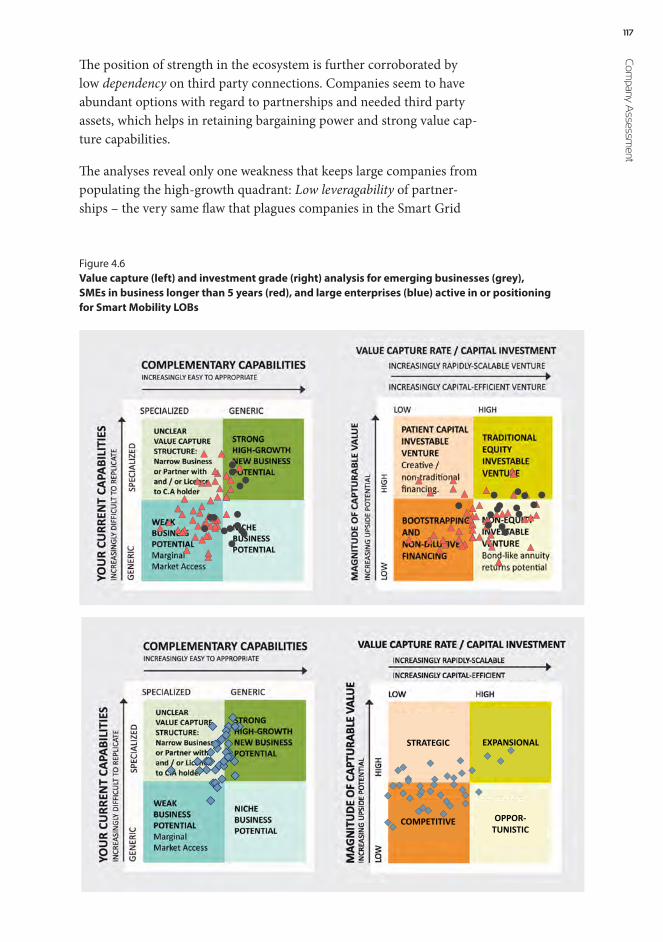
117 C
om
pany Assessm
ent
The position of strength in the ecosystem is further corroborated by low dependency on third party connections. Companies seem to have abundant options with regard to partnerships and needed third party assets, which helps in retaining bargaining power and strong value cap-ture capabilities.
The analyses reveal only one weakness that keeps large companies from populating the high-growth quadrant: Low leveragability of partner-ships – the very same flaw that plagues companies in the Smart Grid
4.6a
Figure 4.6Value capture (left) and investment grade (right) analysis for emerging businesses (grey), SMEs in business longer than 5 years (red), and large enterprises (blue) active in or positioning for Smart Mobility LOBs
COMPETITIVE
STRATEGIC EXPANSIONAL
OPPOR-TUNISTIC
4.6b
118Fi
nanc
ial T
echn
olo
gy fo
r Ind
ustri
al R
enew
al ecosystem – undermines the companies’ ability to exploit their high connectivity for effective market penetration. The existing partnerships are not necessarily the most relevant for or most capable of providing market exposure. As is the case in the Smart Grid ecosystem, low lever-
agability might well be an indication of Smart Mobility’s immaturity as an industry and market place rather than a sign of a weakness on the part of the companies. It is chal-lenging to find channel partners to access a market if this is still developing or emerging. Once the market matures,
however, their excellent connectivity and low dependency give large companies a formidable vantage point to exploit opportunities in Smart Mobility.
If the value capture position of large companies is convincing, the in-vestment grade of opportunities in the Smart Mobility ecosystem is poor (Fig. 4.6, right panel). Large companies are found in the two left most quadrants of the investment grade matrix, indicating that the in-tended strategies to position themselves in the Smart Mobility space are more long-term. Fig. 4.7 (bottom panel) provides grounds for the inter-pretation, showing poor results for both the scalability and capital effi-ciency of applied business models. The companies suffer from the very same syndrome as their peers in the Smart Grid ecosystem: They en-ter the new ecosystem with conventional strategies, trusting approach-es they have successfully employed in their legacy businesses. They are manufacturing-centric and their labor-intensive sales models incom-patible with digitalized, autonomous service platforms that will cap-ture most of the revenues in the growing smart layers of the emerging ecosystem. It is a pity especially because the results for diversification, an indicator for the volume of identified market opportunities, are ex-tremely promising (81% average); even more promising than for enter-prises in the Smart Grid ecosystem.
Smart Mobility startups and SMEs show weaker value capture capabilities but better investment grade than their Smart Grid peers
The value capture capabilities of Smart Mobility startups are, by and large, comparable to those of their peers in Smart Grid. While a small number of individual companies show promise of high growth and hold a strong value capture position in their respective value chains, many have to be content with niche business potential (Fig. 4.6, left panel).
Like their Smart Grid peers, Mobility startups have poor leverage over their market channel partners. An additional weakness is relatively high replicability. At 42 percent, their average Keystone score for the diffi-
Investment grade of opportunities in the Smart
Mobility ecosystem is poor

119 C
om
pany Assessm
ent
VALUE CAPTURE INVESTABILITY
0,04
-0,03 -0,11 -0,09 -0,10
0,11 0,190,37
-0,200,000,200,400,600,801,00
Start-ups
All others Start-ups Differential
0,06
-0,05-0,16 -0,19 -0,15
0,09 0,060,19
-0,40-0,200,000,200,400,600,801,00
SMEs
All others SMEs Differential
-0,08
0,070,24 0,25 0,21
-0,15 -0,16-0,37-0,60
-0,40-0,200,000,200,400,600,801,00
Large companies
All others Large companies Differential
4.7
Figure 4.7Value capture and investment grade drivers of the Finnish Smart Mobility sector. The bars represent averages for the respective KeyStone Compact® metrics for each size class.
120Fi
nanc
ial T
echn
olo
gy fo
r Ind
ustri
al R
enew
al culty to replicate key value capture capabilities is 14 percentage points lower than in the case of their Smart Grid benchmark (Fig. 4.7, up-per left panel). The threat of imitation and the ease of acquiring the same assets the companies employ to generate value compromises the
amount of value Smart Mobility startups can retain. Small and medium-sized companies fare even worse. Not only is their average replicability score much lower than that of Smart Grid SMEs, but their performance is weaker with regard to almost every other value cap-
ture metric with the exception of dependency. Connectivity, especially, is weaker by eight percentage points.
In contrast, Smart Mobility startups and SMEs show better perfor-mance in terms of investment grade than their peers in the Smart Grid ecosystem (Fig. 4.7, right panel). Startups, in particular, outshine the benchmark in every investment grade metric. With an impressive av-erage capital efficiency score of 89 percent, a diversification score of 60 percent and both remaining metrics above 50 percent, the average Smart Mobility startup would be a clear candidate for high-growth eq-uity investment.
The companies have identified both abundant and lucrative market op-portunities (high diversification and profitability scores), and have de-veloped the right business models to quickly access and exploit them (high capital efficiency and scalability scores). The question is what is stopping them? Why do we not see most of the companies pictured in the upper right corner of the investment grade matrix?
As was the case in Smart Grid, the culprit is the companies’ poor value capture position in the ecosystem. A weak position affects the ability to retain created value and, thereby, has a strongly compromising effect on
the upside potential a company can tap into. In a poor value capture position much of the potential is captured by partners and the competition. Investors and finan-cial markets take this into account and correct the in-
vestment grade assessments accordingly. Compared to startups, SMEs suffer additionally because they seem to employ less scalable and, ulti-mately, also less profitable business models. Scalability and profitability have an effect on both the upside potential of a business and the speed at which returns can be generated.
Smart Mobility startups and SMEs show goodperformance
in terms of investability
A weak position affects the ability to retain created value

121 C
om
pany Assessm
ent
Case study 3: Green Chemistry – A biotechnology industry model where innovators partner with incumbents for chan-nels and capital
For contrast’s sake, let us take a look at a final example: Green Chemis-try. The Green Chemistry industry in this case is defined as a subset of the Bioeconomy as introduced in the previous chapter. The rationale is that the Bioeconomy is defined in Finnish strategic government reports as any component of the economy that uses or generates biomass-re-lated products or services. Hence, it encompasses agriculture, forest-ry, water treatment, construction, biofuels and biodigestion, and the food industry. As we noted in the previous chapter, these are – from an industry structure perspective – unrelated segments of the economy. Hence, we decided to focus on Green Chemistry, an industry that is generally understood to mean “the design of products and processes that minimize the use and generation of hazardous substances”. Perhaps the most challenging aspect of assessing the Green Chemistry industry is that Green Chemistry is less a description of a discrete industrial segment than it is a way of carrying out in-dustrial activity, from design to manufacturing.
According to Pike Research3, Green chemical indus-try players run the gamut from vast multinationals that have been in operation for over a century to tiny startups. Much of the bio-based segment, which perhaps has the greatest long-term potential to revolutionize the chemical industry, is nascent. Technologies are just a few steps beyond the laboratory, and production facilities are a few years from reaching their modest full production levels. The bio-based segment of the market excluding biofuels is liable to grow slowly be-cause of challenges with issues of scale. Also, in the chemicals and ma-terials business, the adoption cycle often requires long lags for exten-sive customer testing before new products are introduced.”
We thus explored the companies and industry sectors that participate in the value chains of the various activities geared towards building out the material sourcing, chemical manufacturing, sales and integration into consumer products. A total of 61 companies, from a registry base of over 100 companies, was analyzed for value capture and investment grade (Figure 4.8).
The results indicate that, as compared to Smart Grid and Smart Mo-bility, most startups and SMEs occupy the ‘weak business potential’ quadrant, some exceptions notwithstanding. This could plausibly be at-tributed to the immature markets in this space. Without external policy drivers incentivizing the integration of green chemistries, and without internal efficiency drivers in the industry (see the previous chapter), the
”The bio-based segment of the market excluding biofuels is liable to grow slowly”
– Pike Research

122Fi
nanc
ial T
echn
olo
gy fo
r Ind
ustri
al R
enew
al opportunities for new market access are limited, except through part-nerships with large enterprises. This segment of the economy fares bet-ter in the value capture space, with most companies in the partnership and license area, only straddling new growth potential.
In the investment grade analysis, the business and revenue models of 90% of startups and SMEs places them in the lower two quadrants, with the overwhelming majority in the debt financeable quadrant. The implication is that it can be expected that cash-flow driven business-es will be built, rather than high growth platform firms with significant
4.8a
Figure 4.8Value capture (left) and investment grade (right) analysis for emerging businesses (grey), SMEs in business longer than 5 years (red), and large enterprises (blue) active in or positioning for Green Chemistry LOBs
4.8b

123 C
om
pany Assessm
ent
market and revenue diversification opportunities. The large enterpris-es fare no better: Close to none of the analyzed companies are currently engaged – or have committed resources to – the Green Chemistry in-dustry.
High dependency, low leveragability, and poor scalability explain the generally weak investment grade positioning of all three company sizes
As is the case with many nascent markets, the green chemical market is expected to grow through several stages: a profusion of small com-panies based on exciting technologies will gradually coalesce, through failures, acquisitions, and mergers, into a functioning ecosystem. Ma-ny of these small companies will likely choose to follow a model that is common in the biotechnology industry, whereby small, innovative companies partner with industry incumbents to obtain capital and dis-tribution channels. Established companies have the luxury of choice. They can either establish their own green operations, or watch the startups as they develop and acquire those that are the best fit for their own businesses once some of the technology and market risk has been wrung out.
The results indicate that the technical advantage of startups and SMEs cannot be effectively leveraged in an industry where most large players are very diversified and tend to be dominated by fossil fuel raw materi-als. This was borne out in the Green Chemistry ecosystem, as present-ed in Chapter 3, as well. Most financial transactions occur between the oil companies and refiners on the one hand, and specialty/diversified chemicals on the other hand, to supply the various consumer goods in-dustries. These include personal care and cleaning products, baby prod-ucts, apparel and footwear, healthcare, electronics, building materials and furnishings. According to a recent report from TruCost4, enhanced value chain collaborations are required to accelerate safer chemistry. This points to the immature linkages, as we saw in the financial net-work map earlier, one-project-at-a-time market development, and thus lack of leverage for startups and SMEs.
What about the large enterprises? Why are they characterized by limited leverage, high dependencies and low scalability?
The uncertainty of green policies and volatile petroleum prices are to blame. While regulatory regimes at the federal level in the United States do not appear likely to become increasingly stringent soon, several states have imposed strict new regulations on hazardous chemicals, as has the European Union, by way of promulgation of the REACH (Reg-istration, Evaluation, Authorization and Restriction of Chemicals) pro-gram. Enacted in 2007, it has been phased in over the next ten years,

124Fi
nanc
ial T
echn
olo
gy fo
r Ind
ustri
al R
enew
al and aims to improve the protection of human health and the environ-ment through the better and earlier identification of the intrinsic prop-erties of chemical substances, particularly when better alternatives are available. The phase in has been slow and the industry response is largely voluntary5.
On the other hand, consumers are becoming increasingly aware of the potential effects of the chemicals used to produce common materi-als and are demanding green alternatives. Companies are being forced to meet not only end-user demand, but also the demands of power-ful retailers, which can dictate product specifications to their suppli-ers by virtue of their vast sales. But the low petroleum prices – crucial both as a source of process energy and as a feedstock for many chemi-cal processes – have slowed down scaling of and investment in finding alternative, renewable feedstocks for key chemical products and inter-mediates.
Green Chemistry startups and SMEs show strong differentiation and connectivity in the industry
Despite these mixed market signals, there are encouraging trends in the analysis of the companies that appear to support the stages of devel-opment of this emerging industry. Taking a more detailed look at the KeyStone Scores®, it is apparent that the startups and SMEs are char-acterized by strong differentiation of their assets (intellectual property, real assets, and management) and connectivity (supply chain knowl-edge and management background) in the industry. Green chemistry advancements have long been academically- and technologically- driv-en, rather than being incentivized by industry cost, efficiency needs, or policy responses.
Since the fossil fuel-driven development and use of raw materials in the consumer goods supply chain remains dominant, what has driven the green chemistry market?
There has been substantial activity in the development of renewable feedstocks for a wide range of chemical processes, both replacements for commonly used “merchant molecules” and new compounds with interesting and commercially valuable properties. Claimed advantag-es for renewable feedstocks over conventional derivations from petro-leum include lower greenhouse gas emissions, reduced toxicity, and lower costs. Most renewable feedstocks are produced through biologi-cal processes – primarily fermentation of plant sugars into the desired compounds or their intermediates – or thermal and chemical processes applied to cellulosic materials such as wood, agricultural waste, or non-food plants like switchgrass. In Finland, startups have started to consid-er bio-based pulp waste feedstock for new raw materials.

125 C
om
pany Assessm
ent
The evolution of the green chemical market is being driven by a com-bination of technical, regulatory, consumer preference, and economic factors6. Improved chemical screening technology and advances in the science of mechanistic toxicology have improved our understanding of the effects of manmade chemicals on humans, animals, and the envi-ronment. The rapid advances in biotechnology achieved over the last several decades have created powerful, new toolkits for the manipula-tion of organisms (bacteria, yeasts, and algae) such that they produce industrially useful compounds with great efficiency and minimal waste.
Targeting economic development towards strength in selected sectors of emerging industries
In economic development discussions, investment strategies and vision statements tend to be very aggregate. Stimulating the Cleantech econ-omy or the bioeconomy – for example – is a very generic strategic ob-jective. The challenge with these high level articulations is that many economies are competing in this space, and therefore the value from a foreign direct investment (FDI) or trade perspective rapidly loses steam and meaning.
Foreign direct investments by multinational enterprises (MNEs) are one of the main drivers of globalization and of the creation of glob-al value chains (GVCs). Both inward and outward FDI is important to many economies, and links production across countries. In Finland, many corporate enterprises are subsidiaries of, or investments from, global MNEs. Since MNEs account for a substantial part of interna-tional trade flows – both within the firm and with arms-length trading partners – a well-articulated national policy strategy is at the core of successful FDI marketing and incentivation.
In Finland, Finpro helps SMEs go international, using export credit ve-hicles, and by encouraging foreign direct investment in Finland with taxation and other benefits. Clear delineations of the international-ization strategy in building green economies – asking what sectors of those emerging industries does the country have strength - are nec-essary. They send a message of how Finland’s competencies are differ-ent from those in Sweden, Germany, or the UK. Delineation of sectors of strength and innovation articulate the value of FDI in the Finnish economy to aspiring corporate and financial investors from Europe, the US and Asia.
The financial network mapping tool discussed in the previous chapter, coupled to the sourcing and assessment of companies detailed in this chapter, provides a systematic approach to understanding the strengths and weaknesses of resources in the economy. On its website, Invest in

126Fi
nanc
ial T
echn
olo
gy fo
r Ind
ustri
al R
enew
al Finland indicates broad opportunities in the bioeconomy, Cleantech, healthcare and wellbeing, ICT, manufacturing, mining, and retail. As exemplified for the Smart Grid and new mobility industries – both sub-domains of Cleantech – not all industry segments that make up these industry networks are equally well represented in Finland. And not all companies in each industry segment are equally investable.
The New Mobility economy is dominated by SMEs in anchor industries
To illustrate our point, let’s take a step back to the industry ecosystem of new mobility (Chapter 3). The visualization of this network is shown in Figure 4.9, and is comprised of catalyst (blue) and anchor (red) in-dustries. We have taken all companies (69 SMEs) that were analyzed by the KeyStone Compact® process, and rated for their investment grade as an equity, non-equity, and bootstrap-grade opportunity, and mapped them in their respective industry code.
The relative size of the pie charts represents prevalence of Finnish SMEs in the new mobility industry structure. The figure shows that SMEs in the new mobility economy are represented in two catalyst in-dustries, namely technology hardware and storage, automobile man-ufacturing. Strong activities are evident in multiple anchor industries,
Figure 4.9Smart Mobility ecosystem map with overlays of SMEs and startups in anchor and catalyst industries (size of pie-chart scaled by number of companies represented)
Application Software
IT Consulting & Design
Automobile Manufacturing
Logistics
Technology Hardware & Storage
Wireless Telco
Integrated Telco
Systems Software
Data Processing
IndustrialConglomerates
Bootstrap
Non-equity
Equity
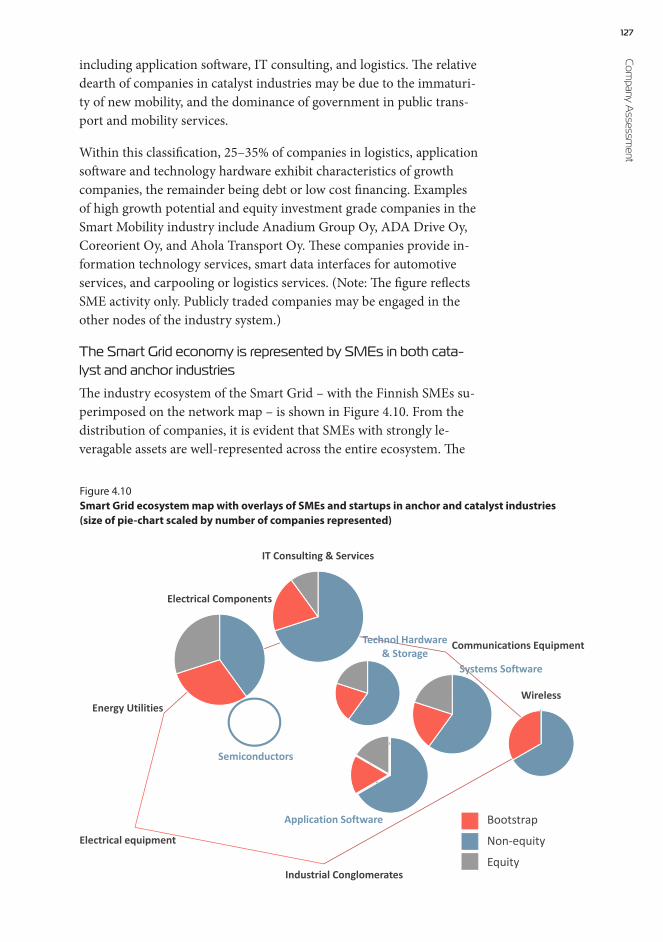
127 C
om
pany Assessm
ent
IT Consulting & Services
Systems Software
Application Software
Technol Hardware & Storage
Electrical Components
WirelessEnergy Utilities
Electrical equipment
Industrial Conglomerates
Semiconductors
Communications Equipment
Application Software Bootstrap
Non-equity
Equity
including application software, IT consulting, and logistics. The relative dearth of companies in catalyst industries may be due to the immaturi-ty of new mobility, and the dominance of government in public trans-port and mobility services.
Within this classification, 25–35% of companies in logistics, application software and technology hardware exhibit characteristics of growth companies, the remainder being debt or low cost financing. Examples of high growth potential and equity investment grade companies in the Smart Mobility industry include Anadium Group Oy, ADA Drive Oy, Coreorient Oy, and Ahola Transport Oy. These companies provide in-formation technology services, smart data interfaces for automotive services, and carpooling or logistics services. (Note: The figure reflects SME activity only. Publicly traded companies may be engaged in the other nodes of the industry system.)
The Smart Grid economy is represented by SMEs in both cata-lyst and anchor industries
The industry ecosystem of the Smart Grid – with the Finnish SMEs su-perimposed on the network map – is shown in Figure 4.10. From the distribution of companies, it is evident that SMEs with strongly le-veragable assets are well-represented across the entire ecosystem. The
Figure 4.10Smart Grid ecosystem map with overlays of SMEs and startups in anchor and catalyst industries (size of pie-chart scaled by number of companies represented)
128Fi
nanc
ial T
echn
olo
gy fo
r Ind
ustri
al R
enew
al Finnish Smart Grid ecosystem is represented in both catalyst and an-chor industries. For catalyst industries in particular, technology hard-ware and storage, application and systems software companies are cen-tral to the ecosystem, with less than a quarter of companies being equi-ty investment grade.
Examples of high growth potential catalyst firms include Sensire Oy, a monitoring and diagnostics company with applications in food and healthcare, that has a platform technology which can be applied in di-verse markets, including energy. Nortal is a platform software solutions provider already active in the energy market, with applications such as network management, metering, and business intelligence in the fields of oil shale mining, energy production and oil production optimiza-tion. On the other hand, Elkamo Oy, is an energy storage manufacturer involved in power distribution systems.
In the anchor industries, electrical components and IT/design services are the major contributors. Nearly a quarter to one third of these com-panies are ‘equity investable’, the remainder being debt financeable or bootstrap firms. Companies such as Aidon Oy, BaseN Oy, and Ener-size Oy are representatives of the high growth equity investable group. Aidon Oy is a Smart Grid and smart metering technology provider, while BaseN is an Internet of Things (IoT) operator enabled by a digi-tization platform. Enersize Oy is a technology company specialized in comprehensive energy saving solutions for process industry, equipment and systems
The Green Chemistry economy is overwhelmingly dominated by machining SMEs in anchor industries
The industry ecosystem that comprises Green Chemistry is dominat-ed by anchor industries, with few financial connections mediated by catalyst industries (Figure 4.11). This is also the finding of Pike Re-search and Trucost research3, 4, as indicated earlier. Our analysis of 58 companies in this industry, of which 36 are SMEs and startups, indi-cated that the overwhelming majority is engaged in one single anchor industry: industrial machining. With focus on the manufacturing of biofuel plants, water treatment facilities, recycling machinery, and the like, these SMEs are supportive of existing industries in the ecosystem. Of note is the large representation of water or waste-related technolo-gy providers, representative of legacy supportive industries. Industry ecosystem activities with three or more SMEs and startups are seen in the diversified- and specialty chemicals industries. Single companies show focus on the development of commodity chemicals or consumer goods derived from the paper industry, with emphasis on energy-relat-ed products.

129 C
om
pany Assessm
ent
In addition, out of 36 companies, three are venture grade, with the re-mainder potentially scalable to risk-debt financeable companies based on reliable offtake contracts. One notable exception as a potential cat-alyst company is Chempolis, a producer of patented third generation technologies for biorefining of residual biomasses: formicobio™ for the co-production of non-food cellulosic bioethanol, biochemicals and bio-coal, and formicofib™ for the co-production of non-wood papermaking fibers (i.e. pulp), biochemicals and biocoal. Others active in the paper industry, such as Bioklapi, focus on the production of consumer goods such as pellets.
Summary: KeyStone Compact® analysis of industry ecosystems informs targeted economic development
The KeyStone Compact® – an algorithmic non-financial due diligence analysis of companies – shows that Finland has specific and targeted business growth opportunities in the Smart Grid, Smart Mobility, and Green Chemistry industries. It also exposes catalyst industries in which the country’s SMEs are currently not active, and in which economic de-velopment strategies should be focused to drive growth of the emerg-ing industry. Ever since Harvard economist Michael Porter introduced the concept7, the design of industrial cluster strategies has evolved as an
Multi-utility
Diversifiedchemicals
Specialty chemicals
Household & Personal Products Paper products
Electric utilities
Oil & Gas
Commodity chemicals
Industrial Machinery
Bootstrap
Non-equity
Equity
Figure 4.11Green Chemistry ecosystem map with overlays of SMEs and startups in anchor and catalyst indus-tries (size of pie-chart scaled by number of companies represented)

130Fi
nanc
ial T
echn
olo
gy fo
r Ind
ustri
al R
enew
al opportunity for systemic economic development. Not one-company-at-time, but an industry. The structure and performance of value chains that underpin industrial clusters are broadly accepted.
For example, the U.S. Economic Development Administration has em-braced the analysis and design of industry clusters as important and powerful tools for policy action and economic development8. A key policy challenge – also pointed out by the Brookings Institution (a Washington, DC based think tank) – in the execution of green cluster designs is figuring out how regional economic strengths and leveraga-ble assets can be translated into (export) growth markets9.
The Multi-Asset Renewal Fund (MARF) is built on the industry cluster concept, and identifies the industry codes and companies that would be plausible candidates for investment. Even if non-financial metrics dis-close valuable information on the risk profiles of companies, they need to be supplemented with rigorous financial analysis. The MARF alloca-tion strategy for SMEs considers two asset classes: equity investment or uncollateralized risk debt. The metrics that are typically used to assess credit worthiness and valuation of companies in these asset classes dif-fer substantially.
The next chapter provides an overview of the asset allocation strategy in each asset class.
131 C
om
pany Assessm
ent
References1 Moore, G. A. (1991). Crossing the Chasm: Marketing and Selling High-Tech Products
to Mainstream Customers. Harper Business Essentials, New York.2 Kotiranta, A., Tahvanainen, A., Ritola, M. & Adriaens, P. (2015). Leveraging Physical
Assets for Value Creation Through Cleanweb Firms: The Finnish Cleantech Space in Transition. Ross School of Business Paper No. 1279. Available at SSRN: http://ssrn.com/abstract=2611231.
3 Pike Research (2011). Green Chemistry Bio-based Chemicals, Renewable Feedstocks, Green Polymers, Less-toxic Alternative Chemical Formulations, and the Foundations of a Sustainable Chemical Industry. Market Report, Boulder, CO, US, Accessed 05042016.
4 TruCost (2015). Making the Business & Economic Case for Safer Chemistry: Report for the American Sustainable Business Council and Green Chemistry & Commerce Council. Available at http://asbcouncil.org/sites/default/files/asbcsaferchemicalsreportpresred.pdf, Accessed 05042016.
5 European Commission (2007). Available at http://ec.europa.eu/environment/chemicals/reach/reach_en.htm, Accessed 022616.
6 Anastas, P. T. & Warner, J. C. (1998). Green Chemistry: Theory and Practice, Oxford University Press, New York
7 Porter, M.E. (1998). Cluster and the new economics of competition. Harvard Business Review, pp. 77–90.
8 United States Economic Development Administration. Cluster Mapping. Available at http://www.clustermapping.us/, Accessed 081515.
9 Katz, B. & Muro, M. (2010). The New ”Cluster Moment”: How Regional Innovation Clusters Can Foster the Next Economy. Brookings Institution, Washington, DC.


Asset Allocation 5Robustness in Combining Financial and Non-Financial Indices
134Fi
nanc
ial T
echn
olo
gy fo
r Ind
ustri
al R
enew
al Robustness in Combining Financial and Non-Financial Indices
Portfolio Investment Objectives
Managing a multi-asset strategy portfolio based on a thematic financial network map of companies is much more complicated than putting to-gether a puzzle. There are three important stages in the process: (1) as-set allocation strategy, (2) portfolio construction, and (3) performance evaluation. The asset allocation strategy will be discussed in this chap-ter, and describes how the decisions were made to include and exclude companies from the fund structure based on financial and non-finan-cial risk metrics. Chapter 6 will focus on the portfolio construction of the Multi-Asset Renewal Fund – the ultimate goal of the work present-ed in this book. Chapter 7 emphasizes the performance evaluation of a
specific portfolio using commonly accepted risk-re-turn analytics tools in the industry.
The asset allocation strategy essentially seeks to un-derstand which companies should be included in the proposed Multi-Asset Renewal Fund (MARF),
and what asset classes best fit their risk-return and growth trajectories. The financial technology approach to find efficiencies in the deal sourc-ing and allocation process is multi-faceted. A financial network map-ping IT solution finds the original pool of companies to be triaged us-ing the KeyStone Compact®, an algorithmic risk typology for startups, mature SMEs and corporate enterprises based on their value capture and investment grade characteristics.
In this chapter, we build on this outcome, and expand the allocation process to integrate also purely financial performance indicators in the asset class allocation strategy. The solutions approach leverages statis-tical models that uncover risk profiles and insights from the KeyStone Scores®, and integrates these in a workflow process with financial indica-tors to arrive at the most viable assignment of risk and return. Since the
“However good our futures research may be, we shall never be able to escape from the ultimate dilemma that all our knowledge is about the past,
and all our decisions are about the future.
– Ian Wilson, Scenario planning expert
The asset allocation strategy seeks to understand which companies should be included in the MARF

135 A
sset Allo
cation
fund structure encompasses private debt, equity and stock investments, each of which have different liquidity and performance expectations, the triaging of companies needs to be performed at multiple levels.
Non-financial risk-performance profile. Non-financial performance indicators are used to assess the activities that an organization sees as important to achieve its strategic objectives. Typical indicators relate to customer relationships, opera-tions, market channels and the organization’s supply chain or its pipeline. Non-fi-nancial measures are indicators for the firm’s long-term performance.
Financial risk-performance profile. Financial performance indicators are general-ly based on income statement or balance sheet components, and may also re-port changes in sales growth – by product families, channel, customer segments – or in expense categories. Accounting-based performance is contemporary and short-term, and tends to measure recent history of the firm.
The KeyStone Compact® suite of risk assessments are focused on quan-tifying non-financial risks, which are often viewed to represent over 70% of the investment risk or performance of companies. Indeed, a re-cent Ernst & Young survey on risk management by major financial in-stitutions emphasized how banks are increasingly focusing on non-fi-nancial risk metrics1. Since each ecosystem is comprised of compa-nies with a wide variety of business models and associated risks, these potential underlying assets for the fund need to be carefully analyzed based on both financial and non-financial metrics. When applied to the three industry ecosystems, metrics such as positioning for value cap-ture, upside potential, and time to scale for enterprises as they partake in – or are entering – new industries and leverage their assets, are high-ly varied and informative for investment risk.
According to a November 2003 Harvard Business Review article2, most companies rarely identify areas of non-financial performance that might advance their chosen growth strategy. Nor do they demonstrate a cause-and-effect link between improvements in those non-financial ar-eas and in cash flow, profit, or stock price3. The objective is to provide an overview of how the non-financial company KeyStone Scores® were used in conjunction with accounting-based metrics to aid in risk pro-filing, and in allocation of companies to the MARF’s unsecured private debt, equity investment, and exchange traded fund (ETF) asset classes.
Interpreting company non-financial risk factors using statistical means
As detailed in Chapter 4, risk profiling of companies using the Key-Stone Compact® tool results in a quantitative score based on a set of eight categories. The categories and granularity of analysis is informed by tacit knowledge of entrepreneurs, investors, and product develop-ment managers.

136Fi
nanc
ial T
echn
olo
gy fo
r Ind
ustri
al R
enew
al Following analysis of hundreds of companies, a wide range of KeyStone Scores® was obtained, a sampling of which from the Green Chemistry industry is shown in Figure 5.1. From this figure it is apparent that the numbers range from 0–100% on some metrics, with a tighter distribu-tion in others. For our systematic analysis of risk and of forward-look-ing performance expectations, but also for matching the companies with the right asset class in the MARF, we needed to design a process that utilizes these metrics and helps to answer the following questions:
– How can similarities among companies be understood and quantified?
– How can companies with similar risk profiles be clustered?– What is the relationship between non-financial and financial risk
metrics?
To answer these questions and mine the data, we employed a set of sta-tistical analytical tools familiar to those versed in the academic and practitioner fields of econometrics and micro-econometrics: Principal Components Analysis (PCA), Hierarchical Cluster Analysis, and Re-gression Analysis. Econometrics uses economic theory, mathematics, and statistical inference to quantify economic phenomena for econom-ic policymaking. Since we are concerned with individual firms, we fo-cus on micro-econometrics, the analysis of data on the economic be-havior of firms as a predictive tool for asset allocation.
This treatise is not intended to provide a technical background on each of these tools, but serves to help explain the objectives and interpreta-tion of the analyses.
Dependency Leverageability Replicability Connectivity Diversification Profitability Scalability Capital Efficiency
35.7 % 15.0 % 13.3 % 37.5 % 18.2 % 56.3 % 57.1 % 70.0 %
21.4 % 20.0 % 40.0 % 12.5 % 81.8 % 37.5 % 50.0 % 60.0 %
14.3 % 25.0 % 46.7 % 37.5 % 81.8 % 56.3 % 57.1 % 100.0 %
35.7 % 30.0 % 53.3 % 62.5 % 63.6 % 50.0 % 50.0 % 100.0 %
0.0 % 35.0 % 66.7 % 62.5 % 72.7 % 62.5 % 71.4 % 100.0 %
7.1 % 45.0 % 60.0 % 62.5 % 45.5 % 18.8 % 14.3 % 30.0 %
14.3 % 45.0 % 73.3 % 50.0 % 81.8 % 37.5 % 42.9 % 100.0 %
0.0 % 50.0 % 73.3 % 37.5 % 63.6 % 62.5 % 28.6 % 50.0 %
0.0 % 40.0 % 60.0 % 50.0 % 54.5 % 50.0 % 57.1 % 70.0 %
14.3 % 30.0 % 33.3 % 25.0 % 36.4 % 31.3 % 50.0 % 40.0 %
Figure 5.1Diversity of KeyStone Scores® across ten companies

137 A
sset Allo
cation
Principal Components Analysis helps to uncover trends in the KeyStone Compact® datasets
Principal component analysis (PCA) is a technique used to identify co-variation and uncover strong patterns in a dataset. The methodolo-gy is commonly used in the social sciences, market research, and other industries that use large data sets. The rationale for using the tool is to condense any number of variables from a large set of data into a much smaller number of uncorrelated variables, called principal components. The PCA is therefore also known as a data reduction tool (Figure 5.2). The goal of the PCA is to explain the maximum amount of variance with the fewest number of principal components.
� � ���� � ���⋮ ⋱ ⋮
��� � ���� ������ � � �
��� � ���⋮ ⋱ ⋮
��� � ����
Figure 5.2Reduction of a large number of variables (n) in a dataset to a smaller subset of uncorrelated variables (k) for easier interpretation
Let us use the KeyStone Scores® as an example. Based on figure 5.1, each company is characterized by a set of eight scores, grouped in two sets: value capture scores and investment grade scores. The matrix of scores for one hundred companies is thus 100 x 8, or 800 combinations of scores and companies. The PCA analysis can then be applied to re-duce this set of eight scores into a smaller number of ‘principal compo-nents’.
Each of the principal components – in layman’s terms – combines a number of the original eight scores based on their mutual correlation – referred to as loadings. Those scores that exhibit either strong positive or negative correlation among themselves are grouped in a single prin-cipal component. Depending on the detailed methodology used, any single variable is significantly loaded with any of the other variables in the data in only one of the obtained principal components. Therefore, the number of principal components obtained is usually smaller than the number of original variables. In our case the PCA reduces the orig-inal space of eight variables to only three principal components with significant explanatory power.
Since the original eight KeyStone Scores® describe different dimensions of non-financial risk for a company, a combination of these dimen-sions basically creates risk profiles that are an expression of each of the
138Fi
nanc
ial T
echn
olo
gy fo
r Ind
ustri
al R
enew
al components. In other words, instead of using dependency, leveraga-bility, connectivity, replicability, diversification, profitability, scalability and capital efficiency as risk descriptors, the dataset is reduced to three principal components that profile the original scores into management, market and industry risk categories. Thus, the original matrix of 100 x 8 KeyStone Scores® transforms into a reduced matrix of 100 x 3 principal components describing three different profiles of risk (Figure 5.2).
Let us describe the three risk profiles that the respective principal com-ponents represent:
– Management risk. This category relates to the experience, skill sets, and connectivity of the management team and advisory board in the industry where the company seeks to grow. This risk may include product management risk, involving strate-gy, market trends and feature definition of a product or product line.
– Industry risk. This category generally describes how well the company is positioned in the industry value chain, how well it can leverage its assets, and how dependent it is on partnerships, regulatory requirements, and supply chain pressures.
– Market risk. This category focuses on revenue and cost struc-tures to get the product or service to market, the sales cycles and scalability of the opportunity, adoption rates and how they are influenced by channels and regulations.
You might want to know how many principal components are sufficient for analysis and interpretation. This depends on the type of dataset and the objective of the study. Each component explains a certain amount of the total variation in the data set. The threshold for the total amount explained really depends on the setting. In this analysis, the objective is to explain underlying trends in the datasets, and find combinations of KeyStone Score® variables that can be grouped to understand types of risk embedded in the business model. Hence, as a sufficient threshold, principal components are required to explain at least 70% of the varia-tion among the companies.
Hierarchical cluster analysis allows for grouping companies with similar non-financial risk profiles
In data mining and statistics, hierarchical clustering – also called hier-archical cluster analysis or HCA – is a method of cluster analysis which seeks to build a hierarchy of related clusters. The tool is commonly used in many areas of inquiry to organize observed data into mean-ingful structures or develop taxonomies of similarity. In other words,

139 A
sset Allo
cation
cluster analysis is an exploratory data analysis tool which aims at sort-ing different objects into groups in a way that the degree of association between two objects is maximal if they belong to the same group and minimal otherwise.
The hierarchical feature of cluster analysis then uses algorithms to make decisions on relatedness between the groups. The degree of as-sociation between two objects – companies, in our case – can be visu-alized in many simple and evocative ways. One approach for graphical representation of a matrix of distances, which is perhaps the easiest to understand, is a dendrogram, or tree (Figure 5.3). The companies are thus joined together in a hierarchical fashion from the closest related (the most similar), to the furthest apart (the most different).
Given this information, cluster analysis can be used to discover struc-tures in data without providing an interpretation. In the current study, cluster analysis was used to discover similarities between companies with regard to their risk profiles, as established in the principal com-ponents analysis of the KeyStone Scores®.
Let us briefly demonstrate how. Assume that the PCA analysis is able to reduce the eight KeyStone Score® variables to the three afore-mentioned principal components: management risk, market risk, and industry risk. Each company can now be assigned what statisti-cal analysts call a factor score for each of the three components. A factor score is a numerical metric that tells how well any given compo-nent is indicative of the companies’ features and profile it is assigned to. If a company has a high factor score for a given principal component, it means that particular component represents the company well. In our example, a company that receives a high factor score for the mar-ket risk component, for instance, is more exposed to market risk than those that have a low score.
The companies receive a factor score for all three principal components separately. Therefore, each company is characterized by an individual combination of these components. Each company is exposed to some management, some industry and some market risk, according to their individual profiles. What hierarchical cluster analysis allows is a group-ing of the companies by similarities in their profiles.
is reduced to three principal components that profile the original scores into management, market and industry risk categories. Thus, the original matrix of 100 x 8 KeyStone Scores® transforms into a reduced matrix of 100 x 3 principal components describing three different profiles of risk (Figure 5.2).
Let us describe the three risk profiles that the respective principal components represent:
Management risk. This category relates to the experience, skill sets, and connectivity of the management team and advisory board in the industry where the company seeks to grow. This risk may include product management risk, involving strategy, market trends and feature definition of a product or product line.
Industry risk. This category generally describes how well the company is positioned in the industry value chain, how well it can leverage its assets, and how dependent it is on partnerships, regulatory requirements, and supply chain pressures.
Market risk. This category focuses on revenue and cost structures to get the product or service to market, the sales cycles and scalability of the opportunity, adoption rates and how they are influenced by channels and regulations.
You might want to know how many principal components are sufficient for analysis and interpretation. This depends on the type of dataset and the objective of the study. Each component explains a certain amount of the total variation in the data set. The threshold for the total amount explained really depends on the setting. In this analysis, the objective is to explain underlying trends in the datasets, and find combinations of KeyStone Score® variables that can be grouped to understand types of risk embedded in the business model. Hence, as a sufficient threshold, principal components are required to explain at least 70% of the variation among the companies.
Hierarchical cluster analysis allows for grouping companies with similar non-financial risk profiles
In data mining and statistics, hierarchical clustering – also called hierarchical cluster analysis or HCA – is a method of cluster analysis which seeks to build a hierarchy of related clusters. The tool is commonly used in many areas of inquiry to organize observed data into meaningful structures or develop taxonomies of similarity. In other words, cluster analysis is an exploratory data analysis tool which aims at sorting different objects into groups in a way that the degree of association
between two objects is maximal if they belong to the same group and minimal
Figure 5.3. Graphical representation of a dendrogram, indicating how observations are clustered based on similarity.
Cluster B
Cluster A Sim
ilarit
y
Observations
Comment [ata3]: NOSTO: Hierarchical Cluster Analysis is commonly used to organize data into meaningful structures and or develop taxonomies of similarity
Figure 5.3Graphical representation of a dendrogram, indicating how observations are clustered based on similarity

140Fi
nanc
ial T
echn
olo
gy fo
r Ind
ustri
al R
enew
al Regression analysis informs whether non-financial risk metrics are predictive value drivers for the firm
Regression analysis is a statistical process for estimating the relation-ships among variables. It includes many techniques for modeling and analyzing several variables, when the focus is on the relationship be-tween a dependent variable and one or more independent variables – or predictors that are assumed to explain the variation of the dependent variable.
In the project described here, we have not conducted explicit regres-sions in the conventional understanding, but rather probed the rela-tionship between non-financial risk metrics and accounting metrics. The rationale for conducting this type of analysis is that non-financial performance measures are sometimes considered to be leading indi-cators of future financial performance, while current financial perfor-mance measures – such as earnings or return on assets – are common-ly considered to be trailing measures of performance. In the design of a long-term investment instrument, it is important to uncover for-ward-looking measures that are predictive of future performance.
The PCA analysis, and cluster analysis reveal structure in the non-fi-nancial company data. The regression analysis is intended to demon-strate the value relevance of financial and non-financial information and their usefulness in the prediction of return on assets and liquidity performance metrics. Allocation decisions will be made following ag-gregate analysis of the three key categories of firm value drivers: hu-man capital, accounting information, and firm market/industry char-acteristics.
Case 1. Strength of SMEs in the Smart Grid industry is predominantly impacted by market growth factors
The PCA analysis of over 40 companies that passed the KeyStone Com-pact® assessment indicate that the three obtained components can de-scribe 75% of the variation between the companies (Figure 5.4). The Figure shows how the eight KeyStone Score® variables are related to the three principal components, whereby the numbers represent the signif-
icance of the relationship. Interpretation of the prin-cipal components is based on finding which vari-ables are most strongly correlated with each compo-nent, i.e., which of these numbers are large in mag-nitude, the farthest from zero in either positive or
negative direction. Which numbers need to be considered as large or small is determined by a number of factors such as the ratio between the number of observations – companies, in our case – and the amount
Market growth opportunities are driven by diversification, profitability,
scalability and capital efficiency
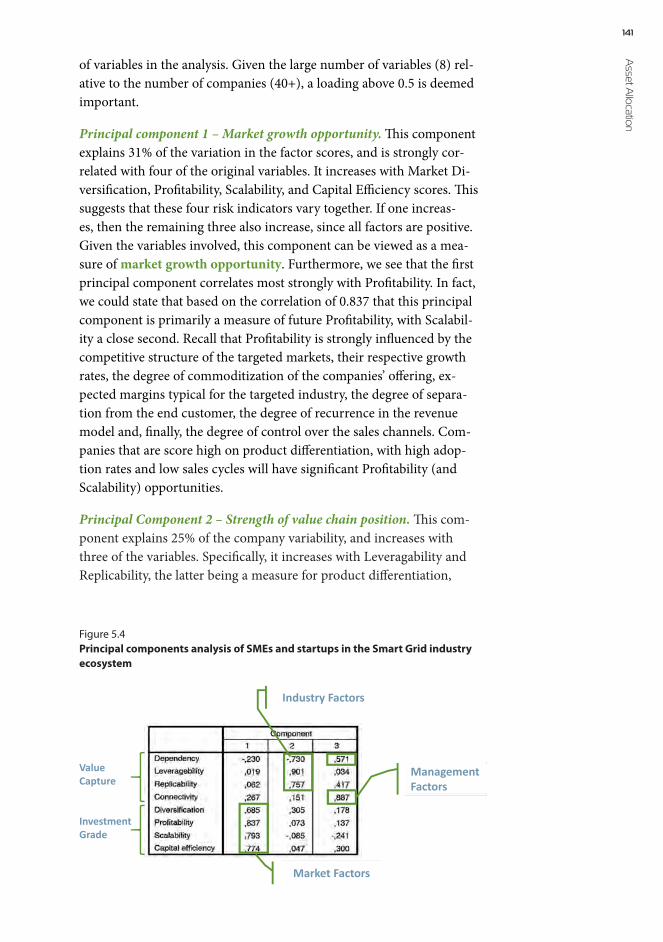
141 A
sset Allo
cation
of variables in the analysis. Given the large number of variables (8) rel-ative to the number of companies (40+), a loading above 0.5 is deemed important.
Principal component 1 – Market growth opportunity. This component explains 31% of the variation in the factor scores, and is strongly cor-related with four of the original variables. It increases with Market Di-versification, Profitability, Scalability, and Capital Efficiency scores. This suggests that these four risk indicators vary together. If one increas-es, then the remaining three also increase, since all factors are positive. Given the variables involved, this component can be viewed as a mea-sure of market growth opportunity. Furthermore, we see that the first principal component correlates most strongly with Profitability. In fact, we could state that based on the correlation of 0.837 that this principal component is primarily a measure of future Profitability, with Scalabil-ity a close second. Recall that Profitability is strongly influenced by the competitive structure of the targeted markets, their respective growth rates, the degree of commoditization of the companies’ offering, ex-pected margins typical for the targeted industry, the degree of separa-tion from the end customer, the degree of recurrence in the revenue model and, finally, the degree of control over the sales channels. Com-panies that are score high on product differentiation, with high adop-tion rates and low sales cycles will have significant Profitability (and Scalability) opportunities.
Principal Component 2 – Strength of value chain position. This com-ponent explains 25% of the company variability, and increases with three of the variables. Specifically, it increases with Leveragability and Replicability, the latter being a measure for product differentiation,
ValueCapture
InvestmentGrade
Market Factors
Industry Factors
Management Factors
Figure 5.4Principal components analysis of SMEs and startups in the Smart Grid industry ecosystem
142Fi
nanc
ial T
echn
olo
gy fo
r Ind
ustri
al R
enew
al and with decreasing Dependency. Hence, if the two former variables increase, the latter decreases. This component can be interpreted as a measure of strength of industry value chain position, particularly due to its high correlation with Leveragability. Recall that this variable mea-sures a company’s ability to exploit its assets and partners to its own ad-vantage, including core partnerships via contracts, joint ventures and other agreements but also the fierceness of the competitive environ-ment and the degree of concentration in the industry. In other words, companies with a high degree of leverage will be able to attain a strong position in the industry value chain, and reduce their dependencies in the industry.
Principal Component 3 – Management experience. The third compo-nent explains 18% of the variation among company scores, and is relat-ed to two factors. These are Connectivity and increasing Dependency. It is suggestive that as the Connectivity of the management team in the industry in which the company seeks to innovate increases, Dependen-cy on partners also increases. Given the strongest correlation (0.887) with industry connectivity, this component is a measure of manage-ment experience. This may indicate that a management team and advi-sory board with deep knowledge of the supply chain and relationships therein to bring products and services to market know how to seek out partners, but thereby increase industry dependencies.
Clustering of SMEs in the emerging Smart Grid industry supports eight company profiles
Using the related factor scores for the three principal components as input, hierarchical cluster analysis of each company indicates that up to eight clusters can be identified based on the relatedness of the com-panies’ factor score profiles (Figure 5.5). A number of replicates such as Foreca, Wirepass and Selmic were included as an internal check for consistency of the KeyStone Compact® analysis.
As a result of the cluster analysis, it can be concluded that forward-look-ing, non-financial performance metrics are indeed capable of differen-tiating between companies based on market growth factors, strength in the value chain, and management experience (Figure 5.6). Importantly, this clustering is irrespective of the industry code or the value chain seg-ment of the Smart Grid industry the companies operate in.
Example. Aidon and BaseN in Cluster 2 are classified under the ‘Manufacture of instruments and appliances for measuring, testing and navigation’ and ‘Data Pro-cessing’ industry codes, respectively. The contributions of Principal Component 1 (Market Growth) and Principal Component 2 (Industry Strength) are lower for Aidon than for BaseN, but Principal component 3 (Management Experience) is higher. The contributions are all strongly positive. When Aidon in Cluster 2 and

143 A
sset Allo
cation
Figure 5.5Hierarchical cluster analysis and dendrogram of companies in the Smart Grid industry
CLUSTER 1
CLUSTER 2
CLUSTER 3
CLUSTER 4
CLUSTER 5
CLUSTER 6
CLUSTER 7
CLUSTER 8

144Fi
nanc
ial T
echn
olo
gy fo
r Ind
ustri
al R
enew
al Eneron in Cluster 1 are compared, Eneron has negative loading factors for Market Growth and Management Experience, and lower Industry Strength. Hence, the statistical relatedness algorithm places these companies in different clusters.
Visualization tools help in drawing connections between non-financial and financial risk metrics
Before moving on in the process, let us briefly recap what has been achieved so far. The ultimate objective of the asset allocation process is to assign companies – qualified for investing by the value capture and investment grade analyses discussed in the previous chapter – to those asset classes of the MARF that are compatible with their risk pro-files, on the one hand, and their financial performance, on the other. Both the principal component analysis and the subsequent clustering of companies have served the former purpose. They have helped to pro-file companies according to their characteristic risks and cluster them into groups of companies that share similar risk profiles. What we have achieved is to measure and utilize, for allocation purposes, key qualita-tive (non-financial) risk features of companies. So far so good.
That being said, we know investors and financial markets tradition-ally also rely on more tangible, quantitative financial metrics when
considering the fit of any given investment vehi-cle with investment targets. While the qualitative metrics we captured in the previous steps are for-ward-looking and gauge the risks involved going
forward in time, traditional financial metrics – such as EBITDA, ROE or profit margins – measure past and current performance. To get a ho-listic view of the risks and the potential involved in their investments, investors consider both qualitative and quantitative dimensions. They complement each other.
Therefore, we have to consider also financial performance metrics in our allocation process. Before plunging straight into yet another battery of analyses, let us first develop an in-depth understanding – a ratio-nale – of how the established qualitative risk profiles tie into and help inform the interpretation of the respective financial metrics. After all, they are expected to complement and support, not contradict each oth-er. To understand the ties, we need to take a step back and take a clos-
er look at the profiles of the individual company clusters.
The interpretation of data structures behind hier-archical clustering and the loadings of principal
components for each company is not a straightforward business. The challenge is that we ultimately have to relate the risk features of the in-
Investors consider both qualitative and quantitative metrics
We have to relate the risk features of company clusters to the physical
business environment
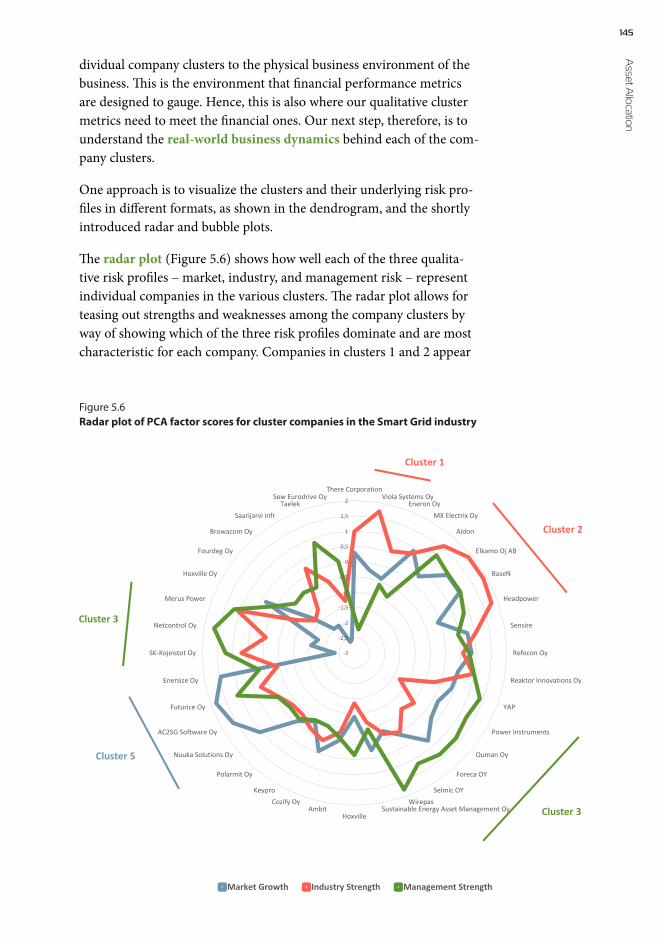
145 A
sset Allo
cation
dividual company clusters to the physical business environment of the business. This is the environment that financial performance metrics are designed to gauge. Hence, this is also where our qualitative cluster metrics need to meet the financial ones. Our next step, therefore, is to understand the real-world business dynamics behind each of the com-pany clusters.
One approach is to visualize the clusters and their underlying risk pro-files in different formats, as shown in the dendrogram, and the shortly introduced radar and bubble plots.
The radar plot (Figure 5.6) shows how well each of the three qualita-tive risk profiles – market, industry, and management risk – represent individual companies in the various clusters. The radar plot allows for teasing out strengths and weaknesses among the company clusters by way of showing which of the three risk profiles dominate and are most characteristic for each company. Companies in clusters 1 and 2 appear
-3
-2,5
-2
-1,5
-1
-0,5
0
0,5
1
1,5
2
There CorporationViola Systems Oy
Eneron OyMX Electrix Oy
Aidon
Elkamo Oj AB
BaseN
Headpower
Sensire
Refecon Oy
Reaktor Innovations Oy
YAP
Power Instruments
Ouman Oy
Foreca OY
Selmic OYWirepas
Sustainable Energy Asset Management OyHoxville
AmbitCozify Oy
Keypro
Polarmit Oy
Nuuka Solutions Oy
AC2SG Software Oy
Futurice Oy
Enersize Oy
SK-Kojeistot Oy
Netcontrol Oy
Merus Power
Hoxville Oy
Fourdeg Oy
Browacom Oy
Saarijarvi infrTaelek
Sew Eurodrive Oy
Market Growth Industry Strength Management Strength
Cluster 2
Cluster 1
Cluster 3
Cluster 3
Cluster 5
Figure 5.6Radar plot of PCA factor scores for cluster companies in the Smart Grid industry
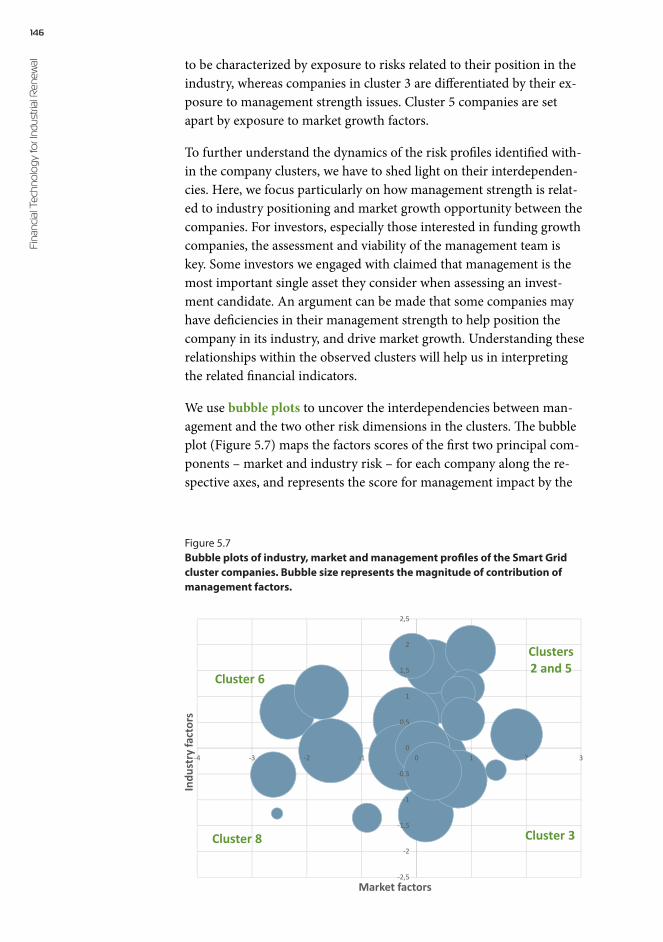
146Fi
nanc
ial T
echn
olo
gy fo
r Ind
ustri
al R
enew
al to be characterized by exposure to risks related to their position in the industry, whereas companies in cluster 3 are differentiated by their ex-posure to management strength issues. Cluster 5 companies are set apart by exposure to market growth factors.
To further understand the dynamics of the risk profiles identified with-in the company clusters, we have to shed light on their interdependen-cies. Here, we focus particularly on how management strength is relat-ed to industry positioning and market growth opportunity between the companies. For investors, especially those interested in funding growth companies, the assessment and viability of the management team is key. Some investors we engaged with claimed that management is the most important single asset they consider when assessing an invest-ment candidate. An argument can be made that some companies may have deficiencies in their management strength to help position the company in its industry, and drive market growth. Understanding these relationships within the observed clusters will help us in interpreting the related financial indicators.
We use bubble plots to uncover the interdependencies between man-agement and the two other risk dimensions in the clusters. The bubble plot (Figure 5.7) maps the factors scores of the first two principal com-ponents – market and industry risk – for each company along the re-spective axes, and represents the score for management impact by the
-4
-3
-2
-1
0
1
2
3
-3 -2 -1 0 1 2 3
Indu
stry
fact
ors
Market factors
Cluster 3Cluster 4
Clusters 3 and 5
Clusters 4 and 5
-2,5
-2
-1,5
-1
-0,5
0
0,5
1
1,5
2
2,5
-4 -3 -2 -1 0 1 2 3
Indu
stry
fact
ors
Market factors
Clusters 2 and 5
Cluster 3
Cluster 6
Cluster 8
Figure 5.7Bubble plots of industry, market and management profiles of the Smart Grid cluster companies. Bubble size represents the magnitude of contribution of management factors.
147 A
sset Allo
cation
size of the bubble. The map shows there are four broad groupings of clusters:
1 Company clusters in which management factors are positively correlated to industry strength and market growth opportunity (clusters 2 and 5);
2 Company clusters in which management factors are positively correlated to market growth opportunity only (cluster 3);
3 Company clusters in which management factors are positively correlated to industry strength and positioning only (cluster 6); and
4 Company clusters in which management factors are negatively correlated to industry strength and market growth opportuni-ty (cluster 8). Since only positive contributions are represented, clusters 1, 4 and 7 as well as some outliers in the featured clus-ters are not included.
What do these results tell us about the real-world business dynamics of the companies?
The interpretation of the positioning of clusters and cluster companies can be tied back to the original PCA results. The management’s deep knowledge of supply chains, industry relationships, and ability to struc-ture beneficial partnerships should positively correlate with strength of the company in the industry, and market access.
Clusters 2, 5, and 6 represent companies with apparent capacity to build a position of value capture. Clusters 2, 3, and 5 appear to be able to leverage this industry connectivity to access market growth opportu-nities. Companies in cluster 8, in spite of positive management factors, have not been able to build a position of strength or gain significant market growth. Clusters 1, 4, and 7, in which management, industry and market factors are all negatively correlated may indicate significant outside factors that influence the industry and market, unable to be overcome by the managements’ connectivity in the industry. These may include issues such as: the market may not be ready, and the strength of positioning is weak because the industry is immature to begin with.
Whether the relative position of the companies is reflected in the finan-cial metrics frequently used by investors will be explored later in this chapter.
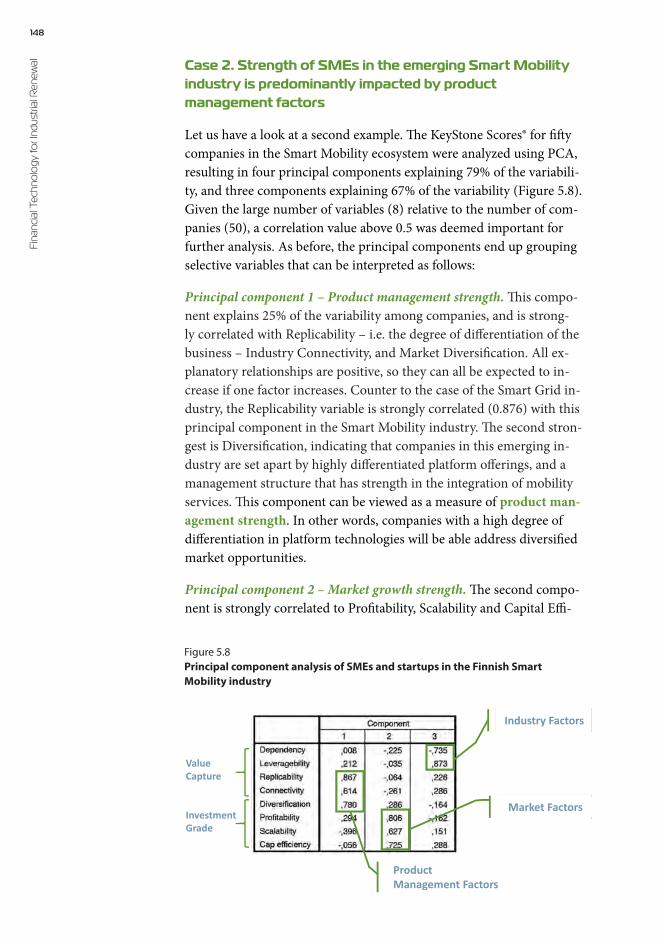
148Fi
nanc
ial T
echn
olo
gy fo
r Ind
ustri
al R
enew
al Case 2. Strength of SMEs in the emerging Smart Mobility industry is predominantly impacted by product management factors
Let us have a look at a second example. The KeyStone Scores® for fifty companies in the Smart Mobility ecosystem were analyzed using PCA, resulting in four principal components explaining 79% of the variabili-ty, and three components explaining 67% of the variability (Figure 5.8). Given the large number of variables (8) relative to the number of com-panies (50), a correlation value above 0.5 was deemed important for further analysis. As before, the principal components end up grouping selective variables that can be interpreted as follows:
Principal component 1 – Product management strength. This compo-nent explains 25% of the variability among companies, and is strong-ly correlated with Replicability – i.e. the degree of differentiation of the business – Industry Connectivity, and Market Diversification. All ex-planatory relationships are positive, so they can all be expected to in-crease if one factor increases. Counter to the case of the Smart Grid in-dustry, the Replicability variable is strongly correlated (0.876) with this principal component in the Smart Mobility industry. The second stron-gest is Diversification, indicating that companies in this emerging in-dustry are set apart by highly differentiated platform offerings, and a management structure that has strength in the integration of mobility services. This component can be viewed as a measure of product man-agement strength. In other words, companies with a high degree of differentiation in platform technologies will be able address diversified market opportunities.
Principal component 2 – Market growth strength. The second compo-nent is strongly correlated to Profitability, Scalability and Capital Effi-
ValueCapture
InvestmentGrade
Product Management Factors
Market Factors
Industry Factors
Figure 5.8Principal component analysis of SMEs and startups in the Finnish Smart Mobility industry
149 A
sset Allo
cation
ciency, and explains 22% of the KeyStone Score® variation. This is very similar to the market growth strength observed in the Smart Grid in-dustry. All factors are positively correlated and, thus, likely increase to-gether. The score for Profitability shows the strongest loading with the component, influenced by the competitive structure and growth rates of the target markets, lack of product commoditization, high expected margins for software services, direct engagement with the end-custom-er, recurring revenue models and high degree of control over the sales channels. The high correlation with Capital Efficiency supports the product-as-a-service (XaaS) business model in this industry.
Principal component 3 – Industry strength. This component explains 20% of the variation among companies, and is strongly loaded with two factors: increasing Leveragability and decreasing Dependency. As de-scribed previously in Chapter 4, Dependency on supply chain partners, policies and other skillsets is the other side of the coin of Leveragability. It explains why the factors are loaded in opposite directions. A compa-ny with high capability to leverage its assets will experience low depen-dencies on complementary capabilities in the supply chain. Converse-ly, a company that depends on supply chain partners that exert a lot of influence over bringing products to market will have low leverage of its assets. Hence, this component is a measure of industry strength.
Clustering of SMEs in the emerging Smart Mobility indus-try supports seven company profiles
How do the companies cluster with respect to their risk profiles? Based on relatedness of the principal component profiles of each company, up to seven clusters can be identified. To arrive at the clustering, we used the factor scores of each principal component for each company (Fig-ure 5.9). One random replicate, Oceanvolt Oy, was in-cluded as an internal check for consistency of the Key-Stone Compact® analysis.
The results show again that forward-looking non-finan-cial performance indicators can indeed be used to profile and differen-tiate companies based on product management factors, market growth, and industry strength factors. Importantly, this clustering is agnostic of industry codes and value chain segments of the Smart Mobility indus-try the companies operate in; the cluster analysis profiles cross-sectoral companies with similar strengths and weaknesses.
Let us look at an example. Mobinet and iQPayments (cluster 4) are classified in the ‘Business and Management Consultancy’ and ‘Data Processing’ industry codes, re-spectively. The contributions of Principal Component 1 (product management) is positive for both companies and Principal Component 2 (market growth) as well as Principal Component 3 (industry strength) are negative for both. The contribu-
Cluster analysis corroborates the cross-industrial structure of Smart Mobility
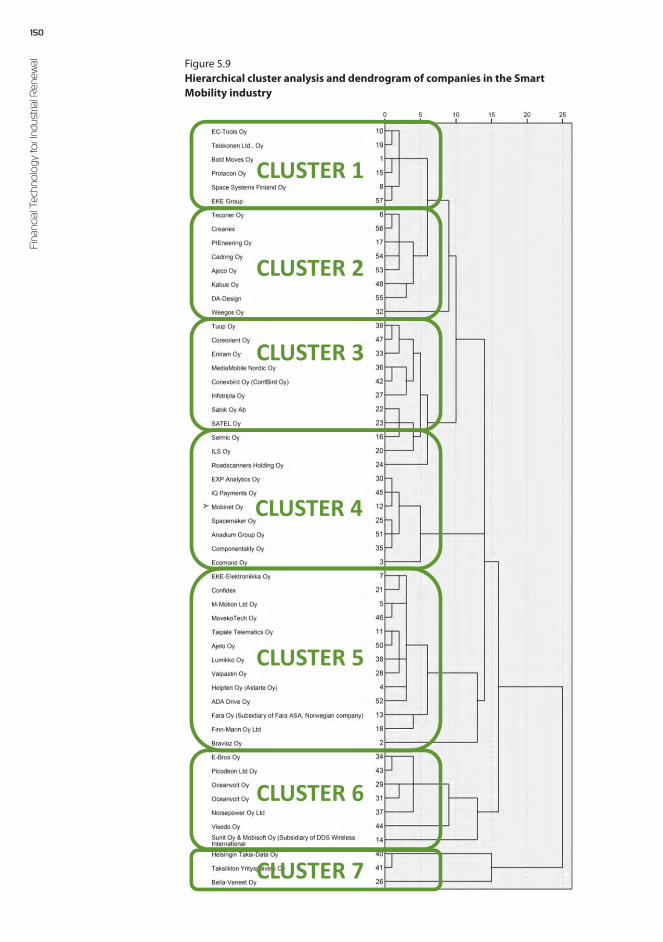
150Fi
nanc
ial T
echn
olo
gy fo
r Ind
ustri
al R
enew
al Figure 5.9Hierarchical cluster analysis and dendrogram of companies in the Smart Mobility industry
CLUSTER 1
CLUSTER 2
CLUSTER 3
CLUSTER 4
CLUSTER 5
CLUSTER 6
CLUSTER 7

151 A
sset Allo
cation
tions are similar in magnitude. On the other hand, when Mobinet (cluster 4) and Selmic (Manufacture of Electronic Components; cluster 3) are compared, Selmic shows negative loading factors for Product Management, while exhibiting posi-tive contributions for Market Growth and Industry Strength. Hence, the statistical relatedness algorithm places these companies in different clusters.
Similar to the observations in the Smart Grid industry, once the com-pany’s weaknesses are identified, remedial action can be designed. Companies with negative Product Management contributions will ben-efit from product design and market understanding, as well as from the services of an executive search firm. Companies with negative contri-butions of Market Growth may require a new business model or mar-keting assistance, while those with negative contributions of Industry Strength may need to consider changes in partnerships or pivot in the industry value chain. A deep dive in the underlying KeyStone Com-pact® assessment of the company is required to pinpoint weaknesses in all the variables used for the PCA.
A more in-depth interpretation of the cluster analysis is supported by the visualization of the factor scores for each principal component and company, as plotted in the radar chart below (Figure 5.10). Based on this chart, it appears that companies in the various clusters exhibit vari-
-2,5
-2
-1,5
-1
-0,5
0
0,5
1
1,5
2
2,5
Bold Moves OyEKE-Elektroniikka OySpace Systems Finland Oy
EC-Tools OyProtacon Oy
Teiskonen Ltd., Oy
EKE Group
Teconer Oy
PIEneering Oy
Weegos Oy
Kabus Oy
Ajeco Oy
Cadring Oy
DA-Design
Creanex
Infotripla Oy
Selmic Oy
ILS Oy
Sabik Oy Ab
SATEL Oy
Roadscanners Holding OyEniram Oy
Conexbird Oy (ContBird Oy)MediaMobile Nordic OyCoreorient Oy
Ecomond OyMobinet OyiQ Payments Oy
Anadium Group OyBravioz Oy
Helpten Oy (Astarte Oy)
M-Motion Ltd Oy
Taipale Telematics Oy
Fara Oy (Subsidiary of Fara ASA, Norwegian…
Finn-Marin Oy Ltd
Confidex
Valpastin Oy
Lumikko Oy
MovekoTech Oy
Ajelo Oy
ADA Drive Oy
Sunit Oy & Mobisoft Oy (Subsidiary of DDS…
Oceanvolt Oy
E-Bros Oy
Norsepower Oy Ltd
Picodeon Ltd OyVisedo OyBella-Veneet Oy
Helsingin Taksi-Data OyTaksiliiton Yrityspalvelu Oy
Market Growth Industry Strength Product Management
Cluster 6
Cluster 3
Cluster 4
Figure 5.10Radar plot of principal component factors for all Smart Mobility SMEs
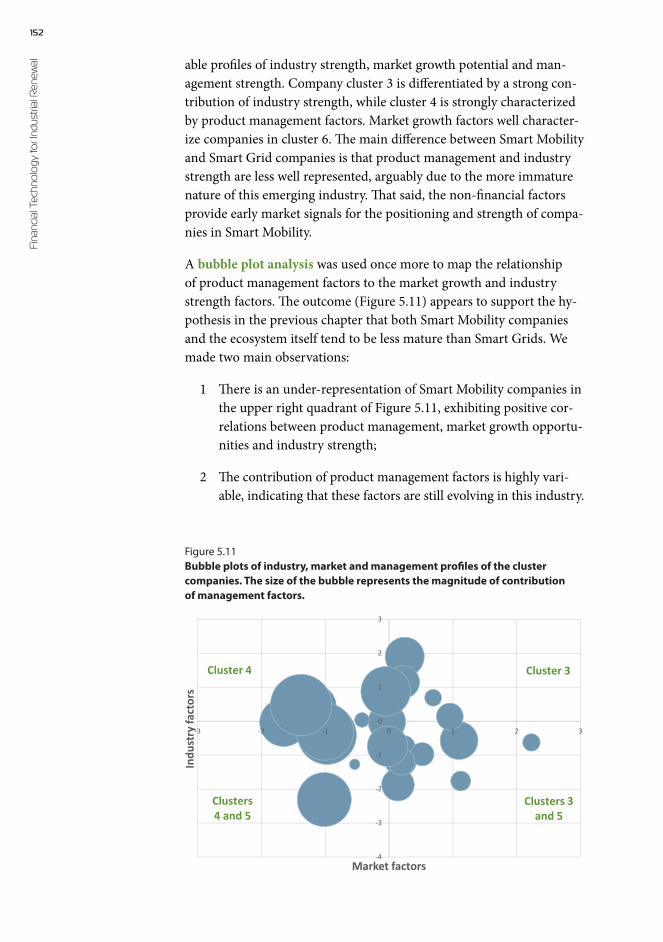
152Fi
nanc
ial T
echn
olo
gy fo
r Ind
ustri
al R
enew
al able profiles of industry strength, market growth potential and man-agement strength. Company cluster 3 is differentiated by a strong con-tribution of industry strength, while cluster 4 is strongly characterized by product management factors. Market growth factors well character-ize companies in cluster 6. The main difference between Smart Mobility and Smart Grid companies is that product management and industry strength are less well represented, arguably due to the more immature nature of this emerging industry. That said, the non-financial factors provide early market signals for the positioning and strength of compa-nies in Smart Mobility.
A bubble plot analysis was used once more to map the relationship of product management factors to the market growth and industry strength factors. The outcome (Figure 5.11) appears to support the hy-pothesis in the previous chapter that both Smart Mobility companies and the ecosystem itself tend to be less mature than Smart Grids. We made two main observations:
1 There is an under-representation of Smart Mobility companies in the upper right quadrant of Figure 5.11, exhibiting positive cor-relations between product management, market growth opportu-nities and industry strength;
2 The contribution of product management factors is highly vari-able, indicating that these factors are still evolving in this industry.
-4
-3
-2
-1
0
1
2
3
-3 -2 -1 0 1 2 3
Indu
stry
fact
ors
Market factors
Cluster 3Cluster 4
Clusters 3 and 5
Clusters 4 and 5
-2,5
-2
-1,5
-1
-0,5
0
0,5
1
1,5
2
2,5
-4 -3 -2 -1 0 1 2 3
Indu
stry
fact
ors
Market factors
Clusters 2 and 5
Cluster 3
Cluster 6
Cluster 8
Figure 5.11Bubble plots of industry, market and management profiles of the cluster companies. The size of the bubble represents the magnitude of contribution of management factors.
153 A
sset Allo
cation
Companies from only three out of seven clusters are represented in this plot – clusters 3, 4 and 5. They are the only ones demonstrating any meaningful product management strength. As a quick reminder, the contribution of management to a company’s success is valued extreme-ly high by investors. A company may very well be endowed with oth-er strengths and, yet, be ignored by the investment domain if it lacks strength in management.
In contrast, cluster 3 companies indicate a positive correlation between contributions of product management on industry strength and mar-ket growth, or only on market growth. Companies representing clus-ter 4 tend to have a strong positive correlation between product man-agement and industry strength. Companies from cluster 5 are mixed in with clusters 3 and 4, and have either a positive correlation with market growth, or negative correlations with both market and industry factors.
Financial metrics reveal that SMEs in the Smart Grid domain are more mature than those in the Smart Mobility industry
Now that the companies have been systematically analyzed for non-fi-nancial risk metrics, the discussion of the use of financial accounting metrics as an investor-driven and complementary step in the asset al-location process is pertinent. The objective of this section is to under-stand how the non-financial measures for the companies in the Smart Grid and Smart Mobility industry can be used together with account-ing metrics to make decisions about asset allocation strategy. To this end, financial metrics of the company groupings – obtained from pub-lic company registries in Finland – are averaged and compared between the clusters.
As stated earlier, accounting metrics are current or short-term indi-cators, whereas non-financial performance indicators are often used to understand forward-looking growth opportunities. The limitations of financial metrics in assessing performance for emerging economies such as new mobility, Smart Grid and Green Chemistry generate de-mand for non‐financial measures appropriate for evaluation of share-holder value creation2, 4–8.
Rarely is the relationship between both systematically investigated, and when it is, the research emphasizes specific investment classes, e.g. debt default, equity valuation, or stock price trends. Let us briefly shed light on the kinds of information used in the assessment of the two illiquid investment asset classes incorporated in the MARF, equity and debt. For a detailed treatment of the four asset classes of the MARF, please see the next chapter.
154Fi
nanc
ial T
echn
olo
gy fo
r Ind
ustri
al R
enew
al Equity Investment: Equity investors use a wide range of accounting and non-accounting information and techniques relating to the specif-ic factors concerning a particular investment. Unpublished accounting information and subjective information are important. Significant dif-
ferences exist in the approaches to valuation and use of accounting information for valuation purposes between types of venture capitalists, according both to their stage of investment focus and whether they are captive or in-dependent investors. Even though return on equity
(ROE), revenue, and profit margins are important in computing valu-ations, it appears that gross margins and non-financial information in-forming future growth are incorporated frequently.
Debt investment: Post-2007, banks have been paying attention to how non-financial risk metrics can be predictors of default for small and medium sized enterprises (2). Liquidity, leverage and profitability mea-sures such as current ratio, debt-to-equity ratio, debt ratio and EBIT-DA/total assets provide recent history information for default risk (8), and generally do not consider whether the company can bring the loan to maturity. Since the majority of the reasons SMEs fail is the lack of capitalization and long term planning, non-financial information that is forward-looking needs to be integrated in the risk assessment. Hence, increasingly, firm-level information such as age, type of busi-ness and industrial sector (e.g. industry insolvency) are used in con-junction with accounting information.
While the equity asset class in the MARF is fairly conventional, the debt asset class requires further introduction because of its particular nature. In the case of the multi-asset fund, the debt asset class focus-
es on leveraged finance. This is a type of funding for a company or business unit with more debt than would be considered normal for that company or industry. Levered finance is commonly employed to achieve a specific, often temporary, objective: to make an acqui-
sition, to effect a buy-out, or to invest in a self-sustaining cash-gener-ating asset. This type of finance generally includes two main products: leveraged loans and high-yield bonds. Leveraged loans, which are often
Box 5.1 Mezzanine debt
A key instrument in leveraged finance that has long been used by mid-cap private companies in Eu-rope and the US as a funding alternative to high-yield bonds or bank debt. The product ranks between senior bank debt and equity in a company’s capital structure, and mezzanine investors take higher risks than bond buyers but are rewarded with equity-like returns averaging between 15 and 20 per cent.
Equity investors use a wide range of accounting and
non-accounting information
Levered finance is commonly employed to achieve a
specific objective

155 A
sset Allo
cation
defined as credits priced 125 basis points or more over the London in-terbank offered rate, are essentially loans with a high rate of interest be-cause of the higher risk posed by the borrower. High-yield bonds are those that are rated below „investment grade,” i.e. lower than triple-B.
When applying financial metrics on the assessment of assets, it should be stressed that, depending on the asset class, the specific metrics differ considerably. Companies that are suited for debt investments need to meet a different set of criteria than those considered for equity invest-ments. At the risk of generalizing, let us briefly describe the space of fi-nancial metrics used by investors to assess the attractiveness of both debt and equity investment opportunities.
With regard to debt investments, financial ratios that are used as pre-dictors for credit risk emphasize liquidity. A select subset of ratios is described in Box 5.2: debt ratio, current ratio, and debt-to-equity ra-tio. Generally, higher financial liquidity and lower leverage are desired for the company to service debt over the lifetime of the loan. Lower li-
Box 5.3 Profitability and Efficiency Metrics
1 Net asset turnover: A measure of operational efficiency – net sales over average total assets
2 Return on equity (ROE): Net profit generated per share
3 EBITDA: Earnings before interest, taxes, depreciation and amortization, relative to total revenue
Box 5.2 Liquidity and Leverage Metrics
1 Debt ratio: short + long-term liabilities over current + long-term assets
2 Current ratio (liquidity): current assets over current liabilities
3 Debt-to-equity ratio: short + long-term liabilities over shareholders’ equity
quidity and higher leverage both increase the probability of default and, hence, increase the risk involved in the investment. As described earli-er, the debt incorporated in the MARF is not working capital, but lev-eraged debt financing. Working capital is usually employed to increase the liquidity of companies to run their daily operations. It is used for purposes such as smoothing out cash flows in highly cyclical businesses and to finance outstanding receivables. Leveraged debt, in contrast, is riskier and used for financing ambitious growth opportunities, not for running business as usual.
156Fi
nanc
ial T
echn
olo
gy fo
r Ind
ustri
al R
enew
al With regard to equity investments, venture capital and other forms of risk capital investing heavily rely on non-financial measures, for-ward-looking business plans, strong management, and proof of trac-tion in the market usually represented by revenue growth or gross mar-gins. We use three financial metrics to compare company groupings be-tween the clusters: EBITDA margin and return on equity (ROE), both as a measure of profitability, and net asset turnover, a measure of cap-ital efficiency. As most equity investable companies are private, access to their financial data is rather difficult outside the Nordics and other countries with public access to such data. Therefore, the financial anal-ysis of private companies will often involve using data of publicly trad-ed comparables as proxies (see Chapter 7). However, since we do have direct access to the required data in Finland, we are able to use margin and capital efficiency analyses to gauge profitability, scalability, and cap-ital efficiency of the companies.
The financial metrics were mapped for clusters of Smart Grid (Figure 5.12) and Smart Mobility (Figure 5.13) companies and show startling differences between these industries.
Smart Grid industry indicates favorable metrics for companies with strong management and industry strength profiles
With the caveat that the numbers are averages for company perfor-mance over the last twelve months, the financial metrics for Smart Grid companies are very stable and consistent between the clusters. Aside from return-on-equity (ROE), which indicates elevated numbers for
clusters 2, 3, and 6, the radar diagram indicates that all Smart Grid clusters exhibit consistent liquidity and lever-age ratios on the one hand, and profitability and efficiency ratios on the other. Operating margins (EBITDA) range
from 12–25%, current ratios vary between 2 and 7, and debt ratios are generally below 1. Net asset turnover hovers around 5, and ROE ranges from negative to about 20.
Note that the clusters with elevated ROE were also the clusters that boasted the strongest management and industry strength profiles (Fig-ure 5.6), and cluster 6 was characterized by a positive correlation of management factors to industry strength (Figure 5.7). Cluster 5, which exhibits a negative ROE, but otherwise similar ratios to the other clus-ters, was shown to have the highest market growth potential in the KeyStone Compact® analysis. In addition, this was one of two company clusters (2 and 5) with a positive correlation between management fac-tors, industry strength and market growth. Cluster 2 boasts the highest
Metrics for Smart Grid companies are very stable
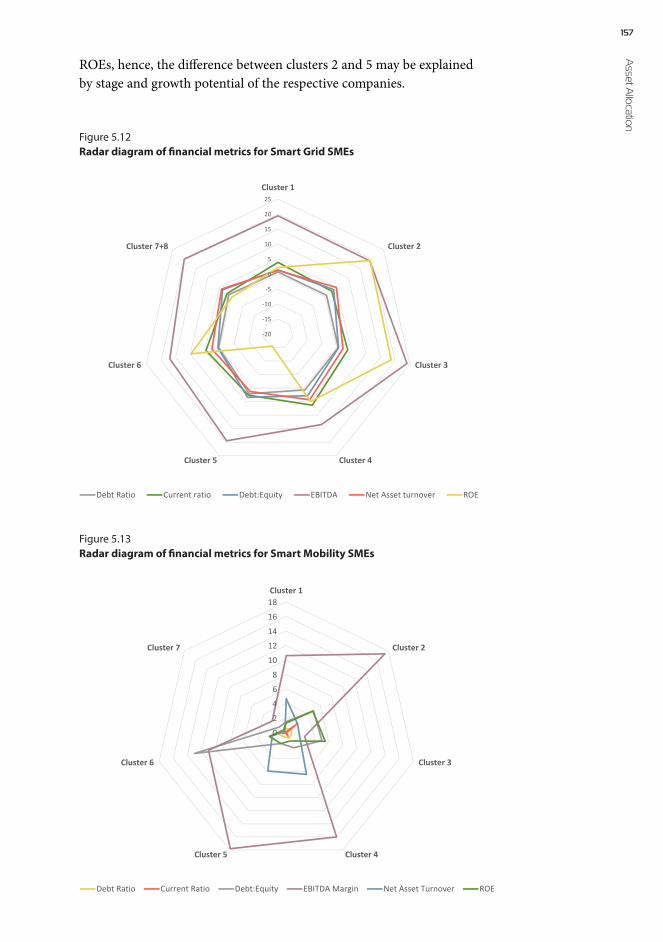
157 A
sset Allo
cation
ROEs, hence, the difference between clusters 2 and 5 may be explained by stage and growth potential of the respective companies.
-20
-15
-10
-5
0
5
10
15
20
25
Cluster 1
Cluster 2
Cluster 3
Cluster 4Cluster 5
Cluster 6
Cluster 7+8
Debt Ratio Current ratio Debt:Equity EBITDA Net Asset turnover ROE
0
2
4
6
8
10
12
14
16
18Cluster 1
Cluster 2
Cluster 3
Cluster 4Cluster 5
Cluster 6
Cluster 7
Debt Ratio Current Ratio Debt:Equity EBITDA Margin Net Asset Turnover ROE
Figure 5.12Radar diagram of financial metrics for Smart Grid SMEs
Figure 5.13Radar diagram of financial metrics for Smart Mobility SMEs
158Fi
nanc
ial T
echn
olo
gy fo
r Ind
ustri
al R
enew
al Smart Mobility companies exhibit favorable financial met-rics for clusters with strong product management profiles
The pattern is not as clear in the case of Smart Mobility companies be-cause all metrics are highly variable. For example, EBITDA margins vary from 2-18%, and debt-to-equity (D:E) range from near zero to 12. The ROE is generally low, with only two clusters reaching similar val-ues to those of Smart Grid companies. To call out a few highlights, two clusters (2 and 5) exhibit the highest EBITDA margins, and clusters 4 and 5 have the highest efficiency (net asset turnover) around 6.
Let us relate these observations to those from Figures 5.10 and 5.11. Cluster 3 exhibits the strongest industry strength profile, and has the highest ROE. Moreover, companies in this cluster were characterized as exhibiting a positive correlation between product management, in-dustry strength and market growth. Product management factors were shown to be highest in cluster 4, which also showed a correlation with industry strength. These clusters have also the highest net asset turn-over and reasonable EBITDA margins. Further, cluster 6 was shown in Figure 5.10 to be differentiated by strong market growth factors. In the financial analysis, this is the cluster with companies showing the high-est D:E ratio, and are thus already very leveraged. Cluster 5 only ap-peared in the prior analysis as having companies giving weak market signals, and negative industry strength signals.
The average age of the Smart Mobility companies tends to be low-er than that for the Smart Grid, and the ecosystem for private compa-nies is very immature, compared to those in the Smart Grid ecosystem. Hence, most of these companies are likely already highly leveraged with low cost debt financing, and would not be attractive for leveraged debt financing until a later stage in their development.
Technology tools for investment analysis and asset allocation strategy
Perhaps the most evident area where financial technology (‘FinTech’) has impacted the world of investing is in the capabilities we now have to analyze investments and investment strategies. Ranging from the basics at Yahoo Finance and Google Finance to the more advanced an-alytical tools offered through Morningstar and Bloomberg terminals, to a host of other specialized sites for investment analysis, our capabilities for investment analysis have come a long way from where they were just a few decades ago. Data-driven tools have augmented the ‘search and selection’ process for stocks and portfolios but not replaced it. It is about process efficiency.

159 A
sset Allo
cation
Beyond the capabilities of technology to support investment analysis, technology is also changing how investments and investment strat-egies are implemented. Online investing for the past 20 years has pri-marily been about picking stocks and mutual funds (and, more recent-ly, ETFs). The latest technology evolution disrupting the world of in-vesting is by way of so-called robo-advisors – services like Betterment and Wealthfront that construct the entire asset-allocated passive strate-gic (multi-asset) portfolio for the investor for a mere 0.25% of AUM or less. In addition to cost, technology offerings allow for increased levels of asset diversification with far more granularity and control.
These FinTech innovations – analytical efficiency and granularity of pre-dictive insights – currently available in the marketplace work well for traded stocks and portfolios, but are not tailored to applications where non-financial and financial risk measures need to be integrated, such as risk management of illiquid asset allocations. This chapter aimed to ex-pand on the asset allocation strategy in the leveraged debt and equity asset classes. Given the trends (‘what’) and insights (‘why’) of the pre-ceding analysis, it is now possible to develop an actionable rules-based approach to assign companies to debt or equity investment assets.
The structure of the financial technologies underpinning the asset al-location strategy is depicted in Figure 5.14. There are four tiers in the
Financial NetworkAnalytics
PVC Invest.KeyStone RiskAnalytics
Industry
Mar
ket Non-Financial &
Financial Trend Analytics
Rules-BasedDecision Process?
Rules Repository
Figure 5.14Rules-based asset allocation process based on non-financial and accounting metrics

160Fi
nanc
ial T
echn
olo
gy fo
r Ind
ustri
al R
enew
al process: (i) financial network analytics to gain insights on industry structure; (ii) KeyStone Compact® analytics to quantify non-financial risk drivers at a granular level; (iii) statistical analysis of non-financial and financial metrics; and (iv) a rules-based approach on how to use the insights to make decisions on asset allocation. Since all tiers have a place-based (e.g. Finland), regional (e.g. Nordic), and industry-spe-cific (e.g. Smart Grid) character, the insights gleaned from the trends, and the rules structured based on the insights need to be adapted to the specific situation.
Finland’s Smart Grid industry and market are more mature than its mobility industry and market. As a result, the KeyStone Scores® and trend analytics of companies engaged in these emerging industries vary significantly. The financial and non-financial profiles are stored sepa-rately, as inputs for the rules engine that makes the allocation decision. The rules themselves need to be manageable ‘statements of actions that should be taken if certain company conditions are true’. For example:
If a smart grid SME is placed in ‘high_growth’ PVC and ‘traditional_equity’ investment grade and a positive relation exists between management and both market and industry strength and its (efficiency metrics) ROE is greater than 10, and its asset turnover is between 3 and 5 then allocate company to private equity asset class
If a smart mobility SME is placed in ‘high_growth’ PVC and ‘traditional_equity’ investment grade and a positive relation exists between management and industry strength only and its (efficiency metrics) ROE and net asset turnover are both greater than 5 then allocate company to private equity asset class
If a smart mobility SME is placed in uncertain_value_ capture PVC and creative_capital investment grade and a positive relation exists between management and market growth only and its profitability and liquidity metrics meet targets (e.g. current ratio >5; debt ratio <5; EBITDA >15%) then allocate company to leveraged debt asset class
The target values will be different based on company, industry sector, and market maturity as well, and will evolve. In addition, based on in-dustry practice, we have weighted the non-financial metrics higher in the decision rules than the financial (accounting) metrics. Let us use two specific examples to illustrate the rules-based allocation strategy.Aidon is a smart metering company. Its KeyStone Scores® place the company in the high growth PVC and traditional equity investment quadrants. It belongs to cluster 2, with companies that exhibit a posi-tive relationship between management and both industry strength and

161 A
sset Allo
cation
market growth potential. The company shows an ROE of 5.47 and a net asset turnover of 2.54, and is thus in the 3-5 target range for its cluster and equity assets allocation. Both non-financial and financial metrics support allocated to the equity asset class. The decision will depend on shareholder preferences.
Mobinet Oy is an early stage mobility management software company. Its KeyStone Scores® placed it in the niche business PVC and non-eq-uity investment quadrants. The company belongs to cluster 4, which is characterized by a positive relationship between (product) manage-ment and industry strength, but negative relation to market growth (in part because of the immature market). Its financial metrics indicate low liquidity, low profitability, but positive efficiency numbers, typical of a well-run early stage company, but do not meet the target values for eq-uity investment. Given the majority weight on non-financial metrics –strong position in the industry – the company would be a candidate for equity investment.
This process was used to allocate the pool of all Smart Mobility and Smart Grid SMEs to the debt and equity asset classes for the multi-as-set renewal portfolio. The list of companies considered is shown below (Figure 5.15). Note that not all companies were included in the final portfolio performance assessment.
Smart Grid IndustryLeveraged Debt Private Equity
Elkamo Oy AB
BaseN
Aidon
Headpower
Enoro Oy
Sensire
Refecon Oy
Reaktor Innovations
Kemet Electronics
AC2SG Software
Enersize Oy
Nuuka Solutions Oy
Futurice Oy
Sust. Energy Asset Mgmt Oy
Hoxville Oy
HomeControl Finland
Ambit
Polarmit Oy
Keypro
Cozify Oy
Wirepass
Norelco
Foreca Oy
Selmic Oy
Yap
Ouman Oy
Power Instruments
Smart Mobility IndustryLeveraged Debt Private Equity
Teconer Oy
Creanex Oy
PIEneering Oy
Cadring Oy
Ajeco Oy
Kabus Oy
DA-Design
E-Bros Oy
Picodeon Ltd Oy
Oceanvolt Oy
Norsepower Oy
Visedo Oy
Weegos
Bravioz Oy
Coreorient Oy
EXP Analytics Oy
iQ Payments Oy
Mobinet Oy
Spacemaker Oy
Anadium Group Oy
Componentality Oy
Ecomond Oy
Figure 5.15Pool of Smart Grid and Smart Mobility SMEs allocated to debt and equity investment asset classes. Final allocation in the portfolio is further discussed in the performance assessment.

162Fi
nanc
ial T
echn
olo
gy fo
r Ind
ustri
al R
enew
al References1 Ernst & Young (2015). Rethinking Risk Management, EYGM Ltd, New York2 Ittner, D. & Larcker, D. F. (2003). Coming Up Short on Nonfinancial Performance
Measurement. Harvard Business Review, November 2003.3 Chow, C.W. & Van der Stede, W. A. (2006). The Use and Usefulness of Nonfinancial
Performance Measures. Management Accounting Quarterly 7(3): pp. 1–8.4 Hussain, M., Gunasekaran, A. & Islam, M. M. (2002). Implications of non-financial
performance measures in Finnish banks. Managerial Auditing Journal 17(8):452–463.5 Hussain, M. & Gunasekaran, A. (2002). An institutional perspective of non-financial
management accounting measures: a review of the financial services industry, Managerial Auditing Journal 17 (9): pp. 518–536.
6 Chenhall, R. H. & Langfield-Smith, K. (1998). The relationship between strategic priorities, management techniques and management accounting: an empirical investigation using a systems approach. Accounting, Organizations and Society 23 (3), pp. 243–264.
7 Cumby, J. & Conrod, J. (2001). Non-financial performance measures in the Canadian biotechnology industry, Journal of Intellectual Capital 2 (3): pp. 261–272.
8 Altman, E. I., Sabato, G. & Wilson, N. (2010). The value of non-financial information in small and medium-sized enterprise risk management. The Journal of Credit Risk 6 (2): pp. 95–127.

Multi-Asset Renewal Fund6Form Follows Strategy – The Design of a New Fund Structure

164Fi
nanc
ial T
echn
olo
gy fo
r Ind
ustri
al R
enew
al Form Follows Strategy – The Design of a New Fund Structure
Now that the asset allocation strategy has been described, the ratio-nale behind the fund design and portfolio construction needs detailed consideration. Given the high degree of variability of institutional in-vestors, the fund structure will primarily focus on yield and risk of as-set classes, and combinations thereof. It is not in the scope of this book to go into detail into the fiduciary, legal and regulatory compliance re-quirements as required under Finnish and EU policies for occupation-al pension funds, given the diversity and regulatory complexities. The chapter will also not consider tax implications of regulated (‘tax trans-fer’) and non-regulated (‘alternative’) investment vehicles. Rather, the chapter will describe trends in capital allocation shifts and types of in-vestments pension funds are considering in search of yield. We assume that – implicitly – these trends are in compliance with all laws and reg-ulatory compliance matters, as required.
As an example of regulatory complexity, policies such as Directive 2003/41/EC of the Institutions for Occupational Retirement Provi-sion, are relevant to our proposed fund structure. The Directive was designed to create an internal (EU) market for occupational retire-ment provision, and lays down minimum standards on funding pen-sion schemes, the types of investments pensions may make and per-mits cross-border management of pension plans. Since the technical requirements under these types of directives are specific to pension funds, and do not apply to sovereign wealth funds and endowments, we leave the reader to consider other resources1, 2. Indeed, sovereign wealth funds are special purpose vehicles, with limited transparency take investment decisions driven by political and/or strategic objectives and considerations, or in a fashion entailing national security concerns.
More apt to the content of this chapter, we will discuss the relevance of our new fund design in the context of the recently approved European Long-Term Investment Fund (ELTIF), which aims to combine illiquid
“Investing money is the process of committing resources in a strategic way
to accomplish a specific objective.
– Alan Gotthardt, The Eternity Portfolio

165 M
ulti-Asset R
enewal Fund
and liquid financial assets in a single investment vehicle. ELTIFs will invest in long-term illiquid assets, such as unlisted companies, real es-tate and infrastructure projects. To meet its fund gathering objective, the ELTIF will be granted a European passport but will have to be man-aged by an authorized European Alternative Investment Fund Manager (“AIFM”).
New fund structuring opportunities need to consider selection of asset classes and management models
When it comes to building a portfolio, some institutional investors fo-cus on selecting the right fund manager or security. However, manag-er selection forms only a small part of the process. At a broader level, portfolio construction is a systematic process. The focus should be on structuring your portfolio such that it has the best chance of meeting your stated investment aims within your acceptable level of risk.
Professional investors begin by exploring investment risk and what they need the investment to do for them. They then work through a series of steps, creating a framework to decide which types of invest-ments are needed. Only then do they choose individual funds or other investments. The Vanguard Group, a US investment management com-pany with $3 trn. in assets, refers to this approach as top-down invest-ing. This approach stands in contrast to that of private investors, who
Figure 6.1The difference between top-down and bottom-up portfolio structuring
Top-down portfolio
Top-down investing
• Often used by profes-sional investors
• Starts with invest-mentobjectives and structureof overall portfolio beforese-lecting funds ormanagers
Bottom-up portfolioBottom-up investing
• Often used by privateinvestors
• Builds portfolio bypiecemeal, ad hocselection of fundmanager or product.
Asset Allocation
Sub-Asset Allocation
Active / Passive Balance
Manager / Fund Selection
166Fi
nanc
ial T
echn
olo
gy fo
r Ind
ustri
al R
enew
al often start with selecting the manager or fund, rather than with the in-vestment objective and structure.
As shown in Figure 6.1, the basic building blocks of top-down struc-tured investments are divided into different asset classes such as equi-ties, bonds, property and cash. These asset classes need to be diversi-fied, i.e. spread across a broad mix of assets. The rationale for diversi-fication is that investment markets move in different cycles, reflecting the underlying strength of the economy, industry trends and investor sentiment. Individual assets also move differently according to exter-nal factors, including policy changes. Portfolio diversification can help smooth out market ups and downs, such that returns from better per-forming assets help to offset those that aren’t performing so well.
Each asset class is comprised of a broad variety of sub-asset classes. For example, a sub-asset class within equities might include: large com-panies, smaller companies, growth funds, income funds and global eq-uities. The debt sub-asset class may be defined by early and later stage companies, as well as companies across multiple industry sectors. Just as when you combine the major asset classes, diversification is essential when choosing sub-assets. It helps to ensure that you don’t take on too
much risk by concentrating in a particular sub-as-set class, for example holding a spread of debt at different credit risk ratings (triple-A to junk).
In addition to the diversification strategy, another decision that needs to be made in portfolio structuring is on the style of the investment fund: is it the objective to actively or passively man-age the portfolio? Is the manager to actively engage in the business of invested companies to drive the value of both the company and the re-spective investment, or is she not? For example, index funds simply seek to reflect the performance of the market. They work by attempt-ing to closely track an index. The manager is not actively involved in the invested companies but only re-balances a portfolio of stocks at given intervals to follow an index of stocks that she has chosen as a benchmark. Actively managed funds, in contrast, often adopt a hands-on management style, which they hope will result in greater gains than those of an index or other benchmark, by selecting and becoming en-gaged with specific companies or equities. They combine research, mar-ket forecasting, and the experience and expertise of a portfolio man-ager or management team. Management of active or passive portfolios requires different skillsets, experience, and varies in governance costs. In recent years, actively managed funds have started to adopt finan-cial technology innovations such as complex algorithms and ‘funds in a box’, an end-to-end management technology solution for hedge funds.
Actively managed funds often adopt a hands-on management style
167 M
ulti-Asset R
enewal Fund
How do these concepts apply to the structuring of the Multi-Asset Renewal Fund?
The motivation of this project was to devise an investment strategy that would allow nations and regions to efficiently source companies and al-locate investments to renew their legacy economies into green econo-mies. In Finland, management consultants and government policy doc-uments have defined and described various versions of Cleantech-driv-en economies and Bioeconomies, but they tend to gloss over invest-ment strategies detailing how these transitions are to be executed. The strategies implicitly engage subsidies, policy-driven government invest-ment funds, and first-loss guarantee programs (more on this later), but tend to be less specific about the engagement of market-driven invest-ment actors.
Hence, the execution of such transitional (‘renewal’) investment strate-gies is fraught with many technical, as well as risk and return challeng-es, which will be discussed in this chapter. The topics include:
1 How can economic development goals and long-term institu-tional investor objectives be reconciled?
2 What is a green economy, and how is this tracked or assessed?3 Does investing in green assets or markets constitute a fad,
subject to policy volatility?4 What does a diversified portfolio structure of asset classes and
sub-assets look like?5 What is the investment style and governance structure of a
MARF?
The investment objective of a MARF is to drive economic development at enhanced market returns
The premise of the MARF’s development work, and the need for the new investment structure is that the current financial system is bro-ken. We claim that it is unnecessarily agnostic of potential benefits to society. With some re-plumbing of the financial system, finance could indeed be harnessed for economic development without compromis-ing the level of returns demanded by today’s professional investors. A recent paper by Luigi Zingales of the Chicago Booth School of Busi-ness argues that finance is increasingly per-ceived as a rent-seeking activity3. This means that finance is increasingly preoccupied with obtaining economic gain from others without reciprocating any bene-fits to society through wealth creation. A recent fascinating book, titled “Makers and Takers: The Rise of Finance and the Fall of American Busi-
The current financial system is broken
168Fi
nanc
ial T
echn
olo
gy fo
r Ind
ustri
al R
enew
al
ness (4)”, further argues that in all advanced economies, most of the money in the system is used for lending against existing assets, such as housing, stocks and bonds. The unfortunate effect is a decrease in lend-
ing to small business, and increased financializa-tion of the economy.
Recall that the textbook definition of the financial sector is: “The intermediation of household savings for productive investment in the business sector.” In
plain words, finance was originally designed to take individual and cor-porate savings, and funnel them into productive enterprises, create new jobs, and drive economic growth, creating wealth along the way. As a result of financialization, the pipeline from finance to economic growth has been largely shut off. Institutional investors such as pension funds and sovereign wealth funds have been both victims and enablers of this trend, as they are looking for growth of their assets to meet their fidu-ciary mandates.
Let us explain.
Many pension funds tend to be relatively small in terms of the mod-ern standards in the finance industry and are managed by – often part-time – lay trustees. As a result, many pension funds lack the scale and internal skills to (i) effectively and efficiently manage the increasing complexity of investment options, (ii) undertake dynamic approach-es to manage the increasing volatility of financial markets, and (iii) re-spond to regulatory complexity. Hence, they have outsourced asset management through a combination of advisory and delegated invest-ment services to achieve the asset owner’s overall investment objectives.
This is referred to as fiduciary management. On-ly asset owners that have sufficient scale – large pen-sion funds, for instance – can organize themselves in an economically efficient and financially sustainable
manner to handle this increasing complexity. The scale of the assets un-der management, increasing specialization as a direct result of the in-creasing complexity itself, and availability of increasingly powerful in-
Box 6.1 Financialization
An increase in the size and importance of a country’s financial sector relative to its overall economy. This occurs as countries shift away from industrial capitalism, thus impacting macro- and micro-eco-nomic behavior. Financialization changes the structure and operation of financial markets, and influ-ences corporate behavior and economic policy.
Source: Investopedia.
As a result of financialization, the pipeline from finance to economic
growth has been largely shut off
Pension fund investing may have contributed to financialization

169 M
ulti-Asset R
enewal Fund
formation technology have contributed to a further increase in the minimum size that is required to efficiently manage institutional assets.
External investment managers are generally paid based on portfolio size as well as performance based on exceeding a benchmark return and adherence to the risk parameters set by the board. Hence, pension fund investing may have contributed to financializatione.g. 5–8.
This is where Multi-Asset Renewal Funds (MARFs) come in. Indus-trial renewal requires a cautious return to industrial capitalism, while not sacrificing the asset returns that institutional investors seek. Over the last three years, we held meetings with investment stakeholders, in-cluding asset managers, asset owners, economic developers, investment consultants, and rating agencies. Often, the structure and governance of such fund was broached in our discussions. Whereas the fund struc-ture will be further explored later in this chapter, it is necessary to lay the groundwork for the rationale of this new investment vehicle.
1 What are the current options of asset classes included in fund structures?
2 What are the allocation strategies of institutional investors?3 What is behind the recent trend towards multi-asset funds?4 What is the proposed structure of Multi-Asset Renewal Funds?
When answering these questions, we will also address issues such as: “How are active and systematic risk balanced?”; “How do multi-asset funds provide diversification options?”; and “Why is this financial in-novation important for the renewal of economies?”.
Box 6.2 What is the financial technology innovation of the MARF?
The integration of financial network analytics and a rules-based allocation strategy of the underlying assets to allow large institutional investors and government actors to efficiently invest in and grow emerging industry ecosystems. By combining companies across the business lifecycle – from start-ups to public equities – and distributing investments over liquid and illiquid asset classes, the MARF achieves efficient blending of the real economy with the financial economy.
Going green: Multi-Asset Renewal Funds are investment vehicles for systemic economic development
An important mandate of our work is to scale investment in the green-ing of the Finnish economy, while creating jobs and stimulating eco-nomic growth, and generating market-driven returns for its investors. Even though we advocate a value-chain driven approach, early on it

170Fi
nanc
ial T
echn
olo
gy fo
r Ind
ustri
al R
enew
al was unclear how the investment vehicle needed to be structured, what the fiduciary limitations were from an investor perspective, and how the investment mandates could result in tangible economic growth. Add to this process the aspiration to leverage existing assets and knowl-edge in the current economic structure such that we did not need to re-build a green economy from scratch, and one rapidly deals with a chal-lenge that crosses technical, financial, policy and legal dimensions.
The aspiration to transition to low carbon, ‘green’ economies is not new, and has been building and evolving for a long time. A key question is: What does this mean from the perspective of macro- and micro-eco-nomic investment policy? Individual companies and their supply chains do not drive an economy, the historical success of Nokia in Finland notwithstanding. Industrial renewal and transitional financing mecha-
nisms need to take on more of a long-term macro-eco-nomic character, while stimulating the underlying assets – the microeconomics – in the country or region. To be long-lasting and perpetual, industrial renewal and the respective financing really need to be market-driven, they need to have economic momentum of their own. Politi-
cal realities are such that subsidies will more often than not do the trick. People who defend subsidies for particular sectors often highlight the goods or services that have been produced, or the new jobs created. This may be true in the short-term; subsidies may support the development of priority projects, but they fail to build lasting growth enterprises.
According to the Global Subsidies Initiative of the International Insti-tute for Sustainable Development9, economists generally agree on two outcomes with respect to subsidies:
1 Depending on the form and conditions of the policy, subsidies have static, first-order effects, resulting in economic distortions and diverting resources from more productive to less productive uses, thus reducing economic efficiency.
2 There is a tendency over time for the benefits from subsidy pro-grams to become capitalized into the least elastic factor of pro-duction, sometimes referred to as the “transitional gains trap”, i.e. the gains are mainly accrued to those who can immediately take advantage of a new scheme.
Neither of these conditions is compatible with the fiduciary responsi-bilities of pension funds and other long-term investors, nor with the objective of developing green growth in industries and economies. Hence, the development of the MARF investment instrument needs to adhere to sound principles of finance as highlighted in the Green Econ-omy Roadmap of the International Chamber of Commerce10. The road-
To be long-lasting and perpetual, industrial renewal and the respective financing really need to be market-driven
171 M
ulti-Asset R
enewal Fund
map emphasizes the essential role of business, and sets out a suite of conditions which relate to business/intra-industry and integrated poli-cy for a transition towards a green economy. The necessary conditions for greening economies naturally include innovations in finance and investment, which are the objectives of our work here.
The MARF portfolio structure needs to reflect an industry-based green investment strategy.
Bringing together outcome-driven economic development with finan-cial performance-driven investment and asset allocation strategies ne-cessitates a deeper discussion on the technicalities of potential invest-ment vehicles.
Historically, the investment in green projects – particularly sustainable energy sources and clean technology – have been relegated either to the domain of risk finance, including venture capital and private equity, or to government-subsidized investments. As technologies matured and were increasingly deployed under various environmental policies, debt finance and project finance with steady cash flows en-tered the financing arena. Over the last decade or so, green economic growth has been fueled by a combi-nation of strong policy support and scalable enterpris-es in renewable energy generation, energy efficiency, LED (light emit-ting diode) lighting, and the like. More recently, public companies such as Yieldco’s have enabled further economies of scale and competitive pricing mechanisms through business model innovations such as long-term power purchase agreements (PPAs).
Most pension funds are more interested in lower risk investments which provide a steady, inflation-adjusted income stream, including longer-term project and debt finance. Consequently, green bonds have garnered gaining interest as an asset class, particularly – though not only – with the Responsible Investment (RI) universe of institutional investors11. Yet, despite the interest in these instru-ments, pension fund asset allocation to such green investments remains low. This is partly due to a lack of environmental policy support, but other barriers to investment include a lack of appropriate invest-ment vehicles and market liquidity, scale issues, regulatory disincentives and lack of knowledge, track record and expertise among pension funds about these investments and their associated risks. To tap into this source of capital, governments have a role to play in ensuring that attractive opportunities and instruments are available to
Box 6.3 MARF Design objective
To integrate the role of governments and institutional investor needs for investment vehicles with sufficient market liquidity.
Green bonds have garnered gaining interest as an asset class
172Fi
nanc
ial T
echn
olo
gy fo
r Ind
ustri
al R
enew
al pension funds and institutional investors. This was the mission of the MARF design.
On the one hand, investments in economic development that empha-size jobs and economic growth tend to involve subsidized loans and grants for individual companies and government-financed projects, aiming to reach policy objectives. Sometimes, government venture capital funds or investment firms (i.e. those not required to disclose an internal rate of return – or IRR – on investment) will either co-in-vest or provide follow-up capital to help grow the company. In Fin-land, agencies and organizations such as Tekes, Finnvera, Finnish In-dustry Investment (Teollisuussijoitus), CleanTech Invest, and Sitra are representatives of this type of capital and investment objective. Of-ten, these investments are driven by policy objectives, such as promot-
ing Cleantech, the bioeconomy, healthcare, and the like. Private investment funds that make equity in-vestments in companies often also strike a themat-ic, but need to demonstrate attractive IRR perfor-mance as well.
On the other hand, pension funds, sovereign wealth funds, and endowments are careful to not fol-low a fad or policy trend, because the longevity of these investment opportunities is not market-driv-en. Typically, a board of trustees sets policies for in-
vestment management and asset allocation, deciding how much of the portfolio is allocated to stocks, bonds, real estate, and other investment classes. As a result, pension funds usually don’t have major allocations to direct private investment placements, but invest in funds to en-able the scale afforded by pooled investments. For most public pension funds, the hiring of staff is generally governed by state and local agen-cy regulations, while the process of soliciting and executing contracts with external professionals – including investment managers – is sub-ject to procurement procedures and public review. Investment consul-tants with a deep background in finance work with staff and the board to help develop and review investment policies (Box 6.5).
Responsible investment (RI): Where pension investment strategies meet economic realities
Let’s illustrate the connection between green policy objectives and in-stitutional investment mandates using the concept of responsible in-vestment (RI). According to the PRI (Principles for Responsible Invest-ment), RI is “an approach to investing that aims to incorporate environ-mental, social and governance (ESG) factors into investment decisions, to
Box 6.4 Internal rate of return (IRR)
A metric used in capital budgeting measuring the profitability of poten-tial investments. The term internal refers to the fact that its calculation does not incorporate environmen-tal factors, e.g., the interest rate or inflation.
173 M
ulti-Asset R
enewal Fund
better manage risk and generate sustainable, long-term returns, and to have positive societal impact”. Some of the main drivers behind RI in-clude the recognition in the financial community that ESG factors play a material role in determining risk and return, and the understand-ing that incorporating ESG factors is part of investors’ fiduciary duty to their clients and beneficiaries.
Box 6.5 Bridging economic development and pension investment mandates: A portfolio model
Policy makers and economic developers seek to engage pension investors to further green policy ob-jectives. To enable this, the investment mandate needs to shift from outcome-driven metrics to risk:re-turn metrics, and the investment vehicle needs to be scalable; it needs to be a portfolio instead of in-dividual companies. In a best case scenario, the investment mandate needs to be able to connect out-comes with risk:return in a meaningful manner. Thus, the MARF portfolio design and management needs to adhere to fiduciary and procurement requirements.
Hence, investment decision-making by institutional investors is start-ing to be impacted by ESG themes such as: clean efficient energy, en-vironmental protection, sustainable infrastructure and development, health & well-being, and social equity. While economic developers and equity investors would tend to focus on companies and projects in these themes, ESG-driven pension funds tend to focus on the impact of environment, social and governance issues on the risk and perfor-mance of their more liquid assets.
A recent article by Bob Massie in Institutional Investor12 – a leading in-vestment blog – asked the question: “As the long-anticipated flood of environmental, social and governance information has at last arrived, will data science finally allow our capital markets to grow up?”. The author aimed at addressing the need for data standardization and improvement, and the objective to link ESG metrics to financial performance. Sustainability has been moving to-wards the center of investment decision-making and business value creation, and has triggered an enduring debate about the relation between sus-tainability and financial performance valuation. Ideas have differed greatly about whether value should be understood narrowly as short- to me-dium-term financial benefit, or as broader socie-tal benefit. As approaches are being explored, de-mand for data – and particularly standardization of data – is rising. The Sustainability Accounting Standards Board (SASB) aims to do just that, and will help pension funds, wealth funds, and endowments to com-
Box 6.6 Pension funds and ESG mandates
In a recent study, MSCI, a global index provider, distinguished three growing categories of pension fund investors: value-based, who want their portfo-lios to align with their principles; im-pact-based, who want to see measur-able social returns; and long-horizon, who want to limit their exposure to systemic problems like water scarcity and carbon regulations.
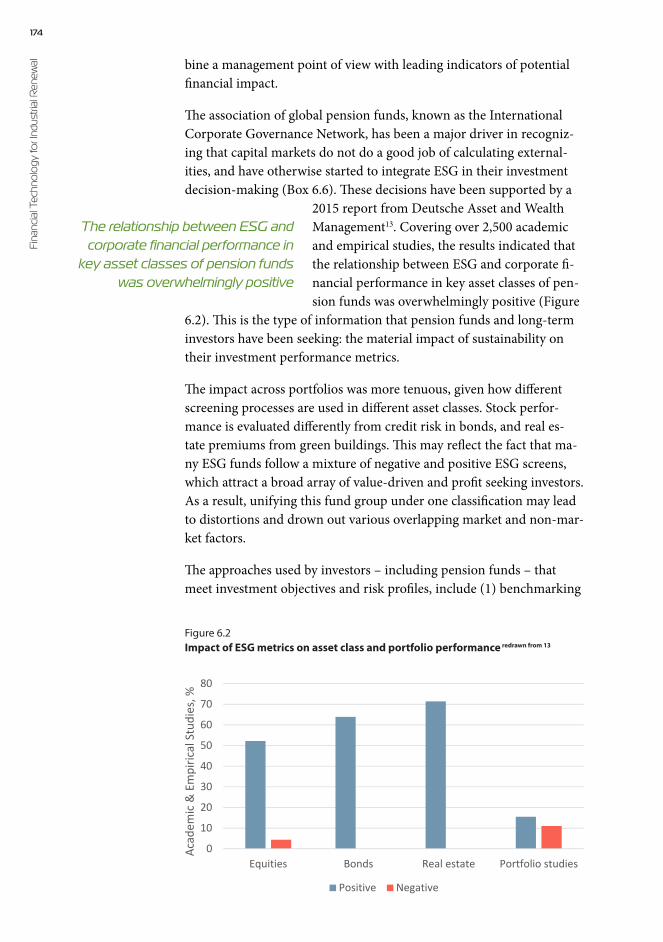
174Fi
nanc
ial T
echn
olo
gy fo
r Ind
ustri
al R
enew
al bine a management point of view with leading indicators of potential financial impact.
The association of global pension funds, known as the International Corporate Governance Network, has been a major driver in recogniz-ing that capital markets do not do a good job of calculating external-ities, and have otherwise started to integrate ESG in their investment decision-making (Box 6.6). These decisions have been supported by a
2015 report from Deutsche Asset and Wealth Management13. Covering over 2,500 academic and empirical studies, the results indicated that the relationship between ESG and corporate fi-nancial performance in key asset classes of pen-sion funds was overwhelmingly positive (Figure
6.2). This is the type of information that pension funds and long-term investors have been seeking: the material impact of sustainability on their investment performance metrics.
The impact across portfolios was more tenuous, given how different screening processes are used in different asset classes. Stock perfor-mance is evaluated differently from credit risk in bonds, and real es-tate premiums from green buildings. This may reflect the fact that ma-ny ESG funds follow a mixture of negative and positive ESG screens, which attract a broad array of value-driven and profit seeking investors. As a result, unifying this fund group under one classification may lead to distortions and drown out various overlapping market and non-mar-ket factors.
The approaches used by investors – including pension funds – that meet investment objectives and risk profiles, include (1) benchmarking
Figure 6.2. Impact of ESG metrics on asset class and portfolio performance (redrawn from 13).
0
10
20
30
40
50
60
70
80
Equities Bonds Real estate Portfolio studies
Acad
emic
& E
mpi
rical
Stu
dies
, %
Positive Negative
Figure 6.2. Impact of ESG on financial performance of various asset classes (redrawn from Deutsche Asset and Wealth Management, 2015)
Figure 6.2Impact of ESG metrics on asset class and portfolio performance redrawn from 13
The relationship between ESG and corporate financial performance in
key asset classes of pension funds was overwhelmingly positive
175 M
ulti-Asset R
enewal Fund
bine a management point of view with leading indicators of potential financial impact.
The association of global pension funds, known as the International Corporate Governance Network, has been a major driver in recogniz-ing that capital markets do not do a good job of calculating external-ities, and have otherwise started to integrate ESG in their investment decision-making (Box 6.6). These decisions have been supported by a
2015 report from Deutsche Asset and Wealth Management13. Covering over 2,500 academic and empirical studies, the results indicated that the relationship between ESG and corporate fi-nancial performance in key asset classes of pen-sion funds was overwhelmingly positive (Figure
6.2). This is the type of information that pension funds and long-term investors have been seeking: the material impact of sustainability on their investment performance metrics.
The impact across portfolios was more tenuous, given how different screening processes are used in different asset classes. Stock perfor-mance is evaluated differently from credit risk in bonds, and real es-tate premiums from green buildings. This may reflect the fact that ma-ny ESG funds follow a mixture of negative and positive ESG screens, which attract a broad array of value-driven and profit seeking investors. As a result, unifying this fund group under one classification may lead to distortions and drown out various overlapping market and non-mar-ket factors.
The approaches used by investors – including pension funds – that meet investment objectives and risk profiles, include (1) benchmarking
Figure 6.2. Impact of ESG metrics on asset class and portfolio performance (redrawn from 13).
index funds of public companies with a minimum of revenue derived from ‘green products or services’, (2) project financing of green tech-nology deployments in developing countries (so called carbon finance), and (3) structuring of new asset allocation strategies whereby the cli-mate risk of the financial asset (company, real estate, commodity) is priced in the value of the asset.
What about the impact of ESG on alternative asset classes such as leveraged debt and private equity?
Environmental Finance, a leading online investor trade magazine, has published on the use and differences of ESG metrics between public-ly traded stocks, bonds, and private equity. For example, it reports on Standard and Poor’s use of ESG metrics impact on creditworthiness in oil refining and marketing, regulated utilities, and unregulated power and gas industries, where environmental regulation and weather events tend to have a more direct impact. Further, ac-cording to INSEADs Global Private Equity Ini-tiative, private equity firms are cognizant of this trend: cost-savings potential, competitor activity and regulation all contribute to the rising aware-ness of ESG factors in investment committee decision-making. The fo-cus on ESG considerations has developed alongside private credit and equity investors’ growing appreciation of the impact that non-financial factors can have on value creation, long-term company performance, and the health of society at large.
In the aggregate, the design of Multi-Asset Renewal Funds with sys-temic economic development and financial objectives needs to be cog-nizant of both environmental and societal value-add and financial risk:return performance metrics to meet the trustee’s mandate.
Investment momentum: Institutional investors shift towards alternative assets in search of increased returns and lower volatility
If MARFs satisfy green economic development objectives, why should economic developers, policy makers and institutional investors such as pension funds care about these new investment models? Can’t they in-vest in currently available investment vehicles and get the same finan-cial and green economy benefits? We argued that the right investment instruments with desired market liquidity and yield were not available (see Box 6.7).
Traditionally, institutional investors have been seen as sources of long-term capital with investment portfolios built around the three main as-
Cost-savings potential, competitor activity and regulation all contribute to the rising awareness of ESG factors
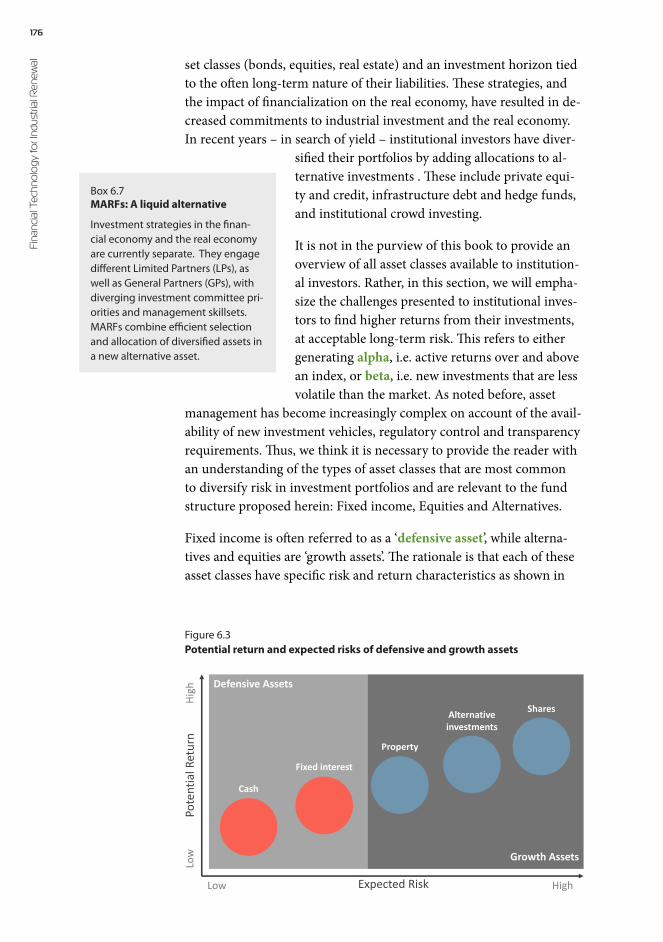
176Fi
nanc
ial T
echn
olo
gy fo
r Ind
ustri
al R
enew
al set classes (bonds, equities, real estate) and an investment horizon tied to the often long-term nature of their liabilities. These strategies, and the impact of financialization on the real economy, have resulted in de-creased commitments to industrial investment and the real economy. In recent years – in search of yield – institutional investors have diver-
sified their portfolios by adding allocations to al-ternative investments . These include private equi-ty and credit, infrastructure debt and hedge funds, and institutional crowd investing.
It is not in the purview of this book to provide an overview of all asset classes available to institution-al investors. Rather, in this section, we will empha-size the challenges presented to institutional inves-tors to find higher returns from their investments, at acceptable long-term risk. This refers to either generating alpha, i.e. active returns over and above an index, or beta, i.e. new investments that are less volatile than the market. As noted before, asset
management has become increasingly complex on account of the avail-ability of new investment vehicles, regulatory control and transparency requirements. Thus, we think it is necessary to provide the reader with an understanding of the types of asset classes that are most common to diversify risk in investment portfolios and are relevant to the fund structure proposed herein: Fixed income, Equities and Alternatives.
Fixed income is often referred to as a ‘defensive asset’, while alterna-tives and equities are ‘growth assets’. The rationale is that each of these asset classes have specific risk and return characteristics as shown in
Box 6.7 MARFs: A liquid alternative
Investment strategies in the finan-cial economy and the real economy are currently separate. They engage different Limited Partners (LPs), as well as General Partners (GPs), with diverging investment committee pri-orities and management skillsets. MARFs combine efficient selection and allocation of diversified assets in a new alternative asset.
PotentialR
eturn
Low
High
Low HighExpected Risk
Cash
Fixed interest
Property
Alternativeinvestments
Shares
Defensive Assets
Growth Assets
Figure 6.3Figure 6.3Potential return and expected risks of defensive and growth assets
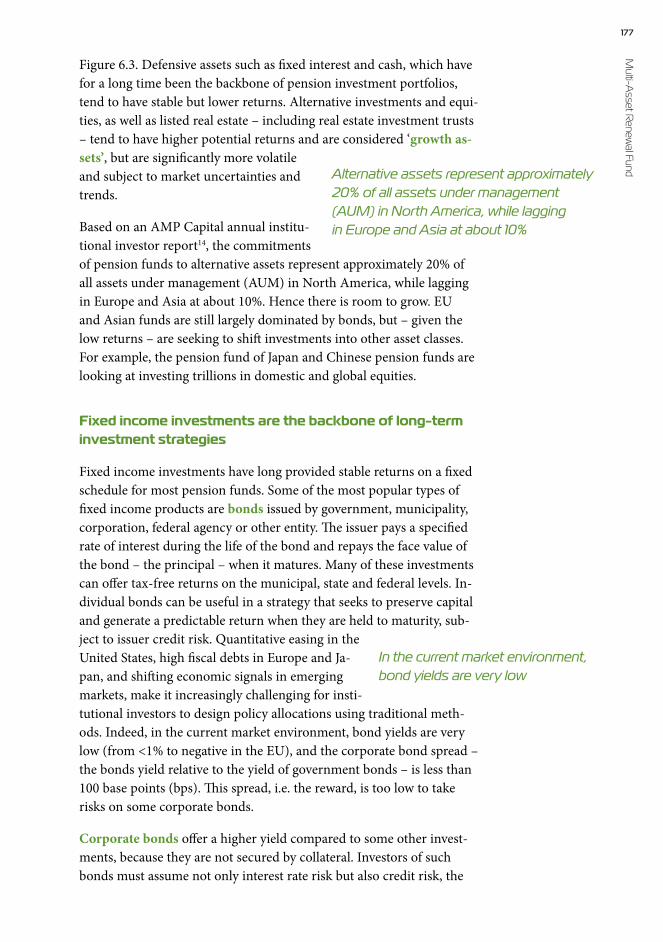
177 M
ulti-Asset R
enewal Fund
Figure 6.3. Defensive assets such as fixed interest and cash, which have for a long time been the backbone of pension investment portfolios, tend to have stable but lower returns. Alternative investments and equi-ties, as well as listed real estate – including real estate investment trusts – tend to have higher potential returns and are considered ‘growth as-sets’, but are significantly more volatile and subject to market uncertainties and trends.
Based on an AMP Capital annual institu-tional investor report14, the commitments of pension funds to alternative assets represent approximately 20% of all assets under management (AUM) in North America, while lagging in Europe and Asia at about 10%. Hence there is room to grow. EU and Asian funds are still largely dominated by bonds, but – given the low returns – are seeking to shift investments into other asset classes. For example, the pension fund of Japan and Chinese pension funds are looking at investing trillions in domestic and global equities.
Fixed income investments are the backbone of long-term investment strategies
Fixed income investments have long provided stable returns on a fixed schedule for most pension funds. Some of the most popular types of fixed income products are bonds issued by government, municipality, corporation, federal agency or other entity. The issuer pays a specified rate of interest during the life of the bond and repays the face value of the bond – the principal – when it matures. Many of these investments can offer tax-free returns on the municipal, state and federal levels. In-dividual bonds can be useful in a strategy that seeks to preserve capital and generate a predictable return when they are held to maturity, sub-ject to issuer credit risk. Quantitative easing in the United States, high fiscal debts in Europe and Ja-pan, and shifting economic signals in emerging markets, make it increasingly challenging for insti-tutional investors to design policy allocations using traditional meth-ods. Indeed, in the current market environment, bond yields are very low (from <1% to negative in the EU), and the corporate bond spread – the bonds yield relative to the yield of government bonds – is less than 100 base points (bps). This spread, i.e. the reward, is too low to take risks on some corporate bonds.
Corporate bonds offer a higher yield compared to some other invest-ments, because they are not secured by collateral. Investors of such bonds must assume not only interest rate risk but also credit risk, the
Alternative assets represent approximately 20% of all assets under management (AUM) in North America, while lagging in Europe and Asia at about 10%
In the current market environment, bond yields are very low

178Fi
nanc
ial T
echn
olo
gy fo
r Ind
ustri
al R
enew
al chance that the corporate issuer will default on its debt obligations. Hence, institutional investors expect that if they take on this additional risk over government bonds, they will be rewarded with higher interest payments. The interest difference between the government bond and corporate bonds is called the yield spread or credit spread. In terms
of business cycles, a slowing economy tends to wid-en credit spreads as companies are more likely to de-fault, and an economy emerging from a recession tends to narrow the spread, as companies are theo-
retically less likely to default in a growing economy. In the current en-vironment, the reward for extra risk is very low, hence, the corporate bond environment is viewed as being very conservative and thus not attractive to investors.
In recent years, some fixed income funds have been diverted to climate bonds issued by governments, multi-national banks or corporations. Key issues in the green bond market right now are that they have low yields and are becoming unattractive. The reason is that over 45% of all climate bonds are AAA rated, and thus are very conservative, resulting in average yields between 2 and 7% (corporate issues), with an average duration of five years. While they do not pay a premium over regular bonds, they have become attractive financial investments for long-term investors, in part because climate bonds help to diversify the funds’ ESG rating.
Another shift is the emergence of infrastructure bonds as a comple-ment or substitute for fixed income allocations (see also alternative in-vestments). The surge in public debt since 2008 impedes government
efforts to finance infrastructure. Banks, which al-so used to fund much of it, are increasingly loath to do so as they decrease loan books in response to tougher capital and leverage requirements. Ac-cording to BlackRock, which holds over USD 9 bn. of global infrastructure bonds and loans, the rise in issuance is good news for institutional inves-tors seeking assets that provide them with a steady stream of income over many years. Many infra-structure bonds have maturities of 20 to 30 years, making them particularly attractive to pension funds, insurance companies and sovereign wealth funds with long-term liabilities. Infrastructure
bonds that are rated single-A or triple-B have a 4 to 5 percentage point yield, rendering them more attractive than government or A-rated cor-porate bonds.
Exchange traded funds (ETF) are an evolving equity growth strategy asset class for pension funds
According to AMP Capital research14, pension funds and sovereign wealth funds have traditionally allocated investments to public equi-ties, i.e. stocks, making up over 40% of total investments (Figure 6.4). Investments in equities can take on many forms, ranging from picking individual stocks to exchange traded funds, index funds, and registered closed end funds. The allocations tend to be separated in domestic eq-uities, global equities, and listed real assets, real estate investment trusts (REITs) and other.
Index funds. These are open-end funds that attempt to replicate an in-dex, such as the S&P 500, and therefore do not allow the manager to actively choose securities to buy. An index fund’s rules of construction clearly identify the type of companies suitable for the fund. Equity in-dex funds include groups of stocks with similar characteristics such as size, value, profitability and/or the geographic location of the under-lying companies. A group of stocks may include companies from the United States, Non-US Developed, Emerging Market or Frontier Mar-ket countries. Additional index funds within these geographic markets could include indexes of companies that include rules based on com-pany characteristics or risk factors, such as companies that are small, mid-sized, large, small value, large value, small growth, large growth, the level of gross profitability or investment capital, real estate, or in-dexes based on commodities and fixed-income. Index funds have also been designed to include rules that screen for social and sustainabili-ty criteria. Companies are purchased and held within the index fund when they meet the specific index rules or parameters and are sold when they move outside of those rules or parameters.
Figure 6.4. Contributions of equities to the total asset allocation of pension funds.
In the current environment, the reward for extra risk is very low
Box 6.8 Climate bonds
Climate change-linked bonds, relat-ed to greenhouse gas emission re-duction projects, clean energy gen-eration, energy efficiency, or climate change adaptation projects. The mar-ket in green bonds has boomed over the past few years, spurred by grow-ing interest among institutional in-vestors in environmental, social and corporate governance (ESG) issues.
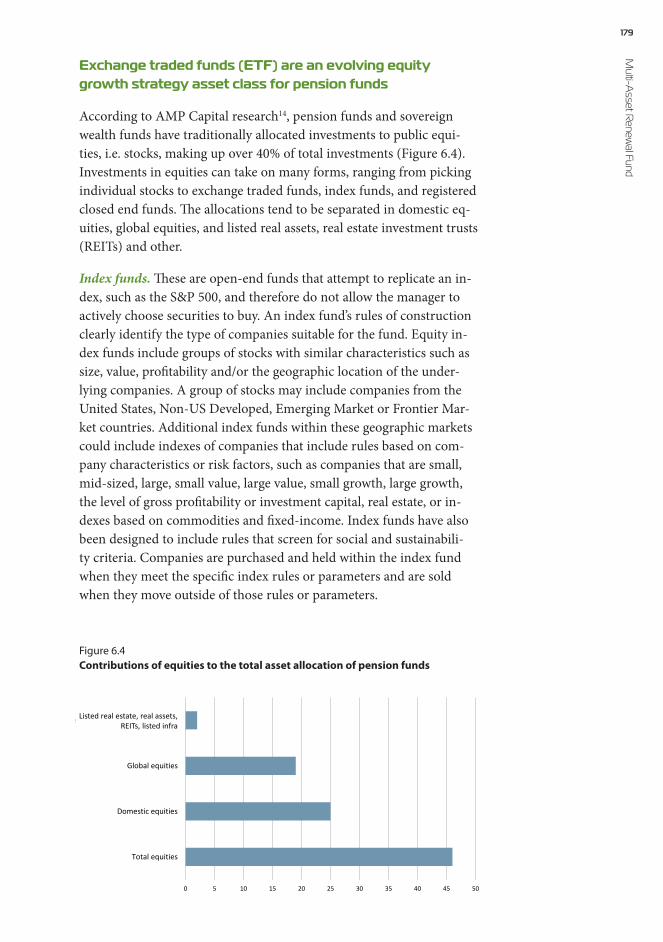
179 M
ulti-Asset R
enewal Fund
Exchange traded funds (ETF) are an evolving equity growth strategy asset class for pension funds
According to AMP Capital research14, pension funds and sovereign wealth funds have traditionally allocated investments to public equi-ties, i.e. stocks, making up over 40% of total investments (Figure 6.4). Investments in equities can take on many forms, ranging from picking individual stocks to exchange traded funds, index funds, and registered closed end funds. The allocations tend to be separated in domestic eq-uities, global equities, and listed real assets, real estate investment trusts (REITs) and other.
Index funds. These are open-end funds that attempt to replicate an in-dex, such as the S&P 500, and therefore do not allow the manager to actively choose securities to buy. An index fund’s rules of construction clearly identify the type of companies suitable for the fund. Equity in-dex funds include groups of stocks with similar characteristics such as size, value, profitability and/or the geographic location of the under-lying companies. A group of stocks may include companies from the United States, Non-US Developed, Emerging Market or Frontier Mar-ket countries. Additional index funds within these geographic markets could include indexes of companies that include rules based on com-pany characteristics or risk factors, such as companies that are small, mid-sized, large, small value, large value, small growth, large growth, the level of gross profitability or investment capital, real estate, or in-dexes based on commodities and fixed-income. Index funds have also been designed to include rules that screen for social and sustainabili-ty criteria. Companies are purchased and held within the index fund when they meet the specific index rules or parameters and are sold when they move outside of those rules or parameters.
Figure 6.4. Contributions of equities to the total asset allocation of pension funds.
0 5 10 15 20 25 30 35 40 45 50
Total equities
Domestic equities
Global equities
Listed real estate, real assets, REITs, listed infraListed real estate, real assets,REITs, listed infra
Figure 6.4Contributions of equities to the total asset allocation of pension funds

180Fi
nanc
ial T
echn
olo
gy fo
r Ind
ustri
al R
enew
al Closed-end funds. Like their better-known open-ended cousins, closed-end funds are usually sponsored by a fund management compa-ny which will control how the fund is invested. They begin by soliciting money from long-term and other investors in an initial offering, which may be public or limited. The investors are given shares correspond-ing to their initial investment. The fund managers pool the money and purchase securities or other assets. What exactly the fund manager can invest in depends on the fund’s charter, prospectus and the applicable government regulations, but includes stocks, bonds and alternatives. In the US, a closed-end fund can include unlisted (private) securities in-cluding SMEs.
The rationale for a closed-end fund is that the investors do not control how the investment is allocated, the fund management company does. A fund raises its initial equity through the sale of common stock. The amount of equity that belongs to a share of common stock is its net as-set value (NAV). As the fund operates, NAV increases with investment
gains and decreases with losses. A distinguishing fea-ture of a closed-end fund is the common use of leverage, whereby the fund manager borrows against the invest-ed capital to increase the total amount of investable cap-ital in the fund. The leverage is “cheaper” to acquire than
raising more equity from LPs and, hence, an efficient means to increase the size of the fund. The amount of leverage a fund uses is expressed as a percent of total fund assets (e.g. if it has a 25% leverage ratio, that means that for each $100 of total assets under management, $75 is eq-uity and $25 is debt). The objective is to earn a higher return with this additional invested capital.
Exchange traded fund (ETF) investments. An ETF is a marketable se-curity that tracks an index, a commodity, bonds, or a basket of assets like an index fund. However, unlike mutual funds, an ETF trades like a common stock on a stock exchange, so it has higher liquidity than a mutual fund. Shareholders do not directly own or have any direct claim to the underlying investments in the fund; rather they indirectly own
Box 6.9 Green ETFs
An investment product that focuses on companies supporting or promoting conservation efforts, alter-native energy, clean air and water projects and other environmentally responsible business decisions. The majority of green ETFs focus on companies involved directly or indirectly with the research, devel-opment, production and provision of alternative energy. Companies may be distributors of alternative energy or may be manufacturers of parts and equipment needed to produce the energy, such as the photovoltaic cells necessary for creating solar panels. Each ETF has its own criteria for determining the eligibility requirements for assets.
A distinguishing feature of a closed-end fund is the
common use of leverage

181 M
ulti-Asset R
enewal Fund
these assets. ETF shareholders are entitled to a proportion of the prof-its, such as earned interest or dividends paid, and they may get a resid-ual value in case the fund is liquidated. The ownership of the fund can easily be bought, sold or transferred in much the same was as shares of stock, since ETF shares are traded on public stock exchanges
Initially marketed as passive instruments – tracking indexes, basical-ly – since 2009 ETFs have shifted towards actively managed invest-ment strategies to optimize returns and minimize volatility. Since pen-sion funds are passive investors, ETFs are an at-tractive path to accessing new investment options. The contribution of ETFs in pension fund alloca-tions has increased dramatically for over a decade, amounting to 14% of total in 2015. With 5,300 products available – including green ETFs – they offer a breadth and depth of investment exposure while becoming cheaper and more liq-uid, allowing more efficient intra-day pricing and trading.
As institutional investors have become more familiar with the product, it has opened opportunities for other parties, including pension funds. As noted earlier, many pension funds rely on advice from independent consultants and outsourced investment management services that tend to use traditional investment products. However, as the asset allocation discussion shifts towards uncovering excess returns over an index, new investment themes such as industrial renewal funds, and changing per-ceptions such as pension fund SME investments in the local economy, the opportunity for ETFs and other exchange traded products (ETP) such as MARFs will continue to grow.
Alternative investments provide the upside yield in return for lower liquidity
The alternative asset class is ever-expanding and includes infrastructure debt, hedge funds, private credit, private equity, real estate, and com-modities. Investor enthusiasm for alternatives stems from a number of factors, including their interest in earning higher returns, meeting cash requirements, and avoiding market volatility. We will highlight a few assets that are relevant to the MARF.
Infrastructure financing. Infrastructure has long been among a suite of alternatives to drive returns and diversify a portfolio. Given the record-low yields on bonds, the in-frastructure asset class has come to the forefront as a substitute for – or complement to – fixed-income allocations. Not all infrastructure in-vestments or assets are suitable as substitutes for bonds, because of the
The contribution of ETFs in pension fund allocations has increased dramatically for over a decade
The infrastructure asset class has come to the forefront as a substitute for – or complement to – fixed-income allocations
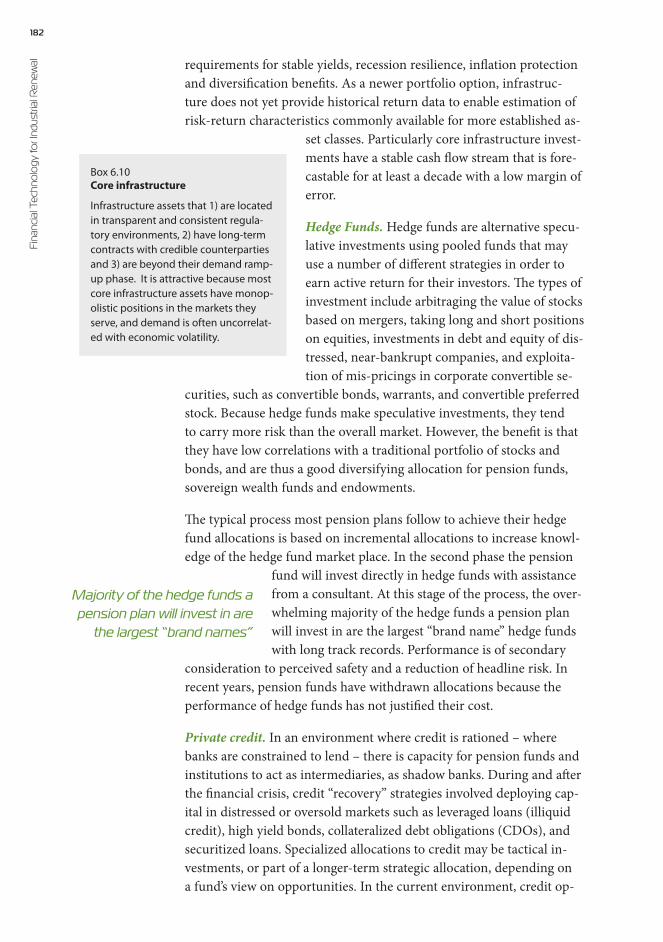
182Fi
nanc
ial T
echn
olo
gy fo
r Ind
ustri
al R
enew
al requirements for stable yields, recession resilience, inflation protection and diversification benefits. As a newer portfolio option, infrastruc-ture does not yet provide historical return data to enable estimation of risk-return characteristics commonly available for more established as-
set classes. Particularly core infrastructure invest-ments have a stable cash flow stream that is fore-castable for at least a decade with a low margin of error.
Hedge Funds. Hedge funds are alternative specu-lative investments using pooled funds that may use a number of different strategies in order to earn active return for their investors. The types of investment include arbitraging the value of stocks based on mergers, taking long and short positions on equities, investments in debt and equity of dis-tressed, near-bankrupt companies, and exploita-tion of mis-pricings in corporate convertible se-
curities, such as convertible bonds, warrants, and convertible preferred stock. Because hedge funds make speculative investments, they tend to carry more risk than the overall market. However, the benefit is that they have low correlations with a traditional portfolio of stocks and bonds, and are thus a good diversifying allocation for pension funds, sovereign wealth funds and endowments.
The typical process most pension plans follow to achieve their hedge fund allocations is based on incremental allocations to increase knowl-edge of the hedge fund market place. In the second phase the pension
fund will invest directly in hedge funds with assistance from a consultant. At this stage of the process, the over-whelming majority of the hedge funds a pension plan will invest in are the largest “brand name” hedge funds with long track records. Performance is of secondary
consideration to perceived safety and a reduction of headline risk. In recent years, pension funds have withdrawn allocations because the performance of hedge funds has not justified their cost.
Private credit. In an environment where credit is rationed – where banks are constrained to lend – there is capacity for pension funds and institutions to act as intermediaries, as shadow banks. During and after the financial crisis, credit “recovery” strategies involved deploying cap-ital in distressed or oversold markets such as leveraged loans (illiquid credit), high yield bonds, collateralized debt obligations (CDOs), and securitized loans. Specialized allocations to credit may be tactical in-vestments, or part of a longer-term strategic allocation, depending on a fund’s view on opportunities. In the current environment, credit op-
Box 6.10 Core infrastructure
Infrastructure assets that 1) are located in transparent and consistent regula-tory environments, 2) have long-term contracts with credible counterparties and 3) are beyond their demand ramp-up phase. It is attractive because most core infrastructure assets have monop-olistic positions in the markets they serve, and demand is often uncorrelat-ed with economic volatility.
Majority of the hedge funds a pension plan will invest in are
the largest “brand names”
183 M
ulti-Asset R
enewal Fund
portunities persist through direct lending strategies, where institutional investment funds raise capital to deploy in SME loans and other direct corporate loans.
Liquidity is lower in such strategies, which is why they are considered alternative investments. TheCityUK published a review in 2013 on al-ternative finance for SMEs and mid-market companies (MMs) in the UK and Europe, and concluded that growth in this space is a means to increase the resilience of the financial system and the wider economy by diversifying the sources of finance to companies. It pointed out that whereas in Europe, banks provide 80% of SME financing, in the US the number is closer to 20%, the remainder being provided by non-banks and capital markets15.
Given their long-term investment horizon, pension funds, sovereign wealth funds and endowments are comfortable with less-liquid invest-ments, like private credit, that provide offsetting benefits when com-pared to liquid public market investments. Those benefits include yield premiums, diversification, and structural elements such as tradition-al financial covenants that help mitigate risks in-herent in holding an illiquid investment through maturity. In today’s yield-constrained, low-inter-est-rate environment, institutional investors’ de-mand for this asset class has increased significant-ly. Private credit investments can be found across the spectrum from traditional, fixed-rate debt private placements, credit tenant loans, and infrastructure debt in the investment-grade world, to senior and junior middle-market loans and mezzanine in the speculative grade category.
Private equity investments. Large institutional investors are heavily fa-voring private equity as the alternative-investment strategy of choice. According to Institutional Investor, a financial industry blog, 60% of as-set managers plan to increase private equity allocations, whereas 20% planned to do the same with hedge funds. One thing is clear: Private equity is quickly becoming the attractive third way for pension funds to increase returns. The contrasting perceptions of volatility in pub-
Box 6.11 Illiquid Credit
Debt instruments that do not have a functioning secondary market, and are usually held until maturi-ty. Most illiquid assets derive their value almost entirely from their cash flows, rather than a perceived future market appreciation (beta), so are well suited to supporting an institutional investor’s stream of liabilities. There are broadly three types of illiquid credit: long-dated, often inflation-linked assets; 5 to 7 year maturity investments; and unique, specialist opportunities that can offer impressive risk-adjust-ed returns.
Private equity is quickly becoming the attractive third way for pension funds to increase returns
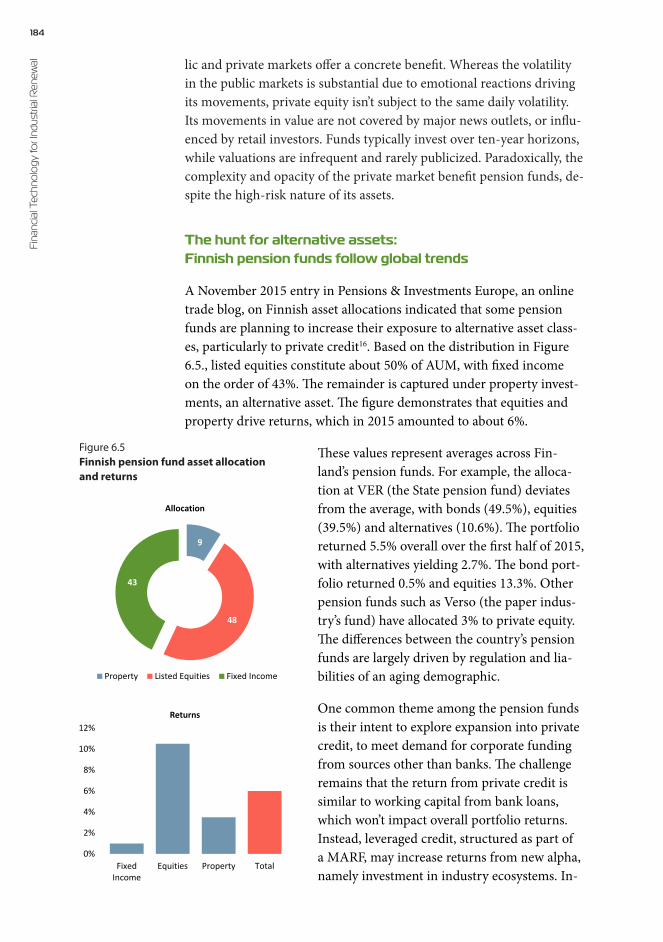
184Fi
nanc
ial T
echn
olo
gy fo
r Ind
ustri
al R
enew
al lic and private markets offer a concrete benefit. Whereas the volatility in the public markets is substantial due to emotional reactions driving its movements, private equity isn’t subject to the same daily volatility. Its movements in value are not covered by major news outlets, or influ-enced by retail investors. Funds typically invest over ten-year horizons, while valuations are infrequent and rarely publicized. Paradoxically, the complexity and opacity of the private market benefit pension funds, de-spite the high-risk nature of its assets.
The hunt for alternative assets: Finnish pension funds follow global trends
A November 2015 entry in Pensions & Investments Europe, an online trade blog, on Finnish asset allocations indicated that some pension funds are planning to increase their exposure to alternative asset class-es, particularly to private credit16. Based on the distribution in Figure 6.5., listed equities constitute about 50% of AUM, with fixed income on the order of 43%. The remainder is captured under property invest-ments, an alternative asset. The figure demonstrates that equities and property drive returns, which in 2015 amounted to about 6%.
These values represent averages across Fin-land’s pension funds. For example, the alloca-tion at VER (the State pension fund) deviates from the average, with bonds (49.5%), equities (39.5%) and alternatives (10.6%). The portfolio returned 5.5% overall over the first half of 2015, with alternatives yielding 2.7%. The bond port-folio returned 0.5% and equities 13.3%. Other pension funds such as Verso (the paper indus-try’s fund) have allocated 3% to private equity. The differences between the country’s pension funds are largely driven by regulation and lia-bilities of an aging demographic.
One common theme among the pension funds is their intent to explore expansion into private credit, to meet demand for corporate funding from sources other than banks. The challenge remains that the return from private credit is similar to working capital from bank loans, which won’t impact overall portfolio returns. Instead, leveraged credit, structured as part of a MARF, may increase returns from new alpha, namely investment in industry ecosystems. In-
Figure 6.5. Finnish pension fund asset allocation and returns.
9
48
43
Property Listed Equities Fixed Income
Figure 6.5 Finnish pension funds’ asset allocation and returns
0%
2%
4%
6%
8%
10%
12%
FixedIncome
Equities Property Total
Allocation
Returns
Figure 6.5Finnish pension fund asset allocation and returns
185 M
ulti-Asset R
enewal Fund
lic and private markets offer a concrete benefit. Whereas the volatility in the public markets is substantial due to emotional reactions driving its movements, private equity isn’t subject to the same daily volatility. Its movements in value are not covered by major news outlets, or influ-enced by retail investors. Funds typically invest over ten-year horizons, while valuations are infrequent and rarely publicized. Paradoxically, the complexity and opacity of the private market benefit pension funds, de-spite the high-risk nature of its assets.
The hunt for alternative assets: Finnish pension funds follow global trends
A November 2015 entry in Pensions & Investments Europe, an online trade blog, on Finnish asset allocations indicated that some pension funds are planning to increase their exposure to alternative asset class-es, particularly to private credit16. Based on the distribution in Figure 6.5., listed equities constitute about 50% of AUM, with fixed income on the order of 43%. The remainder is captured under property invest-ments, an alternative asset. The figure demonstrates that equities and property drive returns, which in 2015 amounted to about 6%.
These values represent averages across Fin-land’s pension funds. For example, the alloca-tion at VER (the State pension fund) deviates from the average, with bonds (49.5%), equities (39.5%) and alternatives (10.6%). The portfolio returned 5.5% overall over the first half of 2015, with alternatives yielding 2.7%. The bond port-folio returned 0.5% and equities 13.3%. Other pension funds such as Verso (the paper indus-try’s fund) have allocated 3% to private equity. The differences between the country’s pension funds are largely driven by regulation and lia-bilities of an aging demographic.
One common theme among the pension funds is their intent to explore expansion into private credit, to meet demand for corporate funding from sources other than banks. The challenge remains that the return from private credit is similar to working capital from bank loans, which won’t impact overall portfolio returns. Instead, leveraged credit, structured as part of a MARF, may increase returns from new alpha, namely investment in industry ecosystems. In-
Figure 6.5. Finnish pension fund asset allocation and returns.
deed, some of the nation’s pension funds have started to allocate to pri-vate credit products such as illiquid credit (Box 6.11), but the amounts are still very small. Juuri Partners (Helsinki) is an example of an asset manager engaged in illiquid credit opportunities for SMEs.
The rise of multi-asset funds is driven by investor desire to expand diversification and return opportunities
In recent years, multi-asset funds have been designed to meet inves-tor objectives by integrating multiple asset classes in a single fund. A multi-asset class fund is a combination of asset classes (such as cash, equity or bonds) used as an investment. The weights and types of class-es will vary according to the individual investor. The mix of expecta-tions for returns, low volatility and low risk can be met by – for exam-ple – structuring closed end funds with longer-term lock-ins. A key challenge is the management of such funds, given the different strate-gies employed to optimize each asset class and the overall portfolio.
Dozens of fund providers including BlackRock, the world’s largest as-set manager, Invesco Perpetual and Hermes Investment Management have launched new multi-asset products since 2013, while competing to hire experts with skills in diverse asset allocation strategies. To date, there are 32 multi-asset ETFs in the US alone, attractive to investors seeking instant diversification. Despite the (current) fringe allocation of pension funds to multi-asset ETFs, their structure and performance has shown the opportunity for scaling investment in riskier asset class-es with proper diversification across thematic portfolios.
What is behind the rise of multi-asset funds?
Partly, the trend is a product of financial industry soul-searching that followed the financial crisis, when many investors were unimpressed to hear their funds had “beaten” their benchmarks by virtue of losing slightly less money than the underlying index would have done. The re-al benefit of multi-asset class investments is an in-crease of the diversification of an overall portfo-lio by distributing investments throughout several classes. This reduces risk (volatility) compared to holding one class of assets, but might also hinder potential returns.
A decade ago the basic concept of a multi-asset income fund was dramatically different. Multi-as-set funds evolved from traditional balanced funds, a mix of equities and bonds; just the basic binary decision be-tween stocks and bonds. How much did you hold of each asset class as
Box 6.12 Tactical Models
An active portfolio strategy that rebal-ances the percentage of assets held in various categories to take advantage of market pricing anomalies or strong market sectors.

186Fi
nanc
ial T
echn
olo
gy fo
r Ind
ustri
al R
enew
al a reflection of your investment strategy? Fund managers were focused on timing the market by combining macro analysis and tactical mod-
els. Fund managers and the academic literature have experienced that this is exceedingly difficult. In the last few years, multi-asset income funds have moved light years ahead. Today, it is all about managing an increas-ingly multi-dimensional and much expanded opportu-nity set of asset classes. That evolution has been argued
to be the reason why multi-asset income funds will prove their value relative to other investment strategies in the immediate future.
Benefits of multi-asset funds
A first major reason of having an allocation to a multi-asset invest-ment strategy is to maximize the opportunities for compelling risk-ad-justed returns by expanding asset class commitments in the context of balanced diversification. This is an important point if we step back to think about it in light of current market sentiment, and the desire for industrial transformation. Despite the recent volatility in the markets, we are now nearly seven years into a bull market in equities, and thirty years into a bond bull market. Many investors are thinking first about yield and return, with less attention on the risk. This is not an optimal solution on a medium term investment basis, and multi-asset funds help to address this risk.
A second major reason that multi-asset investment funds are resonat-ing with institutional investors has to do with realizations that they can replace what used to be the low risk part of their portfolios. Given the low yields and high expense ratio, an allocation to a traditional bond today is becoming very unattractive, leaving higher risk assets with greater valuation as the only opportunity for growth. A multi-asset in-come fund able to incorporate these opportunities while balancing the volatility inherent in higher risk exposures is being seen as a preferable foundation allocation by pension funds.
As can be expected, multi-asset funds are not all roses, because they require active management to rebalance their assets, or to take ad-vantage of specific markets or other conditions. As indicated earlier,
The real benefit of multi-asset class investments is an
increase of the diversification of an overall portfolio
Box 6.13 Diversification
A risk management technique that mixes a wide variety of investments within a portfolio to, on aver-age, yield higher returns and pose a lower risk than any individual investment found within the portfo-lio. Diversification strives to smooth out unsystematic risk events in a portfolio so that the positive per-formance of some investments will neutralize the negative performance of others. Therefore, the bene-fits of diversification will hold only if the securities in the portfolio are not perfectly correlated.
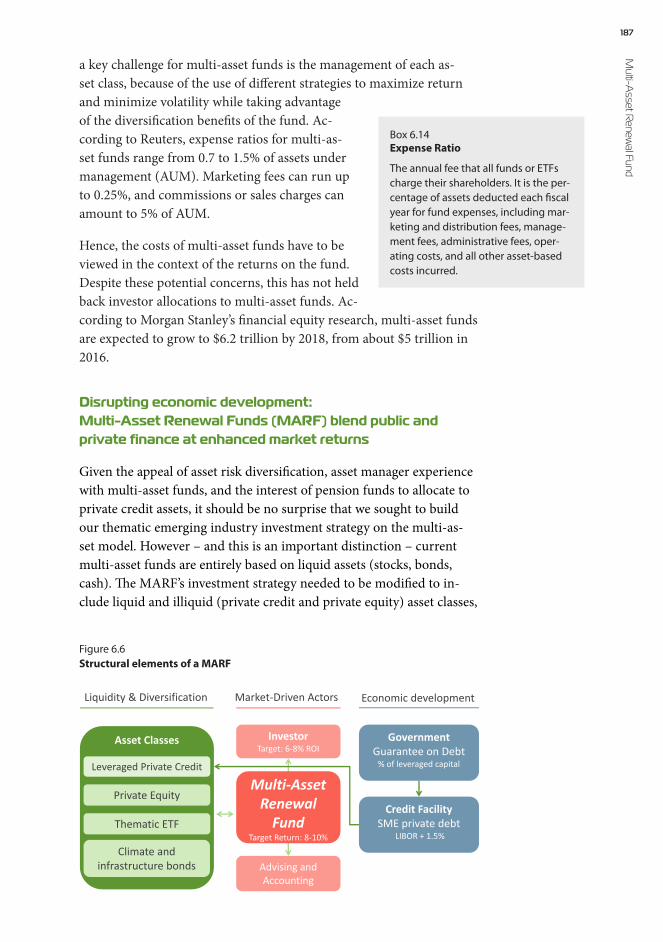
187 M
ulti-Asset R
enewal Fund
a key challenge for multi-asset funds is the management of each as-set class, because of the use of different strategies to maximize return and minimize volatility while taking advantage of the diversification benefits of the fund. Ac-cording to Reuters, expense ratios for multi-as-set funds range from 0.7 to 1.5% of assets under management (AUM). Marketing fees can run up to 0.25%, and commissions or sales charges can amount to 5% of AUM.
Hence, the costs of multi-asset funds have to be viewed in the context of the returns on the fund. Despite these potential concerns, this has not held back investor allocations to multi-asset funds. Ac-cording to Morgan Stanley’s financial equity research, multi-asset funds are expected to grow to $6.2 trillion by 2018, from about $5 trillion in 2016.
Disrupting economic development: Multi-Asset Renewal Funds (MARF) blend public and private finance at enhanced market returns
Given the appeal of asset risk diversification, asset manager experience with multi-asset funds, and the interest of pension funds to allocate to private credit assets, it should be no surprise that we sought to build our thematic emerging industry investment strategy on the multi-as-set model. However – and this is an important distinction – current multi-asset funds are entirely based on liquid assets (stocks, bonds, cash). The MARF’s investment strategy needed to be modified to in-clude liquid and illiquid (private credit and private equity) asset classes,
Box 6.14 Expense Ratio
The annual fee that all funds or ETFs charge their shareholders. It is the per-centage of assets deducted each fiscal year for fund expenses, including mar-keting and distribution fees, manage-ment fees, administrative fees, oper-ating costs, and all other asset-based costs incurred.
Asset Classes
Leveraged Private Credit
Private Equity
Thematic ETF
Climate and infrastructure bonds
Economic developmentMarket-Driven ActorsLiquidity & Diversification
Investor Target: 6-8% ROI
Government Guarantee on Debt
% of leveraged capital
Advising and Accounting
Credit FacilitySME private debt
LIBOR + 1.5%
Multi-AssetRenewal
FundTarget Return: 8-10%
Figure 6.6Structural elements of a MARF
188Fi
nanc
ial T
echn
olo
gy fo
r Ind
ustri
al R
enew
al given that the financial network map – our strategic basis for thematic investment target sourcing – encompasses both public and private en-terprises (see Chapter 3).
In the parlor introduced in Chapter 3, a Multi-Asset Renewal Fund leverages existing assets, or anchor industries, in a country or region, and supplements them with innovative companies from catalyst indus-tries that help to grow the emerging industry. Hence, MARFs are an innovation on value chain investing, but with a significant twist: They blend public and private finance (Figure 6.6).
The fund will be structured as a closed end fund, where management will control how the money is invested and allocated across the four as-set classes. Two assets are illiquid – leveraged debt and VC/PE, and two asset classes are liquid – thematic ETFs, and corporate climate bonds.
1 The leveraged debt asset is an active management strategy to reposition and help grow companies that want to maintain con-trol of the company, or cannot be financed through the tradi-tional financial system. Catalytic public investment by way of first-loss guarantees will be used to de-risk this asset.
2 Investment in the VC/PE asset class will be managed as an LP in portfolio companies of captive funds, such that the fund man-ager has participation rights in follow-on investments. The fund exists solely to provide investment management services to the MARF investors.
3 The thematic ETFs are structured based on companies in indus-try segments represented by the financial network map, and se-lected using the KeyStone Compact® Enterprise tool. They in-clude a mix of 80% from the ‘strategic’ and ‘expansional’ quad-rants, and 20% from ‘competitive’ and ‘opportunistic’ quadrants, with individual company allocations in the ETF not exceeding 8%. The 80:20 ratio was instituted to diversify the the risk of companies seeking to actively engage and invest in new lines of
Box 6.15 Portfolio guarantees
These guarantees cover a proportion of the losses on the package of loans (or projects) as a whole. A ‘first loss’ guarantee covers part of the first tranche of losses – for example, 80% of losses up to a value of 10% of the whole portfolio. A ‘second loss’ guarantee covers a second tranche of losses – for exam-ple, 80% of losses between 10% and 30% of the portfolio. First loss guarantees provide greater protec-tion to the investor. Second loss guarantees protect against extreme events while providing strong in-centives for the lender to minimize losses as they bear the first tranche. A risk of this model is that the guarantor has limited control over the loans or projects in the portfolio.

189 M
ulti-Asset R
enewal Fund
business, with those maintaining a conservative corporate strate-gy in their core markets.
4 The corporate climate bonds are drawn from the open bond market based on corporate issuances that are thematic to the emerging industry ecosystem.
As a quick side note to the piqued reader, we will elaborate in detail on the relative allocation of investments among the asset classes and specific companies, the fund’s expected performance, and its relative position to other investment vehicles in the following chapter on the MARF’s risk assessment.
A blended finance approach is key to engaging economic development in industrial renewal
The blended finance concept and model has been trending over the last year or so, and was developed within the ReDesigning Development Finance Initiative from the World Economic Forum17. At its core, the blending of private and government finance seeks to de-risk private in-vestments using first loss guarantees and other instruments. Even though this does not need to be a government agent, the model fits well with-in economic development mandates. Indeed, the EU, and many of its member governments al-ready have guarantee programs in place to accel-erate investment in SMEs and growth enterprises. The rationale is that blended finance delivers, aside from financial returns, derivative bene-fits such as job creation, industry innovation, and – in the case of envi-ronmental projects – sustainability impacts.
The primary benefit from an investment perspective is that it allows private capital to flow to projects it would normally not invest in, or make risky private credit investments to help companies scale or repo-sition. The April 23 2016 issue of The Economist reported on the re-sults from a World Economic Forum (WEF) study of 74 blended fi-nance vehicles18. For every dollar of public money invested, a further $1–20 was catalyzed in private investment. It is no surprise that pol-icymakers have resorted to blended finance to supplement subsidies and low cost financing to stimulate local economies and execute on vi-sions for industrial renewal. For example, the creation of a European Fund for Strategic Investment (EFSI) – also known as the Juncker plan – aims to stimulate a multiplier effect of 1:15 in real investment in the economy, totaling $436 bn. (350 bn. Euro), by leveraging $26 bn. (21 bn. Euro) in public funds. Most of this investment is aimed at infra-
Blending of private and government finance seeks to de-risk private investments using first loss guarantees and other instruments
190Fi
nanc
ial T
echn
olo
gy fo
r Ind
ustri
al R
enew
al structure and SME investments, for example using Long-Term Invest-ment Funds (LTIF)19.
According to legal language published by – and approved by – the European Commission in April 2015:
“The European LTIF will be able to invest in all kind of assets that are not traded on regulated markets. These assets are illiquid and, for that reason alone, require a fund to make a long-term commitment when purchasing them. The same is true for those who invest in such a fund. Assets that are not traded on a second-ary market and whose owners would require considerable time in finding a pur-chaser would comprise the following: (1) Investments in infrastructure projects, such as in the field of transport, energy or education; (2) Investments in unlisted companies, in practice mainly SMEs; (3) investments in real estate assets, such as buildings or direct purchase of an infrastructure asset. [….] Since it is necessary to provide for managerial flexibility with respect to the precise time frame in which a portfolio of long-term assets has to be assembled, the proposal allows for a five-year period during which the portfolio can be built up. In addition, the proposal allows the manager to invest up to 30% of the ELTIF’s capital in liquid securities. This liquidity buffer has been conceived to allow the ELTIF to manage the cash flow that arises while the long-term portfolio is being constituted. It also allows the manager to place surplus cash that is achieved ‘between investments’ – that is when a long-term asset is sold in order to be replaced by another”.
The MARF can be viewed as an LTIF focused on industry ecosystem investing for economic development
The MARF is a non-regulated closed end fund with longer holding times because of the illiquid assets in the fund. Even though at this time infrastructure investments are not envisioned in the fund, discus-sions with global investors, wealth management and insurance compa-nies have indicated that a MARF-type of instrument would (i) be qual-ified as an ‘alternative investment’ – asset class that falls outside the traditional definition of listed shares and bonds, and (ii) would be ap-pealing to insurance companies and pension funds with long-term lia-bilities and an appetite for investing in longer-term investment assets.
How does the MARF relate to existing financing mechanisms in Finland?
Current financing mechanisms (e.g. Tekes, TESI, Finnvera, Sitra) using public or private funds focus on company-specific investments, either as private equity, loans or grant programs. Aside from equity finance, the returns are based on bank interest rates. The MARF focuses on the value chain, a financial integration of multiple asset classes intended to engage pension funds and wealth management investors by offering at-tractive returns while driving economic development. Fundamentally, it is a market-driven investment instrument that integrates components of existing financing mechanisms, except for grants.
191 M
ulti-Asset R
enewal Fund
How much more effective is the MARF in the use of public funds for output and employment as compared to existing financing schemes?
One of the key arguments for the deployment of a MARF is the econ-omy of scale embedded in the financing instrument, the direct pub-lic funding leverage ratio, and the financial leveraging ratio. Given the type of investor that is targeted, the capital deployment needs to ad-here to diversified investment objectives, with risk and return profiles typically associated with alternative assets, while adhering to portfo-lio liquidity. The Global CleanTech Cluster Association, in an article on cluster investment in Environmental Finance20, showed that 3 to 40 jobs were created per company from investments in the range of $3–35M. On the other hand, investments in clusters of 50–200 companies, a proxy for MARFs, were upwards of $200M. and generated 130–3,000 jobs. The projected efficiency gain from the economies of scale through MARF investments is a factor of 2–3. This does not take into account the output and employment from MARF infrastructure projects.
What is the deployment track record of the MARF approach?
The MARF design approach to thematic investing has been tested and iterated with investors at Deutsche Bank Wealth Management (Lon-don), HSBC Global Debt and Alternative Investments (London), KBC Wealth Management (Brussels), the P80 Foundation (representing 80 of the World’s largest pension funds), CIOs and Directors of Alterna-tive Assets from Finnish pension funds and banks (e.g. Elo, Ilmarinen, OP, VER), and Government Investors. Currently, four commercial MARF designs are under development: (I) Bio-based chemistries (Ant-werp-Ruhr-Rhein Chemical megacluster), (II) Smart Mobility industry (Switzerland), (III) British Columbia (Canada), and (IV) Taiwan Green Trade Office. It is expected that three MARFs will be designed under the Tekes-funded FiDiPro project (Smart Grid, Smart Mobility, and Bioeconomy) that this book is an integral part of.
What is the financial performance of a MARF?
Portfolio performance of MARF-type instruments is dependent on the deal sourcing of companies from the emerging industry ecosystem (Chapter 3), the risk analytics of the underlying assets (Chapter 4), the chosen asset allocation strategy (Chapter 5), and the asset class struc-turing in the blended finance vehicle (Chapter 6). Chapter 7 will dis-cuss in detail the performance of a fund based on companies select-ed for the Smart Mobility industry. The performance metrics of this fund need to meet the 6–8% net return target required by investors, at a long-term risk similar to and not significantly exceeding the bond-stock profile.

192Fi
nanc
ial T
echn
olo
gy fo
r Ind
ustri
al R
enew
al References1 KPMG (2014). Luxembourg Regulated Investment Vehicles: An overview of
the legal and regulatory requirements. Available at https://www.kpmg.com/LU/en/IssuesAndInsights/Articlespublications/Documents/Regulated-Investment-Vehicles-2014.pdf. Accessed 04172016.
2 Mezzacapo, S. (2009). The So-Called “Sovereign Wealth Funds”: Regulatory Issues, Financial Stability, and Prudential Supervision. European Economy, Paper 378. European Commission, Directorate-General for Economic and Financial Affairs, Brussels, Belgium.
3 Zingales, L. (2015). Does Finance Benefit Society? Chicago Booth Research Paper No. 15-09. Available at SSRN: http://ssrn.com/abstract=2585194.
4 Foroohar, R. (2016). Makers and Takers: The Rise of Finance and the Fall of American Business. Penguin Random House LLC, New York.
5 Van der Zwan, N., McCarthy, M. & Sorsa, V.-P. (2015). Pension Fund Capitalism and Financialization: The United States, the Netherlands and Finland Compared. Conference Paper, Inequality in the 21st Century, Society for the Advancement of Socio-Economics, London, UK.
6 Van der Zwan, N. (2014). Making sense of financialization. Socioecon. Rev. 12 (1): 99_129.
7 Macheda, M. (2012). The role of pension funds in the financialization of the Icelandic economy. Capital & Class 36 (3): pp. 433–473.
8 Jung, R. G. & Rhee, N. (2013). How Do Public Pensions Invest? A Primer. Report from the National Institute on Retirement Security, Washington, DC.
9 Global Subsidies Initiative. Geneva, Switzerland. Available at https://www.iisd.org/gsi/effects-subsidies.
10 International Chamber of Commerce (2012). Green Economy Roadmap: A guide for business, policy makers and society to drive sustainable growth in a resource-constrained world with strong demographic growth. Available at http://www.iccwbo.org/products-and-services/trade-facilitation/green-economy-roadmap/, Accessed 05142016.
11 Della Croce, R., Kaminker, C. & Stewart, F. (2011). The Role of Pension Funds in Financing Green Growth Initiatives”, OECD Publishing, Paris.
12 Massie, R. (2016). Welcome to the ESG Evolution. Institutional Investor, Available at http://www.institutionalinvestor.com/article/3535562/investors-pensions/welcome-to-the-esg-evolution.html#/.V0R4nJMrL6A, Accessed 04262016.
13 Deutsche Asset and Wealth Management (2015). ESG & Corporate Financial Performance: Mapping the global landscape.
14 AMP Capital (2015). Institutional Investor Report. Available at https://www.ampcapital.com/campaign/iir, Accessed 10222015.
15 TheCityUK (2013). Alternative Finance for SMEs and Mid-Market Companies. London.

193 M
ulti-Asset R
enewal Fund
16 Paakinen, R. I. (2015). Finland Asset Allocation: The hunt for alternatives. Pension & Investments Europe, November 2015. Available at http://www.ipe.com/pensions/pensions-in/nordic-region/finland-asset-allocation-the-hunt-for-alternatives/10010454.fullarticle, Accessed 05022016.
17 World Economic Forum (2015). Redesigning Development Finance. Available at https://www.weforum.org/global-challenges/projects/redesigning-development-finance/, Accessed 05192016
18 The Economist (2016). Trending: blending. Apr 23rd 2016.19 The European Long Term Investment Fund (2015). Available at
http://ec.europa.eu/finance/investment/long-term/index_en.htm, Accessed 11022016.
20 Adriaens, P., Lesser, S. & Taube, B. (2012). CleanTech Clusters – Scaling Local Economic Development for Global Investment. Environmental Finance (February issue).


Risk: Return Assessment 7MARFs Provide Enhanced Returns at Moderate Risk Increases
196Fi
nanc
ial T
echn
olo
gy fo
r Ind
ustri
al R
enew
al MARFs Provide Enhanced Returns at Moderate Risk Increases
Risk rating as the basis for performance assessment and optimization
In the previous chapter we arrived at the actual fund structure for the MARF. We established the various asset classes that constitute it and how companies are sourced and allocated accordingly. The final stage in the design process is a performance test. At the end of the day, the most crucial of questions concerning any new instrument is: Does it work?
To this end, we first develop a risk-rating strategy for Multi-Asset Re-newal Funds (MARF) in general. Then, we test it using a specific fund structure, focusing on the Smart Mobility industry as the empirical testbed.
Briefly, the fund is comprised of four asset classes; SME private debt (credit), private equity (or venture capital), public equity (ETFs), and climate bonds (or infrastructure bonds, if available). To develop and test a risk rating strategy, it is necessary to incorporate details on the risks and return expectations of all sub-assets and companies that were selected for inclusion in the MARF.
You will remember from Chapters 5 and 6, that we arrived at this stage by applying a rules-based risk tiering strategy to incorporate non-fi-nancial and financial risk metrics for each private company, which was then used to assign the respective firms to the debt, equity, and ‘ETF’ asset classes of the MARF. The universe of private companies is listed in Figure 5.15. In this chapter, we will additionally detail the universe of stocks and bonds to complement the MARF asset allocation for one type of fund. To assess the performance of a Multi-Asset Renewal Fund in general, and the Smart Mobility MARF in particular, it is nec-essary to:
“We have no future because our present is too volatile. We have only risk management.
The spinning of the given moment’s scenarios. Pattern recognition.
– William Gibson, Author

197 R
isk: Return A
ssessment
1 Develop a risk rating strategy for each asset class separately, and integrate the risk and return profile across all asset classes;
2 Apply the rating approach using a pre-specified allocation and portfolio structure, to understand the contributions of each asset class;
3 Test the impact of default and asset correlation assumptions on the volatility of the fund performance;
4 Optimize the asset allocation within and between asset classes, to develop a spectrum of risk:return profiles relevant for institu-tional investors.
Due to the illiquid nature of private debt and private equity, we will describe an approach that involves the use of financial data for compa-rable public companies that are used as proxies for the private compa-nies in both asset classes. By applying the ‘comparables methodology’, it was possible to apply the Capital Asset Pricing Model (CAPM) to es-timate returns and volatility for the private com-pany as if it were a public company. Naturally, we needed to incorporate liquidity discounts – as will be detailed later.
In the case of SME debt, the probability of default for each company is calculated, a liquidity premi-um due to the private nature and size of the debt is added, and the probability of default is com-pared with public bonds in the European market. For public equities we use the actual returns from a specified Smart Mobility Index of companies to calculate standard deviation and vol-atility. Climate bond analysis is conducted on qualifying bonds in the global marketplace, by calculating the one-month historical yield to worst and applied an equal weight.
A Monte Carlo analysis of these input data allows us to calculate a vol-atility risk for the MARF portfolio, using historical returns by explor-ing the correlation between the asset classes, and the individual as-sets in each asset class. The computational analysis does not explicit-ly include the impact of government first loss mechanisms – i.e. guarantees – used to under-write the SME debt instruments, as indicated in Chapter 6.
Let us now take a step back and walk you through the process from the very beginning.
Box 7.1 Capital Asset Pricing Model (CAPM)
An empirical model used to determine a theoretically appropriate required rate of return of an asset, if that asset is to be added to an already well-diversi-fied portfolio.
A Monte Carlo analysis of these input data allows us to calculate a volatility risk for the MARF portfolio

198Fi
nanc
ial T
echn
olo
gy fo
r Ind
ustri
al R
enew
al
We needed to identify a risk- rating approach for the MARF
that pension fund managers would already be familiar with
Value at Risk (VaR) analytics chosen to integrate risk rating of a Multi-Asset Renewal Fund
As indicated in Chapter 6, one of the challenges for pension funds and other long-term institutional investors to more broadly allocate capital to green growth is the lack of scalable investment vehicles with appro-priate market liquidity. The Multi-Asset Renewal Fund – an innovation
on value chain investing – was designed with scale and liquidity that fits investment strategies of pension funds and other long-term investors.
With this goal in mind, we needed to identify a risk- rating approach for the MARF that pension fund man-
agers would already be familiar with and could readily integrate into their existing risk management and actuarial processes. In addition, the selected metric needed to be applicable to all of the assets that comprise the fund. This is a necessary constraint, partly because the fund is com-prised of liquid and illiquid assets, and partly because of the fundamen-tal differences in capital structure across the asset types1. These compli-cations – and how they impacted the selection of a risk metric – are de-tailed within each individual asset class section. We explored risk rating strategies for funds as used by Fitch, Moody’s, S&P and Morningstar, that include both quantitative and qualitative analysis (Figure 7.1).
As expected, most of the published models such as the Barra Equi-ty Risk Model and the Northfield Factor Model focus on public eq-uities (including ETFs), listed bonds and infrastructure or real estate companies, as well as funds based on these asset classes and sub-class-es. These fundamental (i.e. based on publicly available financial data) and stochastic (uncertainty-driven estimations) models are based on the premise that most securities are correlated with the general market,
1
Climate Bonds40%
Public Equity15%
SME Risk Debt35%
Private Equity10%
Qualitative Analysis
Quantitative Analysis
Value at Risk (VaR)
Figure 7.1Approach to MARF risk rating strategy
199 R
isk: Return A
ssessment
and are related to the general market by way of a financial beta. The be-ta is based on the Capital Asset Pricing Model (CAPM), and describes whether a security is more or less volatile than the broader market and whether it follows the broader trends of market direction.
These models also acknowledge that some groups of securities have co-variances that are not directly related to the financial beta, but can be explained by both financial and industry-specific metrics. Generally, both systemic (broader market) and idiosyncratic (specific to a com-pany or industry) risks are taken into account. The problem is that – in the case of the MARF – there are two asset classes that are not liquid or not traded on a daily basis on the market. The implication is that we generally do not know what their volatility is relative to market behav-ior, and whether these assets are correlated at all. We stated in Chapter 6 that – generally – diversification in portfolios has the benefit of un-correlated assets which may reduce the overall volatility of the fund, and increase its performance. The current chapter seeks to investigate the extent of the diversification benefits in a MARF, and how these can be exploited to generate additional alpha (excess returns over an index).
How do we integrate the risk of illiquid asset classes with those of the public equities?
We selected the Value at Risk framework (VaR) to assess the risk of the fund because of its ubiquitous use within the financial services indus-try, its flexibility to capture the nuances of each asset type, and its abil-ity to integrate all asset classes into a single rating for the whole fund2. Further, it is a very intuitive metric to understand. Simply stated, VaR is the expected loss that will occur with a chosen probability of loss (e.g. 5%, 0.5%). The fundamental inputs to the VaR analysis are historical returns and expected returns3. VaR was initially developed by banks to gain a quantitative understanding of their (short term) risk exposures, or extreme losses. Over the last decade or so, VaR has become em-braced by an ever-increasing number of compa-nies who use it as their chosen method to devel-op enterprise-wide risk management approaches. The trend of increased use is clearly facilitated by the fact that VaR is easily understood by non-spe-cialists.
It should be noted that with simplicity comes risk of overreliance on the metric. Indeed, the embed-ded risk associated with VaR estimates is that they are based on past data, i.e., they use the historical distribution of outcomes of the investment. However, to evaluate the risk of an investment, it is of no interest how large this risk has been in the past, but rather how much risk there is within the time horizon go-
Box 7.2 Value at risk (VaR)
A statistical technique used to mea-sure and quantify the level of financial risk within a firm or investment portfo-lio over a specific time frame. Value at risk is used by risk managers in order to measure and control the level of risk which the firm undertakes.
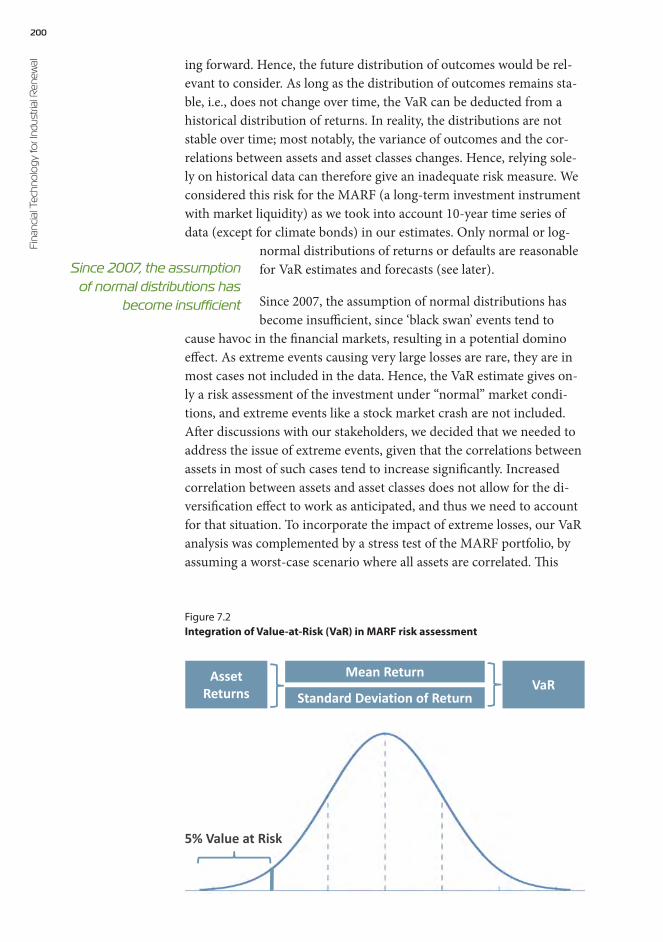
200Fi
nanc
ial T
echn
olo
gy fo
r Ind
ustri
al R
enew
al ing forward. Hence, the future distribution of outcomes would be rel-evant to consider. As long as the distribution of outcomes remains sta-ble, i.e., does not change over time, the VaR can be deducted from a historical distribution of returns. In reality, the distributions are not stable over time; most notably, the variance of outcomes and the cor-relations between assets and asset classes changes. Hence, relying sole-ly on historical data can therefore give an inadequate risk measure. We considered this risk for the MARF (a long-term investment instrument with market liquidity) as we took into account 10-year time series of data (except for climate bonds) in our estimates. Only normal or log-
normal distributions of returns or defaults are reasonable for VaR estimates and forecasts (see later).
Since 2007, the assumption of normal distributions has become insufficient, since ‘black swan’ events tend to
cause havoc in the financial markets, resulting in a potential domino effect. As extreme events causing very large losses are rare, they are in most cases not included in the data. Hence, the VaR estimate gives on-ly a risk assessment of the investment under “normal” market condi-tions, and extreme events like a stock market crash are not included. After discussions with our stakeholders, we decided that we needed to address the issue of extreme events, given that the correlations between assets in most of such cases tend to increase significantly. Increased correlation between assets and asset classes does not allow for the di-versification effect to work as anticipated, and thus we need to account for that situation. To incorporate the impact of extreme losses, our VaR analysis was complemented by a stress test of the MARF portfolio, by assuming a worst-case scenario where all assets are correlated. This
2
Asset Returns Standard Deviation of Return
Mean ReturnVaR
5% Value at Risk
Figure 7.2Integration of Value-at-Risk (VaR) in MARF risk assessment
Since 2007, the assumption of normal distributions has
become insufficient

201 R
isk: Return A
ssessment
approach enables risk managers at investment funds to include such events in their overall risk assessment.
Measuring risk and return for private equity allocations in the MARF
Private equity (PE) investments in privately-held companies are made through a fund organized as a limited partnership4. Typically, the lim-ited partners (LPs) consist of institutional and high net worth investors who invest in a closed-end fund managed by a General Partner (GP). As a closed-end fund, investors cannot redeem their shares until the fund liquidates5, a typical lifespan being between 10 and 13 years. In-vestment strategies include venture capital, which invest in early-stage high growth companies, and buyout funds, which invest in mature companies, typically through the use of extensive leverage (taking on debt financing).
The GP of the fund is responsible for the investments in and liquida-tions of individual companies (called portfolio companies) as well as for portfolio oversight. The goal of the fund manager is to maximize re-turns to investors by investing in private companies and subsequently realizing returns through an ‘exit’ transaction5, which can take on vari-ous forms, including an initial public offering (IPO) or strategic sale to a third-party. In return, the fund manager receives two forms of com-pensation: (1) management fees – guaranteed compensation paid di-rectly by LPs to the GP and usually calculated based on a percentage (typically 1–2%) of committed or invested capi-tal6; (2) carried interest – a form of performance fee which is not guaranteed to the GP, but is paid out once the fund achieves a return in excess of a specified hurdle rate. Once the hurdle rate is crossed, the GP is entitled to a percentage (typical-ly ~20%) of net profits in excess of the hurdle rate.
In the case of the MARF, the fund manager is the LP for the private equity investment. Hence, the MARF plays an active role in deciding which deals to invest in and typically pays reduced man-agement fees and carried interest to the GP7. A study of direct investment programs, including returns data from 1991 through 2011, found evidence suggesting that co-investments by LPs tend to underperform the investments of the corresponding PE funds in which they co-invest. Fang et al.7 posited that the underperformance could be driven by selection. This means that institutional investors can only select from a pool of companies
Box 7.3 MARF investments in PE
In a typical private equity investment structure, the LP is invested in the en-tire fund portfolio. In the situation of the MARF, the fund’s GP has complete discretion as to the choice of portfolio companies in which the LP’s capital is to be invested. Alternatively, an LP can invest directly in a transaction that is originated by a fund manager, which is known as a co-investment.

202Fi
nanc
ial T
echn
olo
gy fo
r Ind
ustri
al R
enew
al that the fund manager has made available as co-invest opportuni-ties. These available opportunities tend to be substantially larger deals, which have been shown to have lower returns, and are more likely to have been made during sub-optimal investment periods (i.e. market peaks) where the valuations were relatively high.
Private equity investing has key distinctions that separate it from investing in other asset classes
Based on these unique features, Invest Europe (formerly the European Private Equity and Venture Capital Association) has identified four cat-egories of risks that LP’s should consider in a private equity investment evaluation: funding risk, liquidity risk, market risk and capital risk8.
Funding Risk. Private equity investors do not actually contribute cap-ital at inception of a fund, rather an investment period is determined during which the GP can periodically ‘call’ capital as needed, in an amount not to exceed the LPs’ original commitments6. In other words,
by ‘committing capital,’ an investor is contractually obligated to provide the partnership with funding at the request of the fund manager; however, the inves-tor will not know the timing or amounts of calls un-til the fund manager sends out capital call notices. An
LP who cannot meet a capital call requirement could effectively lose a portion of his share in the PE fund. This uncertainty surrounding the timing and amounts of cash flows creates funding risk for the limited partners.
Liquidity Risk. There exists a secondary market for LPs to sell interests in a PE fund. However, the market is highly fragmented and inefficient given the lack of any centralized exchanges8. This illiquidity exposes in-vestors to the risk that they may be forced to sell their interests well be-low fair value, especially when selling due to externally distressing cir-cumstances.
Market Risk. Fluctuations in the overall markets can impact the value of portfolio investments. This issue is further complicated by the im-pact of stale pricing and lagged returns, which will be discussed later in this chapter.
Capital Risk. The actual realization of value during the exit of a port-folio company, whether it be through IPO or strategic sale, can be ad-versely impacted by a number of outside factors such as the quality and skill of the PE fund manager or unfavorable movements in exchange rates.
Incorporating PE-specific risks has been quite challenging for
academics and practitioners alike
203 R
isk: Return A
ssessment
Incorporating PE-specific risks into a systematic approach of measur-ing the riskiness of these investments has been quite challenging for academics and practitioners alike. According to Ang and Sorenson4, there are two main problems in assessing PE risk and return. The first is that PE returns are observed very infrequently due to the fact that portfolio companies held by PE funds are not actively traded on an ex-change, which makes it difficult to implement traditional finance the-ory concepts such as CAPM alphas and betas. The second issue relates to the difficulty in interpreting results from traditional finance theo-ry because the assumptions underlying standard asset-pricing models (i.e. transparency, liquidity and low-frictions) do not hold in the realm of private equity.
Traditional finance techniques employed for asset classes such as pub-licly traded equities involve estimating alphas and betas using an ex-pected return regression, and a CAPM-type financial asset pricing model. Private equity returns are complicated by the fact that there are very few data points where observed mar-ket prices actually exist. These data points are typically limited to (1) the initial pur-chase of the portfolio company, (2) any subsequent rounds of financing that may or may not occur, and (3) the final exit transaction. With the introduction of ASC 820 (formerly FAS 157), Disclosure Requirements for Fair Value Measurement in Septem-ber 20069, private equity fund managers are required to periodically mark their portfolios to fair market value, usually on an annual basis. However, many fund managers do so on a quarterly basis. Because of the lack of availability of observed prices, fund managers have consid-erable flexibility in deciding what “fair value” actually is.
This flexibility in valuing portfolios has been found to lead to a ‘stale pricing’ problem, where valuations are kept at cost for multiple periods until some sort of value realization event occurs, such as a financing or exit transaction. This stale pricing tends to understate the true volatili-ty of private equity portfolios, as well as decrease their correlations with the overall markets10. Private equity returns therefore tend to exhibit serial correlations, meaning that prior period returns influence subse-quent period returns. This impact is statistically sig-nificant for up to four lagged quarters9. Further, An-son11, 12 also found that fund managers exhibit behav-ioral tendencies. These include that fund managers were more likely to mark their portfolios down quickly in down-mar-kets and slower to write their portfolios up in up-markets, presumably due to a desire to demonstrate conservativism to LPs in the valuation of companies.
Fund managers have considerable flexibility in deciding what “fair value” actually is
Complicating the returns issue is the lack of quality historical data
204Fi
nanc
ial T
echn
olo
gy fo
r Ind
ustri
al R
enew
al Further complicating the returns issue is the lack of quality historical data. Databases that compile PE returns exist, however academic re-search suggests that data quality could be flawed by the fact that ma-ny of these databases include self-reported returns data from the fund managers themselves. This suggests that self-reporting biases could ex-ist, in other words, better-performing fund returns are overrepresented in the data because fund managers are more likely to choose not to re-port poor performance4.
Existing PE risk models emphasize Net Asset Value (NAV) or cash flow modeling approaches
A survey of academic literature shows that there have been numer-ous attempts to develop models to measure the risk and return of PE. According to Scarpati and Ng13, an overwhelming majority of this re-search has been designed to assess realized returns and risk on an ex post basis, instead of estimating an ex ante risk premium. We note there have been approaches focused on risk-premium predicting mod-els14, however such models have been developed from the perspective of an investor who is fully invested as a limited partner within a PE fund or portfolio of PE funds – as opposed to an investor who is di-rectly investing on a co-investment basis as in the case of the MARF. Further, these models rely on advanced and unproven statistical tech-niques. Such risk models have yet to gain widespread acceptance in the private equity space, likely due to their complexity.
The EVCA Risk Measurement Guidelines8 outline two practical frame-works intended to be implemented at the fund-level by private equity limited partners in their assessment of private equity risks within their portfolios. Both approaches focus on the Value-at-Risk (VaR) metric for assessment of risk:
NAV-time series-based modeling approach. The technique attempts to replicate the methodology used for publicly traded assets by mea-suring the volatility of a fund’s Net Asset Value (NAV) over a specified time period8. The model measures the volatility of the periodic report-ed NAVs of a fund adjusted for capital contributions and distributions during the period. The model is most suitable for investors with a limit-ed allocation to private equity within their portfolios8.
Cash flow-volatility-based modeling approach. The cash flow-volatili-ty model uses fund level cash flow projections (i.e. capital contributions and redemptions to/from limited partners) over the life of the fund to derive an Net Present Value (NPV) under different scenarios8. Using a large number of these portfolio cash flow projections, a probability dis-tribution can be created in order to calculate the VaR.
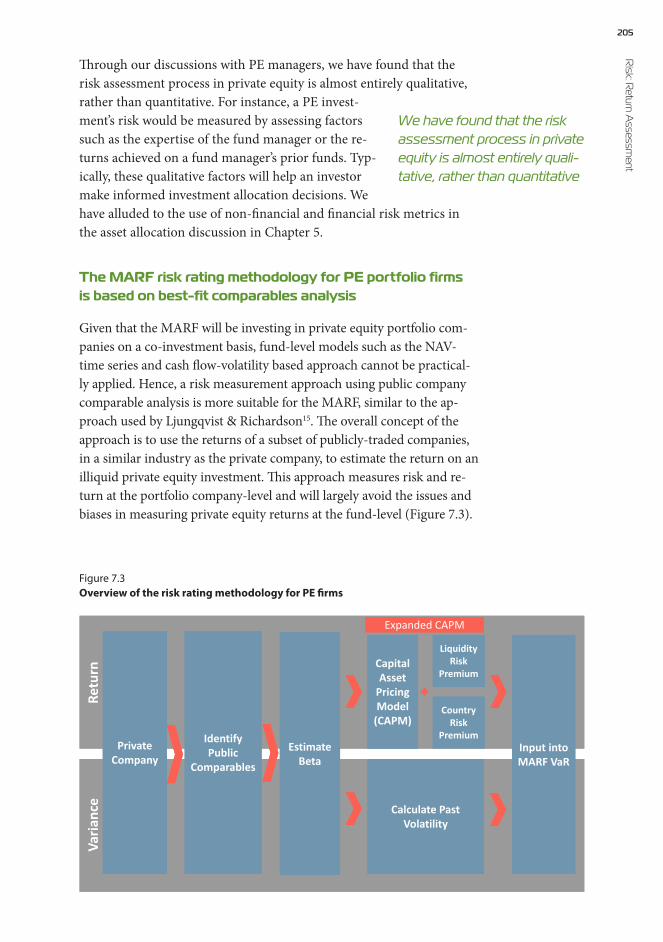
205 R
isk: Return A
ssessment
3
Private Company
Private Company
Identify Public
Comparables
Identify Public
Comparables
Estimate Beta
Estimate Beta
Capital Asset
Pricing Model
(CAPM)
Capital Asset
Pricing Model
(CAPM)
Input into MARF VaRInput into MARF VaR
Calculate Past Volatility
Calculate Past Volatility
Liquidity Risk
Premium
Liquidity Risk
Premium
Expanded CAPMExpanded CAPM
Retu
rnVa
rianc
e
Country Risk
Premium
Country Risk
Premium
Through our discussions with PE managers, we have found that the risk assessment process in private equity is almost entirely qualitative, rather than quantitative. For instance, a PE invest-ment’s risk would be measured by assessing factors such as the expertise of the fund manager or the re-turns achieved on a fund manager’s prior funds. Typ-ically, these qualitative factors will help an investor make informed investment allocation decisions. We have alluded to the use of non-financial and financial risk metrics in the asset allocation discussion in Chapter 5.
The MARF risk rating methodology for PE portfolio firms is based on best-fit comparables analysis
Given that the MARF will be investing in private equity portfolio com-panies on a co-investment basis, fund-level models such as the NAV-time series and cash flow-volatility based approach cannot be practical-ly applied. Hence, a risk measurement approach using public company comparable analysis is more suitable for the MARF, similar to the ap-proach used by Ljungqvist & Richardson15. The overall concept of the approach is to use the returns of a subset of publicly-traded companies, in a similar industry as the private company, to estimate the return on an illiquid private equity investment. This approach measures risk and re-turn at the portfolio company-level and will largely avoid the issues and biases in measuring private equity returns at the fund-level (Figure 7.3).
We have found that the risk assessment process in private equity is almost entirely quali-tative, rather than quantitative
Figure 7.3Overview of the risk rating methodology for PE firms
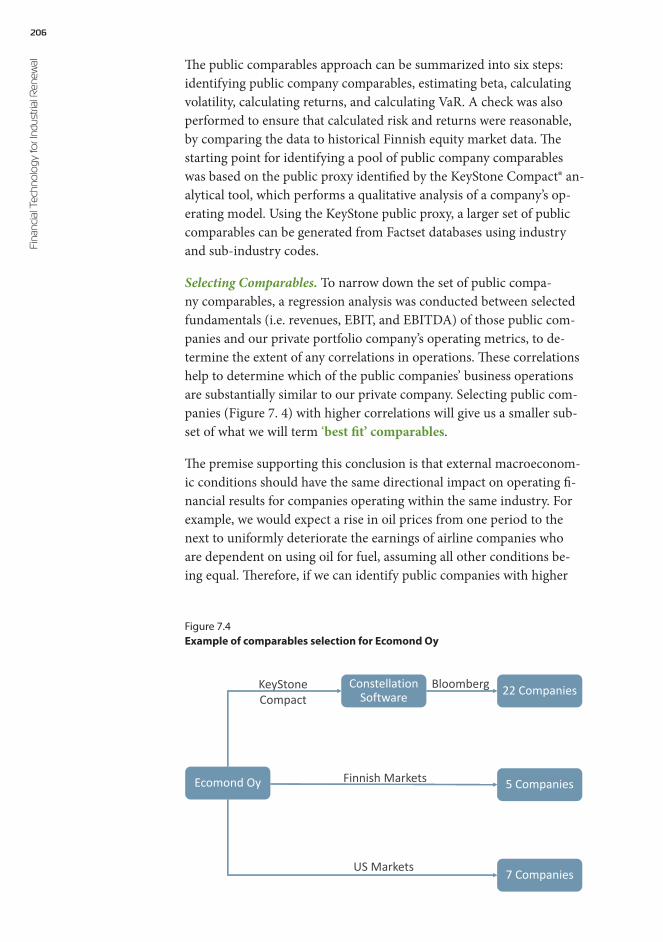
206Fi
nanc
ial T
echn
olo
gy fo
r Ind
ustri
al R
enew
al The public comparables approach can be summarized into six steps: identifying public company comparables, estimating beta, calculating volatility, calculating returns, and calculating VaR. A check was also performed to ensure that calculated risk and returns were reasonable, by comparing the data to historical Finnish equity market data. The starting point for identifying a pool of public company comparables was based on the public proxy identified by the KeyStone Compact® an-alytical tool, which performs a qualitative analysis of a company’s op-erating model. Using the KeyStone public proxy, a larger set of public comparables can be generated from Factset databases using industry and sub-industry codes.
Selecting Comparables. To narrow down the set of public compa-ny comparables, a regression analysis was conducted between selected fundamentals (i.e. revenues, EBIT, and EBITDA) of those public com-panies and our private portfolio company’s operating metrics, to de-termine the extent of any correlations in operations. These correlations help to determine which of the public companies’ business operations are substantially similar to our private company. Selecting public com-panies (Figure 7. 4) with higher correlations will give us a smaller sub-set of what we will term ‘best fit’ comparables.
The premise supporting this conclusion is that external macroeconom-ic conditions should have the same directional impact on operating fi-nancial results for companies operating within the same industry. For example, we would expect a rise in oil prices from one period to the next to uniformly deteriorate the earnings of airline companies who are dependent on using oil for fuel, assuming all other conditions be-ing equal. Therefore, if we can identify public companies with higher
4
Ecomond Oy
Constellation Software 22 Companies
5 Companies
7 Companies
KeyStoneCompact
Finnish Markets
US Markets
Bloomberg
Figure 7.4Example of comparables selection for Ecomond Oy

207 R
isk: Return A
ssessment
correlations in earnings patterns to our private company, we believe it is reasonable to conclude that these public companies are more suitable to be used as a proxy for our private company.
Estimating Beta. Beta is a measure of systematic risk capturing the as-pects of investment risk that cannot be eliminated by diversification (16). It evaluates ex post the degree of risk undertaken in a diversified investment program in relation to a specific benchmark, also referred as the market. An expression used for calculating beta is:
where: ra is the return for the asset and rb is the return of the bench-mark.
In general, a beta higher than 1 indicates that the asset is more volatile than the market and a beta lower than 1 indicates that the asset is less volatile than the market.
Once ‘best fit’ public comparables are selected, we use those compara-bles to estimate a beta specific to our private company; a concept de-scribed by17 as bottom-up betas. Beta is an input into the capital as-set pricing model (CAPM), which will be discussed further in the next section, and is a widely-used measure of the volatility of a security in comparison to the market as a whole (Figure 7.5).
Betas for an asset are typically calculated by regressing historical re-turns against a stock index, with the slope of the regression line rep-resenting beta18. In the case of private companies, we do not have his-torical returns data, however we can estimate a private firm’s beta by using the average betas of the best fit public comparables previously identified, which do have readily available historical prices. We extract-ed betas for our best-fit public comparables from Bloomberg, however we note there may be small differences in betas from different sources, due to the timeframes and frequency of data points used in the regressions.
The use of financial leverage (‘debt’) magnifies re-turns and will therefore, exaggerate betas. In order to use the betas we derived from the Bloomberg database, we need to account for differences in fi-nancial leverage (‘debt’) across the individual public companies, as well as our private companies. To accomplish this, we calculated what are known as ‘unlevered betas’ for the public comparables. Unlevered be-9
Estimating Beta. Beta is a measure of systematic risk capturing the aspects of investment risk that cannot be eliminated by diversification (16). It evaluates ex post the degree of risk undertaken in a diversified investment program in relation to a specific benchmark, also referred as the market. An expression used for calculating beta is:
� � ������� ��)������)
where: ra is the return for the asset and rb is the return of the benchmark.
In general, a beta higher than 1 indicates that the asset is more volatile than the market and a beta lower than 1 indicates that the asset is less volatile than the market.
Once ‘best fit’ public comparables are selected, we use those comparables to estimate a beta specific to our private company; a concept described by (17) as bottom-up betas. Beta is an input into the capital asset pricing model (“CAPM”), which will be discussed further in the next section, and is a widely-used measure of the volatility of a security in comparison to the market as a whole (Figure 7.5).
Betas for an asset are typically calculated by regressing historical returns against a stock index, with the slope of the regression line representing beta (18). In the case of private companies, we do not have historical returns data, however we can estimate a private firm’s beta by using the average betas of the best fit public comparables previously identified, which do have readily available historical prices. We extracted betas for our best fit public comparables from Bloomberg, however we note there may be small differences in betas from different sources, due to the timeframes and frequency of data points used in the regressions.
The use of financial leverage (‘debt’) magnifies returns and will therefore, exaggerate betas. In order to use the betas we derived from the Bloomberg database, we need to account for differences in financial leverage (‘debt’) across the individual public companies, as well as our private companies. To accomplish this, we calculated what are known as ‘unlevered betas’ for the public comparables. Unlevered betas remove the effects of any leverage in a firm’s capital structure. In other words, an unlevered beta is the beta the company would have if it were it financed completely by equity and had no debt. The following formula is used to unlever beta:
unlevered = levered / (1 + (1-Tc)(debt/equity))
where: (debt/equity) = the debt to equity ratio using market values,
Tc = Corporate tax rate
Once we unlever the betas for all of the best-fit public comparables in our set, we can calculate a simple average of that set, which represents the unlevered beta of our private company. The next step is to
Box 7.4. Unlevered beta
This represents the volatility risk of the company relative to the market, if it does not hold any debt. It is a measure of how much systematic risk a firm’s equity has, and removes the beneficial effects from debt.
Box 7.4 Unlevered beta
This represents the volatility risk of the company relative to the market, if it does not hold any debt. It is a measure of how much systematic risk a firm’s equity has, and removes the beneficial effects from debt.

208Fi
nanc
ial T
echn
olo
gy fo
r Ind
ustri
al R
enew
al tas remove the effects of any leverage in a firm’s capital structure. In other words, an unlevered beta is the beta the company would have if it were it financed completely by equity and had no debt. The following formula is used to unlever beta:
β unlevered = β levered / (1 + (1-Tc)(debt/equity))
where: (debt/equity) = the debt-to-equity ratio using market values,
Tc = Corporate tax rate.
Once we unlever the betas for all of the best-fit public comparables in our set, we can calculate a simple average of that set, which represents the unlevered beta of our private company. The next step is to rele-ver the private company’s unlevered beta according to the target cap-ital structure of the private company. This can present a complication in that we do not have the market values of debt and equity for pri-vate companies like we did for public companies. Some analysts will just use book values. An alternative methodology is to use the aver-age debt-to-equity (D:E) ratio of the public companies constituting the comparable set17. In our analysis, we have judgmentally applied both methodologies to evaluate the use of one versus the other to provide better quality data. The following formula was used to relever beta:
β private firm = β unlevered (1 + (1 – Tc)(Comparables Average Debt/Equity))
Calculating Volatility. Using the estimated betas from our comparables analysis it is possible to estimate past volatility for the portfolio of pri-vate equity investments. By multiplying the beta to each weekly return
Private EquityCalculating Beta
34 Companies Analyze Financials
Higher Correlations
5 Best Fit ComparablesUnlevered Beta
Average Unlevered Beta:
0.65
Re-lever Beta
Average Levered Beta for Ecomond
1.72
5
Figure 7.5Approach to determining the behavior of Ecomond Oy relative to market comparables
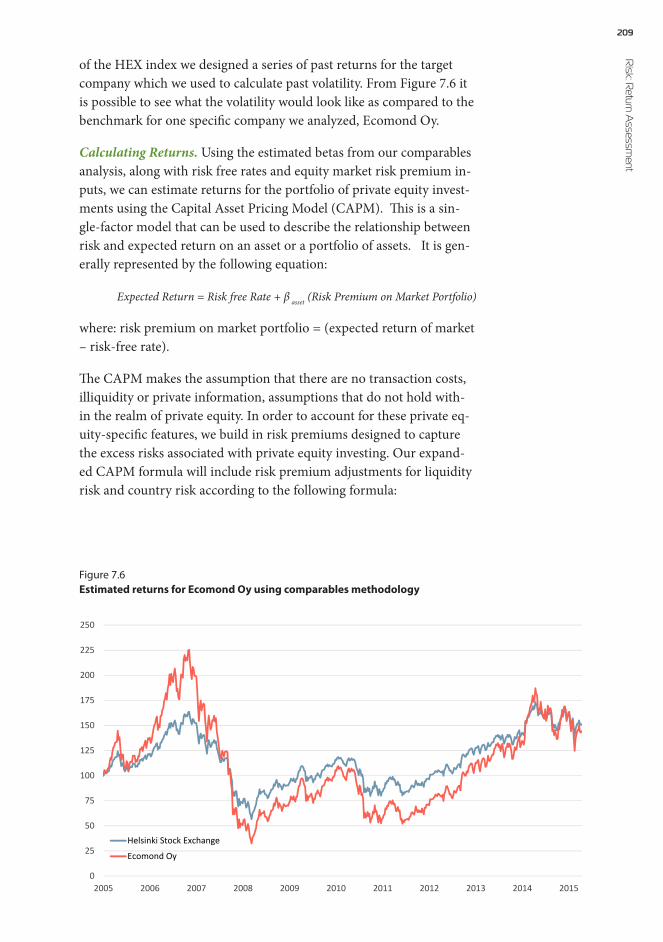
209 R
isk: Return A
ssessment
of the HEX index we designed a series of past returns for the target company which we used to calculate past volatility. From Figure 7.6 it is possible to see what the volatility would look like as compared to the benchmark for one specific company we analyzed, Ecomond Oy.
Calculating Returns. Using the estimated betas from our comparables analysis, along with risk free rates and equity market risk premium in-puts, we can estimate returns for the portfolio of private equity invest-ments using the Capital Asset Pricing Model (CAPM). This is a sin-gle-factor model that can be used to describe the relationship between risk and expected return on an asset or a portfolio of assets. It is gen-erally represented by the following equation:
Expected Return = Risk free Rate + β asset (Risk Premium on Market Portfolio)
where: risk premium on market portfolio = (expected return of market – risk-free rate).
The CAPM makes the assumption that there are no transaction costs, illiquidity or private information, assumptions that do not hold with-in the realm of private equity. In order to account for these private eq-uity-specific features, we build in risk premiums designed to capture the excess risks associated with private equity investing. Our expand-ed CAPM formula will include risk premium adjustments for liquidity risk and country risk according to the following formula:
0
25
50
75
100
125
150
175
200
225
250
2005 2006 2007 2008 2009 2010 2011 2012 2013 2014 2015
Helsinki Stock Exchange
Ecomond Oy
6
(Bloomberg 2016)
Figure 7.6Estimated returns for Ecomond Oy using comparables methodology
210Fi
nanc
ial T
echn
olo
gy fo
r Ind
ustri
al R
enew
al E[R] = Rf + β asset (Risk Premium on Market Portfolio + LRP + CRP)
where: LRP = Liquidity Risk Premium, CRP = Country Risk Premium.
In the following sections we will discuss the remaining inputs, exclud-ing beta which was previously discussed, into our CAPM formula.
Risk-Free Rate of Return. CAPM starts with the risk free rate, which is defined as the rate of return an investor would receive if they were to invest in an asset where actual returns are always equal to the expect-ed returns18. In mature markets, as is the case in Finland, using 10-year bond rates to approximate the risk-free rate is a generally accepted practice18. As such, we have used the 10-year Finnish sovereign bond rate in our analysis, which was 0.41% in April 2016.
Equity Market Risk Premium. The equity market risk premium (“ERP”) can be defined as the additional return an investor demands for investing in a broad spectrum of equities as a class over the risk free rate of return19. Equity risk premiums are determined by many factors, including the current state of risk aversion in the markets, the health of the economy, precision of information in the markets, and govern-ment policy. Given the wide array of factors that can influence ERPs, a precise measurement of the ERP at any given time is quite challenging. There are three broad approaches used in estimating ERP’s, each with their own advantages and limitations: surveying subsets of investors and managers, using historical returns on equities relative to risk free assets, and estimating a forward-looking premium based on current market prices (also known as an implied premium).
For the purposes of this analysis, we used a survey conducted by PwC in 2015 as the basis for ERP. PwC surveyed Finnish investors, equity re-searchers, insurance companies, and other professionals and found an average estimate of the ERP in Finland of 5.78% (PWC 2015). We also reviewed independent academic research commonly used as a primary resource for ERP measures, noting that an ERP of 5.75% was estimated as of January 2015 for the US19. Given that Finland is a mature market environment, similar to the US, it is reasonable to use the PwC survey results as a measure of ERP in Finland (see integration of ERP in PE risk and return exemplified for Ecomond Oy in Figure 7.7).
Liquidity Risk Premium. Damodaran20 describes the cost of illiquid-ity as buyer’s remorse; sometimes an investor will reverse a purchase decision, and will want to sell an asset that was just bought. The cost of illiquidity is the cost of that buyer’s remorse. In other words, if the investor were to attempt to sell that asset immediately, more than like-ly a loss would be incurred. For publicly traded assets, that cost will be smaller (an amount equal to the bid-ask spread). For a private compa-

211 R
isk: Return A
ssessment
ny, this cost will be larger, because there will most likely be relatively few potential buyers.
There are several approaches to measuring liquidity risk premiums, however it should be noted that liquidity discounts are likely to vary across both investors and potential private equity investments17. For in-stance, certain private companies may hold larger balances of cash and marketable assets, in which case they would be easier to sell. Also, cer-tain investors will have different preferences for liquidity in their port-folios, which will impact the size of the discount they apply.
An annual liquidity risk premium of 3.2% was applied to private equity investments within the MARF, based on the average results of the PwC survey referenced in the ERP section21. The reasonableness of the 3.2% value provided by the survey was assessed using an option-based mod-el22 that attempts to estimate an upper bound on the liquidity discount. The premise behind the option-based model is to assume that an inves-tor exists with perfect market timing abilities and this investor holds an asset which cannot be sold for a period of time. Without the trading re-striction and with perfect foresight, the investor would sell the asset at the maximum price the asset reaches over the holding period. Howev-er, given the trading restriction, the investor is forced to hold the asset until the end of the holding period. Therefore, the difference between the maximum price during the holding period and the price the inves-tor is forced to sell at is the upper bound on the value of marketability. The author also makes clear that the higher the volatility of the asset, the higher will be the discount that should be applied to it.
7
BetaRisk Free Rate + X = Return
Liquidity Risk Premium: 3.2%
Country Risk Premium: 0.26%
Market Risk Premium: 5.78%
+
+0.41% + 1.72 X16.3% - Annual0.29% - Weekly
Figure 7.7Calculating PE risk adjusted returns (example for Ecomond Oy)
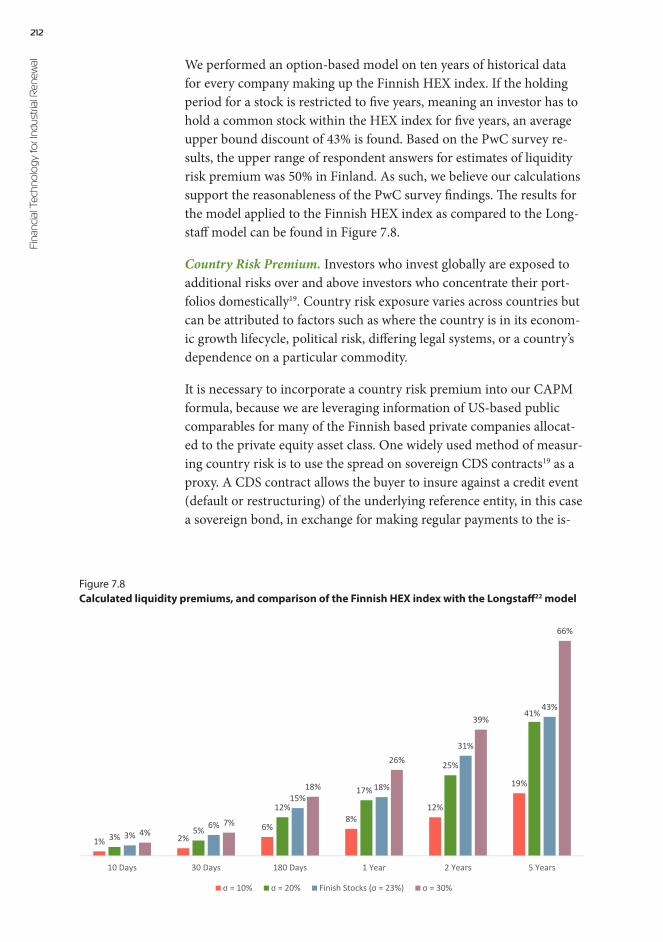
212Fi
nanc
ial T
echn
olo
gy fo
r Ind
ustri
al R
enew
al We performed an option-based model on ten years of historical data for every company making up the Finnish HEX index. If the holding period for a stock is restricted to five years, meaning an investor has to hold a common stock within the HEX index for five years, an average upper bound discount of 43% is found. Based on the PwC survey re-sults, the upper range of respondent answers for estimates of liquidity risk premium was 50% in Finland. As such, we believe our calculations support the reasonableness of the PwC survey findings. The results for the model applied to the Finnish HEX index as compared to the Long-staff model can be found in Figure 7.8.
Country Risk Premium. Investors who invest globally are exposed to additional risks over and above investors who concentrate their port-folios domestically19. Country risk exposure varies across countries but can be attributed to factors such as where the country is in its econom-ic growth lifecycle, political risk, differing legal systems, or a country’s dependence on a particular commodity.
It is necessary to incorporate a country risk premium into our CAPM formula, because we are leveraging information of US-based public comparables for many of the Finnish based private companies allocat-ed to the private equity asset class. One widely used method of measur-ing country risk is to use the spread on sovereign CDS contracts19 as a proxy. A CDS contract allows the buyer to insure against a credit event (default or restructuring) of the underlying reference entity, in this case a sovereign bond, in exchange for making regular payments to the is-
8
1% 2%6%
8%12%
19%
3%5%
12%
17%
25%
41%
3%6%
15%18%
31%
43%
4%7%
18%
26%
39%
66%
10 Days 30 Days 180 Days 1 Year 2 Years 5 Years
σ = 10% σ = 20% Finish Stocks (σ = 23%) σ = 30%
Figure 7.8Calculated liquidity premiums, and comparison of the Finnish HEX index with the Longstaff22 model

213 R
isk: Return A
ssessment
suer. The payments are calculated as a percentage of the notional val-ue and is referred to as the contract spread. In using CDS spreads as a proxy for country risk, we are assuming away counterparty risk and li-quidity risks that are inherently priced into a spread; meaning we as-sume that country risk is the only risk being priced. Our expanded CAPM formula adds a country risk premium of 0.26%, which was the spread on Finnish sovereign bond CDS contracts in April 2016.
Checking the Results. With the volatility and return numbers calcu-lated from the estimated beta for the company, we compared them to the overall stock market in Finland. Figure 7.9 shows what the Finn-ish stock market looked like in the past 10 years. In this figure it is al-so possible to see what the return would be for the most efficient portfolios at each given level of risk. If the calculated risk-return profile for the company was substantially different from historical overall market returns, we would revisit our calculations and check if better comparable companies exist. Also, if the variance for the compa-ny was in the lower range of the market we would also revise the com-parable companies to reflect the higher risk associated with smaller, private companies.
9
-0,40%
-0,20%
0,00%
0,20%
0,40%
0,60%
0,80%
0,00% 0,10% 0,20% 0,30% 0,40% 0,50% 0,60% 0,70% 0,80% 0,90% 1,00%
Wee
kly
Retu
rn
Weekly Variance
Efficient Frontier Nano Cap Micro Cap Small Cap Mid Cap Large Cap
Figure 7.9Historical risk-return profile of the Finnish stock market
The accuracy of the estimation output is highly subject to the quality of the comparables
214Fi
nanc
ial T
echn
olo
gy fo
r Ind
ustri
al R
enew
al Recommendations. In utilizing a public comparables approach, the ac-curacy of the estimation output is highly subject to the quality of the comparables used as inputs into the model. The most important step in the PE risk assessment model is finding public companies with busi-ness models that are truly representative of the private company. Often times, larger conglomerates will have business lines within the compa-ny that are comparable, however those business lines may only repre-sent a small portion of the conglomerate’s total revenue. It is therefore not meaningful to use a company such as a General Electric as a com-parable for a smaller company. For these companies to serve as a pub-lic proxy for SMEs, the separate lines of business need to be considered when using financial metrics. Hence, thorough qualitative analysis is required to find public comparables where the primary revenue gener-ating business is similar to the private company being analyzed.
SME private debt risk and return analysis for MARF companies
Thirty-five percent of the potential MARF will be invested in small or medium enterprise (SME) leveraged debt. Important for the risk assess-ment is to financially define an SME in the EU: a corporation with less than 250 employees and an annual turnover with less than 50 million Euro or a balance sheet total of less than or equal to 43 million Euro.
Current Funding Gap due to Banking Regulations. There is a market opening for SME debt investors due to the increase regulation of banks since the 2008 financial crisis. The most recent and prominent interna-tional regulations, known as Basel III, encourage banks to deleverage their assets23. The Basel III leverage ratio, which was implemented ful-ly in 2015, required banks to deleverage their capital in order to protect against a future “run” on the banks if another economic downfall simi-lar to 2008 were to occur24. Seven percent of Finnish SMEs report hav-ing trouble receiving financing; additionally, SMEs, which do receive fi-nancing, have interest rates that are 180 points higher what large enter-prises pay25. Therefore, there is a gap between banks and SMEs’ ability to receive capital in order to continue operations.
New Investing Market. The aforementioned gap opens a new mar-ket for future SME investors. European SMEs will need 2.4 to 2.8 tril-lion Euros from 2014 to 201826. With the large amount of capital SMEs need and the decreased lending potential of banks due to deleverag-ing, SMEs must find financing from outside debt investors. Compared to corporate debt investors, SME investors perceive SME loans to be riskier due to SMEs’ smaller size and often large emphasis on human capital27. In order to determine the premium that an investor must de-

215 R
isk: Return A
ssessment
mand, the investor needs to know the risk of the asset class. Howev-er, the main challenge for SME debt investors is to determine an SME’s risk level.
Risk and Return of Private Debt. Illiquidity, informational opacity and size are risks that affect SME private debt. The size of SMEs affects the financing they receive. Economies of scale exist for larger corpora-tions that issue public securities, but these economies are not realized with firms in the SME environment28. The size and capital structure of SMEs affects their ability to raise debt on the private markets. This is in part due to the limited auditing record of their financial statements, the marginal capacity to pledge business equity as collateral, and the ab-sence of public records on repayment history and record of profitabili-ty. The availability f data varies from country to country.
The illiquid nature of private debt causes the asset class to contain a pre-mium. Private debt cannot be easily sold or converted to cash, so inves-tors demand a premium on the return29. Even with the illiquidity, size and private nature of this asset class, private debt has recently offered generous returns. A private debt fund outperformed the Euro Stoxx 50 from 2013 to 2014, and has an expected return of 7% for 2015 to 2017.
Risk rating methodologies of SMEs are tied into risk of loan default
Often the riskiness of a debt instrument lies in the issuer’s chance of default. As debt instruments have changed, scholars have changed their methodologies to determine the probability of default for this asset class. Two broad methodologies exist to determine the default proba-bility of a debt issuer: quantitative and qualitative. Scholars argue that models that incorporate qualitative and quanti-tative data outperform models that rely solely on quantitative metrics30.
The literature describing probability of default fo-cuses on the issuing firm’s financial ratios. Over the years, various ratios and methods of analyzing such ratios have evolved to accommodate debt instruments, whether they are public or private firms. Beaver31 analyzed six financial ratios in a univariate sta-tistical model to determine how well financial ratios could predict if a firm failed or did not fail. He found that cash-flow to total-debt could correctly identify failed and non-failed firms much better than one could through random prediction.
Altman32 built on Beaver’s financial ratio analysis and has improved models to fit new forms of debt instruments, including private SME
Scholars argue that models that incorporate qualitative and quanti-tative data outperform models that rely solely on quantitative metrics
216Fi
nanc
ial T
echn
olo
gy fo
r Ind
ustri
al R
enew
al debt. The Z-Score analysis used financial and economic ratios to de-termine the probability of default for manufacturing corporations. A multi-discriminant analysis was conducted to find five ratios that could significantly predict probability of default: Working Capital/Total As-sets, Retained Earnings-to-Total Assets, EBIT-to-Total Assets, Mar-ket Value Equity-to-Book Value of Debt, and Sales-to-Total Assets. A firm would fall into three categories based on a final discriminant func-tion with coefficients for the previously mentioned ratios; the catego-ries were non-bankrupt, bankrupt, and zone of ignorance32. A new Ze-ta analysis incorporated seven financial ratio variables33. The new Zeta model could better predict a firm’s probability of default compared to the previous 1968 model.
Due to the differences between SMEs and larger corporations, schol-ars have developed new models to determine probability of default for
SMEs. Altman and Sabato34 developed a quantita-tive analysis to determine probability of default for SMEs in the U.S. market. The model is based on five accounting areas and found significant ratios for each: Profitability (EBITDA-to-Total Assets), Lever-age (Short-Term Debt-to-Equity Book Value), Li-
quidity (Cash-to-Total Assets), and Activity (EBITDA-to-Interest Ex-penses). Based on a logistic regression, the probability of default for SMEs was assessed with an accuracy level of 87%, which outperformed Altman’s Z-score32 model applied to the same data set34.
In addition to quantitative analysis, research has proposed the incorpo-ration of qualitative data to determine probability of default. Non-ac-counting variables can be better predictors of corporate failure and fi-nancial distress for SMEs compared to financial ratios35. Event or qual-itative data, such as county court judgments, whether a firm is audited, a firm’s age, if a firm has subsidiaries, and whether a firm issues a cash flow statement can improve the probability of default prediction35. The addition of qualitative to Altman et. al.34 analysis improved the model’s classification by 13%36.
Modeling the debt risk rating for small and medium enterprises
In Finland, companies are required to report their financial statements to a central organization, Asiakastieto, regardless of whether they are publicly traded or privately held (Figure 7.10). The financial metrics that the companies must report are very granular, with over 130 metrics in total. In addition, Asiakastieto tracks credit information related to these companies such as late bill payments or bankruptcy filings. Through
Non-accounting variables can be better predictors of corporate
failure and financial distress for SMEs compared to financial ratios

217 R
isk: Return A
ssessment
ETLA, we were able to access this dataset for all Finnish companies from the year 2002 until 2015. This dataset was then pared down to just SMEs based on the revenue criteria set by the European Union.
Prediction of loan default. For our analysis, we are interested in pre-dicting whether a company will default in the coming year based on their reported financial statements from the previous year. As such, the credit information for year 2002 was not used because we would have needed the financial statements from 2001, which were not part of the dataset. Similarly, we did not use the financial statements from 2015 be-cause we do not yet know whether these companies will default in 2016.
10
Figure 7.10Summary of Asiakastieto Credit History Dataset from 2003 through 2014
11
Figure 7.11Performance of Wuha Oy leading up to their bankruptcy filing

218Fi
nanc
ial T
echn
olo
gy fo
r Ind
ustri
al R
enew
al By comparing the mean historical default proportion (about 2.5%) be-tween SMEs and the entire population of Finnish companies we found that there was no significant statistical difference. To illustrate the ob-jective of our models, the performance of Wuha Oy from 2009 through 2013 is shown in Figure 7.11. Starting in 2010, Wuha has at least one late payment each year. Then in 2012, their EBITDA is less than their interest expense and their bankruptcy filing is reported in the following year. Ideally, the model we develop would predict a gradually increas-ing probability of default leading up to 2012.
Based on our literature review, we chose to build several different types of models and compare their performance. Regardless of the specific type of model, they all aim to solve the same problem: predict default based on a set of features that describe the firm. This is shown schemat-ically in Figure 7.12. Two of the models used, linear discriminants anal-ysis and logistic classification, have been widely used in the literature and are not discussed in detail here.
The decision tree, AdaBoost, and Random Forest™ models however are less known. Each of these aim to capture the underlying intuition that humans use to make decisions. Decision tree models use thresh-old values for the features of an observation to determine the classifi-cation that the observation belongs to, as shown in the inset of Figure 7.13. The threshold values used to make decisions are optimized with the goal of maximizing model accuracy. In our case, the features are fi-nancial metrics of a firm and the classification is whether the firm will default or not. Decision tree models use a single tree to make all pre-dictions. In contrast, AdaBoost and Random Forest™ use an ensemble of trees, as shown in Figure 7.13, to make their decisions37. This is anal-
12
X1
XnFeatures
DescribingFirm
Transfer Function
f(X) Y
Probabilityof
Default
Figure 7.12Schematic representation of probability of default models
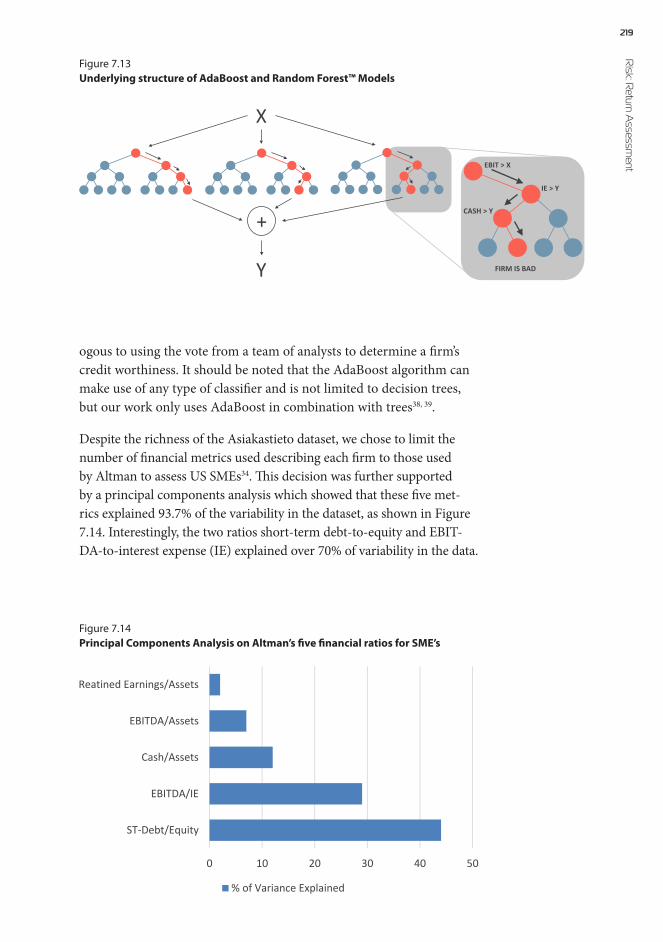
219 R
isk: Return A
ssessment
X
+
Y
IE > Y
EBIT > X
CASH > Y
FIRM IS BAD
ogous to using the vote from a team of analysts to determine a firm’s credit worthiness. It should be noted that the AdaBoost algorithm can make use of any type of classifier and is not limited to decision trees, but our work only uses AdaBoost in combination with trees38, 39.
Despite the richness of the Asiakastieto dataset, we chose to limit the number of financial metrics used describing each firm to those used by Altman to assess US SMEs34. This decision was further supported by a principal components analysis which showed that these five met-rics explained 93.7% of the variability in the dataset, as shown in Figure 7.14. Interestingly, the two ratios short-term debt-to-equity and EBIT-DA-to-interest expense (IE) explained over 70% of variability in the data.
Figure 7.13Underlying structure of AdaBoost and Random Forest™ Models
14
0 10 20 30 40 50
ST-Debt/Equity
EBITDA/IE
Cash/Assets
EBITDA/Assets
Reatined Earnings/Assets
% of Variance Explained
Figure 7.14Principal Components Analysis on Altman’s five financial ratios for SME’s
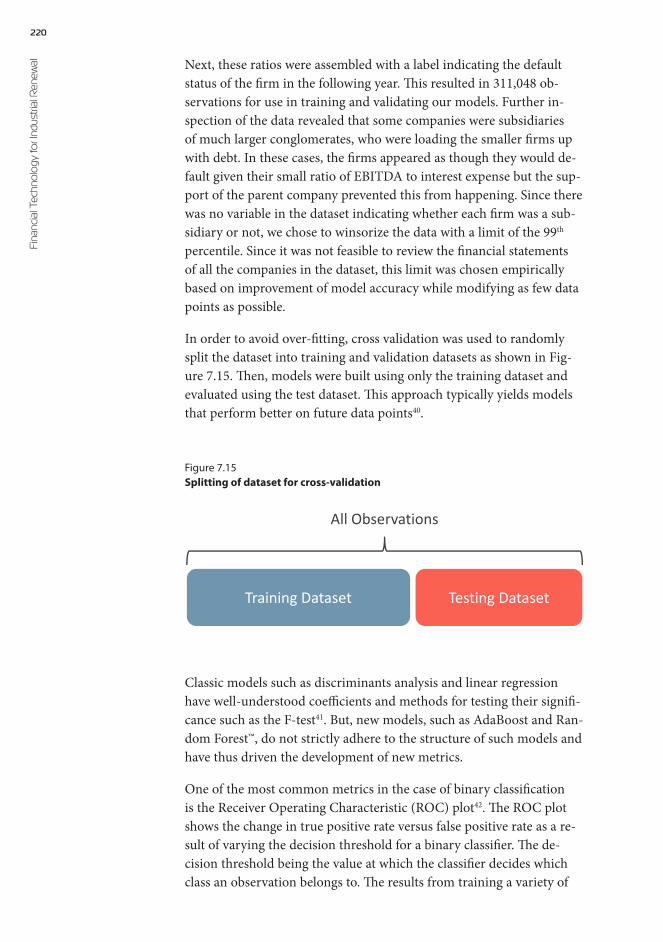
220Fi
nanc
ial T
echn
olo
gy fo
r Ind
ustri
al R
enew
al Next, these ratios were assembled with a label indicating the default status of the firm in the following year. This resulted in 311,048 ob-servations for use in training and validating our models. Further in-spection of the data revealed that some companies were subsidiaries of much larger conglomerates, who were loading the smaller firms up with debt. In these cases, the firms appeared as though they would de-fault given their small ratio of EBITDA to interest expense but the sup-port of the parent company prevented this from happening. Since there was no variable in the dataset indicating whether each firm was a sub-sidiary or not, we chose to winsorize the data with a limit of the 99th percentile. Since it was not feasible to review the financial statements of all the companies in the dataset, this limit was chosen empirically based on improvement of model accuracy while modifying as few data points as possible.
In order to avoid over-fitting, cross validation was used to randomly split the dataset into training and validation datasets as shown in Fig-ure 7.15. Then, models were built using only the training dataset and evaluated using the test dataset. This approach typically yields models that perform better on future data points40.
15
Training Dataset Testing Dataset
All Observations
Figure 7.15Splitting of dataset for cross-validation
Classic models such as discriminants analysis and linear regression have well-understood coefficients and methods for testing their signifi-cance such as the F-test41. But, new models, such as AdaBoost and Ran-dom Forest™, do not strictly adhere to the structure of such models and have thus driven the development of new metrics.
One of the most common metrics in the case of binary classification is the Receiver Operating Characteristic (ROC) plot42. The ROC plot shows the change in true positive rate versus false positive rate as a re-sult of varying the decision threshold for a binary classifier. The de-cision threshold being the value at which the classifier decides which class an observation belongs to. The results from training a variety of
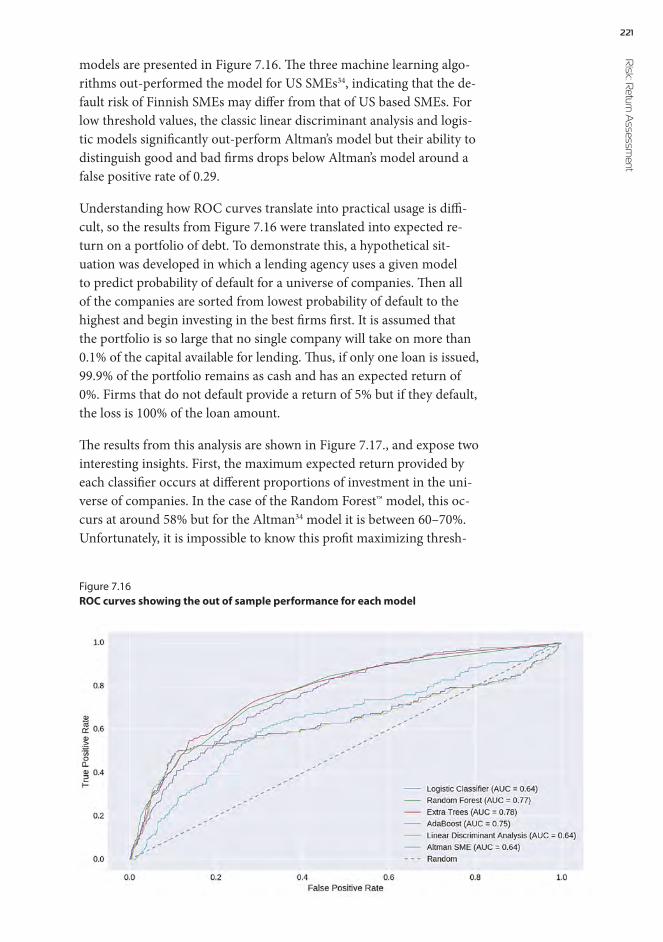
221 R
isk: Return A
ssessment
models are presented in Figure 7.16. The three machine learning algo-rithms out-performed the model for US SMEs34, indicating that the de-fault risk of Finnish SMEs may differ from that of US based SMEs. For low threshold values, the classic linear discriminant analysis and logis-tic models significantly out-perform Altman’s model but their ability to distinguish good and bad firms drops below Altman’s model around a false positive rate of 0.29.
Understanding how ROC curves translate into practical usage is diffi-cult, so the results from Figure 7.16 were translated into expected re-turn on a portfolio of debt. To demonstrate this, a hypothetical sit-uation was developed in which a lending agency uses a given model to predict probability of default for a universe of companies. Then all of the companies are sorted from lowest probability of default to the highest and begin investing in the best firms first. It is assumed that the portfolio is so large that no single company will take on more than 0.1% of the capital available for lending. Thus, if only one loan is issued, 99.9% of the portfolio remains as cash and has an expected return of 0%. Firms that do not default provide a return of 5% but if they default, the loss is 100% of the loan amount.
The results from this analysis are shown in Figure 7.17., and expose two interesting insights. First, the maximum expected return provided by each classifier occurs at different proportions of investment in the uni-verse of companies. In the case of the Random Forest™ model, this oc-curs at around 58% but for the Altman34 model it is between 60–70%. Unfortunately, it is impossible to know this profit maximizing thresh-
16
Figure 7.16ROC curves showing the out of sample performance for each model
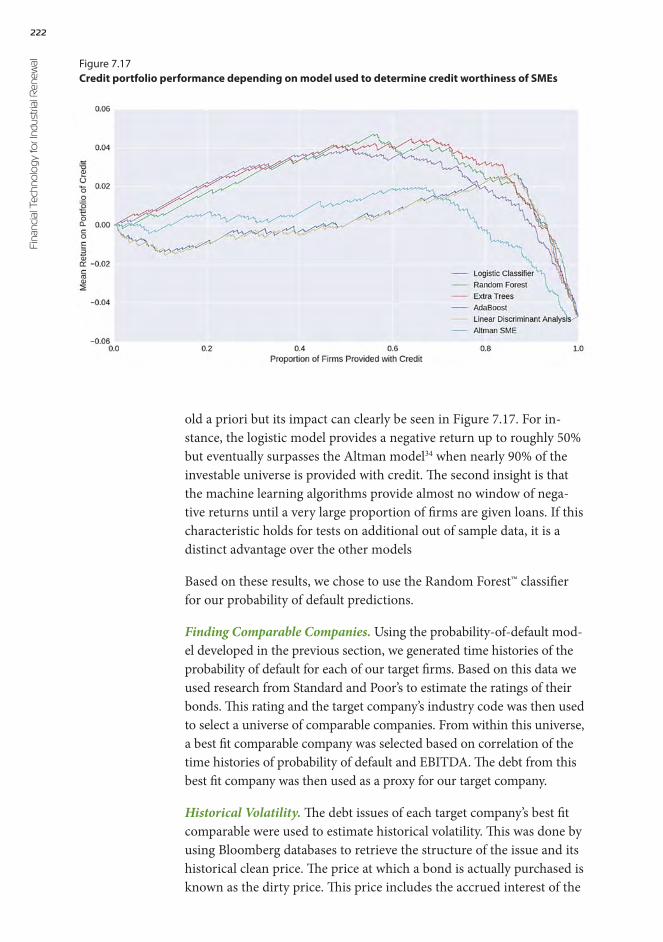
222Fi
nanc
ial T
echn
olo
gy fo
r Ind
ustri
al R
enew
al
old a priori but its impact can clearly be seen in Figure 7.17. For in-stance, the logistic model provides a negative return up to roughly 50% but eventually surpasses the Altman model34 when nearly 90% of the investable universe is provided with credit. The second insight is that the machine learning algorithms provide almost no window of nega-tive returns until a very large proportion of firms are given loans. If this characteristic holds for tests on additional out of sample data, it is a distinct advantage over the other models
Based on these results, we chose to use the Random Forest™ classifier for our probability of default predictions.
Finding Comparable Companies. Using the probability-of-default mod-el developed in the previous section, we generated time histories of the probability of default for each of our target firms. Based on this data we used research from Standard and Poor’s to estimate the ratings of their bonds. This rating and the target company’s industry code was then used to select a universe of comparable companies. From within this universe, a best fit comparable company was selected based on correlation of the time histories of probability of default and EBITDA. The debt from this best fit company was then used as a proxy for our target company.
Historical Volatility. The debt issues of each target company’s best fit comparable were used to estimate historical volatility. This was done by using Bloomberg databases to retrieve the structure of the issue and its historical clean price. The price at which a bond is actually purchased is known as the dirty price. This price includes the accrued interest of the
17
Figure 7.17Credit portfolio performance depending on model used to determine credit worthiness of SMEs

223 R
isk: Return A
ssessment
forthcoming coupon payment. As a result, the dirty price drops signifi-cantly on the day following a coupon payment. In contrast, the clean price is the dirty price minus the accrued interest. Thus, in order to cal-culate historical returns we defined the weekly return as:
where: pi = daily mid clean price at week I; rcpn = bond coupon rate stat-ed on a weekly basis; Par = the face value or principal of the bond
Additionally, upon payment of a coupon, these proceeds are assumed to have been reinvested into the same bond according to the dirty price from the exchange on the day after the coupon was paid. Ideally, clean prices would be retrieved for the previous 5 years, but in some cases on-ly 3 years of data were available for the best fit comparable companies. In these cases, only the data available was used. The historical volatility was then calculated as the standard deviation of the weekly returns.
Future Returns. The mean of the past month’s Yield to Worst on our best fit comparable bonds was used to estimate the future returns on the target company’s debt. This was chosen because it most accurate-ly reflects the current interest rate environment and any risks specific to the industry43. The exact time window used to calculate future yields for our target companies was 03/21/2016 to 04/15/2016.
Liquidity Risk Premium. Due to the illiquid nature of SME debt, a risk premium needed to be added on top of the expected yield devel-oped above. This was calculated in a similar manner as Private Equity using an options-based approach to value liquidity over varying time horizons and volatility44. Based on the selected universe of comparable companies, the mean liquidity risk was estimated to be 1.6%.
Country Specific Risk Premium. A second risk premium was added to the expected yield which accounted for country-specific risk. This was calculated as:
where: rcountry = country specific risk premium; rf,comparable = rate on trea-sury bond of comparable company’s domicile of risk; rf,target = rate on treasury bond of target company’s domicile of risk
In addition, both risk free rates, the rates on the treasury bonds, were matched for maturity to that of the comparable company’s bond issue. This premium ranged from 0.63% to 1.57% depending on the maturity of the comparable issue.
21
Based on these results, we chose to use the Random Forest™ classifier for our probability of default predictions.
Finding Comparable Companies. Using the probability-of-default model developed in the previous section, we generated time histories of the probability of default for each of our target firms. Based on this data we used research from Standard and Poor’s to estimate the ratings of their bonds. This rating and the target company’s industry code was then used to select a universe of comparable companies. From within this universe, a best fit comparable company was selected based on correlation of the time histories of probability of default and EBITDA. The debt from this best fit company was then used as a proxy for our target company.
Historical Volatility. The debt issues of each target company’s best fit comparable were used to estimate historical volatility. This was done by using Bloomberg databases to retrieve the structure of the issue and its historical clean price. The price at which a bond is actually purchased is known as the dirty price. This price includes the accrued interest of the forthcoming coupon payment. As a result, the dirty price drops significantly on the day following a coupon payment. In contrast, the clean price is the dirty price minus the accrued interest. Thus, in order to calculate historical returns we defined the weekly return as:
������� =�� � ���� � ���
����
where: pi = daily mid clean price at week I; rcpn = bond coupon rate stated on a weekly basis; Par = the face value or principal of the bond
Additionally, upon payment of a coupon, these proceeds are assumed to have been reinvested into the same bond according to the dirty price from the exchange on the day after the coupon was paid. Ideally, clean prices would be retrieved for the previous 5 years, but in some cases only 3 years of data were available for the best fit comparable companies. In these cases, only the data available was used. The historical volatility was then calculated as the standard deviation of the weekly returns.
Future Returns. The mean of the past month’s Yield to Worst on our best fit comparable bonds was used to estimate the future returns on the target company’s debt. This was chosen because it most accurately reflects the current interest rate environment and any risks specific to the industry (43). The exact time window used to calculate future yields for our target companies 03/21/2016 to 04/15/2016.
Liquidity Risk Premium. Due to the illiquid nature of SME debt, a risk premium needed to be added on top of the expected yield developed above. This was calculated in a similar manner as Private Equity using an options based approach to value liquidity over varying time horizons and volatility (44). Based on the selected universe of comparable companies, the mean liquidity risk was estimated to be 1.6%.
Country Specific Risk Premium. A second risk premium was added to the expected yield which accounted for country-specific risk. This was calculated as:
�������� = ������������� � ���������
224Fi
nanc
ial T
echn
olo
gy fo
r Ind
ustri
al R
enew
al Risk and return analysis for MARF climate bonds
As explained in Chapter 6, a climate bond is a thematic debt securi-ty focused around climate mitigation projects. As is the case for oth-er bonds, it is paid off at maturity through repayment of the bond’s face value, and it can also be structured so that the issuer is obliged to
make periodic coupon payments, as interest, un-til maturity45. The first climate bond was issued in 2007 by the European Investment Bank (EIB). The EIB sought to create an investment vehicle which provided climate mitigation and adapta-tion initiatives with access to mainstream cap-
ital. These initiatives previously relied on non-traditional investment vehicles, which carried terms not suitable for large portfolio investors. The EIB’s creation of this asset class enabled institutional investors to join the climate solution investment marketplace46.
The capital raised through climate bonds is earmarked for projects that are categorized into the following groupings47:
– Energy – Renewables, distribution/management, storage, prod-ucts that support Smart Grid, data centers using renewable ener-gy
– Energy efficiency – Green commercial buildings, green residen-tial mortgages, energy efficient technology and products, indus-trial retrofits
– Transport – Public (rail, bus rapid transit), electric vehicle infra-structure, cycling rental schemes and infrastructure, low emis-sion vehicles
– Water – Storm water adaptation, investments dealing with rain-fall volatility, water treatment and recycling, waterway adapta-tion
– Waste management – Waste water treatment and methane cap-ture, waste to energy
– Land-use – Sustainable forestry and supply chain, sustainable agriculture and supply chain
– Adaptation infrastructure – Adapting infrastructure to in-creased head stress, ports redevelopment to address sea level rise, storm surge protection, broadband
Despite the issuance of the first climate bond in 2007, the market saw little growth through the end of 2014, with only nine bonds trading globally in the secondary market. Since then, the secondary market has expanded to approximately 180 bonds. Finland recently joined the cho-rus of climate bonds with an an issuance with broad debt finance appli-cations.
EIB sought to create an investment vehicle which provided climate
mitigation and adaptation initiatives with access to mainstream capital

225 R
isk: Return A
ssessment
Slow initial growth in the market is partially attributed to ambiguity in the definition of a climate bond47. Across and within investment eco-systems, issuers set unique climate bonds standards, requiring investors to conduct due diligence to determine if specific bonds met portfolio standards. To overcome this inconsistency, The Climate Bonds Initia-tive, an investor-focused not-for-profit organization, was founded and has created a Climate Bond Taxonomy.
The Climate Bond Taxonomy defines climate bond standards and out-lines an official certification scheme which can be employed to help standardize the asset class48. Standards used in this taxonomy are de-fined by a board of sector-specific experts. Scientific thresholds de-fined are grounded on the most commonly accepted analysis of emis-sion mitigation pathways. These standards are then used by third-party organizations who are able to certify which bonds are indeed climate bonds. To date, the climate bond universe, including labelled climate bonds and unlabeled climate-aligned bonds is approximately $600 bn., a nearly 10-fold increase over 2015.
Climate bond specific risks are the same as conventional bond risks. Depending on the climate bonds selected for the MARF, the following risks may apply:
– Call risk – a bond is called back by the issuer before maturity, typically driven by lower interest rates in the market
– Reinvestment risk – after a bond has been called back, an inves-tor can only reinvest in lower return bonds
– Credit risk – the inability of the issuer to make interest payments– Interest rate risk – an investor cannot immediately recover
funds for alternative investments if market rates go up– Liquidity risk – the inability to quickly sell a bond via second-
ary market– Currency risk (international bond) – currency rate changes
that impact realized return across international markets
Credit risk for bonds is assessed by credit rating agencies, if hired by the issuer. The most commonly used credit rating agencies include Standard & Poor’s, Moody’s, and Fitch. These agencies use a combina-tion of qualitative and quantitative metrics to conduct their analysis to provide a credit rating. Metrics employed typically include:
– Predictability of cash flow – the ability of a company to earn cash
– Adverse scenarios – an estimate of each issuer’s response to a selection of possible future scenarios, both at the broader mac-roeconomic level and at a level more specific to the issuer
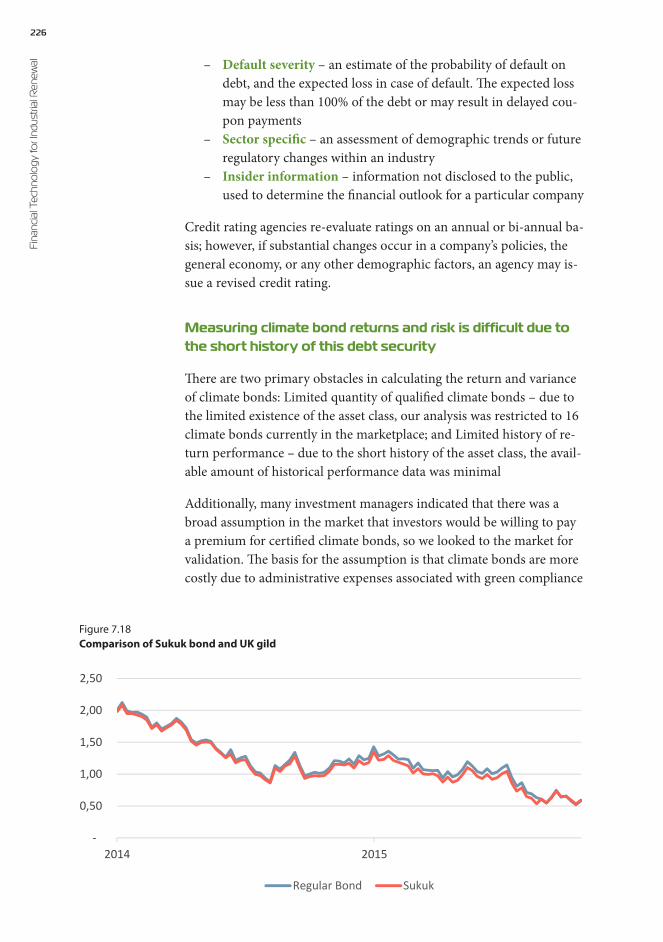
226Fi
nanc
ial T
echn
olo
gy fo
r Ind
ustri
al R
enew
al – Default severity – an estimate of the probability of default on debt, and the expected loss in case of default. The expected loss may be less than 100% of the debt or may result in delayed cou-pon payments
– Sector specific – an assessment of demographic trends or future regulatory changes within an industry
– Insider information – information not disclosed to the public, used to determine the financial outlook for a particular company
Credit rating agencies re-evaluate ratings on an annual or bi-annual ba-sis; however, if substantial changes occur in a company’s policies, the general economy, or any other demographic factors, an agency may is-sue a revised credit rating.
Measuring climate bond returns and risk is difficult due to the short history of this debt security
There are two primary obstacles in calculating the return and variance of climate bonds: Limited quantity of qualified climate bonds – due to the limited existence of the asset class, our analysis was restricted to 16 climate bonds currently in the marketplace; and Limited history of re-turn performance – due to the short history of the asset class, the avail-able amount of historical performance data was minimal
Additionally, many investment managers indicated that there was a broad assumption in the market that investors would be willing to pay a premium for certified climate bonds, so we looked to the market for validation. The basis for the assumption is that climate bonds are more costly due to administrative expenses associated with green compliance
18
-
0,50
1,00
1,50
2,00
2,50
2014 2015
Regular Bond Sukuk
Figure 7.18Comparison of Sukuk bond and UK gild
227 R
isk: Return A
ssessment
requirements to demonstrate that the bond’s investments have the in-tended environmental impacts. The rationale for testing this hypothe-sis is that if climate bonds are sold and traded at a premium versus con-ventional bonds with the same structure and risk profile, MARF port-folio returns would be negatively impacted.
As a first proxy for climate bonds, we first investigated Sukuk bonds, which are debt securities designed to generate returns without infring-ing on Islamic law, which prohibits payment of interest49. The first Sukuk bond was issued in 2000 by Malaysia. Since then, Sukuk bonds have been issued by multiple states and corporations. Our analysis fo-cused on two sovereign bonds in the UK market with the same maturi-ty and seniority. Since June 2014, the Sukuk bond has traded at little to no premium versus a conventional UK gild as shown in Figure 7.18.
As a second proxy for climate bonds, we examined one of the most liq-uid climate bonds in the global marketplace, which was issued by Ap-ple Inc. in February 2016. The universe of climate bonds shows the yield of bonds as a function of their ratings (AAA to BBB) and matu-rity (Figure 7.19, top). If we extract Apple’s climate bond (rated AA+), and map it on a AA yield curve, it does not appear to yield a premium (Figure 7.19, bottom).
In both instances, we could not prove that climate bonds would trade at a premium, thus our analysis was not impacted by this sentiment.
Value at risk estimates for climate bonds were based on the entire universe of this type of security
To calculate the potential return and variance of a portfolio of assets in this class, we first screened the Bloomberg database for all corpo-rate climate bonds in the global market that had more than 21 weeks of trading history. Additionally, we sought to achieve an average ma-turity timeline of five to seven years, a time horizon that would fit with the EU Long Term Investment Fund (LTIF), and adheres to gen-eral holding mandates of longer-term investors such as pension funds (Figure 7.20).
Estimate of returns. An equally-weighted yield to worst (YTW) of 16 bonds was calculated that met the trading and maturity criteria. We re-stricted our analysis to performance in the same time range used for SME Debt, which reflected the market’s most current performance. We employed YTW because it is the most conservative estimate of po-tential return that an investor can earn50. Yield to worst is the lower of yield to maturity (YTM) or yield to call (YTC).
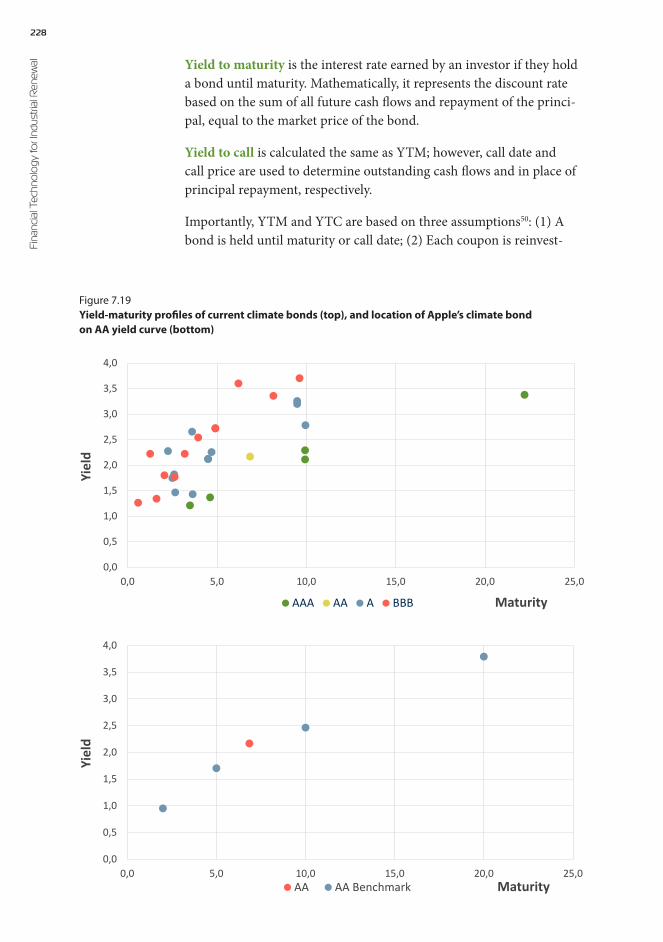
228Fi
nanc
ial T
echn
olo
gy fo
r Ind
ustri
al R
enew
al Yield to maturity is the interest rate earned by an investor if they hold a bond until maturity. Mathematically, it represents the discount rate based on the sum of all future cash flows and repayment of the princi-pal, equal to the market price of the bond.
Yield to call is calculated the same as YTM; however, call date and call price are used to determine outstanding cash flows and in place of principal repayment, respectively.
Importantly, YTM and YTC are based on three assumptions50: (1) A bond is held until maturity or call date; (2) Each coupon is reinvest-
0,0
0,5
1,0
1,5
2,0
2,5
3,0
3,5
4,0
0,0 5,0 10,0 15,0 20,0 25,0AA AA Benchmark
Yiel
d
Maturity
0,0
0,5
1,0
1,5
2,0
2,5
3,0
3,5
4,0
0,0 5,0 10,0 15,0 20,0 25,0
AAA AA A BBB
Yiel
d
Maturity
Figure 7.19Yield-maturity profiles of current climate bonds (top), and location of Apple’s climate bond on AA yield curve (bottom)

229 R
isk: Return A
ssessment
ed; and (3) Coupons are reinvested at the applicable YTM or YTC. It should also be noted that neither YTM nor YTC consider the impact that taxes, fees, or commissions have on return; this should eventual-ly be considered at a MARF level based on terms agreed upon with in-vestment managers.
Variance of bond portfolio performance. This was based on sourced ‘clean bond prices’ from Bloomberg, which were converted to ‘dirty prices’ based on individual bond terms. We then incorporated dirty price data into the total return equation, as discussed in the SME sec-tion. This calculation mirrors the approach employed in determining SME debt variance.
Risk and return analysis for public equities
As was discussed in Chapter 6, public equities can be allocated in dif-ferent investment vehicles, ranging from stocks in open and closed-end funds, and benchmarked exchange traded funds (ETFs) tracked to a large index. ETFs are pooled funds quot-ed on stock markets and designed to rep-licate the performance of a specific asset class51. ETFs began trading in 1993 when State Street, an American financial-services group, launched an ETF that tracked the S&P 500. The investing public showed a de-mand for such a fund. For example, Bar-clays’ TIPS fund commenced trading in De-cember 2003 and this asset class has grown to over $22 billion. Pension funds have shown increasing appetite for investing in ETFs using either an active or passive man-agement strategy.
The benefit of ETFs is low costs, high tax efficiency, and liquidity compared to oth-er asset classes. ETFs generally have low-er costs than other funds as a result of cli-ent service-related expenses being passed on to the brokerage firms that operate the ETF52. ETFs provide tax benefits to inves-tors. Investors do not pay capital gains tax-es until the investor chooses to sell the fund shares52. The deferral of capital gains bene-fits tax-exempt investors because unrealized gains do not build up inside the ETF53.
Target Company Average Return
Average Variance
Vornado Realty Lp 0.04% 0.3%Anstock Ii Ltd 0.04% 0.1%Morgan Stanley 0.03% 0.0%Bank Of America Corp 0.02% 0.0%Digital Realty Trust Lp 0.07% 0.0%Georgia Power Co 0.05% 0.2%Credit Agricole Cib 0.03% 0.1%Bank Of America Corp* 0.03% 0.0%
Apple Inc 0.04% 0.0%Regency Centers Lp 0.06% 0.0%NederWaterschapsbank 0.04% 0.1%
Ing Bank Nv 0.03% 0.0%Southern Power Co 0.07% 0.0%Agricultural Bk Of China 0.03% 0.0%
Hyundai Capital Services 0.05% 0.0%
Kfw 0.02% 0.0%Credit Agricole Cib* 0.05% 0.0%Credit Agricole Cib* 0.03% 0.0%Export-import Bk India 0.05% 0.0%Goldwind New Energy Hk 0.04% 0.3%
Ing Bank Nv 0.04% 0.2%
*Duplicates on the list indicate separate bond issues bythe same company
Figure 7.20Green bond issue, return and variance used in the MARF

230Fi
nanc
ial T
echn
olo
gy fo
r Ind
ustri
al R
enew
al Unlike the SME debt and private equity portfolio, the ETF in the MARF is a representation of global companies, based on the finan-cial network map and the KeyStone Compact® selection process. In the Smart Mobility map, stocks from the following countries are represent-ed: Finland, Switzerland, Germany, Japan, Canada, Sweden, Denmark, and USA (Figure 7.21). The selection criteria for inclusion in the ETF – which are in line with practice in the financial services industry – are:
Minimum 20% free float of shares. The free-float methodology for cal-culating market capitalization of an index’s underlying companies takes the equity price and multiplies it by the number of shares readily avail-able in the market. Instead of using all of the shares outstanding like the full-market capitalization method, the free-float method excludes locked-in shares such as those held by promoters and governments.
Business diversification. The companies needed to be selected in an 80:20 ratio based on KeyStone Compact® investment grade scores. The majority of companies were placed above the 40% (‘upside potential’) mark, and preferably in the upper two quadrants (strategic or expan-sional opportunity) of the investment grade diagram. The rationale for this criteria is to mix diversification in the company’s lines of business (above 40%) with more ‘pure play’-type companies (below 40%).
Broad allocation of stocks within ETF. The allocation weights of each company in the portfolio (‘w’ in Figure 7.22) was restricted to a max-imum of 8%, such that overreliance of returns on a limited subset of companies is avoided.
Ublox
Fsecure
Wartsila
CGI
Murata
Elisa
DSV
Kone
Valmet
Nokia
Bittium
Cargotec
Siemens
Nokian
TeliaSonera
BRP
ABB
Actuant
YIT
TelecityFortumHoneyWellMurataCGINiceBusinessNokiaElisaBaswareOracleTietoF-Secure
GoogleTeliasoneraPrysmianABBSiemensAgcoTeklaCassidianMicrosoftIBMSAPKemet
Smart Grid Stocks Smart Mobility Stocks
Figure 7.21Smart Grid and Smart Mobility stocks selected based on financial network maps and stock asset allocation strategies
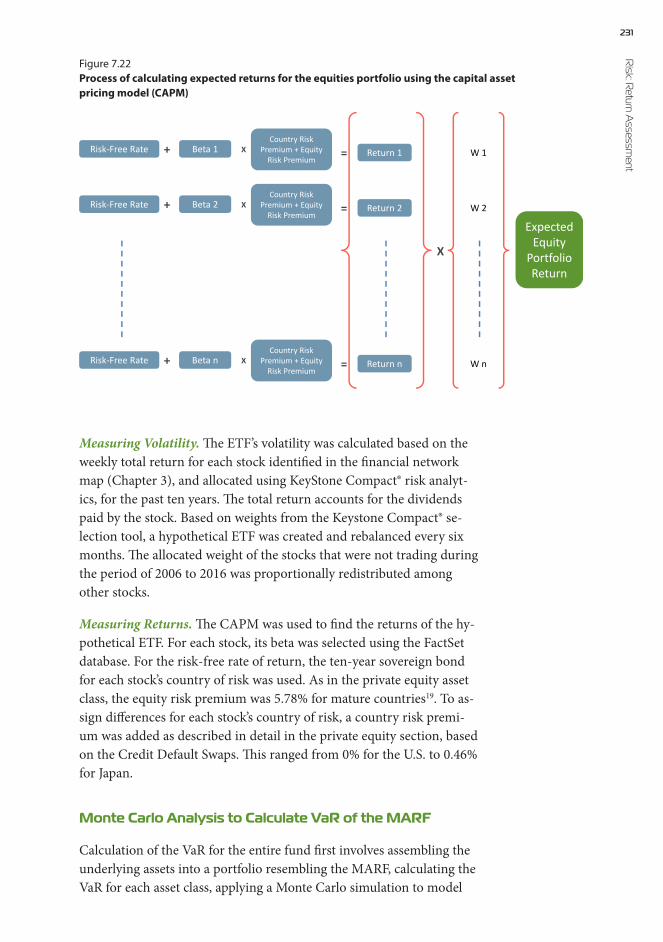
231 R
isk: Return A
ssessment
Measuring Volatility. The ETF’s volatility was calculated based on the weekly total return for each stock identified in the financial network map (Chapter 3), and allocated using KeyStone Compact® risk analyt-ics, for the past ten years. The total return accounts for the dividends paid by the stock. Based on weights from the Keystone Compact® se-lection tool, a hypothetical ETF was created and rebalanced every six months. The allocated weight of the stocks that were not trading during the period of 2006 to 2016 was proportionally redistributed among other stocks.
Measuring Returns. The CAPM was used to find the returns of the hy-pothetical ETF. For each stock, its beta was selected using the FactSet database. For the risk-free rate of return, the ten-year sovereign bond for each stock’s country of risk was used. As in the private equity asset class, the equity risk premium was 5.78% for mature countries19. To as-sign differences for each stock’s country of risk, a country risk premi-um was added as described in detail in the private equity section, based on the Credit Default Swaps. This ranged from 0% for the U.S. to 0.46% for Japan.
Monte Carlo Analysis to Calculate VaR of the MARF
Calculation of the VaR for the entire fund first involves assembling the underlying assets into a portfolio resembling the MARF, calculating the VaR for each asset class, applying a Monte Carlo simulation to model
Public EquityCalculating Expected Return: CAPM
22
Beta 1Risk-Free Rate + X = Return 1Country Risk
Premium + Equity Risk Premium
Beta 2Risk-Free Rate + X = Return 2Country Risk
Premium + Equity Risk Premium
Beta nRisk-Free Rate + X = Return nCountry Risk
Premium + Equity Risk Premium
W 1
W 2
W n
X
Expected Equity
Portfolio Return
Figure 7.22Process of calculating expected returns for the equities portfolio using the capital asset pricing model (CAPM)
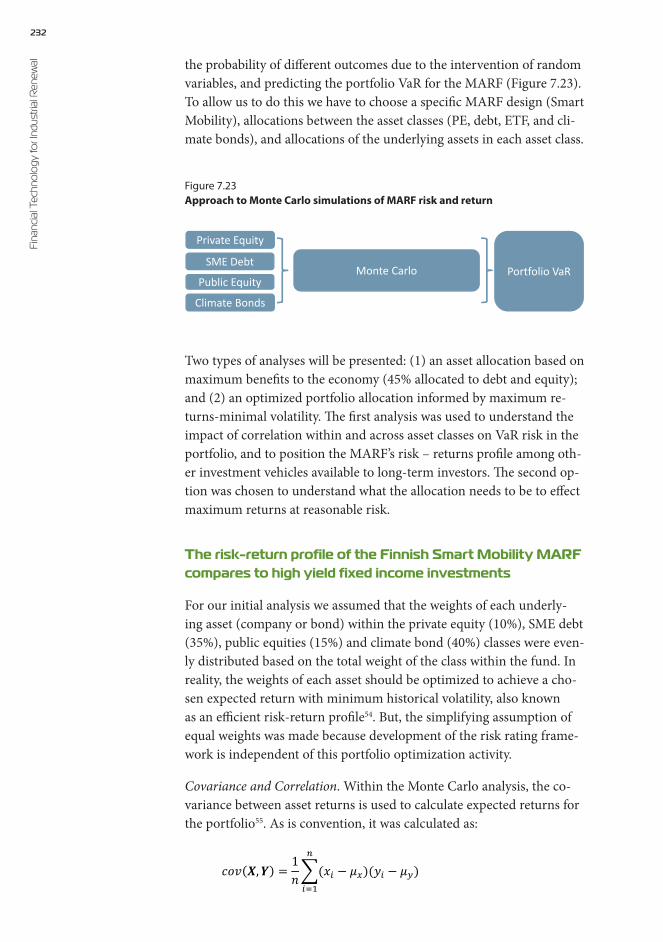
232Fi
nanc
ial T
echn
olo
gy fo
r Ind
ustri
al R
enew
al the probability of different outcomes due to the intervention of random variables, and predicting the portfolio VaR for the MARF (Figure 7.23). To allow us to do this we have to choose a specific MARF design (Smart Mobility), allocations between the asset classes (PE, debt, ETF, and cli-mate bonds), and allocations of the underlying assets in each asset class.
Value at Risk (VaR)Calculating Return and Variance
23
Private Equity
Monte Carlo Portfolio VaRSME Debt
Public Equity
Climate Bonds
Figure 7.23Approach to Monte Carlo simulations of MARF risk and return
Two types of analyses will be presented: (1) an asset allocation based on maximum benefits to the economy (45% allocated to debt and equity); and (2) an optimized portfolio allocation informed by maximum re-turns-minimal volatility. The first analysis was used to understand the impact of correlation within and across asset classes on VaR risk in the portfolio, and to position the MARF’s risk – returns profile among oth-er investment vehicles available to long-term investors. The second op-tion was chosen to understand what the allocation needs to be to effect maximum returns at reasonable risk.
The risk-return profile of the Finnish Smart Mobility MARF compares to high yield fixed income investments
For our initial analysis we assumed that the weights of each underly-ing asset (company or bond) within the private equity (10%), SME debt (35%), public equities (15%) and climate bond (40%) classes were even-ly distributed based on the total weight of the class within the fund. In reality, the weights of each asset should be optimized to achieve a cho-sen expected return with minimum historical volatility, also known as an efficient risk-return profile54. But, the simplifying assumption of equal weights was made because development of the risk rating frame-work is independent of this portfolio optimization activity.
Covariance and Correlation. Within the Monte Carlo analysis, the co-variance between asset returns is used to calculate expected returns for the portfolio55. As is convention, it was calculated as:
29
Two types of analyses will be presented: (1) an asset allocation based on maximum benefits to the economy (45% allocated to debt and equity); and (2) an optimized portfolio allocation informed by maximum returns-minimal volatility. The first analysis was used to understand the impact of correlation within and across asset classes on VaR risk in the portfolio, and to position the MARF’s risk – returns profile among other investment vehicles available to long term investors. The second option was chosen to understand what the allocation needs to be to effect maximum returns at reasonable risk.
The risk-return profile of the Finnish smart mobility MARF compares to high yield fixed income investments
For our initial analysis we assumed that the weights of each underlying asset (company or bond) within the private equity (10%), SME debt (35%), public equities (15%) and climate bond (40%) classes was evenly distributed based on the total weight of the class within the fund. In reality, the weights of each asset should be optimized to achieve a chosen expected return with minimum historical volatility, also known as an efficient risk-return profile (54). But, the simplifying assumption of equal weights was made because development of the risk rating framework is independent of this portfolio optimization activity.
Covariance and Correlation. Within the Monte Carlo analysis, the covariance between asset returns is used to calculate expected returns for the portfolio (55). As is convention, it was calculated as:
���(�� �) = 1��(�� � ��)(�� � ��)
�
���
where: X = n-dimensional vector of discrete observations; Y = n-dimensional vector of discrete observations; n = the number of observations in X and Y; i = positional locator within X and Y; xi = i-th observation within X; x = mean value of X; yi = i-th observation within Y; y = mean value of Y
Carrying this out across the m assets in the MARF results in an m-by-m matrix of the covariance between the assets. This matrix can be readily used to generate correlated random samples representing expected returns for the portfolio. But, in addition to looking at the historical covariance between assets we wanted to stress test the model against unfavorable market conditions. In the case of the 2007-2008 financial crisis, the correlation between assets went to unity (1) causing losses that were substantially higher than expected (56). In order to explore this situation, a “Worst-case” covariance matrix was calculated as:
���(�� �) = ����(�� �)���� where: corr(X,Y) = correlation between X and Y, assumed to equal 1 in worst-case
x = standard deviation of X y = standard deviation of Y

233 R
isk: Return A
ssessment
where: X = n-dimensional vector of discrete observations; Y = n-di-mensional vector of discrete observations; n = the number of observa-tions in X and Y; i = positional locator within X and Y; xi = i-th obser-vation within X; µx = mean value of X; yi = i-th observation within Y; µy = mean value of Y.
Carrying this out across the m assets in the MARF results in an m-by-m matrix of the covariance between the assets. This matrix can be readily used to generate correlated random samples representing ex-pected returns for the portfolio. But, in addition to looking at the his-torical covariance between assets we wanted to stress test the model against unfavorable market conditions. In the case of the 2007–2008 financial crisis, the correlation between assets went to unity (1) caus-ing losses that were substantially higher than expected56. In order to ex-plore this situation, a “Worst-case” covariance matrix was calculated as:
where: corr(X,Y) = correlation between X and Y, assumed to equal 1 in worst-case
σx = standard deviation of Xσy = standard deviation of Y
The returns of an example asset from each class and the p-value from a Shapiro-Wilk normality test on the returns are shown in Figure 7.24.
29
Two types of analyses will be presented: (1) an asset allocation based on maximum benefits to the economy (45% allocated to debt and equity); and (2) an optimized portfolio allocation informed by maximum returns-minimal volatility. The first analysis was used to understand the impact of correlation within and across asset classes on VaR risk in the portfolio, and to position the MARF’s risk – returns profile among other investment vehicles available to long term investors. The second option was chosen to understand what the allocation needs to be to effect maximum returns at reasonable risk.
The risk-return profile of the Finnish smart mobility MARF compares to high yield fixed income investments
For our initial analysis we assumed that the weights of each underlying asset (company or bond) within the private equity (10%), SME debt (35%), public equities (15%) and climate bond (40%) classes was evenly distributed based on the total weight of the class within the fund. In reality, the weights of each asset should be optimized to achieve a chosen expected return with minimum historical volatility, also known as an efficient risk-return profile (54). But, the simplifying assumption of equal weights was made because development of the risk rating framework is independent of this portfolio optimization activity.
Covariance and Correlation. Within the Monte Carlo analysis, the covariance between asset returns is used to calculate expected returns for the portfolio (55). As is convention, it was calculated as:
���(�� �) = 1��(�� � ��)(�� � ��)
�
���
where: X = n-dimensional vector of discrete observations; Y = n-dimensional vector of discrete observations; n = the number of observations in X and Y; i = positional locator within X and Y; xi = i-th observation within X; x = mean value of X; yi = i-th observation within Y; y = mean value of Y
Carrying this out across the m assets in the MARF results in an m-by-m matrix of the covariance between the assets. This matrix can be readily used to generate correlated random samples representing expected returns for the portfolio. But, in addition to looking at the historical covariance between assets we wanted to stress test the model against unfavorable market conditions. In the case of the 2007-2008 financial crisis, the correlation between assets went to unity (1) causing losses that were substantially higher than expected (56). In order to explore this situation, a “Worst-case” covariance matrix was calculated as:
���(�� �) = ����(�� �)���� where: corr(X,Y) = correlation between X and Y, assumed to equal 1 in worst-case
x = standard deviation of X y = standard deviation of Y
24
Figure 7.24Returns distributions from private equity, SME debt, public equities, and climate bonds (Clockwise from top left)
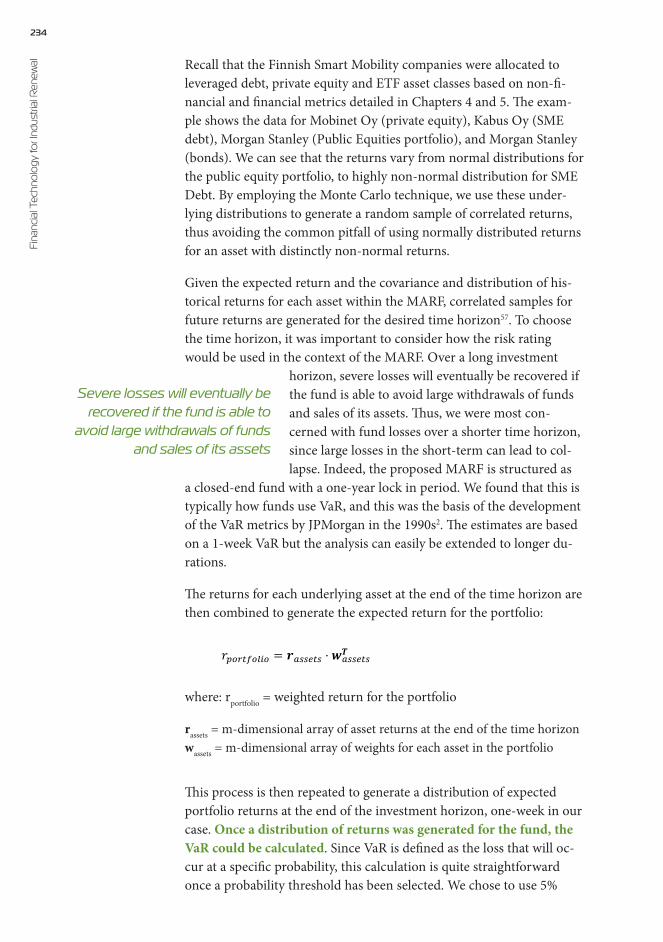
234Fi
nanc
ial T
echn
olo
gy fo
r Ind
ustri
al R
enew
al Recall that the Finnish Smart Mobility companies were allocated to leveraged debt, private equity and ETF asset classes based on non-fi-nancial and financial metrics detailed in Chapters 4 and 5. The exam-ple shows the data for Mobinet Oy (private equity), Kabus Oy (SME debt), Morgan Stanley (Public Equities portfolio), and Morgan Stanley (bonds). We can see that the returns vary from normal distributions for the public equity portfolio, to highly non-normal distribution for SME Debt. By employing the Monte Carlo technique, we use these under-lying distributions to generate a random sample of correlated returns, thus avoiding the common pitfall of using normally distributed returns for an asset with distinctly non-normal returns.
Given the expected return and the covariance and distribution of his-torical returns for each asset within the MARF, correlated samples for future returns are generated for the desired time horizon57. To choose the time horizon, it was important to consider how the risk rating would be used in the context of the MARF. Over a long investment
horizon, severe losses will eventually be recovered if the fund is able to avoid large withdrawals of funds and sales of its assets. Thus, we were most con-cerned with fund losses over a shorter time horizon, since large losses in the short-term can lead to col-lapse. Indeed, the proposed MARF is structured as
a closed-end fund with a one-year lock in period. We found that this is typically how funds use VaR, and this was the basis of the development of the VaR metrics by JPMorgan in the 1990s2. The estimates are based on a 1-week VaR but the analysis can easily be extended to longer du-rations.
The returns for each underlying asset at the end of the time horizon are then combined to generate the expected return for the portfolio:
where: rportfolio = weighted return for the portfolio
rassets = m-dimensional array of asset returns at the end of the time horizonwassets = m-dimensional array of weights for each asset in the portfolio
This process is then repeated to generate a distribution of expected portfolio returns at the end of the investment horizon, one-week in our case. Once a distribution of returns was generated for the fund, the VaR could be calculated. Since VaR is defined as the loss that will oc-cur at a specific probability, this calculation is quite straightforward once a probability threshold has been selected. We chose to use 5%
Severe losses will eventually be recovered if the fund is able to
avoid large withdrawals of funds and sales of its assets
30
The returns of an example asset from each class and the p-value from a Shapiro-Wilk normality test on the returns are shown in Figure 7.20. Recall that the Finnish smart mobility companies were allocated to leveraged debt, private equity and ETF asset classes based on non-financial and financial metrics detailed in Chapters 4 and 5. The example shows the data for Mobinet Oy (private equity), Kabus Oy (SME debt), Morgan Stanley (Public Equities portfolio), and Morgan Stanley (bonds). We can see that the returns vary from normal distributions for the public equity portfolio, to highly non-normal distribution for SME Debt. By employing the Monte Carlo technique, we use these underlying distributions to generate a random sample of correlated returns, thus avoiding the common pitfall of using normally distributed returns for an asset with distinctly non-normal returns.
Figure 7.20: Returns distributions from private equity, SME debt, public equities, and climate bonds (Clockwise from top left)
Given the expected return and the covariance and distribution of historical returns for each asset within the MARF, correlated samples for future returns are generated for the desired time horizon (57). To choose the time horizon, it was important to consider how the risk rating would be used in the context of the MARF. Over a long investment horizon, severe losses will eventually be recovered if the fund is able to avoid large withdrawals of funds and sales of its assets. Thus, we were most concerned with fund losses over a shorter time horizon, since large losses in the short-term can lead to collapse. Indeed, the proposed MARF is structured as a closed-end fund with a one-year lock in period. We found that this is typically how funds use VaR, and this was the basis of the development of the VaR metrics by JPMorgan in the 1990s (2). The estimates are based on a 1-week VaR but the analysis can easily be extended to longer durations.
The returns for each underlying asset at the end of the time horizon are then combined to generate the expected return for the portfolio:
where: rportfolio = weighted return for the portfolio
rassets = m-dimensional array of asset returns at the end of the time horizon wassets = m-dimensional array of weights for each asset in the portfolio
Comment [ata14]: NOSTO

235 R
isk: Return A
ssessment
based on convention but this can easily be tailored to the specific de-sires of an investor3. Figure 7.25 shows the 5% probability VaR calculat-ed using the methodology described above for both the expected (actu-al correlation between assets and across asset classes based on available financial data) and worst case (all assets are assumed to be correlated) scenarios, resulting in -1.6% and -3.3% of returns, respectively.
25
Figure 7.25Expected and worst-case 5% probability Value at Risk for the Smart Mobility MARF
These figures by themselves are not that informative, so we decided to contextualize them. Figure 7.26 puts them in the context of other invest-ment options available to institutional investors, using 2016 Bloomberg data. We see that the risk-return combination of the MARF is positioned between investment grade and high yield fixed income investments.
MARF investment funds demonstrate high diversification benefit across asset classes and perform well in asset correlation stress tests
Given the volume of risky assets within the MARF, the private and public equity assets within the MARF would be expected to have a VaR of -7.7% and -5.8%, respectively, based on single asset class investments shown in Figure 7.26. If that is the case, why did the outcome of the VaR simulation for the entire MARF result in a range of -1.1% (expect-ed) and -3.3% (worst case correlation), well below that of the individual asset classes.
To explore the key risk driver behind this result, we quantified the cor-relation between the assets that comprise the fund. Figure 7.27 shows that within a given asset class, there is limited diversification benefit, with most assets being positively correlated with one another (tenden-cy towards red-brown colors). This was particularly the case in private
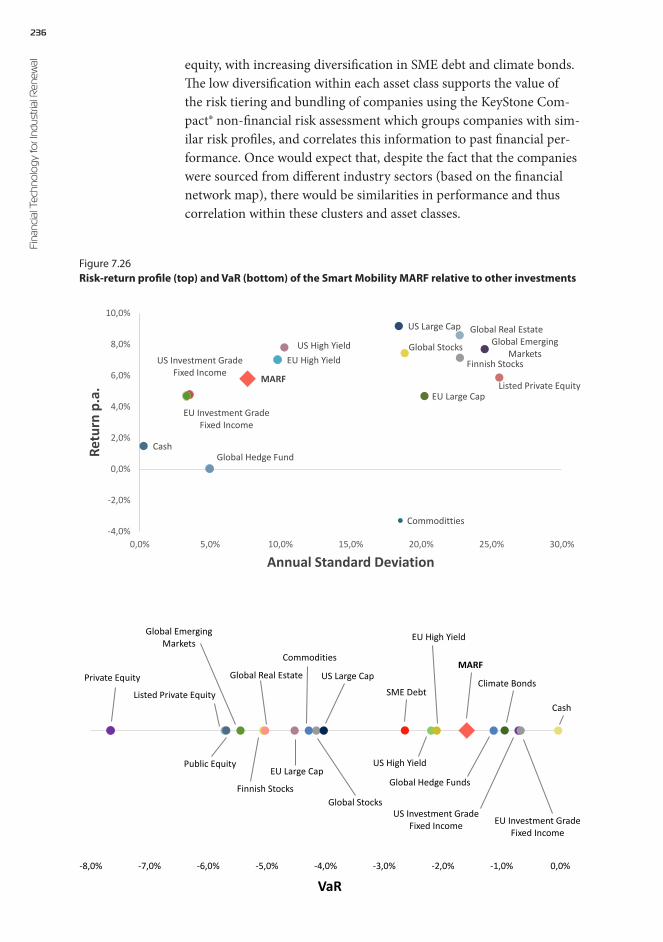
236Fi
nanc
ial T
echn
olo
gy fo
r Ind
ustri
al R
enew
al equity, with increasing diversification in SME debt and climate bonds. The low diversification within each asset class supports the value of the risk tiering and bundling of companies using the KeyStone Com-pact® non-financial risk assessment which groups companies with sim-ilar risk profiles, and correlates this information to past financial per-formance. Once would expect that, despite the fact that the companies were sourced from different industry sectors (based on the financial network map), there would be similarities in performance and thus correlation within these clusters and asset classes.
Figure 7.26Risk-return profile (top) and VaR (bottom) of the Smart Mobility MARF relative to other investments
Cash
US Investment Grade Fixed Income
EU Investment Grade Fixed Income
US High YieldEU High Yield
Global Stocks
US Large Cap
EU Large Cap
Finnish Stocks
Global Emerging Markets
Commoditties
Global Real Estate
Global Hedge Fund
Listed Private EquityMARF
-4,0%
-2,0%
0,0%
2,0%
4,0%
6,0%
8,0%
10,0%
0,0% 5,0% 10,0% 15,0% 20,0% 25,0% 30,0%
Retu
rn p
.a.
Annual Standard Deviation
Cash
US Investment Grade Fixed Income EU Investment Grade
Fixed Income
US High Yield
EU High Yield
Global Stocks
US Large Cap
EU Large Cap
Finnish Stocks
Global Emerging Markets
Commodities
Global Real Estate
Global Hedge Funds
Listed Private Equity
MARF
Climate BondsSME Debt
Public Equity
Private Equity
-8,0% -7,0% -6,0% -5,0% -4,0% -3,0% -2,0% -1,0% 0,0%
VaR
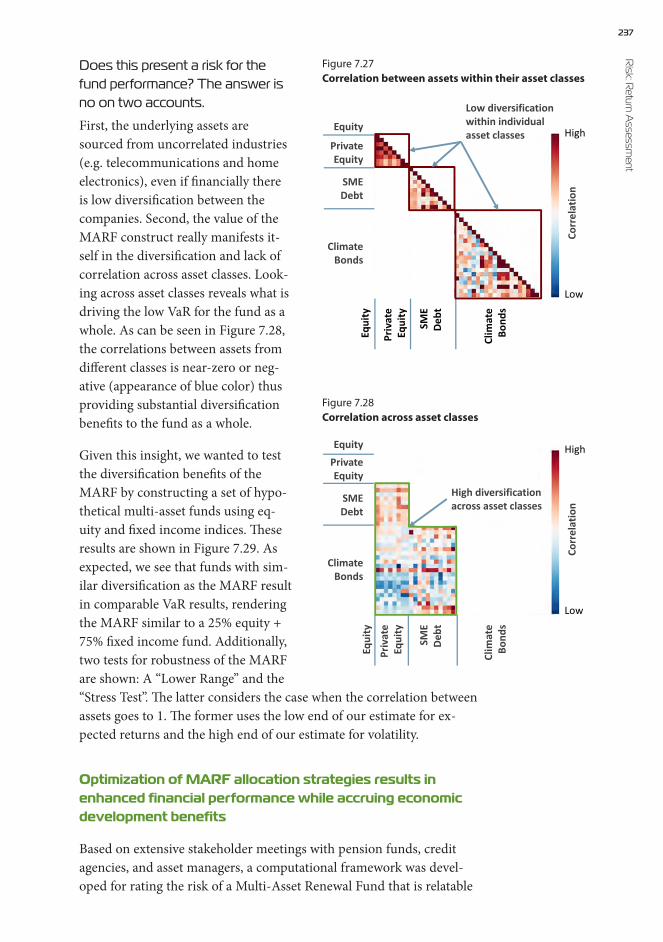
237 R
isk: Return A
ssessment
Equity
Private Equity
SME Debt
Climate Bonds
Equi
ty
Priv
ate
Equi
ty
SME
Debt
Clim
ate
Bond
s
High
Low
Corr
elat
ion
Low diversification within individual asset classes
Does this present a risk for the fund performance? The answer is no on two accounts.
First, the underlying assets are sourced from uncorrelated industries (e.g. telecommunications and home electronics), even if financially there is low diversification between the companies. Second, the value of the MARF construct really manifests it-self in the diversification and lack of correlation across asset classes. Look-ing across asset classes reveals what is driving the low VaR for the fund as a whole. As can be seen in Figure 7.28, the correlations between assets from different classes is near-zero or neg-ative (appearance of blue color) thus providing substantial diversification benefits to the fund as a whole.
Given this insight, we wanted to test the diversification benefits of the MARF by constructing a set of hypo-thetical multi-asset funds using eq-uity and fixed income indices. These results are shown in Figure 7.29. As expected, we see that funds with sim-ilar diversification as the MARF result in comparable VaR results, rendering the MARF similar to a 25% equity + 75% fixed income fund. Additionally, two tests for robustness of the MARF are shown: A “Lower Range” and the “Stress Test”. The latter considers the case when the correlation between assets goes to 1. The former uses the low end of our estimate for ex-pected returns and the high end of our estimate for volatility.
Optimization of MARF allocation strategies results in enhanced financial performance while accruing economic development benefits
Based on extensive stakeholder meetings with pension funds, credit agencies, and asset managers, a computational framework was devel-oped for rating the risk of a Multi-Asset Renewal Fund that is relatable
Figure 7.27Correlation between assets within their asset classes
28
EquityPrivate Equity
SME Debt
Climate Bonds
Equi
tyPr
ivat
e Eq
uity
SME
Debt
Clim
ate
Bond
s
High
Low
Corr
elat
ion
High diversification across asset classes
Figure 7.28Correlation across asset classes
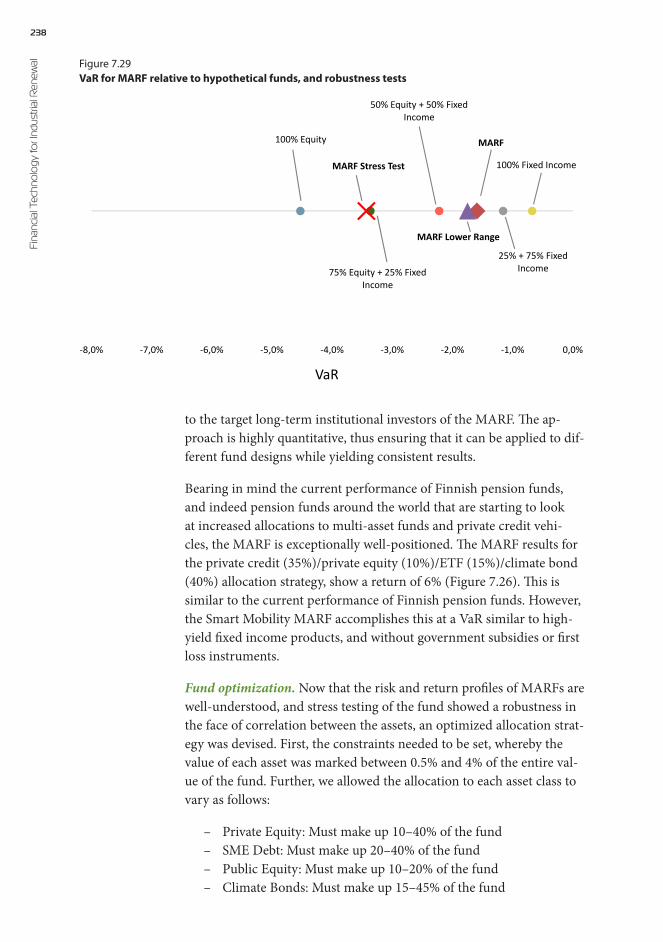
238Fi
nanc
ial T
echn
olo
gy fo
r Ind
ustri
al R
enew
al
29
MARF
100% Fixed Income
25% + 75% Fixed Income
50% Equity + 50% Fixed Income
75% Equity + 25% Fixed Income
100% Equity
MARF Stress Test
MARF Lower Range
-8,0% -7,0% -6,0% -5,0% -4,0% -3,0% -2,0% -1,0% 0,0%
VaR
to the target long-term institutional investors of the MARF. The ap-proach is highly quantitative, thus ensuring that it can be applied to dif-ferent fund designs while yielding consistent results.
Bearing in mind the current performance of Finnish pension funds, and indeed pension funds around the world that are starting to look at increased allocations to multi-asset funds and private credit vehi-cles, the MARF is exceptionally well-positioned. The MARF results for the private credit (35%)/private equity (10%)/ETF (15%)/climate bond (40%) allocation strategy, show a return of 6% (Figure 7.26). This is similar to the current performance of Finnish pension funds. However, the Smart Mobility MARF accomplishes this at a VaR similar to high-yield fixed income products, and without government subsidies or first loss instruments.
Fund optimization. Now that the risk and return profiles of MARFs are well-understood, and stress testing of the fund showed a robustness in the face of correlation between the assets, an optimized allocation strat-egy was devised. First, the constraints needed to be set, whereby the value of each asset was marked between 0.5% and 4% of the entire val-ue of the fund. Further, we allowed the allocation to each asset class to vary as follows:
– Private Equity: Must make up 10–40% of the fund– SME Debt: Must make up 20–40% of the fund– Public Equity: Must make up 10–20% of the fund– Climate Bonds: Must make up 15–45% of the fund
Figure 7.29VaR for MARF relative to hypothetical funds, and robustness tests

239 R
isk: Return A
ssessment
The annual returns used in the portfolio optimization were estimated using a Monte-Carlo simulation. Asset values were assumed to follow Brownian motion based on historical volatility and correlation with other assets. The simulation is run for a 52-week duration, with week-ly time steps, and 10 million trials per individu-al asset. The weights of each asset and asset class were then varied as indicated earlier to achieve an efficient return for the portfolio based on these expected annual returns.
The results from the MARF optimization (Figure 7.30) indicate that a minimum volatility port-folio is dominated by climate bonds (45%) and SME debt (33%), and is expected to generate a target return of 7.7%. A maximum Sharpe ra-tio portfolio is dominated by bonds (45%), SME debt (26%), and public equities (19%), and was calculated to generate a return of 10.5%. These returns are gross, and expense ratios of up to 1.5% AUM need to be taken into account. It should be noted that these returns did not take into account government subsidies or first loss mechanisms on the SME debt, as detailed in Chapter 6.
Government first loss guarantee. The impact of the government de-risking strategies on debt was not separately investigated in this work, but is expected to have a dual effect on the performance of the fund. Guarantees would be treated as a ‘cash asset’ for the fund, as it de-risks debt defaults. By reducing volatility risk – even if only to part of the fund – the likely impact will be a decrease in returns as well. However, this mitigating effect will allow for an increase of capital al-
Minimum Volatility Portfolio
Maximum Sharpe Ratio Portfolio
Figure 7.30Portfolio weight contributions in each asset class to generate expected returns from the Smart Mobility MARF
Box 7.5 Sharpe Ratio
A risk-adjusted measure of return used to evaluate the performance of a port-folio. It represents the average return earned in excess of the risk-free rate per unit of volatility or total risk. The higher the value, the better the performance. The ratio tends to work best for fully liquid assets.
240Fi
nanc
ial T
echn
olo
gy fo
r Ind
ustri
al R
enew
al locations to the private credit asset class, and potentially to private eq-uity as well. The increased allocation to these asset classes will increase the VaR, as was shown in Figure 7.30, but this risk will be mitigated by
first loss mechanisms. Hence, the return estimates could well increase to 14% across the MARF port-folio, while over 70% of capital is allocated to long-term investments, as will be expected for an ELTIF investment vehicle.
The risk and return profile fits the investment man-date and fiduciary requirements for long-term in-vestors, and the process is structured and semi-au-tomated to help build the trust and familiarity of financial managers with this fund. Whether the trustees of pension funds, and managers of sover-eign wealth funds, will consider including MARFs
in their investment portfolios depends on the engagement of policy makers in the replumbing of the financial markets, and of experienced fund managers across the asset classes comprising the fund.
Box 7.6 A MARF for long-term investors?
This performance assessment demonstrated that the MARF design – and the financial technology that enables this type of fund – will meet its goal of a green long-term invest-ment vehicle for pension funds and other institutional asset managers, by merging financial returns with investments in the real economy.
241 R
isk: Return A
ssessment
References1 Lustig, Y. (2013). Multi-Asset Investing: A Practical Guide to Modern Portfolio
Management 1st ed., Harriman House.2 Crouhy, M., Galai, D. & Mark, R. (2000). A comparative analysis of current credit risk
models. Journal of Banking & Finance, 24(1), pp. 59–117.3 Jorion, P. (2006). Value at Risk: The New Benchmark for Managing Financial Risk 3rd
ed., McGraw-Hill Education.4 Ang, A. & Sorensen, M. (2012). Risks, returns, and optimal holdings of private equity:
A survey of existing approaches. The Quarterly Journal of Finance, 2(03), p.1250011.5 Heed, A. (2010). Regulation of private equity. Journal of Banking Regulation,12(1), pp.
24–47.6 Chertok, S. & Braendel, A. D. (2010). Closed-end private equity funds: A detailed
overview of fund business terms, part I. The Journal of Private Equity, pp. 33–54.7 Fang, L., Ivashina, V. & Lerner, J. (2015). The disintermediation of financial markets:
Direct investing in private equity. Journal of Financial Economics,116(1), pp. 160–178.8 European Venture Capital Association (2013). Risk Measurement Guidelines.
Available at http://www.investeurope.eu/media/10083/evca-Risk-Measurement-Guidelines-January-2013.pdf. Accessed 03152016.
9 Anson, M. (2013). Performance measurement in private equity: Another look at the lagged beta effect. The Journal of Private Equity, 17(1), p. 29.
10 Emery, K. M. (2003). Private equity risk and reward: Assessing the stale pricing problem. The Journal of Private Equity, 6(2), pp. 43–50.
11 Anson, M. (2002). Managed Pricing and the Rule of Conservatism in Private Equity Portfolios. The Journal of Private Equity, Vol. 5, No. 2: pp. 18–30.
12 Anson, M. (2007). Performance Measurement in Private Equity: Another Look. The Journal of Private Equity 10 (3): 7–21.
13 Scarpati, F. & Ng, W. (2013). What Really Drives Risk Premium and Abnormal Returns in Private Equity Funds? A New Perspective. The Journal of Private Equity, Fall 2013. Available at Available at SSRN: http://ssrn.com/abstract=2310096
14 Korteweg, A. & Sorensen, M. (2010). Risk and return characteristics of venture capital-backed entrepreneurial companies. Review of Financial Studies, 23(10), pp. 3738–3772.
15 Ljungqvist, A. & Richardson, M. (2003). The cash flow, return and risk characteristics of private equity (No. w9454). National Bureau of Economic Research.
16 Rosenberg, B. & Guy, J. (1995). Prediction of beta from investment fundamentals. Financial Analysts Journal, 51(1), pp. 101–112.
17 Damodaran, A. (2012). Investment valuation: tools and techniques for determining the value of any asset. Hoboken, N.J., Wiley.
242Fi
nanc
ial T
echn
olo
gy fo
r Ind
ustri
al R
enew
al 18 Damodaran, A. (2008). What is the risk free rate? A Search for the Basic Building Block. A Search for the Basic Building Block (December 14, 2008).
19 Damodaran, A. (2015). Equity Risk Premiums (ERP): Determinants, Estimation and Implications – The 2015 Edition. Available at SSRN: http://ssrn.com/abstract=2581517
20 Damodaran, A. (2005). Marketability and value: Measuring the illiquidity discount. Available at SSRN 841484.
21 PWC (2015). Equity Market Risk Premium (EMRP) on the Finnish stock market.22 Longstaff, F. A. (1995). How much can marketability affect security values? The
Journal of Finance, 50(5), pp. 1767–1774.23 Wehinger, G. (2012). Bank deleveraging, the move from bank to market-based
financing, and SME financing. OECD Journal: Financial Market Trends, 2012(1), pp. 65–67.
24 Basel Committee on Banking Supervision (2014). Basel III Leverage Ratio Framework and Disclosure Requirements. 2014. Available at http://www.bis.org/publ/bcbs270.pdf
25 European Central Bank (2015). Survey on the Access to Finance of Enterprises in the Euro Area.
26 Standard & Poor’s Ratings Services (2014). Mid-Market Funding in Europe is Making Strides, But Has Far To Go. April 2014, Available at www.standardandpoors.com/ratingsdirect. Accessed 03122016.
27 Nassr, I. K. & Wehinger, G. (2014). Non-bank debt financing for SMEs. OECD Journal: Financial Market Trends, 2014(1), pp. 139–162.
28 Berger, A. N. & Udell, G. F. (1998). The economics of small business finance: The roles of private equity and debt markets in the financial growth cycle. Journal of Banking & Finance, 22(6), pp. 613–673.
29 Rajan, A. (2015). The Rise of Private Debt as an Institutional Asset Class. September 2015. Available at http://www.icgam.com/SiteCollectionDocuments/Rise of Private Debt as an institutional asset class Amin Rajan GENERIC.pdf. Accessed 03122016
30 Lehmann, B. (2003). Is it worth the while? The relevance of qualitative information in credit rating. The Relevance of Qualitative Information in Credit Rating (April 17, 2003). European Financial Management Association.
31 Beaver, W. H. (1966). Financial ratios as predictors of failure. Journal of accounting research, pp. 71–111.
32 Altman, E. I. (1968). Financial ratios, discriminant analysis and the prediction of corporate bankruptcy. The journal of finance, 23(4), pp. 589–609.
33 Altman, E. I., Haldeman, R. G. & Narayanan, P. (1977). Zeta tm analysis a new model to identify bankruptcy risk of corporations. Journal of banking & finance, 1(1), pp. 29–54.
34 Altman, E. I. & Sabato, G. (2007). Modeling Credit Risk for SMEs: Evidence from the US Market. ABACUS Vol. 43 (3), pp. 332–357.

243 R
isk: Return A
ssessment
35 Altman, E. I., Giannozzi, A., Roggi, O. & Sabato, G. (2013). Building SME rating: is it necessary for lenders to monitor financial statements of the borrowers? BANCARIA, 10, pp. 54–71.
36 Altman, E. I., Sabato, G. & Wilson, N. (2008). The Value of non-financial information in SME risk management. Available at SSRN 1320612.
37 Breiman, L. (2001). Random Forests. pp.1–33. Available at https://www.stat.berkeley.edu/~breiman/randomforest2001.pdf. Accessed 03152016.
38 Geurts, P., Ernst, D. & Wehenkel, L. (2006). Extremely randomized trees. Machine learning, 63(1), pp. 3–42.
39 Freund, Y. & Schapire, R. E. (1997). A Decision-Theoretic Generalization of On-Line Learning and an Application to Boosting. Journal of computer and system sciences 139, pp. 119–139.
40 Picard, R. R. & Cook, R. D. (1984). Cross-validation of regression models. Journal of the American Statistical Association, 79(387), pp. 575–583.
41 Freedman, D. (2005). Statistical Models: Theory and Practice. Cambridge University Press.
42 Fawcett, T. (2006). An introduction to ROC analysis. Pattern Recognition Letters, 27, pp. 861–874.
43 Kozhemiakin, A. (2007). The risk premium of corporate bonds. Journal of Portfolio Management, 33(2), p. 101.
44 Longstaff, F. A., Mithal, S. & Neis, E. (2005). Corporate Yield Spreads: Default Risk or Liquidity? New Evidence from the Credit Default Swap Market. The Journal of Finance 60 (5): pp. 2213–2253.
45 O’Sullivan, A. & Sheffrin, S. M. (2003). Economics: principles in action, Needham, MA: Prentice Hall.
46 European Investment Bank (2015). Climate Awareness Bonds. European Investment Banks. Available from: http://www.eib.org/investor_relations/index.htm. Accessed April 23, 2016.
47 Climate Bonds Initiative (2015). Bonds and Climate Change. The State of the Market in 2015. Climate Bonds Initiative. Available at https://www.climatebonds.net/resources/publications/bonds-climate-change-2015. Accessed April 14, 2016.
48 Climate Bonds Initiative (2016). Taxonomy. Climate Bonds Initiative. Available at https://www.climatebonds.net/standards/taxonomy. Accessed March 25, 2016.
49 Financial Times, Definition of Sukuk (Islamic Bonds). Financial Times. Available at http://lexicon.ft.com/term?term=sukuk-(islamic-bonds). Accessed April 25, 2016.
50 FINRA, Bond Yield and Return. FINRA.Org. Available at http://www.finra.org/investors/bond-yield-and-return. Accessed March 29, 2016.
51 Gastineau, G. L. (2010). The exchange-traded funds manual (Vol. 186). John Wiley & Sons.

244Fi
nanc
ial T
echn
olo
gy fo
r Ind
ustri
al R
enew
al 52 Ferri, R. A. (2011). The ETF book: all you need to know about exchange-traded funds. John Wiley & Sons.
53 Poterba, J. M. & Shoven, J. B. (2002). Exchange traded funds: A new investment option for taxable investors (No. w8781). National Bureau of Economic Research.
54 Shin, S. & Soydemir, G. (2010). Exchange-traded funds, persistence in tracking errors and information dissemination. Journal of Multinational Financial Management, 20(4), pp. 214–234.
55 Markowitz, H. (1952). Portfolio selection. The journal of finance, 7(1), pp. 77–91.
56 Maier, S. F., Peterson, D. W. & Vander Weide, J. H. (1977). A Monte Carlo investigation of characteristics of optimal geometric mean portfolios. Journal of Financial and Quantitative Analysis, 12(02), pp. 215–233.
57 Esposito, M. (2016). The dynamics of volatility and correlation during periods of crisis: Implications for active asset management. Journal of Asset Management, 17(3), 135–140.

Roadmap 8 ‘The Finnish Model’ – A Vaunted Investment Strategy for
Green Industrial Renewal
246Fi
nanc
ial T
echn
olo
gy fo
r Ind
ustri
al R
enew
al ‘The Finnish Model’ – A Vaunted Investment Strategy for Green Industrial Renewal
Multi-Asset Renewal Funds combine technology with blended finance
The execution of the vision for this project – to design efficient mar-ket-driven investment instruments that bridge the fiduciary responsi-bilities of long-term institutional investors with the demands of shifting industrial ecosystems – is a major challenge from a technical, legal, and (industrial) policy perspective. Remember that one of the objectives of the FiDiPro project was to understand how pension funds could be en-gaged in investing in the real economy in general, and a green econo-my in particular.
As a first step, we needed to understand the scope of the problem, hur-dles, perceptions, risk and return profiles of pension funds, and their ‘likelihood to experiment’ with new fund types. Our meetings with var-ious Finnish pension fund CIOs, Directors or Alternative investments, and asset managers in banks uncovered a number of guiding insights:
1 Finnish pension funds were at tipping points, where long-term liabilities were starting to outstrip growth of the fund, thus ne-cessitating search for new alpha or beta
2 Alternatives were the clear return drivers for the funds, but the question was open as to what type of asset funds could be allo-cated to.
3 Real estate and limited commitments to private credit were a po-tential option, but infrastructure was not viewed as being attrac-tive, in part because limited long-term ownership/revenue struc-ture options
4 Investment needed to be longer term and passive, and should not follow a ‘policy fad’ like Cleantech. If it is not market driven, the political risk for sustained alpha is too high.
“ A policy that doesn’t acknowledge reality has never succeeded in the history of the world.
– Sam Zell, Chairman, Equity Group Investments
247 R
oadm
ap
Many of the original concepts and key differentiators of the Multi-Asset Renewal Fund started with the building blocks
5 Most investment in publicly traded companies was directed at global, not domestic, equities
6 Government and corporate bonds in the current climate were not attractive because of the minimal interest spread, making in-vestments in the real economy (e.g. credit) potentially attractive, but not significant enough to make a difference.
Given these inputs, and to navigate the competing topic of designing of the project’s stakeholders – including financiers, risk managers, pol-icymakers, rating agencies, and asset managers – we started the fund structuring process with a Lego® Serious Play® ideation session. Ac-cording to the company’s website:
“The LEGO® SERIOUS PLAY® methodology is a radical, innovative, experiential process designed to enhance business performance. […] By using the LEGO® SE-RIOUS PLAY® materials and methodology you will explore the relationships and connections between people and their world, observe the dynamics both in-ternal and external, explore various hypothetical [business] scenarios, and gain awareness of [business opportunities].”
The Lego® tools and methodology – intended to help innovative teams in corporate boardrooms visualize abstract concepts in structured stra-tegic planning sessions – were adapted to engage a broad-based team in the highly technical discussions associated with economics and finance. Our ideation team consisted of equity and industry analysts, supply chain experts, micro-economists, management consul-tants, and academics with background in finance, strat-egy and entrepreneurship.
The team was challenged over a three-week period – using individual and team-based sessions – to address a robust set of questions on the topic of designing an investment in-strument that has the required (low) risk profile, sufficient liquidity, and scale for pension fund investment allocations, with impact on the real economy. Specifically, the participants were asked to explore the:
1 Differences in capital structure and business model elements of companies across the business cycle (startups, small and medi-um enterprises, publicly listed companies)
2 Fiduciary requirements, expected risk-return profiles, and roles of investment actors across the financing value chain (govern-ment, lenders, equity investors, pension funds)
3 Necessary information flow within the organizational manage-ment of a hypothetical multi-asset fund structure comprised of liquid and illiquid asset classes.
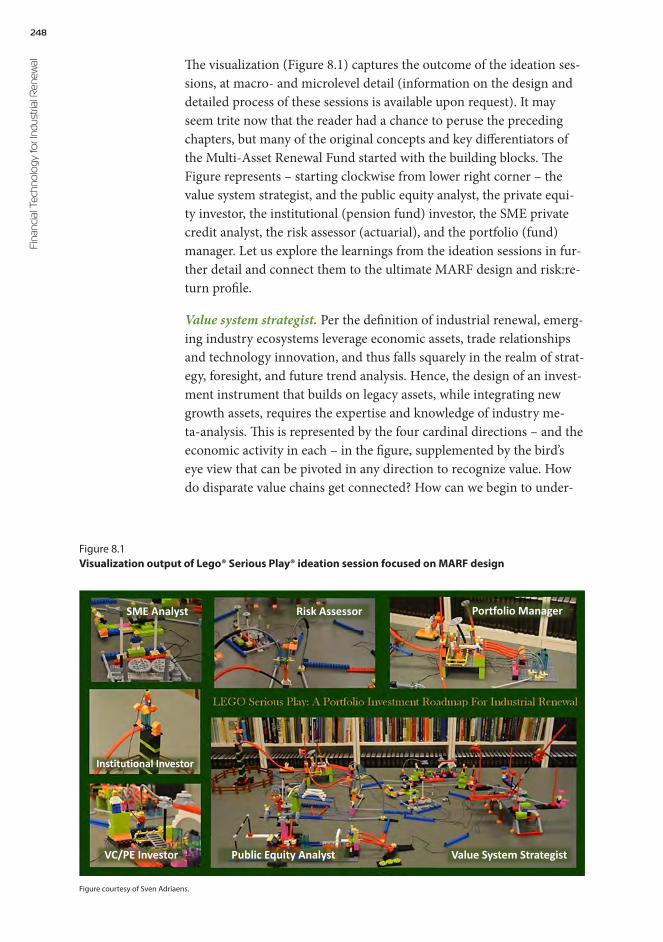
248Fi
nanc
ial T
echn
olo
gy fo
r Ind
ustri
al R
enew
al The visualization (Figure 8.1) captures the outcome of the ideation ses-sions, at macro- and microlevel detail (information on the design and detailed process of these sessions is available upon request). It may seem trite now that the reader had a chance to peruse the preceding chapters, but many of the original concepts and key differentiators of the Multi-Asset Renewal Fund started with the building blocks. The Figure represents – starting clockwise from lower right corner – the value system strategist, and the public equity analyst, the private equi-ty investor, the institutional (pension fund) investor, the SME private credit analyst, the risk assessor (actuarial), and the portfolio (fund) manager. Let us explore the learnings from the ideation sessions in fur-ther detail and connect them to the ultimate MARF design and risk:re-turn profile.
Value system strategist. Per the definition of industrial renewal, emerg-ing industry ecosystems leverage economic assets, trade relationships and technology innovation, and thus falls squarely in the realm of strat-egy, foresight, and future trend analysis. Hence, the design of an invest-ment instrument that builds on legacy assets, while integrating new growth assets, requires the expertise and knowledge of industry me-ta-analysis. This is represented by the four cardinal directions – and the economic activity in each – in the figure, supplemented by the bird’s eye view that can be pivoted in any direction to recognize value. How do disparate value chains get connected? How can we begin to under-
Portfolio Manager
Value System StrategistPublic Equity Analyst
Risk AssessorSME Analyst
Institutional Investor
VC/PE Investor
Figure courtesy of Sven Adriaens.
Figure 8.1Visualization output of Lego® Serious Play® ideation session focused on MARF design
249 R
oadm
ap
stand whether incipient trends in disconnected industries will become value- (and jobs) generating components of an economy? The enlight-ened reader will recognize that this insight led to the development and implementation of financial network mapping, and the application of network theory to recognize anchor and catalyst industries, as de-scribed in Chapter 3.
Public equity analyst. Publicly-traded companies are the core of most economies. Due to their size and diverse lines of business, they are the job creators, major contributors to economic development, and the sup-pliers or customers of complex supply chains. These supply chains in-clude most private companies, including innovative growth companies and startups who unbundle their offerings and contribute to their effi-ciency in the market place. The figure recognizes that public companies are often protected or favored by policies, receiving subsidies and tax breaks, and – in Europe and Asia – government control of their share structure (represented by the cam wheels impacting management and operations). They are often national champions. We recognize that they are key players in the meta-industry system, because they source inno-vations from across the universe of industry codes, particularly those heavily dominated by information technology. This insight led to the development and refinement of a KeyStone Compact® Enterprise® ver-sion of the algorithmic business assessment tool described in Chapter 4.
VC/PE investor. Private equity companies and their portfolio compa-nies play a key role in the diversification of investment funds. In the ideation exercise, the emphasis was on the role of these companies as the high value-high growth companies that dot the landscape in many industry sectors, but nowhere more than in the technology sector. The reason is their scalability, capital efficiency, and important role as con-tributors to the ‘platformization’ of many industries. The periscope in the figure is indicative of the long-term disruptive view of these com-panies and their investors, while the ladder and the glass pillars denote the high risk and uncertainty associated with these companies. Given these risks, the team understood that the fund could not be designed to hold the lead investor position in these companies, but would serve as a co-investor in venture and private equity funds. These high risk ven-tures would be outside the perimeter of the fund, but co-investments would serve to boost returns at a safe distance, as per the MARF struc-ture laid out in Chapter 6.
Institutional investor. Intended to represent the pension fund investor, the ‘layer cake’ tower represents the multitude of different asset classes in the portfolio of the fund. Described in Chapter 6 as fiduciary man-agement, the CIO or head of alternative assets (though we were not yet aware that a MARF would be classified as an alternative investment)
250Fi
nanc
ial T
echn
olo
gy fo
r Ind
ustri
al R
enew
al is connected to the various buy-side asset managers that need to ad-here to – and perform in accordance with – risk and return specifica-tions set by the actuaries and the trust. The pension fund was viewed as a rather passive manager, focused on long-term holdings and growth strategies, as signified by the hose taking in the returns. Hence, the ide-ation team – in structuring the fund – emphasized the need for diver-sification, but also long-term capital commitments, leaving investment decisions to asset managers (Chapter 6).
SME private credit analyst. The team had a solid understanding of the role of SMEs as an innovator in traditional and emerging value chains. The limited leveraging opportunities of SMEs vis à vis the corporate (public) customers, means that they often have to innovate against tight deadlines and marginal cost. Whereas this places SMEs sometimes at a disadvantage in established supply chains – where cost-optimization has been maximized – they have an advantage when new supply chains emerge, with a first-to-market solution. Hence, SMEs are very diverse, ranging from traditional cash-flow driven businesses, to those with the potential for high growth and value capture. Whereas the cam wheels represent the grind of day-to-day business driven by working capital loans, the see-saw in the background symbolizes SMEs in a negotiating position with partners as they attempt to reposition themselves, both reflecting the spectrum of businesses. These insights helped us design the KeyStone Compact® SME® tool, to differentiate between companies with variable market paths. Moreover, following this discussion and re-cent reports on alternative investment models for SMEs, we were fully committed to start exploring how government guarantees could be de-ployed to jump start the private credit investment option.
Risk assessor. Risk assessment and risk mitigation are integral to any investment vehicle, and are more complex as the complexity of the in-strument increases. The team wrestled with the challenge of integrat-ing liquid and illiquid asset classes, comprised of underlying assets that have highly variable business models, outlook, and financial perfor-mance. Whereas plenty of tools are available for publicly traded secu-rities (stocks, bonds, listed infrastructure), the arsenal of risk frame-works for private companies are limited, and are often constrained to credit risk reports or public proxy analysis. Even if the risk assessment strategies exist for separate asset classes, there are no established meth-odologies to integrate the risks of liquid and illiquid assets. These in-sights led us to the emphasis on uncovering trends and insights from KeyStone risk profiles – reflecting non-financial risk – and integrate these with financial risk metrics, as reflected in the ‘spider structure’ in the figure, connected to all asset classes. Moreover, the bespoke analysis of risk required for a Multi-Asset Renewal Fund motivated us to com-

251 R
oadm
ap
mission a team of finance students from the Ross School of Business with a strong background in data mining and uncertainty analysis to develop a risk assessment and allocation optimization tool (Chapter 7).
Portfolio manager. Considering the complexity of the fund, and the mix of different asset classes, we had been asked by members of our steering committee what the governance structure of this type of fund would (need to) be. The response to this question evolved during the three weeks of the ideation session, as it became clear to us that the risk profiles and the data availability (daily to monthly) of the under-lying assets necessitated different management approaches for each asset class. In fact, we con-ceptualized that the private credit asset class it-self was very diverse, given the potential for high growth potential companies, among the solid but staid cash-flow gen-erators. Thus, it dawned on us that the management of a fund like this would require separate managers for each asset class, as well as a port-folio manager overseeing all asset classes, and engaging with the pen-sion fund investors. The diversity of likely skill sets required to make this fund run and perform as intended was daunting, as reflected by the three types of feeds (asset classes), and need to ’fence off ’ and sepa-rate each asset class manager to avoid conflicts.
Following the ideation session, a draft document was developed and circulated widely, and further refined in consultation with experts at global investment banks and with Finnish stakeholders. The due dili-gence work of the preliminary fund structure with practitioners in the field was extremely helpful, and helped us gain an understanding of the limitations and constraints that would be required to implement this investment structure. A sampling of responses and engagement is articulated below.
Governance structure. A face to face meeting with asset managers from Deutsche Bank (London) resulted in a complete deconstruction of the fund, and implementation of conditions for its management and offering. For example, it was made clear that the mix of assets rendered the fund very unwieldy, unless it would be structured as a closed-end fund with minimum lock in requirements, and separate asset managers for each asset class. We were forewarned that a MARF structure would need to keep significant cash on hand given the probability of default on debt, and capacity to respond to capital calls from the private equi-ty funds where the MARF is a co-investor. The first loss guarantee was viewed as a positive element, as was the de-risking of the fund using climate bonds and ETFs, given their high liquidity.
A fund like this would require sepa-rate managers for each asset class
252Fi
nanc
ial T
echn
olo
gy fo
r Ind
ustri
al R
enew
al SME capital structure risks and equity opportunities. A meeting at HSBC (London) revealed the breadth and diversity of loan types and risks in a bank’s portfolio, yet indicated that banks are interested in un-covering potential high growth (‘antelopes’) equity-investable compa-nies among their leveraged credit loans. The challenge is to tease out these SME transitioning opportunities and understand their non-finan-cial as well as financial risks.
MARF structure may fit European Long Term Investment Fund (LTIF). A seminar at the headquarters of KBC Wealth Management (Brussels) with legal experts and fund administrators revealed that the MARF may fit the criteria of the LTIF, which was approved by the Euro-pean Commission in April 2015, or an insurance fund. The key is long-term holding and high proportion of illiquid assets invested in the real economy (projects, infrastructure, SME credit). A strong argument was made for registration in Luxemburg, given its appetite for alternatives.
MARF industry ecosystem investing is attractive to economic devel-opers. The structure and investment thesis of the fund was presented at three investor meetings (Singapore; Taipei, Taiwan; Lausanne, Swit-zerland) led by the Global CleanTech Cluster Association, a Swiss-reg-istered Foundation with the mandate to build out green value systems globally. With members in 27 countries and 54 economic development clusters, representing nearly 10,000 companies, the GCCA has its finger on the pulse across the globe. Feedback from economic development groups, many of whom have been focused on industry cluster build-ing in their local areas of strength, indicated the need to bridge the lan-guage gap towards pension and insurance funds. The net result is that we are building MARFs – designed in Finland – in Switzerland and Taiwan, with strong support at Ministerial level.
Deployment size for pension funds is € 250–500M. Fund discussions with Deutsche Bank and the P80 Foundation (representing the world’s 80 largest pension funds) revealed a minimum size required for capital allocations in the MARF for it to return the intended profit. This size is in part dictated by the minimum capital allocations made by large cross-border funds, and in part by the management costs and expense ratios of a complex fund like this. We were recommended to make all efforts to minimize back office costs, for example by using digital fund management platforms (e.g. CrowdValley).
Industrial investment policies that integrate Multi-Asset Renewal Funds help public funds efficiently unlock private capital for economic development
Industrial renewal has been on the European and North American pol-icy agendas for years as competition from the emerging economies and
253 R
oadm
ap
rapid technological change have rendered the competitive edge of ma-ny established companies and clusters obsolete. To add to the pressure, the need to find environmentally and socially sustainable approaches to production and consumption has garnered global, consensual recogni-tion, increasing the urgency for systemic renewal across the industrial landscape.
The financial crisis has further aggravated the sit-uation in several ways, particularly in Europe. The deep economic slump resulted in structural mass unemployment, leading to the degradation of skills in key segments of the labor force. Business investments plummeted and have remained at a low level, giv-en the weak demand prospects and troubles in financial intermedia-tion. In parallel, spending on corporate R&D has been reduced as well. All these factors have contributed to significant downward revisions of output potential estimates in Europe; and to make things worse, the ac-tual output remains well below these estimates.
Turning the ship has proven difficult; the tugs are running out of fu-el. Badly deteriorated public finances have reduced the scope of tradi-tional policy approaches in promoting investments and renewal. Pub-lic investments in infrastructure have been slashed and can hardly be increased significantly in the near future, as debt reduction will remain a key objective in most EU countries. Without saying, the same is true for direct subsidies and tax breaks for private investments.
In this context of both a heightened need for industrial renewal and a reduced scope for employing public funds for the purpose, it is an im-perative to find effective ways to leverage those public funds that are still available – as limited as they may be – to kick-start and reform the economy. A number of EU-level initiatives have already seen the light of day. Alongside the targeted long-term refinancing operations launched by the European Central Bank, the European Fund for Strategic Invest-ment by the new EU Commission (EFSI or the “Juncker plan”) is the most prominent manifestation of this policy momentum. The plan aims at inducing private investments worth € 315 bn. by using some € 21 bn. EU funding and guarantees in a three-year window.
Thanks to the exceptionally expansive monetary policies in Europe as well as in other parts of the developed world and the low current lev-el of investment, there are lots of idle financial resources waiting to be mobilized. This would suggest that well-designed policies could unlock substantial investments. Still, the EFSI initiative plan has been heavily criticized on two counts: first, for an unrealistic leverage ratio (1:15) of public and private investment injections, and second for the potentially very inefficient selection of projects to be financed.
Turning the ship has proven difficult; the tugs are running out of fuel

254Fi
nanc
ial T
echn
olo
gy fo
r Ind
ustri
al R
enew
al To address these problems, one should be able to design a scheme where (1) the limited public funds help in an efficient way to unlock investment opportunities with optimal risk-return profiles for diverse private investors to drive industrial renewal, and (2) the projects and the companies to be financed are selected in an efficient way given the always imperfect information about the prospects of individual projects and the combined effects of many adjacent activities in terms of growth and job creation.
The task is one of clever financial engineering.
We believe that the Multi-Asset Renewal Fund investment approach of-fers insights that could be helpful in designing the looked-for invest-ment scheme in the European context. Rather than starting from a long list of separate candidate investment projects, it first seeks to identi-fy investable new industrial value systems and then, given these val-ue systems, sets out to design – with a limited support of public sector risk-bearing – a set of investment instruments which would best match the preferences of different types of investors. A key advantage for in-dustrial investment policy design, is that the MARF helps to maximize the impact of public funds given varying – and sometimes contradicto-ry – objectives for private investments, leverage of public funding, eco-nomic growth and job creation.
Pension fund policies should allow Multi-Asset Renewal Funds to generate alpha in their investment strategies, while greening the economy
Pension systems are long-term investors, seeking to meet financial obli-gations that extend over decades and generations. Indeed, because pen-sion plans are rarely terminated, and because the plan sponsors rarely go out of business, these obligations are virtually perpetual in nature. Even so, pension trustees are often pressured to respond to short-term market fluctuations, to react to the daily noise of the capital markets, and to be seen as “doing something” by other stakeholders that have an interest in the plans. Given these conflicting pressures, the develop-
ment of an investment policy is crucial to maintain-ing a long-term focus.
We have noted in Chapter 6, and have discussed with stakeholders, that the search for yield by pen-
sion funds is increasingly including the integration of alternative assets. With private equity the main component, hedge funds, real estate and infrastructure income, and private credit are on the rise. Despite these allocation shifts, it does not appear that EU pension funds in general, and Nordic pension funds in particular, are gaining in their asset allo-cation to alternatives, relative to the US. One of the challenges noted by
The search for yield by pension funds is increasingly including the
integration of alternative assets
255 R
oadm
ap
practitioners and the literature is the lack of familiarity within the pen-sion fund with new instruments, resulting in very small allocations to these assets. A second challenge is that the alternative asset instruments with the right scale and liquidity to meet long-term liabilities have not been available.
The approval of ELTIFs in 2015 to stimulate investment in the re-al economy through infrastructure and SME investments has changed the landscape of alternatives. It is our understanding that individual EU governments yet have to explore how these types of funds can be integrated in the investment strategies of pension funds. If we look at what is happening with Finnish pension funds, we see climate bonds and private credit becoming part of the scope of investment strategies. Unfortunately, these investments are inefficient, as they require piece-meal allocations. Yet, the appetite is there. Multi-Asset Renewal Funds address a number of the limitations in the current market of funds: (i) they are of sufficient scale (see earlier comment from P80 Foundation and Deutsche Bank); (ii) they are diversified with sufficient liquidi-ty and long-term holding times, attractive to pension funds (comment from Deutsche Bank and KBC Wealth Management); (iii) they effect economic development at enhanced market returns (Chapter 7); and (iv) they have the capacity to renew entire clusters and industries, while leveraging existing assets (com-ment from GCCA clusters).
One of the key innovations of MARFs is not only that the underlying assets are efficiently sourced, and vetted using non-financial and financial metrics, but that they engage public capital in a manner that de-risks the loan asset class for SMEs. Blended capital investment funds that have the returns of private equi-ty with the risk of corporate bonds exhibit the best of both worlds, and fit within the risk profile of pension fund investment strategies. The fact that they fit within an already approved fund structure to boot should be an incentive for governments and pension fund policies to adopt the fund as a ‘new’ alternative asset.
Strategic insights for Nordic Cleantech
The clear focus of the book has been on the MARF as a novel invest-ment vehicle for industrial renewal and economic development. That being said, the design process for constructing MARFs generated al-so a lot of insights into the current state of the Finnish Cleantech space – our “wet lab” that we used for developing and testing the MARF. It would be a waste of perfectly good, hard-earned wisdom if we did not wrap up the book by providing you with a concise summary of key im-
One of the key innovations of MARFs is that they engage public capital in a manner that de-risks the loan asset class for SMEs

256Fi
nanc
ial T
echn
olo
gy fo
r Ind
ustri
al R
enew
al plications for a strategic roadmap to promote both value capture and investability in the Finnish Cleantech space.
Now, implications for the Green Chemistry ecosystem were abundant-ly dealt with in Chapter 3. You will remember, rigid vested interests be-
tween the petro chemicals industry and the spe-cialty chemicals industry call for a policy inter-vention for more sustainable solutions to break through and establish themselves. In the final sec-
tions of this chapter, we therefore concentrate on providing you with strategic implications for the remaining two ecosystems covered earlier in this book, namely Smart Grid and Smart Mobility.
Smart Grid enterprises need more aggressive entry strategies to avoid marginalization
Our results confirm that a global, economically viable Smart Grid eco-system is a reality. Power utili-ties, electrical and mechanical compo-nent and systems manufacturers, information and communication technology producers as well as telecommunications operators form a strong infrastructure layer that provides the physical foundation for the entire Smart Grid ecosystem. This foundation integrates power gener-ation technology, transmission and distribution grids, the respective electronic and mechanical equipment as well as telecommunication grids and their control technology.
On top of the foundation, data and software -driven companies build scalable, fast growing businesses, leaning on the resources of the entire infrastructure layer. In doing so, cross-industrial value chains emerge and enable the creation of service models that add new value in the form of improved efficiency, reliability and flexibility. It is these compa-nies that connect the involved legacy industries to form the emerging ecosystem and to make it “smart”. IT-hardware developers, data storage companies, application and systems software developers, as well as da-ta processing and analytics companies are in this growing nexus of the Smart Grid ecosystem. Machine-to-machine communication -enabled grid and facility automation, remote controlled smart homes and facto-ries, micro-grid integration, demand response optimization, and predic-tive grid maintenance services are just few examples of new value added products and services powered by IT- and software-driven solutions.
How do Finnish companies fare on this stage? Given the well-publi-cized strengths of the Finnish industry structure, one would argue that the odds are in the country’s favor.
In the infrastructure layer, Finland has a long-standing legacy in pow-er electronics and mechanical engineering with a particularly live-
A global, economically viable Smart Grid ecosystem is a reality
257 R
oadm
ap
ly, international cluster centered around the Westerly located city of Vaasa. Furthermore, Finnish power utilities had to face the open and competitive electricity market amongst the first in the world as the electricity markets were liberalized in Scandinavia as early as the mid-1990s. In a sense, they have had a head start in de-signing competitive strategies and adopting smart solutions to stay at the edge in the highly commod-itized market place.
Many of the same arguments apply to the Finnish telecommunications sector. With the rise of Nokia driving an explosive national and global adoption rate in mobile telephony in the same time period, the Finnish telecommunications operators faced a fast growing market place that was gagging for ever larger bandwidths and smarter services such as journey planners, digital tickets for public transporta-tion and other flexible on-the-go solutions that helped make everyday life more efficient, less stressful and spontaneous. They, too, have had time and incentives to respond to a very demanding clientele that ex-pected smart solutions from the start.
However, our results show that the incumbent players in the infrastruc-ture layer, despite their robust position to capture value from the Smart Grid ecosystem, have adopted a non-aggressive entry strategy. Their strong value capture position is encumbered by capital intensive, man-ufacturing-driven, production business models that are difficult to scale rapidly. Instead of strategically positioning themselves into the high-growth sectors of the Smart Grid ecosystem, Finnish enterprises have continued to provide their incumbent and highly commoditized products and services – such as elec-tricity by the kilowatt-hour and data transfer by the megabyte – to the ecosystem. These commodities are important, no question, but the attractive mar-gins and growth in value are in the scalable services and related products that help customers save costs through digital op-timization and predictive maintenance, improve the comfort of living through home automation and user interaction, as well as improved risk management through self-healing grid technologies and intelligent security solutions. Continuing to rely on commoditized and generic product and market strategies puts enterprises in danger of becoming marginalized and being pushed to the periphery of the ecosystem. They will still remain vital as the producers of the necessary core commodi-ties, but the value will be captured by companies in the growth sectors of the system.
What can power utilities, component manufacturers and telcos then do to reposition them for improved value capture and growth?
The incumbent players in the infrastructure layer of the Smart Grid ecosystem have adopted a non-aggressive entry strategy
Reliance on commoditized and generic product and market strategies puts enterprises in danger of becoming marginalized

258Fi
nanc
ial T
echn
olo
gy fo
r Ind
ustri
al R
enew
al In the US, some telcos have been particularly aggressive. Verizon, for instance, has invested into its own energy production capacity, and now powers its own facilities. Verizon hardly competes with energy utilities for a share in the regulated commodity business, but uses investments to learn about the dynamics and technologies of renewable energy gen-eration, grid integration, micro- and off-grid technology, power distri-bution, demand response optimization and consumption prediction. It is a test laboratory in Verizon’s own backyard that enables the company to develop and adopt an entirely new skillset for providing cutting-edge solutions without the historical baggage of legacy companies that are too slow to capture value in the Smart Grid ecosystem. At the same time, the company benefits from the goodwill their sustainable and in-
dependent energy setup imparts on the Verizon brand.
Less aggressive strategies build on acquisitions. Again, US contenders are more courageous in the adoption of this strategy. Many of the companies pictured earlier in Figure 4
do not exist anymore because they have been bought out by peers, sup-pliers or customers in both horizontal and vertical acquisition strat-egies. There is an acquisition frenzy sweeping across the Smart Grid landscape as companies across industry boundaries compete for the largest piece of the still growing Smart Grid pie.
But why would companies make such risky commitments in face of the still somewhat vague economic promises made by Smart Grids? Isn’t partnering, for instance, a more flexible and less risky option to probe the emerging space?
An acquisition strategy has one major advantage over pure partnering strategies, the least aggressive of options: the buyer internalizes the val-ue the acquiree would otherwise capture from the growing ecosys-tem. In our company analyses we often encountered enterprises that claimed to have committed to be-coming a key provider of Smart Grid solu-tions. On a closer inspection of their respective business models, how-ever, it turned out that the enterprises’ role in these solutions remained
that of the conventional commodity provider. At the same time, a number of their partners – sometimes tens of them – contributed all the smart elements and captured their as-sociated value. Sure, large incumbent enterprises can charge a certain margin for their role as an integrator of these ele-
ments and for providing a market channel to the often much smaller partners but the dependency on a partner’s specialized capabilities in the emerging Smart Grid space compromises this advantage. A lot of potential synergies are left on the table. Furthermore, the appropriation of relevant capabilities, a prerequisite to long-term success in any envi-ronment new to a company, is difficult in an arms-length, contractual
There is an acquisition frenzy sweeping across
the Smart Grid landscape
Partnering is a justified first step in entering into
the Smart Grid ecosystem
259 R
oadm
ap
relationship, in which partners are understandably reluctant to disclose their core capabilities.
That being said, partnering is a justified first step in entering into the Smart Grid ecosystem. It provides consortia of companies the possibili-ty to capture an increasing share of a fast growing market space. Some-times speed is crucial to the establishment of a competitive position. The objective for corporate consortium partners, then, is to exploit the partnerships to validate potential market opportunities, acquire the re-quired core capabilities for long-term success and aggressively leverage their superior resources to establish their presence in the new market.
Legacy infrastructure and digital market platforms offer improved market access for Smart Grid SMEs
According to our results, startups and SMEs are quicker to tap into the Smart Grid market potential than their large corporate counterparts. Their business models are more scalable and, most decisively, exhibit a much higher capital efficiency. This gives them the capability to capture opportunities faster. Chapter 4 clearly shows that the majority of start-ups and SMEs is in the lower right quadrant of the investment grade matrix.
This is a strength worth preserving. As argued in previous chapters, the make-and-sell business model, the stalwart of the traditional Cleantech economy, is being eroded by service models with recurring revenue streams and low capital intensity. CleanTech 3.0 has been defined by business models that have been built on top of legacy infrastructure, and has given rise to the cleanweb. ICT and network-based technolo-gies are at the core of the transition from Cleantech to cleanweb. A de-cade after Cleantech was defined as an innovation space, the conver-gence between ICT and Cleantech holds the key to scale and profitabil-ity. Given the pre-eminence of Finnish companies in this area, and a rich industry value system in this space, there is clearly an opportunity to be tapped and assets to be leveraged. Our current results imply that SMEs in the Smart Grid space are well positioned to do just that, giv-en their fairly good scalability and excellent capital effi-ciency.
However, both startups and SMEs suffer from the same weakness that seems to be characteristic of the entire ecosystem: poor leveragability of industry capabilities needed to gain access to markets. It is an unfortunate deficiency since there are am-ple market opportunities to be exploited given the deregulation of the energy industry and diversification in the telco industry. However, the necessary value chains – the cross-industrial structures that we mapped
The make-and-sell business model, the stalwart of the traditional Cleantech economy, is being eroded by service models
It is safe to consider the Finnish Smart Grid industry an incipient economic sector

260Fi
nanc
ial T
echn
olo
gy fo
r Ind
ustri
al R
enew
al in Chapter 3 – are too undeveloped to sustain growth of a scalable mar-ket. It is safe to consider the Finnish Smart Grid industry an incipient economic sector.
There is a need for building out a growing Smart Grid industry clus-ter and market. As a first step, startups and SMEs could work with large enterprises to address their energy needs. Small firms can leverage the market infrastructure of large enterprises to gain access to the global market place. Therefore, in the short term, a partnering strategy offers a synergetic opportunity that both small and large firms could bene-fit from. Indeed corporate strategic investors have increasingly turned to the development of corporate incubators with small companies. The objective is to align innovative product offerings with corporate lines of business. In the long-term, however, once the necessary capabilities
have been acquired, large enterprises have the in-centive to use their asymmetric market power to capture most of the value generated in consortia.
Small and medium -sized companies, therefore, are advised to develop parallel value chain strat-
egies independent of large industry connections. Progress in generic, digital market platforms is a promising venue that helps small compa-nies scale their offering onto global markets without having to lock into market channels controlled by dominant enterprises or having to invest heavily into building costly proprietary market infrastructure.
Partnership programs, cross-industrial pilots and governance standards for networks of IT systems are effective tools in promoting industrial momentum
Our findings give rise to a number of policy recommendations. First, the Smart Grid ecosystem seems to have gathered industrial momen-tum to grow in a sustainable manner. As shown, a number of conven-tional legacy industries contribute the necessary commodities and in-frastructure for more agile – and often digital – sectors to build new value added services. However, a closer look has revealed a weak con-nectivity of the companies to appropriate market channels that would allow them to exploit the momentum. As an initial measure, both large enterprises as well as SMEs would benefit from synergetic partnerships that give incumbents access to their specialized capabilities, and pro-vide SMEs with a possibility to leverage the incumbents’ superior mar-ket infrastructure as a channel.
To accelerate the formation of partnerships, economic developers are advised to favor development vehicles that promote collaboration be-tween enterprises and growth companies. Innovative pioneers in this area already exist. The Nordic Innovation Accelerator (NIA) , for in-
Progress in digital market platforms is a promising venue that helps
small companies scale their offering onto global markets
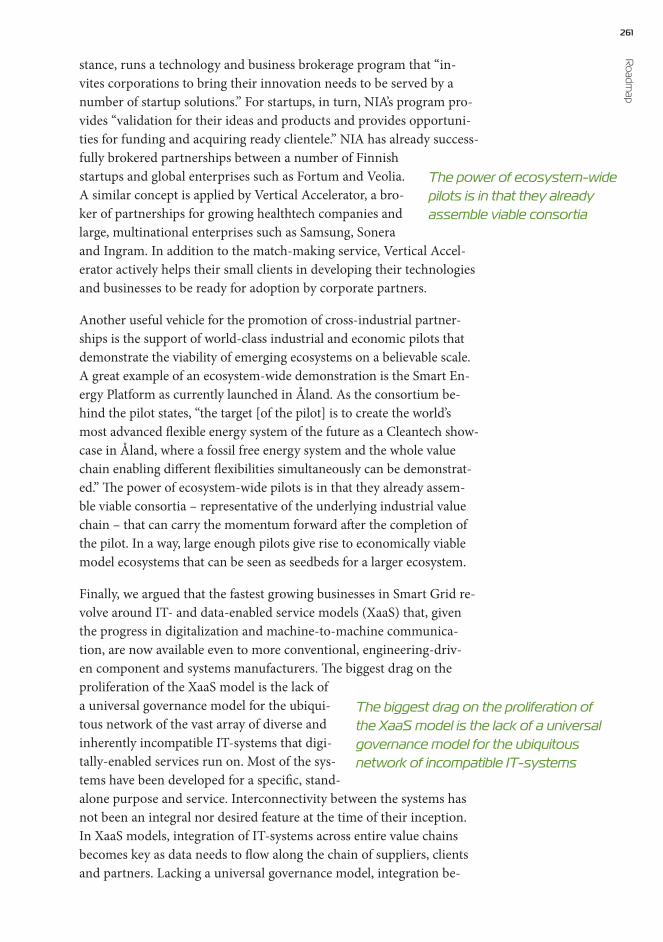
261 R
oadm
ap
stance, runs a technology and business brokerage program that “in-vites corporations to bring their innovation needs to be served by a number of startup solutions.” For startups, in turn, NIA’s program pro-vides “validation for their ideas and products and provides opportuni-ties for funding and acquiring ready clientele.” NIA has already success-fully brokered partnerships between a number of Finnish startups and global enterprises such as Fortum and Veolia. A similar concept is applied by Vertical Accelerator, a bro-ker of partnerships for growing healthtech companies and large, multinational enterprises such as Samsung, Sonera and Ingram. In addition to the match-making service, Vertical Accel-erator actively helps their small clients in developing their technologies and businesses to be ready for adoption by corporate partners.
Another useful vehicle for the promotion of cross-industrial partner-ships is the support of world-class industrial and economic pilots that demonstrate the viability of emerging ecosystems on a believable scale. A great example of an ecosystem-wide demonstration is the Smart En-ergy Platform as currently launched in Åland. As the consortium be-hind the pilot states, “the target [of the pilot] is to create the world’s most advanced flexible energy system of the future as a Cleantech show-case in Åland, where a fossil free energy system and the whole value chain enabling different flexibilities simultaneously can be demonstrat-ed.” The power of ecosystem-wide pilots is in that they already assem-ble viable consortia – representative of the underlying industrial value chain – that can carry the momentum forward after the completion of the pilot. In a way, large enough pilots give rise to economically viable model ecosystems that can be seen as seedbeds for a larger ecosystem.
Finally, we argued that the fastest growing businesses in Smart Grid re-volve around IT- and data-enabled service models (XaaS) that, given the progress in digitalization and machine-to-machine communica-tion, are now available even to more conventional, engineering-driv-en component and systems manufacturers. The biggest drag on the proliferation of the XaaS model is the lack of a universal governance model for the ubiqui-tous network of the vast array of diverse and inherently incompatible IT-systems that digi-tally-enabled services run on. Most of the sys-tems have been developed for a specific, stand-alone purpose and service. Interconnectivity between the systems has not been an integral nor desired feature at the time of their inception. In XaaS models, integration of IT-systems across entire value chains becomes key as data needs to flow along the chain of suppliers, clients and partners. Lacking a universal governance model, integration be-
The power of ecosystem-wide pilots is in that they already assemble viable consortia
The biggest drag on the proliferation of the XaaS model is the lack of a universal governance model for the ubiquitous network of incompatible IT-systems

262Fi
nanc
ial T
echn
olo
gy fo
r Ind
ustri
al R
enew
al tween systems today is a tedious undertaking, as connectivity needs to be established in a customized, non-scalable, case-by-case fashion.
Scaling of digitally-enabled businesses would see unprecedented rates if a unified governance standard for a network of systems could be estab-lished. History has shown that it is possible to introduce standards in a de facto, industry-induced fashion. It is a long, evolutionary road that is usually dominated by the large and often entails unproductive bat-tles over who will set the standard that is adopted widely. On the oth-er hand, history has also shown examples of active, centrally-lead stan-dardization projects. These are a lot faster to set in place and, when de-signed properly, will not introduce market distortions that favor single stakeholders. Policymakers and economic developers could take deci-sive action in promoting digital governance standards to pave the way for the quick emergence of cross-industrial service models that will not only help modern IT-businesses thrive but support incumbent, engi-neering-driven companies reposition their make-and-sell -based busi-nesses models into scalable service models.
Could symbiotic relationships be the way forward for enterprises and SMEs in the Smart Mobility space?
What insights can we draw from the results on the Smart Mobility eco-system? Clearly, many of the takeaways drawn from the Smart Grid ecosystem apply also here. Both ecosystems show proof of existing in-dustrial momentum; they are also both characterized by an anchor-cat-alyst industry structure, the emergence of which is driven by data- and software-driven, scalable businesses that lean on the infrastructure pro-
vided by large, incumbent industry. To avoid tautol-ogy, we focus on the differences between the ecosys-tems for drawing additional insights.
One of the most striking findings is that large enter-prises seem to be exceptionally well positioned to
cap-ture value from the Smart Mobility ecosystem. They are endowed with the essential assets – both tangible and intangible – to be indepen-dent of other actors in the ecosystem, they protect these assets well, and have established effective channels to access the relevant markets. In-deed, large enterprises do not only beat their Smart Grid peers in val-ue capture capabilities but are also clearly ahead of their smaller com-petitors – startups and SMEs – in the Mobility space. So, what is to stop them from establishing a dominant position in Smart Mobility and to drive and accelerate its development as resourceful actors?
The reason lies in the strategies and business models enterprises have adopted to explore opportunities in Smart Mobility. Bound by legacy business trajectories, enterprises rely on their incumbent, capital-inten-
Large enterprises seem to be exceptionally well positioned to
capture value from the Smart Mobility ecosystem
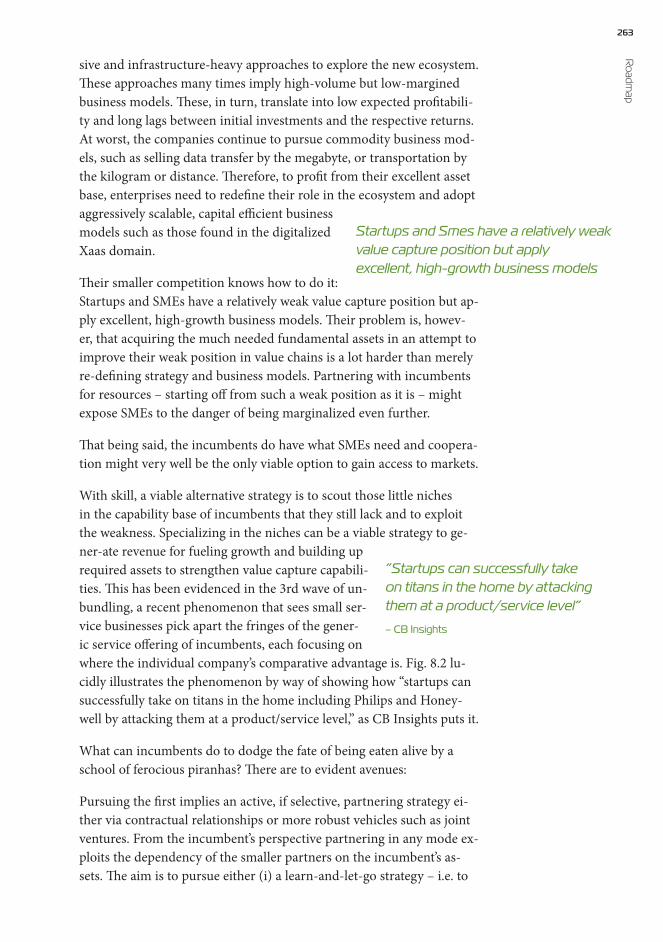
263 R
oadm
ap
sive and infrastructure-heavy approaches to explore the new ecosystem. These approaches many times imply high-volume but low-margined business models. These, in turn, translate into low expected profitabili-ty and long lags between initial investments and the respective returns. At worst, the companies continue to pursue commodity business mod-els, such as selling data transfer by the megabyte, or transportation by the kilogram or distance. Therefore, to profit from their excellent asset base, enterprises need to redefine their role in the ecosystem and adopt aggressively scalable, capital efficient business models such as those found in the digitalized Xaas domain.
Their smaller competition knows how to do it: Startups and SMEs have a relatively weak value capture position but ap-ply excellent, high-growth business models. Their problem is, howev-er, that acquiring the much needed fundamental assets in an attempt to improve their weak position in value chains is a lot harder than merely re-defining strategy and business models. Partnering with incumbents for resources – starting off from such a weak position as it is – might expose SMEs to the danger of being marginalized even further.
That being said, the incumbents do have what SMEs need and coopera-tion might very well be the only viable option to gain access to markets.
With skill, a viable alternative strategy is to scout those little niches in the capability base of incumbents that they still lack and to exploit the weakness. Specializing in the niches can be a viable strategy to ge-ner-ate revenue for fueling growth and building up required assets to strengthen value capture capabili-ties. This has been evidenced in the 3rd wave of un-bundling, a recent phenomenon that sees small ser-vice businesses pick apart the fringes of the gener-ic service offering of incumbents, each focusing on where the individual company’s comparative advantage is. Fig. 8.2 lu-cidly illustrates the phenomenon by way of showing how “startups can successfully take on titans in the home including Philips and Honey-well by attacking them at a product/service level,” as CB Insights puts it.
What can incumbents do to dodge the fate of being eaten alive by a school of ferocious piranhas? There are to evident avenues:
Pursuing the first implies an active, if selective, partnering strategy ei-ther via contractual relationships or more robust vehicles such as joint ventures. From the incumbent’s perspective partnering in any mode ex-ploits the dependency of the smaller partners on the incumbent’s as-sets. The aim is to pursue either (i) a learn-and-let-go strategy – i.e. to
Startups and Smes have a relatively weak value capture position but apply excellent, high-growth business models
”Startups can successfully take on titans in the home by attacking them at a product/service level”
– CB Insights

264Fi
nanc
ial T
echn
olo
gy fo
r Ind
ustri
al R
enew
al
Figure 8.2 Unbundling Honeywell (Source: www.cbinsights.com)
What can incumbents do to dodge the fate of being eaten alive by a school of ferocious piranhas? There are to evident avenues:
Pursuing the first implies an active, if selective, partnering strategy either via contractual relationships or more robust vehicles such as joint ventures. From the incumbent’s perspective partnering in any mode exploits the dependency of the smaller partners on the incumbent’s assets. The aim is to pursue either (i) a learn-and-let-go strategy - i.e. to adopt and adapt agile business models to the incumbents business as taught by the smaller, innovative partners and, eventually, beat them in their own game – or (ii) an acquisition strategy that advocates integrating promising growth companies as new lines of business via acquisitions.
The second avenue requires paradigm shift -level changes in corporate strategy and leans heavily on the capabilities the digital revolution is promising to provide: The platform strategy advocates incumbents to tactically surrender entire lines of business to up-and-coming growth companies that have the competitive edge in the afore mentioned niche businesses. Then, incumbents leverage their highly coveted assets to become platforms for growth companies, providing them with standardized development toolkits, access to the consumer interface, payment interface, transactional back-office functionality and other key resources to develop, launch and run their businesses. In Smart Mobility, one of the key roles of platform providers will be the seamless integration of the various services developed by independent growth companies that populate the platforms. After all, seamless integration of multi-modal private and public transportation is what defines Smart Mobility.
The first question that comes to mind when thinking about the platform business model is how to monetize it. An early and established example of a successful platform business model is that of Apple’s AppStore. Apple simply takes a cut of every transaction concluded on its AppStore platform; a whopping 30% to be exact. The platform strategy is attractive because it provides benefits to both incumbents and growth
Comment [ata21]: NOSTO
adopt and adapt agile business models to the incumbents business as taught by the smaller, innovative partners and, eventually, beat them in their own game – or (ii) an acquisition strategy that advocates integrat-ing promising growth companies as new lines of business via acquisi-tions.
The second avenue requires paradigm shift -level changes in corporate strategy and leans heavily on the capabilities the digital revolution is promising to provide: The platform strategy advocates incumbents to tactically surrender entire lines of business to up-and-coming growth companies that have the competitive edge in the afore mentioned niche businesses. Then, incumbents leverage their highly coveted assets to become platforms for growth companies, providing them with stan-
dardized development toolkits, access to the consumer interface, payment interface, transactional back-office functionality and other key resources to develop, launch and run their businesses. In Smart Mobility, one of the key roles of platform providers will be
the seamless integration of the various services developed by indepen-dent growth companies that populate the platforms. After all, seamless integration of multi-modal private and public transportation is what defines Smart Mobility.
The first question that comes to mind when thinking about the plat-form business model is how to monetize it. An early and established example of a successful platform business model is that of Apple’s App-
Source: www.cbinsights.com
Figure 8.2Unbundling Honeywell
One of the key roles of platform providers will be the seamless integration of the
various services developed by independent growth companies

265 R
oadm
ap
Store. Apple simply takes a cut of every transaction concluded on its AppStore platform; a whopping 30% to be exact. The platform strat-egy is attractive because it provides benefits to both incumbents and growth companies alike: Startups and SMEs gain access to the ecosys-tem-specific assets such as capital-intensive infrastructure and market channels without having to make excessive investments. Incumbents, in turn, can profit from the scalable and fast-growing businesses of growth companies by taking a cut – basically a service fee for running the platform – without having to adopt new business models that do not necessarily fit their organizational or capital structures.
Establishment of standards for system interconnectivity high priority for economic developers
Economic developers can help in clearing the playing field from ob-stacles. Smart Mobility, even more so than Smart Grid, is all about re-al-time coordination of mobility assets, infrastructure and human be-ings that currently are using a multitude of systems and related stan-dards that do not communicate across system borders. Standardiza-tion here is all the more important than in Smart Grid because adding the masses of consumers, their mobile devices and ve-hicles as well as the mind-boggling amount of transac-tions they initiate between involved systems makes inte-gration and coordination a lot more complex1. Intercon-nectivity of systems is therefore paramount for scaling the Smart Mobility ecosystem. Large incumbent companies intent on building platforms for Smart Mobility can do only so much in dynam-ic economies. The emergence of too many competing standards can be a real drag on the evolution and growth of Smart Mobility as a promis-ing ecosystem. Economic developers could promote such growth by ag-gressively pushing for universal standards in inter-system connectivity via legislative measures.
Takeaways for economic developers
Three distinct ecosystems, tens of industrial sectors, hundreds of com-panies, one summary; what have we learned about Cleantech and its future from the Nordic perspective? Let us conclude the book with a few words directed at economic developers, one of the key stakeholders to MARFS.
Our analyses have clearly shown that for business and economic de-velopment purposes the only feasible approach to Cleantech is to deal with it by the ecosystem. The three ecosystems analyzed in this book – Smart Grid, Smart Mobility and Green Chemistry – all feature different industrial structures, make vastly different value propositions, address
Interconnectivity of systems is paramount for scaling the Smart Mobility ecosystem

266Fi
nanc
ial T
echn
olo
gy fo
r Ind
ustri
al R
enew
al different markets and involve a very different set of stakeholders. There is little value in cursorily lumping them together under a quasi-com-mon concept such as Cleantech or the Bioeconomy. These concepts have no substance as they do not refer to specific industrial or econom-ic activity.
Hence, it is also very challenging to develop concrete instruments for economic or business development purposes that are to promote such activity. At worst, scarce resources are put to suboptimal use, as they are allocated over a vast spread of individual companies and projects that might be a fit with the overall theme of Cleantech but have no common denominator in the form of an industrial ecosystem and its underlying value chains. Our results on the Bioeconomy provide for an excellent showcase.
Economic developers need to better align development instruments with identified industrial momentum – based on an in-depth under-standing of the businesses and industries involved in any given emer-
gent ecosystem – to avoid overly long and costly strategies with little economic impact in the short- to medium term. Instead of pumping resources in-to policy-driven excitement, our results call for a
focused approach, supporting existing – if incipient – industrial drive with ecosystem-specific instruments.
Our results show that even the more promising ecosystems such as Smart Mobility and Smart Grids are in the throes of growing pains. There is much that economic developers can do efficiently to allevi-ate them. The poor leveragability of industry assets and connections for market access across the board speak of fragile, budding industry structures that make it difficult for companies to establish robust mar-kets and steady businesses in the short term. Companies of different sizes suffer the symptoms in their own ways. On the one hand, large incumbents do wield the assets necessary to conquer the ecosystem – telecommunications operators seem to have an especially favorable vantage point in smart ecosystems – but shoot themselves in the foot by applying conventional, capital-intensive business models that leave the door open for more agile growth companies that harness the poten-tial of digitalization to exploit opportunities. On the other, startups and SMEs indeed show the drive and lean on nimble enough business mod-els but utterly lack the assets for a full-scale conquest.
It is easy to envision a symbiotic relationship, in which incumbents provide the capital-intensive assets while their smaller peers intro-duce the competitive business models. Given the incipient structure of the ecosystems, however, just finding appropriate partners can incur
Smart Mobility and Smart Grids are in the throes of growing pains

267 R
oadm
ap
considerable transaction costs. Here economic developers can step in, helping to find matches via collaborative accelerators that broker part-nerships between industrial heavy-hitters on a mission of industrial re-newal and small growth companies looking for resources and down-stream assets.
Finding partners is a formidable challenge in and by itself, but our con-clusions point to even more systemic impediments to industrial renew-al that lie outside the industry’s sphere of influence. One such is the lack of proper standards for the interconnectivity and interoperability of the various, often proprietary, IT systems that the numerous stake-holders to ecosystems run their businesses on. Especially smart ecosys-tems – by definition – build on the seamless interoperability across diverse system archi-tectures and organizational boundaries. In the absence of universal standards, interconnec-tivity needs to be established one relationship at a time, building on contractually agreed, customized solutions that do not scale beyond the specific relation-ship. Economic developers can considerably speed up the construction of a digital business environment by introducing universal standards that promote the emergence of plug-and-play platforms for efficient in-teroperability1.
Standards are needed for data security and personal safety as well. In a world of autonomous, self-driving vehicles and applications that affect offtake and feed into electricity grids, quality and safety controls for al-gorithms that govern these systems will be paramount for individual and societal safety. Thus, it has been proposed that, in order to guaran-tee objectivity and to avoid moral hazard traps, agencies akin to those proven effective elsewhere – such as the Food and Drug Administra-tion (DFA) governing foodstuff and medicinal substance approvals in the US – be instituted to govern the approval of algorithms that are in-troduced into networked systems such as those necessary to run Smart Grids and Smart Mobility environments. Early establishment of cen-tral bodies that set the boundaries of the playing field will help in pro-moting clarity and standardization in incipient ecosystems the growth of which suffer from a cacophony of competing and incompatible stan-dards.
Finally, economic developers and governments can speed up the emer-gence of sustainable ecosystems, such as Green Chemistry, by driv-ing the decoupling of industry sectors from petrochemicals and oth-er environmentally harmful substances via legislation. The challenge is to introduce effective enough disincentives that are sufficiently strong to overcome the institutionalized vested interests that many industri-
Economic developers can considerably speed up the construction of a digital business environment by introducing universal standards

268Fi
nanc
ial T
echn
olo
gy fo
r Ind
ustri
al R
enew
al al sectors share with those providing fossil-based raw materials. Incipi-ent links to alternative raw material sources – such as biomass – can al-ready be observed in relational data on industry links, but they are still very fragile and extremely dependent on fossil raw material prices. The current plunge in the price for oil is a great example of a strong deter-rent to entry for sustainable alternatives.

269 R
oadm
ap
Reference1 Seppälä, T. & Mattila, J. (2016). Ubiquitous Network of Systems. Berkeley Roundtable
on the International Economy, University of California, Berkeley. Download at https://www.etla.fi/wp-content/uploads/BRIE_Seppälä_Mattila-2016.pdf
270Fi
nanc
ial T
echn
olo
gy fo
r Ind
ustri
al R
enew
al Finnish summary
Sijoitusinnovaatioita talouden uudistumiseen
Kirjassa esittelemme uudenlaisen sijoitusinstrumentin. Instrument-ti valjastaa niin institutionaalisten suursijoittajien kuin julkisten toimi-joiden pääomapanoksia perinteisten teollisuusalojen uudistamiseen ja uusien teollisten ekosysteemien kasvun edistämiseen markkinaehtoi-sella tavalla. Yhdistelemällä neljä erilaista pääomaluokkaa – lainoja, ris-kipääomaa, velkakirjoja, ja osakkeita – yksittäisissä, temaattisissa port-folioissa saadaan rahoitus kohdennettua tehokkaasti niin pienten kuin suurten yritysten eriäviin rahoitustarpeisiin.
Yhteistyössä varainhallintayhtiöiden, institutionaalisten sijoittajien, jul-kisten kehitysorganisaatioiden ja muiden hyödyntäjien kanssa olemme kehittäneet prosessin, jolla (i) tunnistetaan uusia, kasvavia teollisuuse-kosysteemejä ja niissä toimivia yhtiöitä, (ii) arvioidaan yhtiöiden sijoi-tettavuus, (iii) suunnitellaan rakenne ja sijoitushypoteesi monipääoma-luokkaisille, temaattisille portfoliolle (Multi-Asset Renewal Fund), ja (iv) arvioidaan portfolion riski- ja tuottoasteet sen markkinalähtöisen käyttöönoton edistämiseksi.
Testiympäristönä kehitystyölle on hyödynnetty kolmea eri ekosystee-miä suomalaisen Cleantechin ympäristössä. Näihin kuuluvat älykkäät verkot, älykäs liikenne ja vihreä kemia. Sijoitusinstrumentin ja sen käyttöönoton lisäksi kirjassa tarjotaan myös strategisia johtopäätöksiä suomalaisen Cleantechin kilpailukyvyn parantamiseksi.

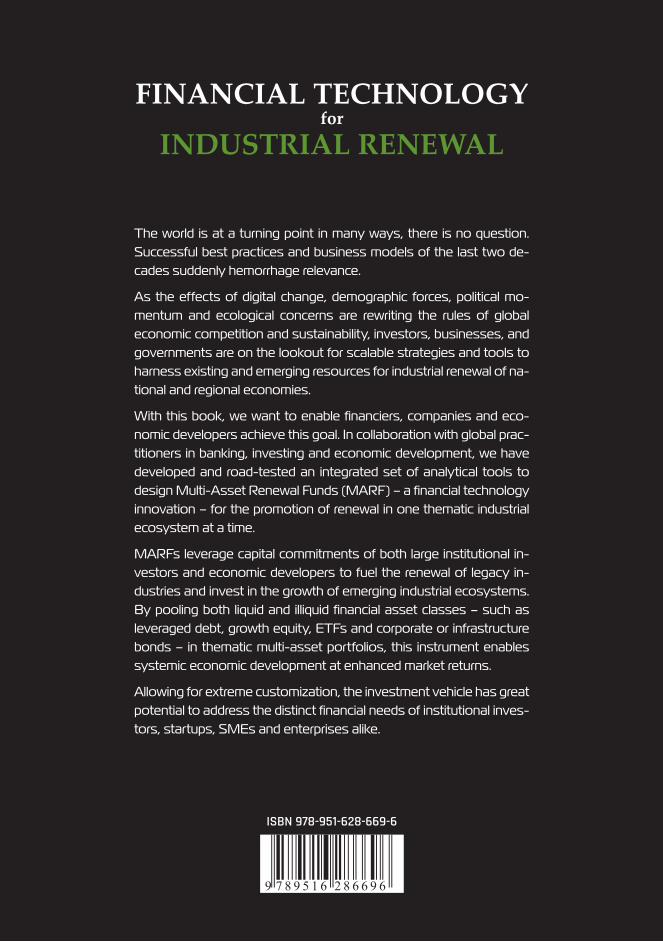
The world is at a turning point in many ways, there is no question. Successful best practices and business models of the last two de-cades suddenly hemorrhage relevance.
As the effects of digital change, demographic forces, political mo-mentum and ecological concerns are rewriting the rules of global economic competition and sustainability, investors, businesses, and governments are on the lookout for scalable strategies and tools to harness existing and emerging resources for industrial renewal of na-tional and regional economies.
With this book, we want to enable financiers, companies and eco-nomic developers achieve this goal. In collaboration with global prac-titioners in banking, investing and economic development, we have developed and road-tested an integrated set of analytical tools to design Multi-Asset Renewal Funds (MARF) – a financial technology innovation – for the promotion of renewal in one thematic industrial ecosystem at a time.
MARFs leverage capital commitments of both large institutional in-vestors and economic developers to fuel the renewal of legacy in-dustries and invest in the growth of emerging industrial ecosystems. By pooling both liquid and illiquid financial asset classes – such as leveraged debt, growth equity, ETFs and corporate or infrastructure bonds – in thematic multi-asset portfolios, this instrument enables systemic economic development at enhanced market returns.
Allowing for extreme customization, the investment vehicle has great potential to address the distinct financial needs of institutional inves-tors, startups, SMEs and enterprises alike.
FINANCIAL TECHNOLOGY
INDUSTRIAL RENEWAL
ISBN 978-951-628-669-6
for