industrial production of the republic of uzbekistan in ... · industrial production of the republic...
TRANSCRIPT

Industrial production of the Republic of Uzbekistan in January-April 2019 1
THE STATE COMMITTEE OF THE REPUBLIC OF UZBEKISTAN ON STATISTICS
According to preliminary data, in
January-April 2019, by enterprises were produced industrial products for 94.7 trillion soums, the industrial production index for the same period of last year amounted to 107.0%.
The main factor behind the growth in total industrial production was the increase in mining and quarrying by 7.2%, manufacturing - by 7.4%, electricity, gas, steam and air conditioning - by 3.4%, water supply, sewerage, waste collection and disposal - by 8.6%.
The structure of industrial production by main types of economic activity in January-April 2019
Industrial production of the Republic of Uzbekistan
in January-April 2019

Industrial production of the Republic of Uzbekistan in January-April 2019 2
THE STATE COMMITTEE OF THE REPUBLIC OF UZBEKISTAN ON STATISTICS
The contribution of the main types of economic activity in growth of industrial production in January-April 2019, %
Mining and quarrying
The production volume by mining and quarrying enterprises in January-April 2019 amounted to 13.4 trillion soums, or 14.2% of total industry.
Compared to the same period of last year, there is an increase in production of natural gas by 4.4% and gravel - in 2.2 t. At the same time, coal production decreased by 18.9%, oil - by 7.4%, gas condensate - by 1.4%, crushed stone - by 31.1%.

Industrial production of the Republic of Uzbekistan in January-April 2019 3
THE STATE COMMITTEE OF THE REPUBLIC OF UZBEKISTAN ON STATISTICS
Production of selected industrial products by large-scale mining and quarrying enterprises
Production in January-April 2018
Industrial output Production in
January-April 2019 By January-April 2018,%
Coal, thousand tons
1256.0
1018.5 81.1
Petroleum, thousand tons
249.7
231.2 92.6
Natural gas, million cubic meters
19932.4
20816.2 104.4
Gas condensate, thousand tons
723.4
713.0 98.6
Crushed stone, thousand tons
354.6
244.2 68.9
Gravel, thousand tons
80.1
179.6 2.2 t.

Industrial production of the Republic of Uzbekistan in January-April 2019 4
THE STATE COMMITTEE OF THE REPUBLIC OF UZBEKISTAN ON STATISTICS

Industrial production of the Republic of Uzbekistan in January-April 2019 5
21,2 %
1,4 %
26,1 %
33,7 %
78,8 %
38,8 %
January-April 2018
22,3 %
1,2 %
26,2 %
37,6 %
77,7 %
35,0 %
January-April 2019
Other activities Manufacturing industry High-tech Medium-high-tech Medium-low-tech Low-tech
THE STATE COMMITTEE OF THE REPUBLIC OF UZBEKISTAN ON STATISTICS
Manufacturing industry
Manufacturing enterprises in January-April 2019 produced goods to 73.6
trillion soums, or 77.7% of total industry.
In the structure of manufacturing industry, as compared with the
corresponding period of the previous year, the share of high-tech industries was
1.2% (1.4% in January-April 2018), medium-high-tech - 26.2% (26.1%),
moderately low-tech - 37.6% (33.7%) and low-tech - 35.0% (38.8%).
The structure of manufacturing industry for manufacturability

Industrial production of the Republic of Uzbekistan in January-April 2019 6
THE STATE COMMITTEE OF THE REPUBLIC OF UZBEKISTAN ON STATISTICS
In total industrial volume, the share of enterprises for the production, repair,
assembly of machinery and equipment, production of cars, trailers, semi-trailers
and other finished products reached 17.1% (increased by 20.2% in January-
April 2018), a share of metallurgical industry - 18.0% (4.9%), enterprises for the
production of textile, clothing and leather products - 13.5% (3.2%), for the
production of food, beverages and tobacco products - 11.5% (8, 0%),
enterprises producing chemical products, rubber and plastic products - 7.6%
(2.7%).
At the same time, in manufacturing industry, compared with the
corresponding period of last year, the production of trucks increased by 2.0 t.,
passenger cars - by 1.5 t., automobile engines - by 1.6 t., buses - by 4,1 t.,
Wheels of running gears, their parts and accessories - 1.5 t., radiators, silencers
and exhaust pipes, clutches, steering wheels, steering columns, crankcases of
steering mechanisms and parts thereof - by 1.5 t.
The overhaul of process equipment made it possible to increase the
capacity utilization of chemical enterprises and to exceed the previous year’s
production of potassium chloride (114.3% compared to January-April 2018),
carbamide (119.8%), ammonium sulfate (126.5% ), ammonium nitrate
(119.2%), paints and varnishes based on acrylic or vinyl polymers (127.7%),
herbicides (107.2%), caustic soda (164.4%), other nitrogen fertilizers and their
mixtures (173.9%), mineral fertilizers containing nitrogen, phosphorus and
potassium (137.4%).

Industrial production of the Republic of Uzbekistan in January-April 2019 7
THE STATE COMMITTEE OF THE REPUBLIC OF UZBEKISTAN ON STATISTICS
Production of certain types of industrial goods by large manufacturing
enterprises
Production in January-April 2018
Industrial output Production in January-April
2019
By January-April 2018,
%
Cars, pcs.
53219
79614 149.6
Trucks, pcs.
856
1719 2,0 t.
Buses, pcs.
144
593 4,1 t.
Automobile engines, pcs.
40780
63762 156.4
Cotton fiber, thousand tons
448.8
303.1
67.5
Vegetable oil (refined), thousand tons
88.0
74.1
84.2

Industrial production of the Republic of Uzbekistan in January-April 2019 8
THE STATE COMMITTEE OF THE REPUBLIC OF UZBEKISTAN ON STATISTICS
Production in January-April 2018
Industrial output Production in
January-April 2019 By January-April 2018, %
Tobacco products, mln. pcs.
3544
3578 101.0
Motor gasoline, thousand tons
378.9
308.7 81.5
Diesel fuel, thousand tons
387.9
341.8 88.1
Portland cement, thousand tons
2415.6
2774.7 114.9
Paints and varnishes based on acrylic or vinyl polymers, tons
3752.1
4790.2 127.7
Tractors, pcs.
806
164 20.3

Industrial production of the Republic of Uzbekistan in January-April 2019 9
THE STATE COMMITTEE OF THE REPUBLIC OF UZBEKISTAN ON STATISTICS
Electricity, gas, steam and air
conditioning
The production volume by enterprises of
electricity, gas, steam and air conditioning
amounted to 6.9 trillion soums (7.3% of total
industry).
In this industry in January-April 2019,
compared with the corresponding period of
last year, production, transmission and
distribution of electricity, steam supply systems and air conditioning increased
by 3.6%.
Production of certain types of industrial goods by large enterprises of electricity, gas, steam and air conditioning
Production in January-April 2018
Industrial output Production in
January-April 2019 By January-April 2018, %
Electricity, million kW/h
20919.2
22051.8 105.4
Heat, thousand Gcal
12116.9
11705.3 96.6

Industrial production of the Republic of Uzbekistan in January-April 2019 10
THE STATE COMMITTEE OF THE REPUBLIC OF UZBEKISTAN ON STATISTICS
Water supply, sewage, waste
collection and disposal
The volume of production by water
supply, sewerage, waste collection and
disposal enterprises amounted to 794.1
billion soums. (0.8% of total industry).
Compared with the corresponding
period of last year, there is an increase
in recycled materials containing aluminum, 2.5 t., recycled materials containing
copper, - 3.2 t., services for emptying, cleaning and processing cesspools,
cesspits and septic tanks - in 1.9 t., water treatment and distribution services
through water supply systems - by 36.5%, waste disposal services,
transportation of wastewater and their treatment - by 50.5%, non-hazardous
waste collection services - by 74.8%.
Production of certain types of industrial goods by large enterprises of water supply, sewerage, waste collection and disposal
Production in January-April
2018 Industrial output
Production in January-April 2019
By January-April 2018, %
Recycled materials containing ferrous metals, thousand tons
123.2
82.5 67.0
Recycled materials containing aluminum, tons
1041.0
2577.0 2.5 t.
Services for the removal, transportation and treatment of wastewater, billion soums
44.9
67.5 150.5

Industrial production of the Republic of Uzbekistan in January-April 2019 11
THE STATE COMMITTEE OF THE REPUBLIC OF UZBEKISTAN ON STATISTICS
Consumer goods production
As a result of measures taken to expand the range and stimulate the
production of finished goods, the production of consumer goods amounted to
29.6 trillion soums compared to the corresponding period of 2018, increased by
17.1%, a share in total industry amounted to 31.2%.
The structure of production and growth of consumer goods in January-
April 2019 by January-April 2018
Compared to the same period of 2018, in the structure of consumer goods
in January-April 2019 there was an increase in the share of non-food products
from 67.5% to 69.1%.
In the structure of foodstuffs, the production of wine-vodka products and
beer was 7.1% (8.2% in January-April 2018).

Industrial production of the Republic of Uzbekistan in January-April 2019 12
THE STATE COMMITTEE OF THE REPUBLIC OF UZBEKISTAN ON STATISTICS
Production of enterprises with foreign investments
During the reporting period, enterprises with foreign investment were
produced goods to 35.9 trillion soums.
The production share of enterprises with foreign investments in total
production volume amounted to 37.9%.
The production proportion of enterprises with foreign investments in total
industry, %
In total production volume of enterprises with foreign investments, the
share of mining and quarrying enterprises amounted to 23.7%, manufacturing
industry - 76.2%.

Industrial production of the Republic of Uzbekistan in January-April 2019 13
THE STATE COMMITTEE OF THE REPUBLIC OF UZBEKISTAN ON STATISTICS
The production proportion of enterprises with foreign investments in
output volume of regions
Industrial production of regions
In the structure of total industrial output, the largest share falls on Tashkent
region (16.1% of total industry), Tashkent city (15.4%), Navoi (13.4%), Andijan
(10.3%), Kashkadarya (6.6%) and Fergana (6.3%) regions.

Industrial production of the Republic of Uzbekistan in January-April 2019 14
THE STATE COMMITTEE OF THE REPUBLIC OF UZBEKISTAN ON STATISTICS
Industrial production index by regions in January-April 2019, % compared to January-April of 2018
The consistent implementation of measures to increase the industrial
potential of regions contributed to a significant increase of industrial production
in Andijan (116.9% compared to January-April 2018), Khorezm (112.3%),
Samarkand (112.0%), Tashkent (109.0%), Namangan (107.2%) and Fergana
(106.4%) regions.
At the same time, there was a significant increase in production of
consumer goods in Andijan (147.7% by January-April 2018), Khorezm
(121.7%), Syrdarya (113.4%), Namangan (110.6%), Fergana (109,4%),
Surkhandarya (107.8%) regions and the Republic of Karakalpakstan (108.7%).
At the same time, it should be noted that the largest share of consumer
goods was produced in Andijan region (25.9% of total consumer goods),
Tashkent city (23.4%), Tashkent (8.1%) and Samarkand (7.8%) regions.

Industrial production of the Republic of Uzbekistan in January-April 2019 15
THE STATE COMMITTEE OF THE REPUBLIC OF UZBEKISTAN ON STATISTICS
Production growth of consumer goods by region in January-April 2019, % compared to January-April 2018
Analysis of the differentiation of industrial output per capita showed an
excess of the national average level (2842.5 thousand soums) in Navoi region
(12925.7 thousand soums), Tashkent city (5788.9 thousand soums), Tashkent
(5264.7 thousand soums) and Andijan (3182.6 thousand soums) regions.
Consumer goods production per capita in the reporting period amounted
to 888.0 thousand soums, including Andijan region - 2490.8 thousand soums,
Tashkent city - 2751.7 thousand soums, Navoi region - 847.5 thousand soums,
Syrdarya region - 841.3 thousand soums, Tashkent region - 827.1 thousand
soums and Khorezm region - 798.5 thousand soums.

Industrial production of the Republic of Uzbekistan in January-April 2019 16
THE STATE COMMITTEE OF THE REPUBLIC OF UZBEKISTAN ON STATISTICS
Industrial production and consumer goods per capita by regions in January-April 2019, % compared to January-April 2018
The contribution of small business in industrial production
During the reporting period, small businesses produced goods to 27.7
trillion soums.
The share of small business in total production amounted to 29.2%.

Industrial production of the Republic of Uzbekistan in January-April 2019 17
THE STATE COMMITTEE OF THE REPUBLIC OF UZBEKISTAN ON STATISTICS
In terms of regions, the largest share of small business was observed in
Namangan (65.5% of total industry of region), Tashkent city (65.3%), Jizzakh
(54.7%), Surkhandarya (46.9%), Samarkand (46.4%), Syrdarya (39.2%) and
Fergana (36.9%) regions.
At the same time, the smallest share of small business in regions was
noted in Navoi (10.7%) and Kashkadarya (16.6%) regions, the Republic
of Karakalpakstan (18.8%), as well as in Andijan (19.3%) and Tashkent
(21.8%) regions.
The share of large and small businesses in the volume of industrial
production of the regions, %
Industrial production of the Republic of Uzbekistan in January-April 2019 18
THE STATE COMMITTEE OF THE REPUBLIC OF UZBEKISTAN ON STATISTICS
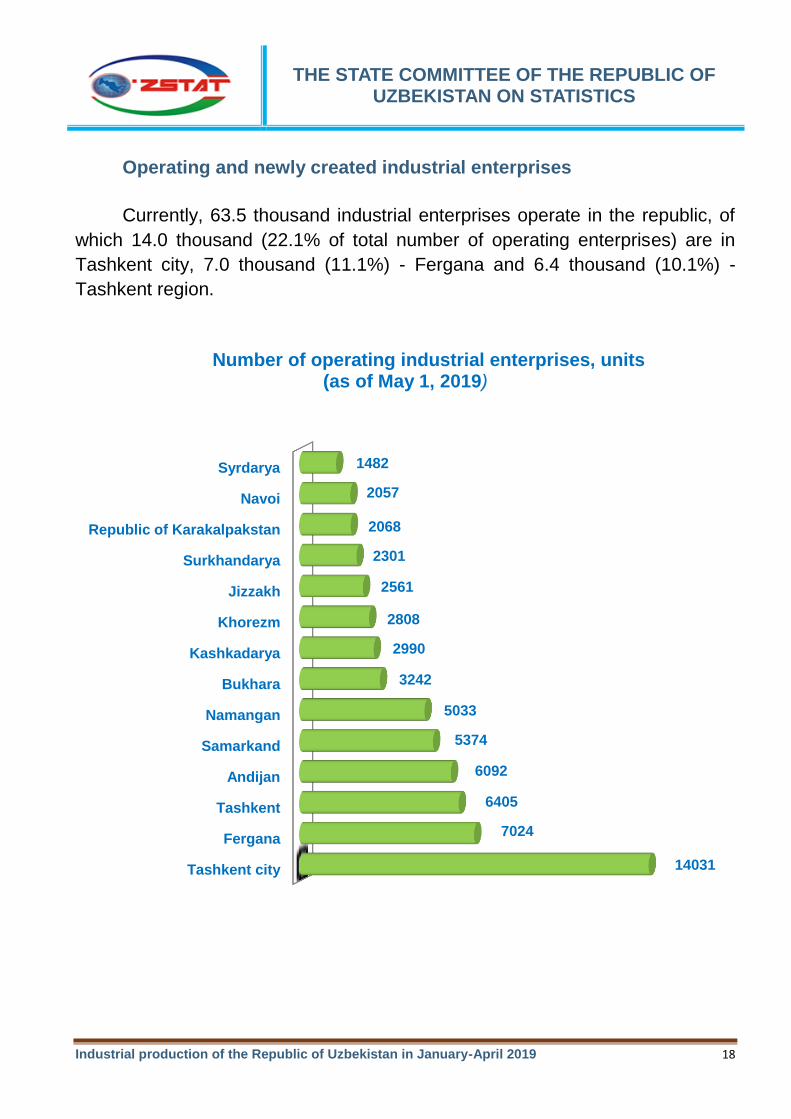
Operating and newly created industrial enterprises
Currently, 63.5 thousand industrial enterprises operate in the republic, of
which 14.0 thousand (22.1% of total number of operating enterprises) are in
Tashkent city, 7.0 thousand (11.1%) - Fergana and 6.4 thousand (10.1%) -
Tashkent region.
Number of operating industrial enterprises, units
(as of May 1, 2019)
Tashkent city
Fergana
Tashkent
Andijan
Samarkand
Namangan
Bukhara
Kashkadarya
Khorezm
Jizzakh
Surkhandarya
Republic of Karakalpakstan
Navoi
Syrdarya
14031
7024
6405
6092
5374
5033
3242
2990
2808
2561
2301
2068
2057
1482

Industrial production of the Republic of Uzbekistan in January-April 2019 19
THE STATE COMMITTEE OF THE REPUBLIC OF UZBEKISTAN ON STATISTICS
In January-April 2019, 8706 industrial enterprises were re-established in
the republic, of which 51.4% fall on Tashkent city, Bukhara, Tashkent,
Samarkand and Fergana regions.
The number of newly created industrial enterprises, units (in January-April 2019)
Department of industrial statistics
Теl: 71-230-80-46
Tashkent city
Samarkand
Fergana
Tashkent
Namangan
Bukhara
Andijan
Kashkadarya
Khorezm
Surkhandarya
Jizzakh
Republic of Karakalpakstan
Navoi
Syrdarya
1179
924
865
820
778
684
610
555
524
465
369
349
348
236