industrial flow meters: when is accuracy important - … webinar... · industrial flow meters: when...
TRANSCRIPT
ALDENSolving Flow Problems Since 1894
Industrial Flow Meters: When is Accuracy Important
Alden Webinar Series
March 10, 2009
For Audio, Please dial 1-866-809 5996 on your phone
and use participant code 6504656
ALDENSolving Flow Problems Since 1894
Housekeeping Items
• Audio system and muted phones
• Asking questions
• Availability of slides
• Webinar recording
For Audio, Please dial 1-866-809 5996 on your phone
and use participant code 6504656
ALDENSolving Flow Problems Since 1894
Agenda
• Introduction
• Flow meter types and when to calibrate– Richard Wakeland, Fluidic Techniques
• How calibration and accuracy affect the power industry– W. Cary Campbell, Southern Company
• Process industry perspective: a case study on steam delivery– Zach Hennig, Air Liquide
• How calibration works– Phil Stacy, Alden Lab
ALDENSolving Flow Problems Since 1894
Introduction
• Current economic conditions
– Make calibration of some meters more important than ever
– Highlight the importance of deciding when not to calibrate
• The importance of industrial flow meters
– Plant efficiency
– Plant safety
• Case in point: Feedwater in nuclear power plants
ALDENSolving Flow Problems Since 1894
Example: Nuclear Safety
• Courtesy of Dr. John Bickel, Talisman International
• Secondary side ΔT calorimetric Power is used to calibrate reactor power
• If feedwater flow instruments become inaccurate over time, the reactor power determination will also be inaccurate – Some plants have unwittingly operated at power levels above what
the license allows
– Large allowances can be made for flow inaccuracies • Corresponds to lost revenue for the plant
• Reference:• License Event Report (LER) Accession #8908310139, 1988
ALDENSolving Flow Problems Since 1894
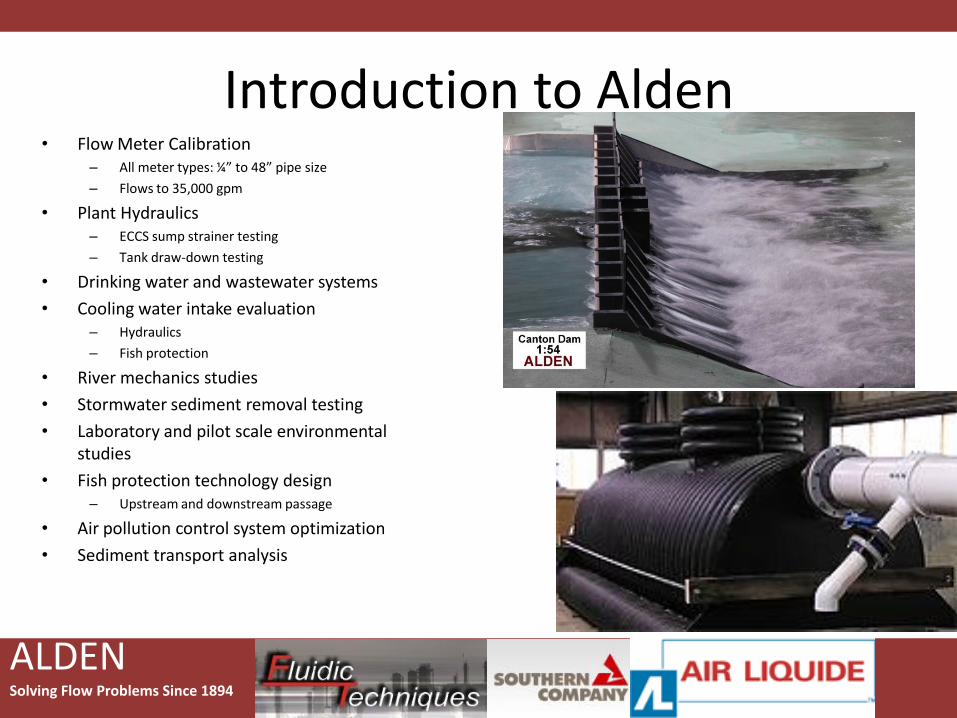
Introduction to Alden• Flow Meter Calibration
– All meter types: ¼” to 48” pipe size
– Flows to 35,000 gpm
• Plant Hydraulics– ECCS sump strainer testing
– Tank draw-down testing
• Drinking water and wastewater systems
• Cooling water intake evaluation– Hydraulics
– Fish protection
• River mechanics studies
• Stormwater sediment removal testing
• Laboratory and pilot scale environmental studies
• Fish protection technology design– Upstream and downstream passage
• Air pollution control system optimization
• Sediment transport analysis
ALDENSolving Flow Problems Since 1894
Flow Measurement1. Background2. Flow Meter Types3. When to Calibrate
By Richard Wakeland, Chief Engineer
ALDENSolving Flow Problems Since 1894
Flow Measurement Applications
• Power Plants
• Refinery
• Chemical
• Gas Production and Transmission
• Others
ALDENSolving Flow Problems Since 1894
Flowmeter Considerations
• Line (Pipe) Size
• Type of Fluid
• Fluid State – Gas, Liquid, Vapor
• Meter Range
• Desired Accuracy / Repeatability
• Piping Configuration
• Costs – initial, installation, and operating
ALDENSolving Flow Problems Since 1894
Flow Meter Types
1. Differential Producers
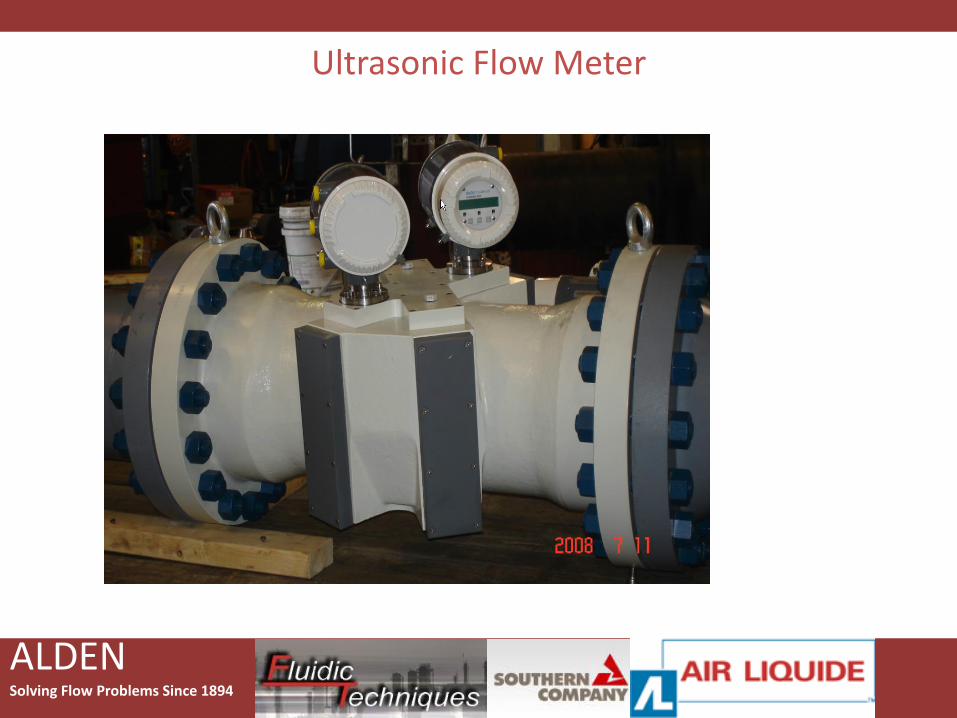
2. Ultrasonic
3. Insertion Pitot Devices
4. Coriolis
5. Others
ALDENSolving Flow Problems Since 1894
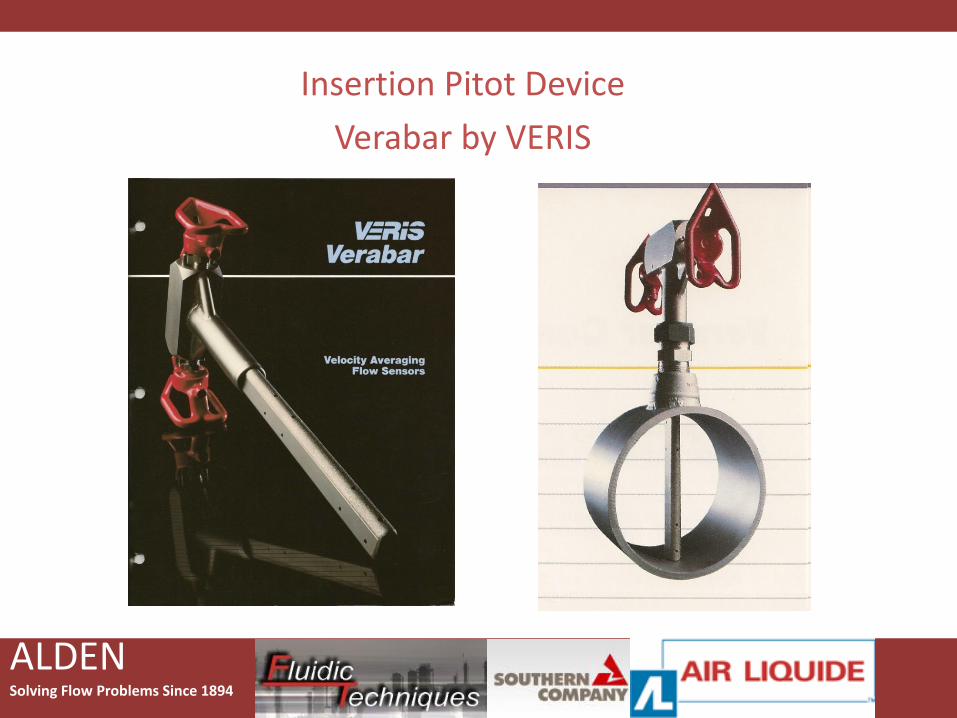
Insertion Pitot Device
Verabar by VERIS
ALDENSolving Flow Problems Since 1894
Differential Producing Primary Flow Elements
1. The largest market share for Nominal Pipe Sizes, NPS, 3” and larger
2. A well established performance recordProven Technology – Long history of usage
3. Differential Producers are typically only being replaced
by other technologies because of poor performance in the
specific application
Simple by design – Durable
Accuracy
Economical
Wide range of applications
ALDENSolving Flow Problems Since 1894
Differential Producing Primary Flow Elements
Orifice Plates
Flow Nozzles
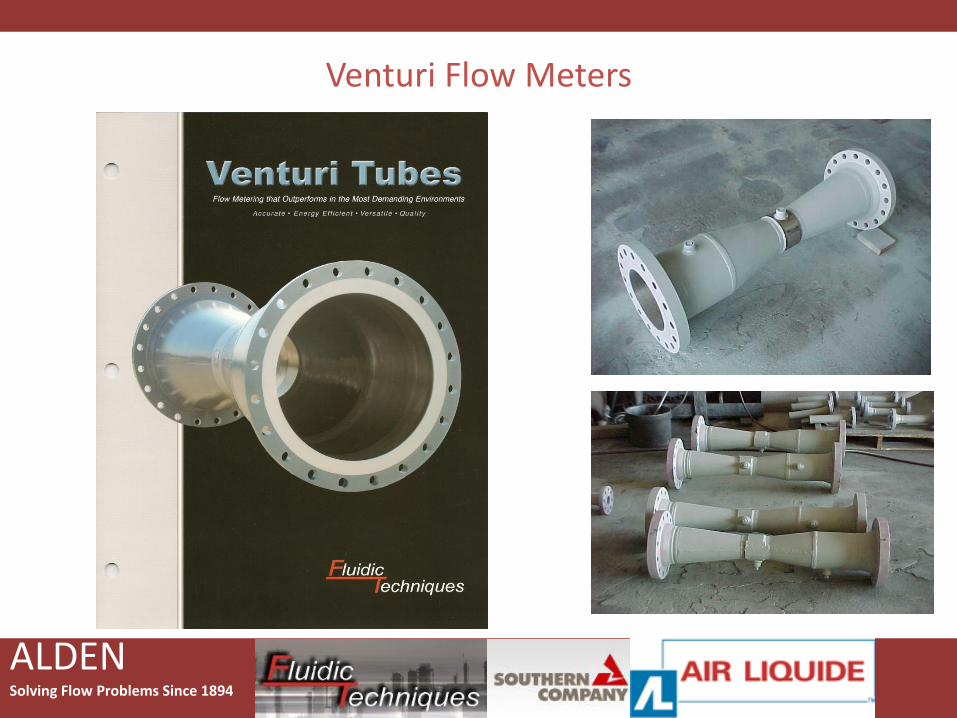
Venturi Flow Meters
Proprietary Devices
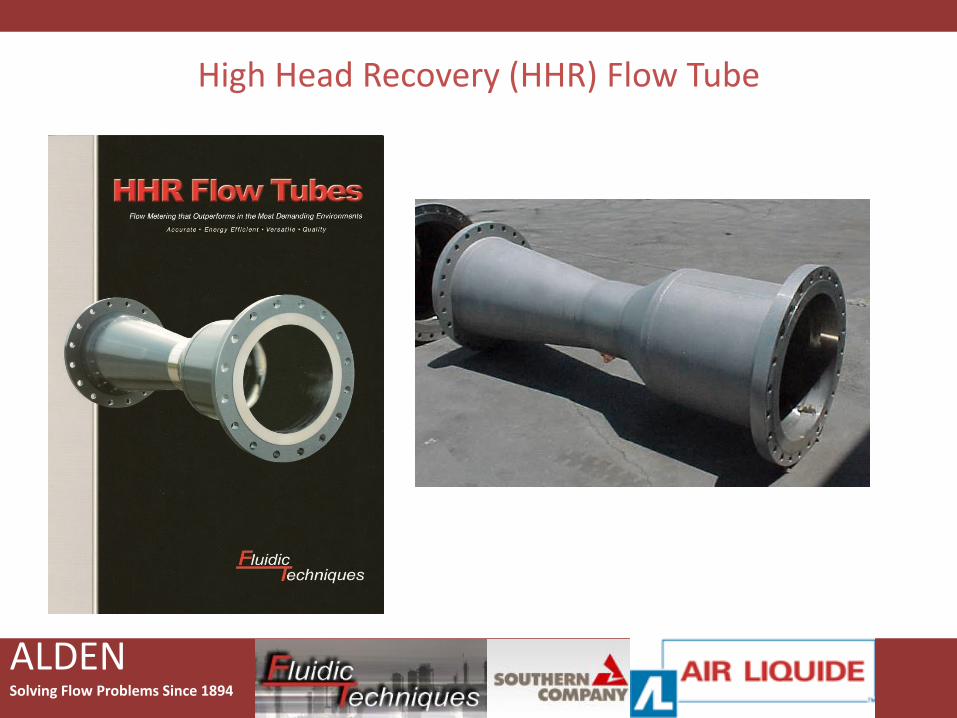
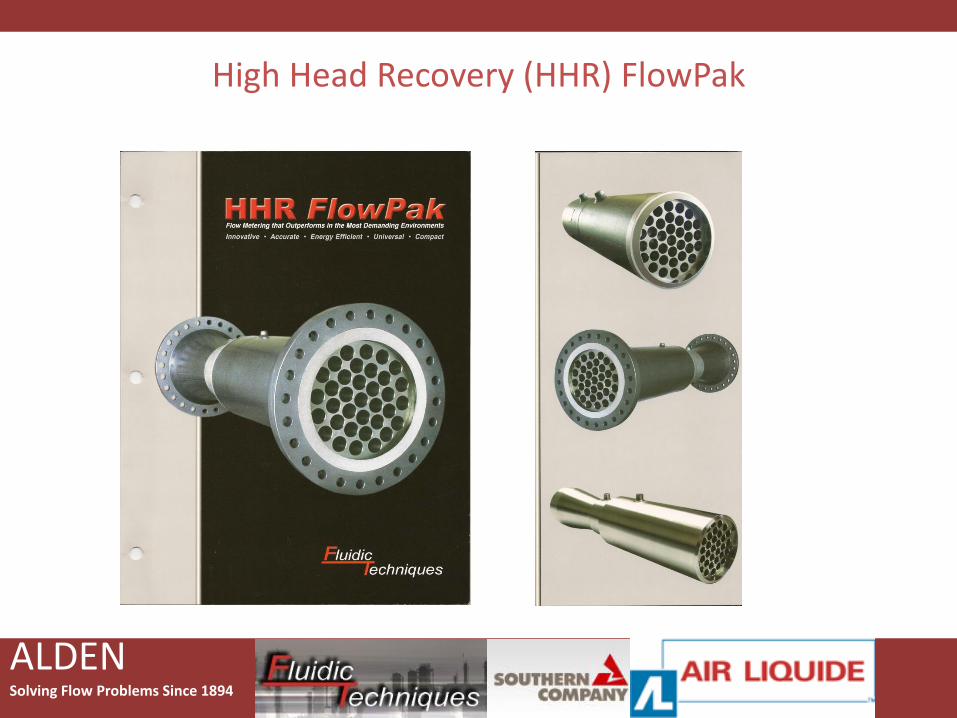
HHR FlowPak
High Head Recovery (HHR) Flow Tube
ALDENSolving Flow Problems Since 1894
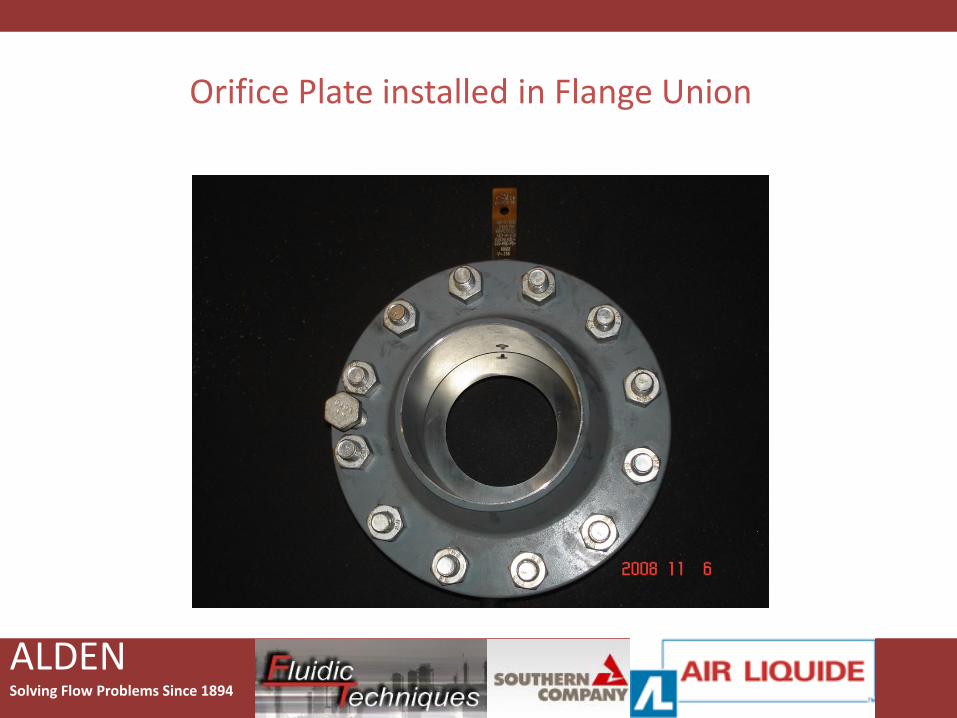
Orifice Plate installed in Flange Union
ALDENSolving Flow Problems Since 1894
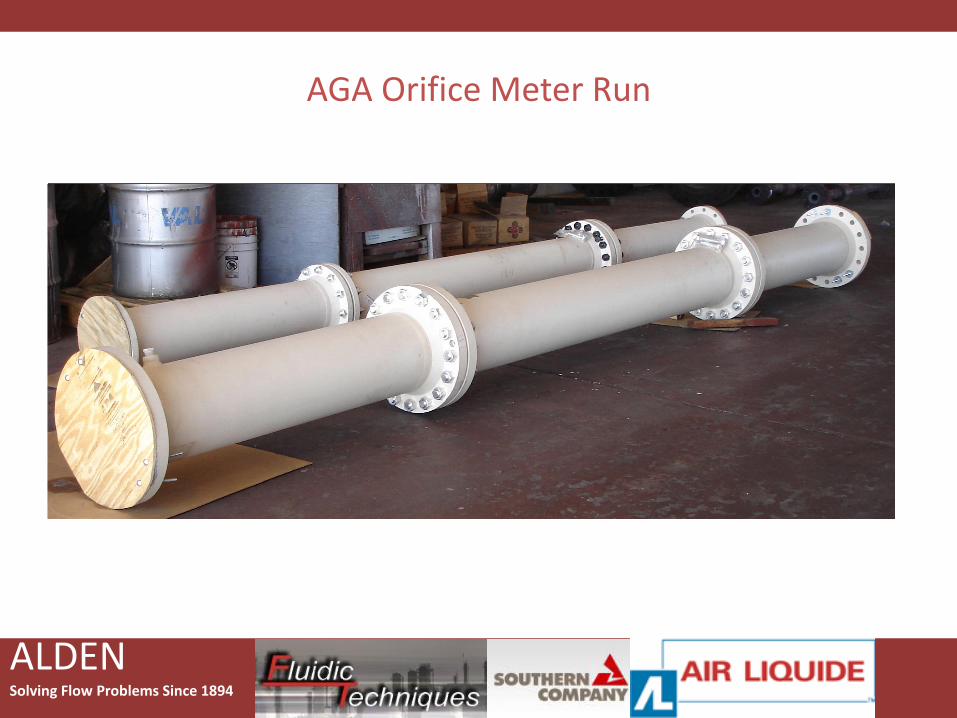
AGA Orifice Meter Run
AGA Meter RunsAGA Meter Runs
ALDENSolving Flow Problems Since 1894
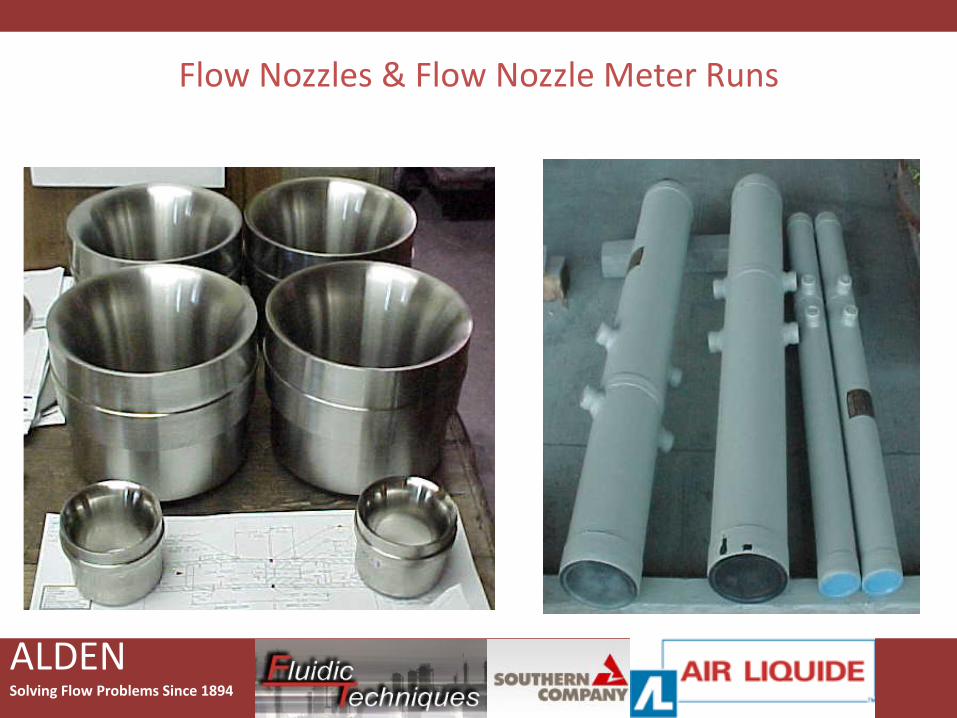
Flow Nozzles & Flow Nozzle Meter Runs
ASME WELD INASME WELD IN
FLOW NOZZLESFLOW NOZZLES
ALDENSolving Flow Problems Since 1894
High Head Recovery (HHR) Flow Tube
ALDENSolving Flow Problems Since 1894
High Head Recovery (HHR) FlowPak
ALDENSolving Flow Problems Since 1894
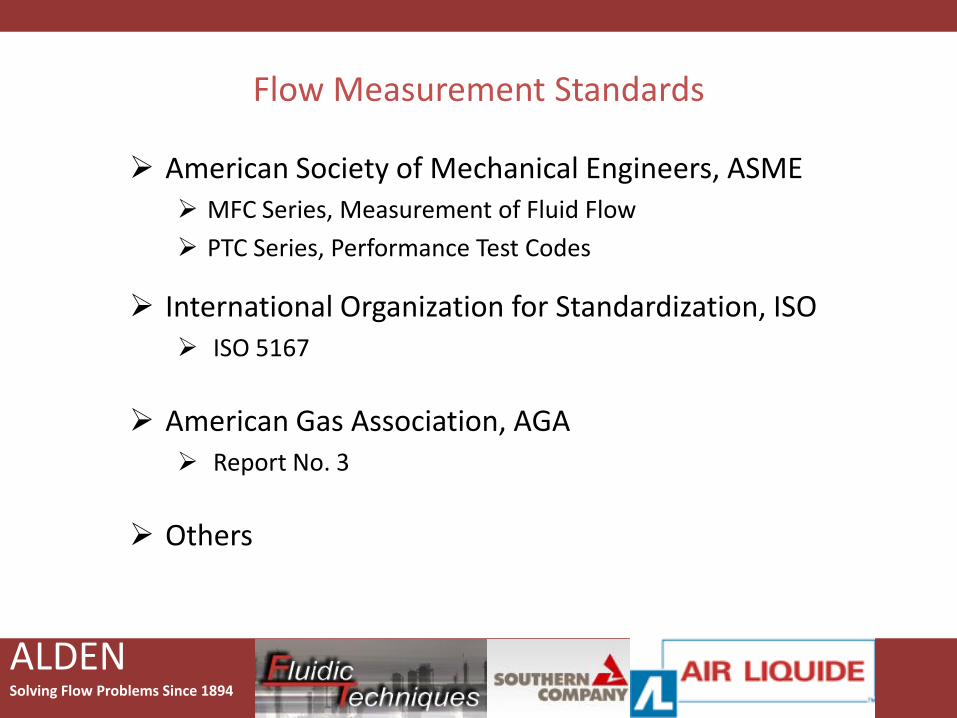
American Society of Mechanical Engineers, ASME MFC Series, Measurement of Fluid Flow
PTC Series, Performance Test Codes
Flow Measurement Standards
International Organization for Standardization, ISO ISO 5167
American Gas Association, AGA Report No. 3
Others
ALDENSolving Flow Problems Since 1894
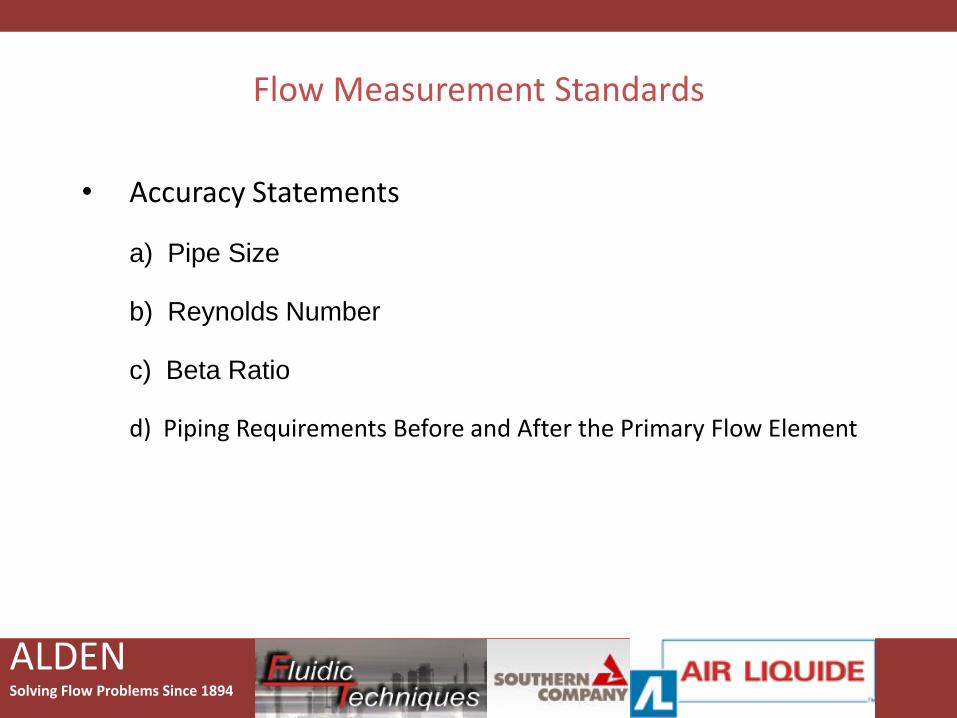
Flow Measurement Standards
• Accuracy Statements
a) Pipe Size
b) Reynolds Number
c) Beta Ratio
d) Piping Requirements Before and After the Primary Flow Element
ALDENSolving Flow Problems Since 1894
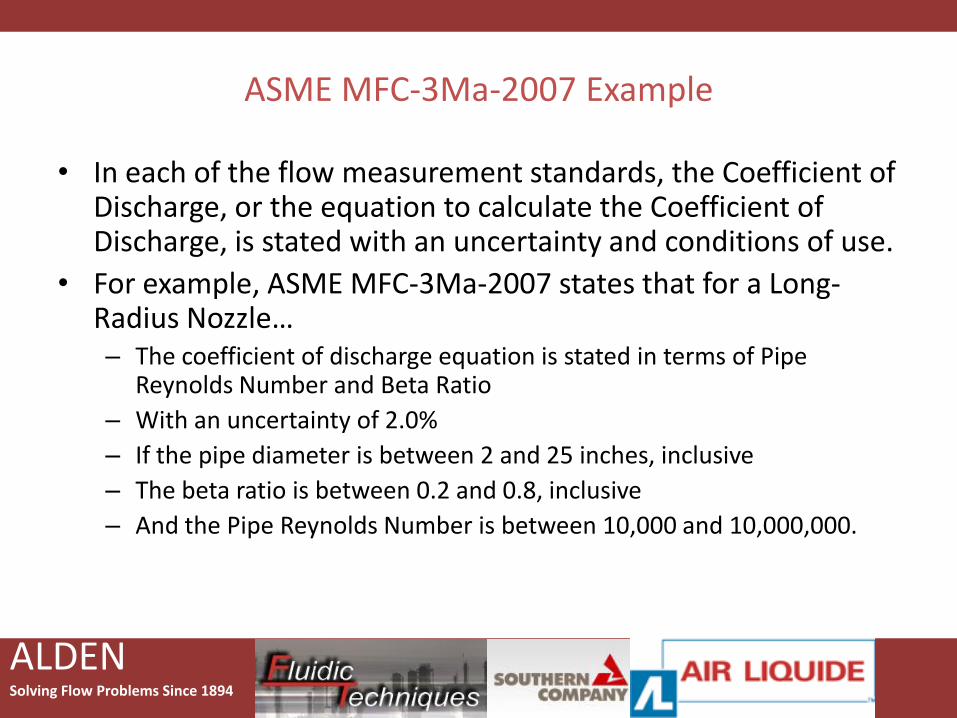
ASME MFC-3Ma-2007 Example
• In each of the flow measurement standards, the Coefficient of Discharge, or the equation to calculate the Coefficient of Discharge, is stated with an uncertainty and conditions of use.
• For example, ASME MFC-3Ma-2007 states that for a Long-Radius Nozzle…– The coefficient of discharge equation is stated in terms of Pipe
Reynolds Number and Beta Ratio
– With an uncertainty of 2.0%
– If the pipe diameter is between 2 and 25 inches, inclusive
– The beta ratio is between 0.2 and 0.8, inclusive
– And the Pipe Reynolds Number is between 10,000 and 10,000,000.
ALDENSolving Flow Problems Since 1894
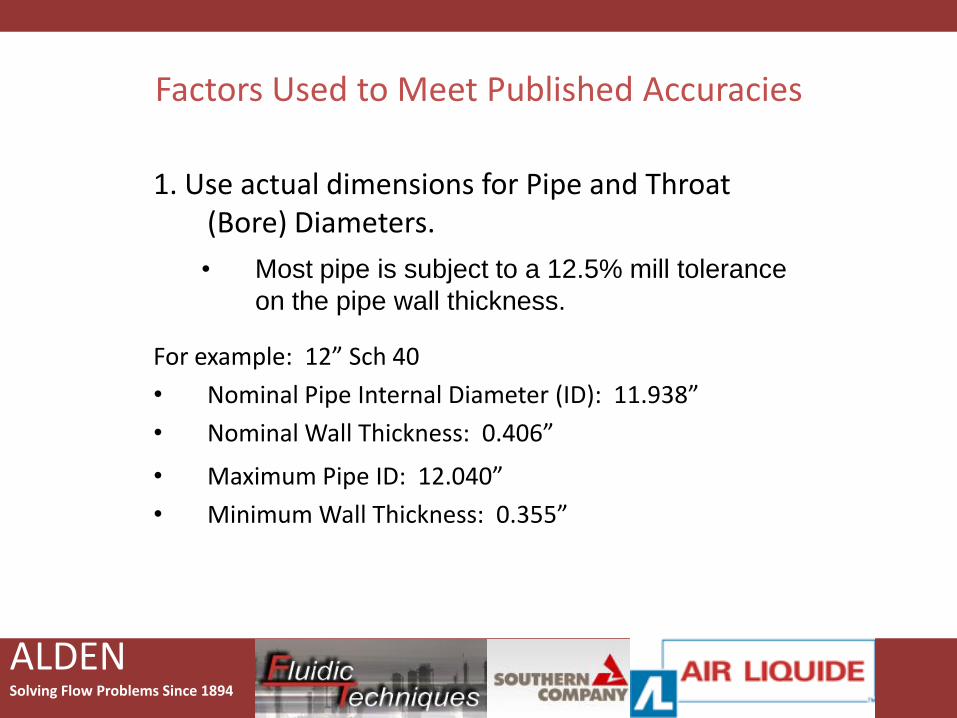
Factors Used to Meet Published Accuracies
1. Use actual dimensions for Pipe and Throat (Bore) Diameters.
• Most pipe is subject to a 12.5% mill tolerance
on the pipe wall thickness.
For example: 12” Sch 40
• Nominal Pipe Internal Diameter (ID): 11.938”
• Nominal Wall Thickness: 0.406”
• Maximum Pipe ID: 12.040”
• Minimum Wall Thickness: 0.355”
ALDENSolving Flow Problems Since 1894
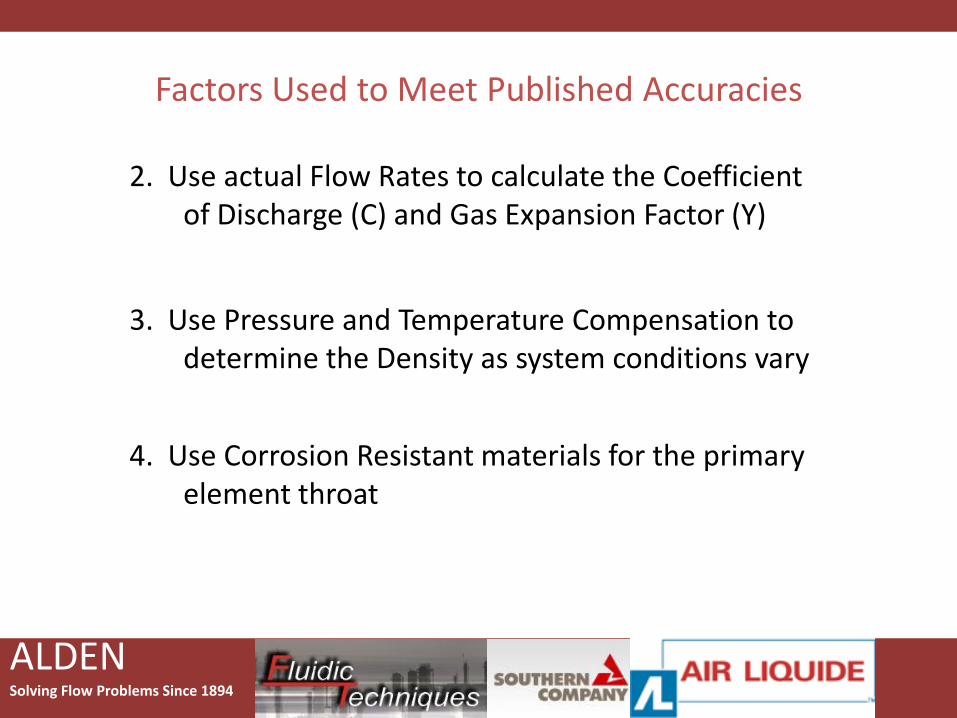
Factors Used to Meet Published Accuracies
2. Use actual Flow Rates to calculate the Coefficient of Discharge (C) and Gas Expansion Factor (Y)
3. Use Pressure and Temperature Compensation to determine the Density as system conditions vary
4. Use Corrosion Resistant materials for the primary element throat
ALDENSolving Flow Problems Since 1894
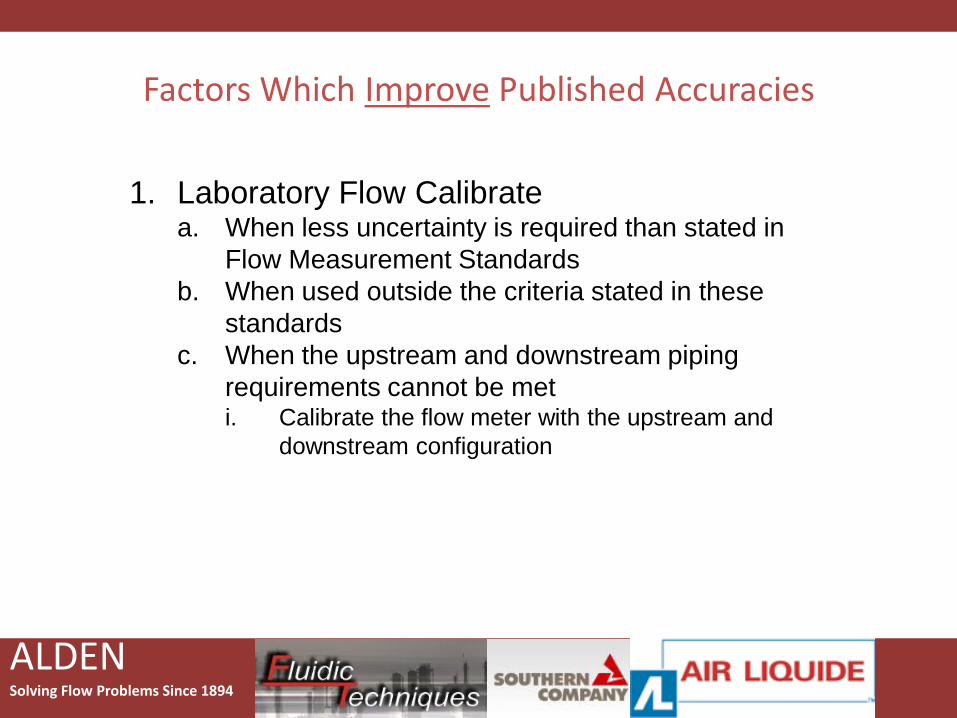
Factors Which Improve Published Accuracies
1. Laboratory Flow Calibratea. When less uncertainty is required than stated in
Flow Measurement Standards
b. When used outside the criteria stated in these
standards
c. When the upstream and downstream piping
requirements cannot be meti. Calibrate the flow meter with the upstream and
downstream configuration
ALDENSolving Flow Problems Since 1894
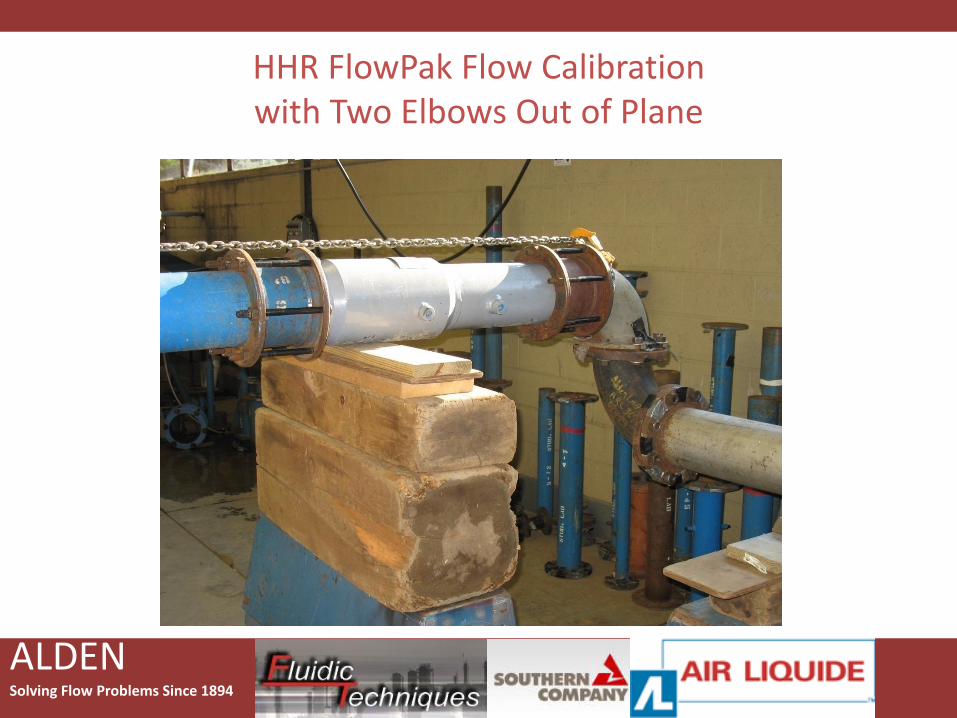
HHR FlowPak Flow Calibrationwith Two Elbows Out of Plane
ALDENSolving Flow Problems Since 1894
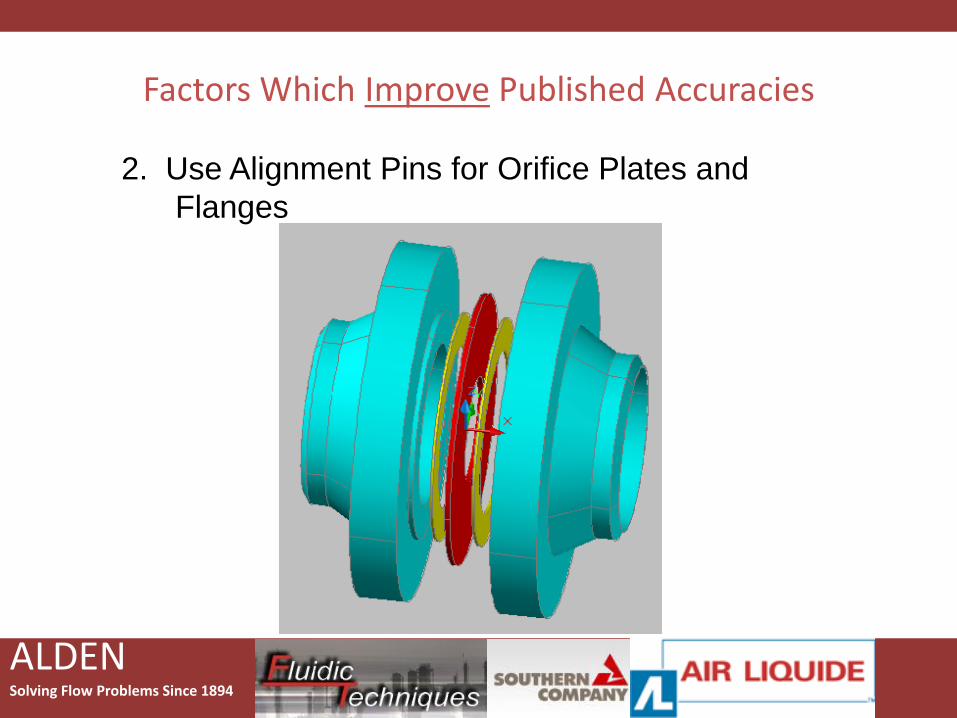
Factors Which Improve Published Accuracies
2. Use Alignment Pins for Orifice Plates and
Flanges
ALDENSolving Flow Problems Since 1894
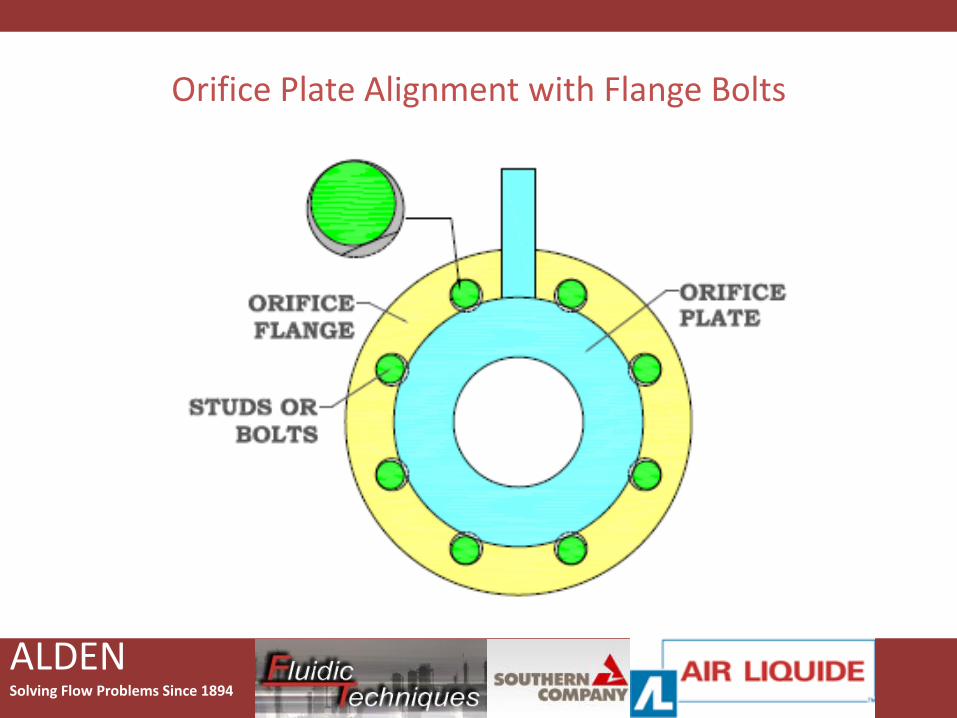
Orifice Plate Alignment with Flange Bolts
ALDENSolving Flow Problems Since 1894
Factors Which Improve Published Accuracies
3. Know your Manufacturer
• Design and manufacturing methods may produce better accuracy
• In some cases, different methods of design and manufacture may be implemented for laboratory flow calibrated meters and those which are not flow calibrated parts.
ALDENSolving Flow Problems Since 1894
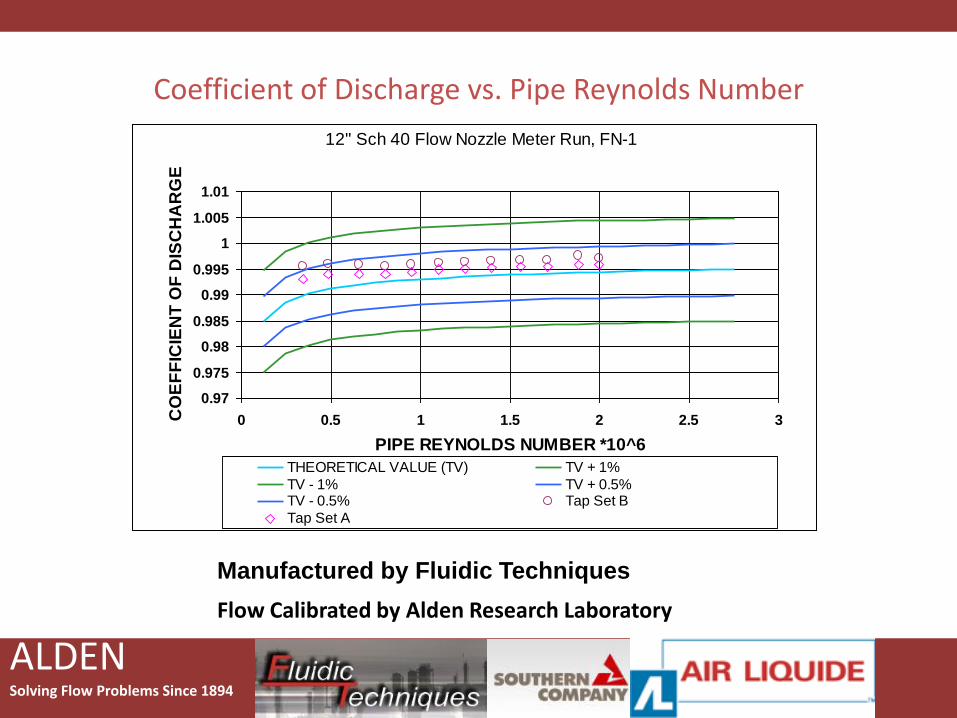
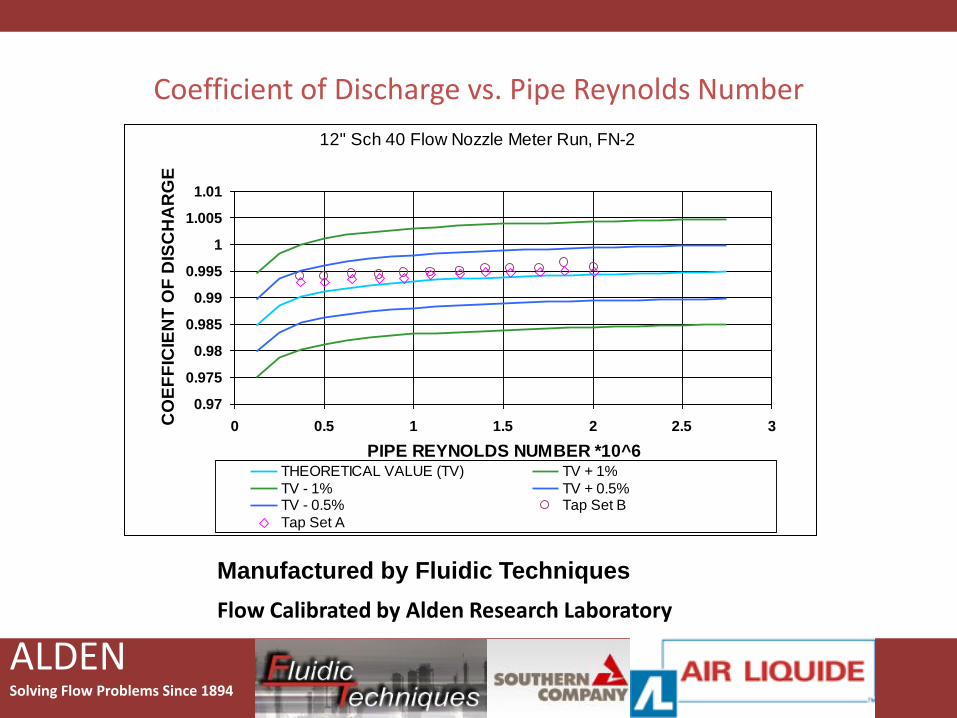
Coefficient of Discharge vs. Pipe Reynolds Number
Flow Calibrated by Alden Research Laboratory
12" Sch 40 Flow Nozzle Meter Run, FN-1
0.97
0.975
0.98
0.985
0.99
0.995
1
1.005
1.01
0 0.5 1 1.5 2 2.5 3
PIPE REYNOLDS NUMBER *10^6
CO
EF
FIC
IEN
T O
F D
ISC
HA
RG
E
THEORETICAL VALUE (TV) TV + 1%
TV - 1% TV + 0.5%TV - 0.5% Tap Set B
Tap Set A
Manufactured by Fluidic Techniques
ALDENSolving Flow Problems Since 1894
Coefficient of Discharge vs. Pipe Reynolds Number
Flow Calibrated by Alden Research Laboratory
Manufactured by Fluidic Techniques
12" Sch 40 Flow Nozzle Meter Run, FN-2
0.97
0.975
0.98
0.985
0.99
0.995
1
1.005
1.01
0 0.5 1 1.5 2 2.5 3
PIPE REYNOLDS NUMBER *10^6
CO
EF
FIC
IEN
T O
F D
ISC
HA
RG
E
THEORETICAL VALUE (TV) TV + 1%
TV - 1% TV + 0.5%TV - 0.5% Tap Set B
Tap Set A

ALDENSolving Flow Problems Since 1894
Case Study 12” Sch 40 Flow Nozzle Meter Run
• Sizing Parameters– Fluid: Steam
– Nominal Pipe ID: 11.938 Inches
– Maximum Flow Rate: 74000 Pounds Per Hour (lb/h)
– Normal Flow Rate: 51800 lb/h
– Maximum Differential Pressure: 250 inches of Water Column (in WC)
– Pressure: 90.00 PSIG
– Temperature: 643°F
– C: 0.99346, calculated @ Normal Flow Rate
– Y: 0.973554, calculated @ Normal Flow Rate

ALDENSolving Flow Problems Since 1894
• Calculating the maximum flow rate (Wm) @ the maximum differential pressure (dPm)– C = 0.994072
– Y = 0.945606
Case Study 12” Sch 40 Flow Nozzle Meter Run
– Wm = 71920 lb/h
– % Error = 2.81
ALDENSolving Flow Problems Since 1894
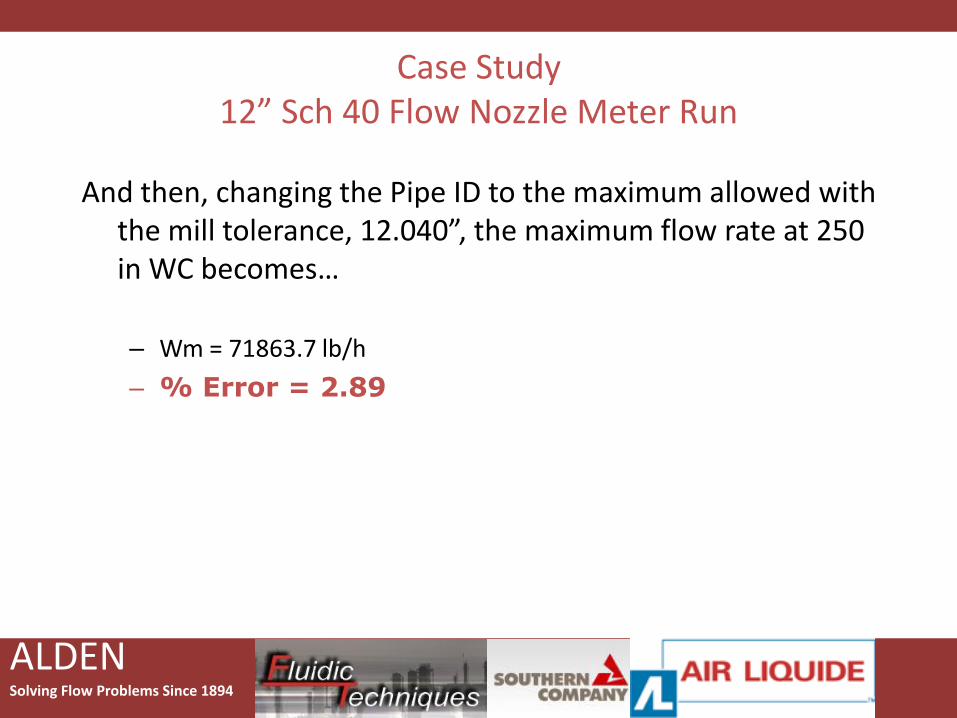
And then, changing the Pipe ID to the maximum allowed with the mill tolerance, 12.040”, the maximum flow rate at 250 in WC becomes…
Case Study 12” Sch 40 Flow Nozzle Meter Run
– Wm = 71863.7 lb/h
– % Error = 2.89
ALDENSolving Flow Problems Since 1894
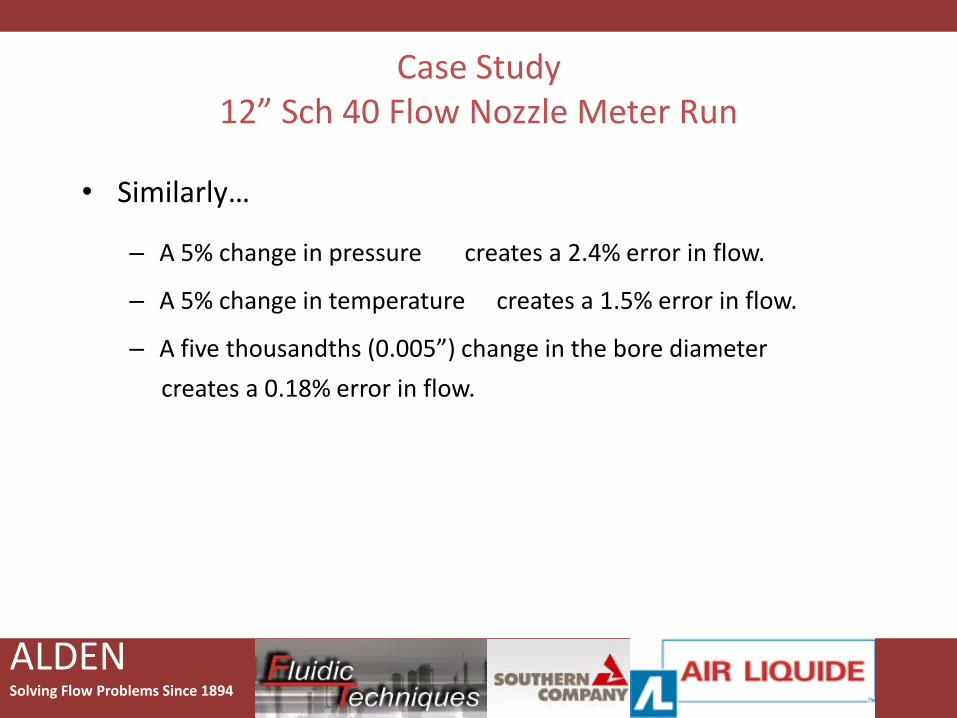
• Similarly…
Case Study 12” Sch 40 Flow Nozzle Meter Run
– A 5% change in pressure
– A 5% change in temperature
– A five thousandths (0.005”) change in the bore diameter
creates a 2.4% error in flow.
creates a 1.5% error in flow.
creates a 0.18% error in flow.
ALDENSolving Flow Problems Since 1894
SUMMARY
• Using a flow element which has not been correctly designed, manufactured and installed for the appropriate application is like expecting a performance car to meet expectations with no maintenance, improperly inflated tires and low octane fuel.
Fluidic Techniques – The Source for Precision Primary Flow
Elements
www.fluidictechniques.com
When Performance Counts…
ALDENSolving Flow Problems Since 1894
Benefits of Calibrating Flow Meters Used in Electrical Generating Plants
W. Cary Campbell, P.E.Southern Company Services, Inc.
42 Inverness Center Pkwy., Bin B418Birmingham, AL 35242
March 10, 2009
ALDENSolving Flow Problems Since 1894
Typical Applications of Fluid Flow Meters in an Electric Power Generating Plant
• Condensate Flow (Low Temperature and Pressure)
• Boiler Feedwater Flows (High Temperature and Pressure)
• HP, IP & LP Steam Flows
• Desuperheating Flows
• Natural gas Flow
• Fuel Oil Flow
• Circulating Water Flow
• Reactor Power Calculations
ALDENSolving Flow Problems Since 1894
Sources of Flow Meter Uncertainty
1. Flow Measurement Technique
2. Meter Design and Manufacture
3. Variations in Surface Roughness from Std. Equations
4. Dimensional Errors
5. Installation and Orientation Effects
6. Upstream Flow Disturbances
7. Change in Meter Condition (Fouling or Damage)
Note: Discharge Coefficient only corrects for Items 1-4
ALDENSolving Flow Problems Since 1894
Reasons to Calibrate Flow Meters
• May be Required by ASME Performance Test Codes
• Verify Meter was Manufactured Properly
• Confirm Expected Meter Characteristics
• Determine and Document Actual Characteristics
• Establish Trends for Interpolation or Extrapolation
• Determine Effect of Fouling, Cleaning, or Damage
• Reduce Uncertainty of Flow Measurements
• Reduce Uncertainty of Overall Test Results

ALDENSolving Flow Problems Since 1894
Example Calibration of an AGA Report 3 Natural Gas Flow Orifice Meter Tube
Goatrock 1 GTA
Comb. Turbine Gas Flow Orifice (Flange Taps)
Calibration Data
0.5960
0.5980
0.6000
0.6020
0.6040
0.6060
0.6080
0.6100
0.6120
0 1 2 3 4 5 6 7
Reynolds Number (x 10^6)
Dis
cha
rge
Co
effi
cien
t
Calibration Data
Extrapolated Calibration
Upper 95%
Lower 95%
ASME MFC-3M-1989
Normal Flow
Maximum Flow
C = 0.598462+112.68981*Re^(-.75)
Difference is suspected to be due to pipe surface roughness (Stainless vs. Carbon Steel)
ALDENSolving Flow Problems Since 1894
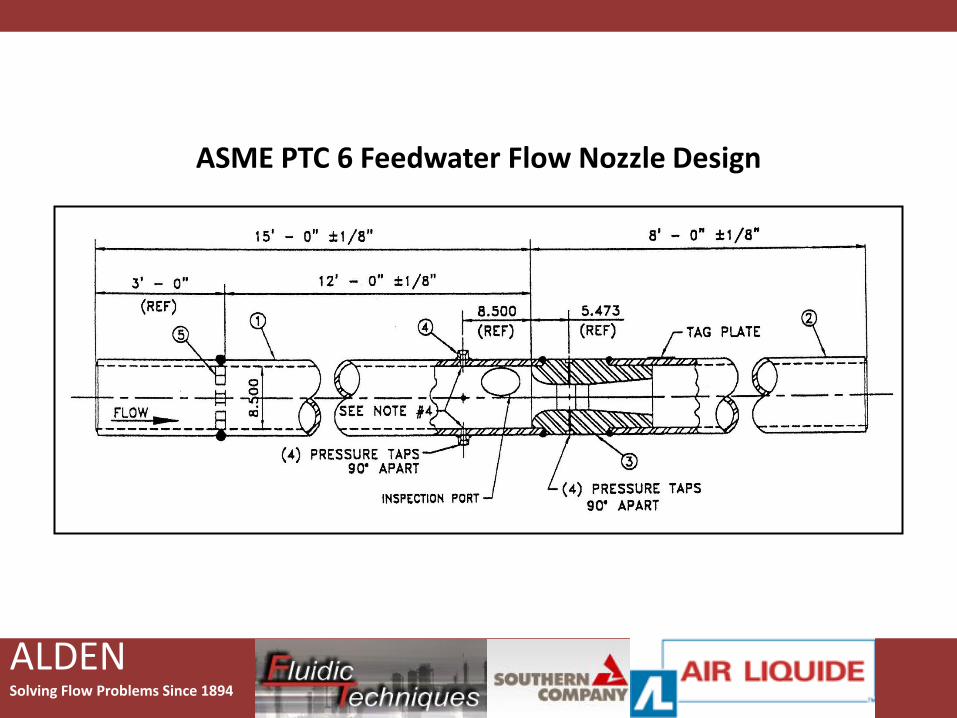
ASME PTC 6 Feedwater Flow Nozzle Design
ALDENSolving Flow Problems Since 1894
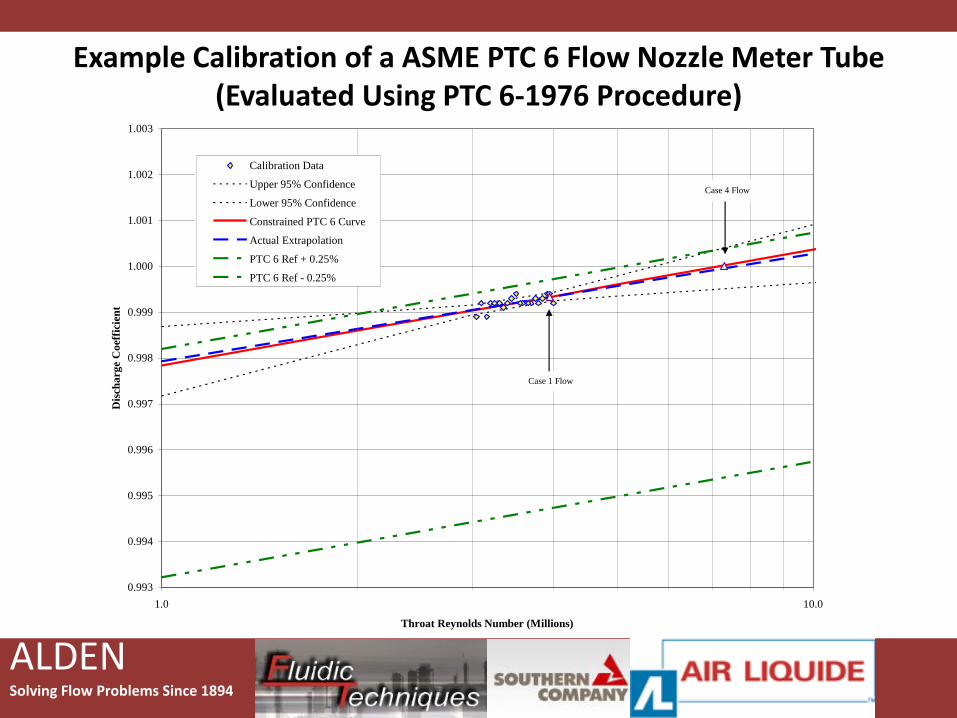
Example Calibration of a ASME PTC 6 Flow Nozzle Meter Tube (Evaluated Using PTC 6-1976 Procedure)
0.993
0.994
0.995
0.996
0.997
0.998
0.999
1.000
1.001
1.002
1.003
1.0 10.0
Throat Reynolds Number (Millions)
Dis
cha
rge
Co
effi
cien
t
Calibration Data
Upper 95% Confidence
Lower 95% Confidence
Constrained PTC 6 Curve
Actual Extrapolation
PTC 6 Ref + 0.25%
PTC 6 Ref - 0.25%
Case 1 Flow
Case 4 Flow
ALDENSolving Flow Problems Since 1894
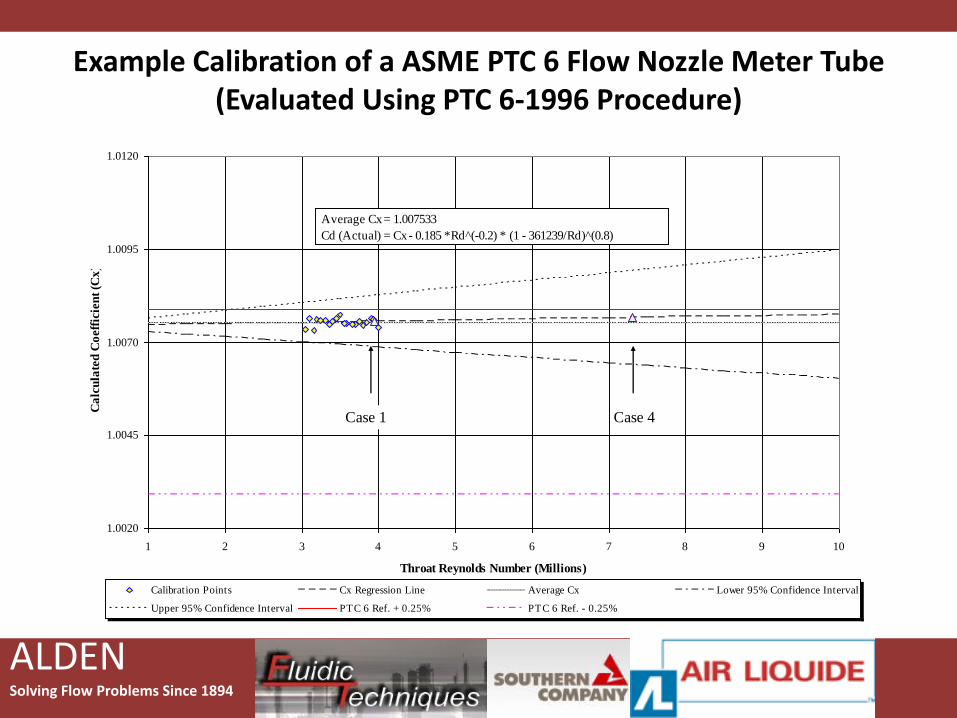
Example Calibration of a ASME PTC 6 Flow Nozzle Meter Tube (Evaluated Using PTC 6-1996 Procedure)
1.0020
1.0045
1.0070
1.0095
1.0120
1 2 3 4 5 6 7 8 9 10
Throat Reynolds Number (Millions)
Ca
lcu
late
d C
oeff
icie
nt
(Cx
)
Calibration Points Cx Regression Line Average Cx Lower 95% Confidence Interval
Upper 95% Confidence Interval PTC 6 Ref. + 0.25% PTC 6 Ref. - 0.25%
Average Cx = 1.007533
Cd (Actual) = Cx - 0.185 *Rd^(-0.2) * (1 - 361239/Rd)^(0.8)
Case 1 Case 4
ALDENSolving Flow Problems Since 1894
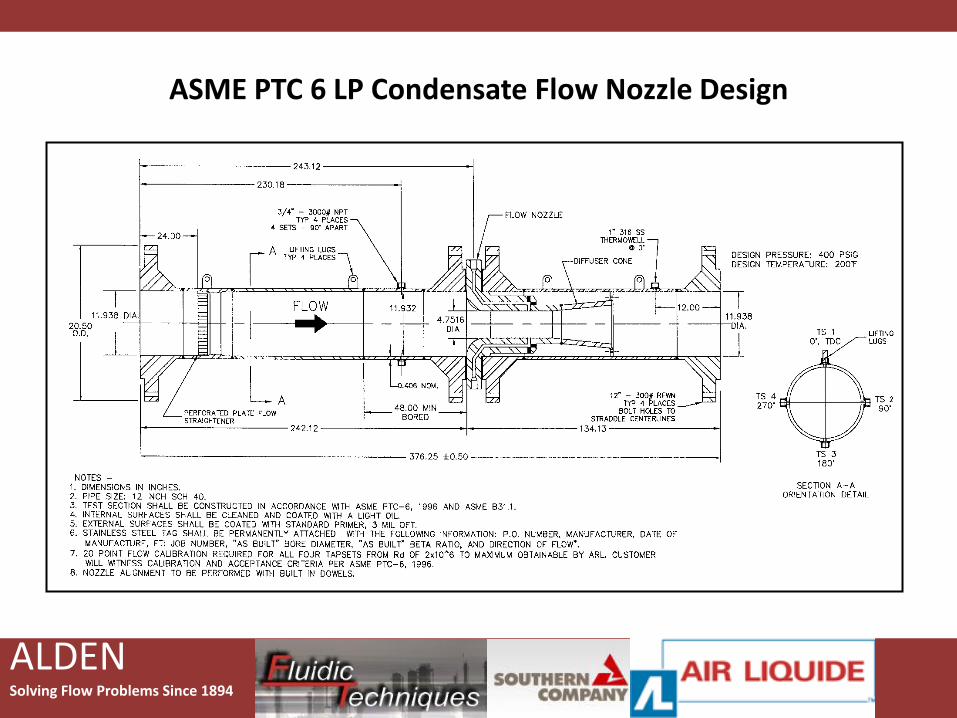
ASME PTC 6 LP Condensate Flow Nozzle Design
ALDENSolving Flow Problems Since 1894
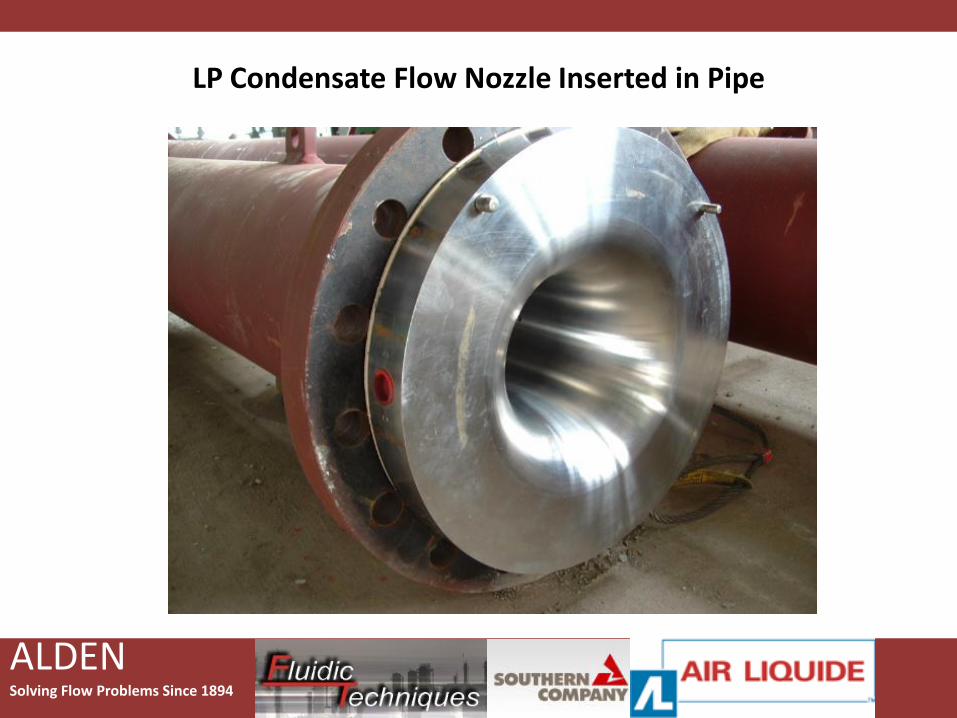
LP Condensate Flow Nozzle Inserted in Pipe
ALDENSolving Flow Problems Since 1894
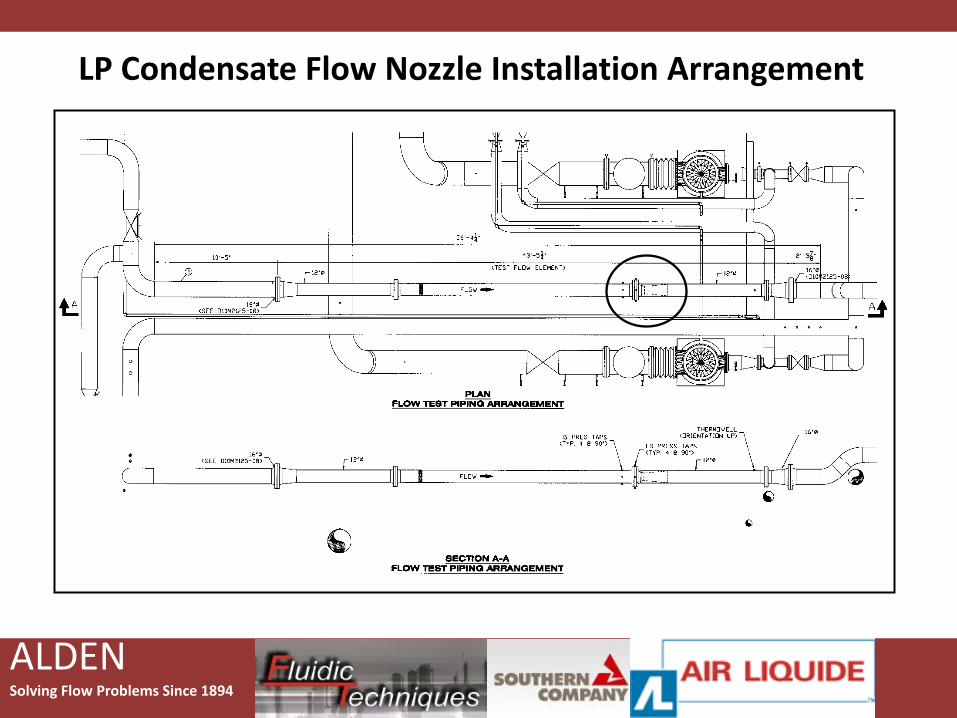
LP Condensate Flow Nozzle Installation Arrangement
ALDENSolving Flow Problems Since 1894
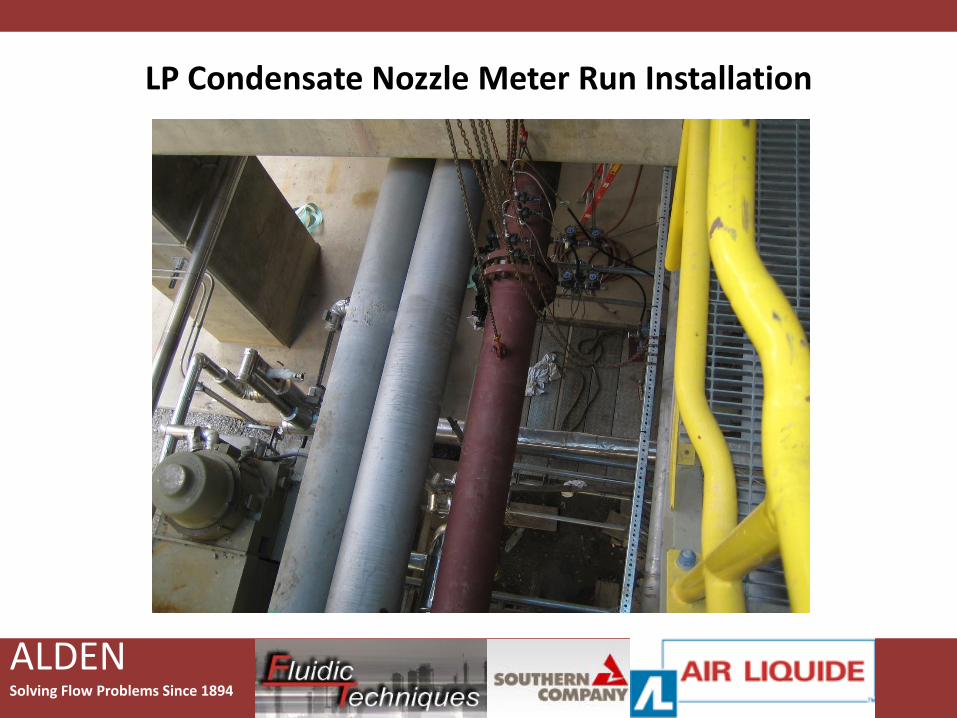
LP Condensate Nozzle Meter Run Installation
ALDENSolving Flow Problems Since 1894
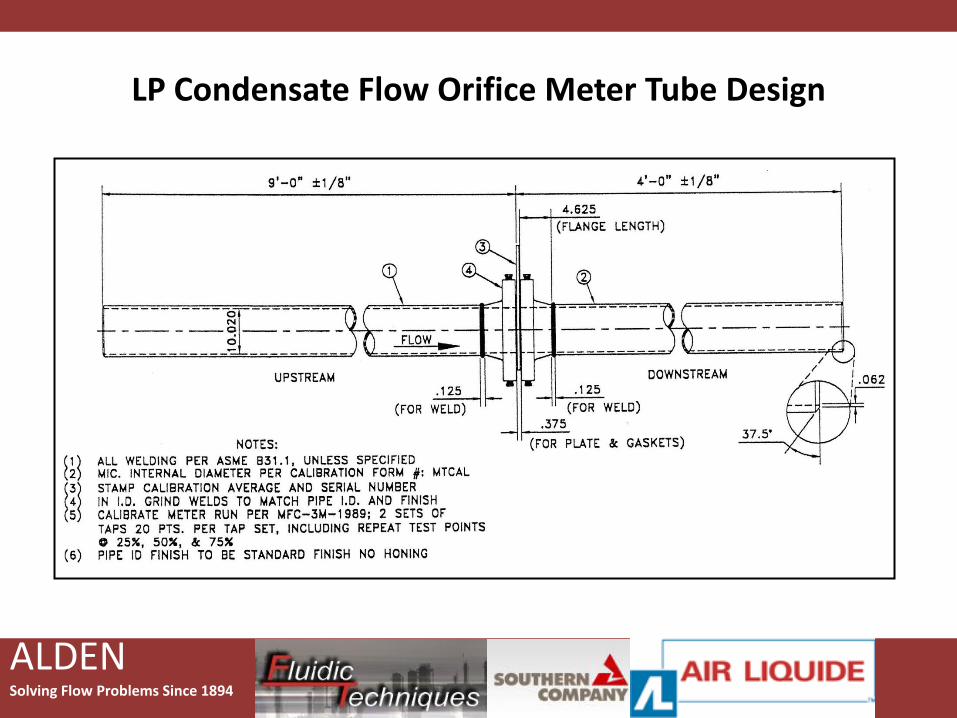
LP Condensate Flow Orifice Meter Tube Design
ALDENSolving Flow Problems Since 1894
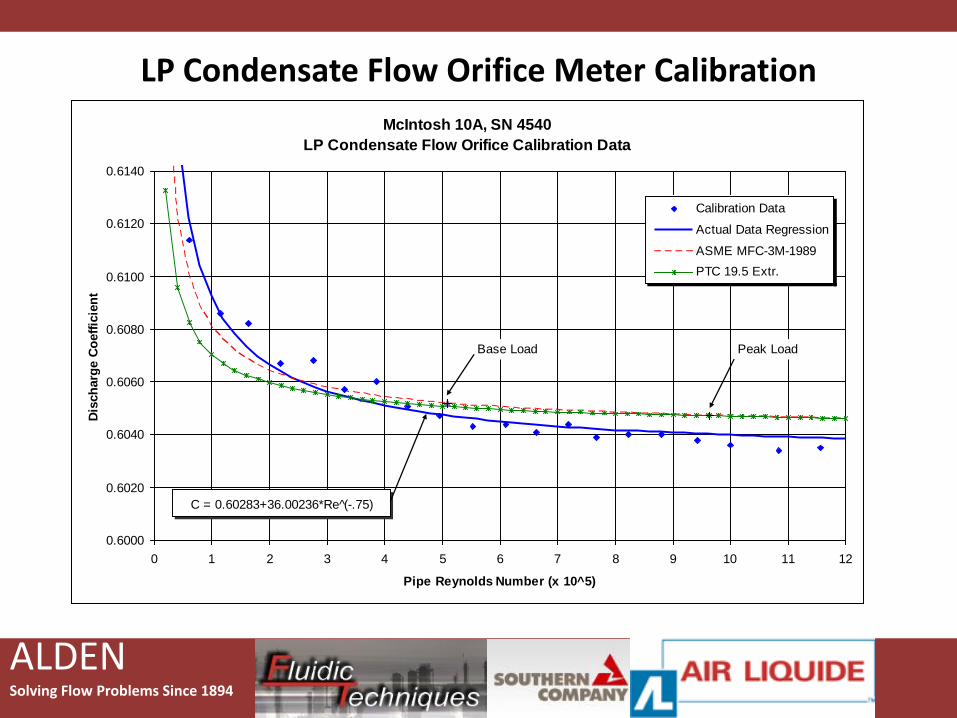
LP Condensate Flow Orifice Meter Calibration
McIntosh 10A, SN 4540
LP Condensate Flow Orifice Calibration Data
0.6000
0.6020
0.6040
0.6060
0.6080
0.6100
0.6120
0.6140
0 1 2 3 4 5 6 7 8 9 10 11 12
Pipe Reynolds Number (x 10^5)
Dis
ch
arg
e C
oeff
icie
nt
Calibration Data
Actual Data Regression
ASME MFC-3M-1989
PTC 19.5 Extr.
Base Load Peak Load
C = 0.60283+36.00236*Re (̂-.75)
ALDENSolving Flow Problems Since 1894
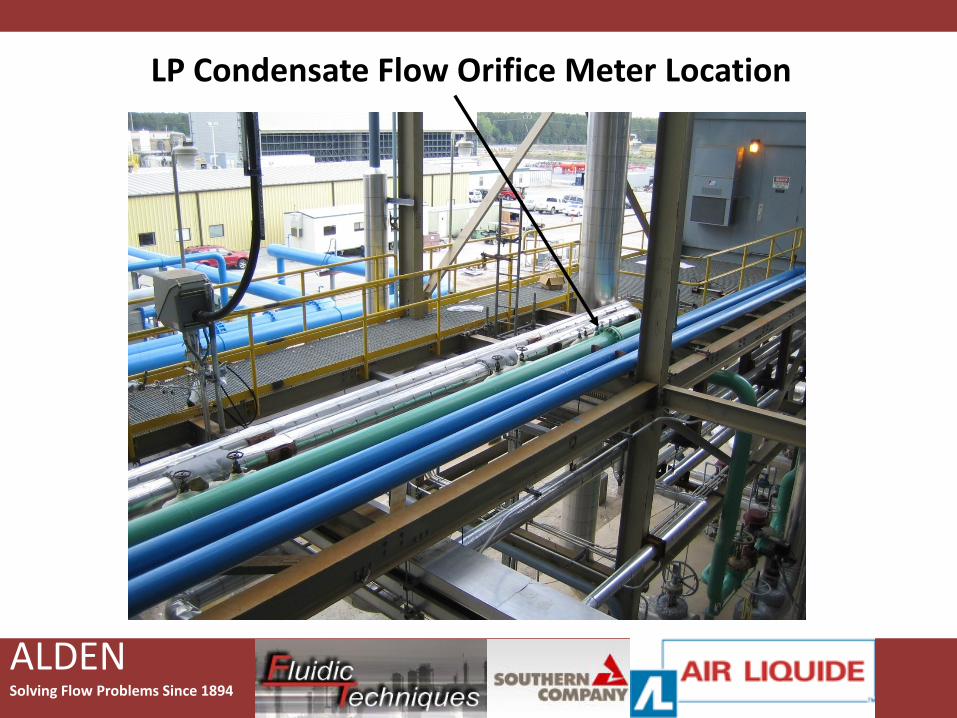
LP Condensate Flow Orifice Meter Location
ALDENSolving Flow Problems Since 1894
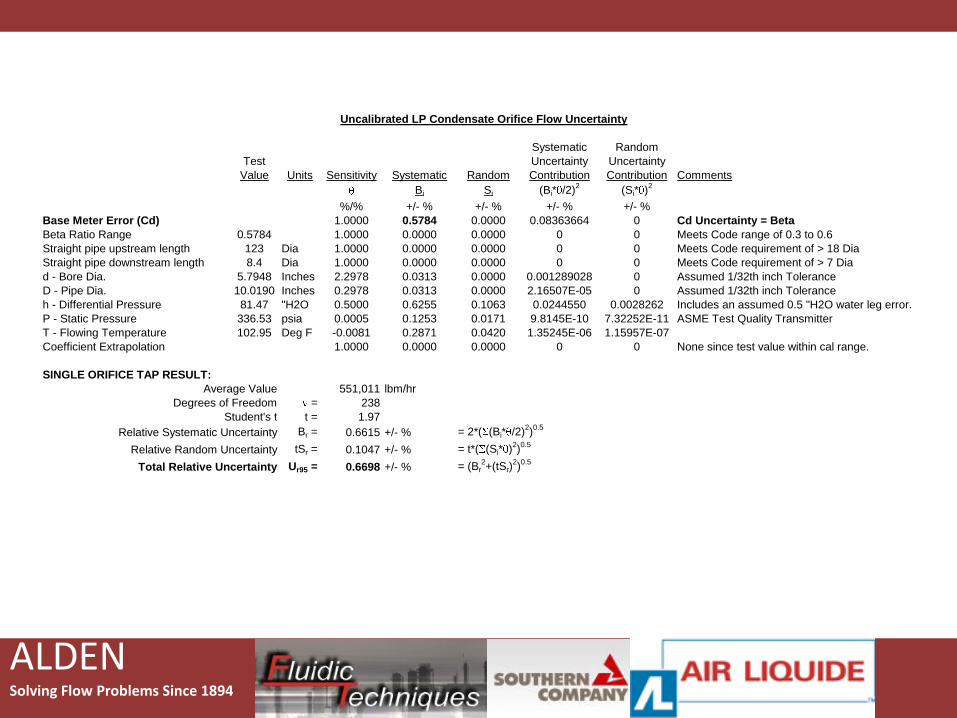
Systematic Random
Test Uncertainty Uncertainty
Value Units Sensitivity Systematic Random Contribution Contribution Comments
Bi Si (Bi* /2)2
(Si* )2
%/% +/- % +/- % +/- % +/- %
Base Meter Error (Cd) 1.0000 0.5784 0.0000 0.08363664 0 Cd Uncertainty = Beta
Beta Ratio Range 0.5784 1.0000 0.0000 0.0000 0 0 Meets Code range of 0.3 to 0.6
Straight pipe upstream length 123 Dia 1.0000 0.0000 0.0000 0 0 Meets Code requirement of > 18 Dia
Straight pipe downstream length 8.4 Dia 1.0000 0.0000 0.0000 0 0 Meets Code requirement of > 7 Dia
d - Bore Dia. 5.7948 Inches 2.2978 0.0313 0.0000 0.001289028 0 Assumed 1/32th inch Tolerance
D - Pipe Dia. 10.0190 Inches 0.2978 0.0313 0.0000 2.16507E-05 0 Assumed 1/32th inch Tolerance
h - Differential Pressure 81.47 "H2O 0.5000 0.6255 0.1063 0.0244550 0.0028262 Includes an assumed 0.5 "H2O water leg error.
P - Static Pressure 336.53 psia 0.0005 0.1253 0.0171 9.8145E-10 7.32252E-11 ASME Test Quality Transmitter
T - Flowing Temperature 102.95 Deg F -0.0081 0.2871 0.0420 1.35245E-06 1.15957E-07
Coefficient Extrapolation 1.0000 0.0000 0.0000 0 0 None since test value within cal range.
SINGLE ORIFICE TAP RESULT:
Average Value 551,011 lbm/hr
Degrees of Freedom = 238
Student's t t = 1.97
Relative Systematic Uncertainty Br = 0.6615 +/- % = 2*( (Bi* /2)2)0.5
Relative Random Uncertainty tSr = 0.1047 +/- % = t*( (Si* )2)0.5
Total Relative Uncertainty Ur95 = 0.6698 +/- % = (Br2+(tSr)
2)0.5
Uncalibrated LP Condensate Orifice Flow Uncertainty
ALDENSolving Flow Problems Since 1894
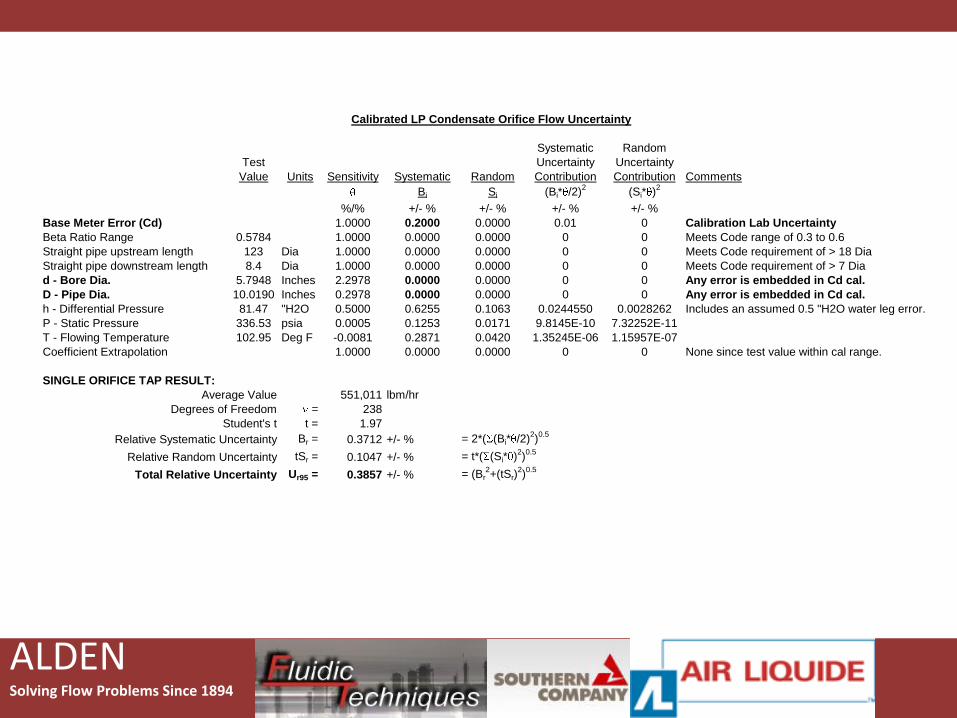
Systematic Random
Test Uncertainty Uncertainty
Value Units Sensitivity Systematic Random Contribution Contribution Comments
Bi Si (Bi* /2)2
(Si* )2
%/% +/- % +/- % +/- % +/- %
Base Meter Error (Cd) 1.0000 0.2000 0.0000 0.01 0 Calibration Lab Uncertainty
Beta Ratio Range 0.5784 1.0000 0.0000 0.0000 0 0 Meets Code range of 0.3 to 0.6
Straight pipe upstream length 123 Dia 1.0000 0.0000 0.0000 0 0 Meets Code requirement of > 18 Dia
Straight pipe downstream length 8.4 Dia 1.0000 0.0000 0.0000 0 0 Meets Code requirement of > 7 Dia
d - Bore Dia. 5.7948 Inches 2.2978 0.0000 0.0000 0 0 Any error is embedded in Cd cal.
D - Pipe Dia. 10.0190 Inches 0.2978 0.0000 0.0000 0 0 Any error is embedded in Cd cal.
h - Differential Pressure 81.47 "H2O 0.5000 0.6255 0.1063 0.0244550 0.0028262 Includes an assumed 0.5 "H2O water leg error.
P - Static Pressure 336.53 psia 0.0005 0.1253 0.0171 9.8145E-10 7.32252E-11
T - Flowing Temperature 102.95 Deg F -0.0081 0.2871 0.0420 1.35245E-06 1.15957E-07
Coefficient Extrapolation 1.0000 0.0000 0.0000 0 0 None since test value within cal range.
SINGLE ORIFICE TAP RESULT:
Average Value 551,011 lbm/hr
Degrees of Freedom = 238
Student's t t = 1.97
Relative Systematic Uncertainty Br = 0.3712 +/- % = 2*( (Bi* /2)2)0.5
Relative Random Uncertainty tSr = 0.1047 +/- % = t*( (Si* )2)0.5
Total Relative Uncertainty Ur95 = 0.3857 +/- % = (Br2+(tSr)
2)0.5
Calibrated LP Condensate Orifice Flow Uncertainty
ALDENSolving Flow Problems Since 1894
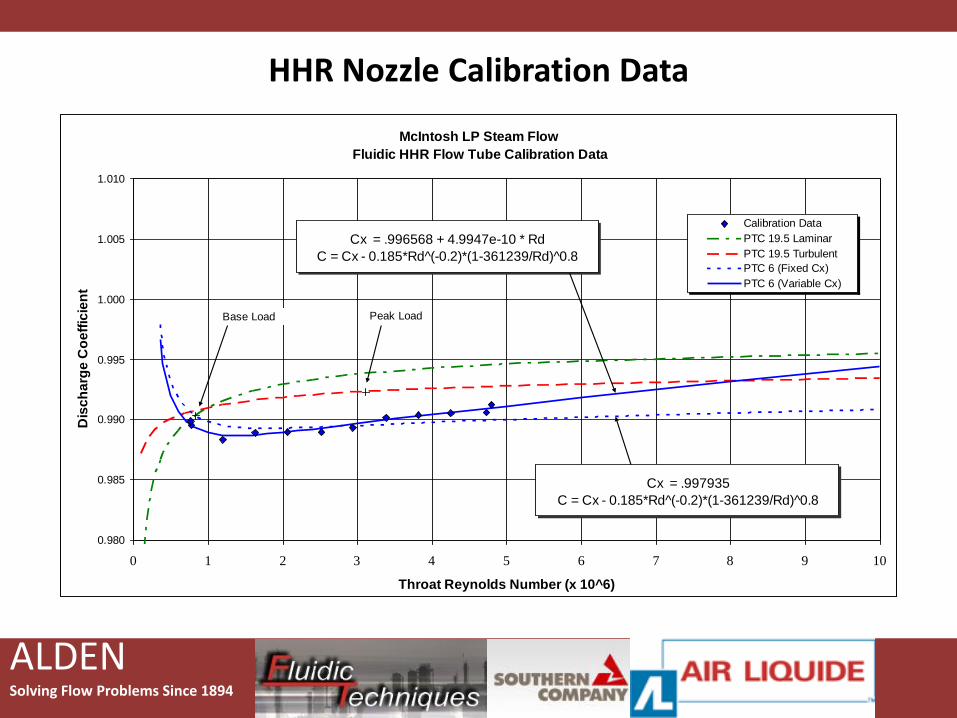
HHR Nozzle Calibration Data
McIntosh LP Steam Flow
Fluidic HHR Flow Tube Calibration Data
0.980
0.985
0.990
0.995
1.000
1.005
1.010
0 1 2 3 4 5 6 7 8 9 10
Throat Reynolds Number (x 10^6)
Dis
ch
arg
e C
oe
ffic
ien
t
Calibration Data
PTC 19.5 Laminar
PTC 19.5 Turbulent
PTC 6 (Fixed Cx)
PTC 6 (Variable Cx)
Base Load
Cx = .997935
C = Cx - 0.185*Rd^(-0.2)*(1-361239/Rd)^0.8
Peak Load
Cx = .996568 + 4.9947e-10 * Rd
C = Cx - 0.185*Rd^(-0.2)*(1-361239/Rd)^0.8
ALDENSolving Flow Problems Since 1894
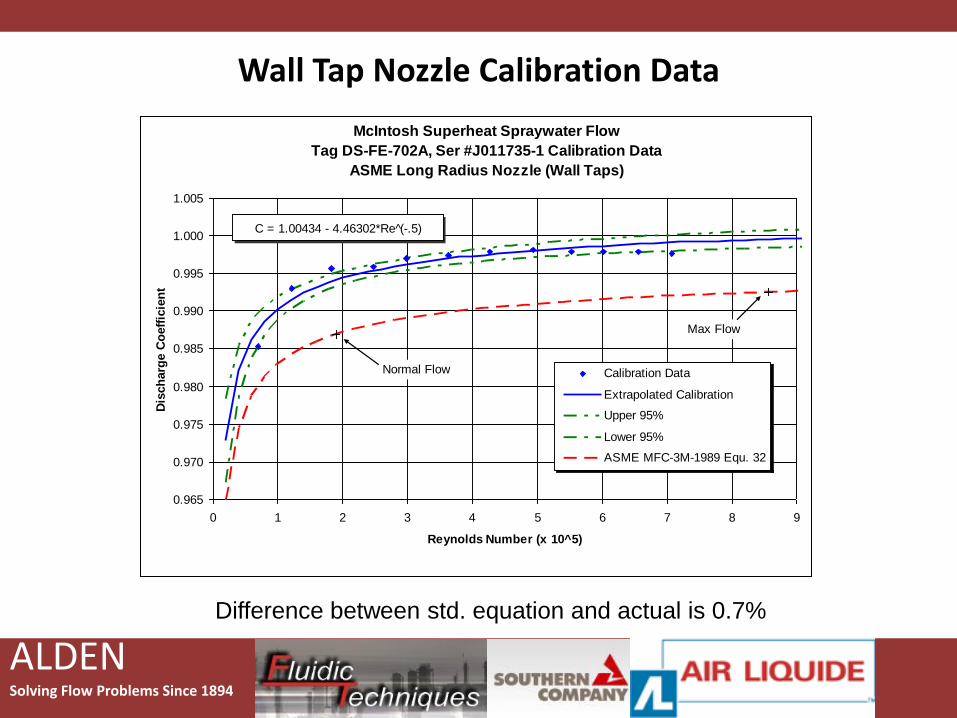
Wall Tap Nozzle Calibration Data
McIntosh Superheat Spraywater Flow
Tag DS-FE-702A, Ser #J011735-1 Calibration Data
ASME Long Radius Nozzle (Wall Taps)
0.965
0.970
0.975
0.980
0.985
0.990
0.995
1.000
1.005
0 1 2 3 4 5 6 7 8 9
Reynolds Number (x 10^5)
Dis
ch
arg
e C
oeff
icie
nt
Calibration Data
Extrapolated Calibration
Upper 95%
Lower 95%
ASME MFC-3M-1989 Equ. 32
Normal Flow
C = 1.00434 - 4.46302*Re (̂-.5)
Max Flow
Difference between std. equation and actual is 0.7%
ALDENSolving Flow Problems Since 1894
Conclusions
• Calibration transfers the uncertainty of a flow meter to the uncertainty of the calibration lab and the repeatability of the meter
• Use meters with predictable and repeatable characteristics
• Verify meter was manufactured properly by it’s performance
• Determine actual meter characteristics by calibration
• Curvefit calibration data using theoretical equation shapes
• Install meters with required upstream and downstream piping requirements (Duplicate lab flow conditions)
• Maintain meter condition as during calibration
ALDENSolving Flow Problems Since 1894
Air Liquide Pipeline Operations
Zach Hennig
Why we calibrate meters
ALDENSolving Flow Problems Since 1894
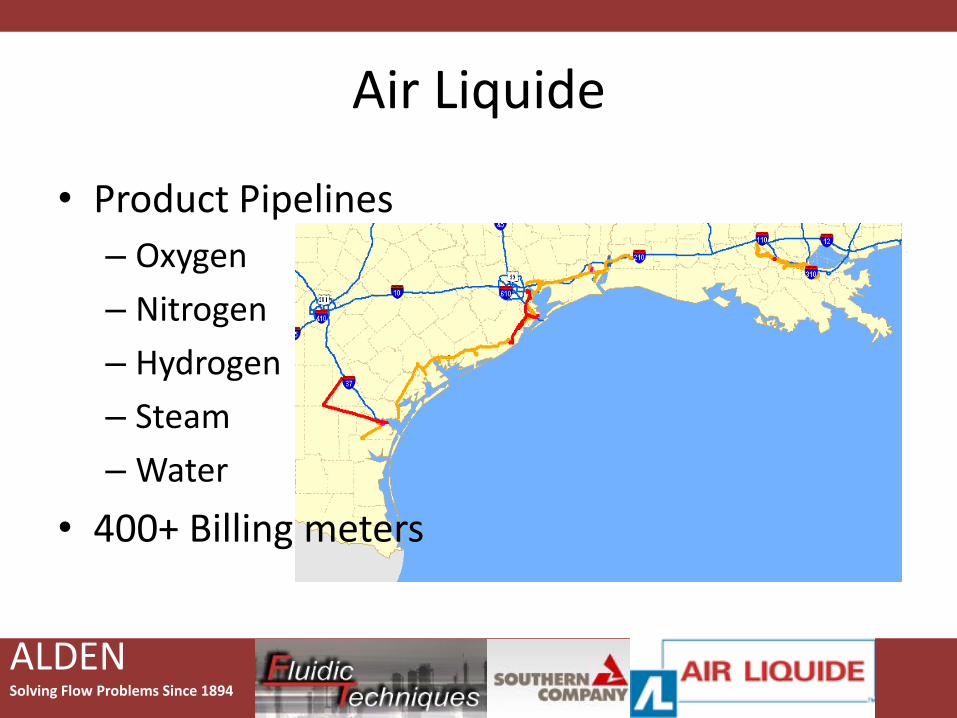
Air Liquide
• Product Pipelines
– Oxygen
– Nitrogen
– Hydrogen
– Steam
– Water
• 400+ Billing meters
ALDENSolving Flow Problems Since 1894
Why we calibrate meters
• Best measurement possible needed
– for venturi meters this means calibrating to reduce the uncertainty of the discharge coefficient
• Assurance we have a properly built meter
• Customer confidence in our metering
ALDENSolving Flow Problems Since 1894
Case Studies
• Case 1: Pipeline Balance
• Case 2: Steam venturi meter calibration
• Case 3: Failed venturi meter calibration
ALDENSolving Flow Problems Since 1894
Case 1: Pipeline Balance
• Problem
– Four mile steam line had ~ 7% balance discrepancy between inlet and outlet venturi meters
• Solution
– Inlet meter had not been calibrated or maintained well for many years
– Replace inlet meter with calibrated meter
ALDENSolving Flow Problems Since 1894
Case 1: Pipeline Balance
• Results
– Imbalance of daily totals of the pipeline were reduced from ~ 7.0% prior to ~ 0.3%
ALDENSolving Flow Problems Since 1894
Case 2: Steam Venturi Calibration
• Problem:
– Plant balances indicated we might be under billing customer steam flow
– Steam meter uncalibrated
– Discharge coefficient assumed to be 0.985
• Solution:
– Install new calibrated venturi meter
ALDENSolving Flow Problems Since 1894
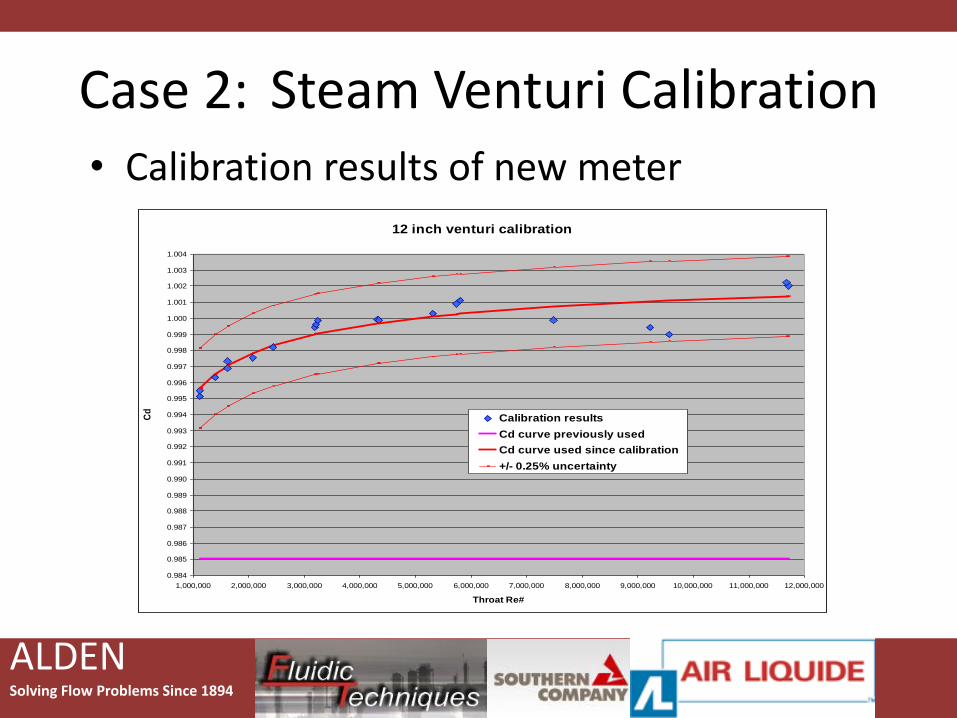
Case 2: Steam Venturi Calibration
12 inch venturi calibration
0.984
0.985
0.986
0.987
0.988
0.989
0.990
0.991
0.992
0.993
0.994
0.995
0.996
0.997
0.998
0.999
1.000
1.001
1.002
1.003
1.004
1,000,000 2,000,000 3,000,000 4,000,000 5,000,000 6,000,000 7,000,000 8,000,000 9,000,000 10,000,000 11,000,000 12,000,000
Throat Re#
Cd
Calibration results
Cd curve previously used
Cd curve used since calibration
+/- 0.25% uncertainty
• Calibration results of new meter
ALDENSolving Flow Problems Since 1894
Case 2: Steam Venturi Calibration
• Results:
– Mass balances following steam meter replacement indicated an ~ 3.9% increase in steam sales
– Project paid for within a matter of weeks
ALDENSolving Flow Problems Since 1894
Case 3: Failed Venturi Calibration
• Problem
– Poor meter performance at the calibration lab
– Difference of 3% between tap two pairs of taps
• Solution
– Meter returned to vendor
ALDENSolving Flow Problems Since 1894
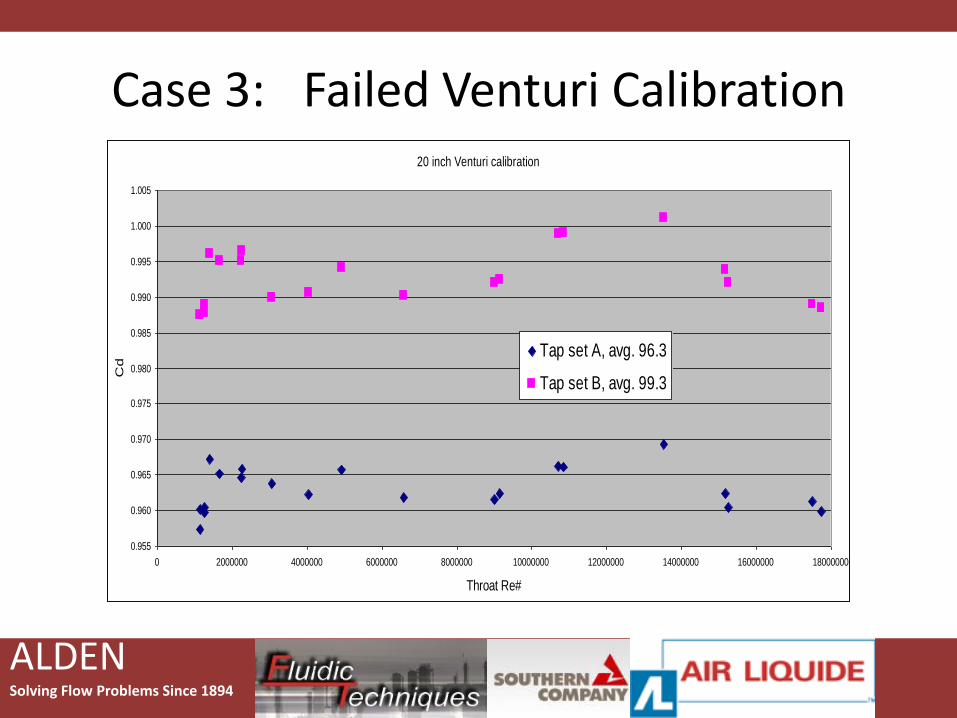
Case 3: Failed Venturi Calibration20 inch Venturi calibration
0.955
0.960
0.965
0.970
0.975
0.980
0.985
0.990
0.995
1.000
1.005
0 2000000 4000000 6000000 8000000 10000000 12000000 14000000 16000000 18000000
Throat Re#
Cd
Tap set A, avg. 96.3
Tap set B, avg. 99.3
ALDENSolving Flow Problems Since 1894
Case 3: Failed Venturi Calibration
• Lesson
– Meter manufactures can make mistakes
– Defects may not be visible to the eye
– Proving the meter assures you know the characteristics of your meter
ALDENSolving Flow Problems Since 1894
Conclusion
• Case studies show the necessity of flow testing meters
ALDENSolving Flow Problems Since 1894
What is Calibration?
Calibration is used to determine the meter’s deviation from an accepted standard.
Accepted Standard = traceable to internationally agreed reference
values, e.g., the National Institute of Standards and Technology (NIST).
Philip S. Stacy, Director
ALDEN RESEARCH LABORATORY INC.
ALDENSolving Flow Problems Since 1894
Flow meters are calibrated by relating a “known” or traceable
flow to the meter’s reading
The first step to Calibration is to determine the meter’s deviation from an accepted
standard.
ALDENSolving Flow Problems Since 1894
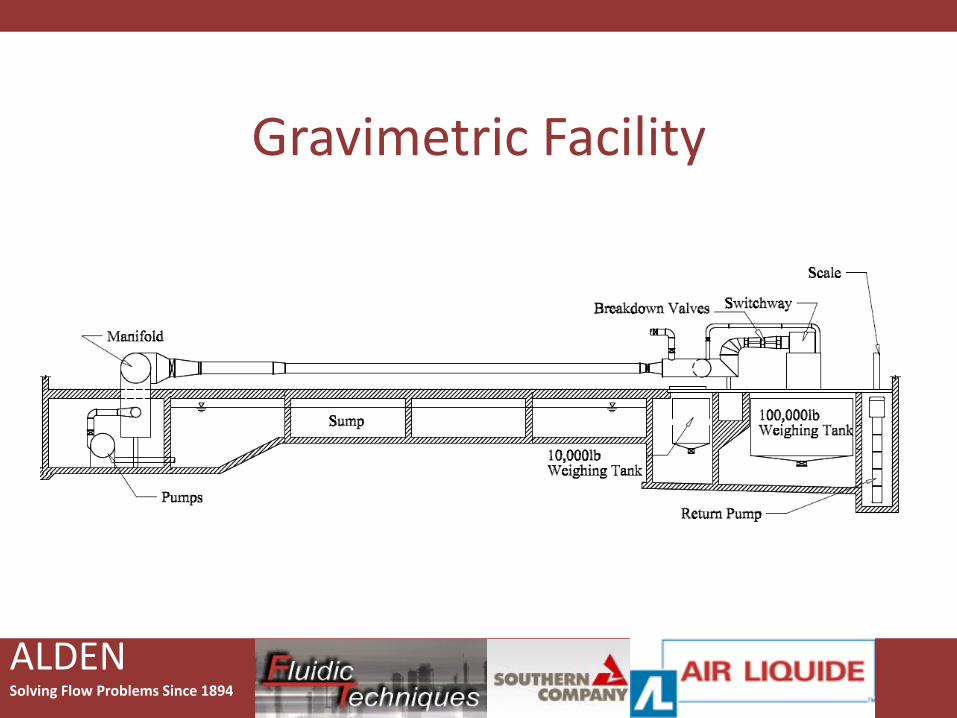
Gravimetric Method
Weight, Time, Temperature
* Corrected for bouyancy and local gravity.
Weight*/Time = Mass Flow
Mass Flow/fluid Density = Volumetric Flow
Measuring the fundamentals:
ALDENSolving Flow Problems Since 1894
Alden’s Meter Calibration Facilities
High Reynolds:
• NVLAP registered with best uncertainty +/- 0.1%
• using water at 95F flows to 20,000 gpm
• Gravimetric systems, 1,000 lb, 10,000 lb, 100,000 lb capacities
Low Reynolds:
• Best uncertainty +/- 0.2%
• Pond water (seasonal temperature variation)
• Gravimetric systems, 1000 lb, 10,000 lb, 50,000 capacities
• Secondary standard (venturi) to 35,000 gpm
ALDENSolving Flow Problems Since 1894
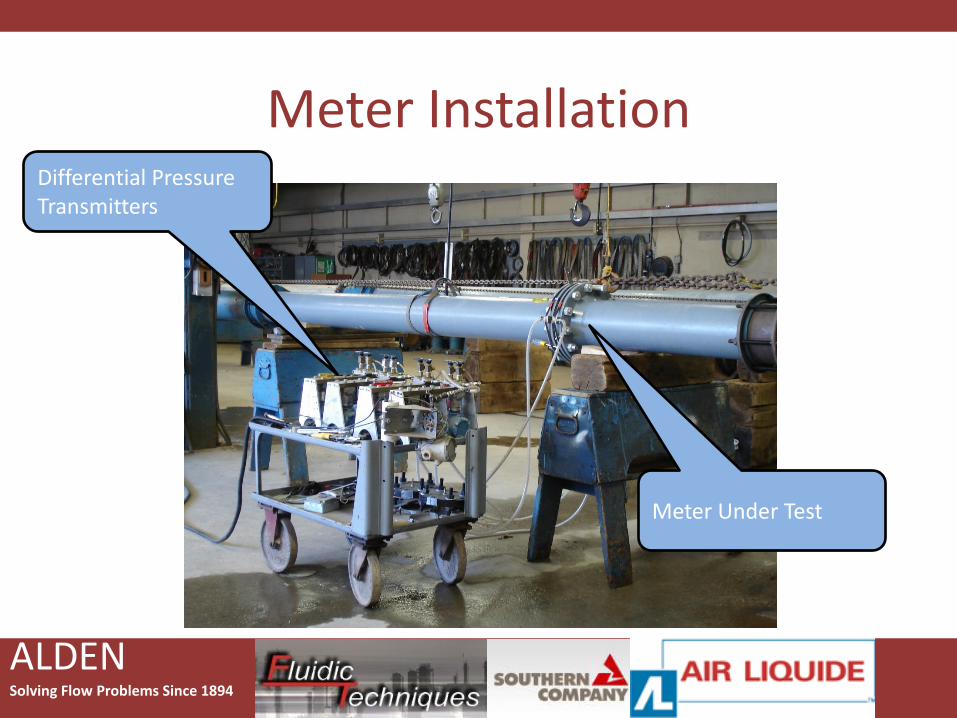
Meter InstallationDifferential PressureTransmitters
Meter Under Test
ALDENSolving Flow Problems Since 1894
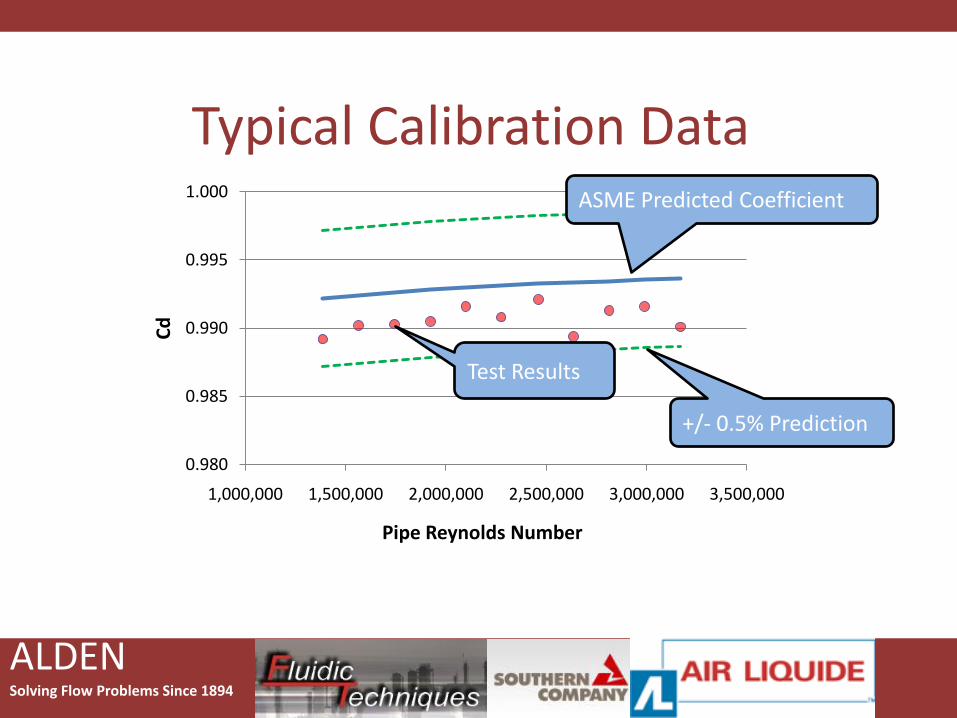
Typical Calibration Data
0.980
0.985
0.990
0.995
1.000
1,000,000 1,500,000 2,000,000 2,500,000 3,000,000 3,500,000
Cd
Pipe Reynolds Number
+/- 0.5% Prediction
ASME Predicted Coefficient
Test Results
ALDENSolving Flow Problems Since 1894
Why Calibrate?
• Meters used in performance testing are required to be calibrated.
• Reduce uncertainty – increase confidence in the meter performance.
• Confirm wear and tear - Recalibration
ALDENSolving Flow Problems Since 1894
Calibration vs. Prediction
How well do meters perform with respect to predictive equations?
ALDENSolving Flow Problems Since 1894
Calibration vs. Prediction
From a data set of several hundred of the following meters:
Throat tap nozzleOrifice plate sections
Wall Tap sections
Classic Venturi sections
ALDENSolving Flow Problems Since 1894
Calibration vs. Prediction
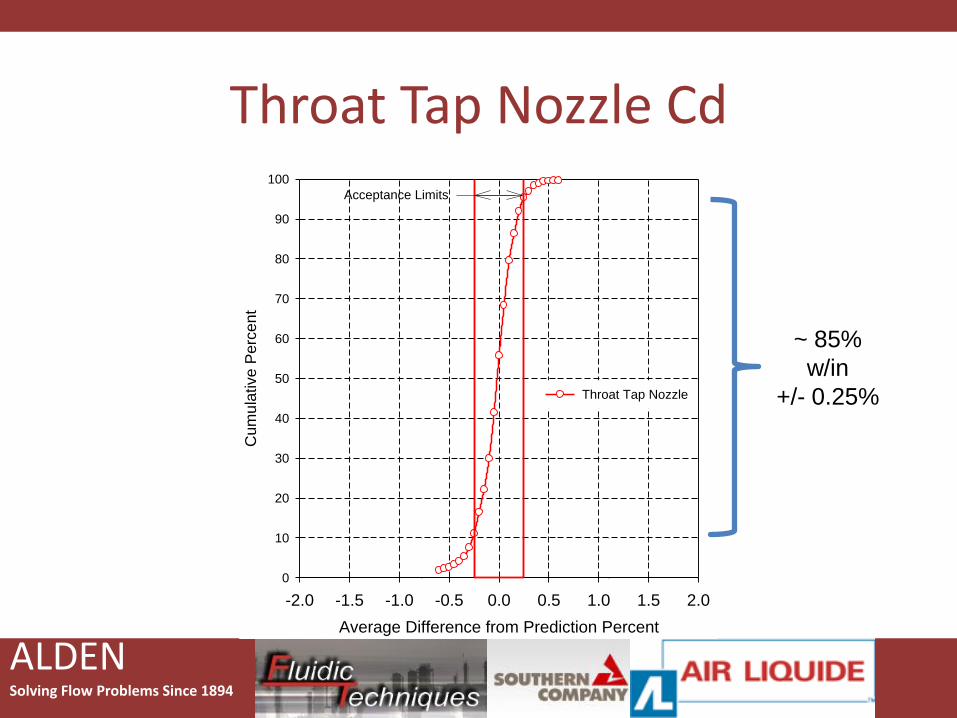
Illustrating the measured average coefficient of discharge (Cd) versus predictive equation Cd.
ALDENSolving Flow Problems Since 1894
Average Difference from Prediction Percent
-2.0 -1.5 -1.0 -0.5 0.0 0.5 1.0 1.5 2.0
Cum
ula
tive P
erc
ent
0
10
20
30
40
50
60
70
80
90
100
Throat Tap Nozzle
Acceptance Limits
Throat Tap Nozzle Cd
~ 85%
w/in
+/- 0.25%
ALDENSolving Flow Problems Since 1894
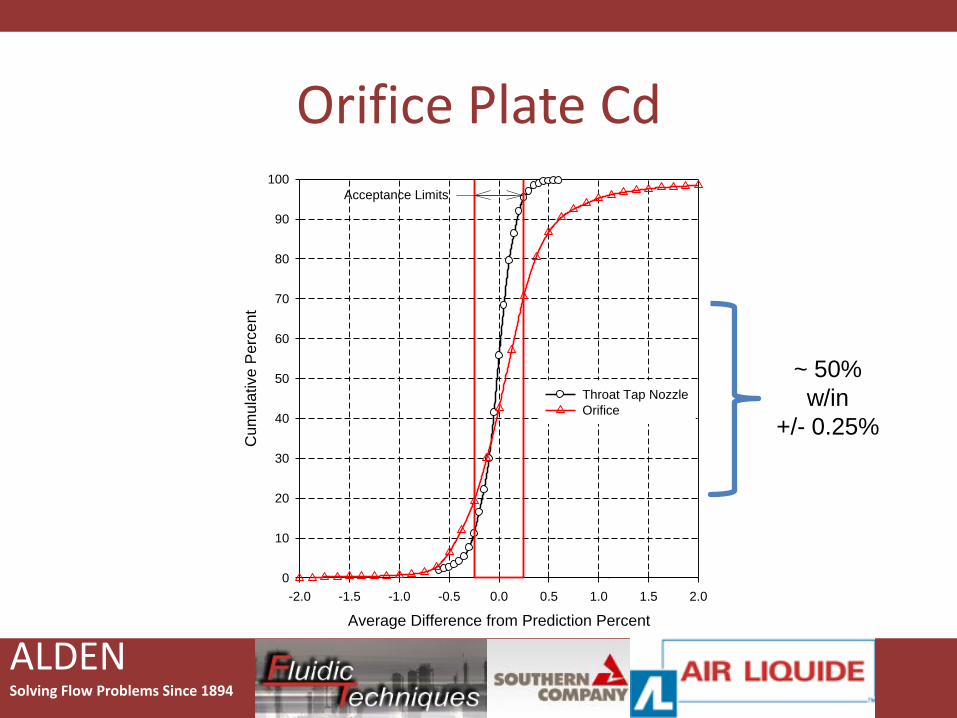
Average Difference from Prediction Percent
-2.0 -1.5 -1.0 -0.5 0.0 0.5 1.0 1.5 2.0
Cum
ula
tive P
erc
ent
0
10
20
30
40
50
60
70
80
90
100
Throat Tap Nozzle
Orifice
Acceptance Limits
Orifice Plate Cd
~ 50%
w/in
+/- 0.25%
ALDENSolving Flow Problems Since 1894
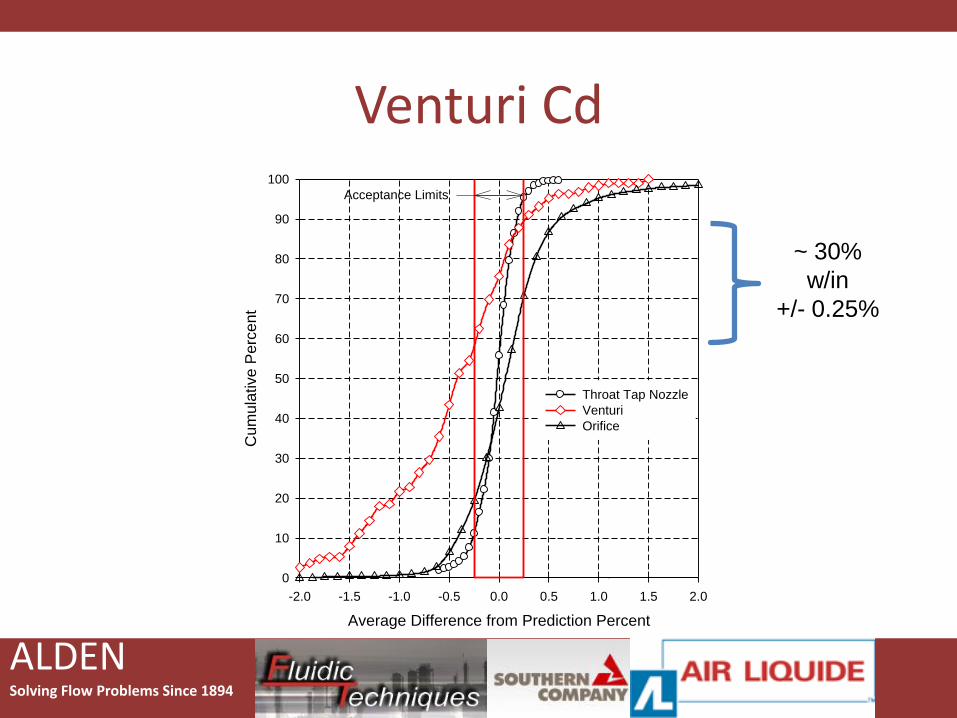
Average Difference from Prediction Percent
-2.0 -1.5 -1.0 -0.5 0.0 0.5 1.0 1.5 2.0
Cum
ula
tive P
erc
ent
0
10
20
30
40
50
60
70
80
90
100
Throat Tap Nozzle
Venturi
Orifice
Acceptance Limits
Venturi Cd
~ 30%
w/in
+/- 0.25%
ALDENSolving Flow Problems Since 1894
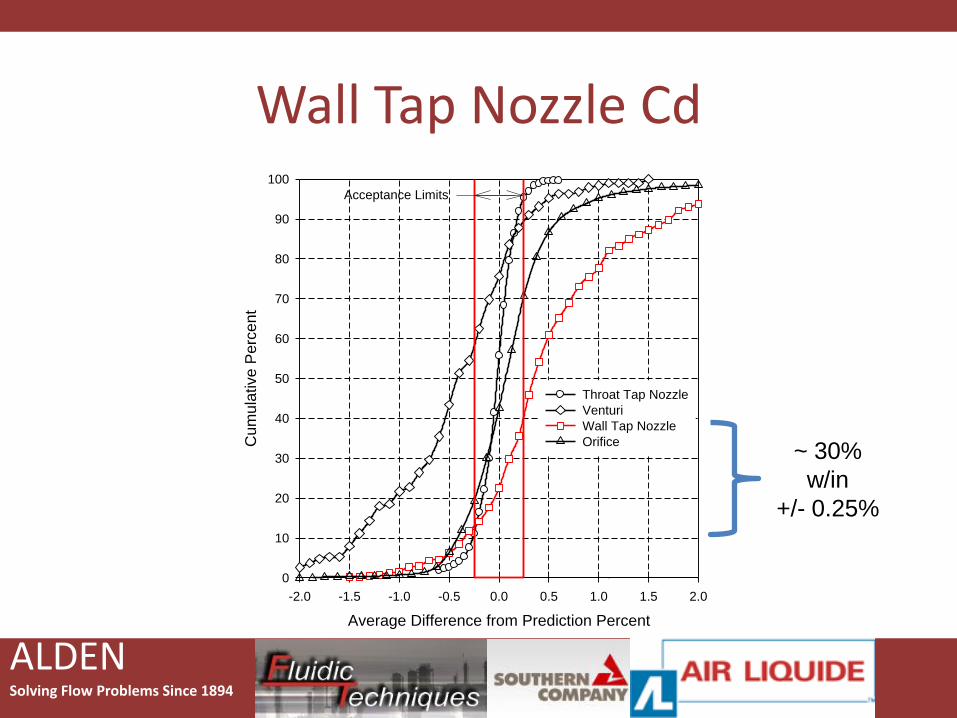
Average Difference from Prediction Percent
-2.0 -1.5 -1.0 -0.5 0.0 0.5 1.0 1.5 2.0
Cum
ula
tive P
erc
ent
0
10
20
30
40
50
60
70
80
90
100
Throat Tap Nozzle
Venturi
Wall Tap Nozzle
Orifice
Acceptance Limits
Wall Tap Nozzle Cd
~ 30%
w/in
+/- 0.25%
ALDENSolving Flow Problems Since 1894
Conclusions
• Calibration reduces uncertainty
• Links the meter performance to Accepted Standards
• Often the only way to account for design and manufacturing tolerance that can significantly affect meter performance with respect to predictive equations.
ALDENSolving Flow Problems Since 1894
Summary
• Flow meter accuracy and the current climate of industry concerns
• An overview of flow meter types, the accuracy standards, and how to know when to calibrate
• Flow meter accuracy importance in the power generation industry
• Increasing revenue in the process industry by calibrating flow meters measuring a product
• Methods of calibration
ALDENSolving Flow Problems Since 1894
Questions?
• Richard Wakeland
• W. Cary Campbell
• Zach Hennig
• Phil Stacy
• Dave Schowalter