industrial fasteners institute fastener industry economics.pdf · group of 52 leading economists to...
TRANSCRIPT

The Industry We are going to change tack from our usual approach of first addressing the general economy, and offer some aggregated information on the U.S. Fastener Industry we were given access to. The data is NAICS-based (332722) covering 2008 and released in June 2009. Industry fastener production revenues in 2008 were $10.63 B with revenue projections for 2009 being $10.76 B (probably not achieved) for 2010 at $11.09 B and 2012 at $12.04 B. These are lower than the previously reported Freedonia projections, which were for consumption not U.S. production. U.S. consumption was $12.02 B with $4.10 B in imports and $2.71 B in exports. Imports were up in 2008 just over 9.1% on a year-to-year as were exports up by 5.7%. 2009 imports were down 37% and exports down 21%, reflecting the recession. Imports in 2009 were $2,650,240 M and exports were $2,025,759 M. There were 841 fastener manufacturing entities (both independent and captive) in existence starting 2009 – probably a few less ending 2009 – versus 937 ending 2004. The industry had 42,000 employees. In 2009, the industry operated at just over 59% of capacity, suggesting there is in place capacity to produce $17.2 B in product, if valued at the same prices, operating at full production capacity. The information as analyzed showed there to be 49 upstream industries supplying the industry while product flowed to 352 identified downstream fastener using industries. The supplying industries included the purchase of just over $895 M in domestic wire and rod for production purposes. Inventory turns in 2009 were 2.8 down from 4.6 in 2008. Also reflecting the economy, 84% of fastener manufacturers reported cutting jobs, and over 50% of those cut jobs by more than 10%. A very detailed breakdown of markets for U.S. produced products was provided. This included nine pages of single spaced type, too voluminous to duplicate here but which can be seen at the IFI offices. Again, the heavy consumers of fasteners were auto parts, light truck and utility vehicle parts, structural, general machinery, heavy truck, aerospace, HVAC/appliance, electrical, ag. equipment and machinery. A few not often mentioned users were ship building and repair ($60 M), military land vehicles ($56.8 M), arms and ordinance ($48.4 M) and electro-medical and electro-therapeutic equipment consuming a whopping $198M. As reported last year, medical devices are a growing market. From a financial perspective, for the aggregated industry, the following industry Income Statement and Balance Sheet were supplied:
2

Aggregated Income Statement Aggregated Balance Sheet Net Sales $10,630 M 100.0% Cash & Equip. $628 M 8.1% Cost of Materials 4,517 M 42.5% A/R 1,279 M 16.5% Salaries 714 M 6.7% Inventories 1,217 M 15.7% Wages 1,317 M 12.4% Other Current Assets 310 M 4.0% Benefits 571 M 5.4% Total Current Assets 3,433 M 44.3% Energy/Fuel 170 M 1.6% Property & Non-Current 4,316 M 55.7% Gross Profit 3,341 M 31.4% Total Assets 7,749 M 100.0% Depreciation, etc. P&E 276 M 2.6% Current Liabilities 1,790 M 23.1% Admin. Sales & Mkting 2,214 M 20.8% Non-current Liabilities 2,503 M 32.3% Income/Loss from Ops. 850 M 8.0% Total Liabilities 4,293 M 55.4% Interest Expense 149 M 1.4% Stockholders Equity 3,456 M 44.6% Other Non-Op., Exp. 128 M 1.2% Total Liab. & Stkh. Equity 7,749 M 100.0% Pre-tax Income 829 M 7.8% Tax 159 M 1.5% Net Income $670 M 6.3% The report also provided detailed hourly wage costs for the aggregated industry; just a few examples are: Title Mean $/Hr. CEO $74.86 Operations Mgr./GM 54.12 Sales Manager 50.02 Financial Manager 43.36 Purchasing Manager 37.92 Engineering Manager 46.50 Accountants 29.41 Mechanical Engineers 31.06 Production Occupations 16.57 Tool & Die Makers 19.17 Inspection/Testing 16.24 Forming Machine Operators 15.84 General Economic Overview For the general economic overview, we are going to again let some U.S. Department of Commerce/NAM pretty grim pictures do the talking about what we’ve come through, and where we appear to be headed in 2010. In the USA, real GDP growth was a -2.4%, actually better than projected, with the improvement mostly driven by inventory sell off’s which were not immediately replaced by new production. Europe and Japan were worse and only in China did GDP growth show the vitality that all would like to see. If we go straight to the current and projected state of the economy, the pictures show:
3

Source: U.S. Department of Commerce and NAM Forecast
The 2008-2009 Recession
*GDP less net exports, government spending and inventories
The economy was what it was – not pretty!
Source: U.S. Department of Commerce
The 2008-2009 Recession
And it hit everything – except Government!
4

Source: Federal Reserve
The Current State of Manufacturing
Manufacturing did make the turn late in 2009!
GROUP1
GROUP2
GROUP3
Q4 2009
Food
Chemicals
Textiles
ApparelWood Paper
Plastics
Primary
Fabricated Metals
MachineryComputersElectrical Equip
Motor Vehicles
Medical Equip
Printing
Petroleum
Nonmetalic
AerospaceFurniture
The Current State of Manufacturing
Expansion
Struggling
Recovering
Recession
1Q Change (SAAR)
In the 4/Q 2009 most segments were in recovery (including fabricated metal)
but very few were in a growth mode.
5

Source: U.S. Department of Labor
The Labor Market
As is well known, the real issue was and is the labor market.
Source: U.S. Department of Labor
Labor Market
35% of Employment in 2007, 76% of Employment Loss
Only three areas showed employment growth – education and health
services and government.
6

Source: Commerce Department Data and World Bank
The Decline in Manufacturing Workers is Global
Manufacturing employment was hurt almost everywhere, and note that
China lost almost 5 times the number of workers than the U.S. did.
Business Investment (inventories)
Source: U.S. Department of Commerce New business investment did not exist and because of tight credit, it
hasn’t recovered yet!
7

Source: U.S. Department of Commerce
The Outlook (Housing)
thousands (SAAR)
The housing market tanked, but has maybe leveled out!
Business Investment (structures)
Source: U.S. Department of Commerce Non-residential construction recovery is still not projected yet.
8

Source: U.S. Department of Commerce and NAM Foreceast
The Outlook (Consumer Spending) EMPLOYMENT
Consumer spending and employment are not expected to really recover
until late 2010.
The Outlook For Consumer Spending
Source: U.S. Department of Commerce and NAM Forecast
Percent Change
Consumer spending remains flat, with durable goods spending
projected to be even less in 2010 than even 2009! Not a particularly good sign for the industry in 2010.
9

The Outlook for Business Investment
Source: U.S. Department of Commerce and NAM Forecast Business investment is projected to be very limited in 2010, but to finally
improve in 2011 and 2012.
The Trade Picture Improves
Source: U.S. Department of Commerce and NAM Forecast Exports could be what helps drive the recovery expanding at least
into 2012.
10
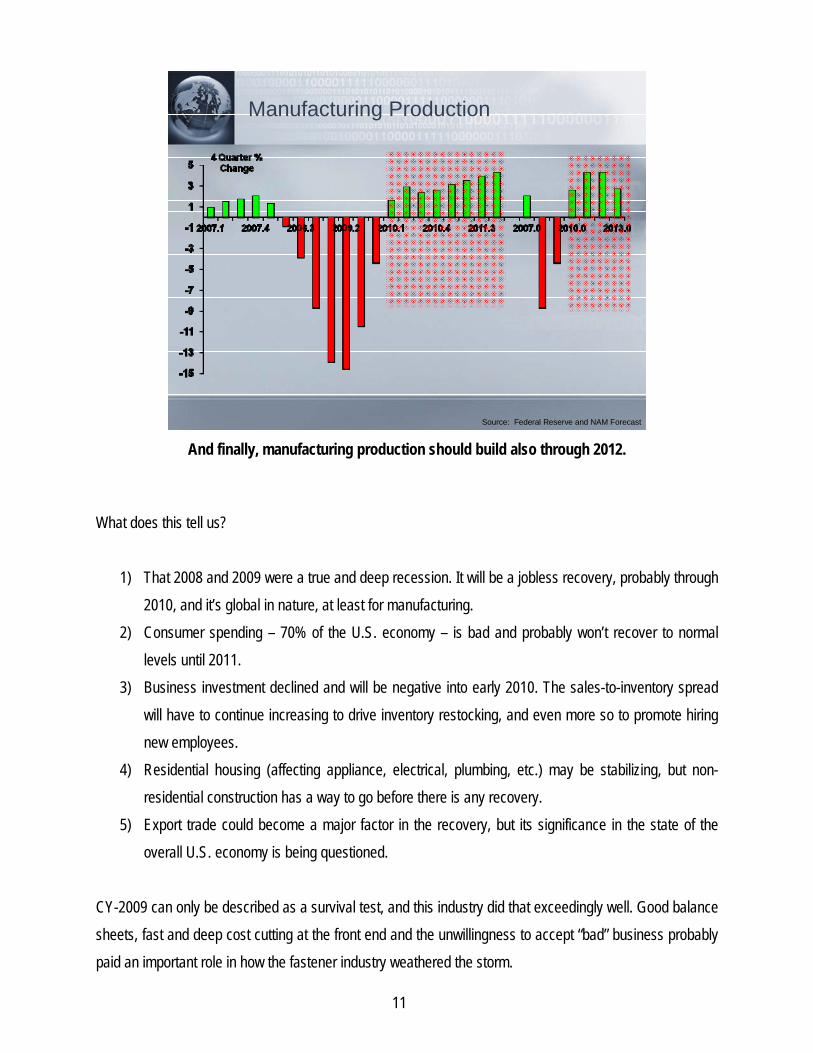
Manufacturing Production
Source: Federal Reserve and NAM Forecast And finally, manufacturing production should build also through 2012.
What does this tell us?
1) That 2008 and 2009 were a true and deep recession. It will be a jobless recovery, probably through 2010, and it’s global in nature, at least for manufacturing.
2) Consumer spending – 70% of the U.S. economy – is bad and probably won’t recover to normal levels until 2011.
3) Business investment declined and will be negative into early 2010. The sales-to-inventory spread will have to continue increasing to drive inventory restocking, and even more so to promote hiring new employees.
4) Residential housing (affecting appliance, electrical, plumbing, etc.) may be stabilizing, but non-residential construction has a way to go before there is any recovery.
5) Export trade could become a major factor in the recovery, but its significance in the state of the overall U.S. economy is being questioned.
CY-2009 can only be described as a survival test, and this industry did that exceedingly well. Good balance sheets, fast and deep cost cutting at the front end and the unwillingness to accept “bad” business probably paid an important role in how the fastener industry weathered the storm.
11

2009 In General Review The U.S. produced about $14.463 trillion in GDP in 2009 (-2.4% for the year), of which about 70% was again consumer spending. The Federal Budget Deficit grew to just below $1.6 trillion in 2009 and is not expected to fall significantly for a couple of more years. CY-2010 GDP projection ranges from 2.7% by a group of 52 leading economists to the Goldman & Sachs projection of 3% growth early in the year falling to 1.7% in the fourth quarter. CY-2011 and 2012 projections are for a return to the 4% range. The year end trade deficit was $380 B (down 45%) with 90% of the deficit from trade with China ($227 B) and oil. Continued currency manipulation by China and to a lesser extent by Japan and South Korea, continued distorting the trade balances with those countries, and the fact that China did reverse its freeing up of the float of the Yuan 2009 vs. the dollar to fuel exports and stimulate its domestic economy, continues to hamper the U.S. recovery. U.S. productivity and corporate profits increased at year end based on corporate cost cutting, but throughout 2009 there were serious declines in plant utilization. The 10.1% unemployment (17.5% if you include those not trying) and particularly the loss of manufacturing jobs was very serious (4.3 M). To understand the U.S. real position in global manufacturing, and why manufacturing isn’t dead here yet or even likely to be in the foreseeable future, the following table shows the relative percentage of the world’s manufacturing output attributable to various countries: Percent of World’s Country Manufacturing Output U.S. 22% Japan 13% China 12% (up from 3% in 1990) Germany 7% France 4% UK 3.5% Brazil 2% Russia 1.5% All Other 35% The U.S. exports about 25% of its domestic output and imports 38% of its domestic consumption. So though still very vital, the U.S. is moving toward importing too much vs. using domestic production, and exporting too little. The undervalued and dollar-pegged Yuan is a critical part of that problem.
12
Another important factor regarding the neglect of domestic manufacturing is that in the last 40 years, U.S. GDP has grown 498%, but manufacturing output has grown only 162%. The result is a lack of pricing power and a manufacturing decline from being 29% of GDP to now being only 11.5%. We suffer due to the absence of a coherent national manufacturing policy. All of this negativity is somewhat offset by the Institute for Supply Management’s (ISM) PMI rising to 54.9 at year end, a sure indication of expected expansion in the economy. The ISM projects a 5.7% increase in manufacturing revenues for 2010 following the 10.7% decrease in 2009. For services, the projection is +1.3% in 2010 following a -4.5% in 2009. This is partly based on ISM’s belief the dollar will weaken vs. major trading partners (except China because of the peg). Manufacturing capital expenditures are projected to be -4.0% in 2010 following -7.8% in 2009 – no relief there. Manufacturing employment is projected to +1.5% and labor and benefits costs are projected to be +1.4% in 2010. CY 2010 GDP projections by the World Bank are 2.7% worldwide; U.S.: 2.7%; EU: 0.5%; Japan: 0.6%; China: 9.5%; India: 7.2%; Brazil: 5.2%. Chinese exports in 2009 exceeded $1.2 trillion surpassing Germany as the largest exporter in the world. Germany had surpassed the U.S. as the world’s leading exporter in 2003. U.S. stock market closings at year end probably told a story not to be neglected as they recovered nicely from the earlier period in absolute free fall. 12/31/2009 DOW 10,428
S&P 1,115 NASDAQ 2,269
The Fastener Industry Beyond that covered earlier in this report, hard numbers for 2009 are not yet known. We do know that the Asia/Pacific region is still outstripping the west in demand consuming over 30% of the total, while N. America again accounted for less than 30%, W. Europe was about 25% and E. Europe/Africa/Latin America/Middle East each counting for the balance. The trend in demand will continue to shift to the developing areas Asia/Pacific/Africa/E. Europe/Latin America/Middle East while N. America/W. Europe/ Japan show slower growth.
13

In the latest information available, U.S. fastener demand by segment for the period 2008 thru 2017 was previously projected by Freedonia to be as follows:
U.S. INDUSTRIAL FASTENER DEMAND
YEAR 2008 2012 2017 U.S. Total $11.800 M $13.200 M $15.000 M OEM 9.000 M 10.200 M 11.500 M Motor Vehicles 3.000 M 3.350 M 3.800 M Electrical/Electronic 970 M 1.050 M 1.170 M Industrial Machinery 1.530 M 1.730 M 1.950 M Fabricated Metal Product 1.170 M 1.310 M 1.440 M Aerospace 1.580 M 1.900 M 2.150 M All Other OEM 750 M 860 M 990 M MRO/Construction/Other 2.800 M 3.000 M 3.500 M
Automotive It is no surprise that Automotive had a very, very difficult year with U.S. sales of 10,429,553 units, down 21.2% from 2008. Of more interest to fastener suppliers, the U.S. automotive production numbers were a total of 8,806,727 units. The table below breaks this out by OEM. For 2010, projections range from 11.5M units to 12.2M.
2009 U.S. Auto/Light Truck Production Company Units GM 1,908,967 (W/Joint Ventures) Ford 1,864,294 (W/Joint Ventures) Chrysler 955,099 Toyota 1,233,202 (W/Joint Ventures) Honda 1,025,000 Nissan 727,115 Mitsubishi 18,554 Hyundai 195,561 KIA 3,679 BMW 121,666 Mercedes 101,482 Volkswagen 320,507
14

Perhaps as interesting as who produced how much, is what was selling by type of vehicle relative to year end 2008: Vehicle Type % Change vs. 2008 Mid Size car – 15.7% Small car – 20.0% Luxury car – 24.5% Large car – 33.0% Pickup truck – 29.7% Cross-Overs – 6.3% Mini Vans – 30.6% Mid Size SUV – 45.7% Large SUV – 32.7% Small SUV – 16.8% Luxury SUV – 32.8% Incentives continued to drive what auto sales occurred. “Cash for clunkers” was the government’s contribution on top of which the Detroit-3 incentives averaged $3,399 (GM the highest at $4,001) at year’s end, the Japanese averaged $1,563 and Koreans $2,096. Aerospace In the Aerospace segment a different story played out in 2009 vs. 2008. Basically, in January aerospace fastener sales fell off a cliff, led by Boeing’s 787 structural design issues. Airbus had delivery problems of their own, and for this industry, the distributors refusing to take delivery of product previously ordered left many in a cash flow dilemma. As a high note, the AIA did report commercial aircraft sales to be $82.5 B in 2009, up from 80.6 B in 2008. This was supplemented by military sales of $61.7 B, missile sales of $14.8 B and space related sales of $40.4 B. Total aerospace sales for 2009 are projected to be $214.1 B, up 4% over 2008. That, remember, is sales not deliveries. Late 787 deliveries, and the general economic slowdown, did hit aircraft backorder levels with some cancellations resulting. Boeing did successfully fly the 787 in December which should break the log jam over time. Airbus had flown the A380 in 2007 and had 25 planes delivered and in operation in 2009. With respect to total commercial aircraft, Boeing received new orders for 93 and delivered 437, while Airbus received orders for 194 and delivered 430. Total aerospace orders and backlog fell about 33% in 2009 to $154.5 B. Aerospace employment also fell to 641,100 from 657,100 in 2008. Net profits in aerospace rose by 6.5% to about $15.6 B. Going into 2010, the ramp up in F-35s is expected to partially offset the commercial downturn, if you’re on that program. In 2010, aerospace sales are projected to be $76.7 B in commercial aircraft, $63.3 B in military, $16.7 B in missiles, $40.9 B in space and $16.9 B in related products and services.
15

Always interesting is what type civil transport aircraft make up the backlog and who they are sold to. For year end 2009 for Boeing this would be:
Aircraft U.S. Backlog Foreign Backlog Total 737 491 1,627 2,118 747 16 91 107 767 26 31 57 777 59 244 303 787 132 718 850
% of the Backlog 18% 82% 100% Basis Order Value: The high dependency on foreign sales is eye opening and may speak to the volatility of the numbers? Industrial Products In most of the Industrial Products segments things were really slow, but at year end some recovery appeared to be occurring. Appliance is an example of where the residential housing problems and tight credit are negatively affecting the market segment. Fewer new houses equals the need for fewer new appliances and this carries through to electrical and plumbing products, lawn and garden, etc. Until the surplus inventory of houses is worked off and easier credit comes back for new homes, demand here will remain weak. Construction machinery demand had been in a steady decline in 2008 in N. America and the 2009 results were no better. CAT’S sales were down 37% in 2009 ($32.396 B) and even worse, were off more than 39% for the fourth quarter 2009 vs. 2008. Never-the-less, CAT is projecting a surprise sales increase of from 10% to 25% in 2010 and is rehiring slowly to prepare for it. Structural fasteners were supposed to be a likely beneficiary of the Obama stimulus package. Highways, bridges, schools, hospitals and government buildings and facilities all appeared to be the intended beneficiaries. This did occur, but probably not to the extent some expected. The “buy American” clauses in the stimulus probably did contribute, though some of the exemptions granted did offset the full potential of what was intended. In the agricultural sector, JOHN DEERE’S 2009 worldwide sales were $23.1 B, down 19% from 2008, generating a net income of $873 M. Non-North American sales were 37% of the total, consistent with the
16

global objectives of the company’s sales and marketing programs. Their global workforce is now about 50,000 employees. Imports/Exports IFI’s 2009 Import/Export Report will show a continuing marked shift in import totals and their country of origin.
• U.S. Fastener Imports in 2009 were $2,650.240 M or 1,883,494,128 pounds (down 39.0% from 2008).
• U.S. Fastener Exports were $2,025.759 M or 1,525,729,419 pounds (up 6.6%).
• The top export countries of origin for the imported products were as follows:
Country Value ($M) % of Total % Change vs. 2008 $/Lb. World $2,650.240 100.0% – 37.1% $1.41 Taiwan 812.145 30.6 – 39.7 1.13 China 616.697 23.3 – 35.8 0.97 Japan 357.321 13.5 – 31.4 3.06 Canada 201.768 7.6 – 42.8 1.76 Germany 128.656 4.9 – 38.2 1.48 UK 66.038 2.5 – 32.3 16.12 France 55.227 2.1 – 23.5 19.75 India 54.764 2.1 – 37.3 1.14 Korea, South 53.840 2.0 – 38.2 1.67 Italy 51.657 2.0 – 48.4 2.47 Other countries 252.126 9.5 – 34.2 – –
With duties now imposed on fastener imports from China and Taiwan by Canada, S. Africa, and on standard products coming from China into the EU, the question of where these Chinese exports are now finding a home could still become a major issue. We continue to watch the developments, maintain contact with an excellent group of trade attorneys in Washington on a gratis basis and will keep you advised as this plays out. Likewise, it behooves you to let us know if you see significant trade disruptions develop. With respect to U.S. exports, 57.9% were NAFTA trade with Canada and Mexico.
17