indo-us workshop on urban freight transport: a global ... · pdf fileindo-us workshop on urban...
TRANSCRIPT

Presentation on
Urban Freight Transport – Mumbai Metropolitan Region
Indo-US workshop on Urban Freight Transport: A Global Perspective
9th April, 2014
K Vijayalakshmi, Addl. Chief (Metro,Mono-UMMTA)
Transport & Communications Division,
Mumbai Metropolitan Region Development Authority

Structure of Presentation
Study Area – MMR and Traffic & Transportation Survey
Database
Internal Passenger Travel Demand
Internal Goods Travel Demand
External Travel Demand: Outer Cordon Locations
Travel Demand Modelling and Transport Networks
External Travel Demand Models
Proposed Terminals
Preliminary Cost Estimates and Funding Sources
Steps taken so far….

Study Area and
Traffic & Transportation
Data Base

Map of India
Map of MMR
District Map of
Maharashtra

Mumbai
Thane
Vasai-Virar
Bhiwandi
Kalyan
Khopoli
Pen
Alibag
Mira-Bhayander
UlhasnagarAmbernath
Badlapur
Panvel
Uran
Matheran
Karjat
Navi Mumbai
Thane Dist.
Raigad Dist.
Sub-urbanDist.
Area 4355 sq.km.
Population 20.8 million (2005)
Districts in MMR 1. Mumbai2. Suburban3. Thane4. Raigad
Corporations in MMR 1. Greater Mumbai 2. Thane3. Navi Mumbai4. Ulhas Nagar5. Kalyan-Dombivali6. Mira Bhayandar7. Bhiwandi- Nizampur8. Vasai-Virar
Municipal Councils in MMR
1. Ambernath2. Kulgaon-Badlapur3. Alibaug4. Pen 5. Uran6. Matheran Hill Station7. Panvel8. Karjat9. Khopoli
Villages < 1000
Urbanisation 94% Urban Population6% Rural Population
Mumbai Metropolitan Region (MMR)

Current Travel Scenario in MMR

Surveys/ Studies ConductedNo. Primary Survey Extent
1 Home Interview Survey (HIS) 66,000 Households
2 Classified Volume count and OD Survey at Outer Cordon
Locations
24 Hr., 9 Locations
3 Classified Volume count and OD Survey at Sub-regional
cordons
24 Hr., 20 Locations
4 Classified Volume count at Inner Cordon Locations 16/24 Hr., 33 Locations (OD Survey at 3 Loc.)
5 Screen Line Points 16 Hr., 3 Locations
6 Mid-Block Locations 16 Hr., 11 Locations
7 Level Crossing Locations 16 Hr., 5 Locations
8 Sub-urban Rail Passenger Surveys 6.17%
9 Sub-urban Rail Passenger Surveys, Alighting Survey: Stations 16%
10 Operational Characteristics of Bus and Rail Transport
Networks
5700 Bus Routes and 1767 Train Services
11 IPT (Auto and Taxi) Surveys 50 Locations
12 Bus Terminal Surveys 13 Bus Terminals
13 Airport Terminal Surveys 2000 air passengers
14 Goods Terminal Surveys 20 Goods Terminals
15 Speed-Flow Studies 16 Carriageway Types
16 Journey Speed and Delay Studies 550 Kms
17 Network Inventory 2,300 kms.
18 Pedestrian Surveys 50 Locations
19 Parking Surveys 50 Stretches
20 Workplace Based Surveys 4000 respondents

JNPT
Mulund
MulundGoregaon
RCF Thal
APMC,Vashi
Taloja MIDC
Mumbai PortWadi Bander
MAFCO,Turbhe
Seepz,Andheri
Chinch Bander
Ambernath MIDC
Badalapur MIDC
Sewree Oil Depot
Andheri Kurla Road
Rallis India,Vashi
Oil Refinery, Mahul
Kalyan Bhiwandi MIDC
Flower Markets,Dadar
Cotton Avenue,Mumbai
Truck Terminal,Vashi
FCI Godowns,Borivali Kalyan Dombivali MIDC
Panvel Truck TerminalReay Road ,FCI Godown
Turbhe,Container Depot
Wagle Estate MIDC,Thane
MIDC,Patalganga,Rasayani
Charkop Industrial Estste
Zenith Industries,Khopoli
Bhuleshwar Textile Market
Mumbai Pune Road,Kalamboli
MIDC Waliv Estate,Bilalpada
Dronagiri Container Terminal
Kajupada,Thane Road, Borivali
Seepz SEZ, Marol MIDC, Andheri
Ispat Industries,Pen Alibag Road
Mahesh Industrial Estate,Bhayander
Iron & Steel Market Yard, Kalamboli
Mahape Industrial Estate,Navi Mumbai
Cotton Green Rly Goods Yard & FCI Godowns
Major Goods Terminals in MMR

• CWC Terminals 0,1,2 3 …. (2)
• CWC warehouses/FCI Godowns
4,13,14,28,34,38,40,41,42 9 ….(4)
• Large whole/FCI Godowns
5,6,7,12,16,19,20,21,25,26,27,29,30
31,32,35,36,37,39,43 20 …. (5)
• Truck Terminals 8,17,24 3 …..(3)
• Oil Refineries 15,18 2 …..(1)
• Container Depots 3,9,10,23,33 5 …..(3)
• Ports 11,12 2 …..(2)
Total 44 (20)
Classification of Goods Terminals
Total Locations
Locations for
Survey

• CWC Terminals 0,1,2 3 …. (2)
– Cotton Green Railway Goods Yard & FCI Godowns
– MAFCO, Turbhe
• CWC warehouses/FCI Godowns
4,13,14,28,34,38,40,41,42 9 ….(4)
– Reay Road, FCI
– Mulund, FCI
– Goregaon, FCI
– Mahesh Industrial Estate, Bhyander
• Large whole/FCI Godowns
5,6,7,12,16,19,20,21,25,26,27,29,30, 31,32,35,36,37,39,43
20 …. (5)
– APMC Vashi
– FCI Godown, Borivali
– Mahape Industrial Estate, Navi Mumbai
– Wagle Estate, Thane
– Kalyan-Bhiwandi Industrial estate
• Truck Terminals 8,17,24 3 …..(3)
– Vashi Truck Terminal
– Wadala Truck terminal
– Panvel Truck terminal
• Oil Refineries 15,18 2 …..(1)
– Sewree Oil Depot
• Container Depots 3,9,10,23,33 5 …..(3)
– Wadi Bunder
– Dronagiri Container terminal
– Mulund
• Ports 11,12 2 …..(2)
Total 44 (20)
Goods Terminal Survey Locations
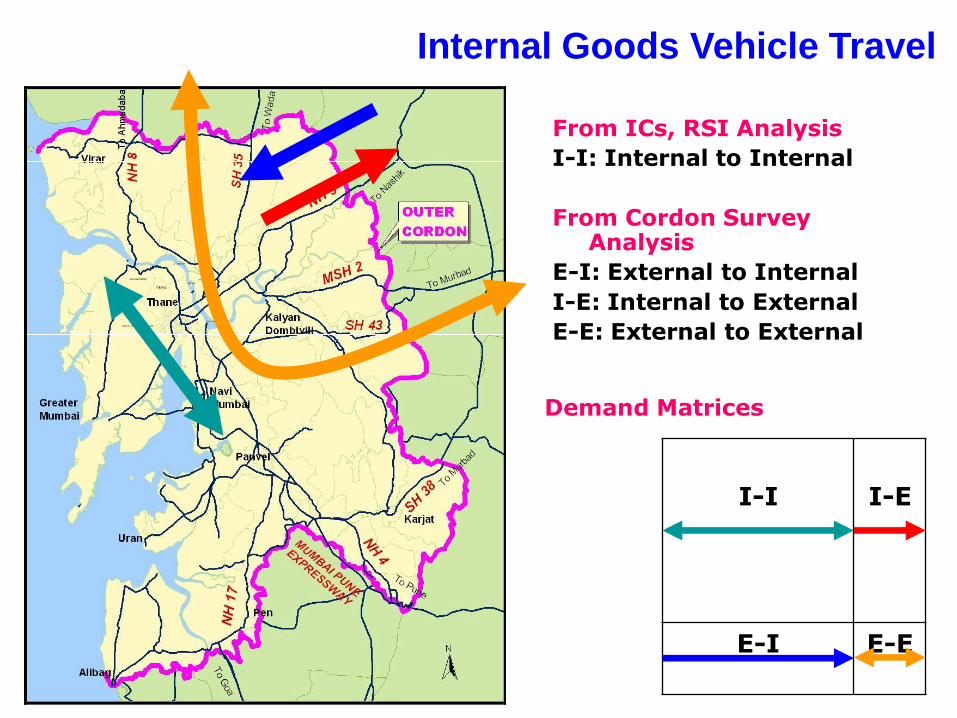
I-I I-E
E-I E-E
From ICs, RSI Analysis
I-I: Internal to Internal
From Cordon Survey Analysis
E-I: External to Internal
I-E: Internal to External
E-E: External to External
Demand Matrices
Internal Goods Vehicle Travel

Inner Cordons
Sub-regional Cordons

Daily Internal Goods Vehicle Travel
Component Veh. PCUs Veh. PCUs
I-I 62,645 1,72,150 60% 59%
I-E 18,886 55,620 18% 19%
E-I 17,076 49,866 16% 17%
E-E 5,105 15,453 5% 5%
Total 1,03,712 2,93,088 100% 100%

Daily Internal Goods Vehicle Travel
Sl. No. WSA,
1961
(Vehicle)
CRRI,
1983
(Vehicle)
MMPG,
1996
(Vehicle)
WFSL, 2005
(PCUs)
CTS Study
(PCUs)
Base Year 1961 1979 1996 2005 2005
Study
Area
BMR BMR MCGM MCGM MMR
Internal 71,000 72,315 1,72,152
External 10,000 54,428 1,20,938
Total 63,000 81,000 1,26,743 2,33,000 2,93,088
Estimated Goods Vehicle Travel from previous Studies

Traffic Survey Locations
External Travel Demand: Outer Cordon Locations
• OC1: Near Tansa River, NH8
• OC2: Near Ambadi Naka, SH35
• OC3: Near Kasna Bridge, NH3
• OC4: Goveli Gaon, MSH2
• OC5: Near Ratholi, SH43
• OC6: Near Karjat Jn., SH38
• OC7: Near Khopoli, NH4
• OC8: Near Toll Plaza, MPE
• OC9: Near Naygaon, NH17

Traffic Survey Analysis:
Outer Cordon Locations
Total Traffic:
97,000 Vehicles/day
1,82,000 PCUs/dayThane
Virar
Kalyan Dombivali
Navi Mumbai
Greater
Mumbai
Panvel
Uran
Alibagh
NH
8
MSH2
SH43
To
Ah
me
da
ba
d
To Murbad
1 2
3
4
5
6
7
8
9
51004900
300300
800900
114007600
26800
27200
All Traffic Figures are in PCUs/Day
• Major Corridors: Ahmedabad-Pune

Location Wise Contribution of
Passenger Vehicles: Outer Cordon
Locations
Total Daily Traffic:
54,882 Vehicles
59,904 PCUs
Thane
Virar
Kalyan Dombivali
Navi Mumbai
Greater
Mumbai
Panvel
Uran
Alibagh
NH
8
MSH2
SH43
To
Ah
me
da
ba
d
To Murbad
1 2
3
4
5
6
7
8
9
9.59%
0.55%
1.05%
6.75%13.9
4%
All Figures are expressed as % of
total passenger vehicles entering and
exiting from the MMR
Major Corridors:
• Pune
• Goa
• Ahmedabad
• Murbad

All Figures are expressed as % of
total freight vehicles entering and
exiting from the MMR
Thane
Virar
Kalyan Dombivali
Navi Mumbai
Greater
Mumbai
Panvel
Uran
Alibagh
NH
8
MSH2
SH43
To
Ah
me
da
ba
d
To Murbad
1 2
3
4
5
6
7
8
9
3.43%
0.15%
0.90%
13.3%37.6
1%
Total Daily Traffic:
42,118 Vehicles
1,22,097 PCUs
Location Wise Contribution of Freight %
Vehicles: Outer Cordon Locations
Major Corridors:
• Ahmedabad
• Pune
• Nashik
• Goa
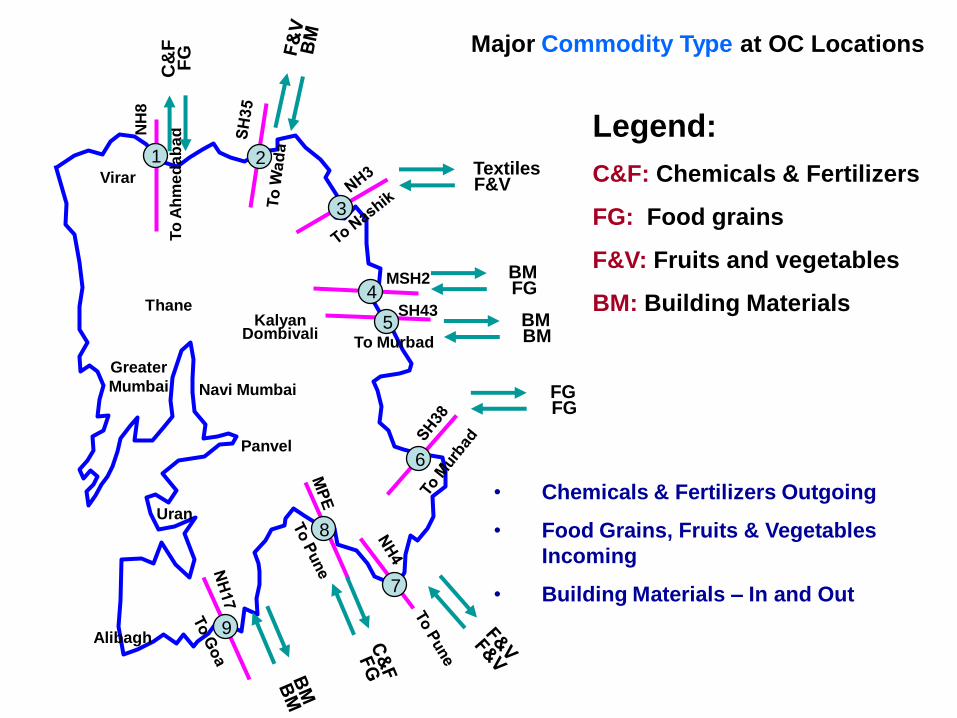
Major Commodity Type at OC Locations
Thane
Virar
Kalyan Dombivali
Navi Mumbai
Greater
Mumbai
Panvel
Uran
Alibagh
NH
8
MSH2
SH43
To
Ah
me
da
ba
d
To Murbad
1 2
3
4
5
6
7
8
9
BMFG
BMBM
FGFG
TextilesF&V
C&
FF
G
Legend:
C&F: Chemicals & Fertilizers
FG: Food grains
F&V: Fruits and vegetables
BM: Building Materials
• Chemicals & Fertilizers Outgoing
• Food Grains, Fruits & Vegetables
Incoming
• Building Materials – In and Out

Average Traffic Composition
2-Axle Truck
23.88%
3-Axle Truck
7.13%
Others
0.04%
Animal Drawn
0.07%
LCV
8.40%
Other Std. Bus
2.75%BEST/Govt. Bus (SD)
3.84%
BEST (DD)
0.00%
Mini Bus
0.43%
Car/Jeep (exc. Taxi)
31.26%
Taxi
0.70%
Auto Rickshaw (3W)
2.57%
Two Wheeler
10.87%
Cycle
0.85%
Maxi Cab (3W)
3.15%
Tractor Trolly
0.05%MAV
3.96%
Tractor
0.07%
• Car & Two wheeler: 42%
• Bus: 6.6%
• Goods vehicles: 43.5%
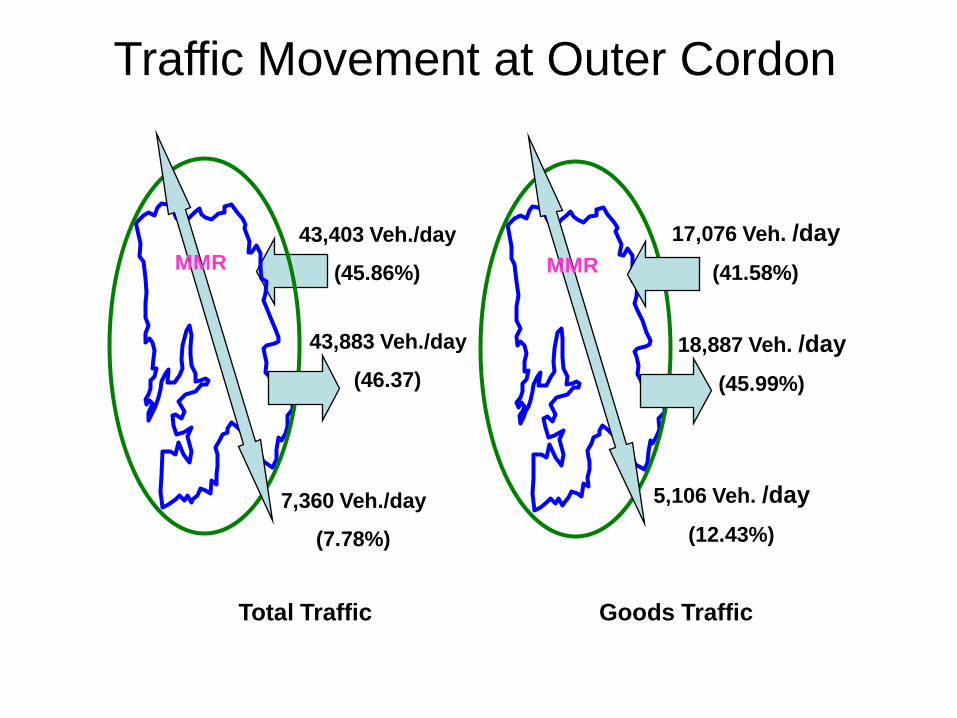
Traffic Movement at Outer Cordon
17,076 Veh. /day
(41.58%)
5,106 Veh. /day
(12.43%)
18,887 Veh. /day
(45.99%)
43,403 Veh./day
(45.86%)
7,360 Veh./day
(7.78%)
43,883 Veh./day
(46.37)
Total Traffic Goods Traffic
MMRMMR

Average Pay Load (Tonnes)
LocationLCV
2 Axle Truck
3 AxleTruck
MAVs
OC1 (NH8) 4.07 6.96 9.87 15.94
OC2 (SH35) 2.47 7.63 10.47 22.00
OC3 (NH3) 3.12 8.44 11.79 15.15
OC4 (MSH2) 5.76 5.97 16.63 18.05
OC5 (SH43) 0.96 5.01 --- ---
OC6 (SH38) 2.55 6.65 22.00 ---
OC7 (NH4) 3.68 6.30 10.92 13.65
OC8 (MPE) 7.66 9.65 12.38 17.00
OC9 (NH17) 3.09 5.99 7.82 11.37
Average 3.71 6.96 12.73 16.16

Travel Demand Modelling
and Transport Networks
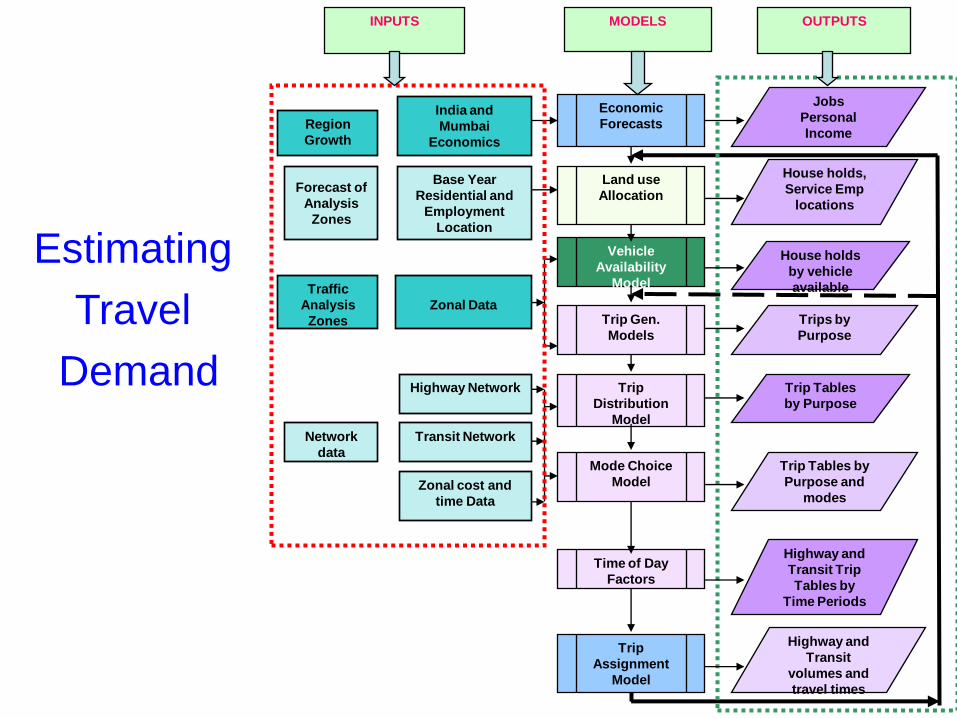
Economic
Forecasts
Jobs
Personal
Income
India and
Mumbai
Economics
Base Year
Residential and
Employment
Location
Land use
Allocation
House holds,
Service Emp
locations
Zonal Data
Vehicle
Availability
Model
Trip Gen.
Models
House holds
by vehicle
available
Trips by
Purpose
Highway Network
Transit Network
Zonal cost and
time Data
Trip
Distribution
Model
Mode Choice
Model
Time of Day
Factors
Trip Tables
by Purpose
Trip Tables by
Purpose and
modes
Highway and
Transit Trip
Tables by
Time Periods
Trip
Assignment
Model
Highway and
Transit
volumes and
travel times
Region
Growth
Forecast of
Analysis
Zones
Traffic
Analysis
Zones
INPUTS MODELS OUTPUTS
Network
data
Estimating
Travel
Demand

Household Category Sub-Models
Trip End Model
Trip Distribution Model
HighwayNetworks
Transit Networks
Modal Choice Model
Matrix Manipulation
Road Network
Inventories
Roadside Interview Surveys
Household Interview Surveys
Transit Passenger Surveys
Transit Network Surveys
NMT Matrices
Transit Matrices
Highway Matrices
External Trip
Matrices
Goods Vehicle
Matrices
Traffic Assignment Model
Convergence
Model Outputs
External
Trip Model
GoodsVehicleModel
Yes
NoNo
Travel Demand Modelling
Framework

National Urban Transport Policy
• Encourage public transport
Encourage greater use of public transport enabling the establishment of quality focused multi modal public transport systems that are well Integrated providing seamless travel across modes
• Integrate Land use with transport
Encouraging integrated land use and transportation planning so the travel distances are minimized and access to livelihoods education and other social needs
• Transport to guide developmentIncorporating urban transportation as an important parameter at the urban planning stage rather than being a consequential requirement.
• Provide equitable allocation of space
Bringing about more equitable allocation of road space with people rather than vehicles as its main focus

Concept for Development
Intensification Focused on
Transportation Corridors
Potential greenfield develop-
ment areas for predominantly
residential uses in planned
communities including
related service uses and
employment
Higher order nodes/
corridors/centres where
offices are the predominant (but
not exclusive) employment use.
Higher density mixed use
developments encouraged close
to rail and Metro stations
Predominantly “clean” industrial
employment areas generally
accommodating employment
uses not compatible with
higher density nodes or
requiring significant land
areas

Long Term (2031)Metro and Sub-urban Network Long Term (2031)Highway Network
YearCumulative Length (km)
Metro Sub-urban
2016 208 237
2021 318 237
2031 450 248
Year Cumulative Length (km)
2016 982
2021 1229
2031 1739

Multi-Modal Corridors

Virar-Alibaug Multi-Modal Corridor (MMC)
MMC From Virar- Alibaug
Length of 140 km (Approx.)
4+4 lanes (other traffic including
BRTS) +Service Roads
Metro (In middle of the Corridor)
Utility Corridor (Under ground)
Non Motorized Transport (Cycles) lane
Estimated Cost : INR 100 billion

Right of Way Requirements
100
100
100
80
80
100
100
100
100
100
100
100
100
100
100
100
100
100
100
100
100
100
80
100
100100
The Right of Way (ROW) shown
for each segment of the
proposed Regional Road
Network is the preferred ROW
width.
However , an absolute minimum
width of 80 m is required.
Finalisation of the ROW’s
require, detailed feasibility
studies specific to each corridor.
Metropolitan
Regional Roads
ROW, 100 m100
LEGEND

External Travel Demand
Demand Forecast: Horizon Year
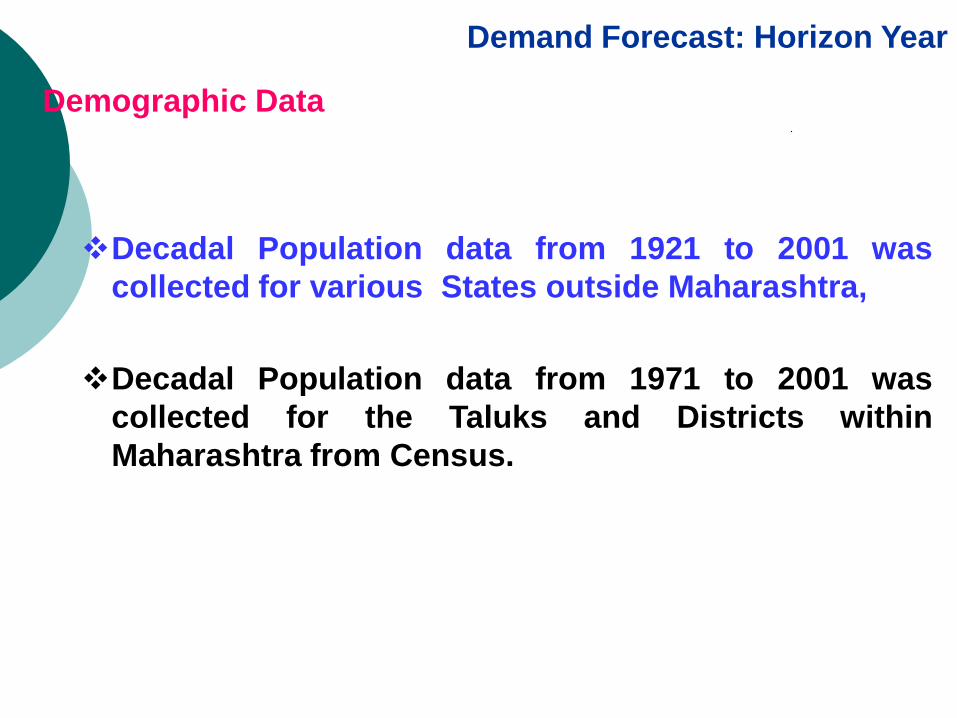
Demographic Data
Decadal Population data from 1921 to 2001 was
collected for various States outside Maharashtra,
Decadal Population data from 1971 to 2001 was
collected for the Taluks and Districts within
Maharashtra from Census.

Demand Forecast: Horizon Year
Economic Data
Net State Domestic Product / Net District Domestic Product
NSDP and NDDP for the states and districts of Maharashtra
was collected from Economic Survey of India for the financial
years 2000 to 2004 (at constant prices 1993-94).
The Compound Annual Growth Rate (CAGR) was calculated
after compiling the data for the detailed zone level.

Demand Forecast: Horizon YearZoning System
Demand Forecast: Horizon Year
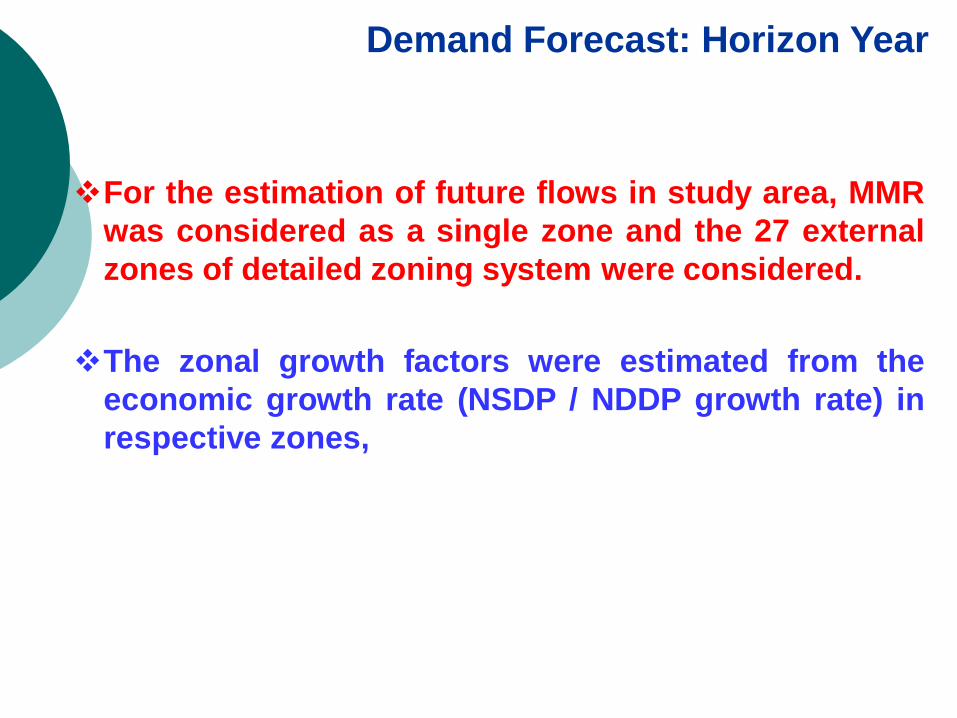
For the estimation of future flows in study area, MMR
was considered as a single zone and the 27 external
zones of detailed zoning system were considered.
The zonal growth factors were estimated from the
economic growth rate (NSDP / NDDP growth rate) in
respective zones,

Description
Growth Rate (%) Description Growth Rate (%)
B T P B T P
1-MMR 3.00 5.90 11.68 3014-Solapur, Osmanabad 0.84 0.16 1.07
3001-Palghar 2.55 4.88 9.70
3015-Buldana,Washim,Aurangabad,Jalna, Hingoli, Parbhani, Nanded, Latur, Beed, Ahmadnagar 2.69 4.06 8.65
3002-Vada 1.79 4.88 8.88
3016-Akola, Amravathi, Nagpur, Gondia, Bhandara, Wardha, Chandrapur, Gadchiroli, Yavatmal 1.72 7.08 12.00
3003-Shahapur 2.18 4.88 9.293017-Nandurbar, Dhule, Jalgaon,
Nashik 2.16 6.19 11.20
3004-Murbad 1.80 4.88 8.90 3051-Gujrat 2.03 5.52 10.07
3005-Vikrumgad, Jawahar, Mokhadai 2.25 4.88 9.37 3052-Indore 3.45 3.02 7.91
3006-Talasari, Dahanu 2.13 4.88 9.25 3053-MP, Chattisgarh & Orissa 2.04 3.02 6.43
3007-Kholapur, Pen 2.49 3.42 7.49 3054-Delhi 4.27 6.21 13.51
3008-Sudhagad 1.13 3.42 6.073055-Haryana, Punjab, Rajasthan,
Himachal Pradesh & JK 2.01 4.12 8.00
3009-Alibag, Murud 1.38 3.42 6.33 3056-UP, Bihar 1.65 2.95 5.94
3010-Roha 1.95 3.42 6.93 3057-Andhra Pradesh 1.59 3.92 7.28
3011-Mangaon, Tala, Shrivardhan, Mhasla, Mahad, Poladpur 1.01 3.42 5.94 3058-Karnakata, Kerala 1.74 4.58 8.40
3012-Satara, Ratnagiri, Sangli, Kolhapur, Sindhudurg 1.51 4.34 7.80 3059-Tamilnadu 1.34 4.67 8.11
3013-Pune 2.78 3.47 7.883060-WB, Assam, Meghalaya,
Arunachal Pradesh & Mizoram 2.05 4.58 8.72
B: Bus T: Truck P: Private Veh’s

Demand Forecast: Horizon Year: Goods Traffic
ZoneBase Horizon
Trip Production Trip Attraction Trip Production Trip Attraction
2 94 76 397 330
3 553 515 2410 2314
5 448 409 1893 1771
7 619 569 2392 2257
9 1043 922 3967 3684
12 575 509 2383 1960
15 1281 1157 5314 4993
16 768 670 3160 2713
21 283 303 1111 1161
24 164 138 673 562
27 436 449 1921 1917
30 329 378 1441 1564
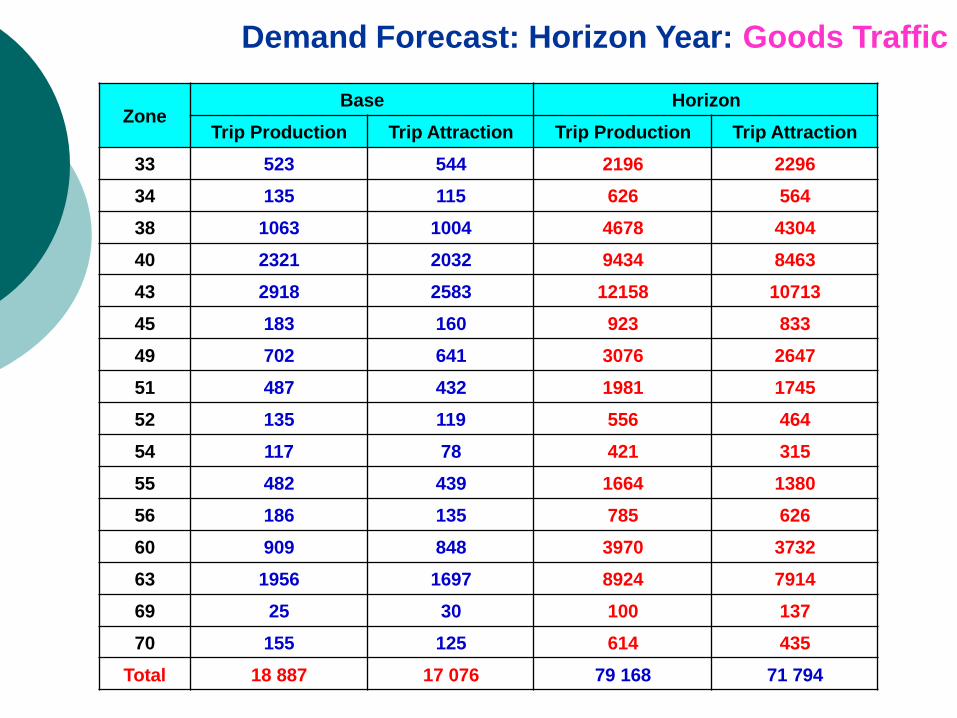
Demand Forecast: Horizon Year: Goods Traffic
ZoneBase Horizon
Trip Production Trip Attraction Trip Production Trip Attraction
33 523 544 2196 2296
34 135 115 626 564
38 1063 1004 4678 4304
40 2321 2032 9434 8463
43 2918 2583 12158 10713
45 183 160 923 833
49 702 641 3076 2647
51 487 432 1981 1745
52 135 119 556 464
54 117 78 421 315
55 482 439 1664 1380
56 186 135 785 626
60 909 848 3970 3732
63 1956 1697 8924 7914
69 25 30 100 137
70 155 125 614 435
Total 18 887 17 076 79 168 71 794

SCALE:
Max. Trips: 22844
11422 TRIPS=1.0 Unit
GOODS-HORIZON

Demand Forecast: Horizon Year: Bus Traffic
Bus Movement Base % Horizon %
Internal - External 3022 47% 5569 47%
External - Internal 3338 52% 6145 52%
External - External 119* 2% 147* 1%
Total 6479* 100% 11861* 100%
Note: * After duplication is Subtracted
Base Horizon
Trip Production
Trip Attractions
Trip Production
Trip Attractions
3022 3338 5569 6145

17 Inter-State/ Inter-City Bus Terminals
6 Inter-City rail Terminals
5 Major Truck Terminals and 10 Mini Truck Terminals
13 Passenger Water Transport (PWT) Terminals
Proposed Terminals

!.
!.!.
!.!.
!.
!.
!.
!.
!.
!.
!.
!.
Rural MMR
Vasai/ Virar
Greater Mumbai
Navi Mumbai/ CIDCO
Pen/SEZ
Sion
Nancy
Thane
Kurla
Dadar
Parel
Kalyan
Panvel
Borivli
Bhiwandi
Mumbai
Central
Rural MMR
Alibag
Proposed
Inter State Bus Terminals
1. Near Wadala Truck Terminal,
MCGM
2. Near Mira-Bhayander
3. Kalyan area
4. Panvel area
1
2
3
4
Proposed Inter State Bus Terminals
(2005-2008)
Existing Bus Terminals
Proposed Inter State Bus Terminals
(2009-2031)

!.
!.!.
!.!.
!.
!.
!.
!.
!.
!.
!.
!.
Rural MMR
Vasai/ Virar
Greater Mumbai
Navi Mumbai/ CIDCO
Pen/SEZ
Sion
Nancy
Thane
Kurla
Dadar
Parel
Kalyan
Panvel
Borivli
Bhiwandi
Mumbai
Central
Rural MMR
Alibag
Proposed
Inter City Bus Terminals
1. Western Suburbs of MCGM: In between
Bandra and Borivali
2. Eastern suburbs of MCGM: In between
Kurla and Mulund
3. Western part of Thane Municipal
Corporation area
4. Nerul in NMMC
5. Kalyan Dombivali Municipal Corporation
area
6. Vasai/ Virar area
7. Pen-SEZ area
8. Bhiwandi-Nizampur MC area
9. Mira-Bhayandar MC area
10. Navgarh-Manikpur Municipal Council area
11. Alibagh Municpal Council area
12. Karjat Municipal Council area
13. Badlapur Municipal Council area
Existing Bus Terminals
Proposed Inter City Bus Terminals (2008-16)
Proposed Inter City Bus Terminals (2017-21)
Proposed Inter City Bus Terminals (2022-31)
1
2
3
4
5
6
7
89
13
10
11
12
Proposed Navi Mumbai Airport

1
5
2
3
6
4
1. Near Vasai Virar
2. Near Kalyan
3. Near Khandeshwar sub-urban
railway station and retaining the
Panvel as en-route station
4. Intersection of MTHL Metro
corridor and Belapur-Uran
Railway Line
5. Near Bhiwandi (Near Vasai
Road-Diva Line)
6. Near Jite on Panvel-Thal
Railway Line
Proposed
Inter-City Rail Terminals
Proposed Inter-City Rail Terminals
(2008-2016)
Existing Inter-City Rail Terminals
Proposed Inter-City Rail Terminals
(2017-2021)
Proposed Inter-City Rail Terminals
(2022-2031)
Proposed Navi Mumbai Airport

1
5
4
32
Proposed Truck Terminals
1. Near boundary of MMR on NH-8
(Mumbai-Ahmedabad)
2. Near boundary of MMR on
Mumbai Pune Expressway
3. Near JNPT/NMSEZ/MMSEZ
4. Near the proposed international
airport in Navi Mumbai
5. On NH-3 (Mumbai-Nashik)
Proposed Major Truck Terminals
(2008-2016)
Proposed Major Truck Terminals
(2017-2021)
Proposed Major Terminals
(2022-2031)
Proposed Navi Mumbai Airport
10 Mini Truck Terminals
(One in each cluster except Island
cluster)
Major Truck Terminals
Proposed Mini Truck Terminals
(2008-2031)

Summary of Preliminary Cost EstimatesProposed Transport Networks
Horizon Years 2031, 2021 and 2016
Component
2008- 2031 2008- 2021 2008- 2016
Length
km
Cost
Rs Crores
Length
km
Cost
Rs Crores
Length
km
Cost
Rs Crores
Metro System 450 1,10,095 316 82,707 204 59,623
Suburban Railway System 241 30,978 231 28,670 231 27,920
Highway System 1660 57,412 1114 44,844 836 31,173
Highway Corridors with
EBL77 1,670 111 2,000 147 11,079
Bus System 4,280 2,150 1,104
Passenger Water Transport 480 480 480
Truck Terminals, Inter-Bus
and Rail Terminals3,040 2,038 1,126
Total 2,429
2,07,956
1,772
1,62,890
1,418
1,32,504
US $ 50.72 Billion US $ 39.73 Billion US $ 32.32 Billion
Note:
1. The cost estimates are @ 2005-06 prices2. The metro system cost includes the cost of rolling stock3. The sub-urban railway system cost includes the cost of rolling stock for new lines, capacity enhancement of the to the existing sub-
urban railway system

Funding Sources
Sl.
No.Transport System
Estimated
Total Cost
(Rs. Crore)
@ 2005-06 Prices
Inter
Governmental
Transfer (%)
Development
Charges
(%)
Borrowing
(%)
Private
Investment
(%)
I Metro System 1,10,095 15 25 0 60
II Sub-Urban Railway System 30,978 30 30 40 0
III Highway System 57,412 25 25 30 20
IV
Highway Corridors with
Exclusive Bus Lanes
(EBL) 1,670 25 25 30 20
V Bus System 4,280 25 25 30 20
VI Passenger Water Transport 480 12 12 16 60
VII Terminals 3,040 21 21 28 30
Total Investment, Average %
Funding Sources
2,07,956
( US$ 43324
million)
20 28 12 40
Potential Need for Re-allocation from Private to Development Charges
Particularly for Metro
Creation of Dedicated Infrastructure fund for MMR for implementation of Proposed Infrastructure Projects in MMR
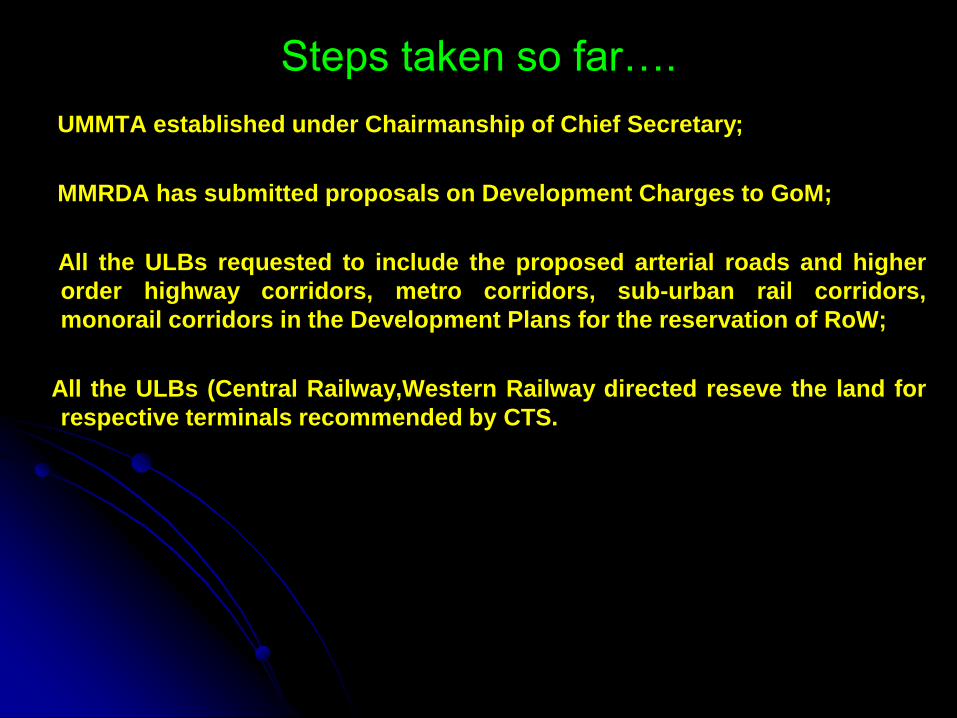
Steps taken so far….
UMMTA established under Chairmanship of Chief Secretary;
MMRDA has submitted proposals on Development Charges to GoM;
All the ULBs requested to include the proposed arterial roads and higher
order highway corridors, metro corridors, sub-urban rail corridors,
monorail corridors in the Development Plans for the reservation of RoW;
All the ULBs (Central Railway,Western Railway directed reseve the land for
respective terminals recommended by CTS.
