individual returns to education in the spanish tourism
TRANSCRIPT

Tourism Economics, 2012, 18 (6), 1229–1249 doi: 10.5367/te.2012.0171
Individual returns to education in theSpanish tourism sector during the
economic crisis
ADELAIDA LILLO-BAÑULS AND JOSÉ M. CASADO-DÍAZ
Departamento de Análisis Económico Aplicado and Instituto Universitario de InvestigacionesTurísticas (IUIT), Universidad de Alicante, Ap. Correos 99, E-03080 Alicante, Spain.E-mail: [email protected]; [email protected]. (Corresponding author: Adelaida Lillo-Bañuls.)
This paper analyses individual returns to education in the Spanishtourism sector. The results, which are robust to different specifica-tions of Mincer earnings regressions, show that the earnings returnsto schooling for tourism workers are only half those for all othersectors, and that the difference in returns between these two groupshas increased significantly during the economic crisis. This hashappened at a time when the earnings range between those withlower and higher qualifications has narrowed in tourism while it hasremained stable in other sectors, and when tourism has been capableof retaining most of its workforce while the rest of the economy hasexperienced a sharp decrease in employment.
Keywords: human capital; returns to education; gender differences;over-education; economic crisis; Spain
JEL classification: J24; I21
The tourism sector comprises many different activities offering services to bothtourists and residents, making it difficult to measure employment and addedvalue in the sector, which is usually identified with a range of services includinghotel and restaurant services (the most representative segment of the sector),transport, travel agencies and tour operators and leisure, cultural and sportingactivities. The sum of these subsectors constitutes a major economic activitywith a broadly positive impact on economic growth and employment in Europe(European Commission, 2010), which is especially important in Spain. As anOrganisation for Economic Co-operation and Development (OECD) country, thetourism sector has the highest relative weight in terms of employment (13%)and gross added value (11%) according to 2009 data.
It is well known that the tourism sector is characterized as a low-tech andtraditionally labour-intensive industry and, particularly in the hotel andrestaurant subsector, by a greater presence of women, young people andimmigrants among its workforce. It is also a sector that has a high capacity for

TOURISM ECONOMICS1230
retaining its workforce or even generating employment in periods of loweconomic growth. Thus, for example, data from 2007 to 2010 – referring tothe evolution of the number of people registering with the Spanish SocialSecurity in the tourism sector – show that a reduction in tourism sector workersoccurred (2.2%) in 2009 only. However, in the economy as a whole, the decreasebegan a year earlier and, after a particularly sharp fall in 2009 (5.7%), continuedin 2010 – a year when the tourism sector was already experiencing net increasesin Social Security registrations. The significant contribution of the tourismindustry to economic growth has been well documented in a growing numberof empirical analyses (see for example Brau et al, 2007; and Cortés-Jiménez,2008). This evidence was recently corroborated and extended by Di Liberto(2010), who used a large international panel dataset covering a long period oftime and found that despite being a low-tech, low skill sector, the positiveeffects of tourism specialization on economic growth are reinforced by higherhuman capital endowments.
The working conditions in tourism have frequently been described in termsof their negative features. In the case of Spain, for example, the White Paperon Human Resources in the Tourism Sector (Exceltur, 2004) reported that thetourism labour market is characterized by uncomfortable working hours(including bank holidays, weekends, and evening and night shifts), longerweekly working hours than in other sectors, uncompetitive wages, jobs thatrequire few or no qualifications, low investment in training, poor careerprospects and low external recognition and social prestige, among other aspects.
Thus, on the one hand tourism is a very important economic sector in Spain,with a high capacity to generate employment, even during the more difficultmoments of the recent economic cycle and one which employs some of the mostdisadvantaged groups in the labour market. On the other hand, but notindependently of this fact, tourism comprises a series of activities where humancapital intensity is lower than elsewhere, and which are characterized by lowlevels of productivity. A less-educated workforce is, in principle, less inclinedto generate and/or adopt innovations of any kind (technological, organizational,etc); it has a lower capacity to adapt to change and fewer possibilities, therefore,for contributing to improving the competitiveness of the sector in a contextof increasing international competition. Without a doubt, a large part ofthe capacity to address the challenges the sector is facing will arise fromimprovements in its human capital (Lillo-Bañuls, 2009b).
This paper analyses different aspects of human capital in the Spanish tourismsector during the economic crisis and concentrates on the measurement ofindividual returns to education in this period. Human capital denotes theknowledge, competences and useful skills that are accumulated by individualsin the process of education and training throughout their working lives. Oneof the most frequently used theoretical frameworks for analysing the earningsaspects of human capital is the one proposed by Becker (1964). This frameworkis based on the idea that investing in education increases the productivity ofworkers and, therefore, that the earnings of those who have spent more yearsstudying are higher. Based on this theory, the calculation of the rate of returnsto education seeks to measure the relationship that exists between the incomeof individuals and their education. This is a branch of literature that hasreceived multiple empirical additions in the last 50 years, although most

1231Returns to education in the Spanish tourism sector
international contributions focusing on tourism are relatively recent. Forexample, see Lillo-Bañuls and Ramón-Rodríguez (2005), Lillo-Bañuls (2009a),Muñoz-Bullón (2009), Lillo-Bañuls and Casado-Díaz (2010), Marchante et al(2005), Campos-Soria et al (2009 and 2011), García-Pozo et al (2011) andGarcía-Pozo et al (2012), who concentrated on the Spanish tourism industry;Santos and Varejão (2007), who analysed the Portuguese case; and Thrane (2008and 2010), who examined diverse aspects of the education–earnings relationshipin the Norwegian tourism industry.
The paper is organized as follows: the next section presents the econometricspecifications, which are variations of Mincer earnings regressions, and the dataused, which stem from the Quality of Life at Work Survey (ECVT) – a surveyconducted annually by the Spanish Ministry of Employment and Immigration.An exploratory analysis confirms some of the negative characteristics that theliterature assigns to the tourism labour market, such as a greater incidence ofpart-time and fixed-term contracts, and lower hourly earnings compared to therest of the economy. It is also notable that although educational levels are, onaverage, lower in tourism (especially at university level), the incidence of over-education is, however, higher in this sector than in others. This is followed bya section that reports and discusses the results, according to which aconsiderable difference exists in the main period of analysis (2008–2010)between the individual returns to education in tourism and in the rest of thesectors. Moreover, the analysis conducted for the preceding year provides areference point that indicates that the difference in the returns to educationbetween both groups has increased during the crisis. Some explanations for thisphenomenon are explored in this section. The magnitude of the difference inthe returns to education between tourism and the rest of the sectors is robustto the diverse specifications reported here, where the traditional Mincer modelis extended through the inclusion of additional covariates, one of which iseducational mismatch. The conclusions are presented in the last section.
Econometric specifications and data
Econometric specifications
In order to calculate private returns to education, diverse specifications of theMincer earnings equations (1974) have been used. In its original formulation(1), this Mincerian equation estimates the effect of individuals’ education andwork experience on their wage earnings:
log Wi= βo + β1Si + β2Xi + β3 X2i + ui, (1)
where i is a subscript for individuals (i = 1, 2,..., n), the dependent variable,earnings Wi, adopts a logarithmic form whereby the estimated coefficients maybe interpreted in terms of rates of return, Si refers to years of schooling, Xi isyears of work experience (this variable is also included as a squared term) andui is a random error term. In Equation (1), education appears as a continuousvariable – the number of years of schooling – and the estimated coefficient canbe interpreted as the elasticity of income-education, namely, the expected value

TOURISM ECONOMICS1232
of the partial derivative of the logarithm of income with respect to the schoolingreceived. Therefore, β1 represents the increase in pay of each additional year ofschooling, which, in the absence of direct costs, is equal to the IRR (InternalRate of Return). In Equation (1) it is assumed that the marginal returns toeducation are constant. This assumption is relaxed in Equation (2), whereeducation is considered in discrete terms and the coefficients β1–β3 may be usedto estimate the earnings premiums that, in relation to the reference category(E1, primary schooling), are obtained by individuals who have completed basicsecondary education (E2), professional training (E3), baccalaureate (E4) oruniversity studies (E5).
log Wi = βo + β1 E2 + β2 E3 + β3 E4 + β4E5 + β5 Xi + β6 X2i + ui. (2)
Equations (1) and (2) were estimated for two different periods1 with the aimof assessing how the returns to education have evolved during the crisis periodcompared to the pre-crisis period, for both the tourism sector and the rest ofthe economy (Table 2). Separate estimations were conducted for male and femaleworkers.
Diverse extended versions of Equation (1) were also considered, in whichadditional explanatory variables were included either separately (Tables 4 andA2) or simultaneously (Table 5). The aim of this strategy was to test thestability of the estimated returns to education across different specifications ofthe model, while at the same time allowing the assessment of the effects of eachof the covariates on such returns.
Data and variables
The data used refer to wage earners aged between 16 and 64 and stem fromthe ECVT, a source that provides information referring to the year 2007 andis the base from which a pool for the crisis period 2008–2010 was alsoconstructed. This survey contains information about workers who are employedin firms of any size, even those with only one worker, which is particularlyimportant when analysing a sector such as tourism, characterized by many smallcompanies. It is worth highlighting that this statistical source allows a goodestimation of the real experience of the worker as it indicates the year whenthe worker began to work for the first time. It also includes variables that makeit possible to analyse other important human capital related aspects such aseducational mismatches or the satisfaction of workers in terms of differentaspects of their working conditions.
The dependent variable in all the specifications is the logarithm of netearnings per effective working hour. This was calculated by combining theinformation that the statistical source provides on both monthly earnings andthe number of hours worked per week. The variable Education (Si) in Equation(1) refers to years of formal education. Following standard practice, this wascalculated using information on the maximum level of education attained bythe respondent, by assigning to each of these levels the minimum number ofyears necessary for their completion. This second variable is the one used inEquation (2), where the reference category, E1, is primary schooling and therest of the categories refer to those who have completed basic secondaryeducation, E2, professional training, E3, baccalaureate, E4, or university studies,

1233Returns to education in the Spanish tourism sector
E5. Experience (Xi) was calculated using the information provided about thetime when the individual actually started to work.2 This approach avoids theinaccuracy of the most frequently used alternative, where experience is proxiedby age minus years of schooling (usually the minimum number of yearsnecessary to complete the declared level of education), minus six. This secondmethod overestimates the experience of employees who have taken more thanthe statutory number of years to obtain a qualification and of those who havetaken longer to find a job (something very relevant in a country where youthunemployment is especially high). All the estimations in the article includecontrols for the year of reference when they are based on pooled data (that is,those for the period 2008–2010).
The extended models subsequently considered in Tables 4, A2 and 5incorporate additional explanatory variables. The first of these is educationalmismatch, which is included through a set of discrete variables that refer towage earners who define themselves as appropriately educated (referencecategory), over-educated, under-educated or in need of different training inrelation to their current job. A direct subjective method was used here,according to which the worker was classified as over-educated or not dependingon his/her response to the question asking whether he/she considered his/herlevel of education to be sufficient for carrying out his/her current job. Type ofcontract is a variable that has two categories in the statistical source: fixed-term/temporary (reference category) and indefinite. A variable distinguishingbetween full-time (reference category) and part-time work has also beenconsidered. Nationality distinguishes between two categories: Spanish (this isthe reference category and also includes individuals with dual nationality inthose cases where Spanish is one of them) and all other nationalities (in thiscategory, the presence of individuals from other advanced economies accordingto the International Monetary Fund [IMF] classification was residual). Thevariable firm size, which is measured in terms of number of employees, has fourcategories: 1–9 (reference category), 10–49, 40–249 and 250+. FollowingAmmermueller et al (2009), a continuous variable capturing the logarithm ofthe regional unemployment rate has also been included. To construct this, eachindividual was assigned the annual average unemployment rate registered in his/her region of residence, using the Labour Force Survey as the source. Lastly,controls were included for the six Spanish regions where tourist inflow is aboveaverage.
The descriptive analysis in Table 1 confirms a fact that has been well-established in the literature on human capital in the tourism sector: its lowlevels of education compared to other economic activities.3 Approximately 50%of wage earners are concentrated in the two lowest levels of schooling, primary(E1) and basic secondary (E2), which is almost 14 percentage points higher thanfigures for the rest of the economy. On the other end of the educational scale,the percentage of university graduates (13.73%) is less than one-half that ofall other economic activities. It is worth noting, however, that these figures haveincreased slightly with respect to those estimated by Lillo-Bañuls and Ramón-Rodríguez (2005), based on the same statistical source for the period 1999–2002. These authors found that workers with primary and basic secondaryeducation accounted for 57% of the total tourism sector and universitygraduates accounted for 11%.

TOURISM ECONOMICS1234
Table 1. Description of statistics for the main study variables, 2008–2010.
Rest of sectors TourismTotal Women Men Total Women Men
Education (years) 10.99 11.67 10.46 9.66 9.91 9.48(4.06) (3.99) (4.03) (3.55) (3.68) (3.45)
Level of education:Primary (E1)
* 16.63% 12.65% 19.84% 20.76% 20.44% 20.99%Secondary (E2) 20.17% 17.22% 22.54% 29.60% 26.66% 31.68%Professional training (E3) 21.54% 20.73% 22.20% 19.43% 17.43% 20.85%Baccalaureate (E4) 12.54% 13.37% 11.84% 16.47% 18.78% 14.85%University (E5) 29.11% 36.03% 23.55% 13.73% 16.70% 11.63%
Hourly earnings (€) 8.63 8.50 8.73 7.51 6.97 7.89(6.01) (6.39) (5.68) (4.33) (4.19) (4.39)
Experience (years) 20.09 18.59 21.29 19.18 17.02 20.70(11.69) (11.30) (11.85) (11.68) (11.15) (11.81)
Fixed-term contract* 21.21% 23.11% 19.69% 26.30% 29.56% 23.99%
Indefinite contract 78.79% 76.89% 80.31% 73.70% 70.44% 76.01%
Full-time* 87.03% 77.95% 94.33% 82.54% 73.13% 89.17%
Part-time 12.97% 22.05% 5.67% 17.46% 26.87% 10.83%
NationalitySpanish* 90.94% 91.52% 90.48% 81.17% 78.11% 83.82%Other nationalities 9.06% 8.48% 9.52% 18.83% 21.89% 16.68%
Firm size (no. of employees)1–9* 21.88% 22.65% 21.26% 33.25% 37.34% 30.36%10–49 21.32% 18.55% 23.55% 26.17% 24.38% 27.43%50–249 16.51% 15.68% 17.18% 15.02% 13.38% 16.17%250 or more 40.29% 43.13% 38.00% 25.57% 24.90% 26.04%
Educational mismatchAppropriately educated* 77.74% 74.9% 80.11% 73.23% 68.98% 76.23%Over-educated 18.48% 21.82% 15.81% 22.39% 25.41% 20.26%Under-educated 1.94% 1.66% 2.16% 1.93% 2.59% 1.46%In need of different training 1.84% 1.74% 1.93% 2.45% 3.01% 2.05%
Note: Continuous variables: mean and standard deviation – in parentheses; discrete variables:percentage of total number of employees in the category. *Reference category in regressions in Tables 2,4, 5, and A2.Source: Authors’ own calculations based on the Quality of Life at Work Survey (ECVT), 2008–2010(Spanish Ministry of Employment and Immigration).
With regards to workforce composition, approximately 19% of tourismworkers are immigrants – a proportion that is more than double that of therest of the Spanish economy (9.06%). The values for the other variables includedin Table 1 show that hourly earnings are lower in tourism than in othereconomic activities (€7.51 versus €8.63), something that is especially evidentin the case of women (€6.97 versus €8.50), and that the incidence of fixed-

1235Returns to education in the Spanish tourism sector
term and part-time contracts is higher in tourism compared to the rest of theSpanish economy (26.30% versus 21.21% and 17.46 versus 12.97%,respectively). According to Table 1, very small firms are much more abundantin the Spanish tourism industry compared to the rest of the economy: whereasthe proportion of tourism workers in firms with less than 10 employees is33.25%, this figure is almost 12 percentage points lower in the rest of thesectors (21.88%).
Table 1 also explores another variable that should be considered together witheducation when analysing tourism’s human capital – educational mismatch. Thedata show that over-education affects around 22.4% of those working in thetourism services4 versus 18.5% in the rest of the sectors. It is worth pointingout that this phenomenon seems to become more pronounced over time.Therefore, according to Lillo-Bañuls (2009b), who pooled data from crosssections of the same source for the period 1999–2002, over-education affected19% of workers in tourism services. These results are consistent with otheranalyses referring to the Spanish economy as a whole, which have also revealedan increase in the incidence of this phenomenon using other analyticaltechniques (Aguilar and García-Crespo, 2008; Murillo et al, 2010). Accordingto García-Montalvo and Peiró (2009) this fact is largely explained by an excesssupply of qualified workers in relation to the demand for their services,something that might be more pronounced in the case of tourism: between theacademic years 1988/1989 and 2008/2009, the number of students enrolled inthe Tourism Diploma multiplied by 2.5 within a context in which enrolmentsin general fell by approximately 25% (INE, 2010).
One of the main conclusions from this descriptive section examining humancapital in tourism is that although the educational levels of those working inthis sector are lower than in the rest of the economy, the incidence of over-education is higher. The potentially negative effects of such a combinationcannot be ignored. As stated earlier, a less-educated workforce is, in principle,less inclined to adopt innovations and has a lower capacity to adapt to changeor contribute to improving the competitiveness of the sector. From a socialpoint of view, it seems evident that over-qualification is an indication of afailure in the allocation of productive resources – a part of which lie idle withrespect to the human capital of the individuals concerned. Moreover, over-education reduces workers’ motivation and well-being, which could have anegative effect on productivity, giving rise to the paradox whereby betterqualified workers could prove to be less productive if the characteristics of theirjobs do not correspond to their training. In the following section, the impactof over-education on earnings and on individual returns to education is one ofthe aspects discussed.
Results
Basic model
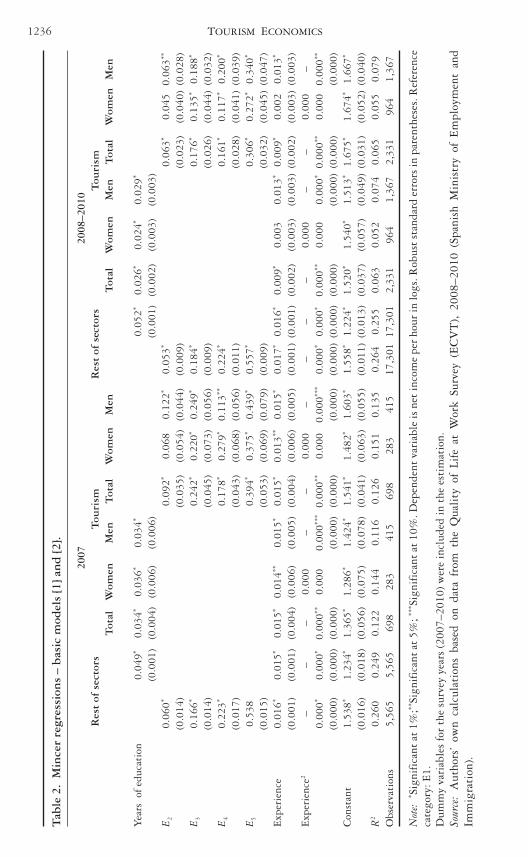
Table 2 includes the results of the ordinary least squares (OLS) regressionanalysis based on Equations (1) and (2). From Table 2, it is clear thatindependently of the group of activities considered, a higher level of education
TOURISM ECONOMICS1236
Tab
le 2
.M
ince
r re
gres
sion
s –
bas
ic m
odel
s [1
] an
d [2
].
20
07
20
08–2
010
R
est
of s
ecto
rs
T
ouri
sm
R
est
of s
ecto
rs
Tou
rism
Tot
alW
omen
Men
Tot
alW
omen
Men
Tot
alW
omen
Men
Tot
alW
omen
Men
Yea
rs o
f ed
ucat
ion
0.04
9*0.
034*
0.03
6*0.
034*
0.05
2*0.
026*
0.02
4*0.
029*
(0.0
01)
(0.0
04)
(0.0
06)
(0.0
06)
(0.0
01)
(0.0
02)
(0.0
03)
(0.0
03)
E2
0.06
0*0.
092*
0.06
80.
122*
0.05
3*0.
063*
0.04
50.
063**
(0.0
14)
(0.0
35)
(0.0
54)
(0.0
44)
(0.0
09)
(0.0
23)
(0.0
40)
(0.0
28)
E3
0.16
6*0.
242*
0.22
0*0.
249*
0.18
4*0.
176*
0.13
5*0.
188*
(0.0
14)
(0.0
45)
(0.0
73)
(0.0
56)
(0.0
09)
(0.0
26)
(0.0
44)
(0.0
32)
E4
0.22
3*0.
178*
0.27
9*0.
113**
0.22
4*0.
161*
0.11
7*0.
200*
(0.0
17)
(0.0
43)
(0.0
68)
(0.0
56)
(0.0
11)
(0.0
28)
(0.0
41)
(0.0
39)
E5
0.53
80.
394*
0.37
5*0.
439*
0.55
7*0.
306*
0.27
2*0.
340*
(0.0
15)
(0.0
53)
(0.0
69)
(0.0
79)
(0.0
09)
(0.0
32)
(0.0
45)
(0.0
47)
Exp
erie
nce
0.01
6*0.
015*
0.01
5*0.
014**
0.01
5*0.
015*
0.01
3**0.
015*
0.01
7*0.
016*
0.00
9*0.
003
0.01
3*0.
009*
0.00
20.
013*
(0.0
01)
(0.0
01)
(0.0
04)
(0.0
06)
(0.0
05)
(0.0
04)
(0.0
06)
(0.0
05)
(0.0
01)
(0.0
01)
(0.0
02)
(0.0
03)
(0.0
03)
(0.0
02)
(0.0
03)
(0.0
03)
Exp
erie
nce2
––
–0.
000
––
0.00
0–
––
–0.
000
––
0.00
0–
0.00
0*0.
000*
0.00
0**0.
000
0.00
0***
0.00
0**0.
000
0.00
0***
0.00
0*0.
000*
0.00
0**0.
000
0.00
0*0.
000**
0.00
00.
000**
(0.0
00)
(0.0
00)
(0.0
00)
(0.0
00)
(0.0
00)
(0.0
00)
(0.0
00)
(0.0
00)
(0.0
00)
(0.0
00)
(0.0
00)
(0.0
00)
Con
stan
t1.
538*
1.23
4*1.
365*
1.28
6*1.
424*
1.54
1*1.
482*
1.60
3*1.
558*
1.22
4*1.
520*
1.54
0*1.
513*
1.67
5*1.
674*
1.66
7*
(0.0
16)
(0.0
18)
(0.0
56)
(0.0
75)
(0.0
78)
(0.0
41)
(0.0
63)
(0.0
55)
(0.0
11)
(0.0
13)
(0.0
37)
(0.0
57)
(0.0
49)
(0.0
31)
(0.0
52)
(0.0
40)
R2
0.26
00.
249
0.12
20.
144
0.11
60.
126
0.15
10.
135
0.26
40.
255
0.06
30.
052
0.07
40.
065
0.05
50.
079
Obs
erva
tion
s5,
565
5,56
569
828
341
569
828
341
517
,301
17,3
012,
331
964
1,36
72,
331
964
1,36
7
Not
e:* S
igni
fica
nt a
t 1%
;**Si
gnif
ican
t at
5%
; *** S
igni
fica
nt a
t 10
%. D
epen
dent
var
iabl
e is
net
inco
me
per
hour
in lo
gs. R
obus
t st
anda
rd e
rror
s in
par
enth
eses
. Ref
eren
ceca
tego
ry: E
1.D
umm
y va
riab
les
for
the
surv
ey y
ears
(200
7–20
10) w
ere
incl
uded
in t
he e
stim
atio
n.So
urce
:A
utho
rs’
own
calc
ulat
ions
bas
ed o
n da
ta f
rom
the
Qua
lity
of
Life
at
Wor
k Su
rvey
(E
CV
T),
2008
–201
0 (S
pani
sh M
inis
try
of E
mpl
oym
ent
and
Imm
igra
tion
).
1237Returns to education in the Spanish tourism sector
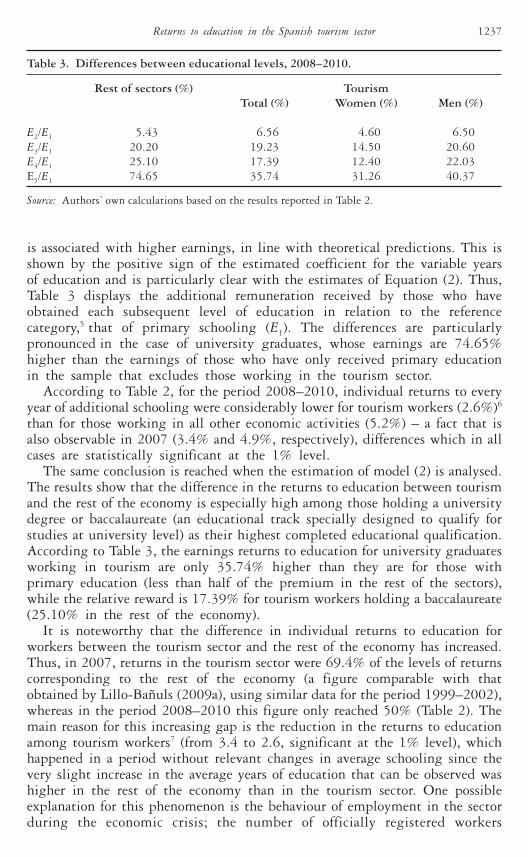
Table 3. Differences between educational levels, 2008–2010.
Rest of sectors (%) TourismTotal (%) Women (%) Men (%)
E2/E1 5.43 6.56 4.60 6.50E3/E1 20.20 19.23 14.50 20.60E4/E1 25.10 17.39 12.40 22.03E5/E1 74.65 35.74 31.26 40.37
Source: Authors’ own calculations based on the results reported in Table 2.
is associated with higher earnings, in line with theoretical predictions. This isshown by the positive sign of the estimated coefficient for the variable yearsof education and is particularly clear with the estimates of Equation (2). Thus,Table 3 displays the additional remuneration received by those who haveobtained each subsequent level of education in relation to the referencecategory,5 that of primary schooling (E1). The differences are particularlypronounced in the case of university graduates, whose earnings are 74.65%higher than the earnings of those who have only received primary educationin the sample that excludes those working in the tourism sector.
According to Table 2, for the period 2008–2010, individual returns to everyyear of additional schooling were considerably lower for tourism workers (2.6%)6
than for those working in all other economic activities (5.2%) – a fact that isalso observable in 2007 (3.4% and 4.9%, respectively), differences which in allcases are statistically significant at the 1% level.
The same conclusion is reached when the estimation of model (2) is analysed.The results show that the difference in the returns to education between tourismand the rest of the economy is especially high among those holding a universitydegree or baccalaureate (an educational track specially designed to qualify forstudies at university level) as their highest completed educational qualification.According to Table 3, the earnings returns to education for university graduatesworking in tourism are only 35.74% higher than they are for those withprimary education (less than half of the premium in the rest of the sectors),while the relative reward is 17.39% for tourism workers holding a baccalaureate(25.10% in the rest of the economy).
It is noteworthy that the difference in individual returns to education forworkers between the tourism sector and the rest of the economy has increased.Thus, in 2007, returns in the tourism sector were 69.4% of the levels of returnscorresponding to the rest of the economy (a figure comparable with thatobtained by Lillo-Bañuls (2009a), using similar data for the period 1999–2002),whereas in the period 2008–2010 this figure only reached 50% (Table 2). Themain reason for this increasing gap is the reduction in the returns to educationamong tourism workers7 (from 3.4 to 2.6, significant at the 1% level), whichhappened in a period without relevant changes in average schooling since thevery slight increase in the average years of education that can be observed washigher in the rest of the economy than in the tourism sector. One possibleexplanation for this phenomenon is the behaviour of employment in the sectorduring the economic crisis; the number of officially registered workers

TOURISM ECONOMICS1238
employed in tourism activities remained stable between 2007 and 2010 (a fallof 0.2%), as opposed to the reduction of 8.2%8 experienced by the Spanisheconomy as a whole. The data indicate that while the economic crisis may havegenerated an adjustment in the Spanish labour market, particularly through ahigh level of job destruction, in tourism activities wage restraints may havebeen applied, which in turn would have differentially and negatively affectedthe returns to education of the workers in the sector. This interpretation iscoherent with the evolution of hourly earnings: on average, these increased by6.22% between 2007 and 2008–2010 for tourism workers, while the figure was9.51% for those working in the rest of the sectors (Tables 1 and A1). However,in the case of those holding university degrees, the hourly earnings in tourismdid not change (–0.22%) whereas they grew by 7.28% in the rest of the sectors.9
As a result of this evolution, the difference in average hourly earnings betweenthe group of workers holding university degrees and those for whom primaryeducation is their highest completed educational level decreased between bothperiods from around 51% to 33% for tourism workers, while it remained stable(around 70%) for the rest of the economy.
With respect to work experience, Table 2 shows that experienced workersreceive a lower earnings premium in the tourism sector than in the rest of theeconomy; this is especially true among female tourism workers, for whom thevariable experience is not significant. This circumstance, which is confirmedboth when education is considered as a continuous variable and when it isintroduced as a series of dummy variables, could be related to some of the lessattractive characteristics of employment in the sector; namely, high seasonalityand job turnover and the low training requirements commonly associated withsuch work. It seems clear then that both official qualifications and theacquisition of skills and abilities through work experience are less valued in thetourism sector than in the rest of the economy.
Including other variables in the model
In order to analyse the possible influence of educational mismatch and otherrelevant variables on the economic returns to education, a more comprehensivespecification of Equation (1) has been estimated in this section, where a numberof additional covariates has been included both separately (Tables 4 and A2)and simultaneously (Table 5).
Starting with Table 4, where educational mismatch is considered in additionto the variables in Equation (1), the estimated coefficient for over-education hasa negative sign and is significant in the samples analysed. However, thecoefficients corresponding to the under-education variable are not significant,while those corresponding to workers who state that they need a different typeof training are not significant in the estimation for the tourism sector. Theresults reveal, therefore, that over-educated workers obtain a lower remunerationthan those who have similar levels of education and experience and occupy jobsfor which they are appropriately trained. Specifically, the expected value of thewage differences between an over-educated worker with respect to the referencecategory (appropriately educated) is a reduction of 11.5% in tourism and 18.9%in the rest of the sectors.10 It is interesting to note that in this case, the penaltysuffered by tourism workers is lower than that experienced by those working

1239Returns to education in the Spanish tourism sector
Table 4. Mincer regressions including educational mismatch, 2008–2010.
Rest of sectors Tourism
Years of education 0.055* 0.030*
(0.000) (0.002)Over-educated –0.173* –0.109*
(0.008) (0.020)Under-educated 0.023 0.034
(0.020) (0.072)In need of different training –0.062* –0.006
(0.19) (0.067)Experience 0.015* 0.008*
(0.001) (0.002)Experience2 –0.000* –0.000
(0.000) (0.000)Constant 1.240* 1.522*
(0.124) (0.037)R2 0.278 0.007Observations 17,301 2,331
Note: Dependent variable is hourly net earnings in logs. Significance levels: *1%,**5%, ***10%. All specifications include controls for the survey year. Robuststandard errors are reported in parentheses. ‘Appropriately educated’ is thereference category for the variable reflecting educational mismatch.Source: Authors’ own calculations based on data from the Quality of Life at WorkSurvey (ECVT), 2008–2010 (Spanish Ministry of Employment and Immigration).
in the wider economy, although this occurs within a context in which the wagesof tourism workers are lower than average, as are the returns to educationaccording to the years of schooling.
The inclusion in model (1) of variables that capture educational mismatchresults in an increase in the estimated returns to education in relation to theresults reported in Table 2. Thus, as opposed to 2.6% (tourism) and 5.2% (restof the sectors), estimated returns to education in Table 4 are 3% and 5.5%,respectively. It is therefore obvious that the returns to education suffer adownward bias when over-education is not taken into account: according to thisresult, the years of over-education would have a lower return than the yearsspent in acquiring the training required for the job. Hence, when consideringall the years of formal education of the individual jointly and equally, theaverage return of each of them is lower. These results contradict, at leastpartially, the assumptions of the human capital theory, which associatesproductivity and wages with the level of education, since this theory impliesthat the returns to education should be independent of whether the worker isover-educated or not. However, the results may be more compatible with theoriesbased on job competition (Thurow, 1970), which contend that the worker isessentially compensated in accordance with the position that he/she occupiesrather than his/her level of education. If a worker has a higher level of academictraining than is required to carry out his/her job, this circumstance is not paid.The worker will only be remunerated for the tasks carried out within his/her

TOURISM ECONOMICS1240
Table 5. Mincer regressions – extended model, 2008–2010.
Rest of sectors TourismTotal Women Men Total Women Men
Years of education 0.049* 0.056* 0.046* 0.026* 0.025* 0.028*
(0.000) (0.001) (0.001) (0.002) (0.003) (0.003)Fixed-term contract 0.061* 0.023** 0.090* 0.051* –0.004 0.090*
(0.007) (0.011) (0.009) (0.019) (0.027) (0.026)Part-time contract 0.142* 0.224* 0.088* 0.202* 0.290* 0.171*
(0.010) (0.012) (0.019) (0.023) (0.029) (0.037)Born in a foreign –0.076* –0.077* –0.084* –0.067* –0.074** –0.060***
country (0.010) (0.017) (0.012) (0.022) (0.029) (0.032)Firm size: 10–49 0.062* 0.066* 0.047* 0.075* 0.080** 0.061**
employees (0.008) (0.013) (0.010) (0.020) (0.032) (0.026)Firm size: 50–249 0.104* 0.096* 0.105* 0.099* 0.070** 0.095*
employees (0.009) (0.014) (0.011) (0.022) (0.035) (0.029)Firm size: 250 or 0.165* 0.156* 0.174* 0.171* 0.111* 0.204*
more employees (0.007) (0.012) (0.009) (0.021) (0.030) (0.029)Over-educated –0.164* –0.161* –0.163* –0.106* –0.079* –0.121*
(0.007) (0.010) (0.010) (0.020) (0.027) (0.028)Under-educated 0.017 –0.018 0.036 0.033 –0.031 0.170
(0.020) (0.035) (0.023) (0.075) (0.079) (0.119)In need of –0.068* –0.069** –0.078* –0.010 –0.30 0.021)different training (0.018) (0.031) (0.020) (0.064) (0.086) (0.089)
Log regional –0.140* –0.101* –0.179* –0.134* –0.50 –0.192*
unemployment (0.017) (0.030) (0.020) (0.051) (0.095) (0.058)Region of residence: 0.092* 0.073* 0.113* 0.047 0.035 0.045Andalusia (0.015) (0.026) (0.017) (0.044) (0.078) (0.053)
Region of residence: 0.075* 0.076* 0.091* 0.064*** 0.71 0.097**
Balearic Islands (0.016) (0.024) (0.021) (0.034) (0.050) (0.046)Region of residence: 0.040** 0.020 0.067* 0.025 0.01 0.060Canary Islands (0.019) (0.032) (0.023) (0.048) (0.076) (0.065)
Region of residence: 0.019* –0.000 0.049* 0.027 0.20 0.046***
Catalonia (0.007) (0.011) (0.008) (0.020) (0.032) (0.025)Region of residence: 0.025** 0.024 0.035** 0.043 0.018 0.074Valencian (0.012) (0.020) (0.015) (0.038) (0.057) (0.050)Community
Region of residence: 0.054* 0.033** 0.083* 0.056*** 0.063 0.067***
Community of (0.009) (0.014) (0.013) (0.031) (0.051) (0.037)Madrid
Experience 0.013* 0.011* 0.014* 0.007* 0.001 0.010*
(0.000) (0.001) (0.001) (0.002) (0.003) (0.003)Experience2 0.000 0.000* 0.000* 0.000*** 0.000 0.000**
(0.000) (0.000) (0.000) (0.000) (0.000) (0.000)Constant 1.478* 1.267* 1.613* 1.732* 1.561* 1.847*
(0.041) (0.069) (0.050) (0.115) (0.201) (0.139)R2 0.319 0.322 0.357 0.146 0.185 0.167Observations 17,301 7,710 9,591 2,331 964 1,367
Note: Dependent variable is hourly net earnings in logs. Significance levels: *1%, **5%, ***10%. Allspecifications include controls for the survey year. Robust standard errors are reported in parentheses.Source: Authors’ own calculations based on data from the Quality of Life at Work Survey (ECVT),2008–2010 (Spanish Ministry of Employment and Immigration).

1241Returns to education in the Spanish tourism sector
job. As indicated by Aguilar and García-Crespo (2008), if, in accordance withjob competition theory, wages depend on the educational level required for jobs,then the years of over-education would be unproductive.
The estimations of alternative specifications of Equation (1), in which severalcovariates are considered individually, are reported in Table A2. The signs ofthese additional estimated coefficients are similar for tourism and the rest ofthe economy (although the values vary): positive for both fixed-term and part-time contracts, as well as for all firm sizes included in the estimation (thereference category was 1–9 employees). As expected, the sign is negative forthe constructed variable log regional unemployment. Most of the regionaldummies are not significant for tourism. The most relevant conclusion, however, isthat the gap in the individual returns to education between tourism and therest of the economy remains largely unaltered throughout the variousspecifications, with the control for nationality being the variable that inducesthe minimum distance between both estimated returns to education (5.1 versus2.7).
In Table 5, the traditional Mincer equation is extended through thesimultaneous inclusion of all the covariates that were considered individually inTables 4 and A2.
According to the results reported in Table 5, the individual returns toeducation in tourism are the same (2.6) in both the pure human capital model(Table 2) and the extended one (Table 5), while a slight reduction is observedin the rest of the sectors (from 5.2 to 4.9). A separate analysis for male andfemale workers shows that the gap is especially wide for women, whose returnsare 2.5 in tourism and 5.6 in the rest of the economy, while for male workersthe figures are 2.8 and 4.6, respectively. The signs of the estimated coefficientsare the same as in Tables 4 and A2. Regarding educational mismatch, the hourlyearnings of workers who classify themselves as over-educated are 17.82%(exp(0.164)-1=0.1782) lower than those within the reference category(appropriately educated), and 11.18% in the case of workers in the tourismsector. These figures are comparable to those in Table 4. As expected, aggregateregional unemployment has an inverse relationship with hourly wage. Finally,and with respect to experience, the coefficient suffers a comparable reduction(around 23%) in the extended model for both tourism and the rest of thesectors, and therefore the distance between both parts of the economy remainsconstant in this regard (the figure for tourism being almost half that of therest of the economy).
The evidence reported in Table 5, together with that of Tables 4 and A2,confirms that the main results are robust to the inclusion of additional variables:the individual returns to education continued to be significantly lower in thetourism sector than in the rest of the economy during the crisis, and this wasalso the case of the rewards associated with each year of work experience.
Conclusion
In Spain, tourism is more important in terms of both employment and grossadded value than in any other OECD country. It is a sector that has withstoodthe worst moments of the recent economic cycle particularly well, and one

TOURISM ECONOMICS1242
which employs a greater proportion of some of the groups for which workvariables register their worst values in aggregate terms (women, younger people,immigrants).
This article concentrates on Spanish tourism human capital. First of all, theresults corroborate that the returns that workers obtain in exchange for theirinvestment in an additional year of official training are much lower in the caseof tourism activities than in the rest of the sectors (2.6% and 5.2%, respectively,according to the results from the parsimonious specification of the Mincerearnings regression for the period 2008–2010), a result that has proved to berobust to the inclusion of additional explanatory variables. The study revealsan apparent paradox: over-education (that is, the existence of workers whose levelof training is higher than that required to perform the tasks inherent to thejob position that they occupy) is greater in this sector than in the rest of theeconomy, while the relative weight of those workers with higher levels ofeducation is much less than in other sectors, especially with regards touniversity degrees. The results show that over-educated workers are subject toa wage penalty in relation to those who, with the same training, occupypositions that are more appropriate to their level of education. In a sector wherehuman capital is fundamental, the lower levels of satisfaction with workingconditions associated with this phenomenon could be particularly negative, notonly in terms of the individual well-being of workers but also in terms ofproductivity levels and aspects related to the quality of the service provided.It is also worth mentioning that the earnings premium associated with workexperience in tourism is approximately half that of the rest of the sectors, andin fact this variable is not significant for female workers.
Secondly, in the context of the global economic crisis, the gap between thereturns in the tourism sector and in the rest of the economy has widened, tothe extent that the wage return for each additional year of schooling in theperiod 2008–2010 is only half that obtained in the rest of the Spanish economicsectors, whereas in the preceding year it accounted for around 70%. This is dueto a significant reduction in such returns among tourism workers: 2.6 comparedto 3.4. One possible limitation of this result is the heterogeneity associated withthe fact that the comparison was made between the period 2008–2010 and theyear 2007 due to the absence of relevant data for 2005 and 2006. However,the estimated returns for 2007 are extremely close to comparable estimationsconducted in a previous analysis for the period 1999–2002 (3.3), somethingthat allays initial concerns and supports the robustness of this result. Onetentative explanation for this increasing gap could be related to the behaviourof employment in this sector during the recession: it remained stable between2007 and 2010, while it decreased by 8.2% for the Spanish economy as a whole.The adjustment in the Spanish labour market took place largely through a highlevel of job destruction whereas in tourism activities, wage restraints have beenapplied, which may have differentially and negatively affected the returns toeducation of the workers in this sector. This interpretation is coherent with theevolution of hourly earnings: on average, they increased by 6.22% between2007 and 2008–2010 for tourism workers, while the figure was 9.51% for thoseworking in the rest of the sectors. However, in the case of those holdinguniversity degrees, hourly earnings in tourism did not change, whereas theygrew by 7.28% in the rest of the economy. As a result of this evolution, the

1243Returns to education in the Spanish tourism sector
difference in average hourly earnings between the group of workers holdinguniversity degrees and those whose highest completed educational level isprimary education decreased between both periods from around 51% to 33%for tourism workers, while it remained stable (around 70%) for the rest of theeconomy.
The calculation of the returns to education is a relevant tool for successfulplanning of both individuals’ and policy makers’ actions in the education andlabour markets. Among the very diverse social and individual implications ofthe results of this study, two are of particular relevance. Firstly, from a globalpoint of view, the incentives for undertaking training are lower in this sectorthan in others and have decreased during the crisis, which may have contributedto the retention of a large part of tourism’s labour force but could alsocontribute to dissuading more qualified individuals from entering the sector,generating problems of competitiveness in the medium and long-term in acontext of growing international competition. One of the implications of thisevolution in rates of return on human capital is that it seems necessary fromthe labour supply point of view to match the levels of education received bystudents with the real needs of the sector, in order to avoid over-educationbecoming consolidated as a structural characteristic of the sector. Thecontributions made by public authorities and the educational community to thesustainable growth of the sector should, particularly in a country such as Spain,focus on improving specialized tourism training at all levels. It is essential togenerate synergies with the productive fabric (providing a tourism educationcapable of responding to the training needs demanded by the businessenvironment), designing general and specific competences that take intoaccount both the professional profiles and the capacities that should bedeveloped in each field of education related to tourism. In terms of demand,it is also necessary to take action with respect to production methods andactivities, which should be offered in such a way that the overall level of thequality of employment in the sector is improved. Unquestionably, this represents along-term strategy, which is difficult to reconcile with the specificcircumstances this industry faces on a day-to-day level, given the pressures thatit is under, circumstances that lead to giving priority to maintaining costs aslow as possible. Within this context, the strategy followed by many tourismcompanies until now, based on a cheap workforce in a sector in which mostjobs require easily acquired and transmitted skills, seems reasonable. It hasenabled many companies to ignore issues of productivity, skills developmentand general workplace enhancement (Baum, 2007). However, this strategy,which has been exacerbated by the crisis, might be difficult to sustain in aglobal context characterized by the increasing capacity of internationalcompetitors where this type of workforce is abundant (European Commission,2010). It seems reasonable therefore to stimulate demand among tourismemployers for human capital gained through education. As pointed out by García-Pozo et al (2011), increasing the formal education of the sector’spotential employees will be ineffective unless the structure of the jobsundergoes improvements, something that would include appropriatecompensations not only in terms of pay but also in the achievement of jobsatisfaction objectives. This, in turn, would logically lead to the generation ofquality jobs in the tourism industry which would counteract preconceived

TOURISM ECONOMICS1244
notions of generalized precariousness in the sector and make it more attractiveto human capital.
Finally, and from a territorial point of view, there is a question that cannotbe ignored: tourism activity is not equally important in all regional and locallabour markets. Those which are highly dependent on this sector, such as theBalearic or Canary Islands, where more than 20% of the regional gross domesticproduct (GDP) is generated by tourism activities, could be at risk of generatingan unfavourable perception of education. This, in turn, could generatedisincentives among the younger generations or towards the arrival of betterqualified immigrants. In this case, the medium and long-term effects oncompetitiveness would not be limited to the tourism sector but would spill overinto the whole of the regional/local economy, since employment expectationswould logically be linked to the predominant sectors in the region. Thisphenomenon could be particularly significant in those cases where theconsiderable weight of the tourism sector is combined with other low-tech/low-skills sectors such as that of the construction of second homes, as is the casein some of the autonomous regions on the Spanish Mediterranean coast, andcould be seriously detrimental to territorial cohesion.
Endnotes
1 The crisis period in this study covers the years 2008–2010, while the previous period onlyincludes data for 2007 due to the lack of data for 2005, when the survey was discontinued, and2006, when some key variables (see note 2) were not included in the questionnaire, thusprecluding the creation of a pool for a similar number of years to make the comparison. However,it should be noted that the estimated value for the return to education for tourism workers inTable 2 (3.4%) is very similar to the results reported by Lillo-Bañuls and Ramón-Rodríguez(2005), who conducted a comparable analysis based on a pool of four waves of the same statisticalsource for the period 1999–2002. According to their estimations, the individual return toeducation in tourism was 3.3% (the estimated coefficients for the variables experience andsquared experience were 0.015 and –0.000, respectively; all variables were significant at the 1%level). This similar figure contrasts with the estimated value for the period 2008–2010 (2.6%,Table 2) and supports the conclusions reached in the paper, despite initial concerns due to thedissimilarity between the number of years included in each of the reference terms used foranalysing the recent evolution of returns to education in the Spanish tourism sector.
2 This approach was not feasible for the year 2006 due to the deletion of some variables fromthe questionnaire, although they were re-introduced in subsequent waves of this survey. Thisis the main reason why it was not possible to use the data for that year to create the comparisonterm in the analysis (see note 1).
3 The criteria employed by the Institute of Tourism Studies, based on the codes used in the SpanishNational Classification of Economic Activities, were adopted to obtain the sub-sample of thoseworkers employed in activities related to tourism.
4 Among workers in the hotel and restaurant sub-sector, the proportion is as high as 26%. Incontrast to these figures is the practical insignificance of under-education, which affects barely2% of workers. For their sample of hotel workers (data derived from the researchers’ survey inAndalusia), Marchante et al (2003) obtained a level of 17.5% of over-educated workers, a figurethat rises to 61.5% when university graduates employed in the sector are examined separately.In the sample used in this article, almost half of workers holding university degrees are affectedby over-education in tourism activities.
5 Calculated as (expβi-1)×100. See Halvorsen and Palmquist (1980) for the interpretation ofdummy variables in semilogarithmic equations.
6 In the hotel and restaurant sub-sector, which employs 65% of tourism workers, the estimatedreturns are even lower: 1.9%.
7 This is especially true among female workers (for which the returns decreased by 27% versusa 15% reduction among male workers).

1245Returns to education in the Spanish tourism sector
8 Data corresponding to workers registered with the Spanish Social Security system in activitiesrelated to tourism and in the economy as a whole (average value for January to December andvariation in relation to the previous year) extracted from IET(2009) and the Ministry ofEmployment and Immigration.
9 According to the statistical source used in the paper, the evolution of hourly earnings by levelof education was as follows: firstly, for workers for whom primary education was their highestcompleted educational level, hourly earnings in 2007 were €6.00 (tourism) and €6.28 (rest ofsectors), and in the period 2008–2010 the figures were €6.83 and €6.80, respectively. Secondly,for workers holding university degrees, hourly earnings in 2007 were €9.08 (tourism) and €10.71(rest of sectors), and in the period 2008–2010 the figures were €9.06 and €11.49, respectively.
10 Calculated as (expβi-1)×100.
References
Aguilar, M.I., and García-Crespo, D. (2008), ‘Desajuste educativo y salarios en España’, EstadísticaEspañola, Vol 50, No 168, pp 393–426.
Ammermueller, A., Kuckulenz, A., and Zwick, T. (2009), ‘Aggregate unemployment decreasesindividual returns to education’, Economics of Education Review, Vol 28, pp 217–226.
Baum, T. (2007), ‘Human resources in tourism: still waiting for change’, Tourism Management, Vol 28,pp 1383–1399.
Becker, G.S. (1964), Human Capital: A Theoretical and Empirical Analysis, With Special Reference toEducation, National Bureau of Economic Research, New York.
Brau, R., Lanza, A., and Pigliaru, F. (2007), ‘How fast are small countries growing? Evidence fromthe data for 1980–2003’, Tourism Economics, Vol 13, No 4, pp 603–614.
Campos-Soria, J.A., Ortega-Aguaza, B., and Ropero-García, M.A. (2009), ‘Gender segregation andwage differences in hospitality industry’, Tourism Economics, Vol 15, No 4, pp 847–866.
Campos-Soria, J.A., Marchante-Mera, A., and Ropero-García, M.A. (2011), ‘Patterns of occupationalsegregation by gender in the hospitality industry’, International Journal of Hospitality Management,Vol 30, pp 91–102.
Cortés-Jiménez, I. (2008), ‘Which type of tourism matters to the regional economic growth? Thecases of Spain and Italy’, International Journal of Tourism Research, Vol 10, No 2, pp. 127–139.
Di Liberto, A. (2010), High Skills, High Growth: Is Tourism an Exception? Centro Ricerche EconomicheNord Sud (CRENOS), Working Paper 2010/11.
European Commission (2010), Communication from the Commission to the European Parliament, theCouncil, the European Economic and Social Committee and the Committee of the Regions – ‘Europe, theWorld’s No 1 tourist destination – A New Political Framework for Tourism in Europe’ [COM(2010)352 final].
Exceltur (2004), Libro Blanco de los Recursos Humanos en turismo, Exceltur, Madrid.García Montalvo, J., and Peiró, J.M. (2009), Análisis de la Sobrecualificación y la Flexibilidad Laboral,
Fundación Bancaja, Valencia.García-Pozo, A., Marchante, A.J., and Sánchez-Ollero, J.L. (2011), ‘Occupational differences in the
return on human capital in the Spanish travel agency and hospitality industries’, Tourism Economics,Vol 17, No 6, pp 1325–1345.
García-Pozo, A., Campos-Soria, J.A., Sánchez-Ollero, J.L., and Marchante-Lara, M. (2012), ‘Theregional wage gap in the Spanish hospitality sector based on a gender perspective’, InternationalJournal of Hospitality Management, Vol 31, pp 266–275.
Halvorsen, R., and Palmquist, R. (1980), ‘The interpretation of dummy variables in semilogarithmicequations’, American Economic Review, Vol 70, No 3, pp 474–475.
IET (Instituto de Estudios Turísticos) (2009), Empleo en el Sector Turístico. Informe Anual 2009, IET,Madrid.
INE (Instituto Nacional de Estadística) (2010) Estadísticas de Enseñanza Universitaria. Año Académico2008–2009, INE, Madrid.
Lillo-Bañuls, A. (2009a), El Capital Humano Como Estrategia Competitiva en el Sector Turístico Español,IV International prize on touristic studies Gabriel Escarrer, Universidad de Islas Baleares, EdicionsUIB.
Lillo-Bañuls, A. (2009b), ‘El papel del capital humano en el sector turístico: algunas reflexiones ypropuestas’, Cuadernos de Turismo, Vol 24, pp 53–64.
Lillo-Bañuls, A., and Casado-Díaz, J.M. (2010), ‘Rewards to education in the tourism sector: onestep ahead’, Tourism Economics, Vol 16, No 1, pp 11–23.

TOURISM ECONOMICS1246
Lillo-Bañuls, A., and Ramón-Rodriguez, A.B. (2005), ‘Returns to education in the Spanish tourismlabour market’, Tourism Economics, Vol 11, No 1, pp 119–132.
Marchante, A., Ortega, B., and Pagán, R. (2003), ‘Desajuste educativo y salarios: nueva evidenciapara el caso español’, Revista Asturiana de Economía, Vol 28, pp 131–158.
Marchante, A., Ortega, B., and Pagán, R. (2005), ‘Educational mismatch and wages in the hospitalitysector’, Tourism Economics, Vol 11, No 1, pp 103–117.
Mincer, J. (1974) Schooling, Experience and Earnings, NBER, New York (reprinted in 1993 by GreggRevivals, Aldershot, UK and Brookfield, USA).
Muñoz-Bullón, F. (2009), ‘The gap between male and female pay in the Spanish tourism industry’,Tourism Management, Vol 30, pp 638–649.
Murillo, I.P., Rahona, M., and Salinas, M.M. (2010), Efectos del Desajuste Educativo Sobre el RendimientoPrivado de la Educación: Un Análisis Para el Caso Español (1995–2006), Fundación de las Cajasde Ahorros, Documento de Trabajo No. 520/2010.
Santos, L.D., and Varejão, J. (2007), ‘Employment, pay and discrimination in the tourism industry’,Tourism Economics, Vol 13, No 2, pp 225–240.
Thrane, C. (2008), ‘Earnings differentiation in the tourism industry: gender, human capital andsocio-demographic effects’, Tourism Management, Vol 29, pp 514–524.
Thrane, C. (2010), ‘Education and earnings in the tourism industry: the role of sheepskin effects’,Tourism Economics, Vol 16, No 3, pp 549–563.
Thurow, L.C. (1970), Investment in Human Capital, Wadsworth Pub. Co., Boston, MA.

1247Returns to education in the Spanish tourism sector
Appendix
Table A1. Description of statistics for main study variables, 2007.
Rest of sectors Tourism
Education (years) 10.57 9.63(4.17) (3.70)
Level of education:Primary (E1)
* 21.67% 24.64%Secondary (E2) 19.64% 25.79%Professional training (E3) 19.42% 17.05%Baccalaureate (E4) 12.76% 18.05%University (E5) 26.51% 14.47%Hourly earnings (€) 7.88 7.07
(4.11) (3.61)Experience (years) 19.01 17.91
(12.25) (12.29)
Note: Continuous variables: mean and standard deviation – in parentheses; discrete variables:percentage over total number of employees in tourism/rest of economic activities. *Reference categoryin regressions in Table 2.Source: Authors’ own calculations based on the Quality of Life at Work Survey (ECVT), 2007 (Ministryof Employment and Immigration).

TOURISM ECONOMICS1248
Tab
le A
2.In
trod
uci
ng
add
itio
nal
var
iab
les
to t
he
mod
el, 2
008–
2010
.
Res
t of
sec
tors
Tou
rism
Yea
rs o
f0.
051*
0.05
3*0.
051*
0.04
8*0.
051*
0.02
6*0.
027*
0.02
7*0.
023*
0.02
6*
educ
atio
n(0
.000
)(0
.000
)(0
.000
)(0
.000
)(0
.002
)
Fixe
d-te
rm0.
079*
0.03
8**
cont
ract
(0.0
07)
(0.0
19)
Par
t-ti
me
0.10
5*0.
169*
cont
ract
(0.1
10)
(0.0
22)
Bor
n in
a fo
reig
n co
untr
y–0
.133
*–0
.100
*
(0.0
11)
(0.0
22)
Firm
siz
e:0.
062*
0.07
0*
10–4
9 em
ploy
ees
(0.0
09)
(0.0
20)
Firm
siz
e:0.
105*
0.09
9*
50–2
49 e
mpl
oyee
s(0
.009
)(0
.023
)
Firm
siz
e:0.
170*
0.17
7*
250
or m
ore
em
ploy
ees
(0.0
08)
(0.0
21)
Log
regi
onal
une
mpl
oym
ent
–0.1
60*
–0.1
50*
(0.0
18)
(0.0
53)
Reg
ion
of r
esid
ence
:0.
099*
0.06
2A
ndal
usia
(0.0
15)
(0.0
46)
Reg
ion
of r
esid
ence
:0.
064*
0.06
9**
Bal
eari
c Is
land
s(0
.017
)(0
.034
)
Reg
ion
of r
esid
ence
:0.
047**
0.03
9C
anar
y Is
land
s(0
.020
)(0
.051
)

1249Returns to education in the Spanish tourism sector
Reg
ion
of r
esid
ence
:0.
016**
0.01
9C
atal
onia
(0.0
07)
(0.0
21)
Reg
ion
of r
esid
ence
:0.
031**
0.05
6V
alen
cian
Com
mun
ity
(0.0
13)
(0.0
39)
Reg
ion
of r
esid
ence
:0.
050*
0.06
3***
Com
mun
ity
of M
adri
d(0
.010
)(0
.032
)
Exp
erie
nce
0.01
4*0.
016*
0.01
5*0.
014*
0.01
6*0.
008*
0.01
1*0.
007*
0.00
8*0.
009*
(0.0
00)
(0.0
01)
(0.0
01)
(0.0
01)
(0.0
01)
(0.0
02)
(0.0
02)
(0.0
02)
(0.0
02)
(0.0
02)
Exp
erie
nce2
–0.0
00*
–0.0
00*
–0.0
00*
–0.0
00*
–0.0
00*
–0.0
00**
*–0
.000
*–0
.000
–0.0
00**
*–0
.000
**
(0.0
00)
(0.0
00)
(0.0
00)
(0.0
00)
(0.0
00)
(0.0
00)
(0.0
00)
(0.0
00)
(0.0
00)
(0.0
00)
Con
stan
t1.
195*
1.19
4*1.
261*
1.19
51.
579*
1.50
3*1.
471*
1.55
8*1.
494*
1.84
8*
(0.0
12)
(0.0
12)
(0.0
13)
(0.0
13)
(0.0
43)
(0.0
39)
(0.0
36)
(0.0
39)
(0.0
38)
(0.1
18)
R2
0.26
00.
262
0.26
20.
276
0.26
10.
065
0.08
80.
070
0.00
90.
007
Obs
erva
tion
s17
,301
17,3
0117
,301
17,3
0117
,301
2,33
12,
331
2,33
12,
331
2,33
1
Not
e:D
epen
dent
var
iabl
e is
hou
rly
net
earn
ings
in lo
gs. S
igni
fica
nce
leve
ls: * 1
%, **
5%, **
* 10%
. All
spe
cifi
cati
ons
incl
ude
cont
rols
for
the
surv
ey y
ear.
Rob
ust
stan
dard
erro
rs a
re r
epor
ted
in p
aren
thes
es.
Sour
ce:
Aut
hors
’ ow
n ca
lcul
atio
ns b
ased
on
data
from
the
Qua
lity
of L
ife
at W
ork
Surv
ey (E
CV
T) (
2008
–201
0).