individual responses to stress and burnout: workplace ...42476/thesis... · and burnout: workplace...
TRANSCRIPT
Individual Responses to Stress and Burnout: Workplace Issues
for Australian Nurses and Midwives
Virginia Skinner
RN, CM, BHSc (CSU Wagga Wagga), MNH (UNE, Armidale)
A thesis submitted for the degree of
Doctor of Philosophy of the
University of New England

ii
Acknowledgements
The nurses and midwives who participated in this research and expressed their views
on stress and burnout were providing personal glimpses of their working lives. They
allowed me the privilege to access this information and for this, I thank them. This
research would not have been possible without their time and effort completing my
questionnaire. Now this information can be provided not only to other nurses and
midwives but also to all relevant nursing unit managers and senior health service
managers so they can be alerted to the impact of the phenomena of stress and burnout.
Thank you to my supervisors, Associate Professor Jeanne Madison, Dr Judy Harris,
Dr Christian Alexander, Dr Mary Ditton and Trish Lee-White for all their feedback
and continual encouragement throughout the past six years. Thank you Jeanne for
your support and not letting me get ahead of myself. Thank you Judy for being so
down to earth. A very big thank you for Christian‟s expertise on statistics grounding
me every step along the way, without him, I could never have understood this „other‟
language. Thanks, Mary for your feedback on work theories. Thank you Trish for
being my local support and for reading my work. Their continual support on this
journey I will never forget.
My biggest thank you goes to my husband, Neil, whose constant support over the past
six years has been never ending. Thank you for all the assistance with printing,
collating and stapling 1400 of my questionnaires which totalled 21,000 pages at home
which was an arduous task, for this I am eternally grateful. Even in the low times
throughout this period, he has given me the incentive to strive towards this
achievement. I now can resume some quality time with you.
Thank you to my family, friends and colleagues for putting up with my constant
interest and conversation surrounding the PhD, I know I have sometimes driven them
incessantly mad. A special thankyou to my brother in law, Paul Dumapit who gave
me assistance with formatting my questionnaire and for all his statistical knowledge

iii
and phone calls. Another special thankyou to Dr Suzie Niblett who has constantly
guided me through the process and for all her assistance with referencing and superb
statistical knowledge. Thank you, Suzie, for the long informative phone calls and
conversations for which I will always be grateful.
Thank you also to Dr Katrina King who also saved me in my crisis points. Thank you
to Carol Hood for her continued positivity and computer knowledge. I also thank
Anne Purcell for always listening to my ramblings about my PhD! Thank you also
Pam Woolfe for your assistance and referral to some of your work and reviewing my
own. Thank you also to my beloved friend, Liz Crampton who also gave me
invaluable feedback on my work.
Thank you also, Dad for reviewing my work, even at 82 years of age, your feedback
was invaluable. I would also like to thank Associate Professor Martin Veysey for his
continued support as my boss for five years throughout my employment whilst
writing my PhD. I do not think he realizes how supportive and flexible he has been to
me for the duration of this journey. Thank you also to Associate Professor Val
Robertson who gave me the drive to publish my pilot study during my candidature.
Thank you also to Dr Amanda Dawson whose little „chats‟ in the tearoom were very
therapeutic and for providing me with the incentive that I could finish this PhD.
List of Papers
2006 Crux postgraduate conference. 18th
November, Lismore, NSW.
2006 In one voice, Australasian Midwifery Expo. 13th
to 15th
September,
Glenelg, Adelaide, SA.
2006 Bridging the gap between ideas and doing research, Inaugural
Postgraduate Research Conference. 8th
to 11th
August, Armidale,
NSW.
Publication
Skinner, V., Agho, K., Lee White, T., Harris, J. The development of a tool to assess
levels of stress and burnout, The Australian Journal of Advanced Nursing, 2007, Vol
24, No 4, June-Aug.

iv
Abstract
The presentation of this quantitative research looks at the relationship between nurses‟
and midwives‟ individual responses and organisational factors concerning stress and
burnout in the workplace. This research aims to understand and assess the associations
and relationships between nurses‟ and midwives‟ individual responses and factors
causing stress and burnout in the workplace. This might enable nurses and midwives
to reduce the impact of negative consequences of stress and burnout in conjunction
with ethical and professional changes within nursing work practices. A questionnaire
was developed and administered to nurses and midwives working in healthcare
organisations in Australia to document their awareness of their individual responses to
workplace issues and factors leading to stress and burnout.
The majority of this study‟s respondents were dealing with moderate levels of stress
and burnout and showed moderate levels of self-imposed work pressure and
motivation which related to work behaviours. The three factors linked with stress for
this study; being the work environment, psychosocial effects, and job dissatisfaction
were all positively associated with exhaustion, the factor linked with burnout.
Important factors linked with stress and burnout included time-related issues,
excessive workloads, low morale as well as powerlessness. According to this
research, organisational support could be improved so that nurses and midwives can
support their colleagues.
Nurses and midwives with higher levels of education were less likely to place
unreasonable expectations on themselves in relation to work behaviours. Generally,
they placed unnecessary stress upon themselves with no apparent time stressor.
Working longer hours was responsible for deleterious effects of stress and burnout.
Older and more educated nurses and midwives experienced less stress and burnout
than younger ones. Accident and emergency nurses were a higher risk specialty
compared to all other areas of practice. Even though some nurses and midwives were
experiencing long-term effects of stress, the majority of them enjoy their work and
perceive they were suited to their work. Addressing issues pertaining to stress and

v
burnout can influence positively on the challenge of recruiting and retaining a
dedicated nursing and midwifery workforce.

vi
Certifications
I certify that the substance of this thesis has not already been submitted for any degree
and is not currently being submitted for any other degree or qualification.
I certify that any help received in preparing this thesis, and all sources used, have been
acknowledged in this thesis.
Virginia Skinner

vii
Table of Contents
Acknowledgements .......................................................................................... ii Abstract ........................................................................................................... iv
Certifications ................................................................................................... vi Table of Contents ........................................................................................... vii Table of Appendices………………………………………………………………..xi List of Tables.................................................................................................. xii List of Figures ............................................................................................... xvi
Chapter 1 ........................................................................ 17
INTRODUCTION ....................................................................................... 17
1. Major aim of study ...................................................................................... 17
2. Significance of study .................................................................................. 17
3. Objectives of the study ............................................................................... 18
4. Overview of thesis ...................................................................................... 19
Chapter 2 ........................................................................ 21
REVIEW OF THE LITERATURE ............................................................ 21
1. Definitions of stress, burnout and individual responses to workplace issues ....................................................................................................................... 22
1.1. Definition of stress ............................................................................................ 22
1.2. Definition of burnout ........................................................................................ 25
1.3. Definition of individual responses to workplace issues .................................... 26
2. Work stress theories .................................................................................. 27 2.1. Effort-Reward Theory ....................................................................................... 28
2.2. Demand-Control Theory ................................................................................... 29
2.3. Person-Fit Theory ............................................................................................. 34
3. Instruments used to detect stress .............................................................. 36
4. Sources of stress ....................................................................................... 38 4.1. Demographics ................................................................................................... 38
4.2. Environmental working conditions ................................................................... 40
4.3. Organisational factors ....................................................................................... 56
4.4. Shift work and occupational health and safety aspects ..................................... 62
5. Results of stress ........................................................................................ 66 5.1. Emotional and physical wellbeing .................................................................... 66
5.2. Prolonged exposure to stress leading to burnout .............................................. 71
5.3. Family and work balance .................................................................................. 76
6. Individual responses .................................................................................. 78 6.1. Individual reactions to stress ............................................................................. 78
6.2. Individual responses according to situational factors ....................................... 82
6.3. Personality hardiness concept ........................................................................... 84
7. Coping strategies ....................................................................................... 85 7.1 Positive coping strategies ................................................................................... 85
7.2. Negative coping strategies ................................................................................ 91
8. Stress in other professions......................................................................... 94
9. Gaps in the literature .................................................................................. 97
10. Conclusion ............................................................................................... 97

viii
Chapter 3 ........................................................................ 99
METHODOLOGY ....................................................................................... 99
1. Introduction ................................................................................................ 99 1.1. Ethical considerations ..................................................................................... 100
2. Pilot study ................................................................................................ 101 2.1. Operational definitions of stress, burnout and individual responses .............. 102
2.2. Classifications and coding legends for questionnaire ..................................... 103
2.3. Validity and reliability .................................................................................... 106
2.3.1. Content validity ........................................................................................ 107 A. Generation of items for the draft questionnaire ................................................................. 107 B. Changes to questions relating to stress and individual responses ...................................... 108 C. Changes to questions relating to demographics ................................................................. 109
2.3.2. Internal consistency ................................................................................. 109
2.3.3. Test-retest reliability ................................................................................ 112 A. Processes for determining test-retest reliability ................................................................. 112 B. Data analysis for test-retest reliability ............................................................................... 113
2.3.4. Construct validity ..................................................................................... 115 Factor analysis ........................................................................................................................ 115
2.3.5. Summary .................................................................................................. 116
3. Main study................................................................................................ 117 3.1. Estimation of sample size ............................................................................... 117
3.2. The sample ...................................................................................................... 118
3.3. Recruitment of respondents and coding of questionnaires ............................. 118
3.4. Data collection ................................................................................................ 119
3.5. Levels of statistical analyses ........................................................................... 120
3.5.1. Descriptive statistics ................................................................................ 120
3.5.2. Correlational or inferential statistics ........................................................ 121 Spearman‟s correlation coefficient ......................................................................................... 121
3.5.3. Logistic regression ................................................................................... 122 Multicollinearity for logistic regression ................................................................................. 127
3.5.4. Factor analysis ......................................................................................... 128 A. Sample size and factor loadings ........................................................................................ 129 B. Assessing normality ........................................................................................................... 129 C. Methods used in factor analysis ......................................................................................... 130
a. The Anderson-Rubin method......................................................................................... 130 b. Sampling adequacy ........................................................................................................ 131 c. The Bartlett method ....................................................................................................... 132 d. Inspection of anti-image correlation matrix................................................................... 132 e. Factor extraction ............................................................................................................ 132 f. Communalities ............................................................................................................... 133 g. Inspection of component matrix .................................................................................... 133 h. Residuals ....................................................................................................................... 134 i. Factor rotation ................................................................................................................ 134
D. Factor scores ...................................................................................................................... 135 a. Coding levels for major themes ..................................................................................... 135 b. Coding levels for subscales ........................................................................................... 137
E. Development of questionnaire‟s subscales using factor analysis ....................................... 138 F. Reliability analysis ............................................................................................................. 141
3.5.5. Group comparisons .................................................................................. 144 Kruskal-Wallis test ................................................................................................................. 144
3.6 Overview .......................................................................................................... 144
Chapter 4 ...................................................................... 145
ix
Results ..................................................................................................... 145
1. Univariate descriptive statistics ................................................................ 145 1.1. Sample characteristics ..................................................................................... 145
1.1.1. Demographics .......................................................................................... 146 A. Gender ............................................................................................................................... 146 B. Employment status ............................................................................................................ 146 C. Area of practice ................................................................................................................. 146 D. Age of respondent ............................................................................................................. 147 E. Hours worked per week ..................................................................................................... 148 F. Years in profession............................................................................................................. 150 G. Qualifications .................................................................................................................... 151 H. Living arrangements .......................................................................................................... 151
1.2. Stress, burnout and individual responses ........................................................ 151
1.2.1. Theme: stress ........................................................................................... 152 A. Subscale: work environment ............................................................................................. 153
Individual components ...................................................................................................... 155 B Subscale: psychosocial effects ............................................................................................ 156
Individual components ...................................................................................................... 158 C. Subscale: job satisfaction ................................................................................................... 161
Individual components ...................................................................................................... 162 1.2.2. Theme: burnout ........................................................................................ 164
Subscale: exhaustion .............................................................................................................. 165 Individual components ...................................................................................................... 166
1.2.3. Theme: individual responses ................................................................... 168 Subscale: pressure and motivation ......................................................................................... 169
Individual components ...................................................................................................... 170 1.2.4. Other variables relating to stress and burnout not included in subscales 172
2. Multivariate Statistics ............................................................................... 172 2.1. Bivariate correlations ...................................................................................... 172
2.1.1. Spearman‟s correlation coefficients ......................................................... 172
2.2. Logistic regression .......................................................................................... 179 A. Stress ................................................................................................................................. 180 B. Burnout .............................................................................................................................. 180 C. Individual responses .......................................................................................................... 181 D. Multicollinearity for logistic regression ............................................................................ 181
2.3. Factor analysis ................................................................................................ 182 A. Stress ................................................................................................................................. 182 B. Burnout .............................................................................................................................. 182 C. Individual responses .......................................................................................................... 182
2.3.1. Development of subscales for factor analysis .......................................... 183 A. Stress ................................................................................................................................. 184
Subscales: work environment, psychosocial effects of stress and job satisfaction ............ 184 B. Burnout .............................................................................................................................. 189
Subscale- exhaustion ......................................................................................................... 189 C. Individual responses .......................................................................................................... 194
Subscale- pressure and motivation .................................................................................... 194 2.4. Group comparisons ......................................................................................... 197
2.4.1. Kruskal-Wallis test ................................................................................... 197
3. Summary.................................................................................................. 198
Chapter 5 ...................................................................... 201
Discussion ............................................................................................... 201
1. Questionnaire return rate and demographics ........................................... 202 1.1. Questionnaire return rate ................................................................................. 202
x
1.2. Demographics - comparison of national workforce with study sample ......... 202
1.2.1 Gender ....................................................................................................... 202
1.2.2. Area of practice ........................................................................................ 202
1.2.3. Age in years ............................................................................................. 203
1.2.4. Hours worked per week ........................................................................... 203
1.3 Demographics - comparison of other studies with this study .......................... 205
1.3.1. Years in profession .................................................................................. 205
1.3.2. Qualifications ........................................................................................... 205
2. Stress, burnout and individual responses ................................................ 205 2.1. Factors linked with stress ................................................................................ 206
2.1.1. Work environment ................................................................................... 207
2.1.2. Psychosocial effects of stress ................................................................... 215
2.1.3. Job satisfaction ......................................................................................... 219
2.2. Factors linked with burnout ............................................................................ 223
2.2.1. Exhaustion ................................................................................................ 224
2.3. Factors linked to individual responses ............................................................ 229
2.3.1. Pressure and motivation ........................................................................... 230
2.4. Relationships between stress, burnout and individual responses .................... 232
2.4.1. Stress relationships with other variables .................................................. 233
2.4.2. Burnout relationships with other variables .............................................. 237
2.4.3. Individual response relationships with other variables ............................ 242
2.5. Demographic factors contributing to stress, burnout and individual responses
................................................................................................................................ 242
2.5.1. Demographic factors contributing to stress ............................................. 242
2.5.2. Demographic factors contributing to burnout .......................................... 244
2.5.3. Demographic factors contributing to individual responses ..................... 248
2.6. Higher risk practice specialties for stress and burnout ................................... 249
3. Limitations of study .................................................................................. 250
4. Summary.................................................................................................. 253
Chapter 6 ...................................................................... 255
CONCLUSION ......................................................................................... 255
1. Stress ....................................................................................................... 256 1.1. Work environment .......................................................................................... 257
1.2. Psychosocial effects ........................................................................................ 258
1.3. Job satisfaction ................................................................................................ 259
2. Burnout .................................................................................................... 260 2.1. Exhaustion ....................................................................................................... 261
3. Individual responses ................................................................................ 261 3.1. Pressure and motivation .................................................................................. 261
4. Implications for nursing and midwifery policy and practice ...................... 262
5. Summary.................................................................................................. 265
6. Recommendations for further research .................................................... 267
References ................................................................... 269

xi
List of Appendices
Appendix 1- Ethics Approval letter
Appendix 2- Conference, seminars, distribution & return rates for main study
Appendix 3- Questionnaire
Appendix 4- Paired responses for pilot study
Appendix 5- Pilot study publication
Appendix 6- Calculations of logistic regressions
Appendix 7- Multicollinearity for logistic regression
Appendix 8- Normality plots for factor analysis
Appendix 9- Factor analysis Cronbach reliability for 5 subscales
Appendix 10- Overall reliability for Cronbach‟s alpha
Appendix 11- Other variables relating to stress and burnout not included in subscales
Appendix 12- Comparison of research sample with state and national statistics of areas
of practice in all jobs
Appendix 13- Calculations of factor analysis
Appendix 14- Kruskal-Wallis H calculations
Appendix 15- Response rates for selected studies focusing on stress and burnout
Appendix 16- Age and hours per week comparison with study sample, NSW and
National statistics

xii
List of Tables
Table 1- Stress, burnout and individual response subscales / indices for pilot
study 105
Table 2- Internal consistency reliability values (Cronbach‟s alpha) for
preliminary and final versions of individual response component 111
Table 3- Spearman‟s rank order correlation- rho, intraclass correlation
coefficient (ICC) and factor analysis method for the six sub-scales 114
Table 4- Factor analysis for pilot study 116
Table 5- Sample size and power calculations- 2-tailed 118
Table 6- Dichotomous dependent variables for logistic regression 125
Table 7- Kaiser-Meyer Olkin measure of sampling adequacy 131
Table 8- Scoring for overall themes 136
Table 9- Scoring levels for work environment subscale 137
Table 10- Scoring levels for pressure and motivation subscale 137
Table 11- Scoring levels for psychosocial effects of stress subscale 138
Table 12- Scoring levels for job satisfaction subscale 138
Table 13- Scoring levels for exhaustion subscale 138
Table 14- Stress, burnout and individual response subscales / indices for main
study 140
Table 15- Employment status 146
Table 16- Frequency of nurses and midwives in main job 147
Table 17- Central tendency statistics for age distribution 147
Table 18- Age categories 148
Table 19- Central tendency statistics for hours worked per week distribution 148
Table 20- Hours worked per week 148
Table 21- Central tendency statistics for hours worked per week distribution for
fulltimers 149
Table 22-Hours worked per week for fulltimers 149
Table 23- Central tendency statistics for hours worked per week distribution
for part-timers and casuals 149
Table 24- Hours worked per week for part-timers and casuals 149
Page

xiii
Table 25- Central tendency statistics for years in profession distribution 150
Table 26- Years in profession 150
Table 27- Overall results for stress 152
Table 28- Overall results for work environment stress levels 153
Table 29- Incidence of stress 155
Table 30- Experiencing inefficient time management for excessive workloads 155
Table 31- Frequency of rushing to complete tasks 155
Table 32- Frequency of finishing work late 155
Table 33- Receiving sufficient organisational support 156
Table 34- Overall results for psychosocial effects of stress 156
Table 35- Experiencing increased anxiety in relation to work 158
Table 36- Experiencing sleeplessness in relation to work 158
Table 37- Experiencing depression in relation to work 158
Table 38- Length of depression in relation to work 159
Table 39- Frequency of experiencing sleeplessness over past week 159
Table 40- Experiencing headaches requiring analgesia 159
Table 41- Experiencing stress requiring treatment 160
Table 42- “Mental health” leave over past year 160
Table 43- Experiencing helplessness in work environment 160
Table 44- Overall results for job satisfaction 161
Table 45- Being suited to the work they are doing 162
Table 46- Doing the kind of work they like 163
Table 47- Wanting to change area of practice 163
Table 48- Wanting to leave professional discipline 163
Table 49- Frequency of experiencing job dissatisfaction 164
Table 50- Overall results for burnout 164
Table 51- Becoming apathetic when “stressed” 166
Table 52- Experiencing low morale in relation to work 166
Table 53- Powerlessness in job 166
Table 54- Feeling undervalued in their job 166
Table 55- Feeling overwhelmed in their job 167
Table 56- Experiencing feelings of incompetence within themselves when
working with others 167

xiv
Table 57- Frequency of fatigue 167
Table 58- Frequency of feeling emotionally drained at work 167
Table 59- Feeling loss of empathy for colleagues while at work 168
Table 60- Feeling loss of empathy for clients while at work 168
Table 61- Overall results of pressure and motivation levels for individual
responses 168
Table 62- Trying to achieve more than time allows 170
Table 63- Unreasonable expectations 170
Table 64- Irritability due to constant interruptions 170
Table 65- Pushed for time 170
Table 66- Difficulty slowing down 171
Table 67- Working at high performance 171
Table 68- Keyed up most of the time on most days 171
Table 69- Tendency to perform many tasks at one time 171
Table 70- Relationship between theme, category, work environment subscale and
Spearman‟s variables 174
Table 71- Relationship between themes, categories, psychosocial effects and
exhaustion subscales and Spearman‟s variables 174
Table 72- Relationship between themes, categories, job satisfaction and
exhaustion subscales and Spearman‟s variables 175
Table 73- Relationship between themes, categories, work environment and
exhaustion subscales and Spearman‟s variables 176
Table 74- Relationship between theme, category, pressure and motivation
subscale and Spearman‟s variables 176
Table 75- Theme Spearman‟s correlations 177
Table 76- Subscale Spearman‟s correlations 178
Table 77- Spearman‟s correlations between significant subscales, incidence of
stress and continuous variables 179
Table 78- Principal component analysis for stress- work environment,
psychosocial effects and job satisfaction 184
Table 79- Contributory loadings for each factor before rotation for stress
(Cronbach‟s-α 0.843) 186

xv
Table 80- Unique contributions of variables to factors following oblique rotation
for stress (pattern matrix) 187
Table 81- Component transformation matrix by oblique rotation for stress 188
Table 82- Rotated component matrix by orthogonal rotation for stress 189
Table 83- Principal component analysis for exhaustion 190
Table 84- Contributory loadings for each factor before rotation for exhaustion
(Cronbach‟s-α 0.793) 192
Table 85- Unique contributions of variables to factors following oblique rotation
for exhaustion (pattern matrix) 193
Table 86- Component transformation matrix by oblique rotation for exhaustion 193
Table 87- Rotated component matrix by orthogonal rotation for exhaustion 194
Table 88- Principal component analysis for pressure and motivation 194
Table 89- Contributory loadings for each factor before rotation for pressure
and motivation (Cronbach‟s-α 0.772) 196
Table 90- Unique contributions of variables to factors following oblique rotation
for pressure and motivation (pattern matrix) 196
Table 91- Component transformation matrix by oblique rotation for pressure
and motivation 197
Table 92- Comparison of age and hours worked per week between study and
national samples 204
Table 93- Work theories relationship with conceptual framework for stress,
burnout and individual responses developed for current project 206

xvi
List of Figures
Figure 1- Reliability values for stress component of questionnaire 110
Figure 2- Reliability values for burnout component of questionnaire 111
Figure 3- Reliability values for six subscales of questionnaire 113
Figure 4- Qualifications of study sample 151
Figure 5- Overall stress levels 153
Figure 6- Work environment stress levels 154
Figure 7- Psychosocial effects of stress 157
Figure 8- Job satisfaction 162
Figure 9- Burnout levels 165
Figure 10- Pressure and motivation levels 169
Figure 11- Stress scree plot 185
Figure 12- Exhaustion scree plot 191
Figure 13- Pressure and motivation scree plot 195
Page

17
Chapter 1
INTRODUCTION
Stress and burnout are familiar occurrences for nurses and midwives working in
clinical areas. This research endeavours to understand and assess the associations and
relationships between nurses‟ and midwives‟ individual responses and factors causing
stress and burnout in the workplace. The focus of this study is to determine stressors
in the work environment and to attempt to document how individuals within the
nursing and midwifery profession currently deal with stress and burnout. This
research attempts to demonstrate how each individual reacts in a specific situation,
their work behaviours and how much pressure they place upon themselves. Stress and
burnout encompass occupational and individual stressors which might lead to ill
health.
1. Major aim of study
Assessment of the associations and relationships between nurses‟ and midwives‟
individual responses were explored as well as factors causing stress and burnout in
the workplace experienced by the surveyed population. This was done by
developing and administering a reliable and valid questionnaire to assess stress,
burnout and individual responses to workplace issues. This research demonstrates
how the sample population reacted to specific work situations and documents
relevant stress and burnout levels including symptoms experienced by the
respondents.
2. Significance of study
One of the benefits of enquiring into these areas is that it provides an opportunity to
encourage health professional accountability in order to reduce stress and burnout.
The questionnaire can be used to help people examine their own behaviour in the
workplace with the possibility of change (Furnham, 1992). It is hoped to highlight

18
behaviours as they occur in the daily work life of nurses and midwives in their
dealings with stress (Duke, 1986).
The questionnaire was intended to identify important occupational stress sources,
which can be modified to avoid deleterious health-related consequences (Vagg &
Spielberger, 1999). As a result of this research and findings, nurses and midwives
will become more aware of their own limitations and choose areas of nursing and
midwifery they believe most suitable. This will enable them to make reasonable
choices regarding avenues of communication and options or areas in which they
aspire to work.
Nurses and midwives will become aware of their own limitations so that they protect
themselves against unnecessary stressors to prevent future ill health if they are aware
of their own vulnerability to sickness, stress, depression or a variety of other work-
related problems. The benefits of this enquiry will encourage the profession to assess
intelligently and accurately the workplace stress and burnout of its members. This
research will also provide information so that interventions can be streamlined to
alleviate specific areas of stress, reducing occupational hazards in conjunction with
necessary ethical and professional changes within nursing work practices.
Additionally, this research hopes to provide informative career counselling strategies
for the guidance of policy makers, in co-ordination with what nurses and midwives
view as reasonable workloads. The findings of this study will assist nurses and
midwives to become aware of their own possible individual responses and factors
leading to stress and burnout within their work environment, enabling them to make
appropriate and informed choices about work, the workplace and professional
development.
3. Objectives of the study
Specifically, this research asks – Ultimately, what are the factors linked with stress?
What are the factors linked with burnout? Are there nurses and midwives with
different pressure and motivation levels relating to work behaviours? Do nurses and
midwives place unreasonable expectations on themselves? Are there associations

19
between stress, burnout and individual responses? Are there particular groups of
nurses and midwives who are experiencing stress and burnout and does stress relate
to environmental, organisational, psychosocial issues and job dissatisfaction? Are
there particular demographics which increase or decrease the likelihood of issues of
stress, burnout, high pressure and motivation levels? For example, does being
younger, working longer hours, being more educated or living alone increase the
likelihood of deleterious effects of stress, burnout and individual responses to the
workplace? Are there higher risk workplaces or practice specialties more or less
vulnerable to stress and burnout?
Given the present critical shortage of nurses and midwives, it is imperative to
explore how both nurses and midwives perceive their jobs, so that strategies might
be identified to enhance the quality of their working lives and improve retention
(Barrett & Yates, 2002). This could have a powerful effect on the already critical
national nursing shortage but it might also have an effect on the retention of nurses
and midwives, reducing the numbers leaving the profession. Critical nursing and
midwifery shortages necessitate investigation of possible factors linked with stress
and burnout (Engelbrecht, 2006). A thorough investigation of resources and cases in
a certain setting might provide information to treat and prevent future stress and
burnout. This study helps to understand specific circumstances involving stress and
burnout in a specific health professional group.
4. Overview of thesis
This thesis is specifically designed as a quantitative study of experiences of individual
responses to stress and burnout as well as many different workplace issues, as applied
to nurses and midwives, in order to forecast, define and prescribe better solutions and
management in the healthcare arena. The questionnaire developed for this study was
distributed to nurses and midwives throughout metropolitan areas of Australia
including Sydney, Perth, Hobart and Brisbane. The conceptual framework for the
study included three essential themes including stress, burnout and individual
responses as well as incorporating the five subscales identified by factor analysis,
namely work environment, psychosocial effects of stress, job satisfaction, exhaustion,
20
and pressure and motivation. As this study was exploratory and included a
convenience sample of 562 nurses and midwives, ability to generalise is limited
(Mackin & Sinclair, 1998; Schneider, Elliott, LoBiondo-Wood & Haber, 2003). All
data were based on self-assessment and there was no substantiation of data to confirm
and validate number of hours worked as used in triangulation methods.
Chapter 2 will review key issues emerging in the literature on individual responses to
stress and burnout, focusing on individual reactions and situational factors. This
information will provide a supporting framework as a background for the study.
Chapter 3 outlines the research design and questionnaire development. It describes in
detail how the subscales which guide the data analysis were developed. Chapter 4
provides results and analysis of the data, Chapter 5 discusses the data and Chapter 6
concludes and discusses implications for nursing and midwifery practice, the health
care workplace and possible directions for future research.

21
Chapter 2
REVIEW OF THE LITERATURE
Reviewing current and relevant literature is of paramount importance, as it provides
the contextual framework for this research study. Numerous and varied examples of
data drawn from literature on stress, burnout and individual responses to workplace
issues have been compiled to form a reference guide and provide an exposition of an
in-depth understanding of these topics. Investigation of stress and how stress is
managed is recommended in the health care arena (Delvaux, Razavi & Farvacques,
1988). Cordes and Dougherty (1993) have shown that burnout has been costly in the
helping professions. Their findings show that up to the 1990s, little work had been
done to establish issues associated with burnout. They believe that stress and burnout
deserves more attention by studying workplace policy and workload issues in
healthcare organisations. Beaudoin and Edgar (2003) recommend studying nurses‟
work and the stressors which prevent them from working effectively and efficiently.
Taylor and Barling (2004) state that stress experienced by nurses is a phenomenon
which requires further research and analysis. A poor understanding exists regarding
generalisability of past research into stress and burnout in the helping professions
(Cordes & Dougherty, 1993).
Generally, behaviour is typified by how much vitality and energy someone has before
they become worn out or tired (Williams & Cooper, 1998). This stress and burnout
study on nurses and midwives then relates to individual responses as work behaviours
measured by self-imposed work pressure and motivation levels. Pervin (1978) reports
that patterns of behaviour are a reflection between external and internal characteristics
or interaction between the situation and person. He reports that this interactional view
is acquiring popularity among psychologists. Some behaviours are situation
determined and others are more person determined. Pervin (1978) suggests that
research is about understanding the situation and person forces which account for
patterns of change and stability in behaviour; defining critical variables of the
situation and person; and understanding the processes by which each one is related to
22
the other. He suggests pursuing how situation and person interact with each other.
Shaw (1999) recommends considering interaction between person and situation
variables.
A review of the literature found no studies in Australia that examined stress levels in
nurses and midwives in the same study or group. This might be because nursing and
midwifery are separate entities, particularly with the introduction of direct midwifery.
This study combined the two groups in the same study to try and gain a broader
understanding of what is relevant for each group and to ascertain any unique
differences and individual responses to their experience of stress and burnout.
Approximately half of this study group were nurses and the other half were midwives.
Areas of predominant practice were compared as they were not mutually exclusive
groups of nurses and midwives. Comparison of stress levels is pertinent and
informative for these caring professions as it will suggest some planning and
management for different areas and issues of stress which might need attention. Paine
(1982) reports how stress and burnout have become an integral and unavoidable
component of work and are considered pertinent to other types of occupations.
Beyond nursing and midwifery, stress and burnout have become an all-encompassing
workplace problem of the current times.
1. Definitions of stress, burnout and individual
responses to workplace issues
1.1. Definition of stress
Overall, there are three primary theories which explain the idea of stress. The first is
Seyle‟s (1956), which defines stress as a human‟s response to noxious or disturbing
environments (Mackin & Sinclair, 1998). The second, Lazarus‟s (1966) theory,
emphasises an individual or situational interaction which causes a stress state. The
third, Cox‟s (1988) theory depicts that stress is part of a dynamic and complex system
of interaction between a human and the environment.
23
Cohen, Kessler and Gordon (1997) have shown how stress has been variously defined
in the literature and how inconsistent these definitions have been. They define stress
as a process whereby
…environmental demands exceed or tax the adaptive
capability of a human, resulting in biological and
psychological changes that may cause risk for
disease. Therefore, stress is a general process by
which environmental demands produce outcomes
which are deleterious to health (Cohen, Kessler &
Gordon, 1997, p. 3).
Their definition is most like Cox‟s (1988) theory, depicting stress as a dynamic
process between a human and the environment. Cohen, Kessler and Gordon (1997)
break down the stress process into three different components. The first one is
environmental stressors, demands or events, which are objective components. The
second one is an individual‟s subjective perceptions or appraisals of stress. The third
component includes stress responses which are biological or behavioural.
Kushnir, Cohen and Kitai (2000) note that opportunities for training and learning
should reduce stress and burnout. They showed that stress was defined as the ratio of
work demands to resources available to each individual for managing these demands.
If the demands exceeded the resources available, an individual would more than likely
experience a certain amount of stress. Their study involved enquiry into physicians‟
job stress and found that incentives such as professional update developments reduced
job dissatisfaction. They discovered that physicians‟ well-being is improved by
reducing occupational stress.
Comcare Australia (1997) defines stress as occurring when employees fail to adjust to
changes and demands in a work environment. Australian research on occupational
stress has acknowledged organisational variables which are likely to cause employee
distress. These variables include the organisational climate involving appraisal and
recognition, supportive leadership, professional interaction, excessive work demands
and role clarity. Comcare Australia (1997) reports that international research has
investigated psychosocial factors contributing to human stress, many focusing on

24
relationships between occupational issues and stress. Comcare (1997) reports that an
individual response will differ depending upon the extent to which a person perceives
a scenario to be threatening, the expectation someone has of dealing with the threat,
and actions available to someone dealing with the threat. Comcare (1997) notes that
while coping mechanisms and personality variables impact upon stress, the employer
cannot always or directly control these issues for their employees.
Arnold, Cooper and Robertson (1995) define stress as a force pushing physical or
psychological factors beyond the coping ability of an individual, causing strain and
stress. A variety of symptoms might occur including behavioural or physical
symptoms and other ailments. Behavioural symptoms include an inability to cope,
disinterest in life and other people, recurrent or constant fear of disease, fear of being
a failure, self-hatred, feeling neglected and dreading the future, difficulty in
concentrating and making decisions and intense fear of enclosed or open spaces.
Physical symptoms include loss of appetite, frequent indigestion, craving for food,
diarrhoea or constipation, constant tiredness, insomnia, nervous twitches, headaches,
nail-biting, muscle spasms and cramps, breathlessness without exertion, nausea,
fainting spells and frequent crying. Other ailments include heart attack, high blood
pressure, allergies, hay fever, peptic ulcers, colitis, menstrual difficulties, skin
disorders, hyperthyroidism and diabetes.
Stress can be an ill-defined term, attempting to define a multivariate, complex and
multilevel phenomenon (Cottrell, 2001). Motowildo, Packard and Manning (1986)
say stress is an emotional, unpleasant experience associated with symptoms of fear,
dread, irritation, anxiety, grief, sadness, anger, annoyance and depression. Quick,
Dalton, Nelson and Jonathon (1985) have defined stress in a more positive light.
Stress is a natural response to organisational and personal demands; and, interestingly,
the individual has no say or conscious control over stress.
Keil (2004) has described „stress‟ as a metaphor for all and any difficulties of life. Her
conceptual analysis aimed to develop a general consensus for the meaning of „coping‟
and „stress‟. Stress is generally a measure of a force which causes damage to a
structure. In ordinary usage stress operates on levels of emotions, but is not an
25
emotion in itself, unlike anxiety or anger. For example, she claimed that „coping‟ and
„stress‟ are terms which have been used widely in nursing and their significance and
meaning have varied over time. Bohle and Quinlan (2000) report that stress is not a
particular illness but a process of continuing interactions which might affect health.
They recognise that psychological stress might affect the onset of disease. Another
variation is a negative reaction to stress being „strain‟ (Payne, 2001). McVicar (2003)
defines „eustress‟ as a term commonly applied to positive responses of stress and
„distress‟ describing negative aspects. McVicar (2003) describes stress as a
continuum, ranging from eustress to mild, moderate or severe distress and will depend
on individuals‟ stress perceptions.
1.2. Definition of burnout
Maslach and Jackson (1981) conceptualise burnout as a continuous variable. There
are three components which include depersonalisation; nurses attending to patients
without any emotional feeling and distancing themselves from clients and colleagues;
emotional exhaustion; and a sense of reduced personal accomplishment indicative of
feelings of low morale. It might range from low to high levels. They report that
burnout is not a synonym for job dissatisfaction. They assert that assessing burnout
among human service workers such as nurses will have a practical benefit of
suggesting modification to job design, training and recruitment, which might alleviate
this significant problem.
Burnard (1991) describes burnout as the condition of being under considerable stress
for extended periods. He reports many characteristics of burnout. Loss of motivation
might occur. People developing negative attitudes towards other people and the job
are other signs. A sense of humour is lost and a sense of a limited choice of options is
evident. A loss of exercising choice concerning work issues is also a sign of burnout.
Maslach, Schaufeli and Leiter (2001) have defined burnout as a reaction to chronic
interpersonal and emotional overload and have shown, for example, that lack of
support has been linked to burnout and that burnout is rated higher for nurses not
involved in decision-making. Their participants perceive too much work in the
available time. They have also investigated the absence of job resources. They have

26
shown that lack of autonomy correlates well with burnout and change only occurs
when both the individual and the setting are integrated.
Cordes and Dougherty (1993) searched the literature relating to burnout. They note
that the first stage of burnout is emotional exhaustion; the second stage,
depersonalisation; and the final stage, a reduced sense of personal accomplishment.
Cordes and Dougherty (1993) found that the client role in service-provider
interactions has been known to contribute to burnout. They noted that patient
interactions which were more frequent or direct, or patients‟ problems which were
chronic, were related to high levels of burnout. They discovered that role overload and
role conflict are also associated with burnout and the strain or problem is frequently
compounded by excessively heavy client loads. As the number of clients increases,
demands on employees‟ personal resources also increase. If the demands are
continuous, as opposed to intermittent, vulnerability to burnout might become evident,
especially if there are no rewards. They found that role conflict might occur when job
expectations conflict with one‟s personal beliefs or values. Burnout is a major cause
concerning the shortage of experienced nurses (Sundin-Huard & Fahy, 1999).
1.3. Definition of individual responses to workplace issues
Individuals have unique life histories, personalities, behaviour patterns, experiences
and demographic characteristics, all of which are instrumental in determining each
individual‟s response to stress. Sources of occupational pressure induce variable
reactions from different people. Some find it easier to cope than others, adapting their
behaviour to meet the environmental challenge. Alternatively, some people are unable
to deal with the stress-provoking situation. Many factors are associated with these
differences, including being ill-equipped to function in a particular area, motivational
differences, personality, personal insight into weaknesses and fluctuations in abilities
(Cooper, 1982). Some people thrive on stress, while other people wilt under mental
and physical strain (Paton, 2003).
Pervin (1975) reports that people express themselves in accordance with situations. It
is the environmental stimulus which provokes a reaction or behaviour from the
individual. Furnham (2001) emphasises the three factors interacting in the workplace:
27
the task the individual is performing; the individual‟s personality, motivation and
ability; and the environment surrounding the individual. He shows how focusing on
task outcomes and personality yet ignoring cultural, structural, or situational and
individual differences in abilities or traits can lead to misinterpretations of data.
2. Work stress theories
There are three work theories which deal with different aspects related to stress. These
three theories are the Effort-Reward Imbalance or Expectancy Theory of Motivation
(Vroom, 1964); the Demand-Control Model which stems from Karasek‟s (1979)
Theory and the Person-Fit Theory (Mansfield, Yu, McCool, Vicary & Packard 1989).
The Effort-Reward Imbalance or Expectancy Theory of Motivation is based on
employees‟ beliefs that their efforts will lead the way to performance, and lead to
rewards (Vroom, 1964). These rewards might either be negative or positive (Lindner,
1998).
Karasek‟s (1979) theory is that most harmful reactions to psychological stress occur
when psychological demands are high and workers‟ freedom to make decisions is
low. This Demand-Control Model invokes a stress response to psychological and
social environments. „Stress‟ and overload occur when information processing loads
are too high for an individual‟s information processing abilities (Karasek, 1979).
Mansfield et al. (1989) recommend a promising approach to reduce job dissatisfaction
among nurses by providing a descriptive guide to various clinical settings before
nurses begin employment. Nurses could then make more appropriate choices for their
clinical work according to personal preferences and strengths, enhancing job
satisfaction and reducing stress and burnout. To promote this „good fit‟ between the
nurse and the work setting, nurses‟ work could be classified in many unique
dimensions enabling nurses and employers to make informed decisions about work
assignments. This information will potentially assist in prevention or reduction of
staff turnover and burnout (Mansfield et al., 1989).
28
2.1. Effort-Reward Theory
Vroom‟s (1964) Expectancy Theory of Motivation is defined by expecting that one‟s
efforts will result in attainment of performance goals. If expectancy is high,
individuals believe they can control the outcome and motivation remains high. If an
individual believes the outcome to be unattainable, motivation is low (Scholl, 2002).
This effort-reward imbalance is defined by increased efforts and low rewards leading
to stress responses in vulnerable people (Heine, 2006).
Furnham (1992) comments how few theories have been developed to account
exclusively for work motivation, nearly all being concerned with general motivation
theories for work applicable to all persons, neglecting individual differences. The
Motivational Expectancy Theory purports to demonstrate that motivation is an
outcome of three different beliefs (Vroom, 1964). One is that expectancy is the belief
that an individual‟s efforts will result in accomplishments. Another is that an
individual‟s performance will reap rewards. The final one is that motivation parallels
the value of rewards to the individual (Furnham, 1992).
This theory shows that motivation is a function of all of these three components. High
motivation levels will result when these three components are all present. The theory
shows that motivation is only one part of many determinants of work performance. It
assumes that skills, ability and personality also contribute to an individual‟s work
performance. Some individuals are more suited to their work than others because of
their special abilities or skills and the unique characteristics they bring to the job. This
theory also shows that people‟s role perceptions will influence work performance.
Poor performance might result from role misunderstanding. The theory also shows
that perceived unlimited opportunities in the workplace will increase performance
levels (Furnham, 1992).
If the reward is positive, the employee will most likely be highly motivated. If the
reward is negative, the employee will not be motivated. Intrinsic or motivator factors,
such as recognition and achievement, produce job satisfaction. Extrinsic factors, such
as job security and pay, produce job satisfaction (Lindner, 1998). Stimuli or stressors
are most often required to motivate people‟s capabilities (Schultz & Schultz, 1997).

29
Bakker, Killmer, Siegrist and Schaufeli (2000) showed that nurses experiencing an
Effort-Reward Imbalance suffered more distress and lower self-esteem than those
nurses who did not set their goals too high.
2.2. Demand-Control Theory
Karasek (1979) was a most influential researcher who studied job control and its
association with job demands, known as the Demand-Control Model. According to
Karasek (1979), lack of autonomy and decision-making combine with stressors or
workload to produce ill health and psychological strain. If the individual cannot
overcome the stressors, unresolved tension will occur as psychological strain. Karasek
(1979) linked this with burnout.
Karasek‟s (1979) Demand-Control Model predicts that job situations with low control
and low demand reduce motivation which leads to „learned helplessness‟. This can
evolve from a sequence of jobs rejecting a worker‟s initiatives. However, most work
situations have high demands, which also can be harmful. The hypothesis is that jobs
high in demands and low in social support and control carry high risks of illness
(Karasek, 1979).
Spillane and Spillane (1996) have shown that the combination of low job control and
high job demands leads to deleterious psychological and physical consequences. De
Jonge, Dollard, Dormann, LeBlanc and Houtman‟s (2000) study showed that jobs
having low control and high demands in health care were more conducive to poor
health such as psychosomatic health complaints and emotional exhaustion. They also
showed that active jobs with high control and high demands produce job satisfaction
and job challenge. They found that the type of job demands (physical demands,
workload or emotional demands) which are considered challenging or potentially
stressful should be reviewed before implementing an intervention. They showed that
emotional demands are the most important for the human service workforce when
considering any intervention.
An important factor influencing the stress response is control (Dumas, 2001). In a
German study,
30
nurses perceived their degree of control as
instrumental in enabling them to cope with
stress and burnout (Lambert & Lambert,
2001, p. 170).
Ganster (1989) defined control as the ability to exert influence over the environment,
making the environment less threatening or more rewarding. Locus of control is a
concept developed by Rotter (1982). This theory follows four assumptions. One is
that predicting human behaviour requires an understanding of people‟s interactions
with their environments. Another is that personality is learned. Personality is not
specifically determined at any particular age of development, but might be changed if
people are willing to learn. The third assumption is that personality has a unity. The
environment and experiences interact with each other to form a whole unit. The
environment has no meaning without the person and the person must not be separated
from their environment. The fourth assumption is that human motivation is directed
by goals.
Rotter (1982) showed that drive-reduction theories could not, on their own, explain
human behaviour. Humans are not motivated by seeking pleasures or reducing drives.
Humans are motivated by expectancies that certain behaviours will move them closer
to personal goals. The hypothesis of Rotter‟s (1982) research is that humans who
believe they can control their fate will behave differently, depending on the situation,
from those who believe their future is ruled by powerful others, luck or chance.
Owning your locus of control is essential for individuals to remain healthy (Jonsson &
Segesten, 2004).
Pelly (2004) noted that stressed health care workers are providing insurers with
claims. They are blaming high job demands, low job control and poor support. Many
nurses have little independent control and must answer to other health professionals,
regulatory agencies and administrators (Gaithersburg & Roach, 1994). Karasek (1979)
highlights that job stress occurs when there is little control. Job control equates to
nurses‟ control over tasks and the conduct of their working day. When nurses have a
small degree of perceived control, stress is inappropriately directed into a coping
mechanism, resulting in a prolonged physiological reaction, causing anxiety, fatigue,

31
physical illness and depression (Karasek & Theorell, 1990). When supportive
relationships do not exist among colleagues, restraint, control and rigid rules are
followed (Sidran, 1999).
Taylor, White and Muncer (1999) noted that losing control over one‟s own
professional work specifically relates to powerlessness and this leads to frustration.
They showed that nurses perceived they were powerless in regard to medical staff and
managers, but it is not so clear whether a sense of powerlessness was due to the
nurses‟ characteristics or more the organisational structure. If employees are unable to
exert control over demands placed upon them, this increases their stress levels (Harris,
2001). Toohey (1996) noted that nurses and midwives are often „alienated‟ and unable
to participate in decisions resulting in limited control over their work. This alienation
then manifests as stress / illness.
Sidran (1999) showed that many survivors of stress and burnout can only see two
options: be controlled or control others. Nurses who start endorsing the „be controlled
or control‟ belief endure power struggles with their personal lives and clients.
Experiences of empathy, creativity and connection will be impossible. Sidran (1999)
showed how nurses are frequently expected to have responsibility for people, things
and situations over which they have limited control and there is often too little support
and too few resources for these difficult tasks. Sidran‟s (1999) research suggests that
some nurses cope with stressors surrounding issues of control and adopt an
unrealistically invincible and empowered stance (presenting an illusion of having
control when they actually do not). Sidran‟s (1999) research shows how nurses need
to identify reasonable expectations about control, looking at what they can control and
what is out of their control. Clegg (2001) showed how nurses are at the frontline of
service delivery, continually dealing with crisis situations and responsibilities with
limited control over workload or work environment. Research from previous studies
suggests „primary nursing‟ (full responsibility for a patient‟s care rather than a team-
based model) is linked with higher autonomy levels than other types of nursing
(Makinen, Kivimaki, Elovainio & Virtanen, 2003).

32
Nurses who demand control and perfection in themselves create unrealistic
expectations and demands on others that cannot possibly be met in reality (Young,
1974). This leads to stress, frustration and burnout (Balevre, 2001). Weekes, Peterson
and Stanton (2001) found that part-time workers experience fewer medical problems
and less stress than fulltime workers. Also most part-time workers believe they are
more in control and satisfied with a balance between family and work life. Nurses in
Webb and Pontin‟s (1996) primary nursing study reported having more confidence
and control over what they do with increased responsibility for client care. These
nurses considered continuity of care was better and that nurses knew their clients‟
needs. Being able to make decisions and use their own initiative enabled the nurses to
prioritise their care and to use their skills more effectively. They were more interested
in their work as they were able to plan care and patient needs in advance (Webb &
Pontin, 1996).
Laschinger, Heather, Finegan, Shamian and Almost (2001a) note that decision latitude
refers to nurses‟ control over their daily tasks. It has two main parts: 1) skill discretion
(to what degree the work involves learning new tasks, encourages creativity, lacks
repetitiveness, includes a variety of practice and develops the nurse‟s unique abilities),
and 2) the decision authority (the nurse‟s ability to make decisions about the job and
how the nurse influences the company policy and work group). They have shown that
when nurses are constrained by poor control, motivation cannot be channelled
appropriately into a coping response, causing a greater psychological reaction,
persisting for a long period of time. Their research shows that active jobs have
increased psychological demands but increased decision latitude. These demanding
jobs encompass tasks over which nurses feel they have a measure of control, having
the ability to use all their available skills. They show that their energy is transformed
into operation through problem solving, which results in little psychological strain.
When nurses have poor control over workload demands, this increases performance
strain.
In Laschinger et al‟s (2001a) study, nurses experiencing high psychological work
stress with poor control were markedly less empowered, less satisfied, and less
committed than those with decreased job strain levels. Nurses having high

33
psychological demands and increased levels of control were more likely to be
psychologically empowered; their confidence was higher in job-performance abilities,
their work was meaningful, they believed they could make an impact and they
reported better autonomy. They experienced more structural empowerment; they
reported having better access to information, resources, support, and opportunities to
grow and learn in their job. Their study‟s results show that an increase of control over
work, despite high psychological demands, will make nurses more satisfied in their
jobs and more committed at an organisational level, therefore more unlikely to leave
their organisation. Laschinger et al‟s (2001a) study showed that, despite these
approaches, there are factors continuing to threaten nurses‟ control over their work.
They showed that although nurses provide input into important decisions affecting
their practice (setting quality standards, scheduling and staffing levels), many still
consider management to have the final word for these decisions. They note that
managerial interventions which increase nurses‟ uncertainties concerning job control
might reduce nurses‟ ability to respond more effectively to extensive changes in
present healthcare work environments.
Deci and Ryan‟s (1987) research showed that events which are typically controlling
(pressuring one towards specific outcomes) affect creativity negatively and events
which are autonomous (promoting choice) for an individual promote creativity.
Controlling events induce negative emotional tones. They discovered that behaviour
which is autonomous has been linked to more creativity, greater interest, a better
emotional tone, better conceptual learning, more cognitive flexibility and more
positive behaviour change than behaviour which is controlling. They also found that
people can pressure themselves in the same way they are pressured by external
proceedings, and controlling themselves in this way is similar to being externally
controlled. Carver and Scheier (1981) describe control as the sequencing implicit in a
set of instructions, each instruction being executed prior to the next instruction being
attempted. The former task needs to be completed before control is transferred to the
next task.

34
2.3. Person-Fit Theory
The Person-Fit Theory suggests that tension arising from a mismatch between an
individual nurse and workplace results in burnout and job dissatisfaction (Mansfield et
al., 1989). Mansfield et al. (1989) have developed an Index to reduce stress and
burnout which arises when nurses encounter conditions that conflict with their work
styles, personalities and basic values. A nurse thriving on work pressure might prefer
a highly technical environment to a personalised, caring setting. Presently, nurses‟
placements do not take account of differences in temperaments, values and
personalities which might be enhanced in one clinical setting or another. Nurse
administrators might, in using their Index, be able to allocate more satisfying and
stable job placements (Mansfield et al., 1989).
If a nurse or midwife thrives on pressure, and / or prefers a technical environment
rather than a personalised setting, he / she would be more likely fulfilled in a coronary
care, neonatal care or emergency unit. Presently, nurses‟ placement into different
clinical areas occurs in no logical way (Mansfield et al., 1989). Mansfield et al‟s
(1989) Job Content Index gives guidelines for nurses selecting different clinical areas.
They assert this strategy, coupled with appropriate rewards and adequate staffing,
should result in lower stress, better morale, better cost savings for institutions and
reduced staff turnover. Jamal and Baba (2000) conceptualise job stress as an
individual‟s reaction to a work environment which they consider threatening. This
portrays a poor fit between the work environment and the individual‟s interest and
abilities, in what would seem to be extreme demands and inability of the individual to
handle a particular situation.
Furnham (1992) reports that the Person-Fit Theory has consequences in work-related
behaviour. He adds that the better the match between an individual‟s needs and
environmental attributes, the more likely the potential for an individual‟s satisfaction
and performance. He states the importance of organisational / environmental factors
and the person-environment fit. He also highlights the importance of individual
differences. Flowers (2004) recommends determining nurses‟ hardiness levels and
needs for training as less hardy nurses might then be directed towards less stressful
environments.

35
Maslach, Schaufeli and Leiter (2001) have shown that recent research on burnout has
developed theoretical frameworks integrating both situational and individual factors,
rather than dealing with them separately. Research has shown that organisational and
situational factors have a more important influence over burnout than individual
characteristics (Maslach, Schaufeli & Leiter, 2001). There is a history within
psychology explaining human behaviour and the interaction of the environment and
the person. Many interactional models view environment and person as independent
entities, characterising them so that a degree of fit can be assessed between
environment and person. Maslach, Schaufeli and Leiter (2001) note how it was
assumed that better job-person fit predicted less stress and better adjustment. The
greater the mismatch between job and person, the greater the chance of burnout. This
model seems appropriate for understanding burnout.
Maslach, Schaufeli and Leiter (2001) report that mismatches in control indicate
individuals having insufficient control over resources needed to achieve their work or
having insufficient authority to pursue work in a most effective manner. They have
identified that individuals overwhelmed by high responsibility levels experience a
crisis concerning control and workload. The mismatch occurs if responsibility exceeds
one‟s authority. They note how it is deeply distressing for nurses and midwives to feel
responsible for producing results which they want while lacking an ability to
influence those results.
Maslach, Schaufeli and Leiter‟s (2001) model proposes that there are six areas of
work life which have relationships with burnout, including control, workload,
community, fairness, values and reward. They view a mismatch in levels of control
and work responsibilities as being related to the reduced personal accomplishment
component of burnout. They report that individuals who are inundated by their
responsibility level might experience a crisis in the areas of control and workload.
They identify a mismatch in workload levels and the wrong type of work, result in
people seeming to lack the skills for a particular type of work. They relate workload
to the exhaustion component of burnout. They report another mismatch involves
people losing connection with other colleagues in the workplace as people thrive in
the work „community‟. They note that a serious mismatch between person and job

36
includes fairness which confirms people‟s self-worth and communicates respect. They
identify values as another component of mismatch between person and job if people
are constrained by their work to do things not in accordance with their values. They
report reward as another component as if social or financial rewards are insufficient;
other rewards such as valuing workers is critical to a good person / work match.
Atkinson (1988) shows that improving job-person fit could be the individual‟s or the
organisation‟s responsibility. She suggests that good selection procedures could
increase the chance of achieving good job-person fit. She suggests that an
employment analysis should include what personal qualities and skills are required.
She suggests that each individual should look at the work involved and the particular
skills they need to apply. Furnham (1992) suggests that some jobs might be more
suitable for a particular individual than others. He reports that the job-person fit
concept has been popular in research areas focusing on occupational choice and work
problems such as stress.
Furnham (2001) reports that researchers have now become aware of the many ways
individuals differ in their work performance. He suggests how important it is to
examine an individual‟s traits and abilities at selection which can help predict aspects
of one‟s professional career. He reports that individuals adapt to the job. Usually out
of necessity, they adopt a working style suited to the job requirements, usually soon
after they commence employment. They suggest that individuals also change aspects
of the work they perform. They personalise aspects of their work and change their
social and physical environments. For example, employees with the same office
arrange their own working spaces to suit their individual preferences (Furnham,
2001).
3. Instruments used to detect stress
It is impossible for any single tool to assess all sources of work stress encountered in
many occupational settings as this would require an exceptionally lengthy instrument
(Vagg & Spielberger, 1999). In recent years, the number of tools which have been
developed by nurses that assess the workplace are on the increase (Rattray & Jones,

37
2007). Hurrell, Nelson and Simmons (1998) reported that choosing a tool to measure
stress poses a perplexing challenge. Edwards and Burnard (2003) report that there are
several established reliable and valid measures for measuring stress outcomes and
stressors but investigators feel there is a need to continue to develop new instruments.
Hurrell, Nelson and Simmons (1998) report that objective measures of stress in
people‟s jobs are difficult to obtain. They predict that self-report measures of stress
will probably dominate job-stress research. They particularly note that developing
valid and reliable measures of the complex phenomena of violence and harassment in
the workplace represents a big measurement challenge. They recommend
development of new and improved tools to assess stress in the workplace. Furnham
(1992) wonders why a set menu should be used when an a-la-carte menu of questions
could be developed specifically for a profession‟s needs. He adds that even though it
is time consuming it is ultimately more cost effective and useful to develop a tool for
each particular profession.
Behaviour is researched by investigators primarily using measurements or
observations and there have been various tools and instruments used previously in the
literature to assess stress (Pervin, 1975). The Maslach (1986) Burnout Inventory
primarily studied the three dimensions of burnout in nurses and is portrayed as the
gold standard for measuring burnout. These included depersonalisation, emotional
exhaustion and reduced personal accomplishment. It is a general measure which
assesses burnout for human service professions, measuring chronic stress, not specific
and organisational stressors as such (Nolan, 1995). Coffey (2000) states that the
measure could be too sensitive and might be reporting higher burnout levels than are
actually evident.
Stordeur, D‟Hoore and Vandenberghe (2001) used the Nursing Stress Scale which
was developed by Gray-Toft and Anderson (1981) specifically to assess three sources
of stress, namely, physical, psychological and social. This questionnaire was deemed
inadequate for this study as it did not examine work behaviour as pressure and
motivation levels. The Nurse Stress Index developed by Hingley and Cooper (1986)
was originally designed specifically for nurses in management and was lengthy,

38
consisting of 140 items. McGowan (2003) used the shortened 30 item questionnaire
with nurses developed by Hingley and Cooper (1986) but did not pursue aspects of
burnout.
Goldberg (1978) designed the General Health Questionnaire-12 which detected
psychological indicators of ill health. It was used in occupational and community
settings for health professionals. The questionnaire‟s main purpose was to evaluate
psychiatric morbidity. Rahe and Tolles‟ (2002) Brief Stress and Coping Inventory
assesses people with fibromyalgia for stress and coping. They assessed how they dealt
with fibromyalgia and how it affected their lives on a daily basis.
Williams and Cooper (1998) developed the Pressure Management Indicator which is
used by employees across organisations. It was developed from the Occupational
Stress Indicator (Cooper, Sloan & Williams, 1988) and not developed for nurses and
midwives specifically. It was developed for a business environment and assesses how
much control the individual is able to exert over their life and ways in which they
cope with stress (Goodfellow, Varnam, Rees & Shelly, 1997).
Williams and Cooper (1998) categorise variables of stress as sources of pressure,
individual differences and effects. They recommend the assessment of individual
differences and stress outcomes. They report that appraisal should be recognised as a
key role with stress and that self-report questionnaires are appropriate when
measuring work stress. Their questionnaire was developed by confirmatory factor
analysis. The Pressure Management Indicator assesses physical well-being, sources of
pressure, interpersonal and coping support, type „A‟ behaviour and influence and
control (Cottrell, 2001).
4. Sources of stress
4.1. Demographics
Individual differences such as age have an effect on the association between strains
and stressors on probation officers (O‟Donnell & Stephens, 2001). The registered
nurse workforce has shown a flat trend of stress and burnout for those under 30 years

39
of age from 1999 to 2001 (Workforce Planning NSW Health, 1999-2003). The
average age of nurses and midwives working nationally in 2004 was 43.2 years
(Australian Institute of Health and Welfare, 2006). Maslach, Schaufeli and Leiter
(2001) report that individual characteristics such as formal education or age have been
linked to burnout in nurses. They state that age has been the one demographic variable
that has been consistently linked with burnout, with trends showing the younger the
person the more likely they are to burn out.
Burnout more often occurs earlier in nurses‟ careers (Maslach, Schaufeli & Leiter,
2001). Research has revealed that more experienced, older employees experience less
burnout than younger employees (Cordes & Dougherty, 1993). Individuals probably
gain competency and skill through experiences linked to ageing, helping them to deal
with stress (Younger, Marsh & Grap, 1995).
Marshall (1980) and Slater‟s (1993) research suggests stress could change in different
specialty areas. Working in intensive care areas of nursing is frequently perceived as
stressful (Goodfellow et al., 1997). Goodfellow et al‟s (1997) study found that hours
worked and age had no impact on stress experienced by nurses and doctors in an
intensive care unit.
In the general population, women have reported higher stress levels stemming from
work factors than their male counterparts (Davidson, 1983). One of the possible
factors influencing nurses and midwives who are leaving the profession is that it is a
predominantly female workforce. Nurses and midwives in childbearing years retire
from the workforce (Doiron, Hall & Jones, 2008). Nurses often leave to have families
and never return (Deary, Watson & Hogston, 2003).
For nurses and midwives in NSW, the highest retention rate (83.3%) pertains to those
aged between 40 to 55 years (Doiron, Hall & Jones, 2008). Goodin (2003) notes that
those nurses with the most experience, being middle-aged women, who are
dominating the workforce will retire from the profession at a time when demands are
the highest. Curtis, Ball and Kirkham‟s (2006a) study showed that 49.5 per cent of

40
midwives who left the profession were less than 40 years of age, representing a
considerable loss of midwifery working years to the profession.
Kent and Lavery (2007) found that nurses with tertiary qualifications experience
higher emotional exhaustion than hospital based nurses. Hope, Kelleher and
O‟Connor‟s (1998) study found that qualified nurses reported significantly higher
levels of stress compared to student nurses. Student nurses in their study used
significantly more coping strategies than qualified nurses. However, those that
continued professional education for more than ten days over two years experienced
lower levels of burnout. Similarly, Jenkins and Elliott (2004) found that qualified
nurses reported higher stress levels relating to workload than nursing assistants.
4.2. Environmental working conditions
Most healthcare providers have known at least one person who has experienced
workplace stress (Lambert, Lambert & Yamase, 2003). Valid measurement of work
environments has assumed importance in occupational health disciplines in order to
evaluate stress and management interventions (Jones & Johnston, 2000). AbuAlRub‟s
(2004) study showed that working in environments with decreased levels of stress and
increased levels of social supports resulted in increased rates of nurse retention. They
recommend that nurse managers and nurse administrators set examples so co-
workers‟ support will be an inherent characteristic within the workplace. Shiu (1998)
suggests nursing management adopt an approach to building a healthy working
environment, rather than focusing on individuals‟ stress management. This is a more
preventative approach, rather than reacting or treatment following a critical incident.
Nursing is a broad profession with nurses performing several roles in various areas of
practice (Chrisopoulos & Waters, 2003). Olofsson, Bengtsson and Brink (2003)
highlighted issues relating to increased workload requirements and demanding work
tasks. They identified high work demands as difficult to address. Nurses in their study
could not influence the work situation which caused them to feel hopeless. As such,
they emphasise the importance of unions and employers overseeing workload levels.
Goodin (2003) found that nurses reported experiencing excessive workloads and an
inability to complete tasks. However, Gillespie and Melby (2003) report that nurses

41
have often regarded stress as their personal responsibility, with less focus on changing
the work environment.
Certain factors are already known to impact on workplace stress such as working
conditions, external pressures and physical aspects of the working environment.
Nurses have described working environments as unpredictable and accidental,
emphasising the importance of a safe physical work environment (Billeter-Koponen
& Freden, 2005; Levin, Hewitt & Misner, 1998). Interventions such as targeting work
environments and involving managers and working team members represent first
steps for improving workers‟ health (Lavoie-Tremblay, Bourbonnais, Viens, Vezina,
Durand & Rochette, 2005). It is essential that nursing organisations introduce
guidelines, procedures and policies which assist managers to implement change and
appropriately manage stress levels within their workplace environments (Harris,
2001).
Canadian nurses in Beaudoin and Edgar‟s (2003) study stated that they could not keep
up at the speed they were working. Nolan (1995) comments that increasing workloads
and lack of resources might mean nurses are working longer hours. Van der Hulst and
Geurts (2001) note that overtime is likely to occur with excessive workloads. They
note that, eventually, insufficient recovery might cause increased fatigue and
influence health and well-being.
Gonsalves (2003) reports that work is now more challenging because of managers‟
demands to work faster. Cooper (video recording, 2007) now directs a company
which manages workplace stress and the outcomes have been shown to have
significant reduction of sick leave especially in the police force. Organisations should
be mindful of their obligation and responsibility to facilitate their employees‟
professional and personal growth by addressing stress reactions. Healthy discussions
might help understand and identify stress in the workplace so solutions to stress and
burnout problems are achieved (Ootim, 2001). Normal meetings of nurses and
midwives during the course of their day are an important aspect of the working
environment (Billeter-Koponen & Freden, 2005).

42
Jenkins (1996) conducted some qualitative research with nurses working in Wales and
found that daily „hassles‟ were sometimes more stressful than bigger issues, and
especially when in a hurry. Chang, Hancock, Johnson, Daly and Jackson (2005)
identified work environment factors as key areas causing role stress in nursing. Role
stress might be defined as the consequence of disparity between an individual‟s
perception of the characteristics of a specific role and what is actually being achieved
by the individual currently performing the specific role (Lambert & Lambert, 2001).
Role stress, specifically work overload, is reported as a main reason for nurses and
midwives leaving the workforce (Chang et al., 2005).
Nursing is perceived to be an extremely stressful vocation (Wheeler & Riding, 1994).
As nursing is historically known as a stressful occupation, McGrath, Reid and Boore
(2003) note that most nurses and midwives would expect a challenge or at least some
type of stress in their working environments. They found that by far one of the most
commonly reported stressors for nurses was insufficient time to perform their work
and provide quality care. Nearly half of their respondents mentioned meeting imposed
deadlines as stressful. Nurses and midwives are susceptible to systemic workplace
stress which includes pressures such as inadequate numbers of staff, heavy workloads
and inadequate organisational support (Bergen & Fisher, 2003). Deery (2005) shows
that sometimes bureaucratic pressures of working in large hospitals and health
services can exaggerate the importance of the system rather than that of the nurses‟
and midwives‟ contributions.
It seems that the workload, rather than the task per se, is the precipitating factor which
is exhausting for nurses and midwives (Severinsson, 2003). As the nurse in
Severinsson‟s (2003) study states:
If you had a couple of families where there
was a terminally-ill older member, for example
you would have to spend extra time, you couldn‟t
just get up and go … there was no one else to refer
them to, so it was you or nobody
(Severinsson, 2003, p. 62).

43
Nurses will not stay in or return to the workforce unless workloads are perceived as
reasonable (Achterstraat, 2007).
In 1997, the Australian Council of Trade Unions listed increased workload as one of
the most stressful conditions for health workers (42%). The Australian Council of
Trade Unions (1997) claimed that increased workload accounted for 25 per cent of
stressful conditions across all industries. The Australian Council of Trade Unions‟
(1997) report showed that nurses identified difficulty in obtaining pay for overtime
when finishing work late due to excessive workloads and often no meal breaks. The
priority of high-quality services pushes nurses and midwives to work in difficult and
complex circumstances (Deery, 2005). According to Deery, (2005) nursing and
midwifery are about human relationships. Development of coping and interpersonal
skills is necessary in dealing with the stressful nature of the work. Zapf, Seifert,
Schmutte, Mertini and Holz (2001) conceptualise emotional responses to work as
multidimensional constructs posing various demands on healthcare professionals.
Engelbrecht (2006) conducted a qualitative study on midwives in Denmark and
revealed that the midwife is not often able to recover, stepping from one demanding
and active environment into others. She reports that midwifery is a job which
demands mental, emotional and physical availability. Wheeler and Riding‟s (1994)
study on occupational stress in nurses and midwives, found that excessive workloads
were very stressful. They found that staff shortages, workload and insufficient time
for completion of tasks were the three main stressors. This highlights the impact of
time pressure as a major stressor. Kushnir, Rabin and Azulai (1997) also identified
excessive workload as a reason that paediatric oncology nurses held their staff
meetings outside of work hours. These nurses believed that the norm was to finish
their work shift two to three hours after the specified shift time and a nurse leaving
prior to this time or on time was not a „good‟ nurse. Therefore, a nurse should not
leave at the completion of the shift. They should stay on as required, taking extra
special responsibilities.
Nurses‟ work is being done with a small number of staff and the pace of this work is
increasing (Billeter-Koponen & Freden, 2005). Nurses are now asked to see more

44
clients in a shorter time period (Penson, Dignan, Canellos, Picard & Lynch, 2000).
Greenglass and Burke (2001) note that workload has been the most consistent and
significant predictor of stress in nurses and has contributed to cynicism, depression
and anxiety. They recommend that if the detrimental effects of increased workloads
are identified to hospital administrators, they might redesign education programmes to
ameliorate stress in nurses. Greenglass and Burke (2001) recommend hospitals reduce
stressful outcomes for nurses by implementing strict policies to limit excessive
workloads, and if workloads are managed appropriately nurses should experience less
anxiety and depression and in turn find greater job satisfaction. The three areas
determining job satisfaction include 1) organisational procedures and policies; 2)
aspects concerning overall workload, feedback, autonomy, skill variety; and 3) the
work environment‟s physical nature and personal characteristics including general life
satisfaction, self-esteem and ability to withstand stress (Furnham, 1992).
Action plans targeting psychosocial work environments represent first steps to
improve workers‟ health. To retain and attract nurses it will be essential to maintain
and create healthy and stable work environments (Lavoie-Tremblay et al., 2005).
Efforts to improve work environments are critical to sustain a strong nursing
workforce for the future (Laschinger & Finegan, 2005). Bohle and Quinlan (2000)
report that attempts to remove or reduce stressors from the work environment are rare
and interventions usually amount to increasing employee tolerance to deleterious job
characteristics. However, Achterstraat (2007) recommended the use of a workload
tool to determine nursing numbers required for general wards and workloads have
since been improved in wards where the tool has been introduced.
Since the questionnaire developed for this study was distributed in 2005, excessive
workloads have been identified as a high priority issue. The NSW Nurses Association
(2007a) has initiated a workloads breakthrough for nurses in emergency departments,
community health and mental health. These guidelines allow nurses‟ input into
workload assessment and attempt to provide them with the power to address these
workload issues. The NSW Nurses Association (2007a) states that it is unacceptable
for nurses in emergency departments, mental health services and community health to
endure heavy, ongoing workloads.

45
The following principles have been developed by NSW Nurses Association and NSW
Health (2008a) (2008b) for emergency department and inpatient mental health
managers in the evaluation of nursing or staffing levels and for the „Reasonable
Workload Committees‟ to assess and manage identified workload issues. To
determine the nursing productive fulltime equivalent required: 1) the previous 12
months activity are to be used as a baseline unless there has been a significant change
in activity or introduction of a new model of care; 2) the previous year‟s fulltime
equivalent utilised is to be compared, professional judgement together with anecdotal
information on workload issues; 3) local factors affecting workload for example,
physical layout of unit, availability of support, staff etc. Extra factors to be considered
for mental health units include: 1) patients with a dual diagnosis; 2) the number of
inpatients requiring: one staff or more to one patient; close observation; sighting at
regular intervals and nearer to going home; 3) clinical risk assessment of patient
including aggressive and suicidal behaviour, vulnerability, age and co-morbidities. To
determine the nursing non-productive fulltime equivalent required: 1) no less than two
weeks (ten days) leave relief per fulltime equivalent for sick / family and community
service leave and mandatory education; 2) annual leave relief; 3) assess impact on
staff for Workers‟ Compensation / Return to Work Programmes on fulltime
equivalent required; 4) long service leave and maternity leave and relief is not
considered part of the funded fulltime equivalent (NSW Nurses Association & NSW
Health, 2008a, 2008b). These strategies are only recently being evaluated for
acceptability and effectiveness.
Stressful and unsafe nurse workloads are an important issue and development of
appropriate guidelines are efforts to underpin nurses‟ legal rights to reasonable
workloads. These guidelines which have arisen from The Nursing Practice and
Process Development Survey (NSW Health Department, 2002-2003) are being
initiated and evaluated. The Nursing Practice and Process Development Survey (NSW
Health Department, 2002-2003) was undertaken to ascertain nurses‟ and midwives‟
opinions concerning possible improvement in staffing levels, resources and
occupational health and safety issues. The Ministerial Standing Committee is
presently reviewing the outcomes and solutions that are currently being implemented
in the workforce areas of nursing and midwifery. One of the most important issues

46
arising from this survey was the awareness and documentation of excessive workloads
as factors which influence provision of quality care for patients. Nurses and midwives
are encouraged to follow the suggested reporting guidelines if they believe that they
are working under these circumstances. Recommendations from the NSW survey
have been partially adopted. These recommendations are designed to assist staff in
skill development and knowledge, coupled with flexibility in an era of rapidly
changing healthcare systems, and showcasing educators and nursing unit managers
with excellent management and leadership skills. Outcomes of the 2002 to 2003
(NSW Health Department) study follow.
This Nursing Practice and Process Development Survey (NSW Health Department,
2002-2003) instigated seven steps in public hospitals and six steps in private hospitals
to address excessive workloads. For public hospitals this involves nurses and
midwives identifying workload issues in the unit, ward or health service. The next
step is raising the issue with the manager. If the issue is then not resolved, the worker
is to consult the representative from a „Reasonable Workloads Committee‟. This
committee then makes recommendations to management and if still not resolved the
NSW Nurses Association is contacted. If the matter is not resolved with the Area
Health Service, the Association commences dispute proceedings in the NSW
Industrial Relations Commission. The process is similar in private hospitals (NSW
Health Department, 2002-2003).
Recently workloads have been addressed at Coffs Harbour Base Hospital in the areas
of the emergency department and operating theatre. Admissions to hospital increased
by 50 per cent in July 2007 compared to the previous year, seeing 33,000 patients
within that year. Extra staff have been sought via the NSW Nurses Association‟s
„Reasonable Workloads Committee‟. Extra positions in the emergency department
and operating theatres have been approved in hopes that unnecessary pressure on
nurses can be relieved. It has been reported that this strategy has made a significant
difference to Coffs Harbour nurses. Coffs Harbour nurses sought an extra ten
positions for areas with the highest staff shortages via the „Reasonable Workloads
Committee‟ (NSW Nurses Association, 2007b).

47
Workload has been a major issue for mental health nurses at Morisset Hospital in
NSW with a new approach following much lobbying to prevent patient overcrowding
and nurse understaffing. This hospital banned new admissions as nurses expressed
concern and frustration about patients‟ welfare. Currently, caps are in place,
controlling the number of patient admissions. If these patient caps are exceeded, an
extra nurse is now employed on each shift. It would seem that unacceptable
workloads for nurses are in some instances finally being assessed (NSW Nurses
Association, 2007c).
Excessive workloads also relate to staffing levels. Recently, midwives at Royal Prince
Alfred maternity unit (NSW Nurses Association, 2007d) report experiencing high
rates of stress and burnout from severe workloads. They have expressed concerns
regarding patient safety and standards of care. Midwives at Royal Prince Alfred
maternity unit (NSW Nurses Association, 2007d) were staffing 60 full beds for the
night shift with just eight midwives, which was one-third of staffing for the day shift.
The midwives described that even when birth rates had increased from 4,200 to 5,043
births in the past year, staffing was not increased. Workload was also increased by
rising Caesarean rates, with 94 more Caesareans in the space of three months
compared to the same period a year ago. Many staff were working regular overtime
due to staff shortages and burnout rates and stress levels were reported as high. A few
of the midwives also required stress leave and some midwives left because they could
not deal with the excessive workloads anymore. Those staff who stayed were
reporting exhaustion and that they could not work any longer (NSW Nurses
Association, 2007d).
Royal Prince Alfred midwives (NSW Nurses Association, 2007d) had sought help by
a „Reasonable Workloads Committee‟ by sourcing more staff for their maternity unit.
This action allowed patient numbers to be capped, removing enrolled nurse trainees
from the ward, trialling a nursing unit manager position, reorganising antenatal clinics
and improving security. Royal Prince Alfred midwives (NSW Nurses Association,
2007d) finally called an extraordinary meeting to increase staffing. Staffing has now
increased, including clinical midwives, ward assistants and ward clerks, another
midwifery educator and expanded role of a clinical midwifery consultant. These
48
midwives are reported as determined in pursuing their claims and committed to
achieving quality patient care and a better workload. They are now reporting success
following a two-year campaign to lobby for more staff and have recently seen
significant staffing increases.
Recent research by the NSW Nurses Association (2008c) has shown that nursing unit
managers reported that more support was crucial to reduce workloads and burnout and
to retain nurses and midwives in the profession. Midwifery managers received no
extra resources and staff to cope with the increased birth rate. Responsibility for
administration and management has been directed towards nursing unit managers who
lack adequate administrative and clerical support (NSW Nurses Association, 2008c).
NSW Nurses Association (2008c) has found that nursing unit managers are obliged to
do significant numbers of hours of unpaid overtime work to complete their
administrative workload. Nurses and clients are disadvantaged because nursing unit
managers lack the time to exercise their high-level skills, mentoring and supervising
other colleagues including nurses and midwives to implement best practice (NSW
Nurses Association, 2008c). Workloads for managers, including clinical care in
addition to leadership, organisation and administration duties, could be an issue worth
pursuing in future research.
A recent anecdotal report from a nursing unit manager at Bathurst Base Hospital‟s
emergency department concluded that she felt overwhelmed by her workload. She
stated that she spent three-quarters of an hour to one hour before and following each
shift attending to unpaid administrative work and frequently worked paid clinical
overtime covering last-minute shortfalls in rosters. Last year her overtime tallied 109
paid clinical hours. She stated that she was rarely consulted on statewide rollouts of
projects affecting her unit (NSW Nurses Association, 2008d).
In another anecdotal report, a nursing unit manager at Mona Vale Hospital stated that
staff reductions are having severe impacts on nursing, allied health and medical staff,
as well as patients. She stated that these staff struggle to deliver quality patient care.
She describes spending much of her time in direct patient care (as opposed to
managing the unit) as there are insufficient nurses to complete the workloads. A key
49
responsibility of her nursing unit manager position is to ensure her unit stays up-to-
date with nursing practice changes, but this suffers due to her direct patient care
workload. She stated that nursing unit managers try to protect colleagues but the
workload is so excessive that they are rarely able to do this anymore (NSW Nurses
Association, 2008e).
Cottrell (2001) found workload to be a major stressor for mental health nurses.
Morgan, Semchuk, Stewart and D‟Arcy (2002) also identified workload issues to be
the most significant concern for aged care nursing staff in their study. They mailed
survey questionnaires to all registered nurses, nurses aides, and activity workers in
aged care facilities. The self-reported scales assessing the social and psychological
structure of work environments found sources of stress involved insufficient skills,
workload and managing dementia in the aged care facility. Heavy workloads
prevented nurses spending more quality time and care with dementia residents.
Dementia care experts reiterate the need for recreation facilitated by nurses to
improve quality of life for persons with dementia (Morgan et al. 2002). In Morgan et
al‟s (2002) study nurses felt anxious and „rushed‟ about their ability keeping up with
work demands. Perceptions of having to work quickly, having insufficient time, and
excessive demands were evident in their feedback. Nurses in their study reported
rushing residents‟ care often resulting in residents becoming aggressive or agitated.
Insufficient time also contributed to psychological demands affecting all staff.
Overall, insufficient time for both physical and psychosocial care diminished
residents‟ quality of life and dignity. Combined with these high job demands, these
aged care nurses perceived their work environments to yield low control, reporting
fewer opportunities for decision-making. Training was identified as a particular
strategy for reducing stress in staff caring for residents with dementia.
Greenglass and Burke (2001) identified workload as the most consistent and
significant predictor of stress in their study with hospital nurses. Barrett and Yates
(2002) also found that workloads are likely to cause emotional exhaustion and job
dissatisfaction for nurses. They note that determining appropriate, sustainable
workloads for nurses and midwives will be a continuing challenge. They recommend

50
that any solution should include a review of how nursing and midwifery care is
delivered, be that primary patient allocation or team models of care.
In Boey‟s (1996) research, Singapore had been experiencing a nursing shortage
resulting in work overload. In fact, work overload and staff shortages were reported as
the most stressful experiences among Singaporean nurses. The nurses noted stress
sources included work overload, inadequate staffing, feelings of incompetence,
awareness of high levels of responsibility, lack of support and interpersonal conflicts.
Harris (2001) found that the nature of nurses‟ work means they are exposed to more
stress compared to other employees, experiencing role ambiguity, significant work
demands and role conflict. Williamson and Dodds (1999) found that potential conflict
between clients and nurses and their relatives, especially involving disputes about the
extent and nature of care delivered, is another source of stress.
Barrett and Yates‟ (2002) research considered factors affecting quality of oncology /
haematology nurses‟ work, which affected their choice to remain in nursing or in a
particular specialty. They found that 8.2 per cent had a high intention of leaving
nursing in the not too distant future. A further 39.5 per cent indicated uncertainty
about their intent to leave the specialty. The ramifications of this actually occurring
would have negative outcomes in social and economic terms.
Muscroft and Hicks (1998) suggest that quality of care might be diminished when
nurses are stressed. Their small study compared general and psychiatric nurses‟
responses on the likelihood of their using counselling at work in dealing with their
problems. They reported that some nurses would rarely want their supervisor to know
that they were requiring counselling because that might be identified as a professional
weakness. They found that the general nurses experienced more stress than their
colleague psychiatric nurses. The psychiatric nurses were also more likely to engage
in workplace counselling services. These results were quite different from previous
similar studies. O‟Connor and Jeavons (2002) have shown that, generally, Australians
are not likely to divulge personal information, especially in a work setting, for fear of
being labelled as „not coping‟, possibly jeopardising job security.

51
Krausz and Koslowsky (1995) note that levels of stress will vary depending on the
kind of department where the nurse works. On the other hand they report that
intensive care unit nurses are more likely to accept greater job opportunities such as
responsibility, autonomy and involvement. Based on these results that intensive care
units might provide better enriched work environments, nurses might demonstrate
lower levels of stress and better work attitudes.
Hall (2001) undertook a study to determine the severity and extent of burnout in a
nurse population in New Zealand. It also assessed socio-demographic characteristics
in relation to burnout and explored relationships between employment variables and
nurses‟ experience of burnout. Eleven hundred and thirty four respondents (38%
return rate) showed that 32.9 per cent show advanced burnout phases, which is similar
to other worldwide studies. Indicators of behaviours of burnout were „keeping distant
from people‟ and „removing themselves from social support networks‟. They were
unable to deal with stressors and apathetic about solving problems. There was a strong
correlation between age group and burnout, more than half of those over 40 years of
age being in advanced stages of burnout. The study‟s findings present a different
picture to previous studies, where a younger population of nurses consistently
reported high burnout levels. Patterns of burnout were not different across various
specialty work settings. Another result was Nolan‟s (1995) study, showing stress
levels to be higher with increased seniority. Burnout can impair quality of care for
clients as well as having detrimental consequences for the personal lives of the carers
(Penson et al., 2000).
Phillips (1995) has shown that nursing stress is extensive because concerns with work
overload, job stability and security, lack of support, self-esteem, safety issues and
money and family are often complex and difficult to resolve. Garrett and McDaniel
(2001) report that as hospitals deal with changes in external environments, such as
available resources or changing regulations, this can create uncertainty in the internal
environment, and the variations and uncertainty might, in turn, affect nurses. They
show that a high level of uncertainty in the environment influences nurses to perceive
that their contributions to both organisational outcomes and client care seem under-
recognised. They have shown that caring for more clients in less time and with fewer

52
available resources produces decreased patient satisfaction, reduced staff morale, staff
behavioural changes and increased healthcare costs. According to Garrett and
McDaniel (2001) this results in negative consequences, leading to burnout.
Ng, Koh, Chan, Ong, Chia and Ong (1999) found that nurses are required to respond
to rapidly changing health environments. Ng et al‟s (1999) study found that for
medical and surgical nurses, 54 per cent of the amount of stress occurring in their
daily lives was caused by their jobs. The main sources of stress included work
overload, death experience, emotional demands of families and patients, poor
communication among staff and a changing work environment. Some nurses working
fulltime also attended to housework and cared for children. Their study concluded that
nurses working in different nursing units experience varying levels of stress.
Mackin and Sinclair‟s (1998) study showed that insufficient time to attend to patient
care duties caused high levels of stress. Mackin and Sinclair (1998) note that stress
requiring treatment has been shown to affect nurses and midwives, ranging from skin
disorders, headaches, migraines and minor surgery. Maslach, Schaufeli and Leiter
(2001) indicate that burnout research has established that high expectations of
healthcare consumers coupled with nurses working hard, beyond what would be
considered reasonable, leads to eventual cynicism and exhaustion, particularly when
the increased exertion does not lead to the expected results. Their research has
reported that as cynicism persists, workers‟ feelings of inefficacy increases, so further
studies are necessary to explore this issue. They support the notion of burnout being a
prolonged response to long-term job stressors. Their alternative argument shows that
mentally healthy people are more adept at coping with chronic stressors, therefore not
as likely to suffer burnout.
Laschinger et al. (2001a) explored relationships between psychological and structural
empowerment, work satisfaction, and job strain. Their final sample consisted of 404
(72%) usable questionnaires (194 males, 210 females) for nurses working fulltime
(58%) or part-time (42%). These demographics were not representative of nurses
practising in the country. The results showed that structural empowerment had a
positive, direct effect on psychological empowerment, which in turn had a positive,

53
direct effect on satisfaction with work and a negative direct effect on strain at work.
They found that increased workloads, increased job uncertainty and higher patient
acuity in healthcare environments have a dramatic impact on nurses‟ experiences of
work. They highlighted how job demands are psychological stressors in the working
environment: how hard and how fast one performs necessary tasks, time limits to
perform certain tasks, increased amount of work, conflicting demands, interruption of
tasks and the hectic pace of the job. Another issue highlighted that employers have
adopted policies restricting nurses from varied aspects of client care; nurses‟ roles
have been devalued by substituting nursing positions with less qualified care
providers. They found nurses with high job strain were less satisfied, less committed
and less empowered with their jobs. Their results suggest that managerial
interventions which increase nurses‟ feelings of control might increase nurses‟
positive responsiveness to healthcare work environments. Fagin, Brown, Bartlett,
Leary and Carson (1995) also found a sizeable proportion (>60%) of their sample of
psychiatric nurses were dissatisfied with their work environments.
Job satisfaction is regarded as an intrinsic reward for nurses and might counterbalance
stress (McGowan, 2001). Retaining experienced and qualified nursing and midwifery
staff has become a challenge in the current work environment (Edwards & Burnard,
2003). It is essential to examine factors influencing nurses‟ job satisfaction. Current
nursing workforce trends suggest shortages are causing problems with quality patient
care (Barrett & Yates, 2002).
Even though the sample was small (N=129), Healy and McKay‟s (2000) study
showed that reducing environmental stressors like perceived inadequate staffing levels
and workload might be more appropriate than interventions like education or
improvement in individual coping strategies and stress management. Workplace
issues influencing staff retention might include flexibility of work hours, pay rates,
incentives towards further education and study and scholarships for worthwhile
research projects. They found that improving working conditions for nurses and
midwives will not only decrease stress levels but encourage nurses and midwives to
continue in their profession. Individual stress management might be helpful, but it
will provide only temporary relief for nurses and midwives. Providing preventative

54
strategies such as a healthy working environment and excellent resources and support
instead of managing the stress effects might be the answer (Healy & McKay, 2000).
Weekes, Peterson and Stanton (2001) identified that working harder and longer is
what they called work intensification. It involves doing more tasks with less resources
and is achieved by increasing workloads of employees or decreasing staff numbers
doing the same work. Following identification of the stressors, methods must be
considered to reduce them (Weekes, Peterson & Stanton, 2001).
Carson, Bartlett, Leary, Gallagher and Senapati-Sharma (1993) found that emergency
nurses report their exposure to violence as extremely high. Another stressful factor
they identified was experiencing too many interruptions. A recent study conducted at
Macquarie University (Carstairs & Trenoska, 2002) on 100 nurses in Sydney hospitals
found abuse and violence from patients and colleagues accounted for the majority of
nurses‟ stress. The study suggests that nurses should not have to endure this abuse in
their working environments. Their study attempted to represent that many more
nurses are continually dealing with this issue. McKenna, Smith, Poole and Coverdale
(2003) have shown that horizontal violence usually involves psychological
harassment which creates hostility. This might lead to deleterious psychological
effects contributing to hostility in the working environment. This hostility might be an
effect of ongoing stress, impacting negatively on nurse and midwife retention in the
workforce.
In Fagin et al‟s (1995) study, nurses thought that changes in health services were a
source of stress and work overload was a huge stressor for nurses in geriatric and
medical wards. Gray-Toft and Anderson (1981) identified three major sources of
stress: inadequate educational preparation, dealing with death issues and work
overload. Carson, Bartlett and Croucher‟s (1991) study found that community
psychiatric nurses identified some of the most stressful aspects of their job as working
with violent clients and having no community facilities to which to refer patients.
They noted that as community services are overloaded, the nurse might take on more
than their role expects of them.

55
In O‟Donnell‟s (1996) research, time pressures / deadlines and work overload were
considered major stressors, while violence and shift working were considered less so.
Managers identified their major stressors as long hours, time pressures / deadlines,
poor communications and role conflict. Hummelvoll and Severinsson (2001) reinforce
the issue of inadequate time in their study with psychiatric nurses who report lack of
time to talk with clients leaves them with a guilty conscience. They show that even
though the nurses in their study would have liked more contact with patients‟ families,
this was not possible due to insufficient time. Nolan‟s (1995) research on mental
health nurses‟ stress revealed major stressors which included: difficulties with clients,
overly heavy workload, interpersonal conflict, organisational structure, professional
self-doubt, under-resourcing and home / work conflict. Clinton, Moyle, Weir and
Edwards (1995) found nurses were stressed about aged residents‟ disruptive
behaviour. These stressors are comparable to other stressors identified in the
literature.
Billeter-Koponen and Freden‟s (2005) study found that 43 per cent of nurses intended
to leave their current employment within 12 months. Healy and McKay (2000) found
that even though most nurses in their study reported being satisfied in their present
positions, 67 per cent had thought about leaving the nursing profession.
Environmental stressors, including low staffing levels and excessive workloads,
accounted for this (Healy & McKay, 2000).
In McGrath, Reid and Boore‟s (2003) study, 33 per cent of nurses supported a
reduction in workload as a factor to alleviate stress. They revealed that nurses
experienced insufficient time to complete their work. Taylor and Barling (2004) in
their research reflect how stress affects mental health nurses in the work environment.
Participants commented how they felt rushed, many times forgetting to drink or
urinate and not writing reports properly.
There is a tendency among nurses and midwives to assume that being pressurised by
stress equals a sign of weakness; however, proper debriefing and mutual support
during crisis periods might be effective for addressing stress (Mackin & Sinclair,
1998). WorkCover Authority of NSW (2000) suggests addressing this pertinent issue
56
of stress and burnout in the workforce, and fostering a supportive work environment
through clinical supervision. Clinical supervision is a supportive, confidential and
formal process which encourages exploration and reflection of work practices.
Clinical supervision allows for professional development and competence in
employees and has been believed to improve client care. Clinical supervision can
foster a more industrious and stable workforce (WorkCover Authority of NSW,
2000).
Clinical supervision has been routine for psychologists and now is steadily penetrating
into nurse and midwife arenas. Williamson and Dodds (1999) note that clinical
supervision has conventionally been seen as educational rather than supportive for
staff. Clinical supervision can be an effective means of nursing and midwifery support
and involves moving beyond acknowledging stress and burnout in the workplace
(Deery, 2005). Being positive towards clinical supervision and feeling supported by
supervisors might mean lower burnout levels (Edwards, Burnard, Hannigan, Cooper,
Adams, Juggessur, Fothergil & Coyle 2006). Further research is recommended on
clinical supervision effects and its association with reducing burnout (Koivula,
Paunonen & Laippala, 2000).
4.3. Organisational factors
Stress is a collective issue and requires a collective response to change the system
(Salvage, 2003). Harris (2001) highlights that stress might affect an organisation‟s
stability and cause significant harm. If the organisation does not address and recognise
this, it could lead to increased absenteeism, impaired productivity, high staff turnover,
increased accident rates, unsafe behaviour and a negative health and safety culture in
general. She found that conflicting organisational demands lead to confusion, also that
over-demanding and inflexible schedules can increase work pressures. She concluded
that prolonged conflict between nurses, including racial or sexual harassment, or
bullying, could cause harmful stress levels. Harris (2001) found that organisations that
are changing or growing rapidly might transfer pressures to individual nurses, with
little consideration of their preparedness for these changes. She reports that some
employers foster a friendly culture, assisting nurses to adapt to new changes and to
learn while practising. In Ekstedt and Fagerberg‟s (2005) study some people

57
experiencing burnout described unstructured organisations as a characteristic feature
in their work situation.
McGowan‟s (2001) study on self-reported stress and its effects on nurses showed that
organisational support contributed greatly towards job satisfaction. Regardless of the
amount of organisational support received, nurses‟ perceptions of this situation will
ultimately affect job satisfaction (McGowan, 2001). Even though the sample was
small (N=72), he found that the most prominent negative influence on job satisfaction
was lack of support from the organisation. McGowan (2001) recommends valuable
research could be conducted on the role of control nurses perceive they have over
their work and if variability in control contributes to stress levels. Beaudoin and Edgar
(2003) found that job satisfaction correlated positively with communication from
supervisors in recognition of the nurses‟ work.
Barling‟s (2001) study has shown that over the past 25 years, mental health nurses‟
job satisfaction has decreased. Mental health nurses felt that this particular area was
more stressful and dangerous than it had been in the past. Visiting unsafe areas and
dealing with suicidal clients were not rare duties. Mental health nurses identified
many stressors which are precursors to burnout. The themes which emerged from
Barling‟s (2001) study are related to the role of the nurses and organisational issues.
The themes included lack of support, suicidal and violent patients, lack of education
and professional development, lack of resources and facilities for patient care and
inadequate numbers of expert staff. Staff perceived they had no control over such
things as decision-making and morale was identified as low.
Barling (2001) reports that the supportive infrastructure previously provided by large
psychiatric hospitals is no longer available to mental health nurses and patients.
Organisational decisions are being approved and implemented by managers who seem
to have little understanding of mental health issues. Large community client loads
lead to professional burnout and frustration. The significant degree of burnout for this
mental health workforce has implications for client quality care according to Barling
(2001).

58
According to Curtis, Ball and Kirkham‟s (2006a) study, one of the main reasons why
81 per cent of midwives had left their profession was job dissatisfaction. Midwives in
Curtis, Ball and Kirkham‟s (2006a) study reported that regular working hours,
improved pay and better working conditions elsewhere influenced their decision to
leave midwifery. These midwives found alternative work in educational settings or in
the community. The majority of these midwives no longer worked shift work. Job
satisfaction factors which were critical to these midwives who had left the profession,
were flexibility, support and autonomy. The midwives who continued to work shifts
now worked predictable, fixed shifts, suiting their individual requirements. Managers
in Curtis, Ball and Kirkham‟s (2006b) study described making difficult decisions
about needs of individual midwives, in relation to flexible working patterns.
In the recent Scoping Study on Australian mental health nurses, Clinton and Hazelton
(2000) identified widespread dissatisfaction. Nurses believed their expertise was not
taken into account. They reported that there has been an increased number of patients
with challenging and aggressive behaviours and drug problems. The study identified
these trends to be of concern and reflected changes in the population profile of clients.
Barrett and Yates‟ (2002) research indicated that oncology / haematology nurses were
dissatisfied with their pay. Nurses believed they were not reasonably paid for the type
of work they did. Nurses recognised that continued employment and job security was
high but regarded opportunities for career promotion as unsatisfactory. Nurses were
also dissatisfied about gaining funding and leave for courses, the quality of work they
undertook and professional support.
Nursing management is in a position to strengthen and support new recruits and more
experienced staff (Shiu, 1998). Sundin-Huard and Fahy (1999) shows that if the
nursing profession does not have organisational support this often leads to moral
distress and outrage. Toohey (1996) noted that the organisational culture and structure
in which nurses find themselves determines their behaviour and the quality of their
work. He noted that the demands which nurses face might be negative or positive
depending upon the individual‟s response to the demands. He highlighted that when
people describe situations as „stressful‟, stress illness might result from organisational

59
problems. The illness might be treated but organisational issues ignored. Furnham
(1992) explains that work-related behaviours are not solely within the individual‟s
control and are often influenced by organisational factors.
Levin, Hewitt and Misner (1998) have shown that workplace physical and verbal
assaults are common, affecting nurses‟ professional and personal lives. They indicated
that nurses expressed vulnerability, unpredictability and fear related to their work
situation. Their results show that emergency nurses in their working lifetime, have
high exposures to workplace violence, and emergency department stress levels are
rising due to an emphasis on client satisfaction, which contributes to a risk for
violence. Customer-friendly environments often seem to put nursing staff safety
second. Not knowing who might be assaultive keeps nurses in an „on guard‟ mode.
They perceived security guards to be more effective in controlling and preventing
violent situations when they wore a uniform and when specially educated in hospital
security. The guards usually wore a „customer friendly‟ jacket and tie. The nurses
considered the security guards‟ behaviour and attitudes important factors contributing
to a decreased risk of violence.
Taylor, White and Muncer (1999) researched causes of stress in English nurses. The
main causes were: multiple conflicting demands and roles, inadequate support due to
lack of personnel and resources, relatives‟ and clients‟ behaviour, low staffing levels,
client suffering, powerlessness regarding decisions, incompetence and attitude of
staff, interruptions, doctors‟ and managers‟ behaviour and shift rotation patterns.
Other common stressful issues were pressures to prioritise work over personal life,
untidy colleagues and excessive background noise. The data strongly show a specific
picture of nursing / midwifery located within a complex and demanding health
industry setting. They have presented a picture of a work-force stretched to what they
perceived as unreasonable limits as other powerful professional groups reduce the
nurses‟ opportunities to alter working conditions.
In another development Snelgrove (1998) reported that 122 nurses working in
hospitals were reporting high levels of stress and lower job satisfaction as compared
with two other groups (that is, 122 district nurses and 38 community psychiatric

60
nurses). Each occupational group found lack of resources, organisational issues and
administrative tasks more stressful than client-centred issues such as difficult cases,
clients‟ emotional problems and socially deprived clients. Key stressors included the
work / home interface for hospital nurses, tedious routine for community nurses and
lack of time for home visits for district nurses.
Ryan and Quayle‟s (1999) study showed that psychiatric nurses reported high stress
levels related to organisational rather than intrinsic factors of the job itself. Lambert
and Lambert (2001) undertook a literature review worldwide and found that in
Switzerland ethical conflicts about role ambiguity, team conflicts, appropriate client
care, organisational deficits and workload were identified as major stressors for nurses
and physicians. In Germany oncology nurses identified interpersonal difficulties as
causing physical distress. Age, as well as institution size and trainees‟ presence, were
associated with stress levels.
Makinen et al. (2003) found that stress caused by increased levels of responsibility
occurred more often in large wards with a high proportion of permanent staff than in
smaller wards with a large number of temporary staff. They found problems with
interpersonal relationships were more likely to occur in medical, not surgical wards.
They also found that high responsibility levels were associated with work overload.
Role expansion in nursing was also associated with higher levels of stress.
Yonge, Krahn, Trojan, Reid and Haase‟s (2002) study indicated acting in the role of
preceptors to be a stressful experience because of increased workloads and lack of
time. They noted that attempting to educate a novice when the preceptor has an
unreasonable workload is unfair to both parties. Although the teaching of students by
clinical specialists is necessary, it requires energy, patience and time in an
increasingly complex and busy work environment. While many students have almost
completed their programmes and have advanced skills, levels of expertise vary
greatly, contributing to preceptors‟ stress.
Forman and Davis (2002) identified workplace stress as a key problem. The majority
of nurses identified their managers as a major source of stress. Their study found that

61
this source of stress was greater than heavy client loads. They believe that the nursing
profession and the media have failed to promote nursing as a desirable livelihood,
vital to the well-being and health of the nation. Spooner-Lane and Patton (2008)
found that supervisor support reduced depersonalisation and improved levels of
personal accomplishment in relation to burnout. Wright (2003) described a nurse who
received little support from the employer and ultimately left the job. Sherer‟s (1993)
results identified poor staffing actually contributed most to serious illnesses and stress
among nurses.
Jenkins and Elliott (2004) found that mental health nurses had high support levels
from colleagues. They found that work colleagues provide more support for dealing
with workplace problems than practical assistance for work tasks. They also found
that work colleagues were more supportive than supervisors or ward managers. Fagin
et al. (1995) also found that the majority (88.9%) of psychiatric nurses could discuss
work problems with colleagues to alleviate work-related stress. Crabbe, Bowley,
Boffard, Alexander and Klein (2004) found that most emergency unit nurses relied
upon their colleagues‟ support following traumatic incidences. Crabbe et al. (2004)
found that when nurses and midwives are working in close proximity and
experiencing stressful events together, they perhaps develop close relations with their
workmates. They often even debrief together about a certain critical incident that they
would not be comfortable discussing with a superior.
In contrast, Hope, Kelleher and O‟Connor‟s (1998) study of hospital nurses identified
relationships with supervisors, management and colleagues as primary sources of
stress, expecting these relationships to be a source of support that were highly valued
as important functions of the work environment. Many identified the workplace as the
highest source of stress. Many nurses and midwives might not acknowledge their own
stress, as if they did they would be seen as weak or incompetent (Dimond, 2004;
Ootim, 2001; Prag, 2003).
Mackin and Sinclair‟s (1998) narratives reveal lack of communication among
midwives regarding decision-making as a source of stress. Their study led to
improvements in communication and development of social activities in the unit

62
under study. They found that if midwives work with each other as a team, a
companionship and trust develops among them, reducing stress levels. It might also
reduce the time it takes to complete a task individually, when the team unites on that
specific task. Lack of respect from relatives and unsatisfactory conditions created by
medical colleagues were other significant stress issues.
4.4. Shift work and occupational health and safety aspects
Kundi, Koller, Stefan, Lehner, Kaindlsdorfer and Rottenbucher‟s (1995) study
showed that nurses working eight hour shifts preferred these to 12 hour shifts. The 12
hour shifts had adverse effects on leisure and social time, with nurses wishing to
abolish 12 hour shifts. Nurses in Iskra-Golec, Folkard, Marek and Noworol‟s (1996)
study experienced more cognitive anxiety and chronic fatigue when working 12 hour
shifts compared to eight hour shifts. They reported worse sleep quality and were more
tired following sleep, even though they had slept longer. Frequent fatigue has also
been associated with depression (Gale, 1998; Gorter, Albrecht, Hoogstraten &
Eijkman, 1999; National Institute of Mental Health, 2004 cited in Rada & Johnson-
Leong, 2004:791). Even though their study of nurses working longer hours had more
time off between shifts to recover, this was insufficient to counteract adverse effects
of extended working days. Emotional exhaustion was more pronounced when
working longer shifts. They suggested that poorer sleep quality could be a
contributing factor towards emotional exhaustion for those nurses working longer
shifts. Josten, Ng-A-Tham and Thierry (2003) concluded in their nurse study that 12
hour shifts can be detrimental for health, fatigue and performance and that older
nurses have reported longer shifts as more physically demanding due to the increased
workload.
Prolonged work hours can result in fatigue, impaired memory and the reduction in
response speed and level of control (Smith, 1995). Iskra-Golec, Marek and Noworol‟s
(1995) results show that there are certain individual factors which counteract or
strengthen each other in relation to the stressors of shift work intolerance. Neurotic,
extroverted and flexible shift workers might not suffer as much from disturbed sleep
and impaired health. They recommend further examination of these traits among
suitably chosen individuals.

63
Schmieder and Smith (1996) report that nurses are at high risk for stress-related
illnesses. They report that working unusual hours during the night and day is stressful,
both psychologically and physiologically. They have shown that nurses working shift
work are more likely to experience gastrointestinal disorders and cardiovascular
disease. They summarise that shift workers need to adapt socially and biologically to
adverse environmental conditions, but often lack support to assist in their adaptation.
They note that sleep at an inappropriate circadian phase will be shallower, fragmented
and less restful. Changes in sleeping patterns resulting from working at night, lead to
impairments of judgement irrespective of previous hours of sleep. A worker who is
sleepy will exhibit responses which will be inappropriate or slow, and attention will
wander (Smith, 1995).
Barton, Spelton, Totterdell, Smith, Folkard and Costa (1995a) reported that shift work
had been demonstrated as a type of stress, resulting in strain. They report how
disturbed sleep results in chronic fatigue and irritability. They highlight two
deleterious effects of shift work, being cardiovascular disease and digestive disorders.
Digestive symptoms include heartburn, constipation, ulcers, flatulence, stomach pain
and loss of appetite. Barton et al. (1995a) also report how social life effects can be
harmful, resulting in poor social interactions and difficulty maintaining social hobbies
and activities such as sport and musical societies. They report how shift workers
might be alienated from the community, as most community activities occur on
weekends and evenings.
Shift work might impact negatively on health habits and cause adverse health
outcomes including smoking, poor dietary intake and being overweight (Zhao &
Turner, 2008). There is a condition known as Shiftwork Sleep Disorder in which shift
workers experience excessive sleepiness, insomnia, a lack of energy, reduced
concentration, irritability and headaches which increase over time. These risk factors
are prevalent in shift workers who work a rotating roster system, the majority of
whom are nurses and midwives working in NSW public hospitals (NSW Nurses
Association, 2008f). Specifically, nurses and midwives are reluctant to work night
shift but it is an unavoidable part of shift work. There is less education and clinical

64
support for junior nurses on night shift compared to day duty and rarely any clerical
support (NSW Nurses Association, 2008g).
Typically, nurses usually work the shifts assigned to them, which might not be their
choice. This in itself could be a cause of depression (Skipper, Jung & Coffey, 1990).
Morrow, McElroy and Elliott (1994) found that 55.6 per cent of their hospital nurse
sample worked shifts they did not choose. Skipper, Jung and Coffey (1990) report that
nurses on rotating shifts are more likely to experience stress at work due to
disturbance of circadian cycles. They report that shift work disrupts family routines,
limiting the time the nurse spends with their family by placing them on a different
time schedule. They also report how shift work interferes with opportunities for social
activities. Totterdell, Spelton, Barton, Smith and Folkard‟s (1995) study showed that
morning shift was associated with a reduction in calmness and cheerfulness, and an
increase in irritability, back pain and work worries at home. They found that
satisfaction with social and home life was reduced by shift work.
Lushington, Lushington and Dawson‟s (1997) study showed that mentally demanding
activities were factors contributing to workload, being greater than both time pressure
and emotional stress. Nurses perceived day duty to be more time pressured, mentally
demanding and physical than night work. Anecdotal reports from nurses in their study
exposed that sleep deprivation was highest following late / early shift combinations.
This contributed to lowering their psychological well-being. Williamson and Dodds
(1999) found that shift work might place pressures on a nurse‟s family and home life,
being disruptive and tiring for the body. Their research also showed that a significant
stress factor was potential conflict between patients, nurses and relatives, particularly
regarding the extent and nature of care delivered.
Bohle and Quinlan (2000) indicate that shift workers tend to experience more health
problems compared with their counterparts on day work. Harulow (2000) notes how
an abundance of research shows how shift work has damaging effects on the health of
nurses who undertake it. He notes how long-term shift work is associated with a
higher risk of cardiovascular problems. Fitzpatrick, While and Roberts‟ (1999) study
found that nurses who work rotating shifts experience greater stress than those who

65
work fixed day, night and afternoon shifts. This stress is related to disturbance of
circadian rhythms from irregular working hours. They show how night work also
results in disturbances to appetite, sleep, energy and concentration, also in feelings of
helplessness and irritability. They concluded that physical and mental tiredness
resulted in working longer hours and diminished nurses‟ overall performance.
Spelton, Totterdell, Barton and Folkard‟s (1995) study found that rotating-shift nurses
experience more work-home conflict. Nurses working permanent night duty rate
themselves more alert than night rotating-shift nurses. Their study found that older
age groups correlated to reduced amounts of sleep and a higher level of alertness.
Nurses with more domestic commitments experienced less sleep, lower levels of
alertness and more sleep difficulties. Barton, Spelton, Totterdell, Smith and Folkard‟s
(1995b) study revealed that permanent night nurses experienced better quality sleep,
better physical and psychological health, less domestic and social disruption, less
chronic fatigue and better attitudes towards shift work than rotating night nurses.
In Greenwood, Rich and James‟s (1995) study, sleep duration decreased following
night duty compared with day duty. Most common measures used to promote sleep
were blocking out the light and noise and regulating the temperature. Their study
reported high alcohol consumption levels following day shift. All these issues are
factors resulting in nurses‟ stress levels. Barak, Achiron, Kimh, Lampl, Gilad, Elizur
and Sarova-pinhas‟ (1996) study in Israel, found that 39.7 per cent of their
participants reported stress at work and this correlated with smoking. They found
smoking was widespread in shift workers, particularly nurses reporting stress. They
considered shift workers a high-risk population for diseases associated with smoking.
Kawachi, Colditz, Stampfer, Willett, Manson, Speizer and Hennekens‟ (1995) study
reported how shift work disrupted nurses‟ normal biological and social diurnal
rhythms. They found that nurse shift workers were more likely to be currently
smoking and have a higher body mass index than those who did not ever do shift
work. They were also less likely to be married. Their results conclude that working
six years or more of shift work increases the risk of coronary heart disease in women.

66
Zhao and Turner (2008) found in their literature review that shift workers adopted
adverse lifestyle behaviours such as smoking and consumed less healthy diets.
Gold, Rogacz, Bock, Tosteson, Baum, Speizer and Czeisler (1992) attended a hospital
survey on sleep, shift work, and accidents occurring among 635 nurses in
Massachusetts. Night and rotating nurses reported less hours of sleep compared to
evening / day nurses. Some night nurses even fell asleep while driving their car to or
from their workplace. Their results demonstrate that disturbance of circadian phases
and sleep deprivation during rotating shifts are associated with lapses of attention,
leading to increased error rates on specific tasks. They discuss how this poses a
problem for hospital policymakers. They conclude that staffing needs of hospitals and
nurses‟ family responsibilities might limit altering hospital schedules so that nurses‟
health and patient safety are improved.
5. Results of stress
5.1. Emotional and physical wellbeing
O‟Donnell (1996) surveyed nurses and results indicated that a broad range of
psychosocial issues are responsible for extensive stress throughout nursing. Dorz,
Novara, Sica and Sanavio (2003) state that health caregivers are at risk of developing
work-related disorders. A stressful workplace can become a breeding ground for
health problems (Lambert, Lambert & Yamase, 2003). Soderfeldt, Soderfeldt, Ohlson,
Theorell and Jones (2000) recommend that people should distinguish between
quantitative pressure and emotional pressure when analysing human work. Work with
people contains emotional exertions which differ from other forms of workload.
The costs from psychosocial illnesses are a challenge for nurses and midwives trying
to return to normality in everyday life (Ekstedt & Fagerberg, 2005). According to
Billeter-Koponen and Freden (2005), workplace demands and expectations for nurses
are far more likely to be psychological than physical. Healy and McKay (2000) also
reiterate that even though individuals might not experience physical symptoms, they
might still experience anxiety, fatigue and feelings of unhappiness. It might also

67
depend on how long the nurse or midwife has been experiencing stress before
physical symptoms appear.
Kushnir, Rabin and Azulai‟s (1997) research showed paediatric oncology nurses
suffer extreme stress from the death of patients with whom they have developed close
relationships. Losses such as these in this particular type of nursing are inevitable.
Jezuit (2002) has reported a paucity of research on nurse suffering and nurses have
defined suffering as frustration, stress, anger, helplessness, excessive obligations and
sadness. She noted that suffering can diminish or threaten an individual‟s professional
or personal values and has been linked to powerlessness. Jezuit (2002) found that
nurses who did not discuss their emotions often experience grief well beyond the time
of the incident. Stanley and Goddard (2002) also found that workers experienced
helplessness and disempowerment in their work with child protection.
Stressors which were related to Sherman‟s (2000) study of AIDS nurses resulted from
„bombardment of senses‟ as these nurses cared for clients with draining wounds or
copious diarrhoea. The sights and smells demanded a controlled reaction so clients
would not be offended. Nurses consistently found the greatest emotional stress was
watching young people die. One nurse reported watching young men disintegrate. On
any day, five patients could die. Another nurse reported her greatest stress to be
coping with extreme sadness, depression and loss experienced by families (Sherman,
2003).
Frequently mothers were seen with their daughters and sons. Kissing their heads,
holding their hands, brushing their hair were mothers‟ acts of love. Watching mothers
cry revealed their suffering and the pain they were experiencing. Nurses‟ own
unresolved personal losses made it difficult to provide support for families following
clients‟ deaths. Nurses also experienced emotional stress from being unable to
establish relationships with clients. Nurses were also aware of stress experienced by
family members concerning contagion and nurses were „protective‟ of their own
family by not discussing any work experiences at home (Sherman, 2000).

68
Manifestations of stress take many forms including headaches, increased anxiety,
poor time management and feelings of helplessness (Cohen-Katz, Wiley, Capuano,
Baker & Shapiro, 2005; Steadman, 2003). The high demands of an occupation,
feelings of powerlessness and low levels of control are linked to health problems. A
major factor of occupational stress for nurses and midwives is lack of autonomy
(McGrath, Reid & Boore, 2003). Kant, Bultman, Schroer, Beurskens and Van
Amelsvoort (2003) found that the prevalence for fatigue in the health care sector was
17.6 per cent.
Research continually reveals that stress might also manifest as back pains, impatience,
fatigue, emotional outbursts, over-eating, fits of anger and over-reacting (Singh,
2002). Stress might lead to general illness, sleep disturbance and severe depression
(Ryan & Quayle, 1999). A third of the oncology caregivers in Penson et al‟s (2000)
study claimed to be depressed when asked about their stress levels. Overwhelming
fatigue was described by nurses in Ekstedt and Fagerberg‟s (2005) study. The fatigue
experienced by their participants was totally mentally and physically exhausting.
Their fatigue affected their work performance and limited activities of daily living.
They experienced insomnia as a psychological manifestation of stress at some stage.
They studied nurses who had already experienced burnout, hence the impact of
sleeplessness in their study. They were unable to relax, experiencing significant
anxiety, especially at night. They emphasise the significance of recognising early
signs of burnout such as sleeplessness.
The Australian Council of Trade Unions (1997) surveyed stress levels in Australian
workplaces and reported continual tiredness and headaches to be the most frequent
symptoms. The majority (60%) of employees from the Australian Council of Trade
Unions (1997) survey reported feeling depressed or experienced sleeplessness in
relation to work. Four factors have been associated with increased risks of claims for
stress-related conditions. These are trauma (defined as harassment, physical assault
and abuse), forced relocation, conflict with supervisors and conflict with peers
(Toohey, 1996). Interestingly, all of these four factors are associated with colleagues
in the workplace.
69
O‟Donnell and Stephens (2001) have established that „stressed‟ employees have
increased sick leave, decreased productivity and more work-related accidents. Their
research shows that as well as monetary costs, personal costs include anxiety,
substance abuse, depression and heart disease. Their results show that emotional and
physical well-being are affected and stress has an effect on employees‟ personal and
professional lives. They report that in the long term, depression, anxiety, marital and
interpersonal problems, physical illness, mental ill health and burnout might ensue.
Their results highlight that the organisational effects of stress include low quality
work, reduced work output, high employee turnover and high absenteeism. Westman
and Etzion (2001) note that researchers have implied that absenteeism might provide a
„safety valve‟ in order to cope with stress. Wong, Leung and So (2001) found that
37.5 per cent of their nurse sample were considered „at risk‟ for poor mental health.
Generally speaking, they were anxious about dealing with problems and making
mistakes.
Harris‟s (2001) aim was to identify situations at work where stress could cause ill
health. If employees are unable to exert control over demands placed upon them, this
then might lead to stress and burnout. She shows how, usually, stress effects are short-
lived and if the pressure on each individual recedes, this results in a return to
normality. In some cases, particularly if pressures are sustained and intense, stress
leads to long-term physical and psychological ill health. De Lange, Taris, Kompier,
Houtman and Bongers (2004) highlight that well-being can affect work characteristics
such as job demands and social support. They found that unhealthy workers reported
higher job demands and poorer levels of manager support over time. They note that
unhealthy workers might perceive their workplace environment in a negative fashion.
Terluin, Van Rhenen, Schaufeli and De Haan (2004) believe that distress reflects an
individual‟s ability to cope with psychosocial effects of life stress such as work stress
and that such distress might result in physical disease. They note if circumstances
threaten an individual‟s psychosocial functioning, symptoms of distress might ensue.
Some psychiatric disorders are linked with environmental stress triggers (Gunlicks &
Weissman, 2008).

70
There is existing evidence that stress has resulted in nurses leaving their profession
altogether, and a decrease in the number of men and women choosing to enter this
field (Laschinger et al., 2001a). According to a National Nurse Survey which polled
10,000 nurses in Washington DC., many nurses „wanted out‟. Sixty-six per cent were
ready to leave the profession or their current job and 50 per cent were advising
relatives, friends or children not to enter the profession. The survey indicated a strong
relationship between various health-related symptoms and inadequately staffed units
(Sherer, 1993).
Research evidence from nurse administrators and organisational and industrial
psychologists indicates that job dissatisfaction is a result of job stress and significantly
predicts workers‟ turnover, performance and absenteeism (Griffin & Bateman, 1986).
Nurse leaders and managers would most likely be interested in preserving nurses‟ and
midwives‟ well-being (Begat, Ellefsen & Severinsson, 2005). Nurses‟ and midwives‟
well-being might then influence high-quality patient care (Jamal & Baba, 2000).
Howard (2001) found that ten per cent of people suffer from bullying and workplace
stress, sometimes leading to hospitalisation and unemployment. Ootim (2001) has
shown that the symptoms indicative of stress effects are a sudden change in
behaviour, nurses who are usually tolerant become timid and nervous, suffer low
morale as well as lose consideration and empathy for others. People low in self-
esteem feel more threatened and are more vulnerable to stress. Occasionally nurses
might lose their temper when they have been calm and professional in the past. Other
indicators he has shown include insensitivity to patients, withdrawal and inflexibility
in approach (Ootim, 2001).
Pinikihana and Happell (2004) found that despite significant stress and burnout levels,
the majority of rural psychiatric Victorian nurses were satisfied with their current
work situation, but almost half (47.8%) thought about finding another nursing job.
The majority of nurses in their study indicated that they do not often think about
searching for another nursing job (52.2%) or an occupation outside nursing (55.8%).
McGrath, Reid and Boore‟s (2003) respondents considered exiting the profession at
some point, with over a third of their respondents considering leaving over the past

71
year, with others favouring a change of work location. Ten per cent of nurses in
McKenna et al‟s (2003) study actually did change their area of practice due to a
critical incident involving horizontal violence in the workplace. Over a third (34%) of
their nurse respondents in their first year of practice considered leaving the nursing
profession following a distressing incident. Oloffson, Bengtsson and Brink‟s (2003)
study of nurses‟ experiences of stress in the workplace indicated that they had
considered at some point leaving the profession.
5.2. Prolonged exposure to stress leading to burnout
Burnout is the result of unmanaged stress, not a symptom of stress at work (Altun,
2002). Burnout is one example of an excessive „strain‟ reaction (Payne, 2001). Factors
associated with burnout include: passive coping style, external control orientation,
work pressure, little social support, less hardiness and intensive contact with clients
(Ewers, Bradshaw, McGovern & Ewers, 2002). Governments and healthcare
managers should implement strategies which would increase nurses‟ and midwives‟
job satisfaction, thereby reducing burnout and enhancing retention (Barrett & Yates,
2002).
Burnout is a serious issue – many „thirty-somethings‟ have expressed a desire to make
a career change or reduce their stress (McIntyre, 2004). Understanding factors related
to burnout would benefit health care institutions financially and in terms of human
costs, especially in view of consistent international shortages of nurses and midwives.
It has been suggested there are two main sources related to these factors including
individual characteristics and the work environment (Lee, Song, Suk Cho, Za Lee &
Daly, 2003).
Koivula, Paunonen and Laippala‟s (2000) Finnish study found that nearly half of their
sample of nursing staff experienced burnout with 27 per cent experiencing serious
burnout. Laschinger and Finegan (2005) found on average that nurses reported only
moderate burnout levels, although 44.7 per cent scored high burnout levels.
Pinikahana and Happell‟s (2004) study with Victorian rural psychiatric nurses
identified 10.4 per cent scoring high burnout, with 70.8 per cent experiencing low

72
burnout. Research literature identifies correlations between burnout and distress in
intensive care nurses (Sundin-Huard & Fahy, 1999).
Maslach, Schaufeli and Leiter‟s (2001) research shows that nurses and midwives do
not just respond to their work setting but they bring distinctive qualities to their work.
These distinctive qualities include personal factors such as demographics (formal
education or age), work-related attitudes and enduring personality characteristics.
Previous research on burnout suggests it is a social phenomenon rather than related to
individuals‟ personalities. Rosser (1995) links burnout with post-traumatic stress
disorder. Kalimo, Pahkin, Mutanen and Toppinen-Tanner (2003) found that workers
experiencing burnout had worked in worse working conditions in comparison with
those with healthy well-being.
Increasing demands will accentuate stress sources that contribute to burnout in health
professionals (Sciacchitano, Goldstein & DiPlacido, 2001). Personnel working in
healthcare environments might find it helpful to develop coping methods to protect
themselves against long-term stress effects resulting in burnout (Randolph, Price &
Collins, 1986). Some physical signs of burnout include a feeling of fatigue and
exhaustion, experiencing frequent headaches, gastrointestinal disturbances,
depression, sleeplessness and shortness of breath (Bailey, 1985; Schwarz, 2005).
There are also psychological and behavioural signs of burnout. These signs include
boredom, alienation and exclusion from interaction with people, feeling discouraged,
disenchanted, resentful and confused. Other behavioural signs include anger, irritation
and frustration (Bailey, 1985).
Laschinger, Purdy, Cho and Almost‟s (2006) study with nurse managers found that 58
per cent experienced increased levels of burnout. Maslach, Schaufeli and Leiter
(2001) highlight that those nurses who burn out and leave early during their career
leave behind survivors who exhibit lower burnout levels. Older nurses are more likely
to have experienced many work scenarios thus managing and understanding
ambiguous or problematic work situations with certainty (Kent & Lavery, 2007). The
reasons for this seem poorly understood, hence another reason for the importance of
this research.
73
MacLellan (1990) reported that years of experience seemed to protect district nurses
from burnout. Even though these nurses might have become survivors, they might still
experience burnout due to relentless workloads and understaffing. They might have
survived early stresses in their work and succeeded in their career (Maslach &
Jackson, 1981). On the other hand, Koivula, Paunonen and Laippala‟s (2000) study
found that exhaustion increased with more years spent in the profession. In fact, they
found that those nurses practising for more than ten years, experienced more burnout
than those with less work experience.
Maslach, Schaufeli and Leiter (2001) note that burnout and exhaustion appear to be
associated with particular behaviours (time-pressured lifestyle, competition, extreme
need for control and hostility). They note that „feeling types‟ of individuals are more
likely to experience burnout than „thinking types‟. Studies on personality traits have
attempted to discover types of people more at risk of suffering burnout. People
displaying decreased levels of hardiness (openness to change, control over events and
participation in daily activities) experience higher levels of burnout, especially the
exhaustion dimension (Maslach, Schaufeli & Leiter, 2001).
Burnout is higher among people who have an
external locus of control (attributing events
and achievements to powerful others or to
chance) rather than an internal locus of control
(attributions to one‟s own ability and effort)
(Maslach, Schaufeli & Leiter, 2001, p. 408).
Loss of control in Browning, Rolniak, Greenberg and Larkin‟s (2001) study on
accident and emergency nurses predicted burnout.
Ootim (2001) notes that negative affectivity or neuroticism refers to a broad
dimension of personality which consists of long-term negative emotions including
anxiety, sadness, anger and guilt as well as behavioural and cognitive characteristics
such as insecurity, preoccupation and low self-esteem. He shows that negative
affectivity is a pervasive disposition and people experience emotional states which
include feelings of anxiety and tension. Those experiencing negative affectivity report
physical and stress symptoms and experience dissatisfaction and strain across

74
situations and time even in the absence of stress. These people are constantly
distressed and nervous. They usually dwell on their disappointments, mistakes and
shortcomings and focus on negative aspects in general. People experiencing low
negative affectivity appear more satisfied, calm and self-secure and focus less on daily
irritations and frustrations.
The burnout process causes lack of energy, rendering concentration difficult. The
attitudes of nurses thinking that they are „only a nurse‟ emphasises low morale,
instead of proficiency in knowledge in decision-making and clinical skills. Lack of
communication and increased workload results in loneliness (Severinsson, 2003).
Dembroski and MacDougall (1978) maintained that some individuals were more
likely to work alone, and that this led to increased workload resulting in high stress
levels. This led to reduced colleague support and feelings of frustration. Waldron
(1978) proposed that increased work overload is self-imposed by some personality
types. This then relates to anxiety, poor stress-related coping abilities and high stress
levels. Some nurses who are experiencing burnout are functional but deny burnout is
the cause of headaches, insomnia and gastrointestinal troubles (Schwarz, 2005).
Maslach and Leiter (1997) suggest that individuals see the imbalance of the job-
person fit problem as a personal crisis, when in fact it is the workplace which is in
trouble. They show how burnout is visible in the behaviours and emotions of
individual employees. The common belief is that the problem relates to people rather
than the job. They report that a common view is that people who suffer burnout are
weak. They think that only the fit will survive and burnout is a result of failing to
survive. Another view shows that people who suffer burnout are unreasonable and
complain about everything. Maslach and Leiter (1997) suggest that the common belief
is that people bring burnout upon themselves and have the responsibility for fixing it.
This view might be popular because individuals describe their experiences in personal
terms, looking for personal solutions which might be making career changes or going
to counselling. Maslach and Leiter (1997) agree that people play a part in alleviating
burnout. However they indicate that people are not completely responsible for its
occurrence or solution.

75
One would expect that a consequence of stress is poor quality patient care and a
decrease in performance and morale (Brown & Edelman, 2000). AbuAlRub (2004)
has shown that continuing low morale will eventually lead to burnout and that
performance declines in stressful situations. Internal resources such as self-esteem
have been effective in sustaining staff against emotional distress evoked by their work
(Delvaux, Razavi & Farvacques, 1988). Workers experiencing low morale tend to be
affected by all types of organisational factors, including leadership behaviours, peer-
group interactions, socialisation practices and evaluation feedback (Furnham, 1992).
Janssen, de Jonge and Bakker (1999) have shown that if a person is suffering stress
and burnout, their reaction time to act in a stressful, emergency situation can be
delayed. This might have deleterious consequences for their clients. Rushing to
complete tasks might cause impairment of interaction with clients. Basel, Grassi and
Magnani (2000) report that psychiatric morbidity has been associated with burnout,
particularly emotional exhaustion. They report that depersonalisation has been related
to loss of confidence in one‟s worth. A sense of decreased personal accomplishment
often results in difficulty in concentration, making decisions and facing problems.
Payne (2001) investigated burnout levels in hospice nurses. She wanted to ascertain
which nursing aspects were associated with burnout. In doing this, she investigated
stressors, demographics and coping strategies. She suggested organisational and
individual interventions to reduce burnout levels and she found stressors contributing
the most to burnout with demographic factors contributing the least. The most
frequently reported problematic stressor was „death and dying‟ followed by
inadequate preparation and workload.
Gaithersburg and Roach (1994) show an increased level of commitment contributes to
rising cycles of burnout. When a nurse is overburdened and continues to work hard
without being relieved from the workload, the nurse becomes committed to meeting
work demands and becomes burned out by continuous pressure. They found the
nurse‟s physical and emotional reserves are diminished. In order to conserve
psychological and physical well-being, the nurse stops caring and commitment
declines drastically. NSW Nurses Association (2008h) comments that hundreds of
nurses and midwives leave the profession every year because they experience burnout

76
from relentless pressure and heavy workloads. Hancock (1998) shows that feeling
powerless and undervalued are often factors of burnout. Samuelsson, Gustavsson,
Petterson, Arnetz and Asberg‟s (1997) study revealed that people who had suicidal
feelings over the past year had higher scores on the Maslach (1986) Burnout
Inventory for emotional exhaustion and depersonalisation, hopelessness and tiredness
than those who never thought about suicide.
Cousins (2003) presented vicarious trauma or compassion fatigue which is similar to
burnout. The concept is relatively new and is linked with people experiencing trauma
which encroaches into the nurse‟s and midwife‟s professional and personal life. NSW
Nurses Association (2008i) reports that levels of exhaustion for nurses in the public
health system are extremely high. Cousins (2003) stated ignoring emotional reactions
and stress predisposes for poor outcomes. She highlighted how vicarious trauma
damages idealism, hope and optimism. She identified some of the signs of vicarious
trauma which are similar to burnout such as depersonalisation, feeling like a failure
and increased fatigue and sickness. Burnout might lead to extended sick leave
(Huibers, Beurskens, Prins, Kant, Bazelmans, Van Schayck, Knottnerus &
Bleijenberg, 2003).
5.3. Family and work balance
Hart (1999) shows that there has been an increasing interest in the interface between
family and work. He highlights how this has resulted in work stress scales. He has
shown how current interest is focused on the overlap between work and family. The
conflict between family and work might occur because of competing demands on a
person‟s time. Mackin and Sinclair‟s (1998) study found midwives‟ work stress was
more prominent than stressors of personal life. The main personal life stress was
financial difficulty. Harris (2001) describes how stress can affect nurses in many
ways, as humans develop symptoms when reacting to excessive pressure at work and
at home. Harris (2001) found that the pressures nurses experience outside work,
including such factors as financial worries, family sickness or bereavement, affects
stress levels at work. Work stress for these nurses and midwives was a pertinent factor
in their personal life.

77
Mauno, Kinnunen and Pyykko‟s (2005) preliminary analysis on their work in Finland
found relatively high correlations between work-family variables across organisations.
Their study included three important dimensions: career development, working hours
and management. They recommend training of management staff and dissemination
of information on appropriate work-related behaviour and fostering a family-friendly
workplace atmosphere. They also recommend changing the long-working-hours
culture. Midwives in Curtis, Ball and Kirkham‟s (2006b) study gave family
commitments and lack of control over working hours as the main reasons for exiting
the profession. Forty per cent of these midwives found shift patterns and difficult
working hours key factors in their final decision to leave. This study identified the
importance of family friendly working hours for midwives.
Nolan (1995) discovered that poor pay compels nurses to increase their income by
working overtime which leads to exhaustion and subsequent effects on family life at
home. Nolan (1995) found that home / work conflicts were associated with insomnia
and anxiety, as well as poor social support. Home / work conflicts were consistent
predictors of decreased mental health outcomes, outweighing significant client-related
difficulties. For these respondents, staff shortages were considered particularly
stressful and taking work home and working long hours impeded quality family life.
Unpaid overtime is a major issue for the nursing and midwifery professions. Taylor,
White and Muncer (1999) found that one of the main stressful issues was working
overtime and long shifts with inadequate breaks. This caused disruption in their
personal lives due to staying at work beyond paid hours. In their study, one nurse
reported only being paid for 13 instead of 14 hours for work completed. The nurse‟s
entitled break was one hour and 20 minutes during the shift and he / she only
managed 20 minutes for the entire shift. Another nurse reported staying at work after
shifts finished and knowing their child was waiting after school.

78
6. Individual responses
This section examines issues associated with various individual responses relating to
work behaviours. Individual reactions to stress, individual factors relating to
situational factors and the personality hardiness concept will also be discussed.
6.1. Individual reactions to stress
Goodfellow et al. (1997) state that each individual will manage stress in a different
way. They report that many work stressors will constitute satisfying challenges rather
than distress. Jonsson and Segesten (2004) highlight how influencing individual
predictors are important for determining how humans respond to stress. Individual
diversity in vulnerability can determine how well people respond to stress (Jonsson &
Segesten, 2004).
The literature tells us that engagement is a popular synonym for motivation. An
engaged nurse or midwife acts quickly, immediately reacting to client demands
(Engelbrecht, 2006). It is inaccurate to presume that because the environment appears
stressful that individuals will experience more stress. Nurses might perceive the
environment as challenging and exciting (Rhead, 1995). Nurses might be naturally
inclined to seek personal development and intellectual challenges and stimulation
might not be stressful for them (Stordeur, D‟Hoore & Vandenberghe, 2001).
It seems self-evident that there are major individual differences when it comes to job
satisfaction. Different individuals in exactly the same job will experience different
sources of satisfaction and two people doing different jobs will experience similar
levels of satisfaction (Furnham, 1992). Schultz and Schultz (1997) report that it is not
so much the incident but the way an individual interprets the incident that might cause
stress. They report how people can absorb significant amounts then continue their
work without debriefing. They recommend looking back on a situation and giving
credit to how they helped themselves in that stressful situation.
It is likely that different people will read the same
situation differently and therefore respond
differently (Lawrence, 1990, p. 41).

79
Motivation in the work setting is described by direction, intensity and persistence
(Kanfer, 2002).
Similar research has focused on behavioural and personality differences between low
and high-stressed individuals. In the early 1960‟s, the major research design
concerning individual stress differences started with Friedman and Rosenman‟s
(1974) work. They classified individuals as having type A as opposed to type B
personalities. Type A individuals‟ style of living was overtly characterised by striving
for achievement, extremes of competitiveness challenged by responsibility, haste,
impatience, hyper-alertness, aggressiveness, restlessness and explosiveness of speech.
Type B personality they described as being free of such habits, harbouring little
hostility and strong feelings and rarely experiencing time urgency or impatience.
In 1982, Cooper noted that there was a paucity of research concerning stress outcomes
and personality traits in female managers. Ootim‟s (2000) study showed how stress
effects are moderated by circumstantial and individual factors. Ootim (2001) raised
the question why one individual might become stressed in a specific situation while
another might embrace it and thrive on the opportunity for development and growth.
He believed the answer could be in the individual‟s cognitive appraisal concerning
stress. This could be projected as a positive or negative outlook about the task at hand.
It is the cognitive assessment of a stressful situation that makes the event positive or
negative (Ootim, 2000).
Feshbach and Weiner (1991) highlight how some individuals are highly emotional
and overreact to some situations, while other individuals react calmly to adverse
situations. Stebnicki (2000) highlights how one‟s own attitude is influential in coping
with trauma. O‟Donnell and Stephens (2001) show that individual differences such as
age, gender, geographical location, education and tenure have an effect on strains and
stressors. They suggest that measurement of stressors could focus on the individual
perceptions of the workplace.

80
Breakwell (1990) notes that people have different resources such as self-confidence,
knowledge and intelligence and demands that could overwhelm one person might not
affect another. Hanson (1989) noted that stress does not seem to be linked to financial
losses or illness. Stress remains neutral until it comes into contact with a person. How
that particular person reacts to the stress determines the outcome. Merson (2001)
noted that some people release high amounts of cortisol and adrenaline when
experiencing stress and others do not, noting that these differences could be linked to
varied reactions to stress.
Humpel and Caputi (2001) suggest how people can react emotionally to difficult and
stressful episodes at work. They report that some reactions will be positive. At other
times emotions might be considered as anxiety, depression and anger. They suggest
that a person‟s ability to manage their emotions might influence stress reactions in a
positive way. Some researchers (Hillhouse & Adler, 1997; Jansen, Kerkstra, Abu-
Saad & Zee, 1996; Lee, So, Alan & Kim, 1998; Omdahl & O'Donnell, 1999)
stipulate that nurses display a highly individualised reaction to work stress, and that
burnout is a consequence of individual rather than environmental characteristics.
Personalities might then have an effect on how that individual deals with stress.
Baldwin (1999) highlighted how investigations have focused on occupational issues
for nurses rather than the personality of the individual entering the profession. Little is
known about the interaction between these factors and the type of person working in
healthcare. Baldwin (1999) examined what happens when a person who is vulnerable
to stress commences working in a particularly demanding nursing job. Clinton et al.
(1995) show that stress is not a fixed response but a process depending on the
situation and the individual‟s characteristics. They note that, recently, knowledge of
the different ways individuals react to life issues has resulted in investigation of social
and personal resources that could moderate stressors. Payne (2001) states that
response to stress is influenced by individual differences among employees, such as
coping and demographic factors, as not all nurses experience burnout.
Hurrell Jr, Murphy, Sauter and Cooper (1988) have shown that within nursing and
midwifery, disciplines are struggling to increase productivity. They have shown the

81
importance of closely examining stress vulnerability, vocational placement and
personal characteristics. Even though theoretical models already exist for each of
these factors, little is known concerning stress responses. They show that if
individuals are identified as having dysfunctional stress responses, it might be
possible to provide extra support and counselling by assisting with the most
appropriate work environments and providing mentors. Hall‟s (2001) study
recommended future research on individual attributes in nurses.
In Nolan‟s (1995) study, stress and burnout in professionals appear to be related to
personal factors as well as contextual factors, as some nurses working in highly
stressful areas like psychiatric, emergency and neonatal units do not experience stress
symptoms whereas others do. Rhead‟s (1995) study showed some nurses working in
volatile workplaces might perceive the environment as exciting and challenging but
not stressful. Lee et al. (2003) showed that individual characteristics could be used to
steer vulnerable nurses towards areas of nursing most suitable for them. Their study
showed that individual characteristics could be important contributors towards
burnout, but less significant when evaluated alongside personal resources or job
stress.
Bohle and Quinlan (2000) report that evidence suggests that certain stress responses
are influenced by dispositional differences among individuals such as how they value
feedback, achievement, interpersonal recognition, self-control and responsibility,
challenge, acceptance and stimulation. They found evidence that relevant experience
and abilities, along with familiarity of stressful situations and training in coping skills,
diminishes negative responses to stress. Laschinger, Heather, Finegan, Shamian and
Wilk (2001b) have shown that if nurses and midwives feel undervalued and
overburdened with unrealistically high levels of workloads, disempowerment might
occur within each individual if this stress is not relieved. Their findings have shown
that empowerment has effects on job satisfaction and job strain. Their results suggest
that when nurses participate in controlling their practice, job strain is diminished. Keil
(2004) believes that ultimately, all coping strategies, from those concentrating on
manipulating external factors, to those attempting to modify a human‟s emotional
response to a particular situation, are generated by the individual internally. Keil

82
(2004) implies that stress is an individual experience rather than one that is linked to
other social or political factors.
Why are potentially stressful situations perceived as
stressful by some individuals and non-stressful by
others? (Cooper, 1982, p. 157).
Individual reactions to stress might account for how people deal with stress and
burnout.
6.2. Individual responses according to situational factors
Bernardin and Bownas (1985) report that individual differences contribute to
behaviour variance more than situational differences. Individuals might not always
behave consistently with the expectations of a situation (Moskowitz & Cote, 1995).
According to Mansfield et al. (1989) an approach to reducing stress amongst nurses
would be to provide a descriptive guide to various clinical settings, prior to
commencing their employment. Nurses could then make better choices according to
their personal preferences, strengths or personality, enhancing job satisfaction and
decreasing burnout and job stress (Mansfield et al., 1989). The nursing profession
works diligently to ensure graduate nurses are competent with nursing skills. Perhaps
graduate nurses lack the awareness of their own personality in relation to job
performance, success and coping with stress (Bellack, 1999). As well as ensuring
graduate nurses are competent with nursing skills, perhaps they could be taught about
coping strategies dealing with stress.
Paine (1982) purports that a person who relies exclusively on organisational skills will
usually handle certain pressures (time pressures, multiple responsibilities, numerous
demands, tight deadlines) very effectively. This same person could have difficulty
reacting appropriately to personal or job situations that induce a grief reaction. Their
pain and sense of loss do not respond well to being organised. In this particular
situation, the individual should focus on obtaining personal support or practising
„surrender‟, which means debriefing about their stress (Paine, 1982). Gilpin (2004)
advises acknowledging instinctive reactions to irritating situations.
83
Stress is not a stable response but a process that
depends on both the characteristics of the
individual and of the situation
(Clinton et al., 1995 p. 6).
Brunero, Cowan and Fairbrother (2008) comment that perceived stress issues arise
from work environmental circumstances where there is no individual control. Kluger,
Laidlaw, Kruger and Harrison (1999) demonstrate that environmental and personality
variables play a significant part in influencing stress precursors or antecedents. They
show how easy it is to recognise environmental aspects (for example, sleep
deprivation, long working hours) and ignore personality aspects. They report how the
personality influences coping mechanisms used when responding to stress. They
stress the importance of the personality when determining the development or
outcome of stress. Alicke (1985) suggests that accurate self-evaluation might predict
an individual‟s influence over people and events. Self-report assessments might be
useful to some organisations because they could help identify workers and leaders
who were able to continue to perform efficiently and effectively under stress (Roberts
& Hogan, 2001).
Cooper and Hazelrigg (1988) recommend that future research examines interactions
between individuals and situations as well as statistical interactions between these
variables, hence the importance for this research. Hattrup and Jackson (1996)
recommend that to understand individuals in organisations, a researcher must
understand the process by which persons are shaped by or shape situations. By
including a time dimension, both situation and person are intertwined in a particular
process. They report that personal attributes determine behaviours, for example
choosing to enter certain types of work situations. The length of time spent in each
situation and how often a particular behaviour is repeated might result in the person‟s
attributes changing. Schneider (1996) proposes that previous studies on individual
differences have failed to reveal a direct link between individual differences and
organisational performance.
Motowildo (1996) reports that job satisfaction is usually measured by self-report
questionnaires asking respondents whether they will stay in their job and whether they

84
think about leaving, similar to the approach used in this research study. He reports
that job satisfaction is judged according to negative or positive responses evoked and
the likeability of the working environment. He reports that job satisfaction is also
based upon evaluation of such things as co-workers, pay, the work itself, supervision
and benefits. It reflects reactions to conditions and events in the work, social and
administrative environment and other broader, organisational aspects of the
environment which might produce negative or positive affective reactions.
6.3. Personality hardiness concept
Kobasa (1979) proposed the personality hardiness concept which related to stress
resistance and personality characteristics. She proposed that hardy individuals are
most likely to remain healthy while enduring high stress levels and non-hardy
individuals are most likely to become ill when confronted with enduring stress levels.
She showed that healthy people exposed to high stress levels have a multifaceted
personality style. Even though the „type A and Type B‟ concept provides clues to
stress-prone personalities, many believe it is inadequate when explaining people‟s ill
health and increased stress levels (Furnham, 1992). According to Prag (2003) some
people might be drawn to the nursing profession as they have specific personality
types either making them resilient to stress or allowing them to endure stress more
readily.
There are three components to hardiness. The first one is commitment to whatever
one encounters (Kobasa, 1979). Commitment is a way of being actively involved in
one‟s life events rather than passively involved (Lambert, Lambert & Yamase, 2003).
The second aspect is control. Control is believing one influences life events rather
than being helpless (Lambert, Lambert & Yamase, 2003). The third aspect is
challenge, being able to confront new activities representing opportunities for growth
and undertaking change. This process of never-ending struggle for growth, according
to Kobasa (1979), usually leads to continuous learning. Another approach says that
change is normal, as opposed to stability, and is a stimulus to improve maturity rather
than being a threat to security (Lambert, Lambert & Yamase, 2003).

85
Low levels of the many dimensions of hardiness lead to burnout (Lambert, Lambert &
Yamase, 2003). Hardiness can lead to developing coping mechanisms (Kobasa,
1979). Bohle and Quinlan (2000) suggest that professionals and managers who have
challenging, interesting and autonomous jobs might be expected to exhibit greater
senses of commitment, challenge and control than workers whose jobs are externally
controlled, monotonous and unstimulating. Bausler (1992) found significant
relationships between burnout and personality hardiness in nursing faculty. She found
that nursing faculty who believed their life had purpose and were in control of life
events tended to experience less depersonalisation and emotional exhaustion and
higher personal accomplishment. Those who believed their lives were in control but
believed their lives served little purpose, experienced more emotional exhaustion and
less depersonalisation.
Severinsson (2003) suggested that there is a complicated interaction for nurses and
midwives, in which social standing, work situation and personality influences the way
various stressors affect their health. Toohey (1996) suggested that integrating work
and family life might be a function of their particular personality and how they deal
with stressors of every day living. If they are unable to develop a balance between the
two, this might lead to ill health. He believes that for those who are „workaholics‟ and
work past their finishing time regularly, this might have a negative effect on their
family life and cause burnout. He reports that individuals‟ personalities determine
their reaction to whatever demands are placed upon them, which determines the
failure or success of their coping methods.
7. Coping strategies
7.1 Positive coping strategies
Coping with stress is important in people‟s working lives in terms of possible illness
and work performance (Cooper, 1982). Dorz et al‟s (2003) study shows that
individual coping strategies might be important buffers of stress. Wong, Leung and So
(2001) reported that little research had been undertaken examining nurses‟ strategies
for coping with stressors in the workplace. They suggest such an understanding would
contribute to further development of these coping strategies and nurses‟ capabilities.

86
Wong, Leung and So‟s (2001) research examined coping strategies of Hong Kong
hospital nurses. Results showed that their coping strategies were culture-specific and
situation-specific, with positive thinking, direct action coping and acceptance being
used more than avoidance and alcohol. One-third of their nurses were considered at
risk of poor mental health. The most frequent complaints included feelings of
inadequacy and anxieties in dealing with daily activities. Wong, Leung and So (2001)
suggest future research could explore the direct effects of coping strategies such as
positive thinking. They believe that nurses with this attribute will have good mental
health despite their particular area of work.
Lazarus and Folkman‟s (1984) Theory of Stress and Coping tries to explain humans
coping with stress. It identifies internal and environmental demands which can exceed
or tax a person‟s resources, endangering their well-being. This model might be useful
for clarification of relationships between stress, burnout and individual responses. The
model proposes that people‟s perception of physical and mental health pertains to
ways they cope with and evaluate stressors of living (Polit & Hungler, 1997). This
might correlate to how nurses and midwives deal with stress or exert control and
develop coping mechanisms to deal with the working environment. Greenglass and
Burke (2001) state that nurses require personal coping strategies so they can deal with
chaos in their work environments. They state that each individual will deal with stress
and burnout differently, hence the importance of this research. This research will
highlight nurses‟ perceptions and dealings with the phenomena of stress, burnout and
how it affects individual responses.
Lazarus and Folkman (1984) conceptualised coping as serving two functions. The
first is altering or managing the distressing problem within the environment. This is
known as problem-focused coping. The second is regulating a response to the
particular problem. This is known as emotion-focused coping. Lazarus and Folkman
(1984) also theorised about developing emotion-focused responses to problems which
led to the experience of psychosocial effects of stress.
Hall (2001) found that pursuing outside interests and reducing enthusiasm for work
were problem-focused coping strategies. Maintaining high standards of client care at

87
all costs or adopting a cynical view about work were emotion-focused coping
strategies. Payne‟s (2001) study with hospice nurses showed that problem-solving was
reported to be most frequently used as a coping strategy to prevent burnout. However
low burnout levels reported by hospice nurses who used emotion-focused strategies
might be explained because they use more coping strategies than any other nurses.
Dumas (2001) found that most coping strategies seem to be developed by individuals
who have experienced their own major life events. This might include a catastrophic
illness. He also notes that locus of control has an effect on coping. The person who
has an external locus of control is more likely to perceive a stressful event as
extraordinary in nature.
Dumas (2001) notes that coping with daily stressors means developing stress
management ability and behavioural adaptation. This includes exercise with exposure
to sunshine and fresh air which allows expenditure of nervous energy and trains the
body to readily achieve homeostasis for future stressors. Dumas (2001) also noted that
repetition of stressful events in controlled circumstances would gradually remove the
fear of the unknown. Lazarus‟s (1966) Transactional Theory highlights that all
approaches do not work for everyone or every situation. Satel (2003) highlighted that
following stressful events and trauma people try to reconnect to rebuild their cultural
and physical environments. Humans are resilient and prefer to cope and adapt well,
according to Satel (2003).
Maeve (1998) has shown how nurses have yet to articulate their construction of how
they manage to live their everyday lives when daily experiences include deaths and
the suffering of others. She found that caring for the dying imbued these nurses with a
type of courage and thoughtfulness towards dilemmas in their own lives. She
researched nurses who were working with the dying and constructed four central
themes. The four themes were: creating a fabric of honourable meaning; doing the
correct thing; tempering involvement; and cleaning up. Creating a fabric of
honourable meaning meant that the nurses‟ own lives were understood by them, both
professionally and personally. They described meandering between their relationships
with clients to avoid obstacles within their own lives. Doing the correct thing involved

88
two methods – coming to know the correct thing and doing the correct thing. Coming
to know the correct thing involved a combination of experience and education. Doing
the correct thing involved a combination of courage, commitment and competence.
Further, Maeve (1998) reported that the nurses described developing a type of
honourable consciousness towards their clients as individuals. Tempering
involvement included setting boundaries and limits in their involvement with their
clients. Using humour was another aspect of tempering involvement to manage the
realistic aspects of nursing. Cleaning up designated the finality of involvement.
Cleaning up represented cleaning up grief and preparing to carry on. This time
allowed the nurses to self-review, professionally and personally.
Some nurses use humour as humour has been seen as a way of coping with social
demands during a crisis event (Britton, 1990; Eaton, 1994). Bender (2001) reports that
laughing produces endorphins, which automatically lowers stress levels. She has
shown how gallows humour is used throughout healthcare, although there is little
research done in this area. She has shown how gallows humour reputedly provides a
release for anxiety, stress and tension, lightens crisis situations, slows the burnout
process and gives staff a „second wind‟.
The AIDS-dedicated nurses in Sherman‟s (2000) study alleviated stress by protecting
themselves, taking the risks in their stride and reframing the risk. They protected
themselves by using universal precautions and totally focusing on what they were
doing. Taking the risks in their stride meant viewing the risks as part of life.
Reframing the risk meant that nurses attributed responsibility for any injuries in the
workplace to a lack of protection by the hospital as opposed to any failure on their
own part.
Sherman (2000) reported that nurses overcame emotional stressors by finding
meaning and enhancing their growth and well-being. They did this by establishing a
balance between their professional and personal lives. They pampered themselves
through long walks, good novels, hot baths, visits with friends, hugs from family and
soothing music. They released their pain by crying, debriefing and meditating. They

89
attended support groups and workshops to acknowledge their feelings. These nurses
managed their demands and asked for help. They found relationships they developed
with their clients supported their professional and spiritual growth and lessened their
stress (Sherman, 2000). Clinton et al‟s (1995) group of mental health nurses were
reluctant to discuss their stress status which might imply that they were already using
effective coping strategies. Clinton et al. (1995) found that nurses relied on colleague
support as a coping behaviour when dealing with stress. Another plausible conclusion
could be that these nurses have an aversion to reporting stress, preferring to minimise
any difficulties they experience (Clinton et al., 1995).
Different cultures adopt different coping strategies to deal with difficulties in life.
Studies show that besides problem-solving, Chinese people adopt „acceptance
strategies‟ in response to situations that are unalterable. If they are unable to change
the situation, they accept it as part of the situation. The Chinese also use less alcohol
than other populations to manage life stressors (Wong, Leung & So, 2001). Bohle and
Quinlan (2000) suggest that professional workers and managers who have a high level
of control over their work, and whose job problems are easily solvable, develop better
coping skills by solving the problems and removing the sources of stress.
American nurses identified coping strategies in Sherman‟s (2000) study as balancing
professional and personal life, managing demands, asking for help, respecting and
controlling feelings and releasing pain while maintaining their spiritual perspective.
O‟Connor and Jeavons‟ (2003) study revealed themes such as sharing with others
experiencing the same event, communication, stress education, self-understanding and
group cohesion. Working together and sharing similar experiences reduce levels of
stress and burnout.
Consistent with previous findings, adaptive coping strategies have been identified as
problem-solving, seeking social support and debriefing about stress (Clinton et al.,
1995). Formal debriefing following a critical incident is also viewed as useful (Levin,
Hewitt & Misner, 1998). Kushnir, Rabin and Azulai‟s (1997) study showed that
experienced nurses are more likely to apply positive coping reactions. They report that
rational-functional thinking is a positive coping resource which promotes well-being,

90
by using adaptive responses. Fagin et al‟s (1995) research showed that community
psychiatric nurses used peer support to alleviate work-related stress.
Muscroft and Hicks (1998) showed that talking to colleagues, talking to families and
friends and talking to counselling services were helpful. Midwives in Mackin and
Sinclair‟s (1998) study demonstrated their stress awareness in their personal and
working lives. A significant stress moderator for midwives in their study was support
from work colleagues. Midwives described a variety of activities to relieve stress
which included quiet reading, physical exercise, socialising and holidays. Jonsson and
Segesten‟s (2004) study found that a coping strategy to diminish stress was obtaining
support from others.
Milne and Watkins‟ (1986) study indicated that nurses were mildly stressed when
working shift rotations. Of greater practical and theoretical significance was the fact
that they increased certain coping strategies when dealing with a change in the type of
stress. These nurses significantly reduced the stress and strain they experienced. Milne
and Watkins (1986) highlight the theoretical importance of the interaction between
strain, coping and stress over time. They recommend psychological coping skills
training workshops for registered nurses experiencing excessive strain, and the
emphasis on coping could also be applied to the training and recruitment of nurses.
For example, applicants for training could be „screened‟ for coping skills, as well as
vocational and academic aptitudes and those currently training could be offered
additional coping strategies.
Brunero, Cowan, Grochulski and Garvey (2006) have written about stress
management for nurses and include coping strategies in their booklet. They advise
how easy it is to develop negative thinking patterns because of the constant daily
pressures faced by nurses. They advise nurses to recognise these thinking patterns and
try to change them. They provide examples or scenarios in their booklet
commissioned by the NSW Nurses Association and NSW Health Department in 2006
that explores stress in the workplace.
91
It is important to examine coping resources that might assist in the prevention of
burnout (Spooner-Lane & Patton, 2008). Dorz et al. (2003) found that developing
adequate coping strategies could be a protective factor against burnout. One study
examining coping strategies showed that hospital staff nurses who scored low burnout
scores, (meaning they were the least stressed),
use planful problem solving, self-controlling
coping, positive reappraisal and seek social
support (Gaithersburg & Roach, 1994, p.44).
7.2. Negative coping strategies
Although nurses seem resilient and have learnt to cope with intense pressures within
their profession, repeated exposure to pressures can compromise coping strategies,
both at work and at home (Badger, Kaiman & Moellering, 2001). Keil (2004) showed
how „coping‟ suggests a low level of success. The word is less positive than
„manage‟. She shows that „coping‟ suggests dealing with stressful or adverse or
difficult circumstances, whereas „manage‟ denotes a new challenging situation.
Coping contains elements of alteration or modification, the object being to reduce
stress; by removing, modifying or accommodating the stressors.
Bohle and Quinlan (2000) suggest that workers who have little control over work
issues have a sense of powerlessness and are more likely to develop negative coping
strategies which leave the stress source untouched, such as psychological withdrawal
and day dreaming, and resorting to drugs to ease work pressures. They suggest that
situations which are intense and unalterable are more likely to result in psychological
withdrawal. Recent research by the NSW Nurses Association (2008j) reported nurses
and midwives becoming accustomed to the work environment, as it relates to the
situation in public hospitals. The NSW Nurses Association (2008j) has highlighted
that some nurses and midwives have described working environments as „war zones‟
and that some shifts feel like they are „out of control‟ and rated their workloads as
high to excessive (NSW Nurses Association, 2008j). They describe arriving home
exhausted and with nothing left for their families. Lambert and Lambert (2001) have
shown that a degree of control is instrumental in enabling nurses to cope with facets

92
of stress and burnout. Clinton et al. (1995) found that maladaptive strategies for
mental health nurses included coping by withdrawal, smoking, worrying, eating,
crying and behaving towards clients in a detached and callous manner.
In Muscroft and Hicks‟ (1998) study, some of the techniques of coping with stress
such as smoking, alcohol and talking to management, were not effective. Studies
showed that nurses who ignored social support were more likely to experience
emotional exhaustion. General nurses were more likely to receive workplace
professional counselling than their counterpart psychiatric nurses. Fagin et al. (1995)
noted that some nurses distance themselves from the stress source. Breaux (1998)
found that avoidance coping was related to burnout.
Fineman‟s (1985) study on social workers showed the most common coping style was
internalising difficulties and compartmentalising or „bottling-up‟ anxiety, hoping it
would disappear. Gaithersburg and Roach (1994) noted that nurses with high burnout
scores use „avoidance and self-controlling methods‟. They have shown that coping
strategies become counterproductive when nurses show cynicism, psychological
withdrawal and rigidity, and that coping in this way can be destructive. Wigens (1997)
concluded that some nurses use routinisation and emotional detachment as coping
strategies. According to Kushnir, Rabin and Azuali‟s (1997) research, young
oncology nurses have few coping skills. A common reaction of inexperienced and
young oncology nurses is to resign from their position. Working continuously with
patients‟ high emotional demands can become emotionally and physically demanding.
Clegg‟s (2001) research in the United Kingdom has noted that within the current
climate, although there is a shortage of nurses, many nurses are employed on only
short-term contracts and nurses perceive this as a deterioration in working conditions.
Nurses accept increased levels of responsibility with reduced control over workload or
work environment. The Garling Inquiry which is presently focusing on the NSW
public health system is hearing overwhelming evidence that nurses and midwives
endure and cope with extreme workloads (NSW Nurses Association, 2008k). Clegg
has also identified behaviour and workers‟ risk factors such as drinking and smoking.
Clegg (2001) highlighted absenteeism and staff sickness as major problems showing a

93
number of nurses reported stress-related illnesses. They found that the impact of these
issues not only affects quality of care and all nursing staff‟s health, but nursing
colleagues facing staffing shortages. Nurses and midwives want better retention
initiatives for safer workplaces for patients and staff (NSW Nurses Association,
2008l).
Behling and Guy (1993) have shown that continual smoking places a health risk on
nurses as stimulants such as tobacco and coffee can be perceived to relieve chronic
fatigue and stress, particularly in night workers. Their study showed that shift workers
are negatively affected by loss of sleep and disturbances of elimination and eating.
Nurses coping with the effects of stress suffer from ill health leading to increased
rates of absenteeism, high turnover rate and poor performance (Buchan, 1994;
Seccombe & Ball, 1992). Drug use, alcohol consumption and smoking were negative
lifestyle practices adopted due to stress by the nurses in Hope, Kelleher and
O‟Connor‟s (1998) study. Not only did stress affect these nurses in their work life,
their own personal lives suffered. These nurses adopted unhealthy habits as a relief
from their work stress, resulting in long-term, negative effects on their health.
Often, callousness and detachment occur as a result of coping with stress (Clinton et
al., 1995). Jones, Janmah, Payne and Rick (1987) have suggested that following
repeated exposures to numerous stressors, the nurse or midwife might become numb
and unable to react to further stress. As a result, an uncaring attitude is displayed. The
nurse or midwife might become apathetic about the value of work leading to the
concept of depersonalisation associated with burnout.
Community psychiatric nurses in Fagin et al‟s (1995) study reported being
emotionally drained from their work, reporting they were unable to feel for clients.
They felt a sense of hopelessness and futility. Their sick leave had increased, they felt
unfulfilled in work and had lower self-esteem. Those community psychiatric nurses
who were not coping showed signs of ill health, poor work performance and
deterioration in personal or professional relationships. Jones et al. (1987) found that
nurses have a high incidence of outpatient psychiatric referrals and increased rates of
suicide.

94
8. Stress in other professions
Snelgrove (1998) investigated levels and sources of stress in relation to specialty
areas. She revealed that stress levels were an outcome of occupation as opposed to
other variables such as gender, age or work setting. Seglin (2003) reported that other
professionals, such as accountants, endure pressures and strain to make money.
Hensher (1947) reported that interstate truck drivers experience fatigue related to their
environment and industrial structure. These include long driving hours, long work
hours, off-road work commitments, alternating night and day shifts, drug use, night
driving and lack of regular sleep patterns. Nurses and midwives might also relate to
these irregular sleep and working patterns.
Cotts (2003) raised questions about stability and stress levels of reporters‟ jobs. The
Australian Council of Trade Unions (1997) in Melbourne found that 70 per cent of
workers reported increased workloads and 68 per cent reported organisational
restructuring and change to be the most common problems. Other problems included
job insecurity and poor career opportunities. Stress in nursing and midwifery and
other professions is therefore a global problem.
In Weekes, Peterson and Stanton‟s (2001) study of medical scientists, the most
striking changes in workplaces over the previous 12 months had been increased
amounts of work, faster pace of work, and corresponding increases in stress levels.
Employees felt they could not provide a quality service due to work overload.
Fulltime workers found it difficult to organise or plan their personal commitments, as
well as establishing a balance between their family and their working life. Job
satisfaction had diminished. Sixty-nine point six per cent of workers worked at an
increased pace, which contributed to rising stress levels (69.2%). They reported
medical scientists‟ job satisfaction had decreased (55.7%) due to excessive workloads
necessitating the increased pace at which they work. Chopra, Sotile and Sotile‟s
(2004) literature review on physician burnout found that the evidence suggests that
practising physicians are experiencing burnout with 46 to 80 per cent experiencing
moderate to high levels of emotional exhaustion.
95
In Weekes, Peterson and Stanton‟s (2001) study, fulltime workers suffered
depression, high blood pressure and continual tiredness, showing physiological
symptoms of stress. Their recent study looking at medical scientists‟ working
conditions showed stress caused by poor working conditions and understaffing had
resulted in many leaving the workforce. Job security and employees‟ control over
their jobs had decreased. Medical scientists had problems with work intensification
occurring throughout the decade. Their study showed that healthcare is continually
burdened by a constant need for increases in productivity, an increased pace
influenced by expectations of better customer service, and increased workloads with
less staff. They found that it was believed that extra staffing and flexible hours and
extra hands to manage a workload that had increased over the past 12 months would
solve the problems. The staff were dissatisfied with management, due to increased
management control. Fineman‟s (1985) study with social worker stress showed losing
control over some aspects of their jobs was an issue.
There is evidence that physicians in stressful specialty areas are at risk of developing
stress-related illnesses. As for the suicide rate among physicians, most studies do not
agree on this variable. Physicians having emotional problems might be attracted to
specific specialty areas. Similarly, physicians who are physically ill might be drawn to
less stressful medical specialties (Bloom, 1988). Pharmacists are also more prone to
burnout and are at high risk for drug and alcohol dependence and suicide (Chi, 1982).
Bohle and Quinlan (2000) visited workplaces. At one, a food processing factory, the
movement and layout of materials was badly organised, requiring a large number of
trucks to operate within a confined area. This posed a risk of injury of collisions
between trucks. It also increased drivers‟ stress.
Berg, Hem, Lau, Haseth and Ekeberg (2005) developed a new instrument to assess
stress in the Norwegian police force. They believed that stress perception also
depends on support, coping strategies, personality and locus of control. They
demonstrate the usefulness of an exclusive stress instrument for police. Their study
found that police experience high stress levels from lack of support. They reported
police with neurotic personality traits evaluate work stress as more serious than did

96
their extrovert counterparts. Those police with internal locus of control were more
motivated and did not evaluate situations as being as stressful as their external locus
of control counterparts did.
Kushnir, Cohen and Kitai (2000) conducted research on continuing medical education
among medical doctors, including family physicians and paediatricians. They
hypothesised that continuing medical education would reduce stress and burnout and
increase job satisfaction. Lack of opportunities to participate in continuing medical
education, combined with the pressure and expectation of continued professional
development, were associated with job stress. Another issue highlighted in stress
literature is professional isolation. In Kushnir, Cohen and Kitai‟s (2000) study of
physicians‟ job stress, lack of stimulation and professional isolation were significant
sources of stress. They found that imbalances between an individual‟s needs and the
job environment are also a source of stress, and that dissatisfaction and job stress are
inversely related to perceived opportunities for continuing professional development.
Mandy and Rouse‟s (1997) study investigated work stress and burnout in junior
physiotherapists and the results indicated that they exhibited moderate to high burnout
levels. These burnout levels might be indicative of the early years in a profession,
which is a time of learning and developing professional skills such as general
organisational and time management skills. Their results showed that role and
organisational issues and quantity and quality of work were related to the burnout
component, emotional exhaustion. Their study also highlighted high depersonalisation
scores.
Rada and Johnson-Leong‟s (2004) study showed that dentistry is a stressful
profession. Their study found that 34 per cent of dentists felt emotionally or
physically exhausted while 26 per cent experienced backaches or headaches. Other
physical symptoms included abdominal or intestinal problems. Other stressors
included the workload and coping with uncooperative or difficult patients. Blatchford
(2003) reports on stress experienced by dentists, highlighting that a busy, stressed
environment was perceived as not fulfilling patient needs. Mandy and Mandy (2000)
found burnout levels higher among podiatrists when compared to dentists.

97
Ames, Kilpatrick, Zoller, Sistino, Blackwell and Acsell‟s (2004) study researched
burnout levels among perfusionists (health professionals who insert intravenous
cannulas or collect blood). Their results demonstrated that low and high burnout
levels of perfusionists were almost equal. Their results verify job satisfaction to be a
reliable marker of burnout. They also found an association between higher burnout
levels and a greater intention to leave the profession.
Griva and Joekes (2003) studied teachers experiencing stress in London. Their
burnout levels predicted higher emotional exhaustion and lower social support levels.
Increased demands were associated with low job satisfaction and high social support
levels were related to high job satisfaction. Older teachers were more satisfied.
9. Gaps in the literature
Stress and burnout levels have not been assessed in nurses and midwives in the same
group in any research. As nurses and midwives work differs somewhat, it has been
interesting to see how nurses and midwives perceive their stress and burnout
experiences. Some nurses and midwives worked in either of these roles, further
accentuating the importance of pursuing this area simultaneously. Even though
Williams and Cooper (1998) developed the Pressure Management Indicator which
assessed how much control the individual is able to exert over their life and ways in
which they cope with stress, this tool did not examine work behaviour as pressure and
motivation levels.
10. Conclusion
Current research indicates nurses and midwives are leaving their profession and the
nursing shortage has become a major global problem. This has prompted significant
new research. The link between illness and stress is well established, stress being
implicated in many conditions including cancer, asthma, hypertension and coronary
heart disease (Rhead, 1995). Stress has destructive consequences, including
cardiovascular disease, tension, depression and ulcers (Quick et al., 1985). It would
seem reasonable to expect that nursing and midwifery professions will become an
unhealthy segment of the population if documented stress levels continue. The result

98
is self-depletion, negativism and cynicism (Williamson & Dodds, 1999). Excessive
time demands prevent nurses pursuing quality opportunities for further professional
development (Duke, 1984).
The literature conveys the meaning of stress and burnout and associated individual
responses for nurses and midwives. The work stress theories partly explain some of
the underlying reasons for stress and burnout including motivation and low rewards,
lack of autonomy and low control over the work environment and a mismatch
between person and the type of work. Karasek‟s (1979) Demand-Control Theory
specifically is related to how a person manages particular demands placed upon them,
and if that person feels overwhelmed by these demands this could lead to stress and
burnout. The Person-Fit Theory relates to the assessment of a person being suited to a
particular job. Vroom‟s (1964) Motivational Expectancy or Effort-Reward Theory
relates to how a person behaves according to expectations or rewards in the
workplace.
The questionnaire developed for this research specifically focuses on aspects relating
to these work theories. The information obtained relates to external pressures in the
work environment, the ability of the individual to deal with these external pressures,
whether the individual is suited to the particular work and the individual‟s motivation
levels. The ability of the individual to deal with external pressures directly relates to
how much stress and burnout they will experience. The individual‟s suitability to a
particular job relates directly to job compatibility and satisfaction. The individual‟s
pressure and motivation levels directly relate to their work behaviour. The literature
highlights the important aspects, which include sources and results of stress,
environmental working conditions, organisational factors, emotional and physical
wellbeing, burnout, individual reactions and coping strategies. These important
aspects of individual responses to stress and burnout are all connected in some way to
the work theories.

99
Chapter 3
METHODOLOGY
1. Introduction
The literature review identified the main sources of individual responses to stress and
burnout as they are related to environmental working conditions and occupational
stress. Experiencing stress can affect emotional and physical wellbeing including
symptoms of stress related to ill health and outcomes relating to disruption of family
and work balance. Continued exposure to stress results in burnout which includes
emotional exhaustion, depersonalisation and low personal accomplishment. Individual
responses and reactions to stress relate to work behaviours, situational factors and the
personality hardiness concept. The theoretical framework and work theories presented
in the previous chapter have common characteristics in dealing with individual
responses to stress and burnout workplace issues. This information provided a
theoretical basis for developing a specific tool to explore individual responses to
stress and burnout workplace issues in a sample of Australian nurses and midwives.
The literature indicated that nurses and midwives are experiencing significant stress
and burnout. Other than a few studies, three focusing on Victorian nurses (Healy &
McKay, 2000; Kent & Lavery, 2007; O‟Connor & Jeavons, 2002) three focusing on
mental health nurses (Clinton et al., 1995; Humpel & Caputi, 2001; Taylor & Barling,
2004), two in Queensland (Barrett & Yates, 2002; Spooner-Lane & Patton, 2008) and
one in Sydney focusing on violence and abuse from patients (Carstairs & Trenoska,
2002), all other studies are based on nurses and midwives working in countries other
than Australia. Lambert and Lambert (2001) recommend that more studies be
undertaken in other countries as there is a plethora of studies in the United Kingdom
and United States of America. On this basis alone, there is good reason to conduct
more research focusing on stress and burnout issues relating to nurses and midwives
working in Australia.

100
The research process began with the development of a questionnaire based on a
comprehensive literature review. As well, questionnaires from this area of interest
were reviewed. Gray-Toft and Anderson (1981), for example, designed the Nursing
Stress Scale specifically to assess three sources of stress, namely, physical,
psychological and social. Their questionnaire was deemed inadequate for this study as
it did not examine self-imposed pressure and motivation levels. Other tools assessed
such things as psychiatric morbidity and fibromyalgia but unfortunately they did not
focus on nurses and midwives. Only one questionnaire (Wheeler & Riding, 1994)
focused on assessment of nurses‟ and midwives‟ stress and did not investigate burnout
and work behaviours.
The major reason why a new questionnaire had to be designed was linked to the fact
that none of the currently available survey instruments are able to measure stress,
burnout and work-related behaviours for nurses and midwives. As most studies have
concentrated on measuring stress and not the outcomes of experiencing stressors
(Delvaux, Razavi & Farvacques, 1988), the questionnaire developed for this project
examines not only overall levels of stress, but also discrete outcomes of the
multifaceted phenomena of stress, specific aspects of burnout and individual
responses to workplace issues.
The development of a new tool required a pilot study to address problems and issues
of reliability and validity. Major issues associated with the development of a new
survey tool include identifying logistical problems, assessing data analysis techniques
to uncover potential problems and testing adequacy of the research instrument
(Hundley & van Teijlingen, 2002). Once reliability and validity were established with
the newly developed questionnaire, it could then be used for the main study.
1.1. Ethical considerations
The draft questionnaire was submitted for ethics approval to the University of New
England, Armidale in March 2004 and approved, once requested minor changes were
made, in July, 2004. The approval number for this study is HE03/201 (Appendix 1).
Ethics approval for the pilot study was obtained from the appropriate Area Health
Service or individual health facilities for distribution of the questionnaire (approval

101
number for Central Coast Area Health Service, 03/61). Further ethics variation
approval was obtained from the University of New England in March 2005 to permit
distribution at nursing and midwifery conferences scheduled over the coming year.
All respondents were advised that they could withdraw without penalty from the study
at any time.
Confidentiality was maintained by coding each of the questionnaires with a numeral.
Each respondent was identified by a numeral to allow for easy access to data
information and to ensure that responses could not be linked with the name of the
respondent. Each of the questionnaires was also given a colour code to allow for
identification of conference attended. The last page of each questionnaire enabled
respondents to write their name if they wanted to be informed of the final results of
the study. Using the last page of each questionnaire allowed these personal details to
be separated from the actual questionnaire. The questionnaires are kept in a locked
cabinet at a private residence and will be destroyed following a period of five years.
2. Pilot study
Hundley and van Teijlingen (2002) report that before using a questionnaire for the
first time a pilot study is of the utmost importance. Reasons include: testing and
developing research instruments, assessing whether the proposed tool is workable and
realistic, assessing the success of recruitment approaches, assessing data analysis
techniques and identifying logistical problems. Sufficient pilot work should be carried
out while developing a new measurement tool (Rattray & Jones, 2007). Edwards and
Burnard (2003) recommend pilot studies to establish reliability and validity. A pilot
study was undertaken primarily to acquire feedback, ensure the questionnaire was
user-friendly, ensure the items in the questionnaire covered the content area and
establish an adequate degree of reliability and validity.
Respondents included 18 registered nurses from three aged care facilities, 30
midwives from the Central Coast of NSW and one doctoral student (who was a
registered nurse) from the University of New England, Armidale. The sample was a
mixture of registered nurses and midwives working in different arenas and

102
indicative of the intended main study sample. The pilot respondents were selected
by convenience sampling. The sample was selected because of geographical
accessibility and ethics approval was obtained from the appropriate authorities.
The aged care facilities offered verbal agreement for the pilot study and the
questionnaires were distributed via the Directors of Nursing. The questionnaire was
distributed directly to the doctoral student. Nursing Unit Managers from a
conveniently located hospital, who had formally agreed to this activity, distributed
the questionnaire to their staff (approval number for Central Coast Area Health
Service, 03/61). As it is sometimes impossible to exclude pilot study respondents
from the main study (Hundley & van Teijlingen, 2002), some of the pilot study
respondents might have also been included in the subsequent main study. It was not
possible to determine if there was such overlap, as the questionnaire forms were
distributed to respondents attending a number of conferences (refer to Appendix 2).
While pilot studies are usually based on smaller numbers (Hundley & van
Teijlingen, 2002), there should be sufficient pilot respondents to obtain valid results
(Dunning & Martin, 1996). The questionnaire was distributed to 49 respondents in
the pilot study, this being comparable to 50 respondents from Dunning and Martin‟s
(1996) pilot study. The pilot sample size for this study was chosen so as to be able
to provide adequate information on reliability and a certain degree of face validity.
The average age of the pilot respondent was 47.9 years and the average number of
years in the nursing profession was 24.2 years. As the sample was small, an average
was calculated for any numerical data that were missing, using a non-parametric
mean imputation method (Nielson, 2001).
2.1. Operational definitions of stress, burnout and individual
responses
For the purpose of this research, stress, burnout and individual responses have been
given the following operational definitions, developed to be specifically applicable for
nurses and midwives in their current working climate.
Stress is defined as:

103
an inability to control the work environment
which leads to considerable pressure and job
dissatisfaction amongst working team members.
This might contribute to feelings of unease at the
initial episode of stress and involve an array of
symptoms characteristic of ill health over a
prolonged period of time in the helping
professions;
burnout is defined as:
an emotional state experienced over a prolonged
period of time by those in the helping professions
resulting in feelingsof powerlessness and being
emotionally exhausted and overwhelmed. This
contributes to lack of empathy towards colleagues
and clients and feelings of incompetence and lack
of achievement in one‟s work with people;
and individual responses are defined as:
how an individual reacts in a particular work
situation depending upon self-imposed work
pressure and motivation.
2.2. Classifications and coding legends for questionnaire
Classifications or categories were developed with numerical values attached to
extreme, moderate, fair and nil / negligible levels of stress and burnout for relevant
questions. This enabled categorisation and calculation of the entire sample‟s level of
stress, burnout and individual responses. Relevant questions from the questionnaire
were also categorised into the following subscales: work environment, psychosocial
stressors, issues of control, job satisfaction, exhaustion and individual responses. As
identified in the literature, questions which related to a particular subscale were
grouped accordingly.
For the majority of the questions, individual responses to stress and burnout
experiences were identified by using a rating scale which designated how often these
occurred (Roberts & Taylor, 1998). As part of a standard valid methodology, such
scales comprise, in most cases, between five and ten points (Schneider et al., 2003).

104
The scales used as part of this research range from five and nine points. For example,
some responses included: „never‟, „occasionally‟, „frequently‟, „most of the time‟ and
„always‟, while others offered nine choices, such as „for seven to ten weeks‟, „for five
or six weeks‟, „for a month‟, „for two or three weeks‟, „for a week‟, „for three to five
days‟, „for two days‟, „for a day‟ and „no holiday‟.
There were eight questions which included „never / occasionally‟ in the same box as
the answer or option. Respondents who used this „never / occasionally‟ box in their
answer to any of these eight questions were recorded as having answered „nil /
negligible‟. For example, the question, „How often do you feel emotionally drained at
work?‟ would rate a nil / negligible stress rating if the answer was „never /
occasionally‟. Seven questions included „yes‟, „no‟, „sometimes‟ or „unsure‟
statements. For logistic regression analysis only, answers to these questions were
recoded as dichotomous variables by removing any answers indicating „sometimes‟
and „unsure‟. There was one question which gave options of behaviour (Bello, 1994).
This question asked, „How do you react when you are irritable?” The options for this
question were „swear and shout‟, „verbalise your feelings in a disruptive manner‟,
„verbalise your feelings in a controlled manner‟ and „bottle your feelings inside‟.
All parts of the stress, burnout and individual response components of the
questionnaire used different indices of coding to accommodate the varied answers.
The specific indices used for the subscales are set out in Table 1 and were used for the
initial pilot study.

105
Table 1 Stress, Burnout and Individual Response Subscales / Indices for Pilot
Study
Major theme Category Subscale Questions Indices
Stress
Occupational
stress
Work
environment
Incidence of stress
Time management- workload
Rush to complete tasks
Finishing late
Respected by clients
Organisational support
Work colleagues unsupportive
Expectation of „stress‟ free environment
0-4
0-4
0-4
0-4
0-4
0-4
0-4
0-2 Stress leading to
ill health
Psychosocial
stressors and
symptoms
Sleeplessness over past decade
Depression over past decade
Sleeplessness over past week
Headaches requiring analgesia
Stress considered healthy
Stress requiring treatment
Mental health leave
Helplessness over past decade
Frequency of depression
Length of holiday
1-6
1-6
1-5
1-5
0-2
0-7
0-6
1-7
0-6
0-8
Autonomy Control
Feeling powerless
Decision-making
Motivated by maintaining control
0-4
0-4
0-4
Job compatibility Job satisfaction Being suited to the work
Enjoying the type of work
Wanting to change area of practice
Wanting to leave professional discipline
Frequency of job dissatisfaction
0-4
0-4
0-3
0-3
0-7
Burnout Prolonged
exposure to
stress
Exhaustion Apathy
Experiencing low morale
Feeling undervalued
Feeling overwhelmed
Feelings of incompetence
Experiencing increased anxiety
Fatigue
Feeling emotionally drained
Loss of empathy for clients
Loss of empathy for colleagues
Burnout unavoidable
0-4
0-4
0-4
0-4
0-4
1-6
1-5
1-5
0-2
0-2
0-2
Individual
Responses
Individual &
work stressors
Pressure /
motivation
Working independently
Trying to achieve more than time allows
Unreasonable expectations on self
Irritability
Pushed for time
Difficulty slowing down for procedures
Working at high performance
Arriving early for appointments
Reporting sick if unwell
Continuing work if unwell
Keyed up on most days
Multi-tasking
Constantly looking for challenge
Strong sense of commitment
Reactions when irritable
0-4
0-4
0-4
0-4
0-4
0-4
0-4
0-4
0-4
0-4
0-4
0-4
0-4
0-4
0-4

106
2.3. Validity and reliability
Tools must possess basic attributes that assure dependable measurement of the
variables under investigation. These important attributes are validity and reliability
(Waltz, Strickland & Lenz, 1991). Rattray and Jones (2007) state that it is essential
that nurse researchers incorporate methods to establish validity and reliability,
particularly of new tools. It is vital to establish validity and reliability and to
incorporate these pre-planned methods when designing a questionnaire (Rattray &
Jones, 2007). Norbeck (1985) suggests that there are four minimum standards
necessary for the adequate evaluation of an instrument for use in research. These
standards should include at least one type of content validity (for example, face
validity), two types of reliability testing (internal consistency and test-retest) and at
least one type of construct (or criterion-related) validity.
Validity is the extent to which a study using a particular tool measures what it sets out
to measure (Polit & Hungler, 1997). The testing of validity is not exactly proven, but
rather supported by an accumulation of evidence. A tool cannot be said to lack or
possess validity; it is an issue of degree. A researcher does not totally validate a tool
in isolation but more an application of the tool (Polit & Hungler, 1997). When
designing a questionnaire, a wide variety of options should be given, so that
respondents can answer truthfully. This enhances validity of the tool (Polgar &
Thomas, 1997). Unlike reliability, there are no simple statistical calculations to assess
validity (Polit & Hungler, 1997).
The reliability of a tool is a criterion for assessing quality (Polit & Hungler, 1997). It
refers to whether the tool obtains consistent results when used again. A tool is reliable
when a repeat use of the tool consistently measures what it is measuring in exactly the
same way (Dempsey & Dempsey, 1992). Reliability is an important precondition for
validity because if an instrument is unreliable, it lacks adequate validity. However, a
reliable instrument is not necessarily valid since it might be measuring something
other than what it is supposed to measure. Reliability is expressed as a numeral which
is called a coefficient. The higher the numeral the more reliable. Rarely is a tool
perfectly reliable and is often reported as 0.8, 0.7 or 0.6, as opposed to 1.0 (Dempsey
& Dempsey, 1992). Stress and burnout are multivariate and multidimensional

107
concepts and achieving lower correlation coefficients is more acceptable
(Kotzabassaki & Parissopoulos, 2003).
2.3.1. Content validity
Polit and Hungler (1997) define content validity as the adequacy of the content area
being considered. A subtype of content validity is face validity and this investigates
whether an instrument is calculating the appropriate construct. Dempsey and
Dempsey (1992) define face validity as whether the items within an instrument
measure the variables in a specific content area.
A. Generation of items for the draft questionnaire
The questionnaire used for this study was developed specifically for the target group
of nurses and midwives. The questionnaire was designed to ascertain information
relating to issues and concerns they faced in their current clinically challenging work
environments. Developing the questionnaire involved an extensive literature review
on stress and burnout pertaining to other professions as well as nurses and midwives.
The search item words included stress; burnout; and behavioural characteristics when
reviewing the literature. Items were generated from a literature review and advice
from academic and clinical experts in the field. Other tools were reviewed but found
to be less specific for current issues faced by this group or cohort (Goldberg, 1978;
Jewell & Siegall, 1990; Maslach & Jackson, 1981; Rahe & Tolles, 2002; Stordeur,
D‟Hoore & Vandenberghe, 2001).
The questionnaire for this research consisted of three sections. The first section
obtained demographic information, encompassing six questions. The second section
comprised 37 questions related to stress and burnout. The third section comprised 15
questions related to behaviour exhibited in particular circumstances, known as
vignettes (Polit & Hungler, 1999). Additionally a comprehensive accumulation of
information from the area of interest came from first-hand knowledge and experience
in the healthcare workforce. The questionnaire, a structured assessment tool, included
self-report techniques consisting of questions with precoded response options (Wilde,
1977).

108
The questionnaire devised for this research uses a measurement framework known as
a norm-referenced approach (Waltz, Strickland & Lenz, 1991). This approach is
employed when comparing and evaluating a respondent‟s performance in relation to
the performance of other respondents in some well-defined norm or reference group.
An example of this strategy would be comparing nurses‟ and midwives‟ scores on
stress in relation to particular demographics, for example, whether they were fulltime
or part-time, better educated or living alone (used in this research, see Chapter 4,
section 2.2.2.). This was important for this research because the questionnaire aims to
assess the relationship of stress amongst nurses and midwives and important
categorical variables.
Following the development of this draft questionnaire, the university presentation
feedback session held in October, 2003, provided an opportunity for reviews and
advice from academic and clinical experts in the field. Content validity ensures that
expert opinion is obtained on whether the questions represent the proposed concepts
the questionnaire is intending to measure. It is the first step when establishing validity,
but insufficient by itself (Rattray & Jones, 2007). Content validity is based on
judgement. There are no objective methods ensuring sufficient content coverage of a
particular tool (Polit & Hungler, 1999).
B. Changes to questions relating to stress and individual
responses
All changes which were aimed at improving acquisition of realistic information from
respondents, reducing the ambiguity of questions or enhancing valid analysis of the
aggregated data were accepted. The first addition included „Tick one box‟ to ensure
respondents provided single responses only. The word „inefficient‟ replaced „poor‟.
The words „In your work‟ were added onto the question, „Are you constantly looking
for a challenge?‟ The value-laden word „suffered‟ was changed to „experienced‟, in
questions relating to sleeplessness and depression. „Stress that keeps you moving‟ was
changed to „stress that keeps you motivated‟.
The questions, „How long was your holiday at one time over the last year?‟ and „How
often did you holiday for more than one day over the last year?‟ were condensed into

109
one question, „How long was your longest holiday at one time over the last year?‟
One of the options for this question was changed from „seven or eight weeks‟ to
„seven to ten weeks‟ to avoid any ambiguity. The phrase „not having enough time to
attend to the quality of care of clients‟ was changed to „Is your workload too
excessive at times to provide quality of care for clients?‟. The question „Do you think
you are well-suited to this particular type of work?‟ was changed to „Do you think you
are suited to the particular type of work you are doing?‟
C. Changes to questions relating to demographics
Demographics were placed at the end of the questionnaire in an effort to initially
engage respondents in the topic under question rather than their particular details, as
suggested by experts in the field (Rattray & Jones, 2007). Changes were made as
indicated: the area of „nursing management‟, which had not been included in the
original draft questionnaire, was included in the „areas of work‟. The sentence „If you
work in more than one area, please write in the space provided starting with the most
predominant area first‟ was added to prevent confusion in being unable to distinguish
predominant areas. It was recognised that nurses often work in many different
specialties and it would be important to know the primary or most usual specialty
workplace. Added to the demographics were the hours worked and whether the nurse
or midwife worked on a permanent, fulltime, part-time or casual basis.
2.3.2. Internal consistency
Acceptable levels of Cronbach reliability values are 0.7 or higher (Field, 2005). The
overall Cronbach reliability level for internal consistency concerning all 37 of the 38
questions for the pilot study relating to the stress and burnout components of the
questionnaire was 0.87 in respect of the first test and 0.82 in respect of the second test.
One question was not included in the reliability analysis because 100 per cent of the
nurse and midwife respondents for both test and retests responded „no‟ to the
question: „Would you expect your environment to be “stress” free?‟ As it is
recommended that the Cronbach‟s alpha statistic be stated for separate parts within a
questionnaire rather than for the whole questionnaire (Rattray & Jones, 2007), these
statistics were calculated for the stress and burnout components separately. The
overall reliability for the stress component of the questionnaire was 0.79 for the first

110
test and 0.75 for the second test. The overall reliability for the burnout component was
0.87 for the first test and 0.83 for the second test.
Figures 1 and 2 illustrate the Cronbach‟s alpha values for each relevant item relating
to either the stress and burnout components for the pilot study in relation to the
preliminary (first test) and final (second test) versions of the questionnaire. All
Cronbach alpha statistics were analysed by SPSS (Statistical Package for Social
Sciences, Version 14).
Figure 1 Reliability Values for Stress Component of Questionnaire
Internal consistency reliability values (Cronbach's
alpha) for preliminary and final version of stress
component of questionnaire
0.7
0.75
0.8
0.85
0.9
1 4 13 16 19 22 26 33 36
Questions
Alp
ha v
alu
es
Preliminary
Final

111
Figure 2 Reliability Values for Burnout Component of Questionnaire
Internal consistency reliability values (Cronbach's
alpha) for preliminary and final version of burnout
component of questionnaire
0.76
0.78
0.8
0.82
0.84
0.86
0.88
5 6 7 8 9 10 23 27 28 29
Questions
Alp
ha v
alu
es
Preliminary
Final
For the individual response component of the pilot questionnaire, only five questions
of 15 intended to measure pressure and motivation were able to be used for statistical
analyses, as only these five questions showed good reliability for internal consistency
(> 0.7) for the preliminary (first test) and final (second test) versions of the
questionnaire (Table 2). Despite this finding, the remaining ten questions were not
deleted from the final version of the questionnaire (Appendix 3) as it was believed
that these questions could also provide a basis for descriptive statistics. Questions
should not be removed if they are theoretically important, even if the criteria of
Cronbach‟s alpha is not met (Rattray & Jones, 2007).
Table 2 Internal Consistency Reliability Values (Cronbach‟s Alpha) for
Preliminary and Final Versions of Individual Response Component
Question Preliminary Final
Trying to achieve more 0.8354 0.7957
Unreasonable expectations 0.8146 0.7671
Irritability 0.8454 0.7360
Pushed for time 0.8387 0.7938
Difficulty slowing down 0.8781 0.8260
Total Reliability 0.8708 0.8208

112
2.3.3. Test-retest reliability
A. Processes for determining test-retest reliability
Test-retest reliability should be included when developing any questionnaire (Rattray
& Jones, 2007). This procedure involves administering the instrument to similar
individuals resembling the proposed main study, letting a period of time elapse (say a
week) to allow for loss of memory of the items, then administering the instrument to
the same individuals again. For test-retest reliability, scores on the two sets of
responses are correlated statistically to yield a correlation coefficient referred to as the
coefficient of stability or Pearson Product moment. A high correlation of 0.9 is used
as a sensible level due to the fact that only a few participants will be involved (if 200
test-retest participants were to be used, a much lower correlation would suffice to
indicate significance). If the results are the same or similar, the coefficient will be
high – for example, 0.9 and the instrument is said to have high test-retest reliability.
One problem with this method is realistically deciding the length of time between test
and retest. If it is too short, individuals will remember responses and if too long,
individuals might score differently because of maturation and learning (Dempsey &
Dempsey, 1992).
As noted earlier, for the pilot study, the first questionnaire was distributed to 49
nurses and midwives in five locations by the nursing unit manager and author and the
second questionnaire was mailed by the author. The time period between the original
test and the retest was two weeks. This time period was chosen so that individuals
would not remember specific responses and not so long that maturation and learning
might occur and affect the answers (Dempsey & Dempsey, 1992). The directions to
complete the questionnaire were exactly the same for each respondent for both the
original test and the retest.
Thirty-five questionnaires were returned out of 49 distributed resulting in a 71 per
cent initial return rate. As eight of these 35 respondents remained anonymous, it was
possible to mail a second questionnaire to only 27 respondents. Twenty-four
respondents returned this second questionnaire, giving a total return rate of 49 per
cent of the postal questionnaires distributed. Twenty-four respondents were therefore

113
used in the pilot data analysis. Twenty nurses were used to validate a research
instrument on burnout in Hall‟s (2001) pilot study in Dunedin Hospital, New Zealand.
B. Data analysis for test-retest reliability
Figure 3 gives a diagrammatic representation of the preliminary and final Cronbach
alpha scores resulting from the pilot study for the six subscales of the questionnaire.
These subscales (except for control) will therefore be used as the conceptual
framework throughout this thesis. Control was excluded as a subscale in factor
analysis because of the poor sampling adequacy (0.5) as, for factor analysis to be
reliable, sample size must be adequate (Field, 2005) (see section 3.5.4. C. b.).
Figure 3 Reliability Values for Six Subscales of Questionnaire
Preliminary and final Cronbach alpha values for the six subscales
0.2
0.3
0.4
0.5
0.6
0.7
0.8
Work
environment
Psychosocial
stressors
Control Job satisfaction Exhaustion Pressure /
motivation
Subscales
Alp
ha v
alu
es
Test Re-test
For the pilot study, the intraclass correlation coefficient was calculated for continuous
data. The Spearman‟s rank order correlation was employed to analyse inter-item,
item-total correlation and correlations between subscales. Spearman‟s rank order
correlation was also used with the intraclass correlation coefficient to estimate the
degree of resemblance or reliability of the scales for the preliminary and final versions
of the pilot questionnaire (that is, the test and retest scores). Table 3 shows the test-
retest reliability estimates (column 4). From the table, all subscales in retest reliability
were moderately correlated (r = 0.47 – 0.74) (Table 3, column 4). The correlation

114
coefficients were between 0.3 and 0.62 (Table 3, column 3) for the preliminary
version of the test. Exhaustion and psychosocial stressors subscales show lower
correlation coefficients. This can be expected as the strengths of the relationship or
association depend on context and in some cases, where the correlation is low, the
outcome might still be significant (Stevens, 1992). Even though a small correlation is
identified, this could make a substantial contribution for determining and evaluating
strategies for reduction of stress. Peiro, Gonzalez-Roma, Tordera and Manas‟ (2001)
study for test-retest reliability coefficients gave results of 0.45, 0.64 and 0.66, which
were relatively low but statistically significant (p<0.01) for burnout dimensions.
Losing descriptive statistical information might be detrimental for understanding
symptoms of stress. For example, if high correlation coefficients are identified, these
areas might be easier to address in possibly alleviating stress areas. For the pilot
study, the intraclass correlation coefficient (ICC) ranged from 0.3 to 0.92, with
psychosocial stressors and symptoms and exhaustion showing a high resemblance
between pre and post-test (Table 3, column 5) which indicates that the instrument has
high test-retest reliability for these two subscales. Average paired responses (for test-
retest scores) for all questions measured the same for 27.5 out of 38 (73%) for the
stress / burnout component of the questionnaire and the same for 9.3 out of 15 (61%)
for the individual response component (Appendix 4). This means that out of the 38
questions for the stress / burnout component of the questionnaire an average of 27.5
out of the 38 questions were answered the same for test and retest scores, and an
average of 9.3 out of 15 questions were answered the same for the individual response
component.
Table 3 Spearman‟s Rank Order Correlation - Rho, Intraclass Correlation
Coefficient (ICC) and Factor Analysis Method for the Six Sub-scales
Subscales Category
Consistency
(Spearman‟s
rho)
Test-
Retest ICC
Work environment (8-item scale) Occupational stress 0.62 0.70 0.44
Psychosocial stressors and
symptoms (10-item scale) Stress related to ill health 0.30 0.50 0.81
Control (3-item scale) Autonomy 0.62 0.74 0.30
Job satisfaction (5-item scale) Job compatibility 0.58 0.68 0.73
Exhaustion (11-item scale) Prolonged exposure to stress 0.35 0.47 0.92
Pressure motivation (15-item scale) Individual and work stressor 0.52 0.64 0.52

115
2.3.4. Construct validity
Construct validity is another standard to be achieved in developing a new tool. It
measures a specific construct or hypothetical trait, such as grief, intelligence or
prejudice pertaining to an instrument (Field, 2005).
Factor analysis
Factor analysis is one way of establishing construct validity (Field, 2005). Construct
validity addresses how well the questions in the tool represent the fundamental
conceptual structure (Field, 2005). Factor analysis was used in developing the
questionnaire to establish if items were representative of the factor (Rattray & Jones,
2007). Factor analysis is calculated to statistically define subgroups for the indices
created by the researcher (Field, 2005). This is useful to assess dimensions of
phenomena to justify them (Waltz, Strickland & Lenz, 1991). Some questionnaires
include a number of subscales which „tap‟ into the construct being measured
(Rattray & Jones, 2007). Different aspects of individual responses to stress and
burnout can be measured. Thus, items such as stress and burnout levels, ideas of
motivation and enthusiasm can be assessed.
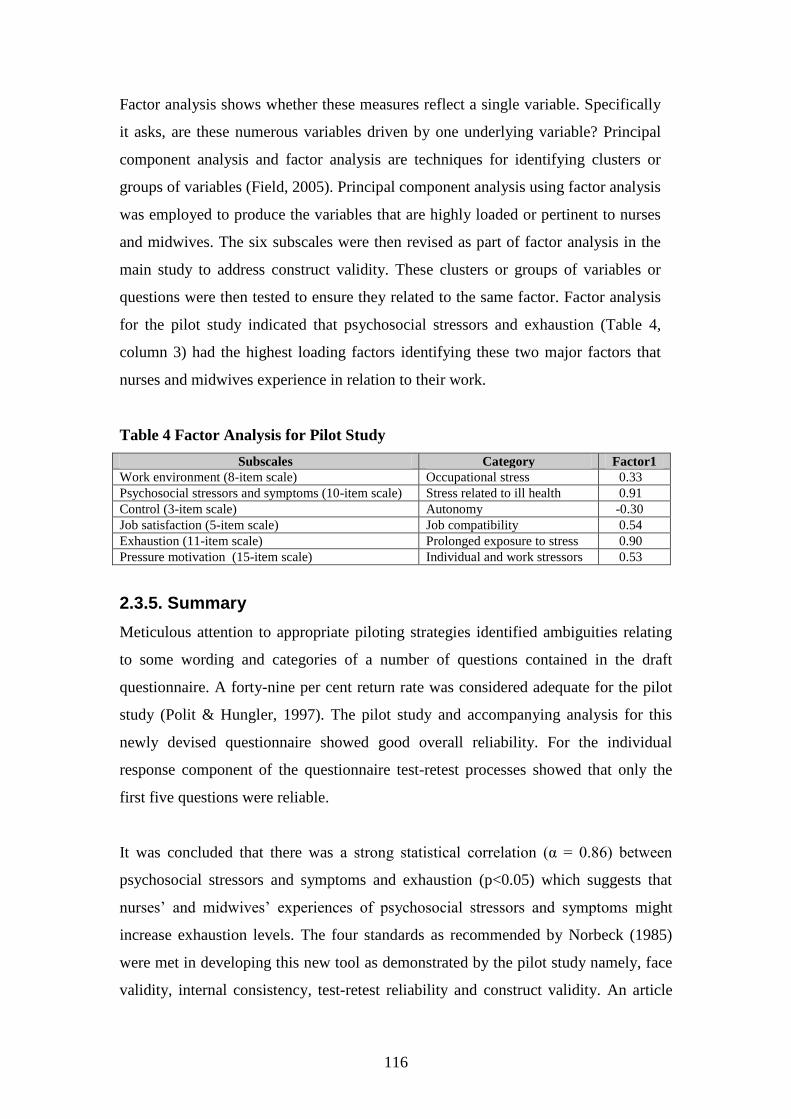
116
Factor analysis shows whether these measures reflect a single variable. Specifically
it asks, are these numerous variables driven by one underlying variable? Principal
component analysis and factor analysis are techniques for identifying clusters or
groups of variables (Field, 2005). Principal component analysis using factor analysis
was employed to produce the variables that are highly loaded or pertinent to nurses
and midwives. The six subscales were then revised as part of factor analysis in the
main study to address construct validity. These clusters or groups of variables or
questions were then tested to ensure they related to the same factor. Factor analysis
for the pilot study indicated that psychosocial stressors and exhaustion (Table 4,
column 3) had the highest loading factors identifying these two major factors that
nurses and midwives experience in relation to their work.
Table 4 Factor Analysis for Pilot Study
Subscales Category Factor1
Work environment (8-item scale) Occupational stress 0.33
Psychosocial stressors and symptoms (10-item scale) Stress related to ill health 0.91
Control (3-item scale) Autonomy -0.30
Job satisfaction (5-item scale) Job compatibility 0.54
Exhaustion (11-item scale) Prolonged exposure to stress 0.90
Pressure motivation (15-item scale) Individual and work stressors 0.53
2.3.5. Summary
Meticulous attention to appropriate piloting strategies identified ambiguities relating
to some wording and categories of a number of questions contained in the draft
questionnaire. A forty-nine per cent return rate was considered adequate for the pilot
study (Polit & Hungler, 1997). The pilot study and accompanying analysis for this
newly devised questionnaire showed good overall reliability. For the individual
response component of the questionnaire test-retest processes showed that only the
first five questions were reliable.
It was concluded that there was a strong statistical correlation (α = 0.86) between
psychosocial stressors and symptoms and exhaustion (p<0.05) which suggests that
nurses‟ and midwives‟ experiences of psychosocial stressors and symptoms might
increase exhaustion levels. The four standards as recommended by Norbeck (1985)
were met in developing this new tool as demonstrated by the pilot study namely, face
validity, internal consistency, test-retest reliability and construct validity. An article

117
describing this pilot study has been published in The Australian Journal of Advanced
Nursing, vol 24, no 4, Jun-Aug, 2007 (Appendix 5).
3. Main study
3.1. Estimation of sample size
Required sample size (a priori calculation) and statistical power for known sample
size of the study (post hoc calculations) were performed according to Field‟s (2005)
recommendations, using the computer program, G*Power. The effect size within a
population is linked to three statistical properties, namely the sample size, the
probability level (the alpha level) and the statistical power (the beta level). Field
(2005) describes the probability level as an accepted level of an effect being
statistically significant and the statistical power as the ability of a specific test to
detect any effect of that size. Field (2005) states that the aim is
to achieve a power of 0.8, or an 80 per cent
chance of detecting an effect if one genuinely
exists (Field, 2005, p. 33).
The power of a specific test is the given probability that that test will discover an
effect assuming one exists in that population (Field, 2005). A probability (or alpha)
(α) level of 0.05 is standard, according to Field (2005), meaning there is a five per
cent chance that results would occur by chance alone. Lang and Secic (1997) state that
statistical power is equal to 1 – beta, meaning beta (β) is the likelihood of calculating
a type 2 error; that is, wrongly concluding there is no distinction between the groups
when in reality there is a difference. For example, if the beta level (1 – β) is set at 0.8
(80% power), the researcher will incur a 20 per cent possibility of missing a
difference (Lang & Secic, 1997). For large scale social science research, a power of
0.8 is acceptable in respect of a priori sample size (Mandy & Mandy, 2000).
Cohen (1992) suggested detection of a small effect size as r = 0.1, medium effect size
as r = 0.3 and a large effect size as r = 0.5. Based on these guidelines, 783
respondents from this questionnaire are needed to reveal a small effect size, 85
respondents to reveal a medium effect size and 28 respondents to reveal a large effect

118
size. The effect size is a standardised and objective measure providing information on
the importance and the extent of the effect. It does not matter what or how the variable
has been measured. A value of 0 means no effect and 1 equals a perfect effect (Field,
2005). Sample size (a priori) and power (post hoc) were calculated using the relevant
statistical parameters (Table 5). There were 1358 respondents in the study with a
response rate of 562.
Table 5 Sample Size and Power Calculations- 2-tailed
Alpha level –
probability
1 - beta level –power Effect size Sample size
A priori 0.05 (α) 0.8 (1 - β) r = 0.12 540
Post hoc 0.05 (α) 0.81 (1 – β) r = 0.12 562
3.2. The sample
From April to November 2005, questionnaires were distributed to nurses and
midwives at 13 nursing, breastfeeding and midwifery seminars and conferences
within Australia, including areas within Sydney, Gosford, Brisbane, Perth and Hobart
(see Appendix 2). These conferences were selected according to their geographical
accessibility as they were held in capital cities. The sample consisted of enrolled and
registered nurses and midwives.
Seven respondents who worked in countries other than Australia were removed from
the sample, to make it possible to compare the phenomena of stress, burnout and
individual responses among nurses and midwives working in Australia. This method
of convenience sampling involves the use of most conveniently available respondents
for the study using relatively easily available elements of a population who meet the
criteria (Polit & Hungler, 1999; Roberts & Taylor, 1998). In convenience sampling,
one chooses respondents who, due to their location, are easy to recruit and / or likely
to respond. In this project, professional conferences attended by nurses and midwives
were deemed the most convenient locations for recruiting eligible respondents.
3.3. Recruitment of respondents and coding of questionnaires
Twelve different conferences and seminars throughout Australia were attended by the
author in 2005 in order to distribute the questionnaire. At the Perth conference, the

119
questionnaire was distributed by a conference convenor. At five of the conferences,
there was an opportunity to address the audience and discuss the research. At the
remaining eight venues or seminars, the conference convenor addressed the audience
regarding the research.
At each conference or seminar, a stand was set up and flyers were distributed
describing the study, encouraging respondents to complete a questionnaire. Several
nurses and midwives at these conferences spoke openly about experiences of stress
and burnout. The questionnaires were placed at each of the stands at each conference,
allowing nurses or midwives to volunteer to take the questionnaire. A box with the
researcher‟s photo and instructions to „place the questionnaires into this box‟ was also
positioned at the stand so that respondents could complete their questionnaire and
return it on the same day. Each questionnaire had a stamped addressed or reply paid
envelope attached to further enhance the return rate for those conference respondents
who did not avail themselves of the option to place their completed questionnaire
form in the box provided.
3.4. Data collection
The returned questionnaires were able to be identified as to the location of conference
but not the name of the person completing the questionnaire form by way of a colour
coding or object placed on one of the pages. They were sorted into conference groups.
Each question was coded and scores added at the end of each part of the
questionnaire. Each respondent was given a code or identification number for their
questionnaire, in order to manage and de-identify data. Standard coding, enabling
appropriate data analysis, was used for data entry. Following coding and scoring of
the questionnaires, data were entered onto the computer programme Microsoft Excel
and SPSS (Statistical Package for Social Sciences, Version 14) for later statistical
analysis.

120
3.5. Levels of statistical analyses
3.5.1. Descriptive statistics
Statistics were analysed in SPSS (Statistical Package for Social Sciences, Version 14).
Descriptive statistics were used to describe frequencies, percentages, demographics,
measures of central tendency and variability. These statistics are mainly presented in
tables and bar or pie graphs. Dempsey and Dempsey (1992) highlight two types of
descriptive statistics. One is central tendency which describes how scores are grouped
together or where most of the scores are clustered or centred. These comprise the
median, mode and mean.
The median measures the centre of a statistical data set (Rumsey, 2003). The median
divides the distribution in half. The scores are arranged from lowest to highest
(Dempsey & Dempsey, 1992). The mode is the most commonly occurring score in a
data set. It becomes more important when there is a bimodal distribution or two peaks
in a bar graph. The median then becomes less important in a bimodal distribution. The
mean calculates an average of a data set.
The other type of descriptive statistic describes variability, which is how the scores
are spread on the specific scale being used (Dempsey & Dempsey, 1992). Examples
of measures of variability are the range, standard deviation and interquartile range.
The range is simply the subtraction between highest and lowest numerals in a data set.
It includes the outliers in a distribution. The standard deviation is used on a normal
distribution curve. It measures the average distance of a score from the distribution
mean (Schneider et al., 2003).
The interquartile range is where 25 – 75 per cent of the scores lie, or how far around
the median the scores lie, measuring that variability. The interquartile range, or 25th
to
75th
percentile, is the range of values between these percentiles of the particular
distribution (Lang & Secic, 1997). For example, if the 25th
percentile was 2 and the
75th
percentile was 3, the middle bracket of respondents scored between 2 and 3.
Essentially, 25 per cent of the distribution had a score of above 2 and 75 per cent of

121
the distribution had a score of below 3. The interquartile range is used again because
of the ordinal data and is used on distributions which do not propose to be normal.
This is likened to the standard deviation.
The confidence interval is the boundary within which the true sample mean will fall
and equates to a range of values accounting for a margin of error. The particular
demographics for which confidence intervals are given are age, hours worked and
years in profession (Chapter 4, sections 1.1.1. D., E., F.). The specific formula is:
Z * square root of (p(1-p)/n) where p is the sample
proportion, Z is the appropriate Z-value for 95%
confidence (1.96), and n is the sample size
(Rumsey, 2003, p. 181).
The confidence interval chosen for these demographics was 95 per cent which means
95 per cent confidence that the interval contains the true sample mean (Field, 2005).
3.5.2. Correlational or inferential statistics
Inferential statistics enable researchers to make inferences or draw conclusions about
characteristics of a population according to data obtained within a sample. Different
researchers would draw the same conclusions again with identical data (Polit &
Hungler, 1999). Correlational statistics are able to detect associations or relationships
between variables. A correlation measures a linear relationship between two variables
and might be positively or negatively related. Correlational statistics are unable to
predict outcomes from another variable (Field, 2005). Correlational or inferential
statistics were used to measure associations or relationships between phenomena and
individual components / subscales of individual responses to stress and burnout to
detect group differences. Non-parametric statistics were used as the data were ordinal
(Likert scale) (Mandy & Mandy, 2000).
Spearman’s correlation coefficient
Correlational statistics used included Spearman‟s correlation coefficient. This was
used as it is a non-parametric statistic for ordinal data and a bivariate correlation.
Two-tailed analyses were calculated. Two-tailed hypotheses are non-directional,

122
meaning that the prediction one makes might increase or decrease (Field, 2005). The
hypothesis might show a positive or negative association. The process of identifying
the particular sub-categories related to the subscales formed from the questionnaire
(Chapter 4, section 2.1. Tables 70 to 74) and Spearman‟s correlations were calculated
on all reliable variables. These then coincide with the three major work theories
(Chapter 2, section 2., Chapter 5, section 2., Table 94). Spearman‟s correlations were
also calculated on the overall scores (being the sum of all scores, not factor scores, as
in Tables 8, 11, 12 & 13) for all major themes and subscales to establish strength of
relationships.
3.5.3. Logistic regression
Regression analysis, unlike correlations, is able to predict outcomes (dependent
variables) from predictor variables (independent variables). Multiple regression
predicts an outcome variable from several predictor variables. Logistic regression was
calculated to predict outcome variables (dependent) that are categorical. It is multiple
regression with an outcome (dependent) variable that is categorical and dichotomous
and predictor (independent) variables that are categorical and continuous. A
categorical dichotomous variable is able to be classified as meaning „yes‟ or „no‟; for
example, losing empathy or not losing empathy. Continuous variables are those that
have no finite limitations and continue indefinitely; for example, age, hours worked
and years in profession. Logistic regression can predict which category a person is
more likely to fit, given other reliable information (Field, 2005).
Logistic regression allows assessment of how well the predictor (independent)
variables predict the outcome (dependent) variable. It assesses „goodness of fit‟ of the
model. It provides the importance and interaction of the predictor variables. An
accurate assessment of classification of cases is provided, highlighting the specificity
and sensitivity of the model as well as positive and negative predictions (Pallant,
2005). These analyses might then identify the nurse or midwife who is more prone to
experiencing stress and burnout relating to certain occupational and individual factors
or behaviours.

123
Logistic regressions were calculated with the major themes and questions which were
outcome or dependent variables, were able to be coded dichotomously and met the
following assumptions. The first assumption is that a large sample size and a small
number of predictors are used in the analysis. The second important assumption
addresses multicollinearity (see next section 3.5.3.). The third assumption addresses
outliers by inspecting residuals only if there is a problem with the model. The model‟s
support is indicated by a „goodness of fit‟ test being an overall indication of how well
the model performs and a significance value of less than 0.05 (Pallant, 2005).
The data requirements are as follows:
An outcome dependent variable which is categorical (dichotomous).
Two or more categorical or continuous predictor independent variables
(Pallant, 2005). All logistic regression calculations presented as part of this project
satisfy all assumptions noted above.
If there were outliers for logistic regression, these outliers were removed from the
analysis. If the outliers were the only ones who answered „no‟ on the dependent
outcome variable, the analysis was impossible as 100 per cent of answers were equal
to „yes‟. For example if 427 nurses and midwives answered „yes‟ and two answered
„no‟, and the outliers were the ones responding „no‟, the analysis was impossible. The
following variables which met the assumptions for logistic regression were included
in the calculations (Table 6).
Sleeplessness, headaches requiring analgesia and feeling emotionally drained were all
dichotomised the same. Those who answered „never / occasionally‟ were taken as
those not concerned with these aspects of stress and burnout and those who answered
„once or twice a week‟, „three or four times a week‟, „five to six times a week‟ and
„daily‟ were taken as those experiencing these aspects. Stress requiring treatment was
dichotomised into the categories „yes‟ and „no‟. The „never‟ answer was placed into
the „no‟ category and the „yes‟ category was taken as those who answered „once a
year‟, „once every six months‟, „once every three months‟, „once a month‟, „once
every few weeks‟, „once a week‟ and „daily‟.

124
“Mental health” leave was dichotomised into the categories „yes‟ and „no‟. The
„never‟ answer was placed into the „no‟ category and the „yes‟ category was taken as
those who answered „once‟, „twice‟, „three to ten times‟, „11 to 29 times‟, „30 to 49
times‟ and „50 to 100 times‟. Length of depression was dichotomised into the
categories „yes‟ and „no‟. The „never‟ answer was placed into the „no‟ category and
the „yes‟ category was taken as those who answered „for one hour‟, „for one day‟, „for
two weeks‟, „for a month‟, „for a year‟ and „for a few years‟.
Wanting to change area of practice and loss of empathy for colleagues and clients
were dichotomised into the categories „yes‟ and „no‟. Those who answered
„sometimes‟ and „unsure‟ were not included in the analysis. Apathy and difficulty
slowing down were dichotomised into the categories „yes‟ and „no‟. Those who
answered „never‟ were placed into the „no‟ category and those who answered
„occasionally‟, „frequently‟, „most of the time‟ and „always‟ were placed into the „yes‟
category.

125
Table 6 Dichotomous Dependent Variables for Logistic Regression
Subscale- Work
Environment
(Stress) Category-
Occupational
Stress
Subscale-
Psychosocial
Effects (Stress)
Category- Stress
Related to Ill
Health
Subscale- Job
Satisfaction
(Stress)
Category-Job
Compatibility
Subscale-
Exhaustion
(Burnout)
Category-
Prolonged
Exposure to Stress
Subscale-Pressure
and Motivation
(Individual
responses)
Category-Work
Behaviours such as
Self-imposed
Work Pressure
and Motivation
Time management-
workload (contained
outliers)
Sleeplessness in
relation to work
Suited to work
(contained outliers)
Apathy (outliers
removed)
Achieving more than
time allows (contained
outliers)
Rush to complete tasks
(contained outliers)
Headaches requiring
analgesia
Enjoy work (contained
outliers)
Low morale
(contained outliers)
Unreasonable
expectations
(contained outliers)
Finish work late
(contained outliers)
Stress requiring
treatment
Wanting to change
area of practice
Powerlessness
(contained outliers)
Irritability (contained
outliers)
Organisational support
(contained outliers)
Mental health leave Leave professional
discipline (contained
outliers)
Feeling undervalued
(contained outliers)
Pushed for time
(contained outliers)
Length of depression Incidence of job
dissatisfaction
(contained outliers)
Feeling overwhelmed
(contained outliers)
Difficulty slowing
down
Feelings of
incompetence
(contained outliers)
Working at high
performance
(contained outliers)
Fatigue (contained
outliers)
Keyed up (contained
outliers)
Feeling emotionally
drained
Multi-tasking
(contained outliers)
Loss of empathy for
colleagues
Loss of empathy for
clients

126
The overall levels of stress, burnout and individual responses were also dichotomised
according to low, moderate and high categories (see Chapter 4, section 1.2.). Low was
dichotomised into the „low‟ or „low self-imposed work pressure and motivation‟
category and moderate and high were dichotomised into the „high‟ or „high self-
imposed work pressure and motivation‟ category.
The categorical predictor (independent) variables that were used with questions
included employment status, qualifications and living arrangement. The continuous
predictor (independent) variables that were used with these questions were age, hours
worked and years in profession. For each question, the employment status,
qualifications and living arrangement were all placed into the logistic regression
calculation as well as either age, hours worked or years in profession. These
demographics might be considered as potential confounding factors when
investigating stress and burnout (Makinen et al., 2003). These predictors (independent
variables) were placed into the calculation separately. So for each question there were
exactly four independent variables (three categorical and one continuous). This
scenario is an ideal calculation for logistic regression (Field, 2005).
The categorical predictor (independent) variables were coded dichotomously. The
independent variable, „employment status‟ was already coded and grouped by the
researcher into three categories. These categories were: permanent fulltime,
permanent part-time and casual. They were then grouped as either permanent fulltime
or not working fulltime (dichotomous answers). Permanent fulltime was classed as
fulltime and the categories permanent part-time and casual were classed as not
working fulltime. The 44 respondents who answered this question permanent only,
without indicating whether they worked fulltime or part-time, were not included in the
dichotomous calculation.
The categorical predictor variable „qualifications‟ was coded as possessing a degree or
not possessing one. The original categories were: hospital certificate, diploma or
degree. The categories hospital certificate and diploma were classified as not
possessing a degree. The predictor variable „living arrangement‟ was categorised as

127
either living alone or not living alone. The continuous predictor variables, hours
worked and years in profession were placed into SPSS as they were, and age as years.
All calculations used the forward stepwise likelihood ratio method initially to define a
model containing only the constant (Field, 2005). A stepwise method is appropriate
for explorative studies, rather than theory testing (as this study is an exploratory
study). A predictor is then selected which best predicts the dependent (outcome)
variable (Field, 2005). The N (sample size) value for each of the calculations
(including those in Appendix 6) ranges from 298 to 508 (total sample size 562)
because the forward stepwise method chooses a subset of predictors which best
provides the predictive power (Pallant, 2005).
The predictor is selected which correlated best with the dependent variable. If this
significantly improves the prediction, the predictor is retained and a second predictor
is chosen which has the biggest semi-partial correlation with the dependent (outcome)
variable. For example, the first predictor might explain 30 per cent of variation in the
dependent outcome variable, which leaves 70 per cent unexplained. The second
predictor is chosen which explains the biggest part remaining (70%). The predictor
accounting for the newest variance is added towards the model. If it makes a
substantial contribution to the model‟s power, the predictor is retained and a new
predictor is considered (Field, 2005).
Multicollinearity for logistic regression
All of the independent (predictor) variables were checked for high inter-correlations
which would mean multicollinearity existed, posing a problem for logistic regression.
Multicollinearity exists if the predictors in a regression model show strong
correlations between them. A high collinearity level increases the probability that the
good predictors of the outcome might be found non-significant, thereby being
abandoned from the model (known as Type 2 error, believing there is no effect when
in reality there is). Low collinearity levels pose no threat to logistic regression models
but if predictors show strong correlations (above 0.8) it is difficult to assess which
predictor is important (Field, 2005). These variables were related somehow to the
dependent (outcome) variables but not to each other. Variance inflation factors predict

128
strength of relationship between the predictor independent variables (Field, 2005).
Variance inflation factor values should not be greater than 10 (Myers, 1990).
Tolerance levels are related to the variance inflation factor, being its reciprocal
(1/VIF) (Field, 2005). All tolerance levels for a multicollinearity check should be
more than 0.1 (see Appendix 7) (Pallant, 2005).
3.5.4. Factor analysis
Factor analysis was calculated a priori for the pilot study and as a post hoc analysis to
statistically define subgroups for the questionnaire. It is vital to report a priori the
number of factors expected to emerge (Rattray & Jones, 2007). Factor analysis was
also calculated to establish construct validity for the questionnaire to confirm factorial
validity of underlying attributes or different questions on a scale. These questions are
usually related to a conceptual framework (Polit & Hungler, 1997). Pervin (1996)
states that factor analysis is exceedingly useful in determining groups or clusters of
items or behaviours that go together.
Hillhouse and Adler (1997) also used factor analysis as a way of examining factor
structures of individual items and reducing the variables to a more workable variable-
to-case ratio. Factor analysis is exploratory and used only to guide researchers about
patterns in the data (Field, 2005). Factor analysis can be considerably affected by a
few undifferentiated variables or questions (Hillhouse & Adler, 1997). Coffey (2000)
states that factor analysis could highlight areas of work with particular problems.
Field (2005) highlights that in social sciences attempts are often made to measure
things that cannot be directly measured (latent variables). Stress and burnout cannot
be measured directly: they have numerous facets (Field, 2005).
Instead of predicting an outcome or dependent variable as is done in logistic
regression, factor analysis works in the opposite direction. Factor analysis predicts an
independent variable calculated from underlying dimensions of dependent variables.
The existence of groups of high correlation coefficients between groups of variables
could mean that those variables might be measuring features of similar underlying
dimensions. These combinations of dependent variables or dimensions are identified
as factors (latent variables). By reducing an enormous data set from a cluster of

129
interconnected variables into a more concise set of factors, factor analysis shows
whether many variables clustered together reflect a single phenomenon. The analysis
achieves this by explaining the greatest amount of common variation in a correlation
pattern using the least amount of explanatory concepts. Factor loadings explain the
virtual contribution that a variable formulates to factor. Factor loadings can be both
regression co-efficients and correlation co-efficients (Field, 2005).
A. Sample size and factor loadings
Field (2005) reports that once factor indexing has been established, it is worthwhile to
choose which variables or questions belong to which factors. For a sample size of
600, a factor loading must be greater than a level of 0.21 and for 300, more than
0.298, based on alpha of 0.01 (two-tailed). Therefore, in larger samples, small
loadings could be statistically meaningful. For factor analysis to be reliable, it
depends on sample size (Field, 2005). Following an initial pilot study and
questionnaire development, the tool should be distributed to a sufficient sample size
(N > 100) to allow factor analysis to be performed (Rattray & Jones, 2007).
Field (2005) suggests that a researcher should have ten to 15 respondents per variable.
If this is true, the number of variables for this research was 52, and so the sample size
should be 520; so this research sample of 562 was appropriate. The value of the
significance of a factor loading is calculated by squaring the loading which gives an
estimate of amount of variance within a factor attributed to a variable. For example, if
a factor loading of 0.5 was squared (R-squared) this would explain 25 per cent of
variance within the variable. The significance of a factor loading shows little
indication of the importance of a variable to a factor (Field, 2005).
B. Assessing normality
An underlying assumption for factor analysis is that the variables used should be
normal distributions of scores (Rattray & Jones, 2007). The Kolmogorov-Smirnov
significance level assesses normality of the score distribution. A non-significant result
indicates normality (p>0.05) All of the variables used for this factor analysis had
significance levels of p<0.0001 indicating violation of this assumption of normality.
However, this is common in large samples (Pallant, 2005). A large sample of 200 or

130
more (this sample being 562) should be assessed for normality by a visual inspection
of the distribution rather than significance level (Field, 2005). This is supported by
inspection of normal probability plots (normal Q-Q Plots). The observed values are
plotted against expected values from a normal distribution. If a reasonably straight
line is displayed, this suggests a normal distribution (Pallant, 2005). These normal Q-
Q Plots for these distributions are displayed in Appendix 8 for each subscale and all
display relatively straight lines.
C. Methods used in factor analysis
Principal component analysis was used as a function of factor analysis. Both of these
techniques differ. Factor analysis produces a mathematical model, identifying factors.
Principal component analysis decomposes original data into sets of linear
relationships. Factor analysis estimates the underlying factors whereas principal
component analysis establishes which linear components are present within the data
and whether a specific variable might contribute to each component (Field, 2005).
The terms principal component analysis and factor analysis are frequently used
synonomously. In practice, principal component analysis is more often used. Rarely is
a tool uni-dimensional and principal component analysis identifies one principal
component which accounts for the majority of the variance (Rattray & Jones, 2007).
a. The Anderson-Rubin method
The first step involved checking for multicollinearity which was determined by the
Anderson-Rubin method. Prior to performing principal component analysis, this
assesses the data‟s suitability for using factor analysis (Pallant, 2005). The first part of
factor analysis involves looking at a correlation matrix to determine that the variables
correlate fairly well. This means that one needs to assess whether the variables are
very closely correlated, suggesting there are too many variables providing the same
information (Field, 2005).
The significance values should be less than 0.05 and there should be no correlation
coefficients greater than 0.9 which would indicate that the variables were measuring
the same factor. For factor analysis, variables should correlate, but not perfectly. So if
the correlations are too high, for example, larger than 0.9, this means that one of the

131
variables is redundant because they are measuring the same factor. The information is
overlapping because the information is already given elsewhere. The determinant
should be greater than 0.00001, indicating that multicollinearity was not a problem
(Appendix 7) (Field, 2005).
b. Sampling adequacy
Following this, the Kaiser-Meyer Olkin measure of sampling adequacy was
calculated. The Kaiser Meyer-Olkin measure of sampling adequacy operates by
determining a ratio of squared correlations between variables to squared partial
correlations between variables. This statistic ranges from 0 to 1. A value of 0 means
that the addition of partial correlations is large compared with the addition of
correlations signifying diffusion in the correlations‟ patterns. In this situation, factor
analysis is probably inappropriate. A value nearer to 1 signifies correlation patterns
which are compact. This situation shows that factor analysis yields reliable and
distinct factors (Field, 2005). Rattray and Jones (2007) state that the Kaiser Meyer-
Olkin measure detects if the correlations between the variables can be accounted for
according to a smaller factor set and should be higher than 0.5. Hutcheson and
Sofroniou (1999) state that Kaiser Meyer-Olkin
values between 0.5 and 0.7 are mediocre, values
between 0.7 and 0.8 are good, values between 0.8
and 0.9 are great and values above 0.9 are superb
(Hutcheson & Sofroniou, 1999, pp. 224-225).
The following table (Table 7) displays levels of sampling adequacy for each theme
and subscale.
Table 7 Kaiser-Meyer Olkin Measure of Sampling Adequacy
Theme Subscale Measure Accepted Interpretation
Stress
Work environment 0.869 Very good
Psychosocial effects
Job satisfaction
Burnout Exhaustion 0.848 Very good
Individual Responses Pressure and motivation 0.815 Very good

132
c. The Bartlett method
The Bartlett method was used to ensure there were some relationships between
variables (Field, 2005). The Bartlett Test of Sphericity is based on the chi-square test
which is a significant and large test used to designate discoverable relationships
(Rattray & Jones, 2007). Factor analysis can work only if there are some relationships
between the variables. A significant Bartlett test (less than 0.05) ensures that the R-
matrix does not resemble an identity matrix because if it did, all coefficients would be
equal to 0. If the Bartlett test is significant, factor analysis is therefore appropriate
(Field, 2005).
d. Inspection of anti-image correlation matrix
Inspection of an anti-image correlation matrix should reveal all variables running
diagonally to have a value of at least 0.5, an important part of factor analysis as it
identifies problematic variables. If any are below 0.5 exclusion from the analysis
might be appropriate. The off-diagonal elements of this anti-image correlation matrix
represent partial correlations between the variables and should be very small (Field,
2005).
e. Factor extraction
Two principal methods are used when deciding upon number of factors, Kaiser‟s
criterion for factors with eigenvalues of more than 1 and the scree test (Rattray &
Jones, 2007). The aim of factor analysis is to find a solution with as few factors as
possible; explaining as much of the variance in the data as possible (Pallant, 2005).
e. (i.) Kaiser’s criterion
Factor extraction determines which factors to retain by using Kaiser‟s criterion
to extract eigenvalues greater than 1 (Rattray & Jones, 2007). The eigenvalue
represents the amount of total variance explained by that factor and the
importance of each individual factor (Field, 2005; Pallant, 2005).

133
e. (ii.) Scree test
Subsequent to this, Cattell‟s (1966) scree plot graph was used. The scree plot
graph is fairly reliable for factor selection with more than 200 respondents and
was used in this research sample of 562. The graph plots each eigenvalue (Y-
axis) against the associated factor (X-axis). The scree plot gives a cut-off point
of inflexion for selecting factors. The number of factors can be selected in this
way (Field, 2005). Retaining factors above the elbow in the plot contributes
most to the explanation of the variance in the data (Cattell, 1966). The
eigenvalues for each factor represent a percentage of total variance (Field,
2005).
f. Communalities
Following factor extraction, common variance is better demonstrated and
communalities are a percentage of variance explaining the underlying factor. To do
factor analysis and discover underlying dimensions, it is essential to discover common
variance. These are the variances for each question which are explained by the
retained factor. Communality values can be calculated for each variable. Once
underlying factors are extracted, new communalities are calculated representing
multiple correlations between variables and factors extracted. This is done by alpha
factoring which uses squared multiple correlations of each variable compared to all
the other variables. The communalities are a percentage of variance explaining the
underlying factor (Field, 2005).
g. Inspection of component matrix
Inspection of a component matrix displays contributory loadings of variables onto
each factor before rotation and values less than 0.4 were suppressed (option in SPSS).
This is suitable for interpretive purposes as loadings higher than 0.4 denote
substantive values. This means suppressing loadings that are significant. However,
significance of loadings provides little indication of substantive importance of each
variable to a factor, and significance itself is unimportant (section 3.5.4. A.) (Field,
2005). Stevens (1992) recommends interpretation of factor loadings greater than 0.4
explaining approximately 16 per cent of variance in a variable (section 3.5.4. A.).

134
h. Residuals
The next step of factor extraction involved looking at residuals. Residuals are
calculated between reproduced and observed correlations. If these residual values are
large, the model reproduced does not fit the observed data properly and
generalisations cannot be made beyond the sample. Any conclusions reached must
then be restricted to the sample being used. There are no set rules in factor analysis
about what residual proportions should be but the percentage of residuals with values
over 0.05 ought to be less than 50 percent to make a generalisation beyond that
sample (Field, 2005).
i. Factor rotation
To assist in interpretation of these factors, the last step involved factor rotation. Factor
rotation assists in making sense of the projected factor structure (Rattray & Jones,
2007). It does not alter the underlying solution but assists in identification of the
underlying theme represented by each factor by looking at the variable with the
highest loading on each factor. It makes interpretation easier than before rotation, as
variables are ordered by loading size (Pallant, 2005). Factor rotation ensures that
groups of variables are being intersected by a factor to which the variables most relate
(Field, 2005).
Two types of rotation exist: orthogonal and oblique rotation (Field, 2005). It is vital to
state which rotation method is being used before commencing an analysis (Rattray &
Jones, 2007). For orthogonal (varimax) rotation to be used, underlying factors are
regarded as being independent. In this situation, a factor loading is a correlation
between the variable and the factor as well as the regression coefficient. The
correlation coefficient values are the same values as the regression coefficients (Field,
2005).
Alternatively, there are circumstances in which underlying factors are regarded as
being correlated or related to each other. For example, the subscales psychosocial
effects of stress, exhaustion and pressure and motivation are all interrelated when
exploring concepts of individual responses to stress and burnout. In these
circumstances and for all calculations for this research, oblique rotation (direct
135
oblimin) was the type of rotation used. When oblique rotation is used, the factor
matrix splits into two matrices. The pattern matrix contains information about unique
contributions of variables to a factor and is preferable for interpretation. The structure
matrix shows the relationship between the factors and is produced from the pattern
matrix. It is a useful double-check as shared variances are not ignored (Field, 2005).
Orthogonal (varimax) rotation was used in two instances. This was done to compare
the results between oblique (direct oblimin) and orthogonal (varimax) rotations. If
oblique (direct oblimin) rotation resulted in stronger correlations, for example above
0.3, oblique rotation was the most accurate rotation to use, as it showed that the
variables were interrelated and not independent (Pallant, 2005). However, if the
components were independent, oblique (direct oblimin) would produce identical
results to orthogonal (varimax) rotation and the component transformation matrix
would be an identity matrix displaying all correlations as 0 (Field, 2005). In the two
instances where orthogonal (varimax) rotation was used for the oblique (direct
oblimin) correlation of less than 0.3, this was not the case, showing that they were
related in some way (Chapter 4, section 2.3.1., A. Tables 80, 81 & 82 & B. Tables 85,
86 & 87).
D. Factor scores
Factor scores can be added to obtain a single overall score for each respondent. The
measurement scales used influence resulting scores. If different variables use diverse
measurement scales, factor scores cannot be compared. Two of the subscales scores
were calculated by factor analysis and this was done by the Anderson-Rubin method;
this method ensures scores are uncorrelated (no multicollinearity). Only these two
subscales which used the same measurement scales were used to obtain factor scores
(Field, 2005).
a. Coding levels for major themes
The major themes were scored to provide an overall analysis relating to stress,
burnout and individual responses (Table 8). A low summary score (0 to 32) for stress
reflects the fact that respondents would have indicated nil / low stress or the frequency
of the question being „never‟ or „occasionally‟ to the majority of relevant questions in

136
the questionnaire. A total stress score of 33 to 64 indicated that the majority of scores
indicated „frequently‟ or „most of the time‟ for the relevant questions relating to
stress. A total score of 65 to 95 reflected the fact that the majority of scores were rated
as „always‟ or scored at a high level of stress.
A low summary score (2 to 13) for burnout reflects the fact that respondents would
have indicated „never‟ or „occasionally‟ or answers which identified the scenarios as
occurring least frequently to the majority of relevant questions in the questionnaire. A
total burnout score of 14 to 26 indicated that the majority of scores indicated
„frequently‟ or „most of the time‟ for the relevant questions relating to burnout. A total
score of 27 to 38 reflected the fact that the majority of scores were rated as „always‟
or scored at a high level of burnout. A low summary score (-3.51 to-1.0) for
individual responses reflects the fact that respondents would have indicated „never‟ or
„occasionally‟ or answers which identified the respondent as not self-imposing work
pressure upon themselves to the majority of relevant questions in the questionnaire. A
total individual response score of -0.9 to 1.5 indicated that the majority of scores
indicated „frequently‟ or „most of the time‟ for the relevant questions relating to
individual response or pressure and motivation. A total score of 1.6 to 5.7 reflected
the fact that the majority of scores were rated as „always‟ or scored as high levels of
self-imposed work pressure and motivation relating to individual responses.
Table 8 Scoring for Overall Themes
Theme Low Moderate High Overall
score
Stress 0-32 33-64 65-95 0-95
Burnout 2-13 14-26 27-38 2-38
Individual
responses
-3.51 to -1.00 -0.900 to 1.50 1.60 to 5.68 -3.50 to 5.68
The Maslach Burnout Inventory (Maslach & Jackson, 1981) also scored low,
moderate and high categories in relation to burnout. An example of scores for
depersonalisation includes: low, 0 to 6; moderate, 7 to 12 and high, 13 or over. The
three factors relating to stress which include the work environment, psychosocial
effects and job satisfaction were amalgamated to provide one overall score. These
three factors relating to stress were also scored separately to obtain information about

137
each individual subscale (see Tables 9, 11 & 12). The other single factors, exhaustion
which related to burnout, and pressure and motivation which related to individual
responses, were amalgamated to provide one overall score (as in Tables 10 & 13).
b. Coding levels for subscales
For the individual subscales work environment and pressure and motivation, factor
scores were obtained from each respondent for those questions relating to each of
these subscales (provided by SPSS version 14). Factor scores were used as each
question used the same scoring system. These individual scores were then categorised
as either low, moderate or high (Tables 9 & 10) and percentage results for the entire
sample of nurses and midwives (Chapter 4, section 1.2.1. A. & 1.2.3.) were then
calculated for the subscales, being work environment and pressure and motivation.
(Raw scores and not factor scores were used to obtain overall stress scores as
displayed in Table 8).
Table 9 Scoring Levels for Work Environment Subscale
Levels for work environment Score
Low stress -2.49 to -1.00
Moderate stress -0.90 to 1.50
High stress 1.60 to 3.17
Overall score -2.49 to 3.17
Table 10 Scoring Levels for Pressure and Motivation Subscale
Levels for self-imposed work pressure and motivation Score
Low self-imposed work pressure and motivation -3.51 to -1.00
Moderate self-imposed work pressure and motivation -0.90 to 1.50
High self-imposed work pressure and motivation 1.60 to 5.68
Overall score -3.5 to 5.68
The remaining subscales were psychosocial effects of stress, job satisfaction and
exhaustion. Factor scores were not used for these three subscales as questions in each
subgroup used different scoring systems (Table 14). For each respondent, an
individual subset of measures was included in an overall score to produce subscale
results (Chapter 4, section 1.2.1. B. C. & 1.2.2.) for the entire sample. Each
individual‟s scores were added for those particular questions relating to that subscale
and then this individual overall score was scored as low, moderate or high (Tables 11,
12 & 13). Percentages were then calculated for the entire sample of nurses and

138
midwives for the subscales psychosocial effects of stress, job satisfaction and
exhaustion.
Measurements of these factor scores are given in Tables 11, 12 and 13. As stated
previously, Field (2005) states that factor analysis is exploratory and only used to
guide researchers about patterns in the data. He recommends making informed
decisions about the outcomes. The questions were subgrouped according to particular
themes for factor analysis and then evaluated and changed (adding and deleting
questions) until reliability was established for factor scores (Appendix 9).
Table 11 Scoring Levels for Psychosocial Effects of Stress Subscale
Level for psychosocial effects subscale Score
Minimal psychosocial effects of stress 6-21
Moderate psychosocial effects of stress 22-38
Excessive psychosocial effects of stress 39-54
Overall score 6 to 54
Table 12 Scoring Levels for Job Satisfaction Subscale
Level for job satisfaction subscale Score
High satisfaction 0-6
Moderately satisfied 7-14
Dissatisfied 15-21
Overall score 0 to 21
Table 13 Scoring Levels for Exhaustion Subscale
Levels for exhaustion Score
Low exhaustion 2-13
Moderate exhaustion 14-26
High exhaustion 27-38
Overall score 2 to 38
E. Development of questionnaire’s subscales using factor analysis
As in the pilot study (with some questions deleted and moved into different
subscales), the first part of the questionnaire used for the main study included 37
questions relating to stress and burnout within the nursing and midwifery profession.
The second part of the questionnaire included 15 questions focusing on individual
responses to workplace issues and how an individual might react in a specific
situation. There is a growing consensus about the need to measure the perceived
139
frequency of incidence of stress-related episodes in the workplace or, in other words,
the perceived frequency of occurrence and severity of stressful events in workplaces
(Vagg & Spielberger, 1999).
The pilot study‟s results initiated the development of the relevant subscales (see
Tables 3 & 4, section 2.3.3. B. & 2.3.4.). All subscales except job satisfaction were
modified for the main study following factor analysis as only those questions which
were reliable were used. Specific indices were used for the subscales (Table 14). All
questions were subgrouped according to the conceptual framework and those
questions which related to each subscale were added for each respondent to give an
overall individual score (Table 14). This score was then coded as in Tables 11, 12 and
13 to give an overall percentage of that subscale for the entire sample of nurses and
midwives. Factor analysis was the basis for developing the conceptual or theoretical
framework throughout this thesis. The following demonstrates how each subscale
relates to individual responses to different aspects of stress and burnout:
Work environment relates to occupational stress
Psychosocial effects relate to stress leading to ill health
Job satisfaction relates to job compatibility
Exhaustion relates to prolonged exposure to stress
Pressure / motivation relates to work behaviours such as self-imposed work
pressure and motivation

140
Table 14
Stress, Burnout and Individual Response Subscales / Indices for Main Study
Major theme Category Subscale Questions Indices
Stress
Occupational
stress
Work environment-
5-item scale
Used factor scores for
overall scores from stress
theme as all indices are the
same
Incidence of stress
Time management- workload
Rush to complete tasks
Finishing late
Organisational support
Factor
Scores
used
(SPSS)
Stress leading to
ill health
Psychosocial effects-
9-item scale
Overall score 6 to 54
Experiencing increased anxiety
Sleeplessness over past decade
Depression over past decade
Sleeplessness over past week
Headaches requiring analgesia
Stress requiring treatment
Mental health leave
Helplessness over past decade
Length of depression
1-6
1-6
1-6
1-5
1-5
0-7
0-6
1-7
0-6
Job compatibility Job satisfaction-
5-item scale
Overall score 0 to 21
Being suited to the work
Enjoying the type of work
Wanting to change area of practice
Leave professional discipline
Frequency of job dissatisfaction
0-4
0-4
0-3
0-3
0-7
Burnout Prolonged
exposure to
stress
Exhaustion-
10-item scale
Overall score 2 to 34
Apathy
Experiencing low morale
Feeling powerless
Feeling undervalued
Feeling overwhelmed
Feelings of incompetence
Fatigue
Feeling emotionally drained
Loss of empathy for colleagues
Loss of empathy for clients
0-4
0-4
0-4
0-4
0-4
1-5
1-5
0-2
0-2
0-2
Individual
Responses
Work behaviours
such as self-
imposed work
pressure &
motivation
Pressure / motivation-
8-item scale
Used factor scores for
overall scores as all indices
are the same
Achieving more than time allows
Unreasonable expectations on self
Irritability
Pushed for time
Difficulty slowing down for
procedures
Working at high performance
Keyed up on most days
Multi-tasking
Factor
Scores
used
(SPSS)
Begat, Ellefsen and Severinsson (2005) used factor analysis to explain their sample
responses, condense their items to focus on pertinent themes and address construct
validity. This framework relates to a set of five subgroups or classifications of
different aspects of individual responses to stress and burnout workplace issues based
on the questionnaire used for this research project. The conceptual or theoretical
framework for this particular study encompasses the five subscales which were work

141
environment, psychosocial effects of stress, job satisfaction, exhaustion, and pressure
and motivation. These five subscales, then are a way of determining and assessing
individual responses to stress and burnout workplace issues for respondents instead of
an overall score from many variables within the questionnaire.
F. Reliability analysis
Cronbach‟s alpha (α) was calculated on all questions to determine reliability for the
questionnaire on the sample of 562 nurses and midwives (Appendix 10). Cronbach‟s
alpha, is a measure of internal consistency or split-half reliability (Field, 2005). Split-
half reliability is assessed by adding up all the odd scores and then the even scores
from the same respondent and comparing those two scores. If they are similar, they
have a high level of split-half reliability which yields internal consistency (Dempsey
& Dempsey, 1992).
To determine reliability, the corrected-item correlations are calculated between each
individual item and the overall total score from the questionnaire. These correlations
should be at least 0.3. With bigger sample sizes, smaller correlations are acceptable. If
there are very low correlation coefficients, these items do not correlate with the total
scale overall. If values for each question are greater than the alpha level overall, these
items are deemed unreliable and might then be deleted to improve reliability (Field,
2005). All questions in this questionnaire which pertain to these criteria can be seen in
Appendix 10. As a few of these questions were unreliable, no inferential but only
descriptive statistics were computed (see Appendix 11).
As factor analysis was used for construct validity in this research, overall reliability of
the questionnaire was assessed and determined by Cronbach‟s alpha, for each of the
five subscales (Appendix 9). The variables relating to each of the subscales (as in
Table 14) as well as the overall addition of scores (as in Tables 11, 12 & 13) relating
to each subscale were assessed (acceptable levels being 0.7 or higher) (Field, 2005).
Field (2005) recommends that reliability analysis be conducted on subscales
individually. For each of the subscales, correlations between variables were evaluated
and a reliable scale shows all variables correlating with the overall tally from the
questionnaire.

142
Kline (1999) highlights that values below 0.7 can be expected when measuring
psychological constructs because of their diversity. This might be an indication that
the data aggregated for these particular questions were multi-dimensional, not uni-
dimensional. While 0.7 is a preferred minimum level for reliability, 0.65 is acceptable
for surveys (Dorz et al., 2003). Skipper, Jung and Coffey‟s (1990) health scale had a
reliability level of 0.671. A Cronbach alpha level of 0.6 to 0.64 might be considered
acceptable (Boey, 1996).
For the first subscale, variables relating to the work environment (Appendix 9), the
overall Cronbach α reliability level was 0.759 which was good. None of the
correlations between variables were less than 0.3 and the only value which was bigger
than the overall Cronbach α reliability level was 0.781 for organisational support,
which would not alter the overall reliability substantially, so if this variable were
deleted, the overall Cronbach α reliability level would be 0.781. For the second
subscale, variables relating to psychosocial effects (Appendix 9), the overall
Cronbach α reliability level was 0.794 which was good. None of the correlations
between variables were less than 0.3 and none of the values were bigger than the
overall Cronbach α reliability level. For the third subscale, variables relating to job
satisfaction (Appendix 9), the overall Cronbach α reliability level was 0.681 which
was acceptable. None of the correlations between variables were less than 0.3 and the
only value which was bigger than the overall Cronbach α reliability level was 0.719
for job dissatisfaction, which would not alter the overall reliability substantially.
For the fourth subscale, variables relating to exhaustion (Appendix 9), the overall
Cronbach α reliability level was 0.793 which was good. One of the correlations
between variables was less than 0.3, but given this was a large sample, is acceptable.
This was loss of empathy for colleagues and the correlation was 0.29, which is only
slightly lower than 0.3 and the overall Cronbach α reliability level for this variable
was 0.795, which was slightly bigger than the overall Cronbach α reliability level
(0.793) which would not alter the overall reliability substantially. The other variable
which was bigger than the overall Cronbach α reliability level (0.793) was 0.796 for
fatigue, which would not alter the overall reliability substantially. For the fifth
subscale, variables relating to pressure and motivation (Appendix 9), the overall
143
Cronbach α reliability level was 0.772 which was good. None of the correlations
between variables were less than 0.3 and the only value which was bigger than the
overall Cronbach α reliability level was 0.773 for working at high performance, which
would not alter the overall reliability substantially (Field, 2005).
Reliability was also assessed on the 19 questions relating to the stress theme. The
overall Cronbach α reliability level was 0.843 which was very good. Two of the
correlations between variables were less than 0.3 but, given this was a large sample, is
acceptable. These variables were „finishing work late‟ and „thinking they are suited to
the work‟ and correlations were 0.236 and 0.281 respectively, which is only slightly
lower than 0.3 and the overall Cronbach α reliability level for these variables was
0.843 and 0.842 respectively, which was not bigger than 0.843. None of the other
values were bigger than the overall Cronbach α reliability level (Appendix 9). (As the
questions for burnout and individual response themes were the same as the exhaustion
and pressure and motivation subscales, reliability was already assessed in factor
analysis). The overall addition of these theme scores were then analysed for strength
of associations (Spearman‟s correlations).
Reliability was also calculated on all subscales according to the overall addition of
scores (see Tables 11, 12 & 13). (Work environment and pressure and motivation
subscales were analysed by way of raw scores, not factor scores). For all subscales,
the overall Cronbach α reliability level was 0.744 which was good. None of the
correlations between variables were less than 0.3 and none of the values were bigger
than the overall Cronbach α reliability level (Appendix 9). The overall addition of
these subscale scores were then analysed for strength of associations (Spearman‟s
correlations).
MacLellan (1990) states that burnout is a multi-dimensional phenomenon resulting
from pressures at numerous levels. Brenninkmeijer and VanYperen (2003) state that
the multidimensionality of burnout is widely acknowledged. They state that
researchers might want to investigate which variables are related to burnout.
Researchers might also wish to combine the overall notion of burnout into one
underlying dimension (Brenninkmeijer & VanYperen, 2003).

144
3.5.5. Group comparisons
Kruskal-Wallis test
The Kruskal-Wallis test was used to detect group differences. Each person contributes
to one cell of a contingency table and measures must be independent of each other.
The frequency data or the numbers of respondents for the categorical dependent
variable must contain three or more categorical groups. There must be an independent
continuous variable (Pallant, 2005). All Kruskal-Wallis calculations presented as part
of this project satisfy these above assumptions.
The categorical groups which were compared were within the area of practice and
these groups were classified as the predominant area of work. This test shows
differences exist, but it does not show where the differences are situated (Field, 2005).
Instead of comparing the medians of the groups, this test compares means. This test
shows which highest ranking corresponds to one highest score on the continuous
variable. The test includes two variables. The variables include a categorical variable
which contains three or more groups (the specialty) and a continuous variable (age,
hours worked) (Pallant, 2005). The predominant areas of work are displayed in Table
16, Chapter 4, section 1.1.1. C.
3.6 Overview
The questionnaire used in this research will provide methodologically valid
information on variables of individual responses to stress and burnout workplace
issues for Australian nurses and midwives who are currently working in the health
field. The statistical part of this thesis will elaborate on these issues surrounding the
work environment, psychosocial issues, job satisfaction, exhaustion and self-imposed
work pressure and motivation. The literature review encompassed all the findings
associated with these issues, including sources of stress, results of stress, coping
strategies and the dimensions and variables of stress and burnout. Other issues involve
comparison of different areas of nursing, other health professionals and other
occupations, professionals‟ fear of appearing weak if seen to be stressed, detectors of
stress, individual behavioural differences and reactions to stress.

145
Chapter 4
Results
In this chapter the major findings of the questionnaire will be presented to facilitate
the analysis of the questionnaire response data. This will include an overall account of
the major themes of individual responses to stress and burnout. The five main
subscales developed from factor analysis, as detailed in the previous methods section,
form the basis for the key concepts guiding this study, which are links between work
environment, psychosocial effects of stress, job satisfaction, exhaustion, and pressure
and motivation. These five subscales are pertinent factors in nurses‟ and midwives‟
stress and burnout levels and relates to individual responses to workplace issues
which will now be presented in finer detail in this chapter.
The presentation of relevant data will be divided into two sections. The first section
will provide information on demographics and responses to the questionnaire using
univariate descriptive statistics. Demographics will provide an overview or
description of this sample of nurses and midwives including area of practice, age of
respondents, hours worked and years in profession. Individual responses to stress and
burnout in relation to the questionnaire will outline variables such as anxiety,
depression, helplessness, fatigue and irritability.
The second section will employ a range of multivariate statistical analyses to identify
associations or relationships in the data, predict outcomes, signpost important
indicators of individual responses to stress and burnout, and detect group differences.
1. Univariate descriptive statistics
1.1. Sample characteristics
There were 1365 respondents in this study‟s sample population. The seven
respondents who worked in countries other than Australia were removed, with a final
sample of 1358. Five-hundred and sixty-two respondents returned completed
questionnaires yielding a response rate of 41.4 per cent. The registered nurses and
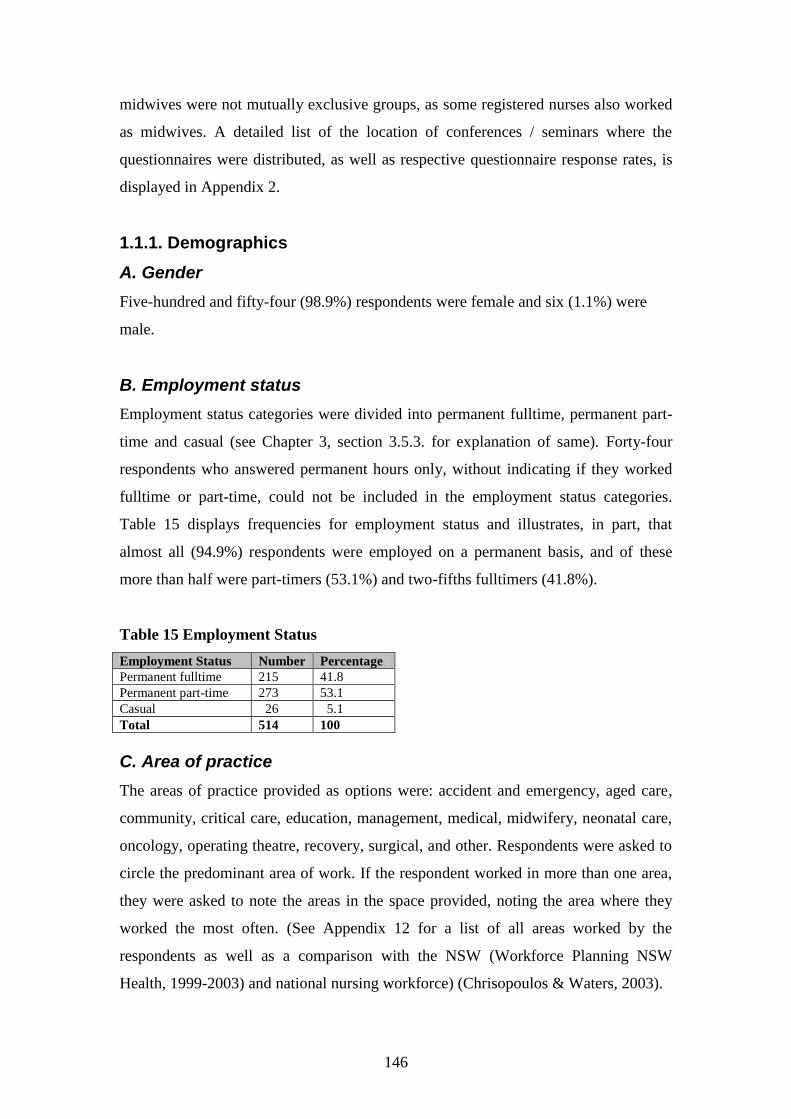
146
midwives were not mutually exclusive groups, as some registered nurses also worked
as midwives. A detailed list of the location of conferences / seminars where the
questionnaires were distributed, as well as respective questionnaire response rates, is
displayed in Appendix 2.
1.1.1. Demographics
A. Gender
Five-hundred and fifty-four (98.9%) respondents were female and six (1.1%) were
male.
B. Employment status
Employment status categories were divided into permanent fulltime, permanent part-
time and casual (see Chapter 3, section 3.5.3. for explanation of same). Forty-four
respondents who answered permanent hours only, without indicating if they worked
fulltime or part-time, could not be included in the employment status categories.
Table 15 displays frequencies for employment status and illustrates, in part, that
almost all (94.9%) respondents were employed on a permanent basis, and of these
more than half were part-timers (53.1%) and two-fifths fulltimers (41.8%).
Table 15 Employment Status
Employment Status Number Percentage
Permanent fulltime 215 41.8
Permanent part-time 273 53.1
Casual 26 5.1
Total 514 100
C. Area of practice
The areas of practice provided as options were: accident and emergency, aged care,
community, critical care, education, management, medical, midwifery, neonatal care,
oncology, operating theatre, recovery, surgical, and other. Respondents were asked to
circle the predominant area of work. If the respondent worked in more than one area,
they were asked to note the areas in the space provided, noting the area where they
worked the most often. (See Appendix 12 for a list of all areas worked by the
respondents as well as a comparison with the NSW (Workforce Planning NSW
Health, 1999-2003) and national nursing workforce) (Chrisopoulos & Waters, 2003).
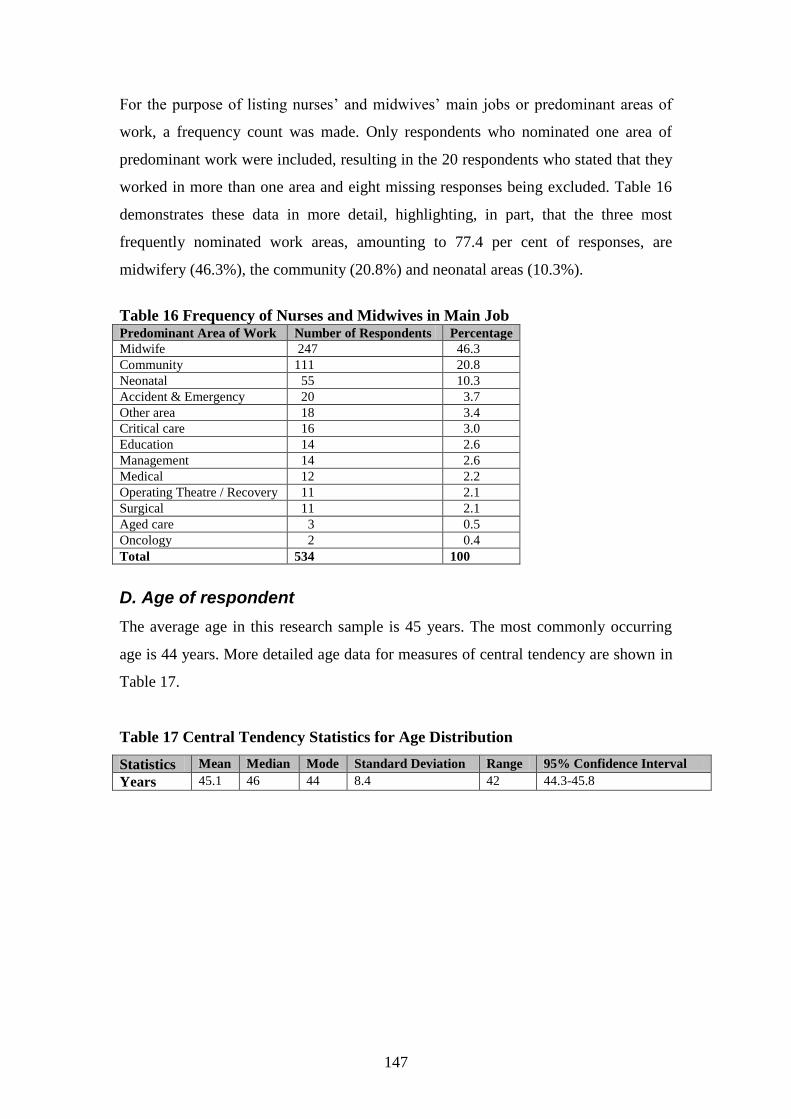
147
For the purpose of listing nurses‟ and midwives‟ main jobs or predominant areas of
work, a frequency count was made. Only respondents who nominated one area of
predominant work were included, resulting in the 20 respondents who stated that they
worked in more than one area and eight missing responses being excluded. Table 16
demonstrates these data in more detail, highlighting, in part, that the three most
frequently nominated work areas, amounting to 77.4 per cent of responses, are
midwifery (46.3%), the community (20.8%) and neonatal areas (10.3%).
Table 16 Frequency of Nurses and Midwives in Main Job Predominant Area of Work Number of Respondents Percentage
Midwife 247 46.3
Community 111 20.8
Neonatal 55 10.3
Accident & Emergency 20 3.7
Other area 18 3.4
Critical care 16 3.0
Education 14 2.6
Management 14 2.6
Medical 12 2.2
Operating Theatre / Recovery 11 2.1
Surgical 11 2.1
Aged care 3 0.5
Oncology 2 0.4
Total 534 100
D. Age of respondent
The average age in this research sample is 45 years. The most commonly occurring
age is 44 years. More detailed age data for measures of central tendency are shown in
Table 17.
Table 17 Central Tendency Statistics for Age Distribution
Statistics Mean Median Mode Standard Deviation Range 95% Confidence Interval
Years 45.1 46 44 8.4 42 44.3-45.8

148
As respondents were invited to write their actual age in years, a number of age
categories were selected to display their answers (Table 18). These age categories
were chosen to facilitate future comparison for national statistics (Chapter 5, section
1.2.4.). Table 18 shows in part that the highest concentration (46.8%) in age groups in
the sample is between 40 to 49 years of age.
Table 18 Age Categories Age in
years
<25 25-
29
30-
34
35-
39
40-
44
45-
49
50-
54
55-
59
60-
64
65-
69
Total
Number 6 23 37 62 113 145 98 51 16 1 552
Percentage 1.1 4.2 6.7 11.2 20.5 26.3 17.7 9.2 2.9 0.2 100
E. Hours worked per week
The average number of hours worked per week in this study is 34.5 hours. The most
commonly occurring number of hours worked per week is 40 hours. More detailed
hours worked data for measures of central tendency are shown in Table 19.
Table 19 Central Tendency Statistics for Hours Worked per Week Distribution
Statistics Mean Median Mode Standard Deviation Range 95% Confidence Interval
Hours 34.5 36 40 10.6 84 33.6-35.4
As respondents were invited to write their actual hours worked per week, a number of
hours categories were selected to display their answers (Table 20). Table 20 highlights
that over four-fifths (83.1%) of respondents worked between 20 to 44 hours per week.
Table 20 Hours Worked per Week Hours
worked
1-9 10-
19
20-
29
30-
37
38-
44
45-
49
50-
59
60-
69
70 &
over
Total
Number 6 23 125 134 205 24 29 5 7 558
Percentage 1.1 4.1 22.4 24 36.7 4.3 5.2 0.9 1.3 100
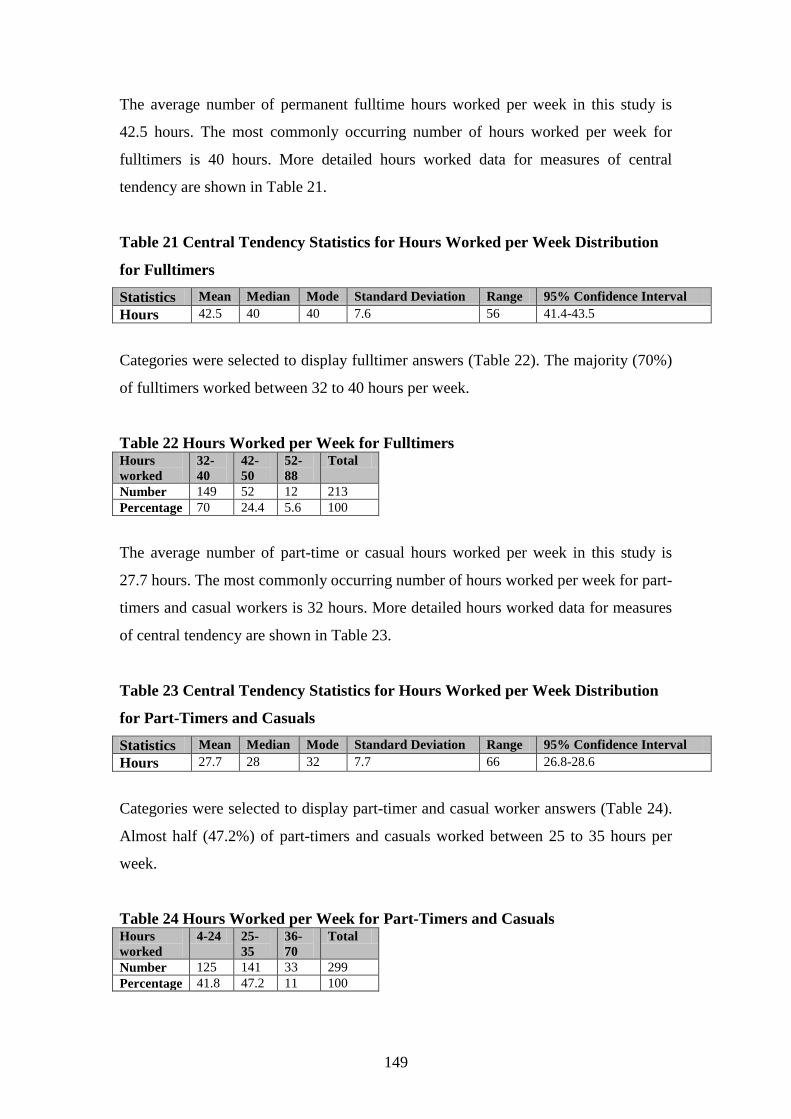
149
The average number of permanent fulltime hours worked per week in this study is
42.5 hours. The most commonly occurring number of hours worked per week for
fulltimers is 40 hours. More detailed hours worked data for measures of central
tendency are shown in Table 21.
Table 21 Central Tendency Statistics for Hours Worked per Week Distribution
for Fulltimers
Statistics Mean Median Mode Standard Deviation Range 95% Confidence Interval
Hours 42.5 40 40 7.6 56 41.4-43.5
Categories were selected to display fulltimer answers (Table 22). The majority (70%)
of fulltimers worked between 32 to 40 hours per week.
Table 22 Hours Worked per Week for Fulltimers Hours
worked
32-
40
42-
50
52-
88
Total
Number 149 52 12 213
Percentage 70 24.4 5.6 100
The average number of part-time or casual hours worked per week in this study is
27.7 hours. The most commonly occurring number of hours worked per week for part-
timers and casual workers is 32 hours. More detailed hours worked data for measures
of central tendency are shown in Table 23.
Table 23 Central Tendency Statistics for Hours Worked per Week Distribution
for Part-Timers and Casuals
Statistics Mean Median Mode Standard Deviation Range 95% Confidence Interval
Hours 27.7 28 32 7.7 66 26.8-28.6
Categories were selected to display part-timer and casual worker answers (Table 24).
Almost half (47.2%) of part-timers and casuals worked between 25 to 35 hours per
week.
Table 24 Hours Worked per Week for Part-Timers and Casuals Hours
worked
4-24 25-
35
36-
70
Total
Number 125 141 33 299
Percentage 41.8 47.2 11 100

150
F. Years in profession
The average number of years in profession in this research sample is 22 years. The
most commonly occurring number of years in the profession is 30 years. More
detailed years in profession data for measures of central tendency are shown in Table
25.
Table 25 Central Tendency Statistics for Years in Profession Distribution
Statistics Mean Median Mode Standard Deviation Range 95% Confidence Interval
Years 22.1 24 30 9.7 48 21.3-22.9
Respondents were invited to write actual years in their profession (Table 26). These
categories were chosen to facilitate viewing the results. The highest concentration
(41%) of respondents have been in the profession for 21 to 30 years. Similar
proportions of nurses and midwives have spent less than 11 years or more than 30
years in the profession (17.3% and 15.8% respectively).
Table 26 Years in Profession
Years in
Profession
0-10 11-20 21-30 31-40 41 & over Total
Number 96 144 228 83 5 556
Percentage 17.3 25.9 41 14.9 0.9 100

151
G. Qualifications
The respondents were given three options for highest qualifications achieved. These
included hospital certificate/s, diploma/s and degree/s. The degree category included
Masters and PhD levels. The following pie graph (Figure 4) shows the largest
proportion (47%) held a degree, followed by a hospital certificate (31%) and then a
diploma (22%).
Figure 4 Qualifications of Study Sample
Qualifications N=557
Hospital
certificate, 171,
31%
Diploma, 123,
22%
Degree, 263,
47%
H. Living arrangements
The majority (88%) of respondents did not live alone. Seventy-four per cent of
respondents lived with their partners; 72 per cent lived with their children, including
those aged 18 and over; nine per cent lived with others including dependent parents,
flatmates, grandchildren and siblings; and four per cent lived with parents. These
groups were not mutually exclusive.
1.2. Stress, burnout and individual responses
This section highlights pertinent aspects of individual responses to stress and burnout
for this sample of nurses and midwives and how they deal with these issues. This

152
information will provide an insight into how nurses and midwives react in different
situations. It also highlights the frequency and duration of stress-related issues in the
workplace and provides information on job satisfaction. It includes a snapshot of how
the nurses and midwives are affected by way of the symptoms of stress and burnout in
their personal lives.
The three essential themes that are to be highlighted include stress, burnout and
individual responses as well as incorporating the five subscales identified by factor
analysis, namely work environment, psychosocial effects of stress, job satisfaction,
exhaustion, and pressure and motivation. In order to determine stress and burnout
levels as well as being able to identify associated individual responses to workplace
issues, mean scores will be displayed, as well as summaries of percentages in low,
moderate and high categories for each theme. Detailed analysis of individual
components will also be displayed as frequencies and percentages in the tables for
each question related to each theme. Each theme will provide specifics related to that
subscale. This summarises each theme by way of the five subscales.
1.2.1. Theme: stress
The following table (Table 27) demonstrates that nurses‟ and midwives‟ mean scores
indicated moderate levels of stress (see Chapter 3, section 3.5.4. D. a., Table 8 for
scoring levels).
Table 27 Overall Results for Stress
Theme Mean / Standard Deviation Stress Rating 95% CI Total
Stress 38.56 / 14.098 Moderate 37.37- 39.76 538

153
Figure 5 displays that the majority (59%) of the sample experienced moderate stress
levels, with 37 per cent experiencing low stress levels and four per cent experiencing
high stress levels.
Figure 5 Overall Stress Levels
Stress N = 538
198, 37%
316, 59%
24, 4%
Low
Moderate
High
A. Subscale: work environment
The following table (Table 28) demonstrates that nurses‟ and midwives‟ mean scores
indicated moderate levels of stress related to the work environment (see Chapter 3,
section 3.5.4. D. b., Table 9 for scoring levels). These scores were calculated from the
actual factor scores, hence the miniscule numbers.
Table 28 Overall Results for Work Environment Stress Levels
Subscale Mean / Standard
Deviation
Stress Rating 95% CI Total
Work
environment
0.000 / 0.999 Moderate -0.086- 0.085 531

154
Figure 6 displays that the majority (76%) of the sample experienced moderate stress
levels related to the work environment, with 17 per cent of the sample experiencing
low stress levels and seven per cent experiencing high stress levels.
Figure 6 Work Environment Stress Levels
Work environment stress levels N = 531
91, 17%
401, 76%
39, 7%
Low
Moderate
High
The following information will highlight individual components as factors linked with
work environment stress. The following five components, (having experienced stress;
inefficient time management, for example, due to excessive workloads; frequency of
rushing to complete tasks; frequency of finishing work late; and having insufficient
organisational support) relate to the work environment as occupational stress (see
section 2.3.1. A. for a detailed exposition of the development of this subscale by way
of factor analysis).

155
Individual components
All respondents indicated having experienced some levels of work-related stress. The
majority (65.1%) of respondents reported experiencing stress frequently, most of the
time or always (see Table 29 for more detail).
Table 29 Incidence of Stress Responses Never Occasionally Frequently Most of the time Always Total
Number 0 195 282 74 7 558 Percentage 0.0 34.9 50.5 13.3 1.3 100
The majority (69.7%) of nurses and midwives in this sample indicated that they are
inefficiently managing their time (for example, due to excessive workloads),
frequently, most of the time or always (Table 30).
Table 30 Inefficient Time Management
Responses Never Occasionally Frequently Most of the time Always Total
Number 3 167 276 97 18 561 Percentage 0.5 29.8 49.2 17.3 3.2 100
Three-quarters (75.9%) of respondents reported that they are rushing to complete
tasks either frequently, most of the time or always (Table 31).
Table 31 Frequency of Rushing to Complete Tasks
Responses Never Occasionally Frequently Most of the time Always Total
Number 3 132 283 128 15 561 Percentage 0.5 23.5 50.5 22.8 2.7 100
The majority (60.9%) of nurses and midwives stated that they finish work late either
frequently, most of the time or always (Table 32).
Table 32 Frequency of Finishing Work Late
Responses Never Occasionally Frequently Most of the time Always Total
Number 17 203 206 110 26 562 Percentage 3.0 36.1 36.7 19.6 4.6 100

156
The respondents were fairly evenly divided between those who receive sufficient
organisational support either occasionally or never (49.7%) and those who received it
frequently, most of the time or always (50.3%) (Table 33).
Table 33 Receiving Sufficient Organisational Support
Responses Never Occasionally Frequently Most of the time Always Total
Number 43 235 124 142 16 560 Percentage 7.7 42.0 22.1 25.3 2.9 100
In response to the questions posed in Chapter 1 as to whether stress relates to
environmental and / or organisational issues, for this study, 76 per cent of nurses and
midwives experienced moderate stress levels related to the work environment and this
included almost half (49.7%) identifying that they receive sufficient organisational
support never or occasionally.
B Subscale: psychosocial effects
The following table (Table 34) demonstrates that nurses‟ and midwives‟ mean scores
indicated minimal psychosocial effects of stress (see Chapter 3, section 3.5.4. D. b.,
Table 11 for scoring levels).
Table 34 Overall Results for Psychosocial Effects of Stress
Subscale Mean / Standard
Deviation
Stress Rating 95% CI Total
Psychosocial
effects of stress
20.970 / 9.847 Minimal 20.15- 21.80 551

157
Figure 7 shows that the majority (56%) of the sample of nurses and midwives
experienced minimal psychosocial effects of stress, with 44 per cent experiencing
moderate to excessive psychosocial effects of stress.
Figure 7 Psychosocial Effects of Stress
Psychosocial effects of stress N = 551
306, 56%
221, 40%
24, 4%
Minimal
Moderate
Excessive
The following nine components, including anxiety, sleeplessness, depression, stress
requiring treatment, mental health leave and feelings of helplessness, relate to factors
linked with psychosocial effects at work which are manifestations of ill health related
to stress (see section 2.3.1. A. for a detailed exposition of the development of this
subscale by way of factor analysis).

158
Individual components
The majority (79.1%) of nurses and midwives in this sample either reported
experiencing increased anxiety never / occasionally or over the past year / decade
(Table 35).
Table 35 Experiencing Increased Anxiety in Relation to Work
Responses Number Percentage
Never / Occasionally 163 29.1 Over past few days 5 0.9 Over past few weeks 36 6.4 Over past few months 76 13.6 Over the past year 169 30.2 Over the past decade 111 19.8 Total 560 100
Over a quarter (27.1%) indicated that they have experienced sleeplessness over the
past few months or over the past year (Table 36).
Table 36 Experiencing Sleeplessness in Relation to Work Over the Past Decade
Responses Number Percentage
Never / Occasionally 286 51.1 Over past few days 5 0.9 Over past few weeks 23 4.1 Over past few months 57 10.2 Over the past year 95 16.9 Over the past decade 94 16.8 Total 560 100
The majority (63.9%) of nurses and midwives reported that they experience
depression in relation to work never / occasionally, with 15.5 per cent experiencing
depression over the past year (Table 37).
Table 37 Experiencing Depression in Relation to Work
Responses Number Percentage
Never / Occasionally 358 63.9 Over past few days 1 0.2 Over past few weeks 10 1.8 Over past few months 32 5.7 Over the past year 87 15.5 Over the past decade 72 12.9 Total 560 100
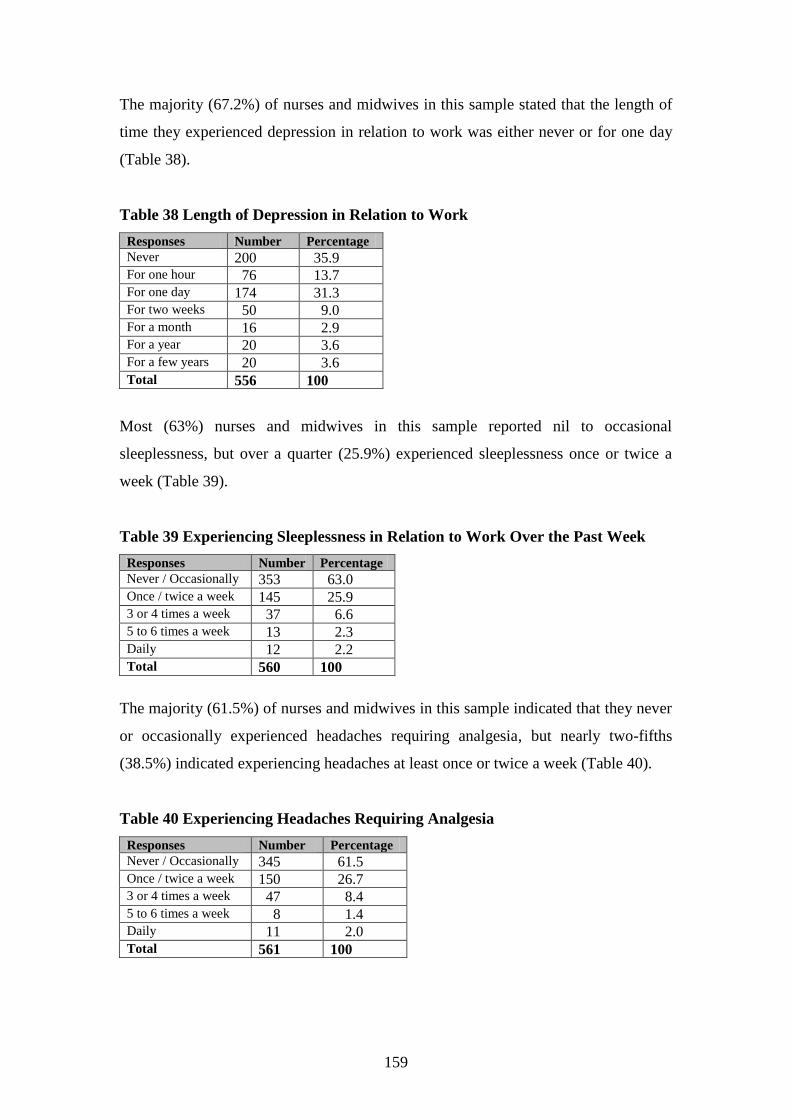
159
The majority (67.2%) of nurses and midwives in this sample stated that the length of
time they experienced depression in relation to work was either never or for one day
(Table 38).
Table 38 Length of Depression in Relation to Work
Responses Number Percentage
Never 200 35.9 For one hour 76 13.7 For one day 174 31.3 For two weeks 50 9.0 For a month 16 2.9 For a year 20 3.6 For a few years 20 3.6 Total 556 100
Most (63%) nurses and midwives in this sample reported nil to occasional
sleeplessness, but over a quarter (25.9%) experienced sleeplessness once or twice a
week (Table 39).
Table 39 Experiencing Sleeplessness in Relation to Work Over the Past Week
Responses Number Percentage
Never / Occasionally 353 63.0 Once / twice a week 145 25.9 3 or 4 times a week 37 6.6 5 to 6 times a week 13 2.3 Daily 12 2.2 Total 560 100
The majority (61.5%) of nurses and midwives in this sample indicated that they never
or occasionally experienced headaches requiring analgesia, but nearly two-fifths
(38.5%) indicated experiencing headaches at least once or twice a week (Table 40).
Table 40 Experiencing Headaches Requiring Analgesia
Responses Number Percentage
Never / Occasionally 345 61.5 Once / twice a week 150 26.7 3 or 4 times a week 47 8.4 5 to 6 times a week 8 1.4 Daily 11 2.0 Total 561 100

160
The majority (69%) of nurses and midwives reported that they required treatment for
their stress at least once every six months or more (Table 41).
Table 41 Experiencing Stress Requiring Treatment
Responses Number Percentage
Never 124 22.2 Once a year 49 8.8 Once every 6 months 79 14.1 Once every 3 months 67 12.0 Once a month 72 12.9 Once every few weeks 80 14.3 Once a week 66 11.8 Daily 22 3.9 Total 559 100
Almost half the sample (45.2%) of nurses and midwives identified that they took
“mental health” leave at least once over the past year (Table 42).
Table 42 “Mental Health” Leave over Past Year
Responses Number Percentage
Never 306 54.8 Once 98 17.5 Twice 76 13.6 3 to 10 times 65 11.6 11 to 29 times 10 1.8 30 to 49 times 3 0.5 50 to 100 times 1 0.2 Total 559 100
Almost half (45.5%) of nurses and midwives in this sample stated that they
experienced feelings of helplessness in their work environment never or occasionally
(Table 43).
Table 43 Experiencing Feelings of Helplessness in Work Environment
Responses Number Percentage
Never / Occasionally 252 45.5 Yesterday 21 3.8 Over past few days 18 3.2 Over past few weeks 40 7.2 Over past few months 64 11.6 Over the past year 86 15.5 Over the past decade 73 13.2 Total 554 100

161
In response to the questions posed in Chapter 1 as to whether stress relates to
psychosocial issues, for this study, the majority (56%) of nurses and midwives
experienced minimal psychosocial effects of stress; however, 40 per cent experienced
moderate effects, with four per cent experiencing excessive psychosocial effects.
C. Subscale: job satisfaction
The following table (Table 44) demonstrates that nurses‟ and midwives‟ mean scores
indicated moderate levels of job satisfaction (see Chapter 3, section 3.5.4. D. b., Table
12 for scoring levels).
Table 44 Overall Results for Job Satisfaction
Subscale Mean / Standard
Deviation
Stress Rating 95% CI Total
Job satisfaction 7.610 / 4.137 Moderate 7.26- 7.95 550

162
Figure 8 displays that the majority (96%) of this sample of nurses and midwives
showed moderate to high job satisfaction levels and a small percentage (4%) were
dissatisfied in their work.
Figure 8 Job Satisfaction
Job satisfaction N = 550
217, 39%
310, 57%
23, 4%
High satisfaction
Moderately satisfied
Dissatisfied
The following five components, including wanting to change area of practice or
leaving the profession, enjoying and being suited to the particular type of work, relate
to factors linked with job satisfaction such as job compatibility (see section 2.3.1. A.
for a detailed exposition of the development of this subscale by way of factor
analysis).
Individual components
The majority (96%) of nurses and midwives indicated that they think they are suited
to the work they are doing either frequently, most of the time or always (Table 45).
Table 45 Being Suited to the Work They are Doing
Responses Never Occasionally Frequently Most of the time Always Total
Number 3 20 43 304 192 562 Percentage 0.5 3.6 7.6 54.1 34.2 100

163
The majority (94.8%) of this sample of nurses and midwives reported that they are
doing the kind of work they like either frequently, most of the time or always (Table
46).
Table 46 Doing the Kind of Work They Like
Responses Never Occasionally Frequently Most of the time Always Total
Number 3 26 60 315 157 561 Percentage 0.5 4.6 10.7 56.2 28.0 100
Almost half (48.6%) of nurses and midwives in this sample did not want to change
their area of practice. Almost half (48%) said „yes‟ they did or sometimes did want to
change their area of practice (Table 47).
Table 47 Wanting to Change Area of Practice
Responses Yes No Sometimes Unsure Total
Number 58 272 210 19 559 Percentage 10.4 48.6 37.6 3.4 100
The majority (55.2%) of nurses and midwives in this sample did not want to leave the
professional discipline, although more than two-fifths (41.2%) of the sample said
„yes‟ they did or sometimes did want to leave (Table 48). More nurses and midwives
(55.2%) were certain that they did not want to leave the professional discipline than
the 48.6 per cent that were certain they did not want to change their area of practice
(Tables 47 & 48).
Table 48 Wanting to Leave Professional Discipline
Responses Yes No Sometimes Unsure Total
Number 42 307 187 20 556 Percentage 7.6 55.2 33.6 3.6 100

164
The majority (57.6%) of nurses and midwives reported that they experienced job
dissatisfaction at least once a month (Table 49).
Table 49 Frequency of Experiencing Job Dissatisfaction
Responses Numbers Percentage
Never 39 7.0
Once a year 53 9.5
Once every 6 months 77 13.8
Once every 3 months 67 12.0
Once a month 61 11.0
Once every few weeks 141 25.3
Once a week 76 13.7
Daily 43 7.7
Total 557 100
In response to the questions posed in Chapter 1 as to whether stress relates to job
dissatisfaction, the above results provide overall evidence that only a small percentage
(4%) were dissatisfied in their work, however, the majority (57.6%) reported
experiencing job dissatisfaction at least once a month.
1.2.2. Theme: burnout
The following table (Table 50) demonstrates that nurses‟ and midwives‟ mean scores
indicated moderate burnout levels (see Chapter 3, section 3.5.4. D. b., Table 13 for
scoring levels).
Table 50 Overall Results for Burnout
Theme Mean / Standard Deviation Burnout Rating 95% CI Total
Burnout 14.990 / 5.483 Moderate 14.53-15.45 543
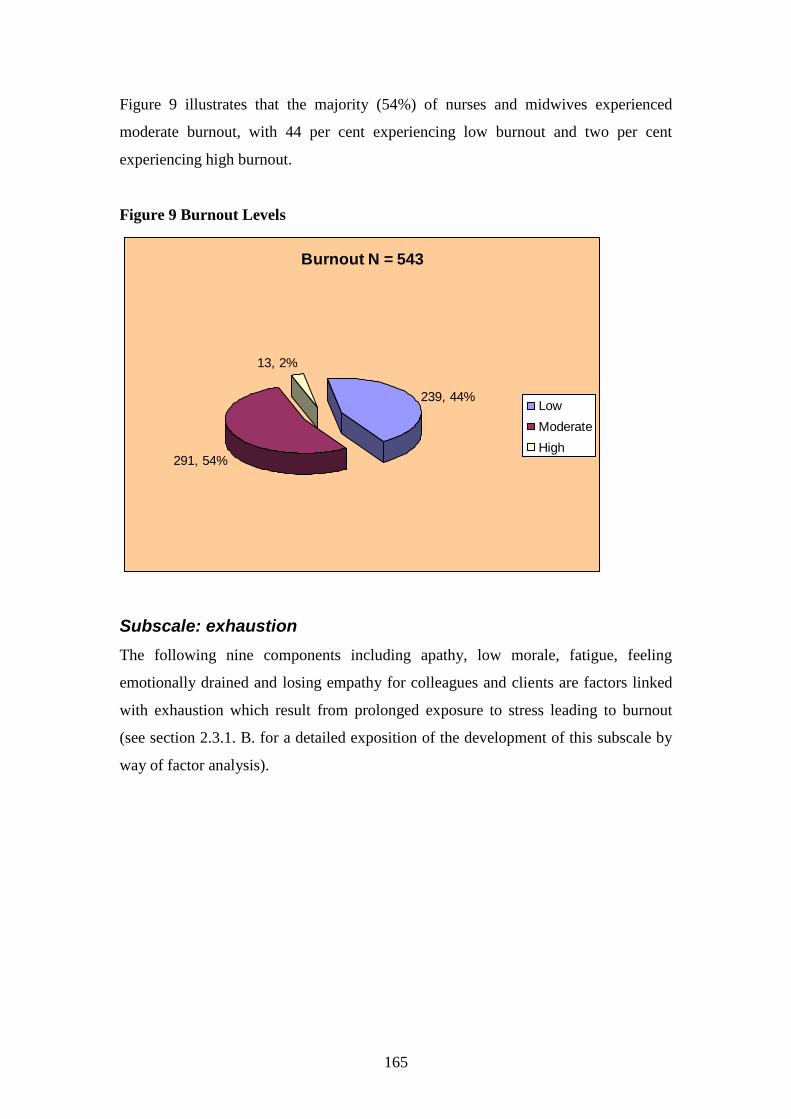
165
Figure 9 illustrates that the majority (54%) of nurses and midwives experienced
moderate burnout, with 44 per cent experiencing low burnout and two per cent
experiencing high burnout.
Figure 9 Burnout Levels
Burnout N = 543
239, 44%
291, 54%
13, 2%
Low
Moderate
High
Subscale: exhaustion
The following nine components including apathy, low morale, fatigue, feeling
emotionally drained and losing empathy for colleagues and clients are factors linked
with exhaustion which result from prolonged exposure to stress leading to burnout
(see section 2.3.1. B. for a detailed exposition of the development of this subscale by
way of factor analysis).

166
Individual components
Twenty-one per cent of nurses and midwives reported that they become apathetic
frequently, most of the time or always, when “stressed” (Table 51).
Table 51 Becoming Apathetic when “Stressed”
Responses Never Occasionally Frequently Most of the time Always Total
Number 111 328 86 25 6 556 Percentage 19.9 59.0 15.5 4.5 1.1 100
Nearly a third (32.7%) of nurses and midwives identified that they experience low
morale in relation to work either frequently, most of the time or always (Table 52).
Table 52 Experiencing Low Morale in Relation to Work
Responses Never Occasionally Frequently Most of the time Always Total
Number 52 326 130 47 6 561 Percentage 9.2 58.1 23.2 8.4 1.1 100
Over a third (34.9%) of nurses and midwives in this sample reported feeling
powerless in their job either frequently, most of the time or always (Table 53).
Table 53 Powerlessness in Job
Responses Never Occasionally Frequently Most of the time Always Total
Number 46 320 134 52 10 562 Percentage 8.2 56.9 23.8 9.3 1.8 100
Forty-four per cent of nurses and midwives in this sample stated that they feel
undervalued in their job frequently, most of the time or always (Table 54).
Table 54 Feeling Undervalued in Their Job
Responses Never Occasionally Frequently Most of the time Always Total
Number 55 260 155 68 23 561 Percentage 9.8 46.4 27.6 12.1 4.1 100

167
Nearly a third (31.2%) of the sample of nurses and midwives have either frequently or
most of the time felt overwhelmed in their job (Table 55).
Table 55 Feeling Overwhelmed in Their Job
Responses Never Occasionally Frequently Most of the time Always Total
Number 37 349 152 23 0 561 Percentage 6.6 62.2 27.1 4.1 0.0 100
The majority (78.4%) of nurses and midwives in this sample identified that they never
or occasionally experienced feelings of incompetence within themselves when
working with others (Table 56).
Table 56 Experiencing Feelings of Incompetence Within Themselves When
Working With Others
Responses Never Occasionally Frequently Most of the time Always Total
Number 66 370 106 13 1 556 Percentage 11.9 66.5 19.1 2.3 0.2 100
Almost all (90.9%) nurses and midwives reported feeling fatigued at least once or
twice a week (Table 57).
Table 57 Frequency of Fatigue
Responses Number Percentage
Never / Occasionally 51 9.1 Once / twice a week 181 32.3 3 or 4 times a week 127 22.6 5 to 6 times a week 39 6.9 Daily 163 29.1 Total 561 100
A large portion (59.6%) of nurses and midwives in this sample indicated that they felt
emotionally drained at work at least once or twice a week (Table 58).
Table 58 Frequency of Feeling Emotionally Drained at Work
Responses Number Percentage
Never / Occasionally 226 40.4 Once / twice a week 207 37.0 3 or 4 times a week 78 14.0 5 to 6 times a week 16 2.9 Daily 32 5.7 Total 559 100

168
Almost half (47.2%) of nurses and midwives in this sample reported that they had felt
loss of empathy for colleagues while at work (Table 59).
Table 59 Feeling Loss of Empathy for Colleagues While at Work
Responses Yes No Unsure Total
Number 263 222 72 557 Percentage 47.2 39.9 12.9 100
Similarly, almost half (45.5%) of nurses and midwives in this sample reported that
they had felt loss of empathy for clients while at work (Table 60).
Table 60 Feeling Loss of Empathy for Clients While at Work
Responses Yes No Unsure Total
Number 254 261 43 558 Percentage 45.5 46.8 7.7 100
1.2.3. Theme: individual responses
The following table (Table 61) demonstrates that nurses‟ and midwives‟ mean scores
indicated moderate levels of pressure and motivation for individual responses (see
Chapter 3, section 3.5.4. D. b., Table 10 for scoring levels). These scores were also
calculated from the actual factor scores, hence the miniscule numbers.
Table 61 Overall Results of Pressure and Motivation Levels for Individual
Responses
Theme Mean / Standard
Deviation
Pressure &
Motivation Rating
95% CI Total
Individual
responses-
pressure and
motivation
0.000 / 1.691 Moderate -0.141- 0.141 552

169
Figure 10 illustrates that the majority (53%) of nurses and midwives scored moderate
levels of self-imposed work pressure and motivation, with 29 per cent scoring low
pressure and motivation levels and 18 per cent scoring high pressure and motivation
levels.
Figure 10 Pressure and Motivation Levels
Pressure and motivation levels N = 552
161, 29%
294, 53%
97, 18%
Low
Moderate
High
Subscale: pressure and motivation
The following eight components, including high achievement levels, unreasonable
expectations and multi-tasking, relate to individual responses which are work
behaviours such as self-imposed work pressure and motivation (see section 2.3.1. C.
for a detailed exposition of the development of this subscale by way of factor
analysis).

170
Individual components
Almost two-thirds (65.4%) of respondents stated that they tried to achieve more than
time allows either frequently, most of the time or always (Table 62).
Table 62 Trying to Achieve More than Time Allows
Responses Never Occasionally Frequently Most of the time Always Total
Number 9 185 236 106 24 560 Percentage 1.6 33.0 42.2 18.9 4.3 100
Over half (58%) of respondents indicated that they placed unreasonable expectations
on themselves either frequently, most of the time or always (Table 63).
Table 63 Unreasonable Expectations
Responses Never Occasionally Frequently Most of the time Always Total
Number 27 209 188 112 25 561 Percentage 4.8 37.2 33.5 20.0 4.5 100
Almost two-thirds (61.1%) of nurses and midwives in this sample reported that they
were occasionally irritable when there were constant interruptions. Another 35 per
cent noted that they were irritable frequently, most of the time or always (Table 64).
Table 64 Irritability due to Constant Interruptions
Responses Never Occasionally Frequently Most of the time Always Total
Number 23 343 142 42 11 561 Percentage 4.1 61.1 25.3 7.5 2.0 100
The majority (65.4%) of nurses and midwives responded that they were pushed for
time either frequently, most of the time or always (Table 65).
Table 65 Pushed for Time
Responses Never Occasionally Frequently Most of the time Always Total
Number 4 190 233 103 31 561 Percentage 0.7 33.9 41.5 18.4 5.5 100

171
The majority (89.3%) of nurses and midwives reported that they never or occasionally
had difficulty slowing down (Table 66).
Table 66 Difficulty Slowing Down
Responses Never Occasionally Frequently Most of the time Always Total
Number 233 266 42 16 2 559 Percentage 41.7 47.6 7.5 2.9 0.3 100
Nurses and midwives were fairly evenly divided in their description of working at
high performance levels either occasionally (30.9%), frequently (28.2%) or most of
the time (27.5%) (Table 67).
Table 67 Working at High Performance
Responses Never Occasionally Frequently Most of the time Always Total
Number 37 173 158 154 38 560 Percentage 6.6 30.9 28.2 27.5 6.8 100
Over half (56.7%) of the sample of nurses and midwives indicated that they were
keyed up (restless) on most days either never or occasionally. The remainder (43.3%)
indicated that they were keyed up frequently, most of the time or always (Table 68).
Table 68 Keyed Up Most of the Time on Most Days
Responses Never Occasionally Frequently Most of the time Always Total
Number 51 265 131 99 11 557 Percentage 9.1 47.6 23.5 17.8 2.0 100
Three-quarters (75.4%) of nurses and midwives indicated that they had a tendency to
perform many tasks at one time either frequently, most of the time or always (Table
69).
Table 69 Tendency to Perform Many Tasks at One Time
Responses Never Occasionally Frequently Most of the time Always Total
Number 5 133 257 134 33 562 Percentage 0.9 23.7 45.7 23.8 5.9 100

172
1.2.4. Other variables relating to stress and burnout not included in
subscales
A total of 15 out of 52 questions were not included in the above calculations (see
Appendix 11 for detail). The reasons were as follows:
one question (while reliable in terms of the Cronbach‟s alpha level) detracted
from its relevant subscale reliability. Therefore to include this question in the
subscale would have made the subscale unreliable;
two reliable questions were not included in the original pilot study‟s
subscales; and
12 questions proved unreliable in terms of their Cronbach‟s alpha, which
analyses and determines reliability of questions or variables.
2. Multivariate Statistics
This section identifies significant associations between the variables of stress, burnout
and individual responses for this sample of nurses and midwives. These associations
were identified by Spearman‟s correlations.
2.1. Bivariate correlations
2.1.1. Spearman’s correlation coefficients
Spearman‟s correlation coefficients were calculated on all reliable questions in the
questionnaire on this sample of 562 nurses and midwives (see Appendix 10 for
reliable questions). This statistical analysis allowed certain associations or
relationships between phenomena of stress, organisational, environmental and
psychosocial issues or individual responses to be identified. All correlations were
viewed for all reliable variables and those associations with the highest correlations,
that is, those with an rho value of more than .40, and those that were statistically
significant (p<0.01, two-tailed) were deemed as being the most important or pertinent
issues and concerns for the nurses and midwives in this sample. Two-tailed analyses
are non-directional, meaning that the prediction or hypothesis can show a negative or
positive association (Field, 2005). These correlations highlighted relationships among
the variables and subscales that also identified certain important themes relating to the
conceptual framework.

173
Overall, these categories include occupational stress (sub-category, workplace
pressures), stress leading to ill health, (sub-category, treatment for stress), job
compatibility, prolonged exposure to stress and work behaviours such as self-imposed
work pressure and motivation (Tables 70 to 74). These categories and sub-categories
directly relate to the subscales of the conceptual framework. The sub-categories relate
to significant Spearman‟s associations. Occupational stress and workplace pressures
relate to the subscale work environment. Stress leading to ill health and treatment for
stress relate to the subscales psychosocial effects and exhaustion. Job compatibility
relates to the subscale job satisfaction. Prolonged exposure to stress and extended
fatigue outcomes relates to the subscale exhaustion. Work behaviours such as self-
imposed work pressure and motivation relate to the subscale pressure and motivation.
Tables 70 to 74 illustrate the following pertinent features:
As far as workplace pressures were concerned, there was a positive
relationship between rushing to complete tasks and inefficient time
management (for example, due to excessive workloads), for nurses and
midwives (r = .636, p<0.01);
As far as stress leading to ill health was concerned, there was a positive
relationship between short and long-term sleeplessness for nurses and
midwives (r = .608, p<0.01);
As far as nurses and midwives being treated for stress was concerned,
there was a positive relationship between stress requiring treatment and
feeling emotionally drained (r = .477, p<0.01);
As far as job compatibility was concerned, there was a positive
relationship between being suited to the particular type of work and
enjoying the work for nurses and midwives (r = .557, p<0.01);
As far as prolonged exposure to stress was concerned, there was a positive
relationship between powerlessness and low morale for nurses and
midwives (r = .624, p<0.01); and
As far as work behaviours such as self-imposed work pressure and
motivation were concerned, there was a positive relationship between
placing unreasonable expectations on oneself and wanting to achieve more
in less time for nurses and midwives (r = .584, p<0.01).

174
Table 70 Relationship Between Theme, Category, Work Environment Subscale
and Spearman‟s Variables
Major theme Category / Sub-
category
Subscale Rho* Relationship between Spearman‟s variables
Stress Category Occupational stress
Sub-category Workplace
pressures
Work
environment
.636
.493
.492
.487
.486
.446
.431
.415
Rushing is associated with poor time management (for
example, due to workloads)
Poor time management (for example, due to
workloads) is associated with stress
Being pushed for time is associated with rushing to
complete tasks
Being pushed for time is associated with achieving
more in less time
Rushing to complete tasks is associated with incidence
of stress
Rushing to complete tasks is associated with finishing
work late
Time management (for example, due to workloads) is
associated with being pushed for time
Time management (for example, due to workloads) is
associated with finishing work late *All values p<0.01, 2-tailed
Table 71 Relationship Between Themes, Categories, Psychosocial Effects and
Exhaustion Subscales and Spearman‟s Variables
Major theme Category / Sub-
category
Subscale Rho* Relationship between Spearman‟s variables
Stress
Category Stress
leading to ill
health
Psychosocial
effects
.608
.586
.489
Sleeplessness over past week is associated with
sleeplessness over past decade
Depression over the past decade is associated with
sleeplessness over the past decade
Sleeplessness over past decade is associated with
increased anxiety
Stress
Sub-category Treatment for
stress
Psychosocial
effects
.454
.401
Stress requiring treatment is associated with
experiencing headaches requiring analgesia
Stress requiring treatment is associated with incidence
of stress
Stress &
Burnout
Category Stress leading to
ill health &
Prolonged
exposure to
stress
Sub-category Treatment for
stress
Psychosocial
effects &
Exhaustion
.477
Stress requiring treatment is associated with feeling
emotionally drained
Stress &
Burnout
Category Stress leading to
ill health &
Prolonged
exposure to
stress
Psychosocial
effects &
Exhaustion
.402
Sleeplessness over past week is associated with feeling
emotionally drained
*All values p<0.01, 2-tailed

175
Table 72 Relationship Between Themes, Categories, Job Satisfaction and
Exhaustion Subscales and Spearman‟s Variables
Major theme Category Subscale Rho* Relationship between Spearman‟s variables
Stress
Job compatibility
Job satisfaction
.577
.494
.410
Being suited to the particular type of work is
associated with enjoying the work one does
Wanting to leave the professional discipline is
associated with wanting to change area of
practice
Job dissatisfaction is associated with incidence
of stress
Stress &
Burnout
Category Job compatibility
& Prolonged
exposure to
stress
Sub-category Extended fatigue
outcomes
Job satisfaction
& Exhaustion
.456
.417
.402
Job dissatisfaction is associated with low morale
Job dissatisfaction is associated with feeling
undervalued
Job dissatisfaction is associated with feeling
emotionally drained
*All values p<0.01, 2-tailed

176
Table 73 Relationship Between Themes, Categories, Work Environment and
Exhaustion Subscales and Spearman‟s Variables
Major theme Category / Sub-
category
Subscale Rho* Relationship between Spearman‟s variables
Burnout Category
Prolonged
exposure to stress
Exhaustion
.624
.612
.561
.444
.442
.440
.439
.424
.412
.409
.404
Powerlessness is associated with low morale
Feeling undervalued is associated with powerlessness
Feeling undervalued is associated with low morale
Loss of empathy for colleagues is associated with loss
of empathy for clients
Low morale is associated with feeling overwhelmed
Feeling undervalued is associated with stress
Feeling overwhelmed is associated with feeling
emotionally drained
Low morale is associated with feeling emotionally
drained
Feeling undervalued is associated with feeling
overwhelmed
Feeling overwhelmed is associated with feelings of
incompetence
Feeling undervalued is associated with feeling
emotionally drained Stress &
Burnout
Category Occupational stress
& Prolonged
exposure to stress
Sub-category Workplace
pressures &
extended fatigue
outcomes
Work
environment
&
Exhaustion
.436
.433
.424
.416
.411
.408
.405
.400
Feeling overwhelmed is associated with incidence of
stress
Low morale is associated with incidence of stress
Feeling emotionally drained is associated with
incidence of stress
Powerlessness is associated with rushing to complete
tasks
Low morale is associated with poor time management
(for example, due to workloads)
Feeling emotionally drained is associated with rushing
to complete tasks
Feeling emotionally drained is associated with poor
time management (for example, due to workloads)
Feeling undervalued is associated with poor time
management (for example, due to workloads)
*All values p<0.01, 2-tailed
Table 74 Relationship Between Theme, Category, Pressure and Motivation
Subscale and Spearman‟s Variables
Major theme Category Subscale Rho* Relationship between Spearman‟s variables
Individual
Responses
Work behaviours
such as self-
imposed work
pressure &
motivation
Pressure &
motivation
.584
.433
.425
Placing unreasonable expectations on oneself is
associated with wanting to achieve more in less
time
Placing unreasonable expectations on oneself is
associated with being pushed for time
Being keyed up on most days is associated with
having a tendency to multi-task
*All values p<0.01, 2-tailed
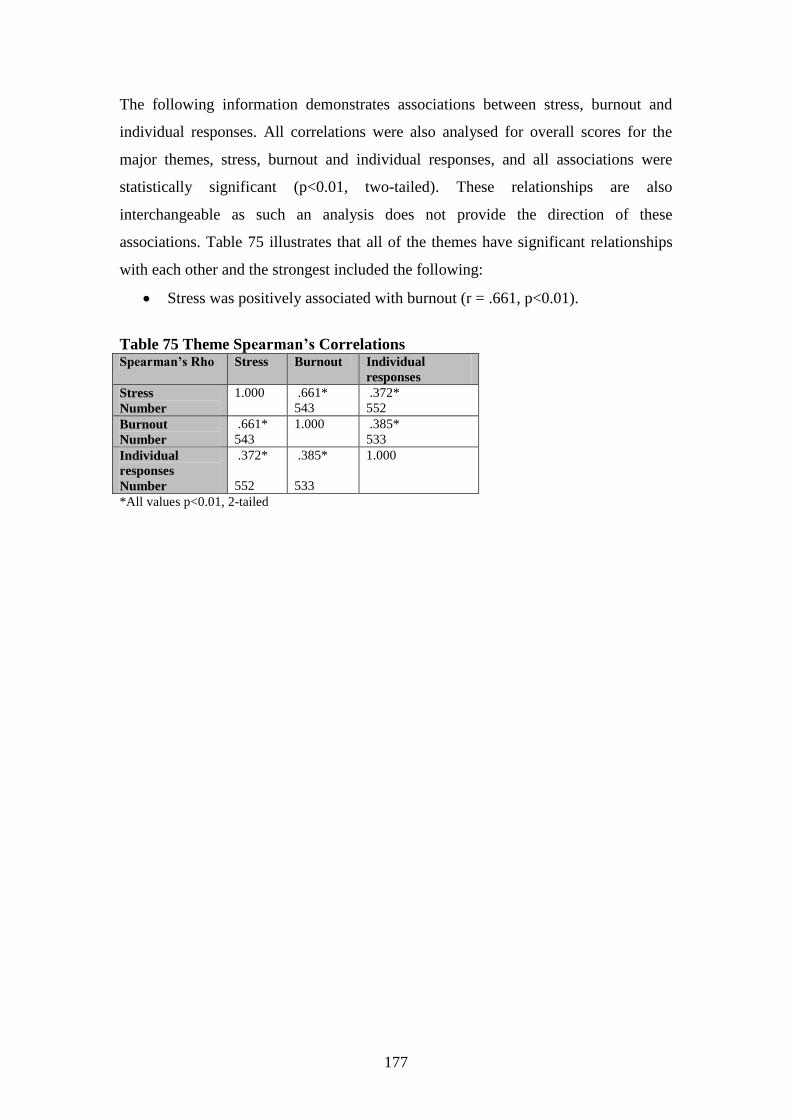
177
The following information demonstrates associations between stress, burnout and
individual responses. All correlations were also analysed for overall scores for the
major themes, stress, burnout and individual responses, and all associations were
statistically significant (p<0.01, two-tailed). These relationships are also
interchangeable as such an analysis does not provide the direction of these
associations. Table 75 illustrates that all of the themes have significant relationships
with each other and the strongest included the following:
Stress was positively associated with burnout (r = .661, p<0.01).
Table 75 Theme Spearman‟s Correlations Spearman‟s Rho Stress Burnout Individual
responses
Stress
Number
1.000 .661*
543
.372*
552
Burnout
Number
.661*
543
1.000 .385*
533
Individual
responses
Number
.372*
552
.385*
533
1.000
*All values p<0.01, 2-tailed

178
All correlations were also analysed for overall scores for subscales and all
associations were statistically significant (p<0.01, two-tailed) (Table 76). Table 76
illustrates that all of the subscales have significant relationships but the strongest
include the following:
Psychosocial effects of stress were positively associated with exhaustion (r =
.605, p<0.01);
Work environment stress was positively associated with exhaustion (r = .593,
p<0.01);
Job dissatisfaction was positively associated with exhaustion (r = .551,
p<0.01);
Work environment stress was positively associated with psychosocial effects
of stress (r = .486, p<0.01);
Psychosocial effects of stress were positively associated with job
dissatisfaction (r = .448, p<0.01) and
Work environment stress was positively associated with high self-imposed
work pressure and motivation (r = .445, p<0.01).
Table 76 Subscale Spearman‟s Correlations Spearman‟s
Rho
Work
environment
Psychosocial
effects
Job
satisfaction
Exhaustion Pressure and
motivation
Work
environment
Number
1.000 .486*
544
.371*
545
.593*
537
.445*
544
Psychosocial
effects
Number
.486*
544
1.000 .448*
543
.605*
533
.360*
542
Job
satisfaction
Number
.371*
545
.448*
543
1.000 .551*
536
.197*
540
Exhaustion
Number
.593* .605*
533
.551*
536
1.000 .385*
533
Pressure and
motivation
Number
.445*
544
.360*
542
.197*
540
.385*
533
1.000
*All values p<0.01, 2-tailed

179
All subscales and the variable incidence of stress were also correlated with the
variables age, hours worked and years in the profession and Table 77 displays
statistically significant associations. Table 77 illustrates that:
Work environment stress was positively associated with more hours worked (r
= .185, p<0.01);
Age was negatively associated with job dissatisfaction (r = -.122, p<0.01);
Exhaustion was positively associated with more hours worked (r = .096,
p<0.05);
High levels of self-imposed work pressure and motivation were positively
associated with more hours worked (r = .120, p<0.01);
Incidence of stress was positively associated with more hours worked (r =
.135, p<0.01) and
Age was positively associated with years in the profession (r = .750, p<0.01).
Table 77 Spearman‟s Correlations Between Significant Subscales, Incidence of
Stress and Continuous Variables
Spearman‟s
Rho
Work
environment
Job
satisfaction
Exhaustion Pressure and
motivation
Incidence of
stress
Years in
profession
Hours
Number
.185**
550
.096*
539
.120**
548
.135**
554
Age
Number
-.122**
541
.750**
547
*All values p<0.01, 2-tailed
**All values p<0.05, 2-tailed
2.2. Logistic regression
The following calculations were done to enable prediction of the likelihood of stress,
burnout, and high pressure and motivation levels in someone who is either older,
works longer hours, has spent many years in the profession, works fulltime, is better
educated or lives alone. These demographics might be potential confounding factors
when investigating stress and organisational issues (Makinen et al., 2003). Only
statistically significant findings (p<0.05) are presented here. A detailed presentation
of all relevant data is contained in Appendix 6.

180
A. Stress
Predicting overall stress levels was done by analysing the data in respect of low or
high levels and there was found to be no statistically significant findings. Predicting
outcomes of stress was shown as evidence of sleeplessness and taking “mental health”
leave. Sleeplessness has been shown to be a normal psychological symptom of stress;
(Buus-Frank, 2002; Olofsson et al., 2003; Soderfeldt, 2000). Staff absenteeism and
frequent sick calls are indicative of occupational stress (Buus-Frank, 2002; Clegg,
2001; Cosentino, 2000).
In summary the data suggest that the respondents were:
more likely to experience sleeplessness if they worked longer hours (p<0.01);
and
less likely to take “mental health” leave if they were older (p<0.0001) and the
longer they worked in the profession (p<0.01).
B. Burnout
Predicting overall burnout levels was done by analysing the data in respect of overall
low or high levels. Happel, Martin and Pinikahana (2003) explored overall levels of
burnout in psychiatric and mental health nurses. An overall burnout level enables
formulation of a summary or „snapshot‟ of this sample of nurses and midwives and
these analyses predict and identify those more at risk of experiencing burnout in the
future.
In relation to overall burnout levels, the data suggest that the respondents were:
more likely to experience burnout if the person worked longer hours (p<0.01).
Predicting outcomes of burnout was done by analysing the data in respect of
experiencing apathy, feeling emotionally drained at work and losing empathy for
colleagues and clients. Feeling emotionally exhausted is one of the components of
burnout (Maslach & Jackson, 1981). Nurses who experience burnout will be more
likely to lose empathy for colleagues and to abuse other nurses (Rowe & Sherlock,
2005).
In summary the data suggest that the respondents were:

181
more likely to be apathetic when “stressed” if they worked longer hours
(p<0.01);
less likely to feel emotionally drained at work if the person was older (p<0.05)
and more likely to feel emotionally drained at work if they worked longer
hours (p<0.01);
less likely to lose empathy for colleagues if the person holds a degree or any
higher qualification (p<0.05) and if they are living alone (p<0.05); and
less likely to lose empathy for clients if the person is older (p<0.01) and the
longer they worked in the profession (p<0.01).
C. Individual responses
Predicting those more likely to exhibit high or low pressure and motivation levels was
done by analysing the data in respect of „low self-imposed work pressure and
motivation‟ or „high self-imposed work pressure and motivation‟. Overall pressure
and motivation levels provides information on those nurses and midwives in this
study who are more likely to place unreasonable expectations on themselves in
relation to work in the future.
As far as pressure and motivation levels were concerned the summary statistics
indicate that they were:
less likely to place unreasonable expectations on themselves in relation to
work if the person holds a degree or any higher qualification (p<0.05).
As the Wald statistics are considerably different from 0, these predictors make a
substantial contribution to predicting all of the above outcomes.
D. Multicollinearity for logistic regression
As stated in Chapter 3 (section 3.5.3.), variance inflation factor (VIF) values should
not be greater than 10 and indicate strong relationships between predictors (Field,
2005; Myers, 1990). All VIF values for these independent variables were less than
1.9, indicating no problems with multicollinearity. Tolerance levels are related to the
variance inflation factor, being its reciprocal (1/VIF) (Field, 2005). All tolerance
levels for a multicollinearity check should be more than 0.1 (Pallant, 2005). All

182
tolerance levels for the independent variables used for logistic regression in these
analyses were above 0.5, indicating no problems with multicollinearity (Appendix 7).
2.3. Factor analysis
This section provides results in respect of the five subscales evolved from factor
analysis. Factor analysis was calculated for the pilot study and as a post hoc analysis
to statistically define subgroups for the scores of the questionnaire (Chapter 3, Tables
3 & 4, section 2.3.3. B. & 2.3.4.). This allows measurement of stress, burnout and
associated individual responses for this sample of nurses and midwives according to
each of the five subscales, namely work environment, psychosocial effects, job
satisfaction, exhaustion and self-imposed work pressure and motivation. Work
environment, psychosocial effects and job satisfaction relate to stress; exhaustion
relates to burnout; and pressure and motivation relates to individual responses.
The aim of factor analysis is to explain as much of the variance in the data as possible
(Pallant, 2005). Factor analysis calculations produced the following findings in
relation to these five subscales and themes.
A. Stress
The overall factor structure for stress explained 54.7 per cent of variance in the data.
The work environment factor structure accounted for 8.3 per cent of variance
in the data.
Psychosocial effects of stress was the most dominant stress factor which
accounted for 35.4 per cent of variance in the data.
Job satisfaction accounted for 11 per cent of variance in the data.
B. Burnout
Exhaustion accounted for 51.9 per cent of variance in the data.
C. Individual responses
Pressure and motivation accounted for 52.5 per cent of variance in the data.
183
There might be other reasons why nurses and midwives were experiencing stress and
burnout and behaved the way they did at work, but the above findings account for
those levels related to each particular aspect of individual responses to stress and
burnout. In this way, it is possible to see what was pertinent for them.
2.3.1. Development of subscales for factor analysis
The outcome of factor analysis for the entire questionnaire resulted in development of
five separate subscales, namely, work environment, psychosocial effects of stress, job
satisfaction, exhaustion, and pressure and motivation (see Chapter 3, section 3.5.4. E.
Table 14 and Appendix 13 show all detailed calculations and explanations). These
subscales allowed assessment of this sample‟s associated individual responses to
overall stress and burnout levels. Each subscale relates to a specific area of concern or
effect from the nurses‟ and midwives‟ work life. Subscales can be used to realistically
assess nurses‟ stress levels in their working environments (AbuAlRub, 2004; Begat et
al., 2005; Humpel & Caputi, 2001; Jenkins & Elliott, 2004; O'Connor & Jeavons,
2002; Snelgrove, 1998). Assessing nurses‟ and midwives‟ stress levels by subscales
provides a more detailed focus on specific work issues so that solutions might target
appropriate areas. As stress and burnout are multidimensional constructs, previous
research has used subscales or components within questionnaires in an attempt to
realistically assess stress levels; (Greenglass & Burke, 2001; Huibers et al, 2003;
Mackin & Sinclair, 1998; Mansfield et al., 1989; Meltzer & Huckabay, 2004; Ryan &
Quayle, 1999).
As outlined in more detail in the methods chapter (Chapter 3), the accepted ten step
procedure regarding detailed factor analysis data presentation was followed in respect
of developing each of the five subscales (Chapter 3, section 3.5.4. C.). For a detailed
presentation of the complete factor analysis data set relating to each subscale, see
Appendix 13. The following presentation of data arising out of factor analysis is
limited to highlighting major critical steps in respect of each subscale.

184
A. Stress
Subscales: work environment, psychosocial effects of stress and job
satisfaction
Using Kaiser‟s criterion, the eigenvalue associated with the first and most dominant
factor was 5.6 and accounted for 29.3 per cent of variance, meaning that this factor
explained 29.3 per cent of the total variance in the data. The eigenvalue for the second
factor was 2.1 and accounted for 11 per cent of variance in the data. The eigenvalue
for the third factor was 1.6 and accounted for 8.3 per cent of variance in the data. The
eigenvalue for the fourth factor was 1.2 and accounted for 6.1 per cent of variance in
the data (see Table 78).
Table 78 Principal Component Analysis for Stress: Work Environment,
Psychosocial Effects and Job Satisfaction
Component Eigenvalue % Total
Variance
Cumulative
Eigenvalue
Cumulative %
Total Variance
Rotation Total
1 5.563 29.278 5.563 29.278 4.142
2 2.085 10.972 7.648 40.251 3.263
3 1.571 8.270 9.219 48.521 3.561
4 1.158 6.096 10.377 54.616 2.540
5 0.937 4.932 11.314 59.548
6 0.817 4.302 12.131 63.851
7 0.782 4.118 12.913 67.968
8 0.762 4.012 13.675 71.981
9 0.677 3.564 14.352 75.544
10 0.628 3.303 14.980 78.847
11 0.592 3.113 15.572 81.960
12 0.556 2.926 16.128 84.886
13 0.507 2.671 16.635 87.557
14 0.487 2.565 17.122 90.122
15 0.455 2.393 17.577 92.515
16 0.405 2.133 17.982 94.647
17 0.375 1.971 18.357 96.619
18 0.335 1.766 18.692 98.384
19 0.307 1.616 18.999 100.000

185
The scree plot graph prior to rotation, displayed a break following the fourth
component recommending the use of three factors (see Figure 11).
Figure 11

186
Stress included 19 questions which were assessed as relating to four factors (see Table
79).
Table 79 Contributory Loadings for Each Factor Before Rotation for Stress
(Cronbach‟s-α 0.843)
Stress Factor 1 Factor 2 Factor 3 Factor 4
Question or variable Associated
loading onto
factor
Associated
loading
onto factor
Associated
loading
onto factor
Associated
loading
onto factor
Incidence of stress 0.679
Length of depression 0.641
Depression over past decade 0.641 -0.419
Job dissatisfaction 0.632
Experiencing increased
anxiety
0.630
Sleeplessness over past decade 0.623 -0.448
Stress requiring treatment 0.612 0.473
Sleeplessness over past week 0.601
Rush to complete tasks 0.582 -0.453
Time management- workload 0.573 0.473
Organisational support 0.547
Helplessness over past decade 0.469
Mental health leave 0.434
Suited to work 0.596
Enjoying the type of work 0.424 0.592
Finishing work late -0.538
Leave professional discipline 0.445 0.527
Change area of practice 0.459 0.482
Headaches requiring analgesia 0.413 0.711

187
The percentage of residuals was 39 per cent (less than 50%) which means that this
model could be generalised beyond this sample. Oblique (direct oblimin) rotation
showed that the highest loading (sleeplessness over past decade) on the first and most
dominant factor seemed to relate to psychosocial effects of stress. The highest loading
on the second factor (enjoying the type of work) seemed to relate to job satisfaction.
The highest loading on the third factor (time management- workload) seemed to relate
to the work environment. The highest loading on the fourth factor (headaches
requiring analgesia) seemed to relate to physical ailments (see Table 80).
Table 80 Unique Contributions of Variables to Factors Following Oblique
Rotation for Stress (Pattern Matrix)
Stress Factor 1
Psychosocial
effects of stress
Factor 2 Job
satisfaction
Factor 3
Work
environment
Factor 4
Physical
Ailments
Question or variable Unique
contribution
Unique
contribution
Unique
contribution
Unique
contribution
Sleeplessness over past decade 0.790
Depression over decade 0.762
Helplessness over past decade 0.721
Length of depression 0.649
Experiencing increased anxiety 0.584
Sleeplessness over past week 0.491
Enjoying the type of work 0.779
Suited to work 0.720
Leave professional discipline 0.702
Change area of practice 0.700
Job dissatisfaction 0.470
Mental health leave
Time management- workload 0.864
Rush to complete tasks 0.824
Finishing work late 0.743
Incidence of stress 0.558
Organisational support 0.432
Headaches requiring analgesia 0.862
Stress requiring treatment 0.661
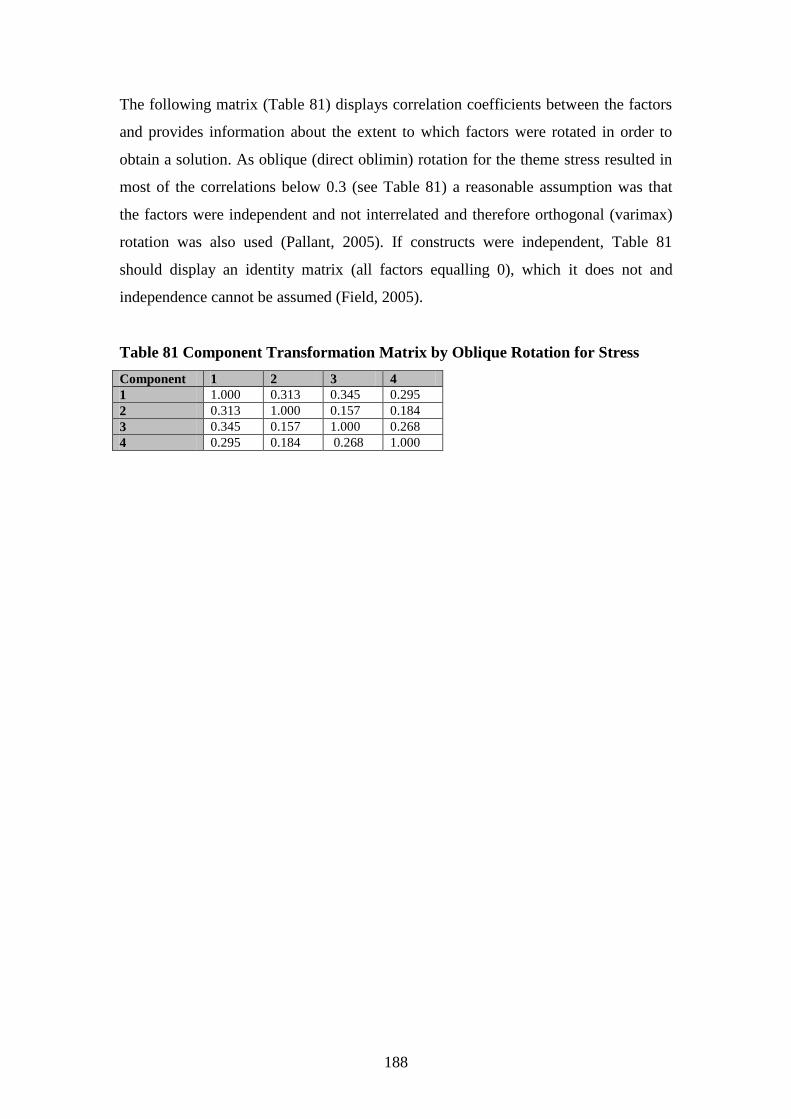
188
The following matrix (Table 81) displays correlation coefficients between the factors
and provides information about the extent to which factors were rotated in order to
obtain a solution. As oblique (direct oblimin) rotation for the theme stress resulted in
most of the correlations below 0.3 (see Table 81) a reasonable assumption was that
the factors were independent and not interrelated and therefore orthogonal (varimax)
rotation was also used (Pallant, 2005). If constructs were independent, Table 81
should display an identity matrix (all factors equalling 0), which it does not and
independence cannot be assumed (Field, 2005).
Table 81 Component Transformation Matrix by Oblique Rotation for Stress
Component 1 2 3 4
1 1.000 0.313 0.345 0.295
2 0.313 1.000 0.157 0.184
3 0.345 0.157 1.000 0.268
4 0.295 0.184 0.268 1.000

189
Discrepancies between the pattern matrix for oblique (direct oblimin) rotation (Table
80) and the orthogonal (varimax) rotation component matrix (Table 82) further
reinforce interrelated factors (Pallant, 2005). If constructs were independent, oblique
(direct oblimin) rotation would produce identical results to orthogonal (varimax)
rotation (see Tables 80 & 82), which they did not. Therefore, oblique (direct oblimin)
rotation is more meaningful than orthogonal (varimax) rotation (Field, 2005). This
further reinforces amalgamation of the four factors into three. The fourth factor, being
physical ailments, was included in the first factor, psychosocial effects of stress, as it
was included in the first factor before rotation and the scree plot suggested three
factors. For more detailed analysis and discussion of the factors, work environment,
psychosocial effects of stress and job satisfaction, see Appendix 13.
Table 82 Rotated Component Matrix by Orthogonal Rotation for Stress
Stress Factor 1
Psychosocial
effects of stress
Factor 2 Job
satisfaction
Factor 3
Work
environment
Factor 4
Physical
Ailments
Question or variable Unique
contribution
Unique
contribution
Unique
contribution
Unique
contribution
Sleeplessness over past decade 0.760
Depression over decade 0.742
Helplessness over past decade 0.667
Length of depression 0.656
Experiencing increased anxiety 0.603
Sleeplessness over past week 0.527 0.400
Availability of time- workload 0.835
Rush to complete tasks 0.810
Finishing work late 0.703
Incidence of stress 0.602
Organisational support 0.458
Enjoying the type of work
Suited to work 0.762
Leave professional discipline 0.699
Change area of practice 0.697
Job dissatisfaction 0.692
Mental health leave 0.504
Headaches requiring analgesia 0.834
Stress requiring treatment 0.683
B. Burnout
Subscale- exhaustion
Using Kaiser‟s criterion, the eigenvalue associated with the first and most dominant
factor was 3.9 and accounted for 38.8 per cent of variance, indicating that this factor
for exhaustion explained 38.8 per cent of the amount of the total variance in the
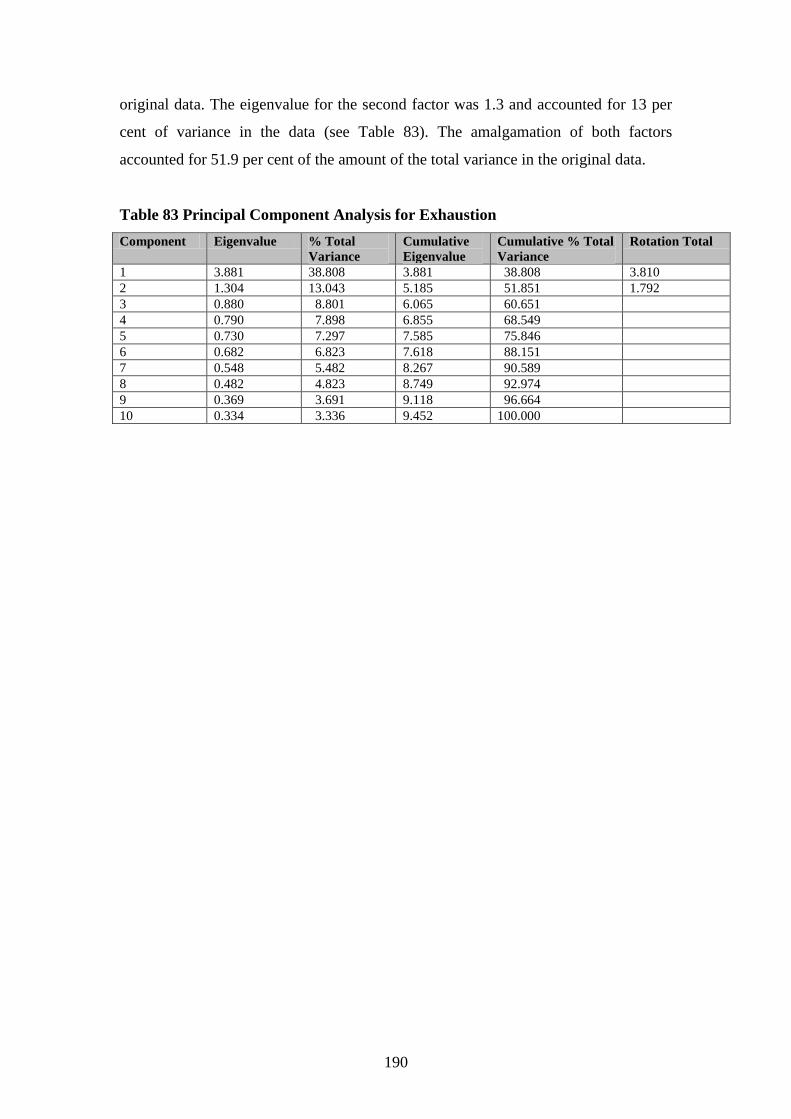
190
original data. The eigenvalue for the second factor was 1.3 and accounted for 13 per
cent of variance in the data (see Table 83). The amalgamation of both factors
accounted for 51.9 per cent of the amount of the total variance in the original data.
Table 83 Principal Component Analysis for Exhaustion
Component Eigenvalue % Total
Variance
Cumulative
Eigenvalue
Cumulative % Total
Variance
Rotation Total
1 3.881 38.808 3.881 38.808 3.810
2 1.304 13.043 5.185 51.851 1.792
3 0.880 8.801 6.065 60.651
4 0.790 7.898 6.855 68.549
5 0.730 7.297 7.585 75.846
6 0.682 6.823 7.618 88.151
7 0.548 5.482 8.267 90.589
8 0.482 4.823 8.749 92.974
9 0.369 3.691 9.118 96.664
10 0.334 3.336 9.452 100.000

191
A scree plot graph prior to rotation, displays a break following the third component
recommending the use of two factors (see Figure 12).
Figure 12

192
As previously mentioned in Chapter 3 (section 3.5.4.), Pallant (2005) reiterates that as
factor analysis is a data exploration technique, the interpretation and judgement is left
to the researcher, rather than specific statistical rules. These factors were condensed
into the same factor, as only two of the factors (losing empathy for colleagues and
clients) were segregated from the first factor. Ten questions for the fourth subscale,
exhaustion, extrapolated two factors (Table 84). The highest loadings for the first
factor are related to how the individual feels when exhausted. The second factor
relates to how exhaustion affects other people.
Table 84 Contributory Loadings for Each Factor Before Rotation for Exhaustion
(Cronbach‟s-α 0.793)
Exhaustion Factor 1 Factor 2
Question or variable Associated loading onto factor Associated loading onto factor
Experiencing low morale 0.790
Feeling powerless 0.789
Feeling undervalued 0.726
Feeling overwhelmed 0.671
Feeling emotionally drained 0.649
Apathy 0.596
Feelings of incompetence 0.594
Fatigue 0.504
Loss of empathy for colleagues 0.767
Loss of empathy for clients 0.744
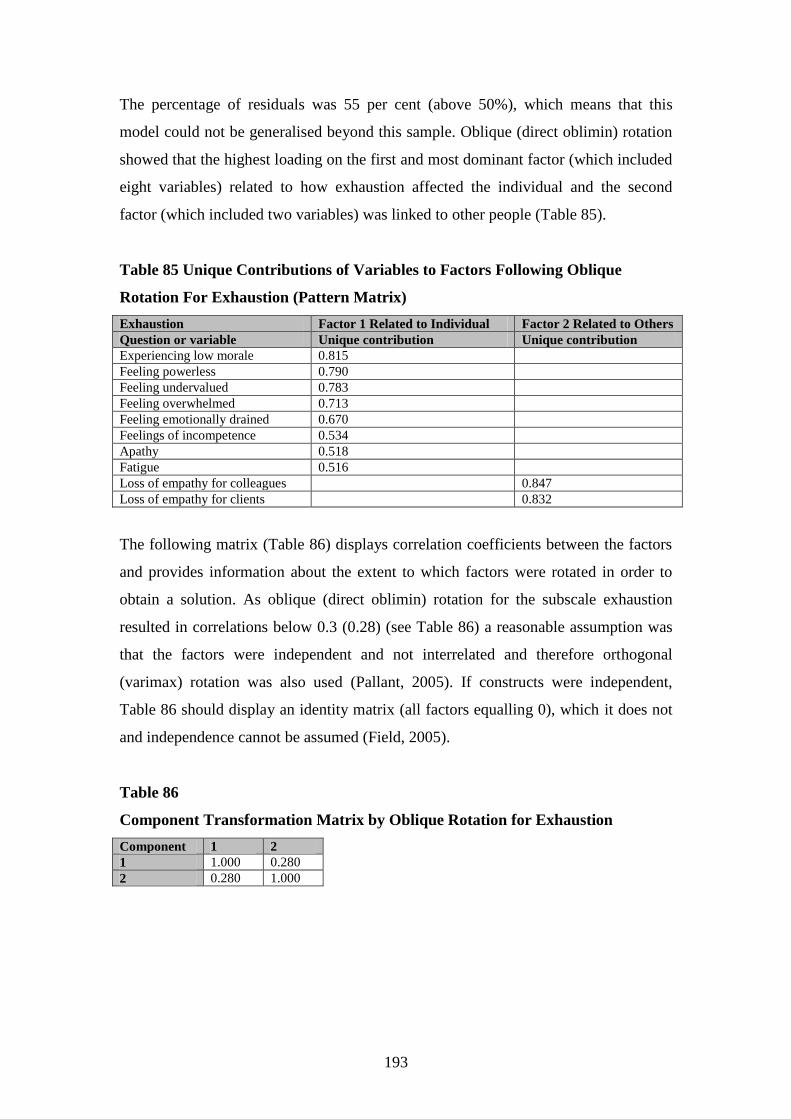
193
The percentage of residuals was 55 per cent (above 50%), which means that this
model could not be generalised beyond this sample. Oblique (direct oblimin) rotation
showed that the highest loading on the first and most dominant factor (which included
eight variables) related to how exhaustion affected the individual and the second
factor (which included two variables) was linked to other people (Table 85).
Table 85 Unique Contributions of Variables to Factors Following Oblique
Rotation For Exhaustion (Pattern Matrix)
Exhaustion Factor 1 Related to Individual Factor 2 Related to Others
Question or variable Unique contribution Unique contribution
Experiencing low morale 0.815
Feeling powerless 0.790
Feeling undervalued 0.783
Feeling overwhelmed 0.713
Feeling emotionally drained 0.670
Feelings of incompetence 0.534
Apathy 0.518
Fatigue 0.516
Loss of empathy for colleagues 0.847
Loss of empathy for clients 0.832
The following matrix (Table 86) displays correlation coefficients between the factors
and provides information about the extent to which factors were rotated in order to
obtain a solution. As oblique (direct oblimin) rotation for the subscale exhaustion
resulted in correlations below 0.3 (0.28) (see Table 86) a reasonable assumption was
that the factors were independent and not interrelated and therefore orthogonal
(varimax) rotation was also used (Pallant, 2005). If constructs were independent,
Table 86 should display an identity matrix (all factors equalling 0), which it does not
and independence cannot be assumed (Field, 2005).
Table 86
Component Transformation Matrix by Oblique Rotation for Exhaustion
Component 1 2
1 1.000 0.280
2 0.280 1.000

194
Discrepancies between the pattern matrix for oblique (direct oblimin) rotation (Table
84) and the orthogonal (varimax) rotation component matrix (Table 87) further
reinforce interrelated factors (Pallant, 2005). If constructs were independent, oblique
(direct oblimin) rotation would produce identical results to orthogonal (varimax)
rotation (see Tables 85 & 87), which it does not. Therefore, oblique (direct oblimin)
rotation is more meaningful than orthogonal (varimax) rotation (Field, 2005). This
further reinforces amalgamation of the two factors into one. For more detailed
analysis and discussion for the factor exhaustion, see Appendix 13.
Table 87 Rotated Component Matrix by Orthogonal Rotation for Exhaustion
Exhaustion Factor 1 Related to Individual Factor 2 Related to Others
Question or variable Unique contribution Unique contribution
Experiencing low morale 0.801
Feeling powerless 0.783
Feeling undervalued 0.760
Feeling overwhelmed 0.695
Feeling emotionally drained 0.658
Feelings of incompetence 0.546
Apathy 0.536
Fatigue 0.508
Loss of empathy for colleagues 0.837
Loss of empathy for clients 0.870
C. Individual responses
Subscale- pressure and motivation
Using Kaiser‟s criterion, the eigenvalue associated with the first factor was 3.2 and
accounted for 39.5 per cent of variance pointing out this factor for pressure and
motivation explained 39.5 per cent of the amount of the total variance in the original
data. The eigenvalue for the second factor was 1.1 and accounted for 13 per cent of
variance in the data (see Table 88). The amalgamation of both factors accounted for
52.5 per cent of the amount of the total variance in the original data.
Table 88 Principal Component Analysis for Pressure and Motivation Component Eigenvalue % Total
Variance
Cumulative
Eigenvalue
Cumulative %
Total Variance
Rotation Total
1 3.158 39.475 3.158 39.475 2.858
2 1.142 12.686 4.300 52.467 2.196
3 0.979 12.232 5.279 64.699
4 0.724 9.049 6.003 73.748
5 0.649 8.112 6.652 81.86
6 0.561 7.010 7.213 88.87
7 0.521 6.507 7.734 95.377
8 0.370 4.624 8.104 100.000

195
The scree plot graph prior to rotation shows a break following the second and third
components, justifying retaining either one or three factors (Figure 13).
Figure 13

196
Field (2005) states that, as factor analysis is used as a guide about patterns within the
data, researchers might exercise their own discretion and the decision on the number
of factors to extract depends on the reasons for initial analysis. As all the variables
were included in the first factor and the percentage of variance was higher for the first
factor, a decision was made to leave these variables as one factor. This means that an
overall combined factor score was obtained for pressure and motivation from all of
the loadings from the first factor instead of separating the scores between factor one
and factor two. Factor analysis identified two factors concerning the subscale,
pressure and motivation (Table 89).
Table 89 Contributory Loadings for Each Factor Before Rotation for Pressure
and Motivation (Cronbach‟s-α 0.772)
Pressure and motivation Factor 1 Pressure Factor 2 Motivation
Question or variable Associated loading onto factor Associated loading onto factor
Pushed for time 0.736
Achieving more in less time 0.729
Unreasonable expectations 0.724
Keyed up 0.624 0.405
Irritability 0.590
Multi-tasking 0.573 0.581
Difficulty slowing down 0.514
Working at high performance 0.480 0.450
The percentage of residuals was 57 per cent (above 50%) which means that this model
could not be generalised beyond this sample. Oblique (direct oblimin) rotation
resulted in a pattern matrix (see Table 90). The first factor with the highest loading
(unreasonable expectations) seems to relate to the individual and the second factor
with the highest loading (multi-tasking) seems to relate to outcomes of pressure. (For
more information on factor rotation for pressure and motivation see Appendix 13).
Table 90 Unique Contributions of Variables to Factors Following Oblique
Rotation for Pressure and Motivation (Pattern Matrix)
Pressure and motivation Factor 1 Related to individual Factor 2 Outcomes
Question or variable Unique contribution Unique contribution
Unreasonable expectations 0.780
Irritability 0.755
Achieving more in less time 0.740
Pushed for time 0.674
Difficulty slowing down 0.508
Multi-tasking 0.836
Keyed up 0.676
Working at high performance 0.662
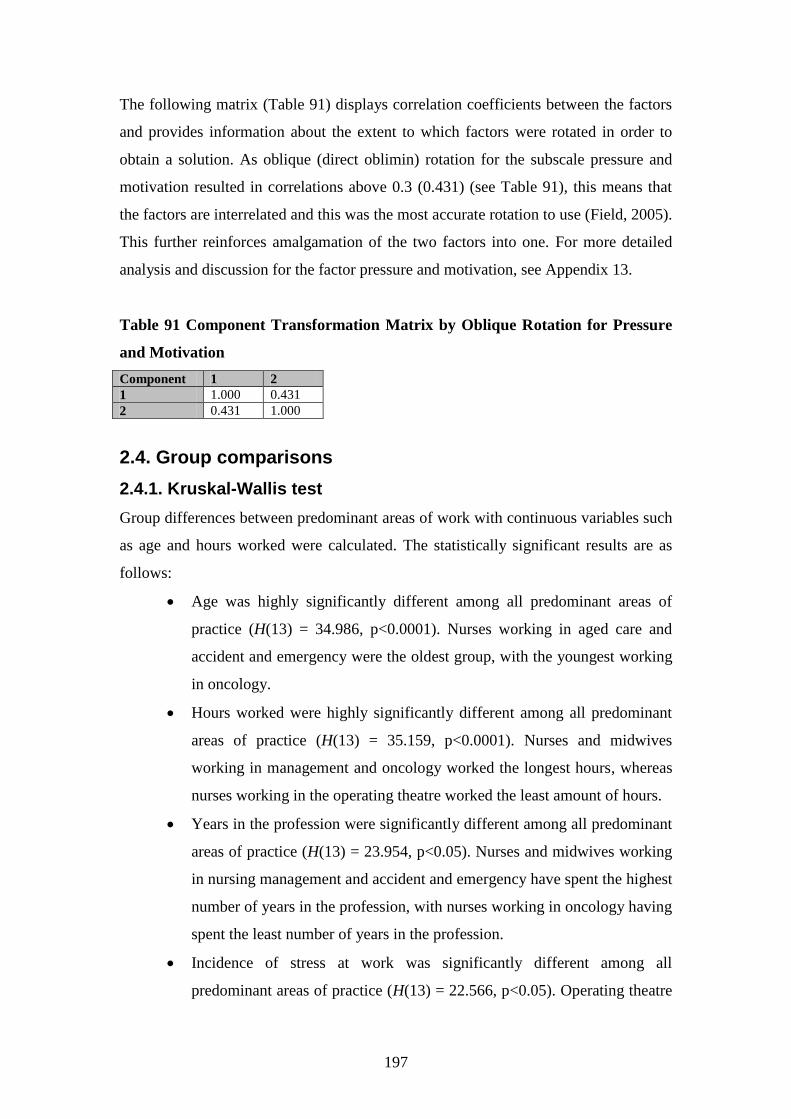
197
The following matrix (Table 91) displays correlation coefficients between the factors
and provides information about the extent to which factors were rotated in order to
obtain a solution. As oblique (direct oblimin) rotation for the subscale pressure and
motivation resulted in correlations above 0.3 (0.431) (see Table 91), this means that
the factors are interrelated and this was the most accurate rotation to use (Field, 2005).
This further reinforces amalgamation of the two factors into one. For more detailed
analysis and discussion for the factor pressure and motivation, see Appendix 13.
Table 91 Component Transformation Matrix by Oblique Rotation for Pressure
and Motivation
Component 1 2
1 1.000 0.431
2 0.431 1.000
2.4. Group comparisons
2.4.1. Kruskal-Wallis test
Group differences between predominant areas of work with continuous variables such
as age and hours worked were calculated. The statistically significant results are as
follows:
Age was highly significantly different among all predominant areas of
practice (H(13) = 34.986, p<0.0001). Nurses working in aged care and
accident and emergency were the oldest group, with the youngest working
in oncology.
Hours worked were highly significantly different among all predominant
areas of practice (H(13) = 35.159, p<0.0001). Nurses and midwives
working in management and oncology worked the longest hours, whereas
nurses working in the operating theatre worked the least amount of hours.
Years in the profession were significantly different among all predominant
areas of practice (H(13) = 23.954, p<0.05). Nurses and midwives working
in nursing management and accident and emergency have spent the highest
number of years in the profession, with nurses working in oncology having
spent the least number of years in the profession.
Incidence of stress at work was significantly different among all
predominant areas of practice (H(13) = 22.566, p<0.05). Operating theatre
198
and surgical areas had the highest scores, with recovery area reporting the
lowest.
Experiencing anxiety as a psychosocial effect of stress was significantly
different among all predominant areas of practice (H(13) = 22.036,
p<0.05). Accident and emergency and aged care areas reported
experiencing most anxiety, with critical care area reporting the least
anxiety.
Feelings of powerlessness as a factor linked with burnout were
significantly different among all predominant areas of practice (H(13) =
23.129, p<0.05). Accident and emergency and oncology areas had the
highest scores, with recovery area reporting the lowest.
The groups of nurses and midwives working in higher risk workplaces or practice
specialties experiencing stress and burnout are those working in operating theatre,
surgical, accident and emergency and aged care. However, as these groups were
relatively small, generalisations cannot be applied for the existing nursing and
midwifery workforce. For more detailed results concerning all relevant and
appropriate Kruskal-Wallis test calculations, see Appendix 14.
3. Summary
The factors linked with stress for this study related to environmental, organisational
and psychosocial aspects and job dissatisfaction. The majority (59%) of this sample
experienced moderate stress levels overall with 76 per cent of nurses and midwives
experiencing moderate stress levels related to the work environment, which included
almost half (49.7%) either occasionally or never receiving sufficient organisational
support. The majority (56%) of this sample of nurses and midwives experienced
minimal psychosocial effects of stress, with 44 per cent experiencing moderate to
excessive psychosocial effects of stress. The majority (96%) of this sample of nurses
and midwives showed moderate to high job satisfaction levels, however the majority
(57.6%) reported experiencing job dissatisfaction at least once a month.
Factor analysis identified three factors as contributing to overall stress levels being the
work environment, psychosocial effects and job dissatisfaction. When all factors are

199
considered together, the most dominant stress factor was identified as psychosocial
effects of stress for this sample of nurses and midwives, reinforcing this important
aspect of stress (accounted for 35.4% of variance in the data compared to 8.3% for
work environment and 11% for job dissatisfaction). However, when all these
subscales are considered separately in relation to overall percentages, stress related to
the work environment was identified as the area of concern (83% moderate to
excessive levels as compared with 44% moderate to excessive levels for psychosocial
effects and 4% job dissatisfaction). These results differ as factor analysis performs
distinct functions of principal component analysis identifying factors representing
relationships between variables, whereas overall percentages of subscales are
calculated from respondents‟ scores.
The factors linked with burnout and exhaustion for this study related to apathy, low
morale, powerlessness, feeling undervalued, overwhelmed and emotionally drained,
feelings of incompetence, fatigue and loss of empathy for colleagues and clients. The
majority (54%) of nurses and midwives experienced moderate burnout levels. The
majority (53%) of nurses and midwives scored moderate levels of self-imposed work
pressure and motivation, with over half (58%) of respondents indicating that they
frequently or more often placed unreasonable expectations on themselves. Other
factors relating to individual responses included achieving more than time allows,
irritability, being pushed for time, difficulty slowing down for procedures, working at
high performance, being keyed up on most days and multi-tasking.
For this study sample of nurses and midwives, there were associations between stress,
burnout and individual responses to workplace issues. Stress was positively associated
with burnout. Psychosocial effects of stress, work environment stress and job
dissatisfaction were all positively associated with exhaustion. Work environment
stress was positively associated with psychosocial effects of stress and high self-
imposed work pressure and motivation. Psychosocial effects of stress were positively
associated with job dissatisfaction.
There were particular demographics which increased the likelihood of associated
individual responses to experiencing stress and burnout. For this study sample of

200
nurses and midwives, they were more likely to experience sleeplessness and burnout
if they worked longer hours. They were less likely to take “mental health” leave if
they were older and if they had worked longer in the profession. If the nurse or
midwife was more educated, they were less likely to place unreasonable expectations
upon themselves. For this study, operating theatre, surgical, accident and emergency,
aged care and oncology were identified as higher risk workplaces or practice
specialties for nurses who were experiencing stress and burnout.

201
Chapter 5
Discussion
This chapter will explore the various aspects of individual responses to stress and
burnout for this sample of nurses and midwives. Firstly, questionnaire return rates and
demographics will be compared with other similar published studies, and with state
and national statistics. The remainder of the chapter will discuss stress, burnout and
individual responses in relation to this study‟s specific, as well as overall results; it
concludes with a discussion linking the results with the conceptual framework. As
summarised in Chapters 3 and 4, the conceptual framework identified in this study
relates to the work environment, psychosocial effects of stress, job satisfaction,
exhaustion, and pressure and motivation. Stress relates to the work environment,
psychosocial effects and job dissatisfaction; burnout relates to exhaustion; and
individual responses relate to self-imposed work pressure and motivation.
This study explored workplace stress and burnout as experienced by nurses and
midwives. Several variables were explored including time pressures, organisational
support, sleeplessness, depression, not enjoying work, low morale, a sense of
powerlessness, feeling exhausted and overwhelmed, expecting more than reasonably
possible, working at high performance and multi-tasking. These issues can prevent
nurses and midwives being able to empathise with colleagues and clients, leading to
poor quality client care.
202
1. Questionnaire return rate and demographics
1.1. Questionnaire return rate
There were 1358 respondents in the study with a response rate of 562. Response rates
in research studies among health professionals are usually poor (Ng et al., 1999).
However, a return rate of 41.4 per cent is comparable to other published research
findings with large samples investigating stress and burnout (see Appendix 15 for
more detail).
1.2. Demographics - comparison of national workforce with
study sample
Important to the findings of this research was the review of previous, similar studies
and whether findings from this study seemed congruent or otherwise with the work of
others. For instance, certain socio-demographic variables such as marital status might
contribute to stress and burnout (Kotzabassaki & Parissopoulos, 2003). Makinen et al.
(2003) recommend that future research examine different modes of work and client
characteristics when looking at stress levels. The following demographics are
therefore pertinent in relation to discussion and analysis of levels of stress and burnout
for nurses and midwives from this study.
1.2.1 Gender
Nursing remains a predominantly female occupation and midwifery not unexpectedly
has a disproportionately high number of females, even though the proportion and
number of male nurses in the remaining general nursing populations have been
increasing. The proportion of female nurses / midwives in the current study is even
higher than that for Australia as a whole (98.9% compared to 91.6% respectively)
(Chrisopoulos & Waters, 2003). Clearly, the high number of midwives targeted for
this study accounted for this difference.
1.2.2. Area of practice
The areas of practice identified by the respondents in this study were similar to those
noted in the national sample. The percentages of nurses working in the oncology area
are lower for the study sample (0.4%) in comparison with the national sample (2.7%).

203
The percentages of nurses working in the aged care sector are also considerably lower
in the study sample (0.6%) compared with the national sample (23.7%), possibly
because midwifery conferences were primarily used to access respondents. Due to the
sampling method applied in this project / study, percentages of the midwifery sample
(48.8%) are substantially greater than the national (10.2%) sample. The percentage of
the community nursing study sample (21.9%) is also much larger than the national
sample (6.3%), possibly because the wound conference (one of the conferences at
which respondents attended) consisted mainly of community nurses. The numbers of
nurses / midwives working in all areas, in all jobs, for this study sample; the national
sample (Chrisopoulos & Waters, 2003); and for nurses and midwives working in their
main clinical job in the NSW (Workforce Planning NSW Health, 1999-2003) samples
in 2003 are compared in Appendix 12.
1.2.3. Age in years
The following information regarding age highlights the escalating issue of the ageing
nurse and midwife workforce and its contribution to the severe nursing shortage, with
the average age of registered nurses being 45.4 years (Chang et al., 2005; Goodin,
2003). The NSW Nurses Association (2008h) reports that those nurses and midwives
currently working in Australia, aged 45 years and over, will retire in the following ten
to 15 years. The age range for this study is similar to national statistics. In 2005, the
average age in this study was 45 years which was also similar to national statistics
(43.2 years in 2004) (AIHW, 2006). Again, these comparisons included the large
sample size for the national sample, being 228,230, compared with 552 for this study
(see Appendix 16 for more detail).
1.2.4. Hours worked per week
The questionnaire identified that nurses and midwives in this study worked slightly
more average (fulltime, part-time and casual) hours per week (34.5 hours) as
compared with the national sample (33.1 hours) (AIHW, 2006). Sydney University is
currently undertaking research with nurses working in the public health system and
their study has shown that fulltime nurses work an average of 43 hours per week and
part-timers work an average of 29 hours per week (NSW Nurses Association, 2008i).
These figures are comparable with this study of nurses and midwives identifying an

204
average of 42.5 hours per week for fulltimers and an average of 27.7 hours per week
for part-timers.
As hours worked per week for all employed nurses and midwives was compared with
total number of nurses and midwives by age for Australia, comparisons were also
made with this study sample (Table 92) (Chrisopoulos & Waters, 2003). When
comparing this study sample and the national sample for the age groups, less than 25
years of age, and 25-34 years of age, the same proportions (14.3% and 18.3%) work
an average of 25-34 hours per week. Similar proportions (71.4% compared to 72.4%
and 50% compared to 49.1%) of this study sample and the national sample aged less
than 25 years of age and 25-34 years of age work an average of 35-44 hours per week.
For the age groups, 35-44 years of age, 45-54 years of age and 55+ years of age,
similar proportions (25.4% compared to 21.8%, 24% compared to 25.1% and 29.4%
compared to 23.8%) work 25-34 hours per week and 35-44 hours per week (30.1%
compared to 36.1%, 46.9% compared to 45% and 42.6% compared to 40.8%). This
study also found that percentages of nurses and midwives of all ages working 45
hours or more were generally higher in comparison to the national sample. This could
be associated with the „specialty‟ nature of this sample in that almost half (46.3%) of
this sample worked in the specialty area of midwifery.
Table 92 Comparison of Age and Hours Worked Per Week Between Study and
National Samples
Hours worked per week %
Age % <25 25-34 35-44 45+ Total
%
Total number
<25 S= 0
N= 10.5
S = 14.3
N = 14.3
S = 71.4
N = 72.4
S = 14.3
N = 2.7
100 S = 7 1.3%
N = 8,512 3.7%
25-34 S = 18.3
N = 29.4
S = 18.3
N = 18.3
S = 50
N = 49.1
S = 13.3
N = 3.2
100 S = 60 10.9%
N = 47,958 21%
35-44 S = 34.1
N = 39.3
S = 25.4
N = 21.8
S = 30.1
N = 36.1
S = 10.4
N = 2.8
100 S = 173 31.5%
N = 76, 556 33.5%
45-54 S = 18.7
N = 26.7
S = 24
N = 25.1
S = 46.9
N = 45
S = 10.4
N = 3.1
100 S = 241 43.9%
N = 68,304 30%
55+ S = 13.2
N = 33.3
S = 29.4
N = 23.8
S = 42.6
N = 40.8
S = 14.7
N = 2.1
100 S = 68 12.4%
N = 26,899 11.8%
Total % S = 22.6
N = 31.7
S = 24.4
N = 22
S = 41.7
N = 43.4
S = 11.3
N = 2.9
100 S = 549 100%
N = 228,230 100%
Legend = S = this study sample N = national sample

205
The national sample did not collect information on years in profession and
qualifications so comparisons were only made with other studies.
1.3 Demographics - comparison of other studies with this
study
1.3.1. Years in profession
Nurses and midwives in this sample had an average of 22 years‟ experience. This is
comparable to Laschinger et al‟s (2001b) study which showed nurse managers had an
average of 25 years and Cohen-Katz et al‟s (2005) study on nurse stress and burnout
who had an average of 21 years of experience. For this project, those nurses working
in accident and emergency were found to have spent the most years in the profession
compared with all other areas of practice (Appendix 14). No other studies investigated
years in profession in relation to the predominant areas of practice. Those nurses and
midwives who were older in this study had spent more years in the profession,
indicating that the older nurses and midwives were more likely to be experienced.
Kent and Lavery (2007) found the same results in a nurse sample in Victoria; that
older nurses had spent more years in practice.
1.3.2. Qualifications
Forty-seven per cent of this study sample of nurses and midwives holding a degree or
higher was comparable with Morrow, McElroy and Elliott‟s (1994) sample of hospital
nurses (48.8%) with the same qualifications. The majority (73%) of Laschinger et al‟s
(2006) sample of nurse managers also held a degree, the percentage being much
higher as the study specifically focused on managers rather than clinicians. The
majority (62%) of all nurses in Cohen-Katz et al‟s (2005) study on hospital stress also
held a degree.
2. Stress, burnout and individual responses
The conceptual framework linking stress, burnout and individual responses will now
be explored in further detail. Themes, categories and subscales relate directly to the
conceptual framework developed for this study (see Chapter 3, Table 14). Themes
include stress, burnout and individual responses and categories include occupational

206
stress, stress leading to ill health, job compatibility, prolonged exposure to stress and
work behaviours such as self-imposed work pressure and motivation. As presented in
Chapters 3 and 4, the five main subscales are work environment, psychosocial effects
of stress, job satisfaction, exhaustion, and pressure and motivation. This conceptual
framework relates to the three major work theories. The three major work theories
include the Effort-Reward Imbalance (Vroom, 1964), Karasek‟s (1979) Demand-
Control Model and the Person-Fit Theory (Mansfield et al., 1989) (Chapter 2, section
2). Table 93 displays a representation of how the themes, categories and subscales are
linked within this conceptual framework.
Table 93 Work Theories Relationship with Conceptual Framework for Stress,
Burnout and Individual Responses Developed for Current Project
Work Theory Theme Category Subscale
Karasek‟s* Demand-Control
Theory
Person-Fit Theory
Stress Occupational stress Work environment
Karasek‟s* Demand-Control
Theory
Person-Fit Theory
Stress Stress leading to ill
health
Psychosocial effects
Person-Fit Theory Stress Job compatibility Job satisfaction
Vroom‟s ^ Motivational /
Expectancy Theory or Effort /
Reward Theory
Karasek‟s* Demand-Control
Theory
Person-Fit Theory
Burnout Prolonged exposure
to stress
Exhaustion
Vroom‟s ^ Motivational /
Expectancy Theory or Effort /
Reward Theory
Individual
Responses
Work behaviours
such as self-imposed
work pressure and
motivation
Pressure and
motivation
* (1979) ^ (1964)
2.1. Factors linked with stress
For this study, the factors linked with stress related to the work environment,
psychosocial effects and job dissatisfaction. Stress related to the work environment
included time pressures and insufficient organisational support. Psychosocial effects
of stress related to physical and emotional ailments, which were the most dominant
factors relating to stress. Even though these nurses and midwives were stressed, it was
evident that they enjoyed their work and this enjoyment was possibly one of the
reasons why they had not left their profession.
207
As previously defined, for the purpose of this study stress is:
an inability to control the work environment
which leads to considerable pressure and job
dissatisfaction amongst working team members.
This might contribute to feelings of unease at the
initial episode of stress and involve an array of
symptoms characteristic of ill health over a
prolonged period of time in the helping
professions.
Overall, the majority (59%) of nurses and midwives in this sample reported moderate
levels of stress. McGrath, Reid and Boore (2003) also found that the majority of their
sample of nurses reported moderate to high levels of stress resulting from insufficient
time to perform tasks to their satisfaction.
Very few (4%) nurses and midwives in this study reported high levels of stress.
Considering anecdotal reports by nurses and midwives about high levels of stress, this
is a surprising finding. Wheeler and Riding (1994) and Ryan and Quayle (1999) also
came to the same conclusions that few of their nurses reported their job as extremely
stressful which would suggest that they, also, are not experiencing high levels of
stress.
2.1.1. Work environment
Nurses and midwives face numerous challenges within the work environment which
affects their work lives. Few studies have specifically examined nurses‟ and
midwives‟ work environments. Beaudoin and Edgar (2003) and Chang et al. (2005)
recommend studying various aspects of these environments. Many aspects of stress in
the work environment relate to the work theory of demand and control which is
Karasek‟s (1979) Demand-Control Model. If demands on an individual are excessive,
this seems to place their environment out of control and an individual loses the ability
to control or cope with the situation. The environment in the healthcare system
incorporates a range of work-related hazards, including frequent patient transfer and
nurses interacting with varied healthcare providers (Stringer, 2001). Processes within
208
the healthcare system could perhaps be streamlined to reduce these occupational
hazards in recognition of the stress associated with inefficient or less than optimum
processes.
Karasek‟s (1979) Demand-Control Model shows that job demands are expected and
present within the work environment. These stressors consist of: how hard and how
fast one performs tasks, the chaotic nature of the work, whether there is sufficient
time to perform tasks, time pressure deadlines, amount of work, level of
concentration, conflicting demands and frequency of work interruptions. All of these
factors can be found in large measures in nursing and midwifery workplaces.
Karasek‟s (1979) findings and the current study would support the importance of
understanding the inter-relationships of the various work demands in the healthcare
workplace.
Results of this and other similar studies could help develop quality work
environments on which retention of nurses and midwives in the profession depend. It
is imperative to construct a working environment promoting the health of nurses and
midwives. As results of this study from the work environment related to time
pressures (for example, due to excessive workloads), this information informs the
profession to target these areas. In conjunction with developing quality work
environments and ensuring safe and working equipment, moderating workloads is
necessary to retain the existing workforce. The NSW Nurses Association (2007a) has
already initiated a workloads breakthrough for nurses in emergency departments,
community health and mental health. This allows nurses‟ input into workload
assessment and provides them with the power to address these workload issues. With
ongoing liaison, dialogue and contact between all interested parties, be that policy
makers, senior management and clinical nurses and midwives, these breakthroughs
can hopefully infiltrate into other areas of nursing and midwifery. Monitoring and
evaluating the effects of these new „workload‟ arrangements is not only essential in
order to document any positive consequences, but, should any positive effects be able
to be documented and well communicated throughout the relevant health services, this
will also facilitate implementing such workload strategies throughout the nursing
profession.

209
The work environment also relates to, and overlaps somewhat with, the Person-Fit
Theory. The literature review identified that if excessive demands are continuous
stress levels gradually increase and might indicate a poor fit between an individual‟s
abilities and their work environment. The literature also found that inappropriate and
heavy workloads and low levels of control over work lead to emotional exhaustion
and stress is a result of friction between the environment and the individual. In
contrast, if personal expectations and work environment conditions fit together, nurses
can engage with their work and work effectively. The results of this nurse and
midwife study support the findings of these other studies.
As the majority (76%) of this study‟s respondents experienced moderate stress levels
related to the work environment (this being different from overall (59%) stress levels,
which includes work environment, see Chapter 4, section 1.2.1.), there is a need for
nurses and midwives to work closely with policy makers and managers so that an
attempt to improve their working environments can be prioritised. This involves
constant discussions and regular meetings with nurses and midwives working in
clinical areas so that problems pertaining to the work environment can be identified.
Other studies have identified that environmental work-related and social issues such
as organisational, interdepartmental relations and nurse / client relations are the most
frequent stressors and nurses‟ experience of stress were related to the social
environment where they worked. As suggested by this study and these other previous
studies, -it is imperative to construct a working environment promoting the health of
nurses and midwives.
This stress and burnout questionnaire for nurses and midwives addressed not only the
perceived severity of stressful events in the work environment but the frequency of
these events. The fact that no nurse or midwife answered „never‟ to the question, „In
your work environment, how often have you experienced stress?‟, indicates that their
work environments always have an element of stress or that they anticipated a certain
level of stress associated with their work environment. According to the results of this
particular question, the majority (65.1%) of this sample of nurses and midwives
reported that they frequently or more often encountered stress in their work

210
environment. It is well recognised in the stress literature that nurses‟ work
environments are stressful (Humpel & Caputi, 2001).
For most of this sample stress is intermittent, as only a small proportion (1.3%) of
nurses and midwives in this sample stated that they always encounter stress. It is
essential for managers to identify and work with nurses and midwives who are
continually encountering stress and this might simply mean assessment by face-to-
face interaction in the clinical areas. Nurses and midwives, then, might at least feel
that their stress is being addressed in the workplace. Similarly, nurses and midwives
in the clinical areas need to be outspoken and alert their managers if their stress levels
are becoming unmanageable before they reach the stage of burnout. When health
professionals experience stress, it is usually accompanied by coping efforts to
overcome sources of stress, in an attempt by the person to regain a stable level of
productivity. If demands are continuous, the stressed nurse or midwife could be
susceptible to burnout. Bailey (1985) found that continuous environmental demands
being placed upon nurses at any time eventually lead to burnout.
Inefficient time management (for example, due to excessive workloads), was a
double-barrelled question and it was difficult to ascertain whether the issue was time
management or excessive workload. Despite this shortcoming, the majority (69.7%)
of nurses and midwives in this sample reported that they were frequently or more
often dealing with inefficient time management (for example, due to excessive
workloads). If workloads are excessive, nurses and midwives will be continually
dealing with inefficient time management. The literature urges the profession to
review various aspects of the work environment that will in turn reduce stress, affect
job satisfaction and influence quality care. Work overload and all its implications is a
primary factor for nurses leaving their profession (Chang et al., 2005).
Job design and workload should be rescheduled in novel ways so that work pressures
are reduced for nurses and midwives (Stordeur, D‟Hoore & Vandenberghe, 2003).
Nurses‟ and midwives‟ workloads could be managed effectively so that they work as
a team. This means addressing staff issues by looking at the skill mixes of those
particular nurses and midwives working on the same shift. There needs to be a

211
balance of all skill mixes on all shifts so that junior nurses and midwives have some
form of leadership so that they can function effectively and feel competent with their
assigned workload. If some shifts are staffed with all junior nurses and midwives, they
might be dealing with situations with which they cannot cope, as they do not have the
experience, and they therefore become stressed. If other shifts are staffed with all
senior nurses and midwives, their experience is not being utilised effectively and their
leadership skills and experience are being wasted. More senior and experienced
nurses and midwives need to consider the „big picture‟ and not only „look after their
own welfare‟. It is the responsibility of nurses and midwives working in the clinical
areas when they are self-rostering that they take their own experience into
consideration and roster themselves accordingly, to reduce the possibility of
workplace stress.
Commissioner Garling (The Garling Inquiry) is currently recommending an action
plan to provide training and mentoring to younger nurses with more senior staff. The
healthcare system will see a changing role for Nursing Unit Managers in the future.
The key objectives are to decrease paper workloads and free up senior nurses such as
nursing unit managers to provide more clinical support and nurse leadership where
they are needed. Garling (Nurses Association NSW, 2008k) also addresses better
team-based education in the recommendations to increase power and responsibility
for nurses and midwives and evidence-based nursing practice.
Nurses and midwives can also distribute workloads more effectively on each
particular shift. For example, especially if staffing levels are low or inadequate, nurses
and midwives can address patient acuity, not just patient numbers and allocate
accordingly. Nurses and midwives as part of their labour-intensive role and
responsibility, are expected to deal with people‟s emotions about what is happening to
their bodies, as opposed to what is happening with their material possessions such as
their car being serviced. Due to the nature of this work, nurses and midwives expect
and require quality time with patients to allow patients to digest information about
their own health and well-being. Nurses and midwives often act as counsellors for
their patients so that the patient can debrief about their health experience. If as the
majority of this study has reported, there is insufficient time to allow for this

212
interaction and healing process to occur, nurses and midwives are likely to consider
their work futile and of little value, both for their clients and themselves.
There might be other reasons why the majority (69.7%) of this sample of nurses and
midwives are frequently or more often reporting inefficient time management. It is
unknown whether these respondents‟ inefficient time management was due, for
example, to having not been educated adequately to do their work effectively with
their workload or other stressors in their personal and family lives. This was not
investigated as part of this research; however this study suggests that inefficient time
management is most likely due to excessive workloads. Initial and subsequent
educational programs could include strategies for multi-tasking, setting priorities and
fostering team support. Importantly, however, previous research (Cohen-Katz et al.,
2005; Goodfellow et al., 1997) has shown that family support buffers stress, meaning
that those nurses who have support from family at home were less likely to be stressed
in their work environment.
Rushing to complete tasks was also identified by three-quarters of respondents as
contributing to stress in the work environment. If there are too many tasks in nurses‟
and midwives‟ working environments, one could correctly surmise that these tasks are
then rushed and the quality of care is diminished, leading to poor job satisfaction.
Other studies such as Barling‟s (2001) highlights stressors related to the work
environment for mental health nurses included having so much to do that everything
could not be done well; completion of too much paper work; insufficient staff and
knowing patient care was being sacrificed due to insufficient staff numbers. As noted
earlier, nurses and midwives could feel that they own the „problem‟ because they feel
responsible for completing the work on their shift due to insufficient staff or peer
pressure to do so.
The fact that three-quarters of this sample of nurses and midwives reported that they
frequently or more often rushed to complete tasks might indicate time pressures and
expected deadlines with which they were working. The literature identified that time
pressures were also considered to be extensive and insufficient time impinged on
nurses‟ work practices. The lack of adequate staff means that they are working longer

213
hours than they planned. Job demands are psychological stressors in work
environments (Laschinger et al., 2001a).
The reason for many nurses and midwives rushing to complete tasks could be reduced
staffing levels resulting in an increased pace of work (Billeter-Koponen & Freden,
2005). The majority (60.9%) of nurses and midwives in this study reported that they
frequently or more often finished work late, suggesting lack of staffing to cope with
excessive workloads or lack of training in working effectively resulting in further
disorganisation in the workplace. Data from this study confirm other studies‟ findings
that nurses working overtime is likely to occur in excessive workload situations
(Morgan et al., 2002; Stordeur, D‟Hoore & Vandenberghe; Van der Hulst & Geurts,
2001). It is believed that those nurses and midwives who remain in the system will
continue to work short-staffed (Bergen & Fisher, 2003).
It is unknown whether the majority (60.9%) of this study of nurses and midwives
indicated that they were frequently or more often finishing work late because of their
own expectations. They might also have been finishing late so that they could
physically accomplish their work tasks or counselling of clients. They might also have
been inadequately educated and prepared to deal with their existing tasks in the
workplace. Billeter-Koponen and Freden (2005) showed that nurses in their study felt
that it was an expectation from management that nurses automatically take on more
work without extra payment. Nurses reported they often did overtime to attend to
medical tasks, patients‟ relatives and documentation for continuous care. They felt
stressed because there was an expectation that they would finish work on time even
though they perceived they were working understaffed.
Excessive workloads are a major concern for both nurses and midwives. There are
reports that nurses and midwives work through meal breaks and incur unpaid
overtime to complete their workloads (Barrett & Yates, 2002). For this study, it is also
unknown whether these extra hours were paid or unpaid but finishing work late has a
connotation of unpaid work whereas overtime is usually regarded as paid work. These
unknown issues could possibly be addressed by adding „beyond paid hours‟ onto the

214
already existing question „At work, how often do you finish late?‟ or exploring these
concepts for future research.
Half (49.7%) of this sample of nurses and midwives reported never or occasionally
having organisational support indicating that these nurses and midwives are probably
dissatisfied with this lack of support from management. Organisational support might
include support from supervisors or managers in the organisation; other nurses and
midwives might find organisational support includes peers and other professional
colleagues. There is evidence suggesting that there is lack of organisational support
for nurses and midwives (Barling, 2001; Curtis, Ball & Kirkham, 2006b; Fagin et al.,
1995; Gillespie & Melby, 2003; Severinsson, 2003). Feeling encouragement and
support from supervisors is imperative for motivating nurses to stay in their
profession (Olofsson, Bengtsson & Brink, 2003). Nurses and midwives working in a
hospital environment might rarely have contact with management and when they do it
might be in the context of a meeting which is significantly different from working
alongside colleagues on a daily basis. This reinforces the need for managers to
communicate with clinical nurses and midwives on a face-to-face daily basis.
However, this study also found that half (50.3%) of this sample reported that they
were frequently or more often supported by the organisation in which they worked.
Barrett and Yates‟ (2002) respondents were also satisfied with organisational,
professional support. Similarly, Laschinger et al‟s (2006b) study found that nurse
managers reported receiving moderate levels of organisational support. It is possible
that nursing unit managers are also better equipped than colleagues when providing
higher levels of support for clinical nurses and midwives with stressful situations,
perhaps because of more education or experience.
In summary, the factors linked with stress which related to the work environment for
this study included frequency of stress, inefficient time management, rushing to
complete tasks, finishing work late and inadequate organisational support. The
majority (76%) of this study‟s respondents experienced moderate levels of stress
related to the work environment. For this study then, stress relating to the work
environment was a major concern. It involved mainly dealing with time constraints

215
and pressures as well as lack of organisational support. In line with Karasek‟s (1979)
Demand-Control Model, if there is insufficient time and conflicting demands in the
workplace, there is an imbalance between an individual‟s available time and
workplace demands made on that particular individual, leading to work environment
stress. Work environments for nurses and midwives could be prioritised as an area on
which to work to alleviate some of these problems, whether by way of continual
assessment of stress in the workplace or continuous efforts by nurses and midwives in
clinical areas to prioritise workloads, assess patient acuity, support each other and
work as a team.
2.1.2. Psychosocial effects of stress
This study‟s results have identified that two-fifths of nurses and midwives are
experiencing moderate psychosocial effects of stress. Psychosocial effects was the
most dominant factor relating to stress. Like the work environment subscale,
psychosocial effects of stress are a result of disharmony within discrete elements of
each of the two work theories, Karasek‟s (1979) Demand-Control Model and the
Person-Fit Theory (Mansfield et al., 1989). The Demand-Control Model theorises that
lack of autonomy and involvement in decision-making, combined with stressors or
workload, leads to ill health and psychological strain (Karasek, 1979). The Person-Fit
Theory shows that a mismatch between a person and the environment in which they
work leads to dissatisfaction and job stress (Mansfield et al., 1989). Psychosocial
effects of stress include anxiety, disturbed sleep patterns, constant headaches and
muscular and back pains (Singh, 2002). Persistent stress places people at risk of
developing poor health.
Nurses and midwives are vulnerable to traumatic workplace stress which involves
experiencing extreme emotional and physical anxiety (Bergen & Fisher, 2003).
Almost a third (30.2%) of this study‟s respondents reported that they had experienced
increased anxiety in relation to work over the past year, possibly due to unhealthy
levels. If nurses and midwives are able to discuss confidential and sensitive issues
with managers or supervisors, this might prevent further anxiety (Edwards et al.,
2006). Wong, Leung and So (2001) investigated mental health issues in Chinese
nurses working in Hong Kong and found that anxiety was the second most reported

216
complaint. Mental health criteria included the presence or absence of psychological
and somatic symptoms of anxiety, life dissatisfaction and unhappiness. Assessment of
anxiety and stress in the workplace is warranted. For example, if nurses and midwives
are encouraged to take (and offer) the opportunity to debrief with their colleagues or
manager following each shift, anxiety levels might decline. Nurses and midwives are
often dealing with life and death critical incidents with patients, the effects of which
could be ameliorated by collegial or management support.
Over a quarter (25.9%) of this sample of nurses and midwives reported that they
experienced sleeplessness at least once or twice a week; however, the majority (63%)
of nurses and midwives reported nil to occasional sleeplessness. Data from this study
confirms Sherer‟s (1993) findings that nearly one out of four nurses experience
sleeplessness. The difficulty is establishing who in the workplace is experiencing
sleeplessness, which reinforces the need for continual assessment of psychosocial
ailments, possibly by way of assessment tools, questionnaires or by simply engaging
in informed dialogue with peers as a routine practice.
This study found that 15.5 per cent of nurses and midwives experienced depression at
times in relation to work over the past year. This is not an unexpected finding,
considering the type of work with which nurses and midwives are involved, often
dealing with grief, counselling and sometimes death. Depression as a psychological
effect on individuals has been associated with excessive demands of stress that might
evolve from environmental stress triggers (Delvaux, Razavi & Farvacques, 1988;
Gunlicks & Weissman, 2008; Penson et al., 2000; Rada & Johnson-Leong, 2004).
The majority (67.2%) of nurses and midwives in this sample stated that the length of
time they experienced depression at one time in relation to work was either never or
for one day. This study found that the majority (63.9%) reported experiencing
depression related to work never or occasionally. For this sample of nurses and
midwives, depression did not seem to be particularly prevalent as a psychosocial
effect of stress. Nurses in Wong, Leung and So‟s (2001) study also exhibited only a
few depressive symptoms. Several nurses in McKenna et al‟s (2003) study

217
experienced depression as a psychological consequence in their first year of nursing
practice.
Almost two-fifths (38.5%) of nurses and midwives in this study reported experiencing
headaches requiring analgesia once or more times a week. It is unknown for this study
whether these headaches are a direct result from work stress or other causes but
headaches are generally reported as symptoms of stress (Bergen & Fisher, 2003;
Cohen-Katz et al. 2005; Ekstedt & Fagerberg, 2005, Jamal & Baba, 2000; Rada &
Johnson-Leong, 2004; Sherer, 1993). The Australian Council of Trade Unions (1997)
study also found the majority of their respondents reported sometimes or frequently
experiencing headaches related to stress at work.
The majority (69%) of this study‟s respondents reported experiencing stress requiring
treatment at least once every six months or more, with over two-fifths (42.9%) at least
once a month or more. It is not an unexpected finding that the majority of nurses and
midwives would be having some type of treatment as this might only be taking
panadol for a headache. However, for 15 per cent of nurses and midwives reporting
treatment for stress at least once a week or more, this is more of a concern, especially
when they are providing care for patients who are either ill or require counselling.
Again, this reinforces the need for continual assessment of stress in the workplace.
People who are experiencing stress at work are more liable to take a day off or call in
sick (Westman & Etzion, 2001). “Mental health” leave conjures images of
psychological reasons for absenteeism as opposed to physical symptoms. To reinforce
the problem of taking “mental health” leave, almost half (45.2%) of this study of
nurses and midwives indicated that they took at least one day off for this reason over
the past year, with a small percentage (2.5%) taking leave of absence 11 to 100 times
over the past year. These results suggest that this small percentage (2.5%) of nurses
and midwives see themselves as dealing with serious psychosocial issues and stress
and perhaps already experiencing burnout. Reinforcing this study‟s results, nurses in
Ekstedt and Fagerberg‟s (2005) study had taken more than three months‟ sick leave
due to unspecified maladjustment disorder as a result of experiencing high levels of
burnout. The Australian Council of Trade Unions (1997) survey also found that over a
218
quarter of employees took stress leave over the past year (number of times not stated).
Employers have started to recognise that employee health initiatives alleviate sickness
absence often caused by preventable illness and inflexible working hours (Harris,
2001). Better, more flexible working hours could be considered, for example part-
time and job-sharing hours. Physical stretching and breathing exercises at the
commencement of each nurses‟ and midwives‟ shift could be of benefit to prepare
staff members mentally and physically for their day ahead.
This questionnaire also enquired about frequency of sick leave when the nurse or
midwife felt unwell as opposed to “mental health” leave. The majority (74.2%) of
nurses and midwives in this study stated that they never or occasionally reported sick
if unwell (Appendix 9, Table 10), suggesting that they are going to work even when
they are feeling unwell. Baldwin (1999) also found that nurses did not take care of
themselves and did not take sufficient time off when sick. They often attended work
even though they were unwell. Absenteeism was also not apparent in McGrath, Reid
and Boore‟s (2003) study, showing that three days off within a six month period was
the average. It is worrying that nurses and midwives seem to not care for themselves
appropriately when they are ill, especially (as stated previously) when they are
providing care for patients who are ill. Nurses and midwives need to be continually
reminded about the risk of working when ill, not only for themselves but for others
who come into contact with them.
It is imperative to focus on factors associated with mental breakdowns such as
helplessness and hopelessness (Severinsson, 2003). This study found that almost half
(45.5%) never or occasionally reported experiencing feelings of helplessness in their
work environment. Over a quarter (25.8%) of this study‟s respondents reported
experiencing feelings of helplessness at least once over the past few months, which is
not an unusual finding. In contrast, midwives in Mackin and Sinclair‟s (1998) study
provided examples of feeling helpless and unable to change the course of events
affecting women in labour. Midwives were frustrated when unable to change a poor
outcome created by medical colleagues. This was evident, for example, when
registrars were pushing women to continue labour when the midwife felt that an
emergency Caesarean should have occurred at that time.

219
In summary, factors linked with stress which related to psychosocial effects for this
study included experiencing anxiety, sleeplessness, depression, headaches requiring
analgesia, stress requiring treatment, taking “mental health” leave and feeling
helpless. The majority (56%) of nurses and midwives experienced minimal
psychosocial effects of stress, however, two-fifths (40%) experienced moderate
effects. The fact that two-fifths of this study‟s respondents are experiencing moderate
psychosocial effects of stress alerts the profession as to the magnitude of the situation.
Involving nurses and midwives in decision-making and increasing their autonomy
could help prevent psychosocial effects of stress (Karasek, 1979). Physical ailments
predominate these psychosocial effects and result in nurses and midwives resorting to
taking special leave to overcome these effects of helplessness. If nurses and midwives
could be encouraged to work in areas of their choice and to believe they can function
most effectively and efficiently, psychosocial effects of stress could be reduced
(Mansfield et al., 1989).
2.1.3. Job satisfaction
Job satisfaction aligns with the Person-Fit Theory which suggests that tension arising
from a mismatch between an individual nurse and the workplace is likely to result in
job stress and job dissatisfaction (Mansfield et al., 1989). Mansfield et al‟s (1989) Job
Content Index gives guidelines for nurses selecting different clinical areas. Mansfield
et al. (1989) contend that nurse administrators might be able to obtain more satisfying
and stable job placements by referring to the Job Content Index. Mansfield et al.
(1989) suggest this strategy coupled with appropriate rewards and adequate staffing
should result in lower stress, better morale and reduced staff turnover.
The overall level of job satisfaction for this sample of nurses and midwives identified
that the majority (96%) showed moderate to high satisfaction levels and only a small
percentage (4%) were dissatisfied in their job. Generally, the nurses and midwives in
this study were satisfied with their work. The majority (57.6%) of nurses and
midwives reported that they experienced job dissatisfaction at least once a month. Job
dissatisfaction is one of the leading causes of nurses leaving the profession (Edwards
& Burnard, 2003); however for this study this level of dissatisfaction was not

220
apparent. Other studies have expressed positive job satisfaction (Billeter-Koponen &
Freden, 2005; Wheeler & Riding, 1994).
This study suggests that even though a large number of nurses and midwives
experienced stress, they seem to be content with their work. The findings that nurses
and midwives are dealing with moderate effects of stress and burnout do not reflect as
job dissatisfaction, but as stress related to the work environment, psychosocial effects
and exhaustion contributing to burnout. Similarly, Barrett and Yates (2002) found that
while oncology / haematology nurses in their study demonstrated high emotional
exhaustion levels, paradoxically many nurses obtained high levels of personal
accomplishment as a result of their work. It might also imply that nurses have
developed coping strategies to deal with stressful situations, which includes talking to
other colleagues (Wong, Leung & So, 2001).
The overwhelming majority (96%) of this study‟s respondents stated that they
frequently or more often thought they were suited to their work. This could be an
explanation as to why the majority (96%) of this study‟s respondents are satisfied in
their work. Stress-related conditions might be warning signs that there is a mismatch
between certain individuals and their jobs (Toohey, 1996). This runs parallel with the
Person-Fit Theory in that the better the match between an individual‟s needs and
environmental attributes, the more likely the potential for an individual‟s satisfaction
and performance (Furnham, 1992). This highlights the need for education and training
as less hardy nurses might then be directed towards less stressful environments
(Flowers, 2004).
The vast majority (94.8%) of this study of nurses and midwives stated that they
frequently or more often enjoyed their work. The inference that can be drawn from
this is that, even though they are experiencing moderate levels of stress and burnout,
they remain in the profession as they basically enjoy their work. Running parallel with
these results, the NSW Health Ministerial Standing Committee Report (2002-2003) on
nurses‟ practice identified that the top reason which keeps nurses in nursing was job
satisfaction and enjoying the work. These responses indicate that if nurses and
midwives self-assess as being suited to their work they might also enjoy their work.

221
McGrath, Reid and Boore (2003) found that although nurses generally felt positive
towards nursing, they self-report as experiencing extensive work-related stress.
Pinikahana and Happell (2004) also found that, despite significant levels of stress and
burnout in rural psychiatric Victorian nurses, the majority were satisfied with their
current work situation. The NSW Nurses Association (2008l) has recently presented a
submission which identifies nurses remaining in the profession because of rewards
gained from their caring professional work, although this might not be enough to
retain nurses in the workforce over the long term.
Changing the area of practice has been seen as a specific solution to stress and this has
been evident in previous research (McGrath, Reid & Boore, 2003). This study was
unable to ascertain whether nurses or midwives did change their area of practice, as
the questionnaire asked whether the nurse or midwife would have liked to change
their area of practice. Further research could include questions aimed at obtaining
information relating to whether nurses and midwives have changed their area of
practice, and reasons for such changes. This study found that over a tenth (10.4%) did
want to change their area of practice with nearly two-fifths (37.6%) sometimes
wanting to change. Other nurse studies found similar results (McGrath, Reid & Boore,
2003; McKenna et al., 2003; Pinikahana & Happell, 2004). Wanting to change the
area of practice could be seen either as time for a new change, a sign of boredom or
wanting a new challenge, or as an outcome of job dissatisfaction.
The majority (55.2%) of this study‟s respondents did not want to leave their
professional discipline. This reinforces the view that, even though the nurses and
midwives in this study seem to be dealing with stress issues, they are content in their
workplace and / or professional choices. They perhaps are comfortable in their
profession and to leave might result in untenable financial consequences. They might
have also become accustomed to the stress and burnout that they are experiencing,
thinking that it is the „norm‟ and are oblivious to their situation. Similarly, the
majority of nurses in Pinikahana and Happell‟s (2004) study indicated that they do not
often think about searching for another nursing job or an occupation outside nursing.
If nurses and midwives do not cope with stress and burnout, they might leave the
profession entirely (Maslach & Jackson, 1981).

222
Only a small proportion (7.6%) of this study‟s respondents wanted to leave the
professional discipline. So, even though almost half (48%) of this sample of nurses
and midwives at least sometimes did want to change their area of practice, the
majority (55.2%) did not want to actually leave their professional discipline,
indicating that they might need to change their own area of nursing or midwifery,
rather than leave the profession entirely. Alternatively, midwives in Curtis, Ball and
Kirkham‟s (2006a) study described the absence of autonomy, support and flexibility
in their work which influenced these midwives to leave the profession. Ames et al‟s
(2004) study with perfusionists found that those experiencing higher burnout levels
had a greater intention to leave their job within a six month period.
Over a third (33.6%) of this study‟s respondents had at some time (no time frame
stated) considered leaving the profession, implying a certain amount of job
dissatisfaction, paralleling other studies (McGrath, Reid & Boore, 2003; McKenna et
al., 2003; Oloffson, Bengtsson & Brink, 2003). Improving working conditions for
nurses and midwives might not only reduce stress levels but might also encourage
nurses and midwives to stay in the profession (Healy & McKay, 2000). This could
include better pay rates, flexible working hours and self-rostering.
Even though a large majority (94.8%) of these nurses and midwives frequently or
more often enjoyed their work, a third of them considered leaving. It is evident from
these results that nurses and midwives enjoying their work is not enough to prevent
them from thinking about leaving the profession entirely. Based on these findings, the
data support the forecast of mass departures of nurses and midwives from the
workforce over the next ten to 20 years (Goodin, 2003). Even though Hall‟s (2001)
New Zealand sample of nurses enjoyed their work, they also felt powerless within the
management system. Other measures are required to address stress levels, whether
that be at ward level, as better communication between managers and clinical nurses,
or better support for currently practising registered nurses and midwives in the field.
Further exploratory, qualitative research could pursue this factor.
The factors linked with stress which relate to job dissatisfaction for this study include
not enjoying and not being suited to the work, wanting to change the area of practice

223
and wanting to leave the professional discipline. This study has confirmed that the
nurses and midwives have stayed in their profession as they enjoy their work. The
majority (96%) of the respondents scored moderate to high levels of job satisfaction,
even though they are dealing with moderate levels of stress and burnout. Appropriate
rewards and adequate staffing should result in lower stress, better morale and reduced
staff turnover (Mansfield et al. 1989). Autonomy, support and flexibility in the
workplace could influence job satisfaction and prevent further nurses and midwives
leaving the profession (Curtis, Ball & Kirkham, 2006a).
Family-friendly working environments and increased control over working hours
could prevent nurses and midwives exiting the profession. Shift patterns and difficult
working hours could be key factors in nurses‟ and midwives‟ decisions to leave the
profession (Curtis, Ball & Kirkham, 2000b). Better communication between
administrative, senior staff and clinical nurses and better support for currently
practising registered nurses and midwives in the field could enhance job satisfaction.
This would involve education and training as part of the profession‟s routine practice.
Additionally, as noted earlier, continual assessment of stress and levels of job
satisfaction in the workplace still needs to be developed and refined.
2.2. Factors linked with burnout
For this study, factors linked with burnout related to exhaustion. Exhaustion relates to
low morale, feeling powerless, incompetent, emotionally drained and loss of empathy
for colleagues and clients. As previously defined, for the purposes of this study
burnout is:
an emotional state experienced over a prolonged
period of time by those in the helping professions
resulting in feelingsof powerlessness and being
emotionally exhausted and overwhelmed. This
contributes to lack of empathy towards colleagues
and clients and feelings of incompetence and lack
of achievement in one‟s work with people.
Overall, slightly over half (54%) of this sample of nurses and midwives scored
moderate burnout levels with over two-fifths (44%) scoring low burnout, and a small

224
percentage (2%) experiencing high burnout. The literature review noted similar
conclusions.
2.2.1. Exhaustion
The three major work theories describe issues associated with exhaustion and thus
burnout. The Effort-Reward Theory describes increased efforts and low rewards
leading to stress responses in vulnerable people (Heine, 2006). The Demand-Control
Theory suggests that if the individual cannot overcome the stressors, unresolved
tension and psychological strain can occur. Karasek (1979) linked this with burnout.
Jamal and Baba (2000) conceptualise the Person-Fit Theory as an individual‟s
reaction to a perceived threatening work environment. This portrays a poor fit
between the work environment and the individual‟s abilities, in which extreme
workplace demands are made, with which the individual has difficulty coping.
Exhaustion paralleling burnout can prompt individuals to distance themselves
cognitively and emotionally from their work, presumably as a coping mechanism to
deal with excessive workloads (Maslach, Schaufeli & Leiter, 2001). A characterising
aspect of exhaustion is a significantly reduced energy level. Individuals might alienate
themselves and withdraw from work activities (Randolph et al., 1986). The results on
the following variables related to exhaustion introduce clues for consideration,
discussion and future research.
Apathy can result from burnout and would be evident in nurses‟ and midwives‟ work
performance. Apathy might accompany depersonalisation, also a component of
burnout. An unsympathetic and uncaring attitude might predominate in their
demeanour. Nurses and midwives are likely to distance themselves from their clients
and treat them as objects rather than as fellow humans (Maslach, 1986). This study of
nurses and midwives found that generally over a fifth (21%) reported at least
frequently or more often feeling apathetic when stressed. It was unclear whether the
apathy was linked to work or non-work situations. Randolph, Price and Collins (1986)
mention a common nursing stressor as apathetic, incompetent staff, so, as well as
apathy being a result of stress, nurses and midwives might find others who are
apathetic quite stressful. There were no other studies assessing apathy specifically;

225
however apathy could be interpreted as being a component of depersonalisation and
closely linked to burnout (Maslach, 1986).
Low morale relates to the third component of Maslach‟s (1986) definition of burnout:
feelings of reduced personal accomplishment. Morale has a significant influence on
coping with stress (Jonsson & Segesten, 2004). This study found that nearly a third
(32.7%) indicated that they frequently or more often experienced low morale in
relation to work. These results suggest that these particular nurses and midwives are
not working to their full capacity if they are not feeling fulfilled in their work. Other
studies also identified low morale as a particular stressor and reinforce the notion that
people with high self-esteem are more likely to deal with stressors more confidently
(Buus-Franc, 2002; Jenkins, 1996; Jonsson & Segesten, 2004; Olofsson, Bengtsson &
Brink, 2003). Nurses and midwives can be rewarded and praised by their managers
and colleagues for good work to enhance morale and camaraderie.
Over two-fifths (44%) of this study‟s respondents reported frequently or more often
feeling undervalued in their work. Perhaps these nurses value themselves, but feel
undervalued by their colleagues and workplace. Hall (2001), Taylor and Barling
(2004) and Laschinger and Finegan (2005) all found that nurses and mental health
nurses felt undervalued in their work. Feeling undervalued also relates to the third
component of Maslach‟s (1986) definition of burnout: feelings of reduced personal
accomplishment. Laschinger and Finegan (2005) found that empowering workplaces
resulted in greater recognition and rewards for contributions made by staff. This could
be made possible by nurses and midwives instigating a reward system in their
workplace, for example, the worker of the month, so that staff in some respect feel
that their work is being recognised and valued.
Feeling overwhelmed also relates to the first component of Maslach‟s (1986)
definition of burnout: emotional exhaustion. Slightly less than a third (31%) of nurses
and midwives in this study stated that they frequently or more often felt overwhelmed.
Future qualitative research could pursue the reasons for their feeling overwhelmed;
however other aspects of this research point to some reasons why feeling
overwhelmed might escalate into feeling emotionally drained and create a sense of
226
low self-esteem. Barrett and Yates (2002) also found that their oncology /
haematology nurses felt like they were „at the end of their rope‟ at least once a week.
This was a variable used on the Maslach Burnout Inventory identifying emotional
exhaustion and burnout.
Feeling incompetent, reduced personal accomplishment and low morale are closely
linked with burnout (Maslach, 1986). As the nature of nursing is demanding, it is
crucial that nurses feel competent in their clinical accomplishments (Boey, 1998).
This study found that the majority (78.4%) of respondents indicated that they never or
occasionally felt incompetent within themselves when working with other people.
This might be due to the fact that the older nurses and midwives in this study identify
being less stressed, so they probably have been working in the profession for many
years and therefore were experienced and unlikely to feel incompetent. Similarly,
Happell, Martin and Pinikahana (2003) found that the majority of their sample of
mental health nurses scored feelings of high personal accomplishment. Contrary to
these results, McGrath, Reid and Boore (2003) found that the vast majority of their
nursing sample was identifying low personal accomplishment related to burnout.
This project found that nearly two-thirds (59.6%) of nurses and midwives stated that
they felt emotionally drained at work at least once a week. This implies regular
occurrences of intense emotional fatigue for these nurses and midwives, indicative of
burnout. In comparison, Barrett and Yates (2002) found that over a third (39%) of
their sample of oncology / haematology nurses felt emotionally drained in their work
at least once a week. Similarly, Fagin et al. (1995) and Payne (2001) found that their
community and psychiatric ward and hospice nurses experienced high emotional
exhaustion levels related to burnout. As nurses and midwives are often dealing with
sickness and death, feeling emotionally drained is not an uncommon or unexpected
finding. Emergency episodes and unexpected outcomes such as unexplained neonatal
deaths could also account for nurses and midwives feeling emotionally drained,
contributing to burnout.
This study found that over a third (34.9%) of nurses and midwives indicated that they
frequently or more often felt powerless in their work as a factor linked with burnout.

227
Nearly two-fifths (38.3%) also never or occasionally felt as though they had control
over their work, suggesting lack of choice or autonomy in their working conditions
and reinforcing feelings of powerlessness. Similarly, McGrath, Reid and Boore‟s
(2003) respondents also felt powerless to make decisions and unable to change
unsatisfactory conditions. Lazarus and Folkman (1984) theorised about developing
problem-focused strategies by examining the problem in the environment. They
identified internal and environmental demands which can tax a person‟s resources,
endangering their well-being. If nurses and midwives have little control over their
working environment, for example, lack of functioning work equipment such as
sphygmomanometers to assess blood pressure readings, this might place unnecessary
stress on the already busy nurses‟ and midwives‟ workloads. Lack of equipment and
equipment that does not function properly increases workloads even further (Wheeler
& Riding, 1994). Up to date and safe working equipment is a priority for both patients
and staff in the healthcare system.
Fatigue, exhaustion and feeling overwhelmed are closely linked to burnout (Maslach,
1986). In comparison to Barrett and Yates‟ (2002) study, this study found that more
than double (91% compared to 40.4%) the proportion of nurses and midwives were
experiencing fatigue at least once a week or more. The majority of respondents from
this study then were experiencing fatigue on a regular basis. Possible explanations for
this finding would be inefficient time management, for example, due to excessive
workloads and rushing to complete tasks. Similarly, continual tiredness was the most
stress-related ailment in Weekes, Peterson and Stanton‟s (2001) study of medical
scientists. Forming special and close relationships with patients and families, as health
professionals often do, might cause fatigue (Lyckholm, 2001).
Almost half (47.2%) of this study sample of nurses and midwives felt loss of empathy
for colleagues at work, which runs parallel to the findings of almost half (49.7%) of
the nurses and midwives who received sufficient organisational support never or
occasionally. Over a tenth (12.9%) of this study‟s respondents stated that they were
unsure as to whether they felt loss of empathy for colleagues, perhaps subliminally
not wanting to admit their feelings or they might not have felt empathy for them in the
first instance. It could be surmised that nurses who experience burnout might lack

228
sympathy towards or mistreat other nurses. This threatens the notion of a nurturing
and caring profession (Rowe & Sherlock, 2005). Alternatively, Spooner-Lane and
Patton (2008) found that colleague support did not have an effect on reducing
burnout, perhaps because nursing colleagues do not have the power to change the
workplace situation. Colleagues might provide better immediate support but cannot
change the heavy workloads.
If nurses and midwives are feeling supported by their immediate colleagues, their job
strain might be reduced as there is a certain cameraderie which is shared and might
even reduce each individual‟s stress levels. Nurses and midwives tend to consult
colleagues to obtain a second opinion (Begat, Ellefsen & Severinsson, 2005) which
also might be an unconscious way of seeking social support. Consistent with previous
work, seeking social support at work and talking about stress indicates adaptive
coping strategies.
Almost half (45.5%) of this study‟s respondents reported that they felt loss of
empathy for clients at work, implying a considerable number of nurses and midwives
experiencing depersonalisation, a component of burnout. Similarly, Happel, Martin
and Pinikahana (2003) and McGrath, Reid and Boore (2003) found that their nursing
samples experienced moderate to high levels of depersonalisation as loss of empathy
for clients relating to burnout. As nursing and midwifery are vocations which involve
close interactions with people, it is discouraging that nearly half of this study sample
are exhibiting signs of distancing themselves from the people (both colleagues and
clients) with whom they work.
In summary, factors linked with burnout which relate to exhaustion for this study
include apathy, low morale, feeling powerless, undervalued and overwhelmed, and
feelings of incompetence. In line with the Effort-Reward Theory, increased,
unrewarded efforts lead to stress responses in vulnerable people which eventually
leads to burnout (Heine, 2006). These include fatigue, feeling emotionally drained and
loss of empathy for colleagues and clients in these nurses‟ and midwives‟ work. These
results portray a group of nurses and midwives who have lost control over their work
situation in line with the Demand-Control Theory which suggests that if the individual

229
cannot overcome the stressors unresolved tension will lead to burnout (Karasek,
1979). It has affected the way they relate to others in the workplace, be that colleagues
or clients.
The majority (54%) of this study‟s respondents experienced moderate levels of
burnout. This finding has a number of implications, including quality patient care, as
nurses and midwives who experience burnout find it difficult to provide quality care
for patients. In line with the Person-Fit Theory (Jamal & Baba, 2000) extreme
demands are made and the individual is incapable of handling the situation, portraying
a poor fit between the work environment and the individual‟s abilities. It is essential
that senior management have some way of identifying stress levels before they reach
this burnout phase so that quality patient care is not affected. Other implications relate
to the health and well-being of the nurses and midwives experiencing burnout.
Clinical supervision is one way of reducing levels of burnout (Edwards et al., 2006).
2.3. Factors linked to individual responses
As previously defined, for the purposes of this study individual responses are:
how an individual reacts in a particular work
situation depending upon self-imposed work
pressure and motivation.
Overall, the majority (53%) of this sample of nurses and midwives scored moderate
self-imposed work pressure and motivation levels according to their individual
responses, with nearly a third (29%) scoring low pressure and motivation, and nearly
a fifth (18%) scoring high pressure and motivation levels. The following individual
response variables related to work behaviours such as self-imposed work pressure and
motivation, indicating useful perspectives for future research.
Nurses and midwives need to explore what stressful work behaviours mean for them.
They can then examine their own individual responses to workplace issues and how
they interact with their own and their organisation‟s nursing and midwifery practices

230
and values. This then, might be a way to reduce or prevent prolonged stress that can
lead to burnout (Salvage, 2003).
2.3.1. Pressure and motivation
Pressure and motivation levels are an inherent predictor of Vroom‟s (1964)
Expectancy Theory of Motivation which is guided by the premise that an individual‟s
efforts will result in accomplishments or outcomes; an individual‟s performance will
reap rewards; and motivation parallels the value of rewards to the individual. This
theory also shows that people‟s role perceptions will influence work performance and
poor performance might result from role misunderstanding. The theory also shows
that unlimited workplace opportunities will likely increase performance levels
(Furnham, 1992). If the reward is positive, the employee will most likely be highly
motivated and if the reward is negative, the employee will not be motivated (Lindner,
1998). If control and reward is removed from nurses‟ and midwives‟ work, motivation
is decreased (Curtis, Ball & Kirkham, 2006a).
Stressors are required to motivate people to „get them going‟ (Schultz & Schultz,
1997). Motivation in the work setting is described as what a person is doing
(direction), how hard a person works (intensity) and how long a person works
(persistence) (Kanfer, 2002). There are various reasons why people are motivated to
work and they work because of certain rewards. People experience different types and
amounts of motivation to work. The quality and quantity of productivity and
enthusiasm shown at work is most likely a function of motivation (Furnham, 1992).
Almost two-thirds (65.3%) of this study‟s respondents reported that they frequently or
more often tried to achieve more than their time allowed, implying that either they
were placing unnecessary pressure upon themselves or there was external pressure in
their working environment. Certain factors, such as external pressures of the working
environment, are already known to impact on workplace stress. Perhaps there is an
expectation that nurses and midwives should be continuously professionally effective
and efficient, thereby another reason why they try to achieve more than their time
allows (Billeter-Koponen & Freden, 2005).

231
High or unmet expectations of work challenge, recognition, rewards and career
advancement can create intrinsic stress leading to burnout (Cordes & Dougherty,
1993). This also runs parallel with the majority (58%) of this study‟s respondents
reporting that they placed unreasonable expectations on themselves, suggesting
unnecessary stressors. Individuals who place unreasonable expectations on themselves
often fail to meet these high expectations (Gillespie & Melby, 2003), which
eventually leads to exhaustion (Maslach, Schaufeli & Leiter, 2001).
The majority (55.7%) of this study‟s respondents reported either frequently or most of
the time working at high performance levels even when no time deadline was
involved. Over two-fifths (43%) of this study‟s respondents frequently or more often
reported being keyed up (or restless) most of the time on most days. This behaviour is
indicative of „Type A‟ competitive behaviour (Boey, 1999).
Behavioural manifestations of stress can be difficult to identify and can include
irritability (Delvaux, Razavi & Farvacques, 1988). Almost two-fifths (35%) of this
study‟s nurses and midwives reported that they became irritable frequently or more
often, due to constant interruptions in their workplace, suggesting that their work
environments seemed hectic in nature. Other studies have found constant interruptions
stressful (Coffey, 2000; Gillespie & Melby, 2003).
The majority (65.4%) of this study‟s respondents frequently or more often reported
being pushed for time. This result is synonymous with the majority (65.3%) of this
study‟s respondents trying to achieve more than time allows. The majority (89.3%) of
this study‟s respondents reported that they had difficulty slowing down. Difficulty
slowing down as an individual response linked to work behaviours is difficult to
interpret. It either suggests that there was no time to slow down in their work due to
workload pressures and the nurse or midwife was always „rushed off their feet‟ or that
difficulty slowing down was an inherent part of how they behave generally.
The majority (75.4%) of this study‟s respondents frequently or more often reported
that they had a tendency to multi-task. Boey (1999) studied a group of distressed and
stress-resistant nurses in Hong Kong and she specifically researched the variable, „try

232
to do many things at once‟ or „push myself very hard‟ which indicated „Type A‟
behaviour. She found no difference between the two groups. As Boey‟s (1999)
average for „trying to do many things at once‟ was high (45 out of a possible 65),
these results are congruent with this study‟s results.
In summary, work behaviours such as self-imposed work pressure and motivation
linked to individual responses to workplace issues for this study include trying to
achieve more than time allows and being pushed for time, which runs parallel with
time pressures. Expecting more than reasonably possible, being keyed up (or restless)
on most days and feeling irritable are examples of self-imposed pressures. Other
behaviours include difficulty slowing down for procedures, working at high
performance, and multi-tasking which are examples of individual reactions in the
workplace. In line with Vroom‟s (1964) Expectancy Theory of Motivation, all these
workplace behaviours speak to increased motivation with positive reward and also
reduced motivation without reward.
The majority (53%) of nurses and midwives scored moderate levels of self-imposed
work pressure and motivation. For this study of nurses and midwives, it would seem
that the majority place unnecessary stress upon themselves related to work by way of
working at an increased speed, which results in feelings of irritability. For these
nurses and midwives an inherent part of their nature could then influence how they
behave at work as well as away from work. Nurses and midwives can be more aware
of and self-assess their own individual responses to workplace issues.
2.4. Relationships between stress, burnout and individual
responses
Investigation of relationships and associations between stress, burnout and how nurses
and midwives react and behave is an important aspect when prioritising which areas
to target when seeking solutions in the workplace. This study contributes to the body
of knowledge about stress and burnout as links are found between these significant
and problematic workplace stressors and particular individual responses. The
associations or relationships developed from this questionnaire could provide

233
information to enable appropriate and targeted solutions to workplace stress to be
identified.
2.4.1. Stress relationships with other variables
Stress was positively associated with burnout for this study. This result highlights the
continuum between stress and burnout and suggests that nurses‟ and midwives‟
experiences of stress might increase burnout levels. If initial action plans to alleviate
stress can be instigated in the workplace, further exposure and progression to burnout
could be prevented. Spooner-Lane and Patton (2008) reinforce the importance of
exploring work stressor factors which contribute to burnout.
The results from this sample of nurses and midwives suggest that those who were
experiencing stress related to the work environment and job dissatisfaction were also
experiencing exhaustion (a component of burnout), which is not an unexpected
finding. This reinforces the notion that experiencing regular or continuing stress and
job dissatisfaction can lead to burnout. Other studies (Billeter-Koponen & Freden,
2005; Healy & McKay, 2000; Maslach, Schaufeli & Leiter, 2001; McGowan, 2001;
Stordeur, D‟Hoore & Vandenberghe, 2003) -have found consistent results and
suggests that the energy and inadequate time to manage high workloads and the
experience of conflict with colleagues are factors that could lead to emotional
exhaustion (Stordeur, D‟Hoore & Vandenberghe, 2003).
The relationship between stress, exhaustion, and the work environment is not simple
as each individual will manage stress in different ways. There might be differences,
including workplace or individual disorganisation, not being suited to the work or not
doing the work they like (Goodfellow et al., 1997). Greenglass and Burke (2001) and
Barrett and Yates (2002) also found the greater the workload, the greater the
emotional exhaustion for the nurses. Factors including mandatory overtime and
increased pressure to complete work have contributed to increased nurses‟ and
midwives‟ dissatisfaction in their work environments (Goodin, 2003).
This study found that those nurses and midwives who were experiencing stress related
to the work environment were also experiencing such psychosocial effects as ill

234
health, which includes depression. This relationship between work environment stress
and ill health might also be interchangeable, meaning that stress predisposes to ill
health and ill health predisposes to experiencing stress. This suggests that if the nurses
and midwives are stressed in their work environments, they will most likely be
experiencing physical and emotional effects of stress in their personal lives. On the
other hand, it could also mean that those nurses and midwives who are already
experiencing psychosocial effects away from work are also experiencing stress in
their workplace. Samuelsson et al. (1997) also found that negative work environments
were associated with depression and burnout. Similarly, De Lange et al. (2004) found
that one basic assumption is that health and work characteristics influence each other.
De Lange et al. (2004) found that unhealthy workers were more likely to view their
work environment negatively over time.
Nurses and midwives in this study who were experiencing stress related to the
working environment were working longer hours. Importantly to this issue, Iskra-
Golec et al. (1996) also found that nurses had higher anxiety scores when working
longer hours. If health organisations could adopt better work practices, such as
introduction of part-time hours and better pay rates, overtime and stress could be
reduced in nurses‟ and midwives‟ work environments.
For nurses and midwives in this study, the workplace pressure of rushing to complete
tasks was positively associated with stress; inefficient time management (for example,
due to excessive workloads); and being pushed for time. This suggests that this
sample of nurses and midwives try to function under heavy work overload and have
insufficient time available to complete their work in the specified time. Work
overload can lead to emotional exhaustion and possible burnout (Cordes &
Dougherty, 1993).
These workplace pressures were pertinent in relation to stress levels in the work
environment and they had a contributing effect over the way in which these nurses
and midwives work. Nurses are treating more patients in shorter periods of time and
yet the nursing and midwifery profession demands meeting patients‟ needs on an
individual level (Penson et al., 2000). If these demands exceed the nurses‟ or

235
midwives‟ own reasonable limitations, they will continue to find themselves rushing
to complete tasks and quality care of patients could diminish.
Finishing work late was also linked with inefficient time management (for example,
due to excessive workloads), and rushing to complete tasks further reinforcing time
issues. Nurses and midwives might find the workloads unmanageable, and if they are
working with unreasonable workloads they might not have time to provide essential
education, support and counselling for their clients. Zapf et al‟s (2001) study also
identified time pressure as a significant issue for health professionals‟ work.
For this study, the results suggest that those who were experiencing psychosocial
effects of stress were also dissatisfied in their work and exhausted. This implies that
detrimental health effects experienced by those nurses and midwives were related to
their job dissatisfaction. One important finding of this study showed that job
dissatisfaction was positively associated with incidence of stress.
This study also found that being older was associated with job satisfaction, meaning
that older nurses and midwives were more satisfied in their work than younger ones.
This finding complements other results in this study, specifically that younger nurses
and midwives were experiencing more stress and burnout than older ones. Other
studies have found that stress appears to be a major determinant of nurses‟ job
dissatisfaction levels and increased stress levels in nurses leads to career
dissatisfaction (Delvaux et al., 1988; Hoffman & Scott, 2003). These findings equate
to Beaudoin and Edgar‟s (2003) and Healy and McKay‟s (2000) studies which found
that those who were satisfied in their work were less stressed than those who were
dissatisfied.
This study found that those nurses and midwives experiencing sleeplessness were also
experiencing anxiety in relation to work, were depressed and felt emotionally drained.
There was a positive relationship between short and long-term sleeplessness,
suggesting nurses and midwives experiencing sleeplessness will continue to
experience this symptom. These results imply that these nurses and midwives are
experiencing long-term effects of stress and / or burnout. This suggests that for this
236
sample of nurses and midwives experiencing anxiety was closely related to how often
they experienced sleeplessness. Levin, Hewitt and Misner‟s (1998) nurses also
reported experiencing physical and emotional effects from verbal and physical
assaults while working in accident and emergency. These nurses complained of
sleeplessness and nightmares. Frequent insomnia is a symptom which has been
associated with depression (Gale, 1998; Gorter et al., 1999; National Institute of
Mental Health, 2004 cited in Rada & Johnson-Leong, 2004:791). No other studies
have specifically associated sleeplessness with feeling emotionally drained although,
according to Maslach (1986), these symptoms suggest burnout.
As far as nurses and midwives being treated for stress was concerned, there was a
positive relationship between stress requiring treatment and headaches requiring
analgesia and feeling emotionally drained. These results imply that these work-related
psychosocial factors are encroaching into nurses‟ and midwives‟ personal lives. It
suggests that headaches were mostly due to stress (be that work or personal) and not
other causes. Mackin and Sinclair‟s (1998) sample of labour ward midwives had
experienced ill health related to stress before and during the six months of their study.
The cost of stress for nurses can include injury or work-related illness (Buchan, 1995).
For this study, as far as job compatibility was concerned there was a positive
relationship between being suited to the particular type of work and enjoying the
work. This runs parallel with the Person-Fit Theory (Mansfield et al., 1989) which
shows that if a person is suited to a particular type of area of work, job satisfaction
will be enhanced. Those nurses and midwives who were wanting to leave the
professional discipline were also wanting to change the area of practice for this study
suggesting that those wanting to change their area of practice were dissatisfied in their
current area of practice.
In summary, identification of stress in the workplace is required to prevent burnout
occurring. This might involve regular identification of stressors in the workplace by
way of assessments, meetings and offering debriefing following critical incidents.
Identifying stress in nurses‟ and midwives‟ work environments might then prevent
psychosocial effects of stress including sleeplessness, depression and headaches
237
requiring analgesia. This could include identifying those most at risk of ill health,
such as nurses and midwives who are requiring treatment for stress. Unhealthy
workers might also create negative work environments over time for co-workers and
monitoring the work environment is necessary to prevent this from occurring (De
Lange et al., 1994).
If nurses and midwives continue to experience stress in the workplace and these
psychosocial effects are left untreated, physical ailments such as sleeplessness might
continue the longer nurses and midwives work in the profession. For this study,
sleeplessness was not an isolated symptom and accompanied other ailments such as
anxiety, depression and feeling emotionally drained (which is related to burnout). As
this study shows, job satisfaction could be improved by diminishing psychosocial
effects of stress. There might also be existing psychosocial effects of stress in the
workplace but assessment and treatment of these signs and symptoms could limit their
progression to burnout. Job satisfaction could be improved by way of rewards and
involving nurses and midwives in clinical areas in management decisions.
As working long hours and time management issues were positively associated with
stress in the work environment for this study, reduction of overtime and addressing
more work-friendly hours such as part-time and job-sharing work could be the
answer. Staffing issues, prioritising workloads and targeting patient acuity could also
alleviate stress in the workplace. As older nurses and midwives were less stressed
than younger ones in this study, targeting younger workers by way of education,
support and mentoring with a more experienced nurse or midwife, might provide
more support to this younger cohort so they can develop better coping skills for
dealing with stress. If nurses and midwives are able to work in areas to which they are
suited, job satisfaction could be improved.
2.4.2. Burnout relationships with other variables
The nurses and midwives in this study who were exhausted were also experiencing
stress from the work environment, psychosocial effects of stress and job
dissatisfaction, further emphasising the detrimental effects of stress and burnout. It is
evident for respondents in this study that exhaustion pervades these nurses‟ and
238
midwives‟ daily lives and is associated with poor psychological and physical health.
The nurses and midwives who were exhausted were also dissatisfied in their work.
Similarly, other nurse research has found that overall burnout was moderately
correlated with the variables emotional exhaustion, job dissatisfaction and health
problems (Jamal & Baba, 2000) and as burnout increases, job satisfaction decreases
(Ames et al., 2004).
The negative association between exhaustion and age might be due to the fact that
older nurses and midwives have developed better coping strategies to deal with stress
and burnout. Kent and Lavery (2007) highlight that the influence of years in the
profession and age partially explains why being hospital educated as a nurse was
associated with lower exhaustion levels (compared to university educated colleagues).
They confirm this by finding that because hospital education was phased out ten years
ago or more, hospital educated nurses were older than their university educated
colleagues. They highlight that more years in the profession is beneficial for the nurse.
Nurses and midwives in this study who were working longer hours were also
exhausted. Iskra-Golec et al. (1996) and Kent and Lavery (2007) also found that
working longer hours was associated with higher levels of emotional exhaustion. As
nurses and midwives usually work the majority of their shifts either standing or
walking in their work environments, and are rarely sedentary, it is not unusual to find
that longer hours would increase exhaustion. The type of work can also be mentally
exhausting as they often act as counsellors in their roles dealing with patients‟ grief
and poor health.
As far as prolonged exposure to stress is concerned, the nurses and midwives in this
study who were feeling powerless were also experiencing low morale, suggesting that
feeling powerless or helpless in their work environment also determined feelings of
low morale as an intrinsic component of burnout. The nurses and midwives in this
study who were dissatisfied in their job were also experiencing low morale. Jenkins
(1996) also found that job dissatisfaction became increasingly evident, resulting in
low morale, in her study with community nurses. Nurses and midwives could be
rewarded and praised for good work to enhance morale in the workplace.

239
Nurses and midwives in this study who were feeling powerless were rushing to
complete tasks, suggesting increased workloads in an uncontrollable environment or
nurses and midwives at risk for burnout. Billeter-Koponen and Freden (2005) and
Olofsson, Bengtsson and Brink (2003) also identified nurses feeling powerless due to
heavy workloads and insufficient time to provide quality patient care. They also found
that valuation of professional experience and knowledge is negated if nurses start
feeling worthless when being replaced by nurses with less experience or education, or
requiring less monetary compensation. They note that powerlessness is the inability to
change one‟s situation. At the other end of the spectrum of powerlessness is
empowerment and this might be important to nurses and midwives with high needs
for achievement, since empowerment helps provide conditions for success. Nurses
and midwives benefit when empowerment is inherent in their workplace, and they are
disadvantaged if that is not present, making them feel powerless (Laschinger et al.,
2001b).
This study also found many other associations which were not found in other
literature. As far as workplace pressures and prolonged exposure to stress was
concerned, low morale was also positively associated with incidence of stress,
inefficient time management (for example, due to excessive workloads), feeling
undervalued and feeling emotionally drained. This suggests nurses‟ and midwives‟
morale levels contribute to the detrimental effects of stress and burnout.
Those who were feeling undervalued were also feeling powerless in this study.
Hancock (1998) highlights that feeling powerless and feeling undervalued are major
factors in stress-related problems. She concludes that free flowing information and
good communication with managers are essential.
In this study, for those people who were dissatisfied in their job, they were also
feeling undervalued, suggesting that they were feeling that their contributions in their
workplace were not worthwhile. Feeling overwhelmed was also positively associated
with incidence of stress, feeling undervalued and feeling emotionally drained. These
other specific associations were not found in other literature, but generally contribute
to a picture of exhaustion leading to burnout.

240
Feelings of incompetence might lead to performing poorly on the job (Maslach,
1986). The nurses and midwives in this study who were feeling overwhelmed were
also experiencing feelings of incompetence, implying that the nurses or midwives
might blame themselves for not managing or coping with their workloads. As the
question relating to feeling incompetent in one‟s work with people was not clearly
restricted to one‟s work environment, it was difficult to distinguish whether
respondents in this study were commenting on feeling incompetent in the home, work
and / or social environment. Wong, Leung and So (2001) also found nurses feeling
incompetent generally in relation to every-day life. It is an unreasonable expectation
for an individual to separate their work lives from their private lives and research is
recommended to identify how private lives exacerbate workplace stress (McVicar,
2003). As stated previously, it is possible that family and friends are instrumental in
buffering effects of stress and burnout for nurses and midwives (Spooner-Lane &
Patton, 2008). A question for future research could focus principally on the area of
work, although research concentrating on the home / work interface is an important
aspect for future stress and burnout studies.
It is common to find that job demands are highly associated with being emotionally
exhausted (Brenninkmeijer & VanYperen, 2003). Feeling emotionally drained was
positively associated with incidence of stress and rushing to complete tasks for this
study of nurses and midwives, implying that stress and burnout levels were high.
Barrett and Yates (2002) found that nurses felt emotionally drained and burdened with
excessive workloads and unpaid overtime which contribute to increasing turnover and
dissatisfaction.
The findings from this study support the work of other researchers (Laschinger &
Finegan, 2005; Zapf et al., 2001) in relation to the positive association between
inefficient time management (for example, due to excessive workloads), and feeling
emotionally drained. In these other studies (Laschinger & Finegan, 2005; Zapf et al.,
2001), the highest correlations were identified as time pressure relating to workload
which was the most important predictor of emotional exhaustion. These results
provide evidence to pursue positive workplace conditions such as effective equipment

241
and good communication and team-work in order to enhance nurses‟ and midwives‟
health.
This study did not show any associations of fatigue with burnout; however fatigue
was identified as a factor of exhaustion which can ultimately lead to burnout. Kant et
al. (2003) and Huibers et al. (2003) also found moderate intercorrelations existed
between fatigue and burnout in the working population. Health professionals who
have the capacity for expressing and feeling empathy are at higher risk of physical
and emotional exhaustion associated with compassion or empathy fatigue (Stebnicki,
2000). When burnout reaches severe proportions, nurses and midwives feel very tired
when interacting with other people, as their emotional resources are depleted
(Koivula, Paunonen & Laippala, 2000).
In summary, for this study, if stress in the work environment, psychosocial effects and
job dissatisfaction are reduced, the resultant exhaustion might decline. As well,
targeting and monitoring younger nurses‟ and midwives‟ stress levels and redesign
and reduction of working hours could reduce exhaustion. According to this study,
nurses‟ and midwives‟ feeling powerless and undervalued in their workplace adds to
further low morale and job dissatisfaction. If nurses and midwives can become
empowered in the workplace by taking control of somewhat frenetic work
environments, morale and job satisfaction could be enhanced. If nurses and midwives
have more control over their workload and do not settle for inadequate staffing,
perhaps these small steps will contribute to their empowerment in the workplace.
These nurses and midwives feeling overwhelmed in their workplace added further to
their feeling incompetent in their work with people, whether this occurred at home or
at work. Powerlessness, low morale and feeling emotionally drained were also linked
with inefficient time management and rushing to complete tasks, further reinforcing
workload issues. If workloads can be shared and prioritised amongst suitable working
team members, nurses and midwives might not have to face the impending emotional
drain.

242
2.4.3. Individual response relationships with other variables
Those nurses and midwives in this study who were experiencing stress from the work
environment were also displaying high levels of self-imposed work pressure and
motivation, ultimately leading them to place unreasonable expectations upon
themselves. It is difficult to assess which direction the association travelled - for
example, if the work environment accounted for high pressure and motivation or
whether high levels of pressure and motivation accounted for work environment
stress. If they strived for perfection within themselves they might have experienced
stress related to the work environment because they were unable to provide excellent,
quality client care. Similarly, Balevre‟s (2001) research suggested that nurses who
demand control and perfection in themselves create unrealistic expectations and
demands that cannot be achieved in reality and ultimately lead to burnout. In today‟s
working health environment excessive workloads might mean that these goals are
possibly unattainable but they might be considered desirable, nevertheless.
As far as work behaviours such as self-imposed work pressure and motivation are
concerned, those nurses and midwives who placed unreasonable expectations on
themselves also tried to achieve more than time allowed and were also pushed for
time, again reinforcing the time issue and suggesting a time urgency or deadline. For
this study, those nurses and midwives who were keyed up (or restless) also had a
tendency to multi-task. These results run parallel with the majority (69.7%) of the
respondents in this study identifying inefficient time management (for example, due
excessive workloads). Strategies to address such matters need to target individual
responses to workplace issues and focus on educating nurses and midwives to
realistically deal with their workloads and not to place unnecessary pressure upon
themselves.
2.5. Demographic factors contributing to stress, burnout and
individual responses
2.5.1. Demographic factors contributing to stress
This project found that the older the person was and the longer they worked in the
profession, the less likely they were to take “mental health” leave, which suggests that

243
older nurses and midwives might be less subject to stress than their younger
counterparts and, because of their age, be expected to be able to cope. This finding
complements other results in this study related to older nurses and midwives being
more satisfied, less stressed and less exhausted in their work. This study indicated that
older nurses and midwives are more likely to be experienced, so (as stated previously)
they might have developed better coping mechanisms over the years to deal with
continued stress, or that personal or professional expectations dissuade them from
taking “mental health” leave. Some people are hesitant to report stress at work as
there might be fear of retribution or difficulty in obtaining acceptance from employers
that stress in the workplace is a legitimate reason for “mental health” leave. Therefore,
they rarely claim workers‟ compensation, using another type of leave instead
(Australian Council of Trade Unions, 1997).
Older nurses and midwives might not want to admit to being stressed because they
have always been taught to endure the stress and not debrief about extenuating
circumstances, for example, „survival of the fittest‟. Similarly, Balevre‟s (2001) study
found that nurses with over ten years of experience, were less likely to have been
suffering burnout compared to those with less than ten years of experience. Humpel
and Caputi (2001) state that past research has shown that as years of work experience
increases, stress levels decrease. It might also relate to the fact that experience does
relate to competence. It might also suggest that those nurses and midwives
experiencing burnout might leave the profession altogether, therefore never becoming
„older nurses and midwives‟.
Nurses and midwives in this study who worked longer hours were more likely to
experience sleeplessness. This finding complements other findings in this study
associated with increased incidence of stress related to the work environment and
exhaustion with working longer hours. As stated previously (Chapter 2, section 4.4),
nurses in Iskra-Golec et al‟s (1996) study also reported worse sleep quality and were
more tired following sleep, even though they had slept longer, when working longer
hours. A psychosomatic sign such as sleeplessness is a health problem related to stress
(Bailey, 1985; Brenninkmeijer & VanYperen, 2003; Buus-Frank, 2002; Jamal &
Baba, 2000; Schwarz, 2005).

244
In summary, these results point to the fact that younger nurses‟ and midwives‟ stress
levels need to be targeted and managed so they do not resort to taking increased
periods of “mental health” leave. As stated previously, working longer hours can be
reduced to prevent detrimental effects such as sleeplessness, a psychosocial effect of
stress. This might take on the form of part-time or job-sharing hours and discouraging
overtime in the workplace.
2.5.2. Demographic factors contributing to burnout
Nurses and midwives who were older in this study, were less likely to experience
aspects of burnout. Older nurses and midwives were less likely to feel emotionally
drained and less likely to lose empathy for clients than younger nurses and midwives,
paralleling other research. These findings complement previous results of this study
related to older nurses and midwives experiencing less stress and exhaustion, and
more job satisfaction than younger ones. Younger nurses have exhibited stronger
burnout behavioural trends than older nurses (Balevre, 2001; Maslach & Jackson,
1981). Balevre‟s (2001) study also showed that nurses aged 40 years and over were
less likely to burn out than their younger colleagues. Spooner-Lane and Patton (2008)
also found that younger nurses reported higher depersonalisation levels than older
nurses. The relationship between age and stress suggests that individuals gain
competency and skill through experiences linked to ageing, helping them to deal with
stressors (Younger et al., 1995). As stated previously, it could also mean that those
nurses and midwives who could not cope have already left the profession.
Losing empathy for clients is related to depersonalisation, which is one of the
components of burnout (Maslach, 1986). This study‟s findings support other evidence
that the older the person, the less likely they were to lose empathy for clients. Age is
associated with work experience and burnout occurs earlier in nurses‟ careers
(Maslach, Schaufeli & Leiter, 2001). Edwards et al. (2006) and Kent and Lavery
(2007) also found that as nurses grew older they were less likely to experience one
aspect of burnout, namely depersonalisation.
This study found that the longer the person had spent in the profession the less likely
they were to lose empathy for clients, which is consistent with the study‟s findings

245
related to age. Development of coping strategies over time, „survival of the fittest‟ and
more experience could account for these results. Burnout seems to manifest about one
year into the health professional‟s career (Bailey, 1985). Schiacchitano, Goldstein and
DiPlacido (2001) found in their study with radiographers that years in profession
correlated positively with personality hardiness. They report that perhaps people
spending longer in the profession have a more realistic perspective about life and are
not as prone to burnout. They note that long-time members of professions might have
learned coping skills for their work demands and are more satisfied with their
achievements. On the other hand, Koivula, Paunonen and Laippala (2000) and Chang
et al‟s (2005) studies‟ findings that older nurses distanced themselves from others to
cope with stressors differs from this study‟s results.
Those nurses and midwives working longer hours in this study were more likely to
experience burnout. This is not an unexpected finding as nursing and midwifery are
fairly demanding physical vocations and working longer hours would increase the
likelihood of fatigue predisposing to burnout. This study also found that the more
hours that nurses and midwives worked the more apathy they experienced. These
results parallel other findings in this study relating to stress and exhaustion from
working longer hours. This suggests that fatigue and exhaustion at work played a
major role in their apathy. Van der Hulst and Geurts (2001) note that employees who
are involuntarily working overtime are more prone to fatigue and poor recovery as
opposed to those who choose to do so. They also found that overtime might lead to
poor psychological health in situations where there is a lack of motivation. Nurses
have been known to experience adverse health effects induced from the longer 12
hour shifts (Kundi et al., 1995).
As Schwarz (2005) states, a major reason for the shortage of nurses is a state of
physical and emotional depletion caused by unrelieved workplace stress leading to
burnout. This study found that the more hours the nurse or midwife worked the more
likely they were to feel emotionally drained at work, which is not an unexpected
finding. Working longer hours would seem detrimental towards these nurses‟ and
midwives‟ health. Kent and Lavery (2007) also showed a positive association between
expectations of working overtime and working longer hours with emotional

246
exhaustion. Hoffman and Scott (2003) found that the longer the hours the nurse
works, the more fatigued they were in relation to the clinical environment. Other
studies (Iskra-Golec et al., 1996; Kundi et al., 1995; Van der Hulst & Geurts, 2001)
have found that emotional exhaustion and increased risk of poor psychological health
were more significantly pronounced when working longer shifts and overtime.
This nurse and midwife study predicts that the more educated the person the less
likely they are to experience one aspect of burnout, losing empathy for their
colleagues, so less likely to experience depersonalisation. They might also be better
prepared for dealing with stress and burnout. Similarly, Maslach and Jackson (1981)
found there was a tendency for depersonalisation to decline with higher education
levels. Wong, Leung and So (2001) also found that nurses with higher education
levels were significantly less depressed and more likely to cope with stressful
situations than those with secondary school qualifications.
Some studies have shown that burnout scores increase with education levels and
though difficult to interpret, this might occur as a result of greater responsibility
(Maslach & Jackson, 1981; Maslach, Schaufeli & Leiter, 2001). This could be
explained by the fact that highly educated nurses and midwives have higher
expectations, and are therefore more likely to become distressed if their expectations
are not realised (Maslach, Schaufeli & Leiter, 2001). Koivula, Paunonen and
Laippala‟s (2000) study found that burnout was highest among those possessing a
secondary level education.
This study also found that if the person lived alone they were less likely to lose
empathy for their colleagues. Goodfellow et al‟s (1997) study showed that having
children and having a partner acted as buffers against stressors of work. They
commented that this could be due to work providing a welcome escape from their
home life or having multiple roles protecting them against stress within any of their
roles. Boey‟s (1999) study on distressed and stress resistant nurses in Hong Kong also
identified that when nurses are confronted with high levels of stress those with more
family support enjoy better mental health than those with fewer family supports.
When distinguishing between stress and prolonged exposure to stress resulting in
247
burnout, this might be explained by the fact that the respondents welcome the
interaction with people at work if they are living alone and perhaps not dealing with
added stressors at home such as cooking, cleaning and washing for other people. It
could also mean that they are unaware of how stressed they really are, juggling many
roles. No other study linked living alone with lower burnout levels. People living
alone might be more likely to want to converse and interact with people at work
because they do not receive that same interaction at home. Therefore they might be
less likely to distance themselves from their colleagues.
Those people who are unmarried are more likely to experience burnout than those
people who are married (Maslach, Schaufeli & Leiter, 2001). The questionnaire
developed for this study of nurses and midwives did not obtain information about
marital status. A spouse might impose a more balanced lifestyle by requiring the nurse
or midwife to spend more time away from work. The family might help an individual
cope by providing a balanced perspective (Cordes & Dougherty, 1993). Kotzabassaki
and Parissopoulos (2003) also highlighted that married people with children were
more resilient against burnout. Marital status is consistently under-investigated. On
one hand there might be security and support from a partner and home life, but there
might also be extra strains which are caused by marital relationships (Rhead, 1995). A
person living alone might not have the opportunity to communicate as closely with
other people and is a possible explanation why they are more likely to be empathic
towards colleagues in their workplace.
The implications of these results also reinforce other findings in this study which
show that younger nurses‟ and midwives‟ stress levels can be targeted to prevent
burnout. Younger nurses report higher stress levels leading to their leaving the
profession and one effective way to address this is by way of an appropriate and / or
relevant education syllabus. As this study reconfirms, longer hours can be discouraged
to prevent burnout signs such as apathy and feeling emotionally drained. This study
also predicts that the more educated the person is, and if they live alone, the less likely
they are to lose empathy for colleagues (which is an aspect of burnout). This finding
substantiates the positive effect of being better prepared and educated, and reduces the

248
need to target those people who live alone in the prevention and management of
burnout.
2.5.3. Demographic factors contributing to individual responses
This study found that working longer hours was associated with high levels of self-
imposed work pressure and motivation, suggesting those placing unreasonable
expectations on themselves or experiencing pressure related to work are more likely
to work longer hours. They might also work longer hours or overtime because they
are afraid that in failing to do so they will not be seen as a dedicated nurse or midwife.
In Catalyst, Cooper (video recording, 2007) stated that there was now clear evidence
that working longer hours causes stress and a lack of control over working life. He
reports that workplaces in the United Kingdom are now acknowledging stress for the
first time and implementing management standards for reduction of stress.
Individual differences such as education have an effect on the association between
strains and stressors (Maslach, Schaufeli & Leiter, 2001; O‟Donnell & Stephens,
2001). For this sample of nurses and midwives, those who possessed a degree or
higher qualification were less likely to place unreasonable pressure on themselves in
relation to work than those who possessed either a hospital certificate or diploma.
These nurses and midwives might have developed better coping skills because of their
education. Running parallel with these findings, other research indicates those who
are less educated are more likely to experience burnout than those who are more
educated (Balevre, 2001).
These demographic findings regarding individual responses, run parallel with the
previous findings related to stress and burnout which found that deleterious effects of
working longer hours leads to increased levels of self-imposed work pressure and
motivation. Again, working longer hours can be discouraged. The prediction that if
the person is more educated, they are less likely to experience high levels of self-
imposed work pressure and motivation also reinforces the benefit of education. These
results run parallel with other findings in this study, which found that if a person
possessed a degree or higher qualification, they were less likely to lose empathy for
colleagues.

249
2.6. Higher risk practice specialties for stress and burnout
Previous research on nursing stress has examined stress and area of clinical practice
(McGrath et al., 2003). The following provides information on particular groups of
nurses and midwives who are experiencing stress and burnout and identifies higher
risk workplaces or practice specialties. This study found that accident and emergency
nurses experienced the most anxiety and the highest levels of feeling powerless
compared to all other areas of practice. Given that there were only 20 nurses working
in the accident and emergency department in this study, further research could
investigate individual responses to stress and burnout in different areas of practice.
The nursing profession‟s status in an organisation, its lack of autonomy in decision-
making for provision and planning of care possibly influences nurses‟ and midwives‟
experiences of powerlessness (Severinsson, 2003). Alternatively, Gillespie and Melby
(2003) found that nurses working in accident and emergency experience lower levels
of exhaustion compared to those working in acute medicine. There might be specific
issues re stress and burnout concerning nurses working in accident and emergency,
but as this study was not designed to deal with this aspect, other studies might want to
pursue this. The implications of this could mean that because accident and emergency
nurses are dealing with incoming admissions, lack of beds in hospitals render them
powerless in an already overworked and under-resourced system. Even though other
areas of nursing are dealing with similar issues, they perhaps have more control over
incoming admissions into their ward areas. Research attended by the NSW Nurses
Association (2008j) has shown that nurses from accident and emergency report that
their workloads are unrealistic, seeing between 150 to 170 clients per day, and with
five to six clients awaiting evaluation and treatment at any one time.
Browning et al. (2001) also found that emergency nurses reported experiencing stress
more frequently compared with nurses not working in emergency. They reported
higher levels of emotional exhaustion and depersonalisation. Similarly, Levin, Hewitt
and Misner (1998) found that emergency nurses‟ stress levels are rising due to an
emphasis on client satisfaction, which contributes to a risk of being subjected to
violence by clients.
250
For this study, nurses from accident and emergency were also one of the oldest groups
compared to other areas of practice. Nurses from accident and emergency had also
spent significantly more years in the profession compared to all other groups. Years in
profession helps explain these nurses‟ ages. Ng et al. (1999) found differences in tasks
performed and work conditions could be responsible for dissimilarities in stress levels
in nurses working in different settings. Marshall (1980) and Slater‟s (1993) research
suggests stress in nursing could fluctuate as a function of a particular specialty. No
other study could be found comparing years in profession among different areas of
practice except for Wheeler and Riding (1994), who found that midwives had spent
many more years in the profession compared to general nurses.
Commonality of factors of stress cannot be assumed for nurses and midwives within
the same areas of practice. The impact of stress and perceptions of nurses and
midwives varies considerably within the same workplace. Consequently, an
evaluation of stress for nurses working in any area cannot predict ensuing distress
within an individual (McVicar, 2003). Due to the small numbers in this study more
comparative studies in Australia are recommended, as nurses‟ and midwives‟ needs
might vary between areas of practice.
Also important to these findings are the areas of stress and burnout which do not
differ significantly between the areas of practice (see Appendix 14, section 2). This
information pinpoints those areas which do not need attention. Strategies to reduce
stress and burnout would then not need to be differentiated to meet such subgroups in
order to be effective. These areas of stress include depression, helplessness and job
dissatisfaction. It would seem that all areas of practice, then, have similar job
dissatisfaction levels. For burnout these include apathy, low morale, fatigue and
feeling emotionally drained. These areas of burnout highlight nurses‟ and midwives‟
resultant fatigue with no differentiation between groups of practice.
3. Limitations of study
Despite careful piloting, some problems with the questionnaire were encountered.
Inefficient time management (for example, due to excessive workloads) was a poor

251
choice of question as it was double-barrelled and difficult to ascertain whether the
issue was time management or excessive workload. Even though Pinikahana and
Happell (2004) have shown that inefficient time management goes hand in hand with
excessive workloads, future research could separate these issues into two questions
and investigate associations or relationships between the two. As the question relating
to feeling incompetent in one‟s work with people was not clearly restricted to one‟s
work environment, the respondents‟ answers might reflect their feeling incompetent in
the work, home and / or social environment. A future question could focus on the area
of work; research concentrating on the home and work interface is an important
reference for future stress and burnout studies. A further limitation of the
questionnaire included eight questions in the first section with „never / occasionally‟
in the same box. This made it impossible to separate those respondents who wanted to
answer „never‟ and those whose answer was meant to signify „occasionally‟. Future
questions should separate the options „never‟ and „occasionally‟.
For factor analysis, residuals were calculated between reproduced and observed
correlations. Residual values were large for factor analysis calculations for exhaustion
and pressure and motivation subscales performed as part of this study, and so
generalisations could not be made beyond this study for those particular subscales.
Any conclusions reached for exhaustion and pressure and motivation subscales must
then be restricted to this sample (being used). Even though there are no set rules in
factor analysis about what residual proportions should be, the percentage of residuals
with values over 0.05 ought to be less than 50 percent to make a possible
generalisation beyond that sample (Field, 2005).
The questionnaire also asked whether the nurse or midwife worked permanent,
fulltime, part-time or casual so they could specify their employment status. This
allowed ambiguous interpretation resulting in 44 nurses and midwives specifying
permanent hours but without distinguishing if they worked fulltime or part-time. In
future, this question should ask for distinct categories such as if they worked
permanent fulltime, permanent part-time, temporary fulltime, temporary part-time,
casual fulltime or casual part-time.

252
Given that this study was exploratory, included a convenience sample of 562 nurses
and midwives from a national population of 228,230 working in Australia and
information was obtained by volunteers who participated, ability to generalise is
limited (Mackin & Sinclair, 1998; Schneider et al., 2003). Convenience sampling uses
those conveniently available people. The problem is that these people could be
atypical of nurses and midwives in the general population in so far as critical variables
measured (Polit & Hungler, 1999). It was also unknown for more than two-fifths
(44.1%) of the sample which state or territory they worked in as nurses or midwives,
as the questionnaire asked for country of practice only. As nurses and midwives who
participated in this study were self-selected from attendees at professional
conferences, it could be that respondents were more motivated and willing and
perhaps less stressed than other work colleagues who were not present at these
conferences. The fact that respondents volunteered to complete the questionnaire
could cause underestimation of adverse results of stress and burnout (Zhao & Turner,
2008).
It is acknowledged that high achievers might also be more likely to attend conferences
and participate in research questionnaires. Other work colleagues might not have been
financially able to attend and / or had family commitments preventing them from
attending the conferences. Those nurses and midwives who attended these
conferences and did not complete the questionnaire, might have been too disaffected
and exhausted to participate in this research or too interested in other topics and
stands at the conferences, which could have resulted in underestimation of real trends.
The response rate (41.4%) raises concern about the remaining nurses‟ and midwives‟
stress levels. Those nurses and midwives experiencing high burnout levels might have
been too fatigued to participate in this study. It was not possible to determine if there
were multiple responses from the same respondents, as respondents voluntarily picked
up the questionnaires from a conference stand. While it seems unlikely that, during
the data collection time-frame from April to November 2005, a nurse or midwife
would have attended two conferences dealing with similar themes, let alone would
have chosen to complete the same questionnaire twice, this possibility cannot be
entirely discounted. As the conference organisers neither collected nor released

253
relevant data pertaining to conference respondents there was no opportunity to assess
non-response bias (Polit & Hungler, 1997).
All data were based on self-assessment and there was no substantiation of data to
confirm and validate number of hours worked as used in triangulation methods. De
Lange et al. (2004) argue that findings from self-report data „could be more useful
than is frequently assumed‟. They assert that discussions concerning „objective‟
measures as being superior to self-report data are not very constructive. The fact that
self-appraisal plays a major role in determining stress levels makes it suitable to use
self-report tools to assess stress at work (Williams & Cooper, 1998). Self-report
questionnaires are probably used most frequently in stress studies and the results can
therefore be compared with other studies (Ryan & Quayle, 1999). As this
questionnaire did not assess personality types, individual responses were assessed
which might relate somewhat to their personality. The question remains, whether
personality types affects nurses‟ and midwives‟ perception of stress (Wheeler &
Riding, 1994).
A complete assessment of stress and burnout would include biochemical blood
analyses, physiological measurements as detected by Ng et al‟s (1999) study
evaluating changes in immunoglobulin-A in saliva and an assortment of rating
methods measuring mental and physical health status. Better psychological tools are
needed, as well as an assortment of rating methods for physiological measurements
(McVicar, 2003). These resources were unavailable for this study, although a follow-
up study could now be undertaken. This study did not specifically focus on coping
strategies used by nurses and midwives but future research could pursue this aspect of
the stress and burnout phenomena.
4. Summary
This research, with the findings from the questionnaire, has, by way of factor analysis,
been able to show the different variables which distinguish stress and burnout from
each other. It is simplistic to claim that one, two or three factors of stress relate to all
nurses and midwives (McVicar, 2003). The phenomena of stress and burnout are

254
multifaceted and cannot be explained without some overlap (Ootim, 2001). Some of
the stress variables include time pressures and organisational support related to the
work environment. Other stress variables include psychosocial effects such as
sleeplessness and depression. The other stress variables relate to job dissatisfaction
and not enjoying the work. Burnout variables include low morale, a sense of
powerlessness, feeling exhausted and overwhelmed. This prevents nurses and
midwives from being able to empathise with colleagues and clients, leading to poor
quality client care. Individual responses to workplace issues include such variables as
expecting more than reasonably possible, working at high performance and multi-
tasking.
The main difference between stress and burnout is that stress begins as a feeling of
unease in the workplace, as being unable to control the working environment
demands, leading to a build up of pressure and job dissatisfaction. This then leads to
symptoms of ill health over a prolonged period of time. Burnout ensues as an
emotional state from prolonged exposure to stress which leads to exhaustion and
feeling overwhelmed. This then interferes with quality of client care by way of poor
communication with clients and colleagues and a sense of not achieving in the
workplace, leading to low morale. Understanding individual and workplace responses
to various stressful issues can limit burnout in the nursing and midwifery professions.

255
Chapter 6
CONCLUSION
The central components of various individual responses to stress and burnout for this
sample of nurses and midwives related to the work environment, psychosocial effects,
job dissatisfaction, exhaustion levels and work behaviours such as self-imposed work
pressure and motivation. As there are reported high levels of stress and burnout in the
nursing and midwifery profession, the goal of this study was to investigate, as well as
document, nurses‟ and midwives‟ awareness of stress, burnout and individual
responses to enable an accurate self-assessment of their own as well as workplace
stress. For nurses and midwives to be able to do this, appropriate training, tools, time
and support (by management and peers) would need to be implemented. New tools
might also still need to be developed to assess and manage workplace stress and
burnout for nurses and midwives. These actions by senior management and nurses and
midwives in clinical areas might need to be included as part of one‟s routine
professional practice.
This study has shown that it is possible to develop a questionnaire specifically related
to nurses and midwives working in Australia. Since beginning this study, there have
been significant changes within the nursing and midwifery working environments,
with a real focus on reducing workloads and introducing tools to assess nurse /
midwife / patient ratios and patient acuity (Achterstraat, 2007; NSW Health
Department, 2002-2003; NSW Nurses Association, 2007). These improvements in the
workplace and the information generated from this questionnaire could foster
improved quality care for patients and ideally reduce stress and burnout levels within
the profession.
Similar percentages of respondents experienced stress as well as burnout. The three
factors linked with stress for this study, being work environment, psychosocial effects

256
and job dissatisfaction were all positively associated with exhaustion, a factor linked
with burnout. The information on the subscales, exhaustion relating to burnout, and
pressure and motivation relating to individual responses, introduce tantalising clues
for consideration, discussion and future, more focused research.
1. Stress
The fact that the majority (59%) of nurses and midwives in this study identified
moderate levels of stress overall highlights that the stress phenomenon should not be
taken lightly. Stress was positively associated with burnout for this study, suggesting
a continuum between stress and burnout. Working longer hours was also positively
associated with incidence of stress, highlighting the negative impact of long hours in
the workplace. Incidence of stress was significantly different among the various
practice specialties, highlighting the importance of assessment of stress for separate
areas within nursing and midwifery. If organisations do not address and recognise
stress in the workplace, nurses and midwives might continue to leave the profession
and quality of patient care could decline.
Developing quality work environments is a priority for both patient care and the
healthcare system in general. This includes targeting increasing staffing levels,
ensuring use of safe, effective equipment in the workplace and the enhanced
empowerment and control over workloads, as shown by the results of this research.
Debriefing with managers and / or co-workers following each shift, especially when
dealing with life and death situations, should be part of routine nursing and midwifery
practice. This could include assessment of psychosocial effects of stress, such as
sleeplessness, by way of questionnaires and informed, thoughtful dialogue with
clinical nurses and midwives. Better support for currently practising nurses and
midwives which includes education and training about continual assessment of stress
and developing coping mechanisms as part of their professional practice could
enhance job satisfaction.
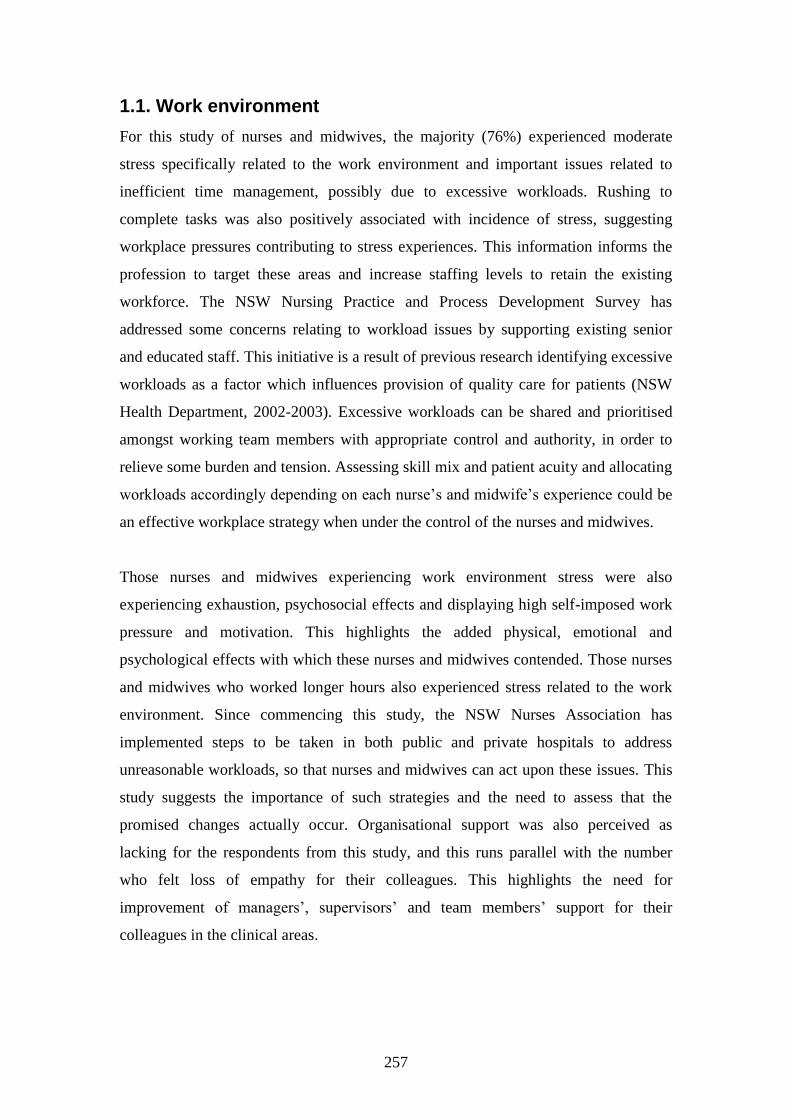
257
1.1. Work environment
For this study of nurses and midwives, the majority (76%) experienced moderate
stress specifically related to the work environment and important issues related to
inefficient time management, possibly due to excessive workloads. Rushing to
complete tasks was also positively associated with incidence of stress, suggesting
workplace pressures contributing to stress experiences. This information informs the
profession to target these areas and increase staffing levels to retain the existing
workforce. The NSW Nursing Practice and Process Development Survey has
addressed some concerns relating to workload issues by supporting existing senior
and educated staff. This initiative is a result of previous research identifying excessive
workloads as a factor which influences provision of quality care for patients (NSW
Health Department, 2002-2003). Excessive workloads can be shared and prioritised
amongst working team members with appropriate control and authority, in order to
relieve some burden and tension. Assessing skill mix and patient acuity and allocating
workloads accordingly depending on each nurse‟s and midwife‟s experience could be
an effective workplace strategy when under the control of the nurses and midwives.
Those nurses and midwives experiencing work environment stress were also
experiencing exhaustion, psychosocial effects and displaying high self-imposed work
pressure and motivation. This highlights the added physical, emotional and
psychological effects with which these nurses and midwives contended. Those nurses
and midwives who worked longer hours also experienced stress related to the work
environment. Since commencing this study, the NSW Nurses Association has
implemented steps to be taken in both public and private hospitals to address
unreasonable workloads, so that nurses and midwives can act upon these issues. This
study suggests the importance of such strategies and the need to assess that the
promised changes actually occur. Organisational support was also perceived as
lacking for the respondents from this study, and this runs parallel with the number
who felt loss of empathy for their colleagues. This highlights the need for
improvement of managers‟, supervisors‟ and team members‟ support for their
colleagues in the clinical areas.

258
1.2. Psychosocial effects
It is evident from this research that a significant proportion (40%) of nurses and
midwives are experiencing an array of psychosocial effects associated with stress.
Psychosocial effects such as anxiety, sleeplessness, depression, headaches and
helplessness were the most dominant factors relating to stress. This research provides
information so that nurses and midwives can become aware of these effects, thereby
reducing the risk of ill health. If nurses and midwives are made aware of these effects
as part of their education and syllabus they might make more informed decisions
about where they want to work.
A focus on developing coping skills for the future and the importance of debriefing
with colleagues following critical incidents would be a valuable strategy to
incorporate into the workplace. This research found that nurses and midwives are
going to work even though they are ill, thus putting not only themselves at risk, but
their patients as well. Those nurses and midwives experiencing psychosocial effects
of stress were also experiencing work environment stress, exhaustion and job
dissatisfaction, implying that physical and mental ailments that these nurses and
midwives were experiencing were related to their workplace. Those nurses and
midwives who experienced stress requiring treatment and sleeplessness, were also
feeling emotionally drained, indicative of psychosocial effects related to stress and
moving towards burnout. Nurses and midwives who experienced stress requiring
treatment were also experiencing headaches requiring analgesia, further highlighting
psychosocial effects of stress in this study. The older the person was and the longer
they worked in the profession, the less likely the nurse or midwife was to take “mental
health” leave, which runs parallel with other results from this study.
Those nurses and midwives working longer hours were more likely to experience
sleeplessness, which is an area that could be focused upon for future research,
especially with the introduction of 12 hour shifts to promote continuity of care for
patients. A quarter of this sample of nurses and midwives reported that they
experienced sleeplessness at least once or twice a week. This is a substantial
proportion of nurses and midwives experiencing sleeplessness, considering short-term
sleeplessness was associated with long-term sleeplessness, meaning that these nurses

259
and midwives could be dealing with sleeplessness for some time. Working longer
hours might serve the purpose of better continuity of care for patients but ultimately
might be deleterious for the ability of the nurse or midwife to provide high quality
care for an extended period. Managers fostering autonomy and involving nurses and
midwives in decision-making in the workplace and preventing overtime could help
reduce these psychosocial effects of stress. Nurses and midwives could have increased
control over better working hours by job-sharing which could reduce the incidence of
“mental health” leave and reduce other effects such as sleeplessness. Nurses and
midwives experiencing sleeplessness were also dealing with depression and feeling
emotionally drained, suggestive of long-term effects of stress and burnout.
Managers, educators and supervisors must continually assess their staff and consider
the psychosocial effects that stress in the workplace might generate. This would
involve continual assessment of issues such as treatment for stress and job satisfaction
by way of questionnaires (which could still need to be developed), and ensuring that
communication lines are open between all colleagues as part of daily professional
practice. If nurses and midwives can work in areas where they feel comfortable, job
dissatisfaction levels might then decrease as nurses and midwives address their
psychosocial situation.
1.3. Job satisfaction
The majority (57%) of this sample of nurses and midwives were moderately satisfied
with their work. Enjoying the work and perceiving themselves as suited to their
particular type of work related to nurses‟ and midwives‟ job satisfaction. Job
dissatisfaction is another factor linked with stress and in fact, nurses and midwives
who were experiencing psychosocial effects of stress were also experiencing work
environment stress and job dissatisfaction. Those nurses and midwives who were
dissatisfied in their job were also exhausted, suggesting they were discontented in
their work due to their fatigue levels moving well within the definition of burnout.
Being younger was also associated with job dissatisfaction for this sample of nurses
and midwives.

260
It is evident that the nurses and midwives in this study, despite their experiences of
stress and burnout, continue to work in their profession as they enjoy what they do.
Managers could foster collegial and respectful relationships with those nurses and
midwives presently in the workforce to reduce the likelihood of their leaving the
profession. Nurses and midwives currently working in the system also need to be
appropriately praised and rewarded by senior management for their good work to
enhance morale and camaraderie so that they feel that they are being recognised and
valued for the work they do. Anecdotal reports of nurses and midwives only receiving
feedback for negative complaints should be an occurrence of the past.
2. Burnout
The majority (54%) of this study of nurses and midwives scored moderate burnout
levels, which indicates that a substantial proportion of those in the workplace were
already dealing ineffectively with what they described as continuous stress. Nurses or
midwives subjected to working longer hours, were more likely to experience burnout,
apathy and feel emotionally drained, highlighting this pertinent issue in the prevention
and management of burnout. This study identified some of the characteristics of
nurses and midwives less likely to suffer burnout. Being older, and having spent more
years in the profession lessened their chances of losing empathy for clients which is a
component of burnout. Being older they were also less likely to feel emotionally
drained, suggesting development of coping mechanisms and higher tolerance of
burnout levels as they age. As these nurses and midwives become more experienced
in dealing with continued stress they reduce the likelihood of moving into burnout. A
more educated person was less likely to lose empathy for colleagues, suggesting
development of coping skills and better education to provide more camaraderie and
support from work colleagues. If they were living alone, they were also less likely to
lose empathy for colleagues. These people, then, were probably more likely to
develop close harmonious working relationships. Clinical supervision could be made
available to all nurses and midwives working in the healthcare system so that they
have an outlet to diffuse stress which accumulates over time, thereby preventing
burnout.

261
2.1. Exhaustion
The main factor linked with burnout for nurses and midwives in this study was
exhaustion. There were strong links between experiencing low morale, feelings of
powerlessness and exhaustion relating to prolonged exposure to stress in the
workplace. These results suggest that, overall, these nurses and midwives have
become overtired possibly from working in an environment which restricts autonomy
and decision-making, resulting in low self-esteem. Nurses and midwives might need
encouragement to accurately assess their own workplace stress as those who were
exhausted were also experiencing work environment stress, psychosocial effects of
stress, job dissatisfaction and working longer hours. It seems that for these nurses and
midwives, exhaustion pervades their personal and professional daily lives.
3. Individual responses
The majority (53%) of nurses and midwives showed moderate levels of self-imposed
work pressure and motivation. As noted before, the more educated nurses and
midwives were less likely to place unreasonable pressure on themselves. Being more
educated suggests that those people are less likely to inflict unnecessary pressures on
themselves or, as previously noted, might be better prepared to cope in the first place.
This also suggests development of better coping mechanisms or the fact that they
were more educated to deal with internal or external pressures. Further research could
focus on the interrelationship between stress and self-induced pressure, job
compatibility and the type of person entering the profession. The findings might then
highlight how a person might be expected to behave, and subsequently respond and
perform in the healthcare workplace.
3.1. Pressure and motivation
If stressors are absent there is no motivation, and if they are excessive nurses and
midwives might place unreasonable expectations on themselves, either as a result of
the work environment or themselves. As far as work behaviours such as self-imposed
work pressure and motivation were concerned, those nurses and midwives who
wanted to achieve more in a short space of time also placed unreasonable expectations
on themselves, highlighting self-imposed time urgency and unnecessary deadlines.

262
Those nurses and midwives experiencing work environment stress also displayed high
levels of self-imposed work pressure and motivation, suggestive of the workplace
pressures faced by these nurses and midwives. This could also mean that the more
pressure nurses and midwives impose upon themselves the more likely they were to
feel stressed in their work environment. Those nurses and midwives who worked
longer hours also scored high self-imposed work pressure and motivation levels,
which suggests that those who placed unreasonable expectations on themselves or felt
pressure from work are more likely to work longer hours. Future research focusing on
nurses and midwives placing unnecessary pressure upon themselves might shed light
on the relationships between excessive workloads preventing them from achieving
their goals and providing quality care.
4. Implications for nursing and midwifery policy and
practice
Detecting stress in the nursing and midwifery profession is not easy but this might be
able to be achieved by continually updating professional practices and promoting
awareness of the difficult conditions in which health professionals work. Nurses and
midwives also need positive reinforcement. Relationships between the individual
responses to stress and burnout have been presented, as well as the effect of individual
differences such as demographics on stress-related areas and higher risk workplaces.
These pertinent areas relate to this study‟s nurses‟ and midwives‟ issues, concerns,
expectations, effects and satisfaction as they deal with stress and burnout in their
healthcare workplace.
Nurses and midwives need to be continually reminded and educated about the
possibility of stress and burnout within the profession. They need to assess their own
workplace stress and heighten their awareness so they can reduce occupational
hazards and reduce the likelihood of developing health problems related to stress and
burnout. As shown by this research, there are many types of stress and burnout that
nurses and midwives encounter in their daily working lives.

263
If novice nurses have the appropriate information concerning major issues they are
likely to have to deal with in their chosen career, and are provided with effective
strategies to address stress and burnout, their improved and more realistic
understanding and expectations of the nursing and midwifery working environments
will assist them throughout their professional lives. This research will make nurses
and midwives aware of their own personal attributes, matching them to a particular
work environment appropriate to individual needs of skill, experience, choice and
suitability. Individual potential can then be fully maximised. This research will
provide line and senior health managers and other key stakeholders with relevant
information as to a range of appropriate workplace strategies which, if implemented
effectively, reduce stress and burnout within the nursing and midwifery workforce.
Employers, both governmental and private, need to continually address issues of
excessive workloads and enhance the quality of work environments so that nurses and
midwives can work effectively. If senior management and policy advisors can
acknowledge and assess stress and burnout within the nursing and midwifery
profession this might be enough to eradicate increased levels of burnout and prevent
nurses and midwives leaving the profession. Even if assessment of stress and burnout
is addressed, for example, on a monthly basis, with any of the reliable tools available,
at least nurses and midwives might feel as though their stress and burnout is being
acknowledged and monitored.
If nurses and midwives are able to work effectively and efficiently in their workplace,
retention rates will possibly improve. Targeting workplace and occupational stress
will thereby minimise future burnout and the associated psychosocial effects,
exhaustion and job dissatisfaction, as this research found that nurses and midwives do
enjoy their work. Other factors linked with stress relate to psychosocial effects which
include psychological and physical ailments requiring treatment and “mental health”
leave. If managers can be aware of these signs and symptoms in the workplace these
problems can be addressed before they lead to burnout.
It seems that, according to this study, older and more educated nurses and midwives
are less stressed than their younger counterparts. It could be that they have developed

264
better coping mechanisms. As far as job compatibility was concerned, they might
have stayed in the profession because they perceive that they are suited to the
particular type of work and enjoy what they are doing. Marketing strategies might
attract younger nurses and midwives into the profession but the problem then is
retaining this workforce. Retaining this dedicated workforce and attracting and
nurturing younger nurses and midwives into the profession will be a challenge for
future employers if they do not address the stress and burnout phenomena. Those
nurses and midwives living alone were identified as less likely to experience ill effects
of burnout which provides some information for the nursing and midwifery profession
and the health professions when they are dealing with stressful issues.
This study found that accident and emergency nurses experienced some aspects of
stress and burnout more than other areas of practice, suggesting that research into
stress and burnout in the various speciality areas of nursing practice would be useful.
This research informs people who design nursing and midwifery curricula so that they
can make stress and burnout a priority within their education syllabus. Education
including awareness of signs, symptoms and prevention of stress strategies might
improve retention rates. If nurses and midwives are educated about these issues at the
outset of their careers, they will be able to develop their own coping strategies early
enough to reduce the likelihood of leaving the profession. This might then also reduce
ill health and treatment of nurses and midwives for stress. It seems that shorter
working hours, improved pay and better working conditions are components of
excellence in quality of care; these issues need to be considered in attempts to reduce
the likelihood of ill health in the nursing and midwifery profession.
Nurses and midwives must have realistic expectations of themselves so they can
provide quality care for their clients in their workplace. This research could also
inform career counselling to address individual responses to stress and burnout of the
future nurse and midwife workforce. Future nurses and midwives entering the
profession need to be aware of the present status of the healthcare system so that they
can prepare themselves for their professional lives.

265
The literature and this research identifies that clinical supervision might become
routine for the nursing and midwifery profession; this supervision could focus on the
professional and personal development of the nurse or midwife, encouraging
reflective clinical practice to promote quality care for the patient. If nurses and
midwives are able to debrief about their workplace problems and issues, as in clinical
supervision, either as part of their paid work time or if preferred in an external source
of individual counselling, the impact of stress and burnout might diminish. Dealing
with critical incidents at the time they are encountered might lessen the impact of
those incidents.
5. Summary
This research has shown that nurses and midwives are experiencing problematic stress
issues associated with their workplace and the psychosocial effects that accompany
stress and burnout. Increased exhaustion levels were a result of a combination of work
environment stress, psychosocial effects and job dissatisfaction. Even though these
nurses and midwives are working with moderate levels of stress and burnout, the
majority enjoy their work and do not want to leave their profession. Considering the
levels of stress and burnout that these nurses and midwives describe, these results
display a dedicated workforce, and possibly explain why they have not left the
profession. It also might mean that they have become accustomed to their stressful
work environment and are not acknowledging and dealing with their stress and
burnout, as most do not feel supported by their colleagues to do so.
It seems that inefficient time management (for example, due to excessive workloads);
and time pressures or deadlines, were important issues for this study of nurses and
midwives, and if governments and employers focus on alleviating workload issues
stress and burnout might decline. For nurses and midwives working in the healthcare
system, if time management issues, such as excessive workloads, team-work and
patient acuity can be prioritised, work environment stress could be lessened. Particular
demographics increased the likelihood of experiencing stress, burnout and high self-
imposed work pressure and motivation with working longer hours being one of the
most deleterious causes. Working longer hours for these nurses and midwives

266
increases the likelihood of experiencing stress and burnout in the workplace and was
responsible for detrimental effects including sleeplessness and feeling emotionally
drained. Consequently a focus, by employers on the duration of shifts is warranted. If
policy makers and senior management could concentrate on reducing working long
hours in the workplace, levels of stress and burnout might be lessened. Increasing
staff numbers and streamlining services would ameliorate some of these effects so
that nurses and midwives can provide quality care.
According to this research, organisational support needs to be improved so that nurses
and midwives can support their colleagues and feel recognised and valued with the
best outcomes for patient care. Increased organisational support, both by senior nurse
and health care managers could reduce work environment stress. It is therefore
essential for managers to identify and work with nurses and midwives who are
constantly encountering stress, by way of better communication, by face-to-face
interaction in the clinical areas. This could be addressed by simply monitoring nurses‟
and midwives‟ stress levels through administration of questionnaires to assess stress,
and through formal and informal enquiries. This could include frequent discussions,
dialogue and regular meetings with clinical practising nurses and midwives. Nurses
and midwives might then feel that their stress is being addressed and acknowledged.
Likewise, nurses and midwives need to be outspoken without being ashamed, to alert
their managers about increasing stress levels before they reach burnout.
If this research‟s findings are made available to other nurses and midwives in the
profession by way of publications or conference presentations it would hopefully
enable them to make informed choices for the workplace and professional
development. Nurses and midwives need opportunities for training, education and
support in these areas, to enable them to make informed choices so they are not
oblivious to the obvious stressors which lie ahead of them. Clinical supervision is one
way of addressing the outcomes of stress and burnout, and even though it is only a
relatively new phenomenon for the nursing and midwifery profession it might be a
useful method of confronting and dealing with problems caused by excessive levels of
stress and burnout.

267
If nurses and midwives are to continue to provide quality care, a reduction of work
hours, increasing morale and developing strategies to reduce feelings of being
powerless, as well as attention to proper staffing, would likely contribute to reducing
stress and burnout. Future research could focus on in-depth interviews which would
complement this quantitative study to further explore specific reasons why nurses and
midwives work the way they do and pursue the phenomena of associated individual
responses to stress and burnout. Results of this research highlight the need for policy
makers to address the workload issue so that individual responses to stress and
burnout could be continually assessed for the existing nurse and midwife workforce.
Those nurses and midwives found to have problems could be treated and counselled,
instead of attempting to deal with the aftermath of a stressful workplace. Future
resources could be targeted at retaining this dedicated existing workforce and
attracting younger nurses and midwives into the profession. If all relevant
stakeholders implemented these above recommendations stress and burnout levels
should then become more manageable. This study has provided further evidence in
the area of stress, burnout and individual responses to workplace issues, adding to the
body of existing information which will hopefully further inform nursing and
midwifery practice.
6. Recommendations for further research
Long-term effects such as sleeplessness and feeling emotionally drained were
deleterious effects of stress and burnout for this study. An understanding of the
association of these deleterious effects with working longer hours could assist nurses
and midwives to make better choices regarding time spent in the workplace. It is
unknown whether working these longer hours was voluntary for these nurses and
midwives. This could be pursued in further research, to compare if those working
longer hours voluntarily are more stressed than those working longer hours
involuntarily.
Individuals might behave differently in various situations and this research has shown
that the workplace had a significant effect on nurses and midwives placing
unreasonable expectations on themselves. This might be due to the excessive

268
workload or the type of personality likely to self-impose pressures and deadlines.
Nurses and midwives possibly feel that they own the „problem‟ rather than the
organisation owning it. The idea that nurses internalise the responsibility for
workplace stress is one worth examining. This is an area which could be targeted for
identifying solutions.
This study did not research coping mechanisms, focusing more on the sources and
effects of stress and burnout. Coping mechanisms could be investigated further as
relating to stress and burnout. The challenge is to investigate how coping strategies
used by nurses and midwives in managing stress influence reduced stress as well as
affect patient care.
Consideration should be given to pursuing further research into those nurses and
midwives who have already changed their area of practice or left the profession as to
reasons why they made this change. If their reasons for leaving the profession include
experiences of stress and burnout, these could be focused on for future research.
Changing the area of practice could also be seen as a solution to addressing stress and
burnout and investigation into these areas is worth pursuing. Clinical supervision is an
area where further research is warranted, once it has been implemented and whether it
has made a significant difference to nurses‟ and midwives‟ experiences of stress and
burnout.

269
References
AbuAlRub, R. F. (2004). Job stress, job performance, and social support among
hospital nurses. Journal of Nursing Scholarship, First Quarter, 73-78.
Achterstraat, P. (2007, February). All hospitals should use workload tool. The Lamp,
64, 24-25.
Alicke, M. D. (1985). Global self-evaluation as determined by the desirability and
controllability of trait adjectives. Journal of Personality and Social
Psychology, 49(6), 1621-1630.
Altun, I. (2002). Burnout and nurses' personal and professional values. Nursing
Ethics, 9(3), 269-278.
Ames, M. M., Kilpatrick, A. O., Zoller, J., Sistino, J. J., Blackwell, M., & Acsell, J.
(2004). A national study of job satisfaction and burnout among perfusionists.
The Journal of The American, Society of Extra-Corporeal Technology, 36(1),
44-50.
Arnold, J., Cooper, C., & Robertson, T. (1995). Work Psychology Understanding
human behaviour in the workplace (2nd ed.). London: Pitman Publishing.
Atkinson, J. M. (1988). Coping with stress at work. Northamptonshire: Thorsons
Publishing Group.
Australian Council of Trade Unions, (1997). Stress at work: not what we bargained
for: a report on the Australian Council of Trade Unions. Melbourne: ACTU
National Occupational Health and Safety Unit.
Australian Institute of Health and Welfare, (2006). Nursing and midwifery labour
force 2004 (No. HWL 38). Canberra: Australian Institute of Health and
Welfare.
Badger, J. M., Kaiman, C., & Moellering, M. (2001). Understanding secondary
traumatic stress. The American Journal of Nursing, 101(7), 26-33.
Bailey, R. D. (1985). Coping with stress in caring. Oxford: Blackwell Scientific
Publications.
Bakker, A. B., Killmer, C. H., Siegrist, J., & Schaufeli, W. B. (2000). Effort-reward
imbalance and burnout among nurses. Journal of Advanced Nursing, 31(4),
884-891.
Baldwin, P. (1999). Stress and the nurse. Nursing Standard, 13(16), 22, 24.
Balevre, P. (2001). Professional nursing burnout and irrational thinking. Journal for
Nurses in Staff Development, 17(5), 264-271.
Barak, Y., Achiron, A., Kimh, R., Lampl, Y., Gilad, R., Elizur, A., & Sarova-pinhas,
I. (1996). Health risk among shift workers: a survey of female nurses. Health
Care Women International, 17, 527-533.
Barling, J. (2001). Drowning not waving: burnout and mental health nursing.
Contemporary Nurse, 11(2-3), 247-258.
Barnason, S. (2001). Research paper and poster summaries from the ENA 2001
annual meeting. Journal of Emergency Nursing, 27(5), 422-429.
Barrett, L., & Yates, P. (2002). Oncology/haematology nurses: a study of job
satisfaction, burnout, and intention to leave the specialty. Australian Health
Review, 25(3), 109-119.

270
Barton, J., Spelton, E., Totterdell, P., Smith, L., & Folkard, S. (1995b). Is there an
optimum number of night shifts? Relationship between sleep, health and well-
being. Work & Stress, 9(2/3), 109-123.
Barton, J., Spelton, E., Totterdell, P., Smith, L., Folkard, S., & Costa, G. (1995a). The
Standard Shiftwork Index: a battery of questionnaires for assessing shiftwork-
related problems. Work & Stress, 9(1), 4-30.
Basel, Grassi, L., & Magnani, K. (2000). Psychiatric morbidity and burnout in the
medical profession: an Italian study of general practitioners and hospital
physicians. Psychotherapy and Psychosomatics, 69(6), 329-335.
Bausler, C. (1992). The relationship between burnout and personality hardiness in
nursing faculty. University of Missouri, Columbia.
Beaudoin, L. E., & Edgar, L. (2003). Hassles: their importance to nurses' quality of
work life. Nursing Economics, 21(3), 106-113.
Begat, I., Ellefsen, B., & Severinsson, E. (2005). Nurses' satisfaction with their work
environment and the outcomes of clinical nursing supervision on nurses'
experiences of well-being - a Norwegian study. Journal of Nursing
Management, 13, 221-230.
Behling, D., & Guy, J. (1993). Industry profile: healthcare - hazards of the healthcare
profession. Occupational Health and Safety, 62(2), 54-60.
Bellack, J. P. (1999). Emotional intelligence: a missing ingredient? Journal of
Nursing Education, 28, 3-4.
Bello, A. (1994). Descriptive Data Analysis. In LoBiondo-Wood, G. & Haber, J.
(Eds.), Nursing Research Methods, Critical Appraisal, and Utilization (pp.
385-403). St Louis: Mosby.
Bender, E. (2001). Phenomenological study of emergency nurses' lived experience
with the use of gallows humour: release valve for stress, tension and anxiety.
Journal of Emergency Nursing, 27(5), 423.
Berg, A. M., Hem, E., Lau, B., Haseth, K., & Ekeberg, O. (2005). Stress in the
Norwegian police service. Occupational Medicine, 55, 113-120.
Bergen, E., & Fisher, P. (2003). Stress, burnout and trauma in health care. When
working hurts. Nursing BC, 35(5), 12-15.
Bernardin, H. J., & Bownas, D. A. (1985). Personality Assessment In Organizations.
New York: Praeger.
Billeter-Koponen, S., & Freden, L. (2005). Long-term stress, burnout and patient-
nurse relations: qualitative interview study about nurses' experiences.
Scandinavian Journal Of Caring Sciences, 19(1), 20-27.
Blatchford, B. (2003). Less stress, more profitability. Dental Economics, 93(2), 32-33.
Bloom, B. L. (1988). Health Psychology A Psychosocial Perspective. New Jersey:
Prentice Hall.
Boey, K. W. (1996). A factorial study of work stress among the nursing profession.
Professional Nurse, 26, 38-40.
Boey, K. W. (1999). Distressed and stress resistant nurses. Issues in Mental Health
Nursing, 20(11), 33-54.
Bohle, P., & Quinlan, M. (2000). Managing Occupational Health And Safety A
Multidisciplinary Approach (2nd ed.). Melbourne: MacMillan Publishers
Australia Pty Ltd.
Breakwell, G. M. (1990). Are you stressed out? American Journal of Nursing, 31-33.
Breaux, C. A. (1998). Burnout in mental health caregivers for persons with HIV
disease: coping strategies, appraised controllability and perceived coping

271
efficacy. Dissertation Abstracts International: Section B: the Science and
Engineering, 58(9-B), 5107.
Brenninkmeijer, V., & VanYperen, N. (2003). How to conduct research on burnout:
advantages and disadvantages of a unidimensional approach in burnout
research. Occupational and Environmental Medicine, 60(Suppl 1), 116-120.
Britton, N. (1990). The permanent volunteer emergency worker: exploring relevant
factors in stress coping: information on volunteerism and the use of volunteer
labour in the disaster context with a view to understanding the variables
thought to influence stress. Sydney: Cumberland College of Health Sciences.
Disaster Management Studies Centre.
Brown, H., & Edelman, R. (2000). Project 2000: a study of expected and experienced
stressors and support reported by students and qualified nurses. Journal of
Advanced Nursing, 31(4), 857-864.
Browning, L., Rolniak, S., Greenberg, M., & Larkin, G. (2001). Cross-sectional
survey of burnout in emergency and nonemergency nurses in Research paper
and poster summaries from the ENA 2001 annual meeting. In Barnason, S.
(Ed.), Journal of Emergency Nursing (Vol. 27, pp. 5-6).
Brunero, S., Cowan, D., & Fairbrother, G. (2008). Reducing emotional distress in
nurses using cognitive behavioural therapy: A preliminary programme
evaluation. Japan Journal of Nursing Science, 5, 69-75.
Brunero, S., Cowan, D., Grochulski, A., & Garvey, A. (2006). Stress Management for
Nurses. Sydney: NSW Nurses Association, NSW Health.
Buchan, J. (1994). Nursing shortages and human resources planning. International
Journal of Nursing Studies, 31(5), 460-470.
Buchan, J. (1995). Counting the cost of stress in nursing. Nursing Standard, 9(16), 30-
31.
Burnard, P. (1991). Coping with Stress in the Health Professions A practical guide.
London: Chapman & Hall.
Buus-Frank, M. E. (2002). If you didn't care, it wouldn't hurt. Advances in Neonatal
Care, 2(2), 67-69.
Carson, J., Bartlett, H., & Croucher, P. (1991). Stress in community psychiatric
nursing: a preliminary investigation. Community Psychiatric Nursing, 11(2),
8-12.
Carson, J., Bartlett, H., Leary, J., Gallagher, T., & Senapati-Sharma, M. (1993). Stress
and the community psychiatric nurse. Nursing Times, 89(3), 38-40.
Carstairs, J., & Trenoska, V. (2002). The stress of being a nurse: abuse from patients
and doctors new study shows. Available online at
http://www.pr.mq.edu.au/events/index.asp?ItemID=747 Retrieved 3rd
February, 2003.
Carver, C. S., & Scheier, M. F. (1981). Attention and self-regulation: a control-theory
approach to human behaviour. New York: Springer-Verlag.
Catalyst (video recording) 6 September 2007, ABC Television.
Cattell, R. B. (1966). The scree test for the number of factors. Multivariate
Behavioural Research, 1, 245-276.
Cattell, R. B. & Dreger, R. M. (1977). Handbook of Modern Personality Theory.
Washington: Hemisphere Publishing Corporation.
Chang, E. M., Hancock, K. M., Johnson, A., Daly, J., & Jackson, D. (2005). Role
stress in nurses: Review of related factors and strategies for moving forward.
Nursing and Health Sciences, 7, 57-65.

272
Chi, J. (1982). How pharmacists cope with stress. Drug Topics, 126(5), 26-30.
Chopra, S. S., Sotile, M., & Sotile, M. O. (2004). Physician Burnout. Journal of
American Medical Association, 291(5), 633.
Chrisopoulos, S., & Waters, B. (2003). Nursing labour force 2002 (No. 29). Canberra:
Australian Institute of Health and Welfare.
Clegg, A. (2001). Occupational stress in nursing: a review of the literature. Journal of
Nursing Management, 9(2), 101-106.
Clinton, M., & Hazelton, M. (2000). Scoping the Australian mental health workforce.
Australian and New Zealand Journal of Mental Health Nursing, 9, 83-85.
Clinton, M., Moyle, W., Weir, D., & Edwards, H. (1995). Perceptions of stressors and
reported coping strategies in nurses caring for residents with Alzheimer's
disease in a dementia unit. Australian and New Zealand Journal of Mental
Health Nursing, 4, 5-13.
Coffey, M. (2000). Stress and coping in forensic community mental health nurses:
Demographic information and qulaitative findings. NT research, 5(2), 100-
114.
Cohen, J. (1992). A power primer. Psychological Bulletin, 112(1), 155-159.
Cohen, S., Kessler, R. C., & Gordon, L. U. (1997). Measuring stress. Oxford: Oxford
University Press.
Cohen-Katz, J., Wiley, S. D., Capuano, T., Baker, D. M., & Shapiro, S. (2005). The
effects of mindfulness-based stress reduction on nurse stress and burnout, part
ii A quantitative and qualitative study. Holistic Nursing Practice, 19(1), 26-35.
Comcare. (1997). The management of occupational stress in Commonwealth
agencies.Unpublished manuscript, Canberra.
Cooper, C. L. (1982). High pressure: working lives of women managers. London:
Fontana.
Cooper, C. L. & Robertson, I. T. (1995). International Review of Industrial and
Organizational Psychology. Chichester: John Wiley & Sons.
Cooper, C. L., Sloan, S. J., & Williams, S. (1988). Occupational Stress Indicator.
Windsor: NFER- Nelson.
Cooper, H., & Hazelrigg, P. (1988). Personality moderators of interpersonal
expectancy effects: an integrative research review. Journal of Personality and
Social Psychology, 55(6), 937-949.
Cordes, C. L., & Dougherty, T. W. (1993). A review and an integration of research on
job burnout. The Academy of Management Review, 18(4), 621-656.
Cosentino, B. W. (2000). When helping hurts: vicarious traumatization. Available
online at
http://community.nursingspectrum.com/MagazineArticles/article.cfm?AID=65
0 Retrieved 9th April, 2007.
Cottrell, S. (2001). Occupational stress and job satisfaction in mental health nursing:
focused interventions through evidence-based assessment. Journal of
Psychiatric and Mental Health Nursing, 8, 157-164.
Cotts, C. (2003). 'Post' traumatic stress disorder. The Village Voice, 48(7), 34-35.
Cousins, C. (2003). Vicarious trauma. Paper presented at the Vicarious trauma
seminar, Gosford, NSW.
Cox, T. (1988). Stress. London: Macmillan Education.
Crabbe, J. M., Bowley, D. M. G., Boffard, K. D., Alexander, D. A., & Klein, S.
(2004). Are health professionals getting caught in the crossfire? The personal

273
implications of caring for trauma victims. Emergency Medicine Journal, 21,
568-572.
Curtis, P., Ball, L., & Kirkham, M. (2006a). Ceasing to practise midwifery: Working
life and employment choices. British Journal of Midwifery, 14(6), 336-338.
Curtis, P., Ball, L., & Kirkham, M. (2006b). Flexible working patterns: Balancing
service needs or fuelling discontent? British Journal of Midwifery, 14(5), 260-
264.
Davidson, M. J. (1983). Stress and the woman manager. Oxford: Robertson.
De Jonge, J., Dollard, M. F., Dormann, C., Le Blanc, P. M., & Houtman, I. L. D.
(2000). The Demand-Control Model: Specific Demands, Specific Control, and
Well-Defined Groups. International Journal of Stress Management, 7(4), 269-
287.
De Lange, A. H., Taris, T. W., Kompier, M. A. J., Houtman, I. L. D., & Bongers, P.
M. (2004). The relationships between work characteristics and mental health:
examining normal, reversed and reciprocal relationships in a 4-wave study.
Work & Stress, 18(2), 149-166.
Deary, I. J., Watson, R., & Hogston, R. (2003). A longitudinal cohort study of burnout
and attrition in nursing students. Journal of Advanced Nursing, 43(1), 71-81.
Deci, E. L., & Ryan, R. M. (1987). The support of autonomy and the control of
behaviour. Journal of Personality and Social Psychology, 53(6), 1024-1037.
Deery, R. (2005). An action-research study exploring midwives' support needs and the
affect of group clinical supervision. Midwifery, 21, 161-176.
Delvaux, N., Razavi, D., & Farvacques, C. (1988). Cancer care - a stress for health
professionals. Social Science and Medicine, 27(2), 159-166.
Dembroski, T. M., & MacDougall, J. M. (1978). Stress effects on affiliation
preferences among subjects possessing the type A coronary-prone behaviour
pattern. Journal of Personnel and Social Psychology, 36(1), 23-33.
Dempsey, P. A., & Dempsey, A. D. (1992). Nursing research with basic statistical
applications. Boston: Jones & Bartlett Publishers.
Dimond, B. (2004). Stress caused to nurses following the death of patients:
employer's duty. British Journal of Nursing, 13(13), 802-805.
Doiron, D., Hall, J., & Jones, G. (2008). Is there a crisis in nursing in New South
Wales? Available online at
http://www.pubmedcentral.nih.gov/articlerender.fcgi?artid=2546412 Retrieved
4th December, 2008.
Dorz, S., Novara, C., Sica, C., & Sanavio, E. (2003). Predicting burnout among HIV /
AIDS and oncology health care workers. Psychology and Health, 18(5), 677-
684.
Duke, D. L. (1984). Teaching- the imperiled profession (Vol. 174). Albany: State
University of New York Press.
Duke, M. P. (1986). Personality science: a proposal. Journal of Personality and Social
Psychology, 50(2).
Dumas, T. C. (2001). Stress and disease. Who gets sick and who stays well. Paper
presented at the Stress and disease Professional Education Seminar, Sydney,
NSW.
Dunnette, M. D. & Hough, L. M. (2002). Handbook of Industrial and Organizational
Psychology. Mumbai: Jaico Publishing House.
Dunning, T., & Martin, M. (1996). Developing a questionnaire: some methodological
issues. Australian Journal of Advanced Nursing, 14(2), 31-38.

274
Eaton, L. (1994). Executive stress. Nursing Times, 90(6).
Edwards, D., & Burnard, P. (2003). A systematic review of stress and stress
management interventions for mental health nurses. Journal of Advanced
Nursing, 42(2), 169-200.
Edwards, D., Burnard, P., Hannigan, B., Cooper, L., Adams, J., Juggessur, T.,
Fothergill, A. & Coyle, D. (2006). Clinical supervision and burnout: the
influence of clinical supervision for community mental health nurses. Journal
of Clinical Nursing, 15, 1007-1015.
Ekstedt, M., & Fagerberg, I. (2005). Lived experiences of the time preceding burnout.
Journal of Advanced Nursing, 49(1), 59-67.
Engelbrecht, S. (2006). Motivation and Burnout in Human Service Work The Case of
Midwifery in Denmark. Roskilde University, Copenhagen.
Ewers, P., Bradshaw, T., McGovern, J., & Ewers, B. (2002). Does training in
psychosocial interventions reduce burnout rates in forensic nurses? Journal of
Advanced Nursing, 37(5), 470-476.
Fagin, L., Brown, D., Bartlett, H., Leary, J., & Carson, J. (1995). The Claybury
community psychiatric nurse stress study: is it more stressful to work in
hospital or the community? Journal of Advanced Nursing, 22, 347-358.
Feshbach, S., & Weiner, B. (1991). Personality (third ed.). Lexington, Masachusetts:
D. C. Heath and Company.
Field, A. (2005). Discovering Statistics using SPPS (2nd ed.). London: SAGE
Publications.
Fineman, S. (1985). Social work stress and intervention. Brookfield: Gower.
Fitzpatrick, J., While, A. E., & Roberts, J. D. (1999). Shift work and its impact upon
nurse performance: current knowledge and research issues. Journal of
Advanced Nursing, 29(1), 18-27.
Flowers, L. (2004). "Hardy nurses" less likely to burn out. OR Manager, 20(9), 22-23.
Forman, H., & Davis, G. A. (2002). The rising tide of healthcare labour unions in
nursing. Journal of Nursing Administration, 32(7/8), 376-378.
Friedman, M., & Rosenman, R. (1974). Type A Behaviour and Your Heart. New
York: Knopf.
Furnham, A. (1992). Personality at work: The role of individual differences in the
workplace. London: Routledge.
Furnham, A. (2001). Personality and individual differences in the workplace. In B. W.
Roberts & R. Hogan (Eds.), Personality psychology in the workplace (pp. 223-
251). Washington, DC: American Psychological Association.
Gaithersburg, & Roach, B. L. (1994). Burnout and the nursing profession. The Health
Care Supervisor, 12(4), 41-47.
Ganster, D. C. (1989). Work control and well-being: A review of research in the
workplace. In Sauter, S. L., Hurrell Jr, J. J. & Cooper, C. L. (Eds.), Job
Control and worker health. (pp. 3-23). Chichester: Wiley.
Garrett, D., & McDaniel, A. (2001). A new look at nurse burnout: the effects of
environmental uncertainty and social climate. Journal of Nursing
Administration, 31(2), 91-96.
Gillespie, M., & Melby, V. (2003). Burnout among nursing staff in accident and
emergency and acute medicine: a comparative study. Journal of Clinical
Nursing, 12, 842-851.
Gilpin, M. M. (2004). Our generation: coping with stress. Contemporary OB/GYN, 1-
3.

275
Gold, D. R., Rogacz, S., Bock, N., Tosteson, T. D., Baum, T., Speizer, F. E. &
Czeisler, C. A. (1992). Rotating shift work, sleep, and accidents related to
sleepiness in hospital nurses. American Journal of Public Health, 82(7), 1011-
1014.
Goldberg, D. (1978). Manual of the General Health Questionnaire. Windsor: NFER-
Wilson.
Gonsalves, A. (2003, Mar 17s). CIOs feel stress from tighter budgets. TechWeb News
Information Week, 1.
Goodfellow, A., Varnam, R., Rees, D., & Shelly, M. P. (1997). Staff stress on the
intensive care unit: a comparison of doctors and nurses. Anaesthesia, 52(11),
1037-1041.
Goodin, H. J. (2003). The nursing shortage in the United States of America: an
integrative review of the literature. Journal of Advanced Nursing, 43(4), 335-
350.
Gray-Toft, P., & Anderson, J. (1981). Stress amongst hospital nursing staff: its causes
and effects. Social Science and Medicine, 15, 639-647.
Greenglass, E. R., & Burke, R. J. (2001). Stress and the effects of hospital
restructuring in nurses. Canadian Journal of Nursing Research, 33(2), 93-108.
Greenwood, K. M., Rich, W. J., & James, J. E. (1995). Sleep hygiene practices and
sleep duration in rotating-shift shiftworkers. Work & Stress, 9(2/3), 262-271.
Griffin, R. W., & Bateman, T. S. (1986). Job satisfaction and organizational
commitment. In C. L. R. Cooper, I. T. (Ed.), International review of industrial
and organizational psychology (pp. 317-328). Chichester: Wiley.
Griva, K., & Joekes, K. (2003). UK teachers under stress: can we predict wellness on
the basis of characteristics of the teaching job? Psychology and Health, 18(4),
457-471.
Gunlicks, M. L., & Weissman, M. M. (2008). Change in Child Psychopathology With
Improvement in Parental Depression: A Systematic Review. Journal of the
American Academy of Child and Adolescent Psychiatry, 47(4), 380-390.
Hall, L. (2001). Burnout: results of an empirical study of New Zealand nurses.
Contemporary Nurse, 11, 71-80.
Hancock, C. (1998). Hancock in call to combat stress. Nursing Standard, 12(22), 8.
Hanson, P. (1989). Stress for success. London: Pan Books.
Happell, B., Martin, T., & Pinikahana, J. (2003). Burnout and job satisfaction: A
comparative study of psychiatric nurses from forensic and a mainstream
mental health service. International Journal of Mental Health Nursing, 12, 39-
47.
Hargrove, E. C. & Glidewell, J. C. (1990). Impossible Jobs in Public Management.
Kansas: Kansas University Press.
Harris, N. (2001). Management of work-related stress in nursing. Nursing Standard,
16(10), 47-55.
Hart, P. M. (1999). Predicting employee life satisfaction: a coherent model of
personality, work and nonwork experiences, and domain satisfactions. Journal
of Applied Psychology, 84(4), 564-584.
Harulow, S. (2000). Are you losing sleep over shift work? Australian Nursing
Journal, 11, 26-28.
Hattrup, K., & Jackson, S. E. (1996). Learning about individual differences by taking
situations seriously. In Murphy, K. R. (Ed.), Individual Differences and

276
Behaviour in Organizations (pp. 507-547). San Francisco: Jossey-Bass
Publishers.
Healy, C. M., & McKay, M. F. (2000). Nursing stress: the effects of coping strategies
and job satisfaction in a sample of Australian nurses. Journal of Advanced
Nursing, 31(3), 681-688.
Heine, H. (2006). The model of effort-reward imbalance. Available online at
www.uni-duesseldorf.de/MedicalSociology/eri.theorie.htm Retrieved 7th
March, 2006.
Hensher, D. A. (1947). Safety and productivity in the long distance trucking industry.
Sydney: Institute of Transport Studies, University of Sydney.
Hillhouse, J. J., & Adler, C. M. (1997). Investigating stress effect patterns in hospital
staff nurses: results of a cluster analysis. Social Science and Medicine, 45,
1781-1788.
Hingley, P., & Cooper, C. L. (1986). Stress and the Nurse Manager. Chichester: John
Wiley & Sons.
Hoffman, A. J., & Scott, L. D. (2003). Role stress and career satisfaction among
registered nurses by work shift patterns. Journal of Nursing Administration,
33(6), 337-342.
Hope, A., Kelleher, C., & O'Connor, M. (1998). Lifestyle practices and the health
promoting environment of hospital nurses. Journal of Advanced Nursing,
28(2), 438-447.
Howard, G. (2001). Stop picking on me. Occupational Health, 53(7), 12-15.
Huibers, M. J. H., Beurskens, A. J. H. M., Prins, J. B., Kant, I. J., Bazelmans, E., Van
Schayck, C. P., Knottnerus, J. A. & Bleijenberg, G. (2003). Fatigue, burnout,
and chronic fatigue syndrome among employees on sick leave: do attributions
make the difference? Occupational and Environmental Medicine, 60(Suppl 1),
i26 - i31.
Hummelvoll, J. K., & Severinsson, E. (2001). Coping with everyday reality: mental
health professionals' reflections on the care provided in an acute psychiatric
ward. Australian and New Zealand Journal of Mental Health Nursing, 10,
156-166.
Humpel, N., & Caputi, P. (2001). Exploring the relationship between work stress,
years of experience and emotional competency using a sample of Australian
mental health nurses. Journal of Psychiatric and Mental Health Nursing, 8,
399-403.
Hundley, V., & van Teijlingen, E. (2002). The role of pilot studies in midwifery
research. Midwives, 5(11), 372-374.
Hurrell Jr, J. J., Murphy, L. R., Sauter, S. L., & Cooper, C. L. (1988). Occupational
stress: issues and developments in research. London: Taylor & Francis.
Hurrell Jr, J. J., Nelson, D. L., & Simmons, B. L. (1998). Measuring Job Stressors and
Strains: Where We Have Been, Where We Are, and Where We Need to Go.
Journal of Occupational Health Psychology, 3(4), 368-369.
Hutcheson, G. & Sofroniou, N. (1999). The multivariate social scientist. London:
Sage.
Iskra-Golec, I., Folkard, S., Marek, T., & Noworol, C. (1996). Health, well-being and
burnout of ICU nurses on 12- and 8-h shifts. Work & Stress, 10(3), 251-256.
Iskra-Golec, I., Marek, T., & Noworol, C. (1995). Interactive effect of individual
factors on nurses' health and sleep. Work & Stress, 9(2/3), 256-261.

277
Jamal, M., & Baba, V. (2000). Job stress and burnout among Canadian managers and
nurses: an empirical examination. Canadian Journal of Public Health, 91(6),
454-457.
Jansen, P. M., Kerkstra, A. K., Abu-Saad, H. H., & Zee, J. V. D. (1996). The effects
of job characteristics and individual characteristics on job satisfaction and
burnout in community nursing. International Journal of Nursing Studies, 33,
407-421.
Janssen, P. P. M., De Jonge, J., & Bakker, A. B. (1999). Specific determinants of
intrinsic work motivation, burnout and turnover intentions: a study among
nurses. Journal of Advanced Nursing, 29(6), 1360-1369.
Jenkins, L. (1996). Community burn-out. Journal of Community Nursing, 10(5), 4-10.
Jenkins, R., & Elliott, P. (2004). Stressors, burnout and social support: nurses in acute
mental health settings. Journal of Advanced Nursing, 48(6), 622-631.
Jezuit, D. L. (2002). The manager's role during nurse suffering: creating an
environment of support and compassion. Journal of Health Law and Ethics
Regulations, 4(2), 26-29.
Jones, J. G., Janmah, K., Payne, R. L., & Rick, J. T. (1987). Some determinants of
stress in psychiatric nurses. International Journal of Nursing Studies, 24, 129-
144.
Jones, M. C., & Johnston, D. W. (2000). Reducing distress in first level and student
nurses: a review of the applied stress management literature. Journal of
Advanced Nursing, 32(1), 66-74.
Jonsson, A., & Segesten, K. (2004). Guilt, shame and need for a container: a study of
post-traumatic stress among ambulance personnel. Accident and Emergency
Nursing, 12, 215-223.
Josten, E. J. C., Ng-A-Tham, J. E. E., & Thierry, H. (2003). The effects of extended
workdays on fatigue, health, performance and satisfaction in nursing. Journal
of Advanced Nursing, 44(6), 643-652.
Kalimo, R., Pahkin, K., Mutanen, P., & Toppinen-Tanner, S. (2003). Staying well or
burning out at work: work characteristics and personal resources as long-term
predictors. Work & Stress, 17(2), 109-122.
Kanfer, R. (2002). Motivation theory and industrial and organizational psychology. In
Dunnette, M. D. & Hough, L. M. (Eds.), Handbook of Industrial and
Organizational Psychology (pp. 75-170). Mumbai: Jaico Publishing House.
Kant, I. J., Bultmann, U., Schroer, K. A. P., Beurskens, A. J. H. M., & Van
Amelsvoort, L. G. P. M. (2003). An epidemiological approach to study fatigue
in the working population: the Maastricht Cohort Study. Occupational and
Environmental Medicine, 60(Suppl 1), 132-139.
Karasek, R. A. (1979). Job demands, job decision latitude and mental strain:
implications for job redesign. Administrative Science Quarterly, 24, 284-306.
Karasek, R. A., & Theorell, T. (1990). Healthy Work. New York: Basic Books.
Kawachi, I., Colditz, G. A., Stampfer, M. J., Willett, W. C., Manson, J. E., Speizer, F.
E. & Hennekens, C. H. (1995). Prospective study of shift work and risk of
coronary heart disease in women. Circulation, 92(11), 3178-3182.
Keil, R. M. K. (2004). Coping and stress: a conceptual analysis. Journal of Advanced
Nursing, 45(6), 659-665.
Kent, P., & Lavery, J. (2007). Burnout in nursing. Australian Journal of Advanced
Nursing, 24(3), 43-48.

278
Kline, P. (1999). The handbook of psychological testing (2nd ed.). London:
Routledge.
Kluger, M. T., Laidlaw, T. M., Kruger, N., & Harrison, M. J. (1999). Personality traits
of anaesthetists and physicians: an evaluation using the Cloninger
Temperament and Character Inventory (TCI-125). Anaesthesia, 54, 926-935.
Kobasa, S. C. (1979). Stressful life events, personality, and health: An inquiry into
hardiness. Journal of Personality and Social Psychology, 37, 1-11.
Koivula, M., Paunonen, M., & Laippala, P. (2000). Burnout among nursing staff in
two Finnish hospitals. Journal of Nursing Management, 8, 149-158.
Kotzabassaki, S., & Parissopoulos, S. (2003). Burnout in renal care professionals.
EDTNA/ERCA Journal, 29(4), 209-212.
Krausz, M., & Koslowsky, M. (1995). Impact of shift work and department type upon
strain and attitudinal measures of hospital nurses. Work & Stress, 9(1), 88-94.
Kundi, M., Koller, M., Stefan, H., Lehner, L., Kaindlsdorfer, S., & Rottenbucher, S.
(1995). Attitudes of nurses towards 8-h and 12-h shift systems. Work & Stress,
9(2/3), 134-139.
Kushnir, T., Cohen, A. H., & Kitai, E. (2000). Continuing medical education and
primary physicians' job stress, burnout and dissatisfaction. Medical Education,
34(6), 430-436.
Kushnir, T., Rabin, S., & Azulai, S. (1997). A descriptive study of stress management
in a group of paediatric oncology nurses. Cancer Nursing, 20(6), 414-421.
Lambert, V. A., & Lambert, C. E. (2001). Literature review of role stress/strain on
nurses: an international perspective. Nursing Health Science, 3(3), 161-172.
Lambert, V. A., Lambert, C. E., & Yamase, H. (2003). Psychological hardiness,
workplace stress and related stress reduction strategies. Nursing and Health
Sciences, 5, 181-184.
Lang, T. A., & Secic, M. (1997). How to Report Statistics in Medicine Annotated
Guidelines for Authors, editors and Reviewers. Philadelphia: American
College of Physicians.
Laschinger, H. K. S., & Finegan, J. (2005). Empowering nurses for work engagement
and health in hospital settings. Journal of Nursing Administration, 35(10),
439-449.
Laschinger, H. K. S., Purdy, N., Cho, J., & Almost, J. (2006). Antecedents and
consequences of nurse managers' perceptions of organizational support.
Nursing Economics, 24(1), 20-29.
Laschinger, S., Heather, K., Finegan, J., Shamian, J., & Almost, J. (2001a). Testing
Karasek's demands-control model in restructured healthcare settings: effects of
job strain on staff nurses' quality of work life. Journal of Nursing
Administration, 31(5), 233-243.
Laschinger, S., Heather, K., Finegan, J., Shamian, J., & Wilk, P. (2001b). Impact of
structural and psychological empowerment on job strain in nursing work
settings: expanding Kanter's model. Journal of Nursing Administration, 31(5),
260-272.
Lavoie-Tremblay, M., Bourbonnais, R., Viens, C., Vezina, M., Durand, P. J., &
Rochette, L. (2005). Improving the psychosocial work environment. Journal
of Advanced Nursing, 49(6), 655-664.
Lawrence, K. S. (1990). Coping with impossible jobs. In Hargrove, E. C. &
Glidewell, J. C. (Eds.), Impossible jobs in public management. Kansas:
University Press of Kansas.
279
Lazarus, R. S. (1966). Psychological Stress and the Coping Process. New York:
McGraw-Hill.
Lazarus, R. S., & Folkman, S. (1984). Stress, Appraisal, and Coping. New York:
Springer.
Lee, H., Song, R., Suk Cho, Y., Za Lee, G., & Daly, B. (2003). A comprehensive
model for predicting burnout in Korean nurses. Journal of Advanced Nursing,
44(5), 534-545.
Lee, M. R., So, H. Y., Alan, E. K., & Kim, T. S. (1998). Hardiness: determinants of
psychological distress from stress. Journal of Korean Academy of Nursing, 28,
583-590.
Levin, P., Hewitt, B. J., & Misner, T. S. (1998). Insights of nurses about assault in
hospital-based emergency departments. Image- the Journal of Nursing
Scholarship, 30(3, Quarter Third), 249-254.
Lindner, J. R. (1998). Understanding employee motivation. Retrieved 7th March,
2006.
LoBiondo-Wood, G. & Haber, J. (1994). Nursing Research Methods, Critical
Appraisal, and Utilization. St Louis: Mosby.
Lushington, W., Lushington, K., & Dawson, D. (1997). The perceived social and
domestic consequences of shiftwork for female shiftworkers (nurses) and their
partners. Journal of occupational health and safety, Australia and New
Zealand, 13(5), 461-469.
Lyckholm, L. (2001). Dealing with stress, burnout, and grief in the practice of
oncology. The Lancet, 2, 750-755.
Mackin, P., & Sinclair, M. (1998). Labour ward midwives' perceptions of stress.
Journal of Advanced Nursing, 27(5), 986-991.
MacLellan, M. (1990). Cooling burnout. Journal of District Nursing, 8(10), 12,14.
Maeve, M. K. (1998). Weaving a fabric of moral meaning: how nurses live with
suffering and death. Journal of Advanced Nursing, 27, 1136-1142.
Makinen, A., Kivimaki, M., Elovainio, M., & Virtanen, M. (2003). Organization of
nursing care and stressful work characteristics. Journal of Advanced Nursing,
43(2), 197-205.
Mandy, A., & Rouse, S. (1997). Burnout and work stress in junior physiotherapists.
British Journal Of Therapy And Rehabilitation, 4(11), 597-603.
Mandy, P., & Mandy, A. (2000). Professional stress A study to compare work stress
and burnout in two similar professional groups - podiatrists and dentists.
Occupational Health, 52(12), 25-28.
Mansfield, P. K., Yu, L. C., McCool, W., Vicary, J. R., & Packard, J. S. (1989). The
job context index: a guide for improving the 'fit' between nurses and their
work environment. Journal of Advanced Nursing, 14, 501-508.
Marshall, J. (1980). Stress amongst nurses. In C. L. Cooper & J. Marshall (Eds.),
White Collar and Professional Stress (pp. 189-209). Chichester: John Wiley.
Maslach, C. (1986). Burnout - the cost of caring. New York: Prentice Hall Press.
Maslach, C., & Jackson, S. E. (1981). The measurement of experienced burnout. In C.
L. Cooper (Ed.), The International Library of Clinical Writings in Psychology
1 Industrial and Organizational Psychology (Vol. 2). New York: New York
University.
Maslach, C., & Leiter, M. P. (1997). The truth about burnout. San Francisco: Jossey-
Bass Publishers.

280
Maslach, C., Schaufeli, W., & Leiter, M. P. (2001). Job burnout. Annual Review of
Psychology, 52, 397-422.
Mauno, S., Kinnunen, U., & Pyykko, M. (2005). Does work-family conflict mediate
the relationship between work-family culture and self-reported distress?
Evidence from five Finnish organizations. Journal of Occupational and
Organizational Psychology, 78, 509-530.
McGowan, B. (2001). Self-reported stress and its effects on nurses. Nursing Standard,
15(42), 33-38.
McGrath, A., Reid, N., & Boore, J. (2003). Occupational stress in nursing.
International Journal of Nursing Studies, 40, 555-565.
McIntyre, P. (2004). Burnout sends generation to exits. The Sydney Morning Herald,
p. 17.
McKenna, B. G., Smith, N. A., Poole, S. J., & Coverdale, J. H. (2003). Horizontal
violence: experiences of Registered Nurses in their first year of practice.
Journal of Advanced Nursing, 42(1), 90-96.
McVicar, A. (2003). Workplace stress in nursing: a literature review. Journal of
Advanced Nursing, 44(6), 633-642.
Meltzer, L. S. & Huckabay, L. M. (2004). Critical care nurses' perceptions of futile
care and its effect on burnout. American Journal of Critical Care, 13(3), 202-
208.
Merson, J. (2001). Stress the causes, the costs and the cures. Sydney: ABC Books.
Milne, D., & Watkins, F. (1986). An evaluation of the effects of shift rotation on
nurses' stress, coping and strain. International Journal of Nursing Studies,
23(2), 139-146.
Morgan, D. G., Semchuk, K. M., Stewart, N. J., & D'Arcy, C. (2002). Job strain
among staff of rural nursing homes: a comparison of nurses, aides, and activity
workers. Journal of Nursing Administration, 32(3), 152-161.
Morrow, P. C., McElroy, J. C., & Elliott, S. M. (1994). The effect of preference for
work status, schedule, and shift on work-related attitudes. Journal of
Vocational Behaviour, 45, 202-222.
Moskowitz, D. S., & Cote, S. (1995). Do interpersonal traits predict affect? A
comparison of three models. Journal of Personality and Social Psychology,
69(5), 915-924.
Motowildo, J. S., Packard, J. S., & Manning, R. M. (1986). Occupational stress: its
causes and consequences for job performance. Journal of Applied Psychology,
71(4), 618-629.
Motowildo, S. J. (1996). Orientation toward the job and organization. In Murphy, K.
R. (Ed.), Individual Differences and Behaviour in Organizations (pp. 175-
208). San Francisco: Jossey-Bass Publishers.
Murphy, K. R. (1996). Individual Differences and Behaviour in Organizations. San
Francisco: Jossey-Bass Publishers.
Muscroft, J., & Hicks, C. (1998). A comparison of psychiatric nurses' and general
nurses' reported stress and counseling needs: a case study approach. Journal of
Advanced Nursing, 27(6), 1317-1325.
Myers, R. (1990). Classical and modern regression with applications. (2nd
ed.).
Boston: MA: Duxbury.
Ng, V., Koh, D., Chan, G., Ong, H. Y., Chia, S. E., & Ong, C. N. (1999). Are salivary
Immunoglobulin A and lysozyme biomarkers of stress among nurses? Journal
of Occupational and Environmental Medicine, 41(10), 920-927.

281
Nielson, S. F. (2001). Non-parametric conditional mean imputation. Journal of
Statistical Planning and Inference, 99(2), 129-150.
Nolan, P. (1995). A measurement tool for assessing stress among mental health
nurses. Nursing Standard, 9(46), 36-39.
Norbeck, J. S. (1985). What constitutes a publishable report of instrument
development? Nursing Research, 34(6), 380-381.
NSW Health Department, Ministerial Standing Committee, (2002-2003). Nursing
practice and process development survey, Sydney.
NSW Nurses Association, (2007a, July). Workloads breakthrough. The Lamp, 64, 14.
NSW Nurses Association, (2007b, September). Workloads to ease at Coffs ED. The
Lamp, 64, 25.
NSW Nurses Association, (2007c, May). Workload, safety win at Morisset. The
Lamp, 64, 14-15.
NSW Nurses Association, (2007d, July). Staffing win for RPA maternity unit. The
Lamp, 64, 12-13.
NSW Nurses Association & NSW Health, (2008a). Summary of the Principles to
Manage Nursing Workload in Emergency Departments, Sydney.
NSW Nurses Association & NSW Health, (2008b). Summary of the Principles to
Manage Nursing Workload in Inpatient Mental Health Units, Sydney.
NSW Nurses Association, (2008c, February). NUMS at breaking point. The Lamp, 65,
22.
NSW Nurses Association, (2008d, February). Overworked and overwhelmed. The
Lamp, 65, 24.
NSW Nurses Association, (2008e, February). Support staff cuts hit frontline nurses.
The Lamp, 65, 25.
NSW Nurses Association, (2008f, April). Studies show shiftwork is harmful. The
Lamp, 65, 17.
NSW Nurses Association, (2008g, April). Nurses deserve fair rates for night shift. The
Lamp, 65, 14-15.
NSW Nurses Association, (2008h, April). Without support young nurses won't stay.
The Lamp, 65, 18-20.
NSW Nurses Association, (2008i, May). Exhausted nurses' goodwill is evaporating.
The Lamp, 65, 21.
NSW Nurses Association, (2008j, February). Propping up a system in crisis. The
Lamp, 65, 16.
NSW Nurses Association, (2008k, May). Save our system. The Lamp, 65, 20.
NSW Nurses Association, (2008l, May). Nurses hold system together. The Lamp, 65,
25.
O'Connor, J., & Jeavons, S. (2002). Perceived effectiveness of critical incident stress
debriefing by Australian nurses. Australian Journal of Advanced Nursing,
20(4), 22-29.
O'Donnell, C., & Stephens, C. (2001). The impact of organisational, social,
environmental and job content stressors on the work related strains of
probation officers. The Australian and New Zealand Journal of Criminology,
34(2), 193-203.
O'Donnell, E. (1996). Occupational health: stressing the point. Nursing Standard,
10(16), 22-23.

282
Olofsson, B., Bengtsson, C., & Brink, E. (2003). Absence of response: a study of
nurses' experience of stress in the workplace. Journal of Nursing Management,
11, 351-358.
Omdahl, B. L., & O'Donnell, C. (1999). Emotional contagion, empathic concern and
communicative responsiveness as variables affecting nurses' stress and
occupational commitment. Journal of Advanced Nursing, 29, 1351-1359.
Ootim, B. (2001). Stress detector. Nurse Manager, 7(8), 22-25.
Paine, W. S. (1982). Job stress and burnout. Research, theory, and intervention
perspectives. Beverly Hills: Sage Publications.
Pallant, J. (2005). SPSS survival manual. A step by step guide to data analysis using
SPSS (2nd ed.). Sydney: Allen & Unwin.
Paton, N. (2003, May 5). High cost of pressure; executives may be physically
healthier, but mentally they pay the price for company demands. Sunday
Business, pp. 1-2.
Payne, N. (2001). Occupational stressors and coping as determinants of burnout in
female hospice nurses. Journal of Advanced Nursing, 33(3), 396-405.
Peiro, J. M., Gonzalez-Roma, V., Tordera, N., & Manas, M. A. (2001). Does role
stress predict burnout over time among health care professionals? Psychology
and Health, 16, 511-525.
Pelly, M. (2004, June, 21). Surge in claims for workplace stress. Sydney Morning
Herald.
Penson, R. T., Dignan, F. L., Canellos, G. P., Picard, C. L., & Lynch, J., T. J. (2000).
Burnout: caring for the caregivers. The Oncologist, 5, 425-434.
Pervin, L. A. (1975). Personality: Theory, Assessment, and Research (2nd ed.).
Toronto: John Wiley & Sons, Inc.
Pervin, L. A. (1978). Current controversies and issues in personality. Toronto: John
Wiley and Sons.
Pervin, L. A. (1996). The science of personality. Toronto: John Wiley & Sons, Inc.
Phillips, S. (1995). The stress of nursing: meeting the challenge. AORN Journal,
62(4), 664-665.
Pinikahana, J., & Happell, B. (2004). Stress, burnout and job satisfaction in rural
psychiatric nurses: a Victorian study. Australian Journal of Rural Health, 12,
120-125.
Polgar, S., & Thomas, S. (1997). Introduction to research in the health services.
Melbourne: Churchill Livingstone.
Polit, D. F., & Hungler, B. P. (1997). Essentials of Nursing Research (4th ed.).
Philadelphia: Lippincott.
Polit, D. F., & Hungler, B. P. (1999). Nursing Research Principles and Methods (6th
ed.). Philadelphia: Lippincott.
Prag, P. W. (2003). Stress, burnout, and social support: a review and call for research.
Air Medical Journal, 22(5), 18-22.
Quick, J. C., Dalton, J. E., Nelson, D. L., & Jonathon, D. (1985). Health
administration can be stressful ... but not necessarily distressful. Hospital &
Health Services Administration, 30(5), 101.
Rada, R. E., & Johnson-Leong, C. (2004). Stress, burnout, anxiety and depression
among dentists. Journal of the American Dental Association, 135(6), 788-794.
Rahe, R. H., & Tolles, R. L. (2002). The Brief Stress and Coping Inventory. A useful
stress management instrument. International Journal of Stress Management,
9(2), 61-70.

283
Randolph, G. L., Price, J. L., & Collins, J. R. (1986). The effects of burnout
prevention training on burnout symptoms in nurses. The Journal of Continuing
Education in Nursing, 17(2), 43-49.
Rattray, J., & Jones, M. C. (2007). Essential elements of questionnaire design and
development. Journal of Clinical Nursing, 16, 234-243.
Rhead, M. (1995). Stress among student nurses: is it practical or academic? Journal of
Clinical Nursing, 4(6), 369-376.
Roberts, B. W., & Hogan, R. (2001). Personality Psychology in the Workplace.
Washington, DC: American Psychological Association.
Roberts, K., & Taylor, B. (1998). Nursing Research Processes: an Australian
perspective. Melbourne: Nelson.
Rosser, R. (1995). Stress, personality disorder and post-traumatic stress disorder.
Current Opinions of Psychiatry, 8(2), 98-101.
Rotter, J. (1982). The Development and Application of Social Learning Theory. New
York: Praeger.
Rowe, M. M., & Sherlock, H. (2005). Stress and verbal abuse in nursing: do burned
out nurses eat their young? Journal of Nursing Management, 13, 242-248.
Rumsey, D. (2003). Statistics for dummies. Indiana: Wiley Publishing, Inc.
Ryan, D., & Quayle, E. (1999). Stress in psychiatric nursing: fact or fiction. Nursing
Standard, 14(8), 32-35.
Salvage, J. (2003). Burnout may mark a new start on our inner journey. Nursing
Times, 99(2), 19.
Samuelsson, M., Gustavsson, J. P., Petterson, I. L., Arnetz, B., & Asberg, M. (1997).
Suicidal feelings and work environment in psychiatric nursing personnel.
Social Psychiatry and Psychiatric Epidemiology, 32, 391-397.
Satel, S. (2003, May 2). Taste: talk about trauma. The Wall Street Journal, pp. 13-14.
Sauter, S. L., Hurrell Jr, J. J. & Cooper, C. L. (1989). Job Control and worker health.
Chichester: Wiley.
Schmieder, R. A., & Smith, C. S. (1996). Moderating effects of social support in
shiftworking and non-shiftworking nurses. Work & Stress, 10(2), 128-140.
Schneider, B. (1996). When individual differences aren't. In K. R. Murphy (Ed.),
Individual Differences and Behaviour in Organizations (pp. 548-571). San
Francisco: Jossey-Bass Publishers.
Schneider, Z., Elliott, D., LoBiondo-Wood, G., & Haber, J. (2003). Nursing Research
(2nd ed.). Sydney: Mosby.
Scholl, R. W. (2002). Motivational Processes - Expectancy Theory. Available online
at www.uri.edu/research/lrc/scholl/webnotes/Motivation_Expectancy.htm
Retrieved 7 March, 2006
Schultz, C. L., & Schultz, N. C. (1997). Care for caring parents. Melbourne:
Australian Council for Educational Research.
Schwarz, T. (2005). PTSD in nurses. American Journal of Nursing, 105(3), 13.
Sciacchitano, M., Goldstein, M. B., & DiPlacido, J. (2001). Stress, burnout and
hardiness in R.T.s. Professional Issues, 72(4), 321-328.
Seccombe, I., & Ball, J. (1992). Motivation, morale and mobility: a profile of
qualified nurses in the 1990's. London: Institute of Manpower Studies.
Seglin, J. L. (2003, Feb 16). Forewarned is forearmed? The New York Times, pp. 1-2.
Severinsson, E. (2003). Moral stress and burnout: qualitative content analysis.
Nursing and Health Sciences, 5(1), 59-66.
Seyle, H. (1956). The Stress of Life. New York: McGraw-Hill.

284
Shaw, C. (1999). A framework for the study of coping, illness behaviour and
outcomes. Journal of Advanced Nursing, 29(5), 1246-1255.
Sherer, J. L. (1993). Survey highlights the occupational hazards of nursing. Hospitals,
67(10), 60-61.
Sherman, D. (2000). Experiences of AIDS-dedicated nurses in alleviating the stress of
AIDS caregiving. Journal of Advanced Nursing, 31(6), 1501-1508.
Shiu, A. T. (1998). The significance of sense of coherence for the perceptions of task
characteristics and stress during interruptions amongst a sample of public
health nurses in Hong Kong: implications for nursing management. Public
Health Nursing, 14(4), 273-280.
Sidran, (1999). Risking connection. Vicarious traumatization Module 5: Sidran
Foundation & Press.
Singh, J. (2002). Keeping stress at bay. Malaysian Business, 1 December, p. 5.
Skinner, V. (2009). Individual responses to stress and burnout: workplace issues for
Australian nurses and midwives, New South Wales, PhD thesis, University of
New England.
Skipper, J. K., Jung, F. D., & Coffey, L. C. (1990). Nurses and shiftwork: effects on
physical health and mental depression. Journal of Advanced Nursing, 15, 835-
842.
Slater, J. (1993). Occupational Stress in General Practice. University of Wales,
Cardiff.
Smith, A. (1995). Determinants of human performance in organizational settings. In
Cooper, C. L. & Robertson, I. T. (Eds.), International Review of Industrial and
Organizational Psychology (pp. 49-73). Chichester: John Wiley & Sons Ltd.
Snelgrove, S. R. (1998). Occupational stress and job satisfaction: a comparative study
of health visitors, district nurses and community psychiatric nurses. Journal of
Nursing Management, 6(2), 97-104.
Soderfeldt, M., Soderfeldt, B., Ohlson, C. G., Theorell, T., & Jones, I. (2000). The
impact of sense of coherence and high-demand / low-control job environment
on self-reported health, burnout and psychophysiological stress indicators.
Work & Stress, 14(1), 1-15.
Spelton, E., Totterdell, P., Barton, J., & Folkard, S. (1995). Effects of age and
domestic commitment on the sleep and alertness of female shiftworkers. Work
& Stress, 9(2/3), 165-175.
Spillane, L., & Spillane, R. (1996). Job control and job demands: accountability in
disguise? Journal of Occupational Health and Safety, Australia and New
Zealand, 12(2), 179-183.
Spooner-Lane, R., & Patton, W. (2008). Determinants of burnout among public
hospital nurses. Australian Journal of Advanced Nursing, 25(1), 8-16.
Stanley, J., & Goddard, C. (2002). In the Firing Line: Violence and Power in Child
Protection Work. West Sussex: John Wiley & Sons Ltd.
Steadman, D. (2003). Learning to say 'no' is the first step to improving life. Sunday
Business, pp. 1-2.
Stebnicki, M. A. (2000). Stress and grief reactions among rehabilitation professionals:
dealing effectively with empathy fatigue. Journal of Rehabilitation, 66(1), 23-
29.
Stevens, J. (1992). Applied Multivariate Statistics for the Social Sciences. Hillsdale,
New Jersey: Lawrence Erlbaum Associates, Inc.

285
Stordeur, S., D'Hoore, W., & Vandenberghe, C. (2001). Leadership, organizational
stress, and emotional exhaustion among hospital nursing staff. Journal of
Advanced Nursing, 35(4), 533-542.
Stringer, B. (2001). Pinpointing the causes of nurses' stress [International conference
on occupational health for health care workers]. The Canadian Nurse, 97(4),
32-35.
Sundin-Huard, D., & Fahy, K. (1999). Moral distress, advocacy and burnout:
Theorizing the relationships. International Journal of Nursing Practice, 5, 8-
13.
Taylor, B., & Barling, J. (2004). Identifying sources and effects of carer fatigue and
burnout for mental health nurses: a qualitative approach. International Journal
of Mental Health Nursing, 13, 117-125.
Taylor, S., White, B., & Muncer, S. (1999). Nurses' cognitive structural models of
work-based stress. Journal of Advanced Nursing, 29(4), 974-983.
Terluin, B., Van Rhenen, W., Schaufeli, W. B., & De Haan, M. (2004). The four-
dimensional symptom questionnaire (4DSQ): measuring distress and other
mental health problems in a working population. Work & Stress, 18(3), 187-
207.
Toohey, J. (1996). Psychiatric and behavioural disorders: workplace issues (No.
Paper 4). Bondi Junction: Legal and Accounting Management Seminars Pty
Ltd.
Totterdell, P., Spelton, E., Barton, J., Smith, L., & Folkard, S. (1995). On-shift and
daily variations in self-report and performance measures in rotating-shift and
permanent night nurses. Work & Stress, 9(2/3), 187-197.
Vagg, P. R., & Spielberger, D. (1999). The Job Stress Survey: assessing perceived
severity and frequency of occurrence of generic sources of stress in the
workplace. Journal of Occupational Health Psychology, 4(3), 288-292.
Van der Hulst, M., & Geurts, S. (2001). Associations between overtime and
psychological health in high and low reward jobs. Work & Stress, 15(3), 227-
240.
Vroom, V. H. (1964). Work and Motivation. New York: John Wiley & Sons.
Waldron, I. (1978). Type A behaviour pattern and coronary heart disease in men and
women. Social Science Medicine, 12B, 167-170.
Waltz, C. F., Strickland, O. L., & Lenz, E. R. (1991). Measurement in Nursing
Research. Philadelphia: F.A. Davis Company.
Webb, C., & Pontin, D. (1996). Introducing primary nursing: nurses' opinions.
Journal of Clinical Nursing, 5(6), 351-358.
Weekes, K., Peterson, C. L., & Stanton, P. (2001). Stress and the workplace: the
medical scientists' experience. Labour and industry, 11(3), 95-120.
Westman, M., & Etzion, D. (2001). The impact of vacation and job stress on burnout
and absenteeism. Psychology and Health, 16, 595-606.
Wheeler, H., & Riding, R. (1994). Occupational stress in general nurses and
midwives. British Journal of Nursing, 3(10).
Wigens, L. (1997). The conflict between 'new nursing' and 'scientific management' as
perceived by surgical nurses. Journal of Advanced Nursing, 25, 116-122.
Wilde, G. J. S. (1977). Trait description and measurement by personality
questionnaires. In Cattell, R. B. & Dreger, R. M. (Eds.), Handbook of Modern
Personality Theory (pp. 69-103). Washington: Hemisphere Publishing
Corporation.

286
Williams, S., & Cooper, C. L. (1998). Measuring occupational stress: development of
the pressure management indicator. Journal of Occupational Health
Psychology, 3(4), 306-321.
Williamson, G., & Dodds, S. (1999). The effectiveness of a group approach to clinical
supervision in reducing stress: a review of the literature. Journal of Clinical
Nursing, 8(4), 338-344.
Wong, D. F. K., Leung, S. S. K., & So, C. K. (2001). Differential impacts of coping
strategies on the mental health of Chinese nurses in hospitals in Hong Kong.
International Journal of Nurse Practitioners, 7(3), 188-198.
WorkCover Authority of NSW, (2000). Managing loss and grief in the aged care
industry (No. 53). Sydney.
Workforce Planning NSW Health, (1999-2003). Nurses working in NSW. Available
online at www.health.nsw.gov.au/workforce/nurses/nurses.html Retrieved 9th
June, 2006.
Wright, S. (2003). Finding a way out of burnout. Nursing Standard, 18(5), 24-25.
Yonge, O., Krahn, H., Trojan, L., Reid, D., & Haase, M. (2002). Being a preceptor is
stressful. Journal for Nurses in Staff Development, 18(1), 22-27.
Young, H. (1974). A rational counselling primer. New York: Institute for Rational
Living, Inc.
Younger, J., Marsh, K. J., & Grap, M. J. (1995). The relationship of health locus of
control and cardiac rehabilitation to mastery of illness-related stress. Journal
of Advanced Nursing, 22, 294-299.
Zapf, D., Seifert, C., Schmutte, B., Mertini, H., & Holz, M. (2001). Emotion work and
job stressors and their effects on burnout. Psychology and Health, 16, 527-
545.
Zhao, I., & Turner, C. (2008). The impact of shift work on people's daily health habits
and adverse health outcomes. Australian Journal of Advanced Nursing, 25(3),
8-22.
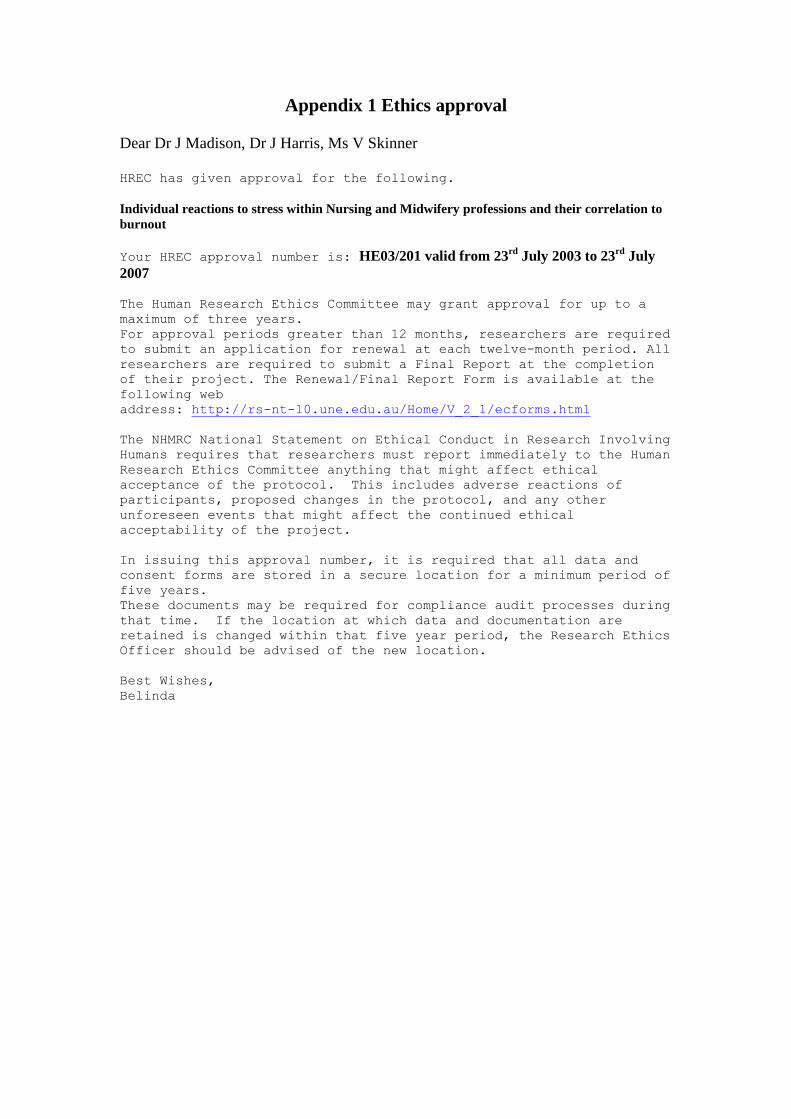
Appendix 1 Ethics approval
Dear Dr J Madison, Dr J Harris, Ms V Skinner
HREC has given approval for the following.
Individual reactions to stress within Nursing and Midwifery professions and their correlation to
burnout
Your HREC approval number is: HE03/201 valid from 23rd
July 2003 to 23rd
July
2007
The Human Research Ethics Committee may grant approval for up to a
maximum of three years.
For approval periods greater than 12 months, researchers are required
to submit an application for renewal at each twelve-month period. All
researchers are required to submit a Final Report at the completion
of their project. The Renewal/Final Report Form is available at the
following web
address: http://rs-nt-10.une.edu.au/Home/V_2_1/ecforms.html
The NHMRC National Statement on Ethical Conduct in Research Involving
Humans requires that researchers must report immediately to the Human
Research Ethics Committee anything that might affect ethical
acceptance of the protocol. This includes adverse reactions of
participants, proposed changes in the protocol, and any other
unforeseen events that might affect the continued ethical
acceptability of the project.
In issuing this approval number, it is required that all data and
consent forms are stored in a secure location for a minimum period of
five years.
These documents may be required for compliance audit processes during
that time. If the location at which data and documentation are
retained is changed within that five year period, the Research Ethics
Officer should be advised of the new location.
Best Wishes,
Belinda

Appendix 2 Conferences and distribution / return rates for main
study
Conference /Seminar, 2005 Population
(Number)
Responses
(Number)
Response Rate
(Percentage) Legal Issues for Midwives Seminar,
Westmead, Sydney, NSW, April 28
66 51 77.2%
Lactation conference,
Sydney, NSW, May 27-28
199 82 41.2%
Obstetric & Accident & Emergency
Update, Brisbane, QLD, June14-15
167 81 48.5%
Paediatric Update, Sydney, NSW, June18 142 50 35.9%
Legal Issues Seminar, Perth, WA, June18 180 38 20.6%
Nurses Electrocardiograph & Pacemaker
Seminar, Gosford, NSW, June 27-28
45 24 51.1%
Dilemmas of the Newborn Seminar,
Parramatta, NSW, July 29
38 10 26.3%
Lactation Seminar, Gosford, NSW, August
2
45 25 55.6%
Neonatal Seminar, Westmead, NSW,
August 30
56 33 58.9%
International Breastfeeding Conference,
Hobart, Tasmania,
September 28, 29 & 30
197 80 40.6%
Annual State Midwifery Conference,
Bondi, NSW, October 21 & 22
73 32 43.8%
Annual Wound Conference, North
Sydney, NSW, November 11 & 12
141 53 37.6%
Cardiotocographic Seminar, Gosford,
NSW, November 22
9 3 33.3%
Total 1358 562 41.4%

1
Appendix 3 Questionnaire
School of Health
Armidale, NSW 2351,
Australia
Dear Colleague,
As part of my research doctoral studies at the University of New England, Armidale, I am
studying how individuals with different personality types within the nursing and
midwifery profession deal with “stress” and “burnout” and how this is related to control
over their work environment.
Considering your present role as a midwife or nurse, I am most interested in obtaining
your views and believe that you will give me great insight and individual perspective on
this issue. I hope you will enjoy completing the questionnaire for your own thoughts and
feelings about stress and burnout and associated personality types.
For the purposes of this research, these definitions are given.
DEFINITION OF STRESS
Inability to control work environment in such a way that it causes considerable
pressure amongst working team members. This may contribute to feelings of unease at
the initial episode of stress and involve an array of symptoms characteristic of ill-health
over a prolonged period of time in helping professions, ultimately leading to burnout.
DEFINITION OF BURNOUT
Over a prolonged period of time burnout is experienced by those in helping
professions resulting in feelings of helplessness and being emotionally exhausted and
overwhelmed. This contributes to lack of empathy towards clients and feelings of
incompetence and unsuccessful achievement in ones’ work with people.
Once you have completed the enclosed questionnaire, you may be asked to be involved in
an interview with the researcher. The interview will be audiotaped and transcribed by the
researcher. The interview can take place at your residence or any other place you choose.
If you do not live in Australia, it will be by phone. If you are willing to return for an
interview, you will be given another information sheet and consent form for that purpose.

2
The research data for this questionnaire will be locked in a cabinet at my private
residence during the research project and kept for a period of 5 years following the
research. The data will then be destroyed. Your participation is strictly voluntary and you
may withdraw at any time. All aspects of this research project will remain confidential
and all questionnaires and interviews will contain a number instead of a name. Only the
researchers will know your identity.
The material revealed in this questionnaire may be disseminated by publication in
professional journal articles and papers presented at nursing professional conferences.
Once again, your identity will be protected at all times and not disclosed.
The UNE Ethics approval number for this research project is HE03/201.
As the questionnaire may raise personal or upsetting issues, counselling services may be
contacted at your local Health Service.
If you have any questions regarding the research project please contact my supervisors,
Dr Jeanne Madison, School of Health, University of New England, Armidale, NSW,
2351, telephone (02) 6773 3667, Dr Judy Harris, University of New England, Armidale,
telephone (02) 6773 3953 or Trish Lee-White, Obstetric Unit Clinical Nurse Consultant,
Central Coast Health, Holden Street, Gosford, NSW, 2250, telephone (02) 4320 2397.
Further information may be gained by contacting me, Virginia Skinner, 46 Holcombe
Ave, Narara, NSW, 2250, telephone (02) 4323 4962.
Should you have any concerns or complaints concerning the manner in which this
research is conducted, please contact the Human Research Ethics Committee at the
following address
The Secretary
Human Research Ethics Committee
Research Services
University of New England
Armidale, 2351
Telephone: (02) 6773 3449
When you have completed the questionnaire, please place the three sections of the
questionnaire in the addressed envelope supplied and mail them by
Date………………………………..
The questionnaire will take approximately 35 minutes to complete. If you are willing to
be involved in an in-depth interview, please complete the last page of the questionnaire to
provide your contact details. I will also provide you with feedback information on the
results of your questionnaire. Thank you for your time and co-operation.
Virginia Skinner RN CM BHSc MNH
CONSENT FORM FOR QUESTIONNAIRE

3
TITLE: INDIVIDUAL REACTIONS TO STRESS AND BURNOUT WITHIN
NURSING AND MIDWIFERY PROFESSIONS AND THEIR CORRELATION
TO PERSONALITIES.
I have read and understand all the information describing this study in the attached Cover
Letter to Questionnaire Participants. I understand the nature of the study; purpose and
possible consequences and that I may withdraw at any time. All my questions have been
answered to my satisfaction. I voluntarily consent to participate in this study and
acknowledge that I have received a copy of this agreement and information sheet.
Completing this questionnaire is an indication that I wish to participate.
It has been explained to me that the research project has been approved by the University
of New England Human Research Ethics Committees.
I have fully explained the above study to the participant.
NAME OF INVESTIGATOR: VIRGINIA SKINNER
SIGNATURE:
DATE: …………………….
Should you have any concerns or complaints concerning the manner in which this
research is conducted, please contact the Human Research Ethics Committee at the
following address:
The Secretary
Human Research Ethics Committee
Research Services
University of New England
Armidale NSW 2351
Telephone: (02) 6773 3449

4
COVER SHEET TO EXPLAIN QUESTIONNAIRE
Example of completing the questionnaire:
In your work environment, how often have you experienced “stress”?
Definition of stress: Inability to control work environment in such a way that it
causes considerable pressure amongst working team members. This may
contribute to feelings of unease at the initial episode of stress and involve an array
of symptoms characteristic of ill health over a prolonged period in helping
professions, ultimately leading to burnout.
Occasionally Frequently Most of the time Always
√
If your answer is Frequently tick the appropriate column. Please ONLY TICK ONE
BOX FOR EACH ANSWER.

- -
5
APPENDIX ONE
QUESTIONNAIRE
PART ONE-STRESS AND BURNOUT
Please tick the most correct answer to the following questions.
1) In your work environment, how often have you experienced „stress‟?
Never Occasionally Frequently Most of the
time
Always
2) In your work environment for your organisation, have you experienced
inefficient time management? For example, is your workload too excessive at
times to provide quality of care for clients?
Never Occasionally Frequently Most of the
time
Always
3) In your work environment, how often do you rush to complete things?
Never Occasionally Frequently Most of the
time
Always
4) At work, how often do you finish late?
Never Occasionally Frequently Most of the
time
Always
5) Do you become apathetic when “stressed”?
Never Occasionally Frequently Most of the
time
Always

- -
6
6) Do you experience low morale in relation to work?
Never Occasionally Frequently Most of the
time
Always
7) Do you feel powerless in your job?
Never Occasionally Frequently Most of the
time
Always
8) Do you feel undervalued in your job?
Never Occasionally Frequently Most of the
time
Always
9) Have you felt overwhelmed in your job?
Never Occasionally Frequently Most of the
time
Always
10) Have you ever experienced feelings of incompetence within yourself in your
work with people? This may occur at home, at work or in your social world.
Never Occasionally Frequently Most of the
time
Always
11) Are you treated with respect by your clients/patients?
Never Occasionally Frequently Most of the
time
Always

- -
7
12) Do you have control over your work? This may involve choice in assignments,
work hours and how you undertake your work.
Never Occasionally Frequently Most of the
time
Always
13) Do you have enough organisational support?
Never Occasionally Frequently Most of the
time
Always
14) Do you find your work colleagues unsupportive?
Never Occasionally Frequently Most of the
time
Always
15) Do you think you are suited to the particular type of work you are doing?
Never Occasionally Frequently Most of the
time
Always
16) Are you doing the kind of work you like?
Never Occasionally Frequently Most of the
time
Always
17) Have you experienced increased worry in relation to work?
Never/Occasionally Over past
few days
Over past
few weeks
Over past
few months
Over the
past year
Over the
past decade

- -
8
18) Have you experienced sleeplessness in relation to work?
Never/Occasionally Over past
few days
Over past
few weeks
Over past
few months
Over the
past year
Over the
past decade
19) Have you experienced depression in relation to work?
Never/Occasionally Over past
few days
Over past
few weeks
Over past
few months
Over the
past year
Over the
past decade
20) How often do you experience sleeplessness in relation to work?
Never/Occasionally Once or twice
a week
3 or 4 times a
week
5 to 6 times a
week
Daily
21) How often do you feel tired?
Never/Occasionally Once or twice
a week
3 or 4 times a
week
5 to 6 times a
week
Daily
22) Do you experience headaches that require analgesia?
Never/Occasionally Once or twice
a week
3 or 4 times a
week
5 to 6 times a
week
Daily
23) How often do you feel emotionally drained at work?
Never/Occasionally Once or twice
a week
3 or 4 times a
week
5 to 6 times a
week
Daily

- -
9
24) Would you like to change your area of practice?
Yes No Sometimes Unsure
25) Would you like to leave your professional discipline?
Yes No Sometimes Unsure
26) Do you think a certain amount of „stress‟ is healthy? For example, „stress‟ that
keeps you motivated?
Yes No Unsure
27) Have you ever felt loss of empathy for feelings of colleagues while at work?
Yes No Unsure
28) Have you ever felt loss of empathy for feelings of clients while at work?
Yes No Unsure
29) Do you think „burnout‟ is unavoidable in your job?
Yes No Unsure
30) Would you expect your work environment to be „stress‟ free?
Yes No Unsure

- -
10
31) Do you experience „stress‟ that requires treatment? For example, panadol,
massages.
Never Once a
year
Once
every 6
months
Once
every 3
months
Once a
month
Once
every
few
weeks
Once a
week
Daily
32) How often do you experience job dissatisfaction?
Never Once a
year
Once
every 6
months
Once
every 3
months
Once a
month
Once
every
few
weeks
Once a
week
Daily
33) Over the last year, have you taken leave as “mental health days”?
Never Once Twice 3 to 10
times
11-29
times
30 to 49
times
50 to 100
times
34) In your work environment, have you experienced feelings of helplessness?
Never/Occasionally Yesterday Over
past few
days
Over
past few
weeks
Over
past few
months
Over the
past
year
Over the
past
decade
35) For how long at one time do you experience depression in relation to work?
Never For one
hour
For one
day
For two
weeks
For a
month
For a year For a few
years

- -
11
36) How long was your longest holiday at one time over the last year?
For 7 to
10
weeks
For 5
or 6
weeks
For a
month
For 2
or 3
weeks
For a
week
For 3 to
5 days
For 2
days
For a
day
No
holiday
37) Would you prefer to work alone than with others?
Never Occasionally Frequently Most of the
time
Always
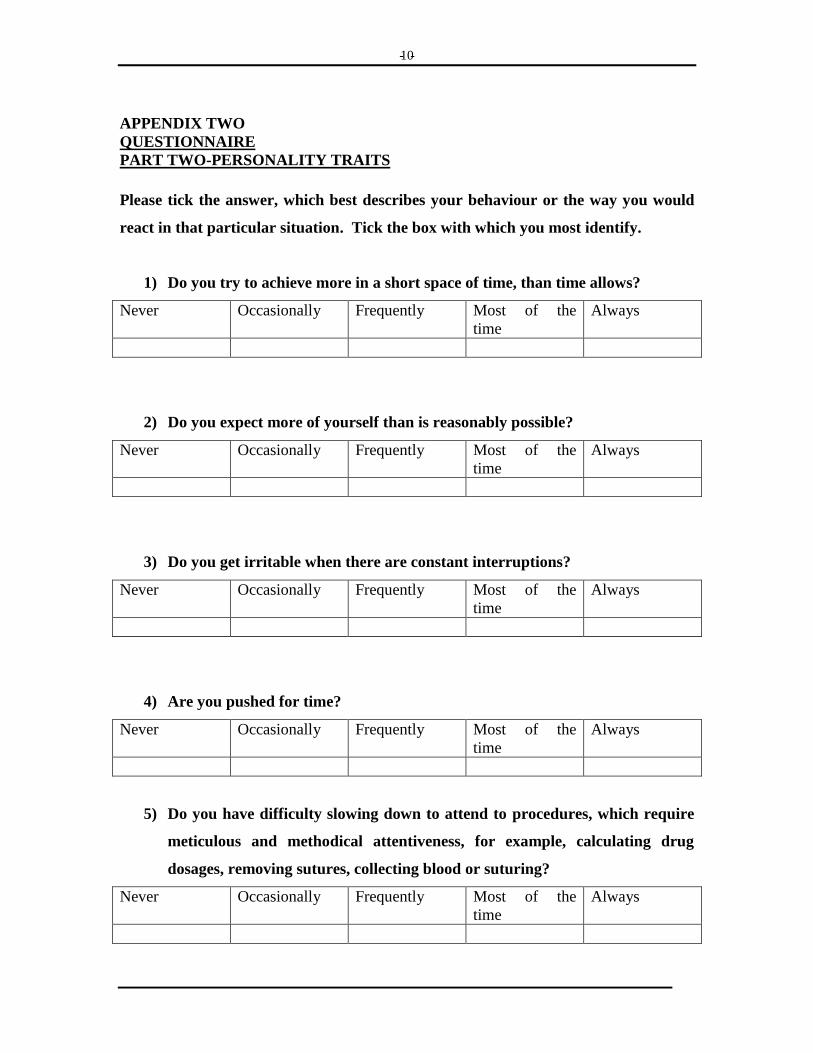
- -
10
APPENDIX TWO
QUESTIONNAIRE
PART TWO-PERSONALITY TRAITS
Please tick the answer, which best describes your behaviour or the way you would
react in that particular situation. Tick the box with which you most identify.
1) Do you try to achieve more in a short space of time, than time allows?
Never Occasionally Frequently Most of the
time
Always
2) Do you expect more of yourself than is reasonably possible?
Never Occasionally Frequently Most of the
time
Always
3) Do you get irritable when there are constant interruptions?
Never Occasionally Frequently Most of the
time
Always
4) Are you pushed for time?
Never Occasionally Frequently Most of the
time
Always
5) Do you have difficulty slowing down to attend to procedures, which require
meticulous and methodical attentiveness, for example, calculating drug
dosages, removing sutures, collecting blood or suturing?
Never Occasionally Frequently Most of the
time
Always
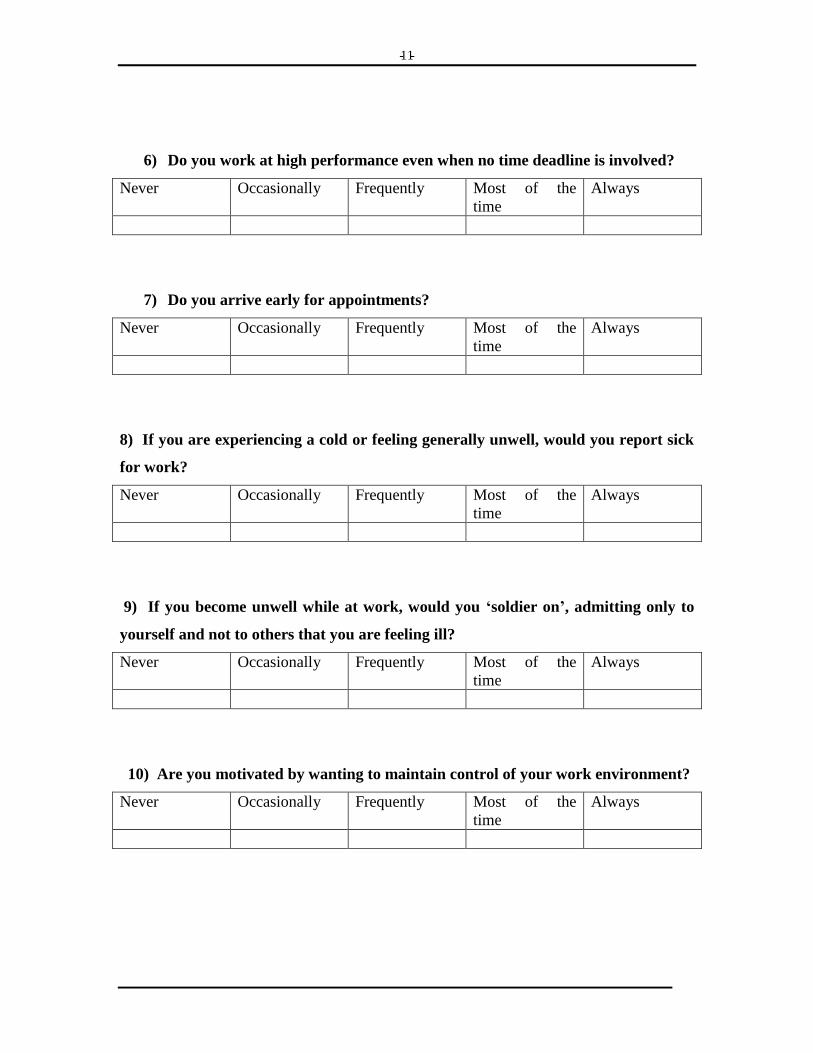
- -
11
6) Do you work at high performance even when no time deadline is involved?
Never Occasionally Frequently Most of the
time
Always
7) Do you arrive early for appointments?
Never Occasionally Frequently Most of the
time
Always
8) If you are experiencing a cold or feeling generally unwell, would you report sick
for work?
Never Occasionally Frequently Most of the
time
Always
9) If you become unwell while at work, would you „soldier on‟, admitting only to
yourself and not to others that you are feeling ill?
Never Occasionally Frequently Most of the
time
Always
10) Are you motivated by wanting to maintain control of your work environment?
Never Occasionally Frequently Most of the
time
Always

- -
12
11) Are you keyed up a lot of the time on most days?
Never Occasionally Frequently Most of the
time
Always
12) Have you the tendency to perform many tasks at one time?
Never Occasionally Frequently Most of the
time
Always
13) Are you constantly looking for a challenge in your work?
Never Occasionally Frequently Most of the
time
Always
14) Do you have a strong sense of commitment to your work?
Never Occasionally Frequently Most of the
time
Always

- -
13
15) How do you react when you are irritable?
Swear and shout Verbalize your
feelings in a
disruptive manner
Verbalize your
feelings in a
controlled manner
Bottle your feelings
inside
Please select and circle the personality traits that apply to you.
Relaxed Easy going
Thoughtful Shy
Hard-driving Competitive
Impatient Energetic
Aggressive Workaholic
Compliant Introspective
Hostile Introverted
Tense Easily angered
Ambitious Anxious
Restless

- -
13
QUESTIONNAIRE
PART THREE-DEMOGRAPHIC INFORMATION
I would appreciate acquiring some information concerning your own personal details and
nursing history. Please tick your answer / answers.
YOUR AREA OF PRACTICE. Please circle your predominant area or specify same.
If you work in more than one area, please write the areas in the space provided,
writing the most predominant area first.
Critical care / Midwifery / Neonatal care / Accident & Emergency / Oncology / Operating
Theatre / Recovery / Medical / Surgical / Aged Care / Community / Education / Nursing
Management / Other
……………………………………………………………………………………..
Male Female
YOUR COUNTRY OF PRACTICE
……………………………………………………………………………………………
Are you permanent, fulltime or part-time or casual?
………………………………………………………………………………………………
How many hours per week do you work on average?
……………………………………………………………………………………………
How long have you been in your profession?
……………………………………………………………………………………………
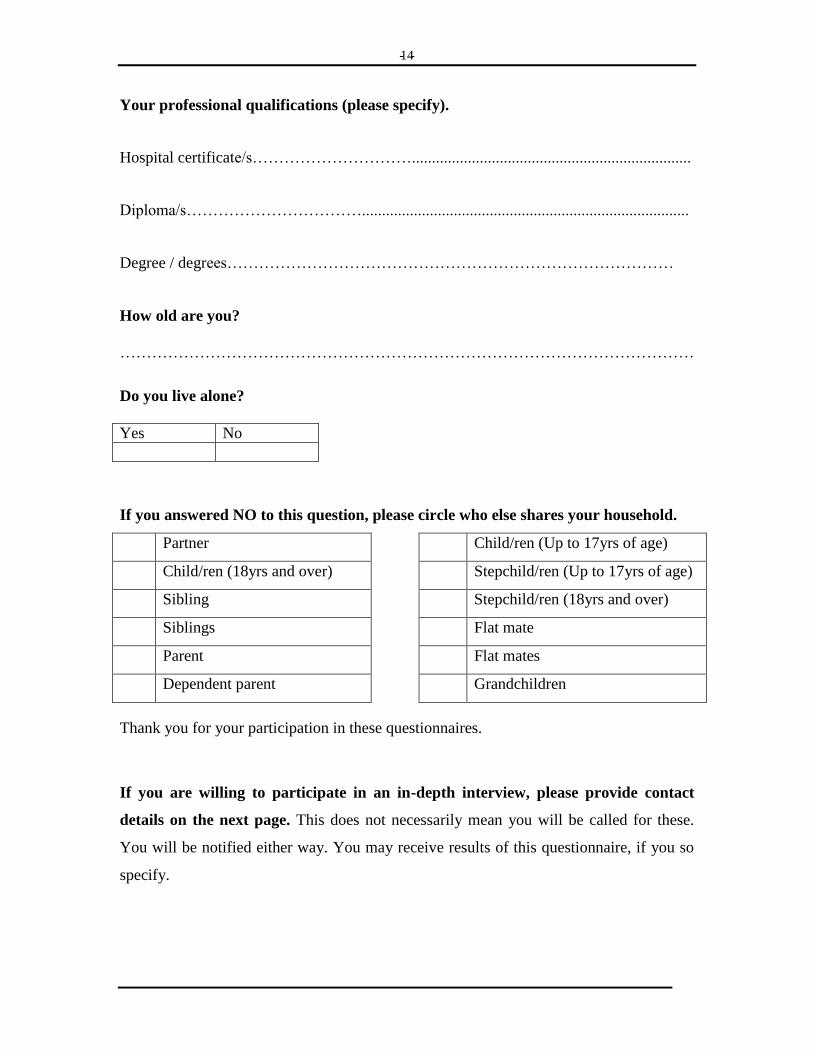
- -
14
Your professional qualifications (please specify).
Hospital certificate/s…………………………......................................................................
Diploma/s……………………………..................................................................................
Degree / degrees…………………………………………………………………………
How old are you?
………………………………………………………………………………………………
Do you live alone?
Yes No
If you answered NO to this question, please circle who else shares your household.
Partner Child/ren (Up to 17yrs of age)
Child/ren (18yrs and over) Stepchild/ren (Up to 17yrs of age)
Sibling Stepchild/ren (18yrs and over)
Siblings Flat mate
Parent Flat mates
Dependent parent Grandchildren
Thank you for your participation in these questionnaires.
If you are willing to participate in an in-depth interview, please provide contact
details on the next page. This does not necessarily mean you will be called for these.
You will be notified either way. You may receive results of this questionnaire, if you so
specify.

- -
15
NAME:
ADDRESS:
PHONE NUMBER:
Best time to call:

Appendix 4 Paired responses for test-retest scores for pilot study
Part 1 – 38 questions
Stress Burnout
Part 2 – 15 questions
Individual Responses
ID 1 25 paired 66% the same 5 paired 33% the same
ID 2 22 paired 61% the same 9 paired 64% the same
ID 3 27 paired 76% the same 7 paired 47% the same
ID 4 26 paired 66.6% the same 9 paired 60% the same
ID 5 29 paired 73.7% the same 15 paired 100% the same
ID 6 31 paired 81.6% the same 7 paired 46.7% the same
ID 7 30 paired 79% the same 9 paired 60 % the same
ID 8 28 paired 73.7% the same 10 paired 66.6% the same
ID 9 27 paired 76.3% the same 11 paired 73.3% the same
ID 10 31 paired 84% the same 9 paired 82% the same
ID 11 21 paired 55.2% the same 10 paired 66% the same
ID 12 24 paired 63.9% the same 11 paired 73.3% the same
ID 13 23 paired 60.5% the same 8 paired 53.3% the same
ID 14 28 paired 73.7% the same 10 paired 66.6% the same
ID 15 22 paired 57.8% the same 9 paired 60% the same
ID 16 32 paired 84.2% the same 15 paired 60% the same
ID 17 31 paired 81.5% the same 10 paired 66.7% the same
ID 18 27 paired 75.6% the same 5 paired 33.3% the same
ID 19 35 paired 92% the same 10 paired 66.6% the same
ID 20 20 paired 54% the same 5 paired 33.3% the same
ID 21 34 paired 89.5% the same 14 paired 93.3% the same
ID 22 25 paired 65.8% the same 7 paired 46.7% the same
ID 23 27 paired 71% the same 8 paired 53.3% the same
ID 24 34 paired 89% the same 10 paired 66.6% the same
Average for total 27.5 paired 73% the same 9.3 paired 61 % the same

1
Appendix 5 Pilot study publication
The development of a tool to assess levels of stress and burnout.
Virginia Skinner RN RM BHsc MNH
Kingsley Agho Msc
Trish Lee-White RN RM BSoc Sci
Dr Judy Harris PhD
Virginia Skinner1,3*
, Kingsley Agho2,Trish Lee-White
3, Judy Harris
1.
1University of New England, Armidale
2 School of Public Health, The University of Sydney.
3 Northern Sydney Central Coast Health
* corresponding author
Virginia Skinner
Research Project Officer
Northern Sydney Central Coast Health
Phone: AH: (02) 4323 4962 Mob: 0408 427612
Fax: (02) 4323 4962
Email: [email protected]
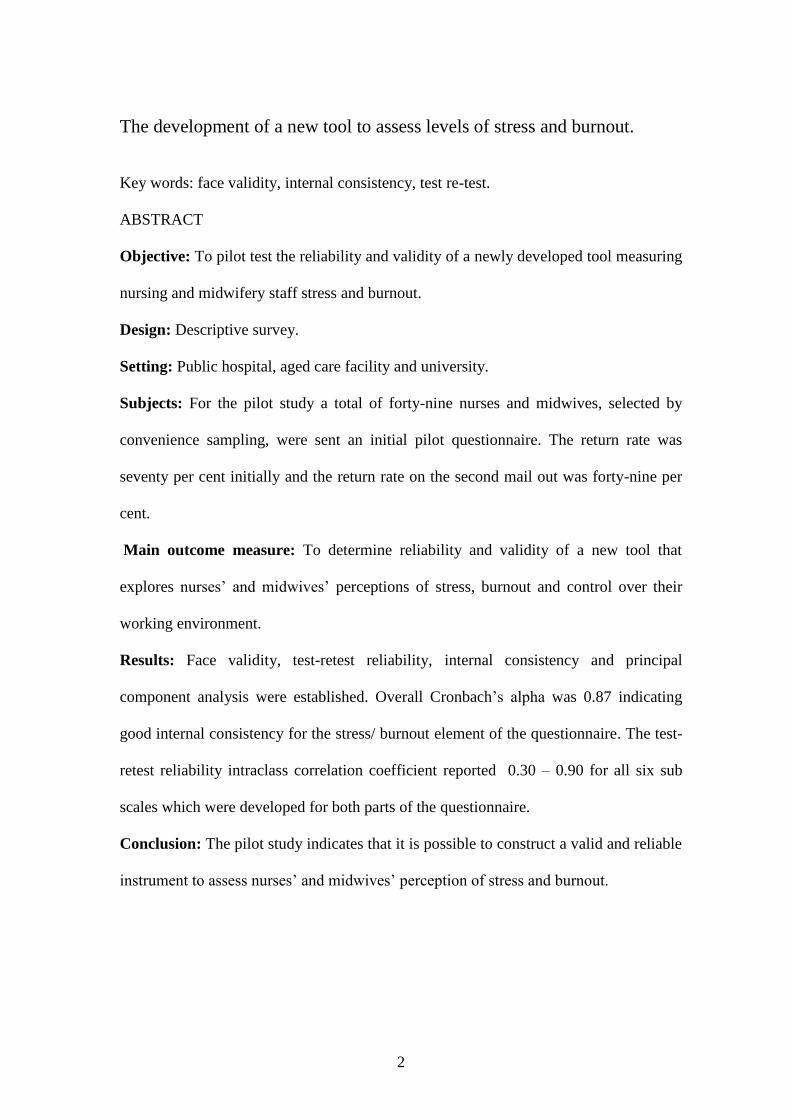
2
The development of a new tool to assess levels of stress and burnout.
Key words: face validity, internal consistency, test re-test.
ABSTRACT
Objective: To pilot test the reliability and validity of a newly developed tool measuring
nursing and midwifery staff stress and burnout.
Design: Descriptive survey.
Setting: Public hospital, aged care facility and university.
Subjects: For the pilot study a total of forty-nine nurses and midwives, selected by
convenience sampling, were sent an initial pilot questionnaire. The return rate was
seventy per cent initially and the return rate on the second mail out was forty-nine per
cent.
Main outcome measure: To determine reliability and validity of a new tool that
explores nurses’ and midwives’ perceptions of stress, burnout and control over their
working environment.
Results: Face validity, test-retest reliability, internal consistency and principal
component analysis were established. Overall Cronbach’s alpha was 0.87 indicating
good internal consistency for the stress/ burnout element of the questionnaire. The test-
retest reliability intraclass correlation coefficient reported 0.30 – 0.90 for all six sub
scales which were developed for both parts of the questionnaire.
Conclusion: The pilot study indicates that it is possible to construct a valid and reliable
instrument to assess nurses’ and midwives’ perception of stress and burnout.

3
INTRODUCTION
There have been various tools and instruments used previously in the literature
to assess stress (Maslach & Jackson, 1981; Jewell & Siegall, 1990; Stordeur, D’Hoore
& Vandenberghe, 2001; Goldberg, 1978 & Rahe & Tolles, 2002). These tools were
reviewed but seemed dated and no longer pertinent to current issues and concerns faced
by midwives and nurses in their current clinical, challenging work environments. Tools
must possess basic attributes that assure dependable measurement of the variables
under investigation. These important attributes are termed validity and reliability
(Waltz, Strickland & Lenz, 1991). Norbeck (1985) suggests that there are four
minimum standards necessary for the adequate evaluation of an instrument for use in
research. These standards should include at least one type of content validity, one type
of construct (or criterion-related) validity and two types of reliability testing (internal
consistency and test-retest). This paper will explore these issues concerning validity
and reliability as they relate to the development of a new, original questionnaire.
RELEVANT LITERATURE
Validity and reliability
Validity is the extent to which a study using a particular tool measures
what it sets out to measure (Polit & Hungler, 1997). The testing of validity is not
exactly proven, but rather supported by an accumulation of evidence. A researcher does
not totally validate a tool per se but more an application of the tool. Unlike reliability,
there are no simple statistical calculations to assess validity (Polit & Hungler, 1997).
Polit and Hungler (1997) define content validity as the adequacy of the content
area being considered. A subtype of content validity is face validity and this
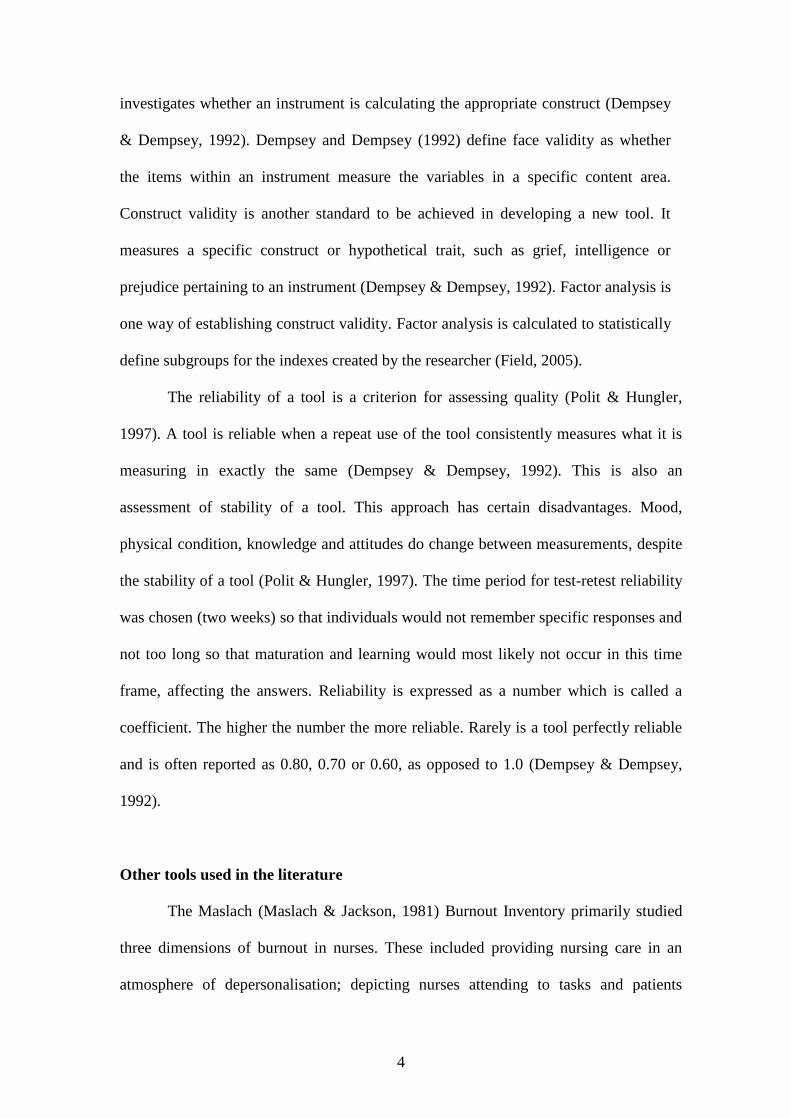
4
investigates whether an instrument is calculating the appropriate construct (Dempsey
& Dempsey, 1992). Dempsey and Dempsey (1992) define face validity as whether
the items within an instrument measure the variables in a specific content area.
Construct validity is another standard to be achieved in developing a new tool. It
measures a specific construct or hypothetical trait, such as grief, intelligence or
prejudice pertaining to an instrument (Dempsey & Dempsey, 1992). Factor analysis is
one way of establishing construct validity. Factor analysis is calculated to statistically
define subgroups for the indexes created by the researcher (Field, 2005).
The reliability of a tool is a criterion for assessing quality (Polit & Hungler,
1997). A tool is reliable when a repeat use of the tool consistently measures what it is
measuring in exactly the same (Dempsey & Dempsey, 1992). This is also an
assessment of stability of a tool. This approach has certain disadvantages. Mood,
physical condition, knowledge and attitudes do change between measurements, despite
the stability of a tool (Polit & Hungler, 1997). The time period for test-retest reliability
was chosen (two weeks) so that individuals would not remember specific responses and
not too long so that maturation and learning would most likely not occur in this time
frame, affecting the answers. Reliability is expressed as a number which is called a
coefficient. The higher the number the more reliable. Rarely is a tool perfectly reliable
and is often reported as 0.80, 0.70 or 0.60, as opposed to 1.0 (Dempsey & Dempsey,
1992).
Other tools used in the literature
The Maslach (Maslach & Jackson, 1981) Burnout Inventory primarily studied
three dimensions of burnout in nurses. These included providing nursing care in an
atmosphere of depersonalisation; depicting nurses attending to tasks and patients
5
without any emotional feeling, emotional exhaustion and perceptions of reduced
personal accomplishment; all indicative of feelings of low morale. It did not study
specific stressors such as high patient acuity or low staffing levels. Jewell and Siegall’s
(1990) Nurse Stress Index correlated stress scores with job satisfaction, not behavioural
aspects. It aimed to identify issues of occupational stress.
Stordeur, D’Hoore and Vandenberghe (2001) used a nursing stress scale which
identified three sources of stress, namely, physical, psychological and social
environments. They conducted their study on leadership, organization stress, and
emotional exhaustion among nursing staff. These researchers did not look at the
behavioural aspects of individual nurses. Goldberg (1978) designed the General Health
Questionnaire-12 which detected psychological indicators of ill health. It was used in
occupational and community settings as opposed to nursing workplaces. The
questionnaire’s main purpose evaluated psychiatric morbidity.
Aims
A pilot study before embarking on a main study is of the utmost importance
(Hundley & van Teijlingen, 2002). A pilot study was undertaken to primarily
establish a feedback mechanism, ensure the survey was user-friendly, ensure the
items in the survey covered the content area of interest and establish a degree of
reliability. This paper explores issues associated with the development of a new,
original questionnaire and reports on reliability and validity determined by a pilot
study. The paper discusses the imperative issues of a comprehensive pilot process that
assesses not only the questionnaire but that meaningful data and analysis is possible
to acquire.

6
METHOD
Development of survey
Generation of items for the draft questionnaire
The researcher began the process of developing a comprehensive questionnaire
by accumulating literature and other questionnaires from the area of interest. The
questionnaire was designed and developed specifically for the study. Items were
generated from a literature review and the researcher used the search items, stress;
burnout; personality and behavioural characteristics. The questionnaire consisted of
three sections. The first section obtained demographic information. The second section
comprised thirty-eight items related to stress and burnout. The third section comprised
fifteen questions related to personality and behavioural aspects exhibited in particular
scenarios, known as vignettes (Polit & Hungler, 1985). Additionally a comprehensive
accumulation of information from the area of interest came from the researcher’s first
hand knowledge and experience in the healthcare workforce.
Expert advice from academic and clinical experts in the field included a
university presentation feedback session. The questionnaire was presented for comment
to a post-graduate research residential school including students and lecturers at the
university in October, 2003. This university research residential school is an
opportunity for students to present their research and receive feedback. The researcher
thought that this would be an excellent venue to present the questionnaire in its first
draft form. The original questionnaire was presented and many changes were
implemented from this presentation.

7
Changes to questions relating to stress and behavioural aspects
The residential school feedback provided the researcher with a comprehensive
list of changes and additions from the original draft questionnaire. All changes
suggested were incorporated into the new questionnaire. The first addition included
“Tick one box” to ensure participants answered single responses only. The word
“inefficient” replaced “poor”. The words “In your work” were added onto the question,
“Are you constantly looking for a challenge?” The word “suffered” as in suffering pain
was changed to “experienced”, “stress that keeps you moving” was changed to “stress
that keeps you motivated”.
The questions, “How long was your holiday at one time over the last year?”
and “How often did you holiday for more than one day over the last year?” were
condensed into one question, “How long was your longest holiday at one time over the
last year?” One of the options for this question, was changed to “seven to ten weeks”
from “seven or eight weeks”. The phrase “not having enough time to attend to the
quality of care of clients” was changed to “is your workload too excessive at times to
provide quality of care for clients”. The question “Do you think you are well-suited to
this particular type of work?” was changed to “Do you think you are suited to the
particular type of work you are doing?”
Changes to questions relating to demographics
Changes were made as indicated: the area of “nursing management” was
included in the “areas of work”, which had not been included in the original draft
questionnaire. The sentence “If you work in more than one area, please write in the
space provided starting with the most predominant area first” was added to prevent

8
answers of many areas and the researcher not knowing the predominant area. It was
recognized that nurses often work in many different specialties and it would be
important to know the primary or most usual specialty work place. Added to the
demographics were the hours worked and whether the nurse or midwife worked
permanent, fulltime, part time or casual.
Sampling population
Forty-nine respondents were included in this pilot study. The sample size was
chosen to provide adequate information on reliability and a certain degree of face
validity. Respondents included eighteen registered nurses from aged care facilities,
thirty midwives from the Central Coast of NSW and one doctoral student (who was a
registered nurse) from the university. The subjects were selected by convenience
sampling. The sample was selected because of geographical accessibility and the
researcher gained ethics approval from the appropriate authorities. Although the
sample was a mixture of midwives and registered nurses working in competely
different arenas, the sample seemed indicative of what the main study sample could
resemble. The surveys were distributed via the nursing unit managers to staff and by
the researcher directly to the university student. The main study could have included
some of the pilot study respondents, but the researcher was unable to determine if
there was such overlap.
Classifications and coding legends for questionnaire
Classifications or categories were developed by the researcher for the first two
parts of the questionnaire with numerical values attached to extreme, moderate, fair and
nil / negligible levels of stress, control and self-imposed pressure. Questions from each

9
part of the questionnaire were categorized into the following sub-scales: work
environment, burnout, control, job satisfaction, stressors and prefers working alone. For
the stress / burnout and personality surveys, questions used a Likert ranking scale
which designated level of stress or behaviour expected to be found in that situation.
This is known as ordinal data. For example, the answers were: “never”, “occasionally”,
“frequently”, “most of the time” and “always”. The researcher ranked the answers from
nil stress to extremely stressed on opposite ends of the scale. There were eight
questions which included “never / occasionally” in the same box as the answer or
option. For example, the question, “How often do you feel emotionally drained at
work?” would rate a high stress rating if the respondent answered “always” and a nil /
negligible stress rating if the answer was “never / occasionally”.
All parts of the survey used different indices of coding to accommodate the
varying, required levels. For both the stress / burnout and personality / behaviour
components of the survey, specific indices were used for the subscales (see Table 1).
Processes for determining test-retest reliability
For test-retest reliability, scores on the two sets of responses are correlated
statistically to yield a coefficient referred to as the correlation coefficient. If the
results are the same or similar, the coefficient will be high – say 0.90 and the
instrument is said to have high test-retest reliability. The first survey was distributed
by the nursing unit manager and the second survey was mailed by the researcher.
There was no way of controlling as to where the respondent completed the survey.
The directions to complete the survey were exactly the same.

10
RESULTS
Response rate
The average age of the pilot respondent was 47.9 years and the average number
of years in the nursing profession was 24.2 years. Thirty-five questionnaires were
returned out of forty-nine distributed resulting in a seventy-one per cent return rate
initially. A test–retest procedure was followed. Eight respondents remained anonymous
and necessarily these respondents were not sent another questionnaire. Respondents
were able to be identified by placing their contact details on the questionnaire. The
remaining twenty-seven respondents were sent another questionnaire, two weeks later.
Twenty-four respondents returned the second questionnaire, giving a test-retest return
rate of forty-nine per cent of the postal questionnaires distributed. Twenty-four
respondents were therefore used in the pilot data analysis.
Data analysis
As the sample was small, an average was calculated for any numerical data that
were missing (also known as mean imputation method). Overall reliability of the scale
was calculated by Cronbach’s alpha indicating internal consistency. The Spearman’s
rank order correlation was employed to analyse inter-item, item-total correlation and
correlations between subscales. Spearman’s rank order correlation was also used with
the intraclass correlation coefficient to estimate the degree of resemblance or reliability
of the subscales for the preliminary and final versions of the pilot questionnaire (that is,
the test and retest scores). The intraclass correlation coefficient was used with the
continuous data. Principle component analysis using factor analysis was employed to
produce the variables that are highly loaded or pertinent to midwives and nurses.

11
Internal consistency
The overrall Cronbach reliability level for internal consistency for the total and
subscales between the preliminary (first test) and final (second test) versions of the
questionnaire were calculated. The result for the first test was 0.87 and 0.82 for the
second test for the stress and burnout component of the questionnaire. The second
correlation coefficient is only marginally lower than the first, to be expected when
questions pertain to aspects of behaviour and stress. This level should be at least 0.70.
One question was not included because one hundred per cent of the nurse and midwife
participants responded “no” to the question, “Would you expect your environment to be
“stress” free?” Nurses and midwives perhaps think that there is an expectancy that there
will be certain levels of workplace stress with which to contend. For the personality
traits component of the questionnaire, only the first five questions were used as they
showed good reliability for internal consistency (> 0.70) for the preliminary (first test)
and final (second test) versions of the questionnaire (see Table 2).
Test-retest reliability
Table 3 shows the test-retest reliability estimates (see column 3). From the
table, all subscales in retest reliability were moderately correlated (r = 0.47 – 0.69) (see
Table 3, column 2) and the correlation coefficients are between 0.30-0.62 (see Table 3,
column 1) for the preliminary version of the test, however, stress and burnout subscales
show lower correlation coefficients. This fact was supported by Stevens (1992) who
reports that the strengths of the relationship or association depends on context and in
some cases where the correlation is low does not imply that the outcome has no useful
significance. Kline (1999) reaffirms this by reporting that when looking at
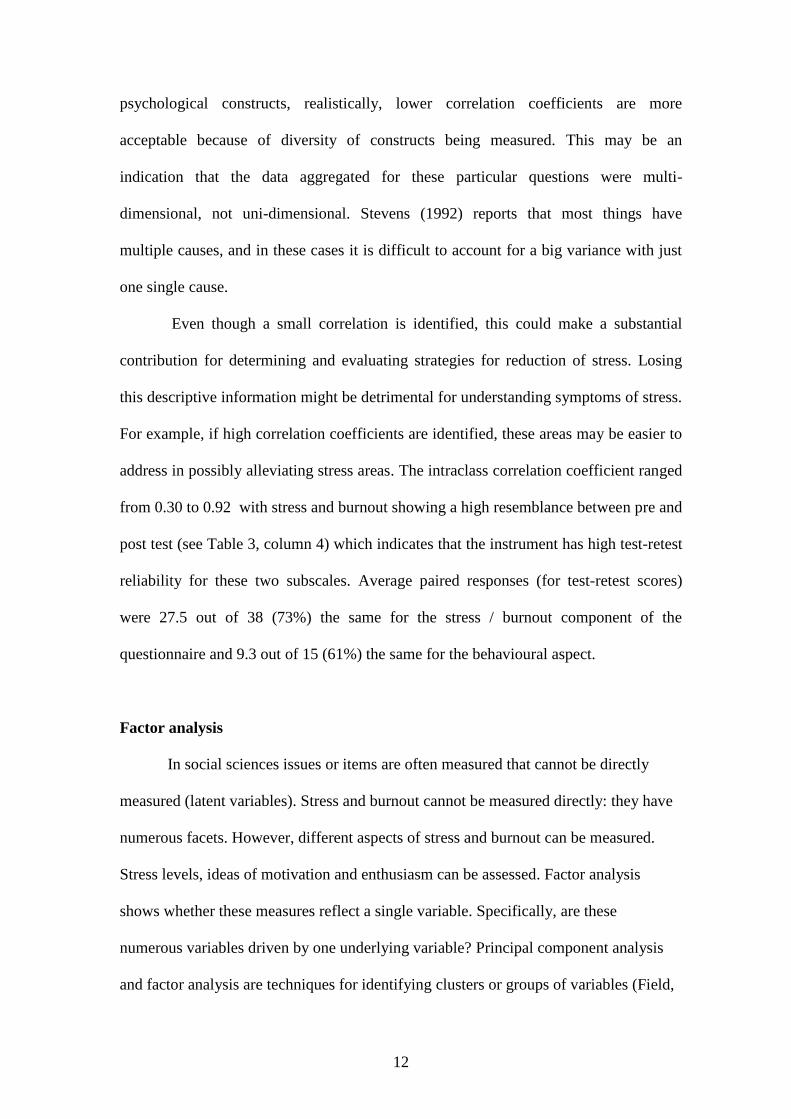
12
psychological constructs, realistically, lower correlation coefficients are more
acceptable because of diversity of constructs being measured. This may be an
indication that the data aggregated for these particular questions were multi-
dimensional, not uni-dimensional. Stevens (1992) reports that most things have
multiple causes, and in these cases it is difficult to account for a big variance with just
one single cause.
Even though a small correlation is identified, this could make a substantial
contribution for determining and evaluating strategies for reduction of stress. Losing
this descriptive information might be detrimental for understanding symptoms of stress.
For example, if high correlation coefficients are identified, these areas may be easier to
address in possibly alleviating stress areas. The intraclass correlation coefficient ranged
from 0.30 to 0.92 with stress and burnout showing a high resemblance between pre and
post test (see Table 3, column 4) which indicates that the instrument has high test-retest
reliability for these two subscales. Average paired responses (for test-retest scores)
were 27.5 out of 38 (73%) the same for the stress / burnout component of the
questionnaire and 9.3 out of 15 (61%) the same for the behavioural aspect.
Factor analysis
In social sciences issues or items are often measured that cannot be directly
measured (latent variables). Stress and burnout cannot be measured directly: they have
numerous facets. However, different aspects of stress and burnout can be measured.
Stress levels, ideas of motivation and enthusiasm can be assessed. Factor analysis
shows whether these measures reflect a single variable. Specifically, are these
numerous variables driven by one underlying variable? Principal component analysis
and factor analysis are techniques for identifying clusters or groups of variables (Field,

13
2005). The factor analysis for this pilot exercise indicated that stress and burnout had
the high loading factors (see Table 3, column 4). The principal component analysis
identified stress and burnout to be two major factors that nurses’ and midwives’
experience in their work environment.
DISCUSSION
Based on feedback from respondents in the research residential school,
the format was changed to enhance user friendliness. The initial questionnaire
contained the demographic information at the beginning, which was then placed at the
end of the document. The residential school respondents suggested that immediately
requiring personal details to be divulged might inhibit or restrict subsequent responses.
The pilot study and accompanying analysis for this newly devised questionnaire
showed good overall reliability. For the personality / behaviour component of the
questionnaire only the first five questions were found to be reliable based on test-retest
processes. Despite this finding, the remaining eleven questions were not deleted from
the final version of the questionnaire as it was believed that these questions could also
provide a basis for descriptive statistics. If reliability is found to be low in the main
study, this would be a limitation of this tool. It was concluded that there was a strong
statistical correlation (α = 0.86) between stress and burnout (p<0.05) which suggests
that nurses and midwives experiences of stress may increase burnout levels.
Meticulous attention to appropriate piloting strategies identified weaknesses in
the original questionnaire discussed in this paper. If not addressed, questions regarding
coding, classifying, analysing and discussing subsequent findings could be expected.
One of the limitations of this tool include the questions with low correlation co-
efficients. The sample size of the pilot survey would probably not be indicative of the

14
general population, but increased numbers in the main study could address this issue.
The effects or reasons for non-responders cannot be analyzed as the researcher was
unaware as to who was given the questionnaires. A forty-nine per cent return rate was
considered adequate for this pilot study, but nonresponse bias needs to be considered
(Polit & Hungler, 1997). Those who returned anonymous questionnaires, but did not
want to participate in the second test were of varying characteristics to those who
participated. They were mostly in the aged care, neonatal or midwifery professions and
had worked in the profession anywhere from two to forty-one years.
The final questionnaire was distributed to 1366 Australian nurses and midwives
and ultimately achieved a forty-one per cent response rate. The time, cost and energy to
reach the distribution and collection stage of this research project warranted careful
piloting as described here. It is expected that the findings will include information
useful to the nursing and midwifery professions, as well as employers in the Australian
health care industry.
CONCLUSION
The pilot study associated with the development of a new questionnaire
demonstrated that it is possible to construct a reliable instrument to assess nurses’ and
midwives’ perceptions of stress and burnout in their working environment.
Comprehensive attention to careful survey development, adequate feedback from
appropriately selected pilot respondents and detailed adherance to high quality piloting
principles and strategies yielded significant information that informed the final survey.
Future studies with this instrument, on bigger populations and in different cultural and
socio-economic settings are needed to develop a generalized conclusion about this
questionnaire as well as on nurses’ and midwives’ perceptions of stress and burnout.

15
REFERENCE LIST
Dempsey, P. A. & Dempsey, A.D. (1992). Nursing research with basic statistical
applications. Boston, Jones & Bartlett Publishers.
Field, A. (2005). Discovering Statistics using SPPS. London, SAGE Publications.
Goldberg, D. (1978). Manual of the General Health Questionnaire. Windsor, NFER-
Wilson.
Hundley, V. & van Teijlingen, E. (2002). "The role of pilot studies in midwifery
research." Midwives 5(11): 372-374.
Jewell, L. & Siegall, M. (1990). Contemporary Industrial Organisational Psychology.
St Paul, New York, West Publishing Company.
Kline, P. (1999). The handbook of psychological testing. London, Routledge.
Maslach, C. & Jackson, S.E. (1981). The measurement of experienced burnout. The
international library of Clinical Writings in psychology 1 Industrial and
organizational psychology. Cooper, C. L. New York, New York University.
Norbeck, J. S. (1985). "What constitutes a publishable report of instrument
development?" Nursing Research 34(6): 380-381.
Polit, D. F. & Hungler, B.P. (1997). Essentials of Nursing Research. Philadelphia,
Lippincott.
Stevens, J. (1992). Applied Multivariate Statistics for the Social Sciences. Hillsdale,
New Jersey, Lawrence Erlbaum Associates, Inc.
Stordeur, S., D'Hoore, W, & Vandenberghe, C. (2001). "Leadership, organizational
stress, and emotional exhaustion among hospital nursing staff." Journal of
Advanced Nursing 35(4): 533-542.
Waltz, C. F., Strickland, O.L. & Lenz, E.R. (1991). Measurement in Nursing Research.
Philadelphia, F.A. Davis Company.

16
Table 1
Stress / burnout and personality / behaviour subscales / indices
Subscales Questions / Indices
Work environment Frequency of stress / 0-4
Excessive workload / 0-4
Rush to complete tasks / 0-4
Finishing late / 0-4
Treated with respect by clients / 0-4
Organizational support / 0-4
Work colleagues unsupportive / 0-4
Expectation of “stress” free environment / 0-2
Burnout Apathy / 0-4
Low morale / 0-4
Feeling undervalued / 0-4
Feeling overwhelmed / 0-4
Feelings of incompetence / 0-4
Increasing anxiety / 1-6
Fatigue / 1-5
Emotionally drained / 1-5
Loss of empathy for colleagues / 0-2
Loss of empathy for clients / 0-2
Burnout unavoidable / 0-2
Control Powerlessness / 0-4
Decision-making / 0-4
Motivated by maintaining control / 0-4
Job satisfaction Suited to work / 0-4
Enjoying type of work / 0-4
Change area of practice / 0-3
Leave professional discipline / 0-3
Frequency of job dissatisfaction / 0-7
Psychosocial stressors and symptoms Sleeplessness / 1-6
Depression / 1-6
Frequency of sleeplessness / 1-5
Headaches / 1-5
Stress considered healthy / 0-2
Stress requiring treatment / 0-7
Mental health leave / 0-6
Helplessness / 1-7
Frequency of depression / 0-6
Length of holiday / 0-8
Personality / behaviour (all indices 0-4) Working independently
Achieving more than time allows
Expect more than reasonably possible
Irritability
Pushed for time
Difficulty slowing down for procedures
Working at high performance
Arriving early for appointments
Reporting sick if unwell
Continuing work if unwell
Keyed up on most days
Tendency to perform many tasks
Constantly looking for challenge
Strong sense of commitment
Reactions when irritable
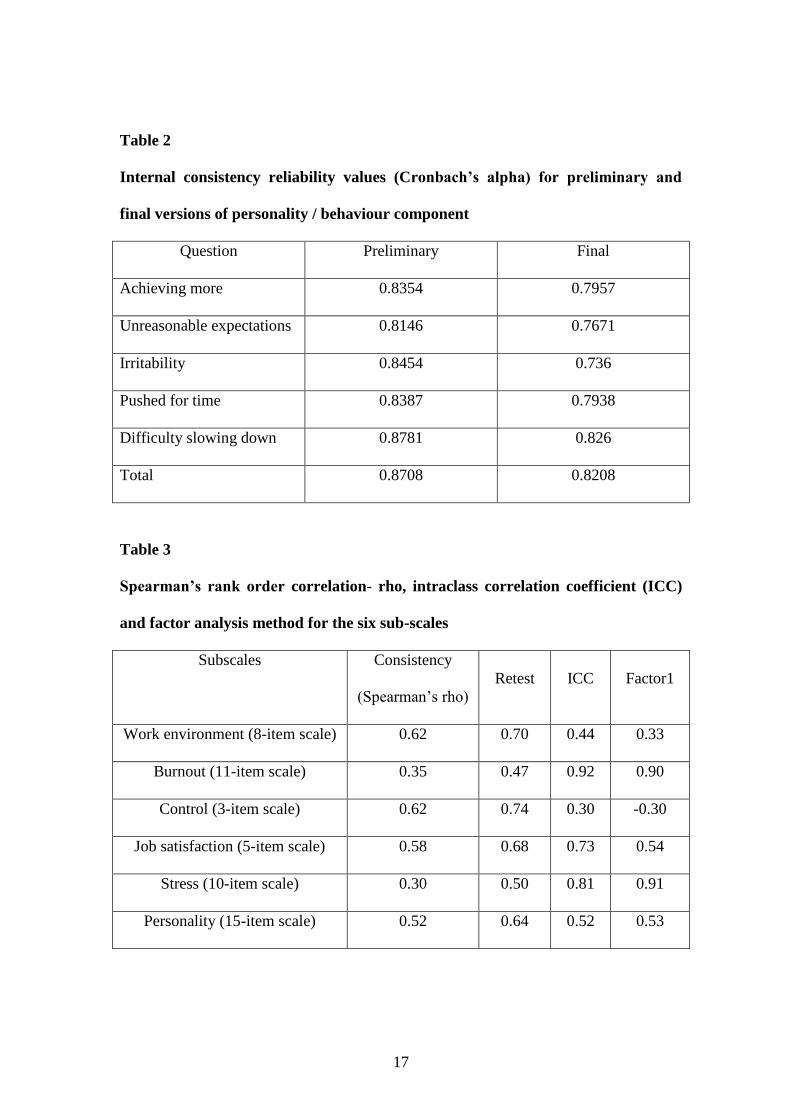
17
Table 2
Internal consistency reliability values (Cronbach’s alpha) for preliminary and
final versions of personality / behaviour component
Question Preliminary Final
Achieving more 0.8354 0.7957
Unreasonable expectations 0.8146 0.7671
Irritability 0.8454 0.736
Pushed for time 0.8387 0.7938
Difficulty slowing down 0.8781 0.826
Total 0.8708 0.8208
Table 3
Spearman’s rank order correlation- rho, intraclass correlation coefficient (ICC)
and factor analysis method for the six sub-scales
Subscales Consistency
(Spearman’s rho)
Retest ICC Factor1
Work environment (8-item scale) 0.62 0.70 0.44 0.33
Burnout (11-item scale) 0.35 0.47 0.92 0.90
Control (3-item scale) 0.62 0.74 0.30 -0.30
Job satisfaction (5-item scale) 0.58 0.68 0.73 0.54
Stress (10-item scale) 0.30 0.50 0.81 0.91
Personality (15-item scale) 0.52 0.64 0.52 0.53

1
Appendix 6 Logistic regression calculations
The data lent itself to predicting outcomes of individual responses to stress and
burnout and depending upon other aspects such as education, age, hours worked,
years in profession and living arrangements.
1. Statistically significant findings
Statistically significant findings were found in relation to individual responses to
stress and burnout.
1.1. Stress
In relation to stress, different variables predict whether respondents are more likely to
experience sleeplessness and take “mental health” leave. In particular respondents
were:
more likely to experience sleeplessness if they worked longer hours (p<0.01)
and
less likely to take “mental health” leave if they were older (p<0.0001), the
longer they worked in the profession (p<0.01) and if they lived alone (p =
0.05).
The following section presents more detailed information relating to stress concerning
experiencing sleeplessness and taking “mental health” leave.

2
1.1.1. Experiencing sleeplessness (hours worked)
The results using the categorical predictor variables and the continuous predictor
hours worked for the question, “Have you experienced sleeplessness in relation to
work?” will be displayed. The categorical variable results are displayed in Table 1.
Table 1 shows that when experiencing sleeplessness in relation to work with hours
worked as the predictor, 41.7 per cent were fulltimers, 47 per cent of nurses and
midwives possessed a degree and 12.1 per cent lived alone. This means that when
using hours worked as the predictor in the equation for logistic regression, over two-
fifths (41.7%) experiencing sleeplessness worked fulltime, almost half (47%)
experiencing sleeplessness possessed a degree and a minority (12.1%) experiencing
sleeplessness lived alone.
Table 1 Categorical Variable Results for Experiencing Sleeplessness in Relation
to Work with Hours Worked as Continuous Predictor
Categorical results for Have you experienced sleeplessness in relation
to work?
Predictor- hours worked
Fulltime Yes Number = 211 41.7%
N = 506 No Number = 295 58.3%
Possesses a degree Yes Number = 238 47.0%
N = 506 No Number = 268 53.0%
Live alone Yes Number = 61 12.1%
N = 506 No Number = 445 87.9%

3
The first analysis was calculated on a forward stepwise method, so the initial model
was derived using the constant, “Have you experienced sleeplessness in relation to
work?”, in the logistic regression equation (Table 2). Therefore, in this calculation all
of the predictor variables were omitted. If predictions were that all nurses and
midwives did experience sleeplessness in relation to work, it was predicted that this
would be correct 189 times out of 506, that is, 37.4 per cent. If the prediction was that
all nurses and midwives did not experience sleeplessness in relation to work, this
prediction would be correct 317 times out of 506, that is, 62.6 per cent.
Table 2
Predictions for Experiencing Sleeplessness with Only the Constant in the Model
Question: Have you experienced sleeplessness in relation to work?
Prediction correct for
experiencing sleeplessness
in relation to work
189 / 506 N = 506 37.4%
Prediction correct for not
experiencing sleeplessness
in relation to work
317 / 506 N = 506 62.6%

4
The next calculation included the categorical predictor variables and the continuous
predictor hours worked for the question, “Have you experienced sleeplessness in
relation to work?” Parameter codings were assigned to the categorical variables to
determine the probability of outcome variables (Table 3).
Table 3 Categorical Variable Codings for “Have you experienced sleeplessness in
relation to work?” with Hours Worked as Continuous Predictor
Predictor- hours worked Parameter coding
Category Frequency (1)
Fulltime No 295 1
Yes 211 0
Possesses a degree No 268 1
Yes 238 0
Live alone No 445 0
Yes 61 1
As hours worked was the highest score statistic (Table 4) compared to the other
variables, this was entered into the model.
Table 4 Variables Not in the Equation (when only constant used) for “Have you
experienced sleeplessness in relation to work?” in Calculation with Hours
Worked as Continuous Predictor
Predictor- hours worked Score df Sig.
Variables Step 0 Fulltime (1) 1.799 1 0.180
Qualifications (1) 1.263 1 0.261
Live alone (1) 2.167 1 0.141
Hours worked 11.707 1 0.001
Overall statistics 14.613 4 0.006

5
The following results indicate how well this model predicts group classification. The
significance of the models are displayed in the following tables (Tables 5, 6 & 7). The
model for predicting sleeplessness with significant variables is displayed in Table 5.
The model for hours worked (step one) (Table 5) correctly categorises 310 who do not
experience sleeplessness and misclassifies seven (correctly classifies 97.8% of cases).
For those who do experience sleeplessness, the model correctly categorises ten and
misclassifies 179 (correctly classifies 5.3% of cases). When the constant was used
only, the model correctly categorised 62.6 per cent of cases and now with hours
worked added into the equation, the model correctly classifies 63.2 per cent of cases.
For this question, people who work longer hours, are more likely to experience
sleeplessness at the p<0.01 level, which was statistically significant. The other
continuous predictors, age and years in the profession, were insignificant.
Table 5 Model for Predicting Sleeplessness with Significant Variables Included
Observed
N = 506
Predicted
no
Predicted
yes
Percentage correct
Sleeplessnessa no 310 7 97.8%
Sleeplessnessa
yes 179 10 5.3%
Overall percentage 63.2% a Step one- Hours worked
In Table 6, for hours worked, the B value is positive denoting that if the person works
longer hours, they are more likely to experience sleeplessness, which is statistically
significant at the p<0.01 level. The standard errors of the mean for these values are
0.308 and 0.008, respectively.

6
The Wald statistic is considerably different from 0 (Table 6), the predictor making a
substantial contribution to predicting the outcome. The degree of freedom (df) is
equal to 1 which relates to number of observations able to vary (Field, 2005). The exp
b (1.028) for hours worked is the value of the odds ratio which is only a guess or point
estimate of the true value, given the sample data. If the person works longer hours, the
odds for sleeplessness is 1.028 times higher than for someone working less hours. The
confidence interval (95% CI) is more accurate for the variable hours worked meaning
that there is 95 per cent confidence that the value of the odds ratio in this sample
population lies between 1.012 and 1.046.
Table 6 Significance of Model for Sleeplessness with Hours Worked as
Continuous Predictor
N=506 B(SE) Wald df exp b 95% CI
Included Predictor- hours worked
Constant -1.488* 23.355 1 0.226
(0.308)
Hours workeda 0.028** 11.097 1 1.028 1.012 to 1.046
(0.008)
*p<0.001. **p<0.01. a Variable entered on step one.

7
In Table 7, the initial -2 Log likelihood equals 668.731, which assesses the overall fit
of the model when only the constant is included. The overall final fit of the model
equals the second -2 Log likelihood which is 657.035. The difference in these scores
equals the chi-square which is 11.696 (p<0.01) indicating a good fit of the model.
This is the value between the initial model and the second model. This shows that
more hours worked significantly predicts sleeplessness better than when only
sleeplessness was used on its own in the model. The R2 value for the Hosmer and
Lemeshow (1989) is .02 which is the value of the chi-square divided by the original -2
log likelihood. The R2 for the Cox and Snell (1989) and the Nagelkirke (1991) values
are .023 and .031 for hours worked. This suggests that between 2.3 and 3.1 per cent of
variability is explained by the outcome (dependent) variable when hours worked is
built into the model.
Table 7 Significance of Model with Hours Worked as Continuous Predictor
Demonstrating -2 Log Likelihood & Chi-square
Initial -2 Log
likelihood
2nd
-2 Log
likelihood
Chi-square Degrees of freedom
668.731a 657.035 11.696 (p<.01) 1
R2 = .02 (Hosmer & Lemeshow), .023 (Cox & Snell), .031 (Nagelkerke).
a Step one (hours).
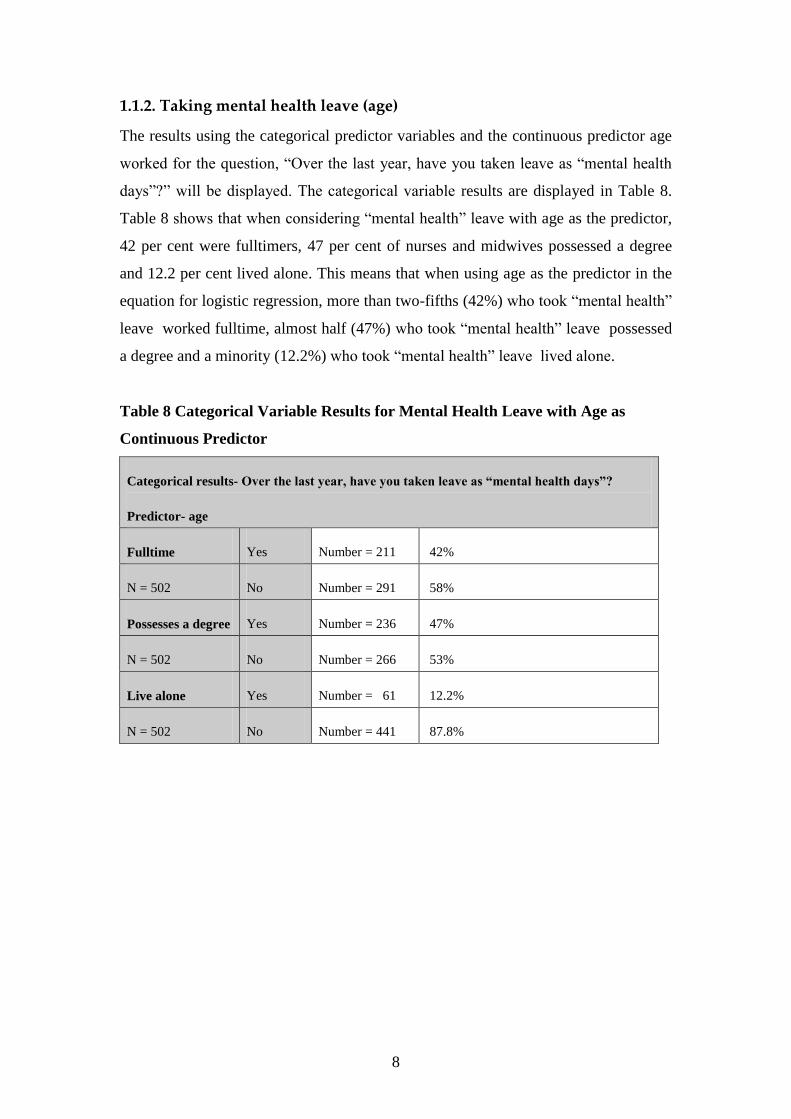
8
1.1.2. Taking mental health leave (age)
The results using the categorical predictor variables and the continuous predictor age
worked for the question, “Over the last year, have you taken leave as “mental health
days”?” will be displayed. The categorical variable results are displayed in Table 8.
Table 8 shows that when considering “mental health” leave with age as the predictor,
42 per cent were fulltimers, 47 per cent of nurses and midwives possessed a degree
and 12.2 per cent lived alone. This means that when using age as the predictor in the
equation for logistic regression, more than two-fifths (42%) who took “mental health”
leave worked fulltime, almost half (47%) who took “mental health” leave possessed
a degree and a minority (12.2%) who took “mental health” leave lived alone.
Table 8 Categorical Variable Results for Mental Health Leave with Age as
Continuous Predictor
Categorical results- Over the last year, have you taken leave as “mental health days”?
Predictor- age
Fulltime Yes Number = 211 42%
N = 502 No Number = 291 58%
Possesses a degree Yes Number = 236 47%
N = 502 No Number = 266 53%
Live alone Yes Number = 61 12.2%
N = 502 No Number = 441 87.8%
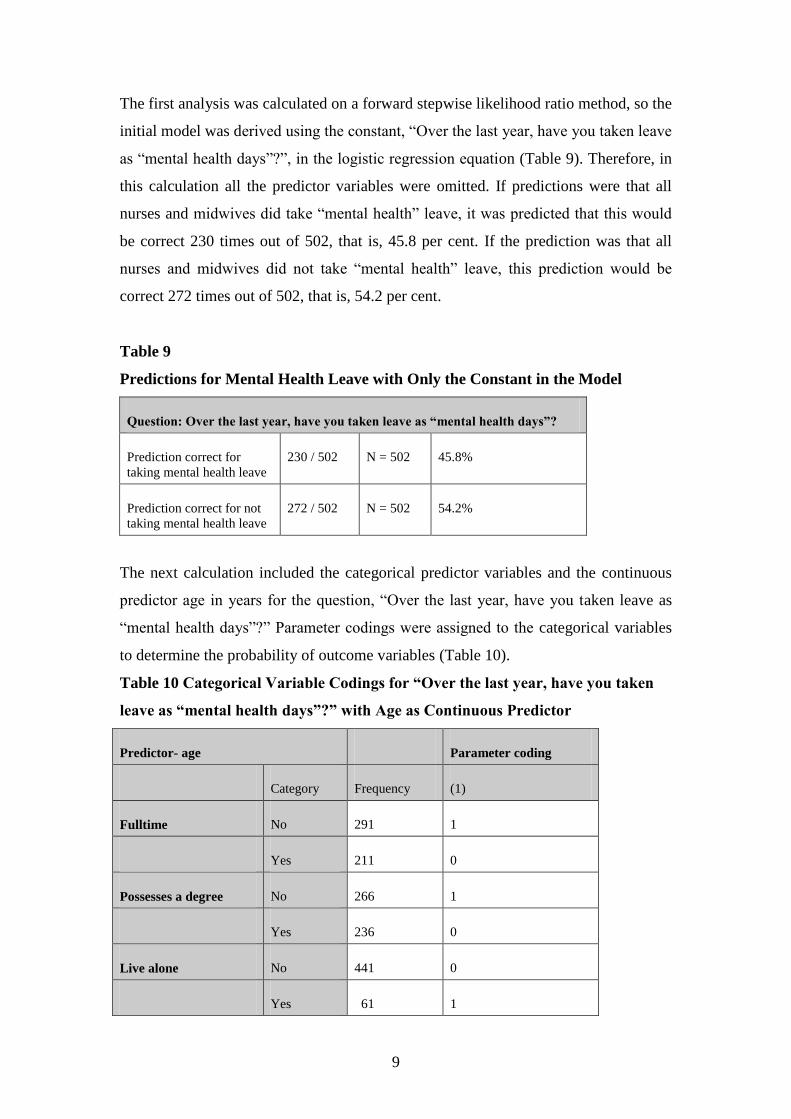
9
The first analysis was calculated on a forward stepwise likelihood ratio method, so the
initial model was derived using the constant, “Over the last year, have you taken leave
as “mental health days”?”, in the logistic regression equation (Table 9). Therefore, in
this calculation all the predictor variables were omitted. If predictions were that all
nurses and midwives did take “mental health” leave, it was predicted that this would
be correct 230 times out of 502, that is, 45.8 per cent. If the prediction was that all
nurses and midwives did not take “mental health” leave, this prediction would be
correct 272 times out of 502, that is, 54.2 per cent.
Table 9
Predictions for Mental Health Leave with Only the Constant in the Model
Question: Over the last year, have you taken leave as “mental health days”?
Prediction correct for
taking mental health leave
230 / 502 N = 502 45.8%
Prediction correct for not
taking mental health leave
272 / 502 N = 502 54.2%
The next calculation included the categorical predictor variables and the continuous
predictor age in years for the question, “Over the last year, have you taken leave as
“mental health days”?” Parameter codings were assigned to the categorical variables
to determine the probability of outcome variables (Table 10).
Table 10 Categorical Variable Codings for “Over the last year, have you taken
leave as “mental health days”?” with Age as Continuous Predictor
Predictor- age Parameter coding
Category Frequency (1)
Fulltime No 291 1
Yes 211 0
Possesses a degree No 266 1
Yes 236 0
Live alone No 441 0
Yes 61 1

10
As age was the highest score statistic (Table 11) compared to the other variables, this
was entered into the model.
Table 11 Variables Not in the Equation (when only constant used) for “Over the
last year, have you taken leave as “mental health days”?” in Calculation Using
Age as Continuous Predictor
Predictor- age Score df Sig.
Variables Step 0 Fulltime (1) 1.318 1 0.251
Qualifications (1) 1.521 1 0.217
Live alone (1) 2.753 1 0.097
Age 17.308 1 0.000
Overall statistics 21.430 4 0.000
The model for predicting taking “mental health” leave with significant variables is
displayed in Table 12. The model for age (step one) (Table 12) correctly categorises
208 who do not take “mental health” leave and misclassifies 64 (correctly classifies
58.6% of cases). For those who do take “mental health” leave, the model correctly
categorises 86 and misclassifies 144 (correctly classifies 58.6% of cases). When the
constant was used only, the model correctly categorised 54.2 per cent of cases and
now with age added into the equation, the model correctly classifies 58.6 per cent of
cases.
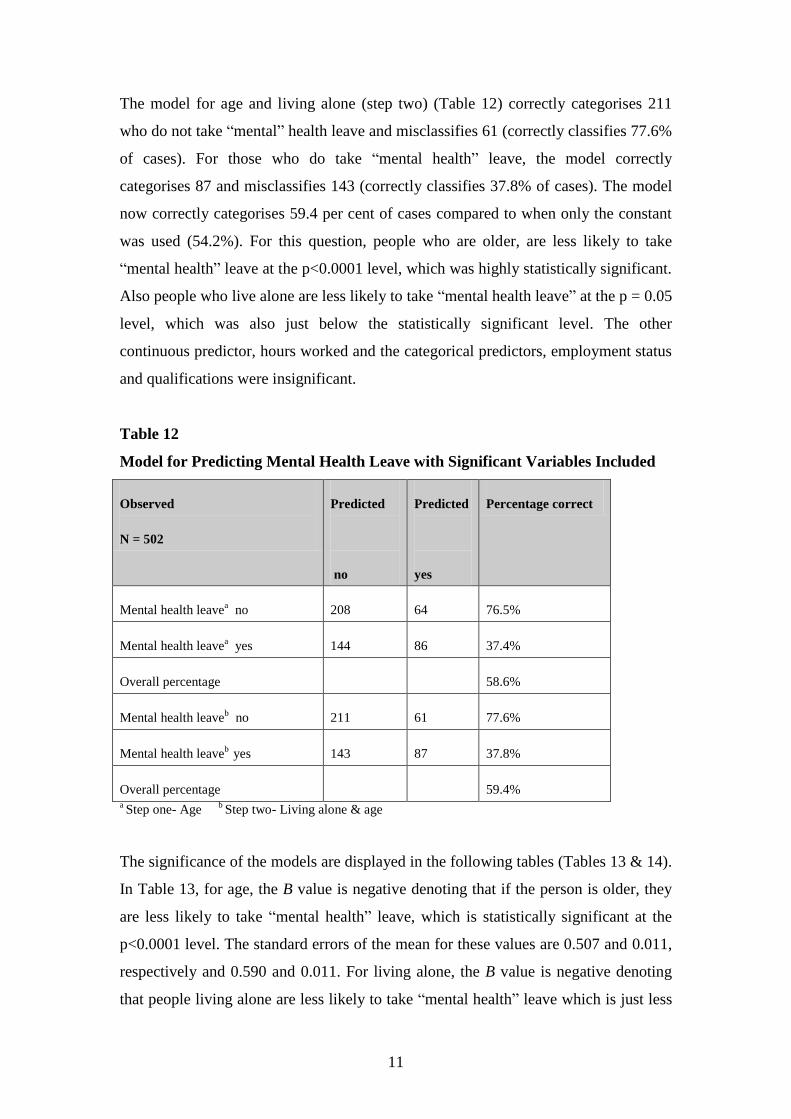
11
The model for age and living alone (step two) (Table 12) correctly categorises 211
who do not take “mental” health leave and misclassifies 61 (correctly classifies 77.6%
of cases). For those who do take “mental health” leave, the model correctly
categorises 87 and misclassifies 143 (correctly classifies 37.8% of cases). The model
now correctly categorises 59.4 per cent of cases compared to when only the constant
was used (54.2%). For this question, people who are older, are less likely to take
“mental health” leave at the p<0.0001 level, which was highly statistically significant.
Also people who live alone are less likely to take “mental health leave” at the p = 0.05
level, which was also just below the statistically significant level. The other
continuous predictor, hours worked and the categorical predictors, employment status
and qualifications were insignificant.
Table 12
Model for Predicting Mental Health Leave with Significant Variables Included
Observed
N = 502
Predicted
no
Predicted
yes
Percentage correct
Mental health leavea no 208 64 76.5%
Mental health leavea
yes 144 86 37.4%
Overall percentage 58.6%
Mental health leaveb no 211 61 77.6%
Mental health leaveb
yes 143 87 37.8%
Overall percentage 59.4% a Step one- Age
b Step two- Living alone & age
The significance of the models are displayed in the following tables (Tables 13 & 14).
In Table 13, for age, the B value is negative denoting that if the person is older, they
are less likely to take “mental health” leave, which is statistically significant at the
p<0.0001 level. The standard errors of the mean for these values are 0.507 and 0.011,
respectively and 0.590 and 0.011. For living alone, the B value is negative denoting
that people living alone are less likely to take “mental health” leave which is just less

12
than statistically significant at p = 0.05 level. The standard errors of the mean for
these values are 0.590 and 0.283, respectively.

13
The Wald statistics are considerably different from 0 (Table 13), the predictor making
a substantial contribution to predicting the outcome. The degrees of freedom (df) are
equal to 1 which relates to number of observations able to vary (Field, 2005). The exp
b (0.955 & 0.954) for age is the value of the odds ratio which is only a guess or point
estimate of the true value, given the sample data. If the person is older, the odds for
not taking “mental health” leave is 0.954 to 0.955 times higher than for someone
younger. The confidence interval (95% CI) is more accurate for the variable age
meaning that there is 95 per cent confidence that the value of the odds ratio in this
sample population lies between 0.933 and 0.976. The exp b (0.575) for living alone
means that if a person lives alone, the odds of taking “mental health” leave decreases
by a factor equalling or 0.575, all factors being equal. The confidence interval (95%
CI) is more accurate for the variable living alone, being between 0.330 and 1.001.
Table 13 Significance of Model for Mental Health Leave with Age as Continuous
Predictor
N=502 B(SE) Wald df exp b 95% CI
Included Predictor- age
Constant 1.875* 13.686 1 6.522
(0.507)
Agea -0.046* 16.735 1 0.955 0.935 to 0.976
(0.011)
Live aloneb -0.553** 3.826 1 0.575 0.330 to 1.001
(0.283)
Ageb
-0.047* 17.750 1 0.954 0.933 to 0.975
(0.011)
Constant 2.440* 17.086 1 11.478
(0.590)
*p<0.0001. ** p = 0.05. a Variable entered on step one.
b Variables entered on step two.

14
In Table 14, the initial -2 Log likelihood equals 692.402, which assesses the overall fit
of the model when only the constant is included. The initial -2 Log likelihood for
living alone equals 674.856. The overall final fits of the model equal the second -2
Log likelihoods which are 674.856 and 670.987. The difference in these scores equals
the chi-squares which are 17.546 (p<0.0001) and 0.049 (p<0.05) indicating a good fit
of the model. This is the value between the initial model and the second model. This
shows that being older and living alone significantly predicts not taking “mental
health” leave better than when only taking “mental health” leave was used on its own
in the model. The R2 value for the Hosmer and Lemeshow (1989) is .03 and .01 which
is the value of the chi-square divided by the original -2 log likelihood, for both steps.
The R2 for the Cox and Snell (1989) and the Nagelkirke (1991) values are .034 and
.046 for age and .042 and .056 for living alone. This suggests that between 3.4 and 4.6
per cent of variability is explained by the outcome (dependent) variable when age is
built into the model and between 4.2 and 5.6 when living alone is built into the model.
Table 14 Significance of Model for Mental Health Leave with Age as Continuous
Predictor Demonstrating -2 Log Likelihood & Chi-square
Initial -2 Log
likelihood
2nd
-2 Log
likelihood
Chi-square Degrees of freedom
692.402a 674.856 17.546 (p<0.0001) 1
674.856b 670.987 3.869 (p<0.05) 1
R2 = .03 & .01 (Hosmer & Lemeshow), .034 & .042 (Cox & Snell), .046 & .056 (Nagelkerke).
a Step
one (qualifs). b Step two (live alone).

15
1.1.3. Taking mental health leave (years in profession)
The next calculation used the same question and the categorical variable results are
displayed in Table 15. The continuous predictor years in profession was used for this
analysis. Table 15 shows that when considering “mental health” leave with years in
profession as the predictor, 42.1 per cent were fulltimers, 47.2 per cent of nurses and
midwives possessed a degree and 11.9 per cent lived alone. This means that when
using hours worked as the predictor in the equation for logistic regression, over two-
fifths (42.1%) who took “mental health” leave worked fulltime, almost half (47.2%)
who took “mental health” leave possessed a degree and a minority (11.9%) who took
“mental health” leave lived alone.
Table 15 Categorical Variable Results for Mental Health Leave with Years in
Profession as Continuous Predictor
Categorical results- Over the last year, have you taken leave as “mental health days”?
Predictor- years in profession
Fulltime Yes Number = 212 42.1%
N = 504 No Number = 292 57.9%
Possesses a degree Yes Number = 238 47.2%
N = 504 No Number = 266 52.8%
Live alone Yes Number = 60 11.9%
N = 504 No Number = 444 88.1%

16
The first analysis was calculated on a forward stepwise method, so the initial model
was derived using the constant, “Have you taken leave as “mental health days”?”, in
the logistic regression equation. Therefore, in this calculation all of the predictor
variables were omitted. If predictions were that all nurses and midwives did take
“mental health” leave, it was predicted that this would be correct 230 times out of
504, that is, 45.6 per cent. If the prediction was that all nurses and midwives did not
take “mental health” leave, this prediction would be correct 274 times out of 504, that
is, 54.4 per cent (Table 16).
Table 16 Predictions for Taking Mental Health Leave with Only the Constant in
the Model
Question: Over the last year, have you taken leave as “mental health days”?
Prediction correct for
taking mental health leave
230 / 504 N = 504 45.6%
Prediction correct for not
taking mental health leave
274 / 504 N = 504 54.4%

17
The next calculation included the categorical predictor variables and the continuous
predictor years in profession for the question, “Over the last year, have you taken
leave as “mental health days”?” Parameter codings were assigned to the categorical
variables to determine the probability of outcome variables (Table 17).
Table 17 Categorical Variable Codings for “Over the last year, have you taken
leave as “mental health days”?” with Years in Profession as Continuous
Predictor
Predictor- Years in profession Parameter coding
Frequency (1)
Fulltime No 292 0
Yes 212 1
Possesses a degree No 266 1
Yes 238 0
Live alone No 444 1
Yes 60 0
As years in profession was the highest score statistic (Table 18) compared to the other
variables, this was entered into the model.
Table 18 Variables Not in the Equation (when only constant used) for “Over the
last year, have you taken leave as “mental health days”?” in Calculation with
Years in Profession as Continuous Predictor
Predictor- years in profession Score df Sig.
Variables Step 0 Fulltime 1.284 1 0.257
Qualifications (1) 1.752 1 0.186
Live alone (1) 2.408 1 0.121
Years in profession 10.718 1 0.001
Overall statistics 14.114 4 0.007

18
The following results (Tables 19, 20 & 21) indicate how well this model predicts
group classification. The model for years in profession (step one) (Table 19) correctly
categorises 205 who do not take “mental health” leave and misclassifies 69 (correctly
classifies 74.8% of cases). For those who do take “mental health” leave, the model
correctly categorises 76 and misclassifies 154 (correctly classifies 33% of cases).
When the constant was used only, the model correctly categorised 54.4 per cent of
cases and now with qualifications added into the equation, the model correctly
classifies 55.8 per cent of cases. For this question, people who have spent more years
in the profession, are less likely to take “mental health” leave at the p<0.01 level,
which was statistically significant. The other continuous predictor, hours worked and
the categorical predictors, employment status and qualifications were insignificant.
Table 19
Model for Predicting Mental Health Leave with Significant Variables Included
Observed
N=504
Predicted
no
Predicted
yes
Percentage correct
Mental health leavea no 205 69 74.8%
Mental health leavea
yes 154 76 33.0%
Overall percentage 55.8% a Step one- Years in profession
The significance of the models are displayed in the following tables (Tables 20 & 21).
In Table 20, for years in profession, the B value is negative denoting that the longer
the person works in the profession, they are less likely to take “mental health” leave,
which is statistically significant at the p<0.01 level. The standard errors of the mean
for these values are 0.224 and 0.009, respectively.

19
The Wald statistics are considerably different from 0 (Table 20), the predictor making
a substantial contribution to predicting the outcome. The degrees of freedom (df) are
equal to 1 which relates to number of observations able to vary (Field, 2005). The exp
b (0.97) for years in profession is the value of the odds ratio which is only a guess or
point estimate of the true value, given the sample data. If the person works longer in
the profession, the odds for not taking “mental health” leave is 0.97 times higher than
for someone working less years. The confidence interval (95% CI) is more accurate
for the variable years in the profession meaning that there is 95 per cent confidence
that the value of the odds ratio in this sample population lies between 0.952 and
0.988.
Table 20 Significance of Model for Taking Mental Health Leave with Years in
Profession as Continuous Predictor
N=504 B(SE) Wald df exp b 95% CI
Included Predictor- years in profession
Constant 0.493* 4.842 1 1.638
(0.224)
Years in
professiona
-0.031** 10.532 1 0.970 0.952 to 0.988
(0.009)
*p<0.05. **p<0.01. a Variable entered on step one.

20
In Table 21, the initial -2 Log likelihood equals 694.846, which assesses the overall fit
of the model when only the constant is included. The overall final fit of the model
equals the second -2 Log likelihood which is 684.058. The difference in these scores
equals the chi-square which is 10.788 (p<0.01) indicating a good fit of the model.
This is the value between the initial model and the second model. This shows that
years in profession significantly predicts not taking “mental health” leave better than
when only taking “mental health” leave was used on its own in the model. The R2
value for the Hosmer and Lemeshow (1989) is .02 which is the value of the chi-square
divided by the original -2 log likelihood. The R2 for the Cox and Snell (1989) and the
Nagelkirke (1991) values are .021 and .028 for years in profession. This suggests that
between 2.1 and 2.8 per cent of variability is explained by the outcome (dependent)
variable when years in profession is built into the model.
Table 21 Significance of Model for Taking Mental Health Leave with Years in
Profession as Continuous Predictor Demonstrating -2 Log Likelihood & Chi-
square
Initial -2 Log
likelihood
2nd
-2 Log
likelihood
Chi-square Degrees of
freedom
694.846a 684.058 10.788 (p<0.01) 1
R2 = .02 (Hosmer & Lemeshow), .021 (Cox & Snell), .028 (Nagelkerke).
a Step one (years in
profession).
1.2. Burnout
In relation to overall burnout levels, the data suggest that the respondents were:
more likely to experience burnout if the person worked longer hours (p<0.01).
The following section presents more detailed information relating to burnout in regard
to working longer hours.

21
1.2.1. Burnout level (hours worked)
The results using the categorical predictor variables and the continuous predictor
hours worked for the overall burnout level will be displayed. The categorical variable
results are displayed in Table 22. Table 22 shows that when experiencing high
burnout levels in relation to work with hours worked as the predictor, 42.8 per cent
were fulltimers, 46.2 per cent of nurses and midwives possessed a degree and 11.8 per
cent lived alone. This means that when using hours worked as the predictor in the
equation for logistic regression, over two-fifths (42.8%) experiencing moderate to
high levels of burnout worked fulltime, almost half (46.2%) experiencing moderate to
high levels of burnout possessed a degree and a minority (11.8%) experiencing
moderate to high levels of burnout lived alone.
Table 22 Categorical Variable Results for Burnout Levels in Relation to Work
with Hours Worked as Continuous Predictor
Categorical results for Burnout Levels
Predictor- hours worked
Fulltime Yes Number = 210 42.8%
N = 491 No Number = 281 57.2%
Possesses a degree Yes Number = 227 46.2%
N = 491 No Number = 264 53.8%
Live alone Yes Number = 58 11.8%
N = 491 No Number = 433 88.2%

22
The first analysis was calculated on a forward stepwise method, so the initial model
was derived using burnout level as the constant, in the logistic regression equation
(Table 23). Therefore, in this calculation all of the predictor variables were omitted. If
predictions were that all nurses and midwives experienced high burnout levels in
relation to work, it was predicted that this would be correct 274 times out of 491, that
is, 55.8 per cent. If the prediction was that all nurses and midwives experienced low
burnout levels in relation to work, this prediction would be correct 217 times out of
491, that is, 44.2 per cent.
Table 23 Predictions for Burnout Levels with Only the Constant in the Model
Burnout levels in relation to work
Prediction correct for high
burnout level in relation to
work
274 / 491 N = 491 55.8%
Prediction correct for low
burnout level in relation to
work
217 / 491 N = 491 44.2%
The next calculation included the categorical predictor variables and the continuous
predictor age for burnout levels. Parameter codings were assigned to the categorical
variables to determine the probability of outcome variables (Table 24).
Table 24 Categorical Variable Codings for Burnout Levels with Hours Worked
as Continuous Predictor
Predictor- hours worked Parameter coding
Category Frequency (1)
Fulltime No 281 0
Yes 210 1
Possesses a degree No 264 1
Yes 227 0
Live alone No 433 1
Yes 58 0

23
As hours worked was the highest score statistic (Table 25) compared to the other
variables, these were entered into the model.
Table 25 Variables Not in the Equation (when only constant used) for Burnout
Levels in Calculation with Hours Worked as Continuous Predictor
Predictor- hours worked Score df Sig.
Variables Step 0 Fulltime (1) 0.490 1 0.484
Qualifications (1) 0.367 1 0.545
Live alone (1) 0.032 1 0.858
Hours worked 7.618 1 0.006
Overall statistics 10.452 4 0.033

24
The following results (Tables 26, 27 & 28) indicate how well this model predicts
group classification. The model for hours worked (step one) (Table 26) correctly
categorises 60 who experience low burnout levels and misclassifies 157 (correctly
classifies 27.6% of cases). For those experiencing moderate to high burnout levels,
the model correctly categorises 217 and misclassifies 57 (correctly classifies 79.2% of
cases). When the constant was used only, the model correctly categorised 55.8 per
cent of cases and now with hours worked added into the equation, the model correctly
classifies 56.4 per cent of cases. For this question, people who work longer hours, are
more likely to experience moderate to high burnout levels at the p<0.01 level, which
was statistically significant. The other continuous predictors, age and years in the
profession and the categorical predictors, employment status, qualifications and living
alone were insignificant.
Table 26
Model for Predicting Burnout Levels with Significant Variables Included
Observed
N=491
Predicted
low
Predicted
high
Percentage correct
Burnout levela low 60 157 27.6%
Burnout levela
high 57 217 79.2%
Overall percentage 56.4% a Step one- Hours worked
The significance of the models are displayed in the following tables (Tables 27 & 28).
In Table 27, for hours worked, the B value is positive denoting that the more hours the
person has worked, the more likely they are to experience moderate to high burnout
levels, which is statistically significant at the p<0.01 level. The standard errors of the
mean for these values are 0.316 and 0.009, respectively.

25
The Wald statistics are considerably different from 0 (Table 27), the predictor making
a substantial contribution to predicting the outcome. The degrees of freedom (df) are
equal to 1 which relates to number of observations able to vary (Field, 2005). The exp
b (1.025) for hours worked is the value of the odds ratio which is only a guess or point
estimate of the true value, given the sample data. If the person works longer hours, the
odds for experiencing moderate to high burnout levels is 1.025 times higher than for
someone who works less hours. The confidence interval (95% CI) is more accurate
for the variable hours worked meaning that there is 95 per cent confidence that the
value of the odds ratio in this sample population lies between 1.007 and 1.043.
Table 27 Significance of Model for Burnout Levels with Hours Worked as
Continuous Predictor
N=488 B(SE) Wald df exp b 95% CI
Included Predictor- hours worked
Constant -0.597* 0.5623 1 0.550
(0.316)
Hours workeda 0.025** 7.427 1 1.025 1.007 to 1.043
(0.009)
*p=0.059. **p<0.01. a Variable entered on step one.

26
In Table 28, the initial -2 Log likelihood equals 674.038, which assesses the overall fit
of the model when only the constant is included. The overall final fit of the model
equals the second -2 Log likelihood which is 666.252. The difference in these scores
equals the chi-square which is 7.786 (p<0.01) indicating a good fit of the model. This
is the value between the initial model and the second model. This shows that hours
worked significantly predicts experiencing burnout better than when only
experiencing burnout was used on its own in the model. The R2 value for the Hosmer
and Lemeshow (1989) is .01 which is the value of the chi-square divided by the
original -2 log likelihood. The R2 for the Cox and Snell (1989) and the Nagelkirke
(1991) values are .016 and .021 for hours worked. This suggests that between 1.6 and
2.1 per cent of variability is explained by the outcome (dependent) variable when
hours worked is built into the model.
Table 28 Significance of Model for Experiencing Burnout with Hours Worked as
Continuous Predictor Demonstrating -2 Log Likelihood & Chi-square
Initial -2 Log
likelihood
2nd
-2 Log
likelihood
Chi-square Degrees of freedom
674.038a 666.252 7.786 (p<0.01) 1
R2 = .01 (Hosmer & Lemeshow), .016 (Cox & Snell), .021 (Nagelkerke) .
a Step one (hours worked).
In relation to burnout, different variables predict whether respondents are more likely
to experience apathy, feel emotionally drained and lose empathy for colleagues or
clients. In particular, respondents were:
more likely to be apathetic when “stressed” if they worked longer hours
(p<0.01) and
less likely to feel emotionally drained at work if the person was older
(p<0.05) and more likely to feel emotionally drained at work if they worked
longer hours (p<0.01) and
less likely to lose empathy for colleagues if the person holds a degree or any
higher qualification (p<0.01) and less likely to lose empathy for colleagues
if they are living alone (p<0.05) and
less likely to lose empathy for clients if the person is older (p<0.01) and the
longer they worked in the profession (p<0.0001).

27
The following section presents more detailed information relating to burnout
concerning experiencing apathy, feeling emotionally drained and relationships with
colleagues and clients.
1.2.2. Apathy (hours worked)
The results using the categorical predictor variables and the continuous predictor
hours worked for experiencing apathy when “stressed” will be displayed. The
categorical variable results are displayed in Table 29. Table 29 shows that when
experiencing apathy when “stressed” with hours worked as the predictor, 42 per cent
were fulltimers, 46.4 per cent of nurses and midwives possessed a degree and 11.8 per
cent lived alone. This means that when using hours worked as the predictor in the
equation for logistic regression, over two-fifths (42%) experiencing apathy worked
fulltime, almost half (46.4%) experiencing apathy possessed a degree and a minority
(11.8%) experiencing apathy lived alone.
Table 29 Categorical Variable Results for Apathy with Hours Worked as
Continuous Predictor
Categorical results for Apathy
Predictor- hours worked
Fulltime Yes Number = 211 42.0%
N = 502 No Number = 291 58.0%
Possesses a degree Yes Number = 233 46.4%
N = 502 No Number = 269 53.6%
Live alone Yes Number = 59 11.8%
N = 502 No Number = 443 88.2%

28
The first analysis was calculated on a forward stepwise method, so the initial model
was derived using the constant, „apathy‟, in the logistic regression equation (Table
30). Therefore, in this calculation all of the predictor variables were omitted. If
predictions were that all nurses and midwives experienced apathy when “stressed”, it
was predicted that this would be correct 400 times out of 502, that is, 79.7 per cent. If
the prediction was that all nurses and midwives did not experience apathy when
“stressed”, this prediction would be correct 102 times out of 502, that is, 20.3 per
cent.
Table 30 Predictions for Apathy with Only the Constant in the Model
Apathy when “stressed”
Prediction correct for
experiencing apathy
400 / 502 N = 502 79.7%
Prediction correct for not
experiencing apathy
102 / 502 N = 502 20.3%
The next calculation included the categorical predictor variables and the continuous
predictor hours worked for apathy. Parameter codings were assigned to the categorical
variables to determine the probability of outcome variables (Table 31).
Table 31 Categorical Variable Codings for Apathy with Hours Worked as
Continuous Predictor
Predictor- hours worked Parameter coding
Category Frequency (1)
Fulltime No 291 0
Yes 210 1
Possesses a degree No 268 1
Yes 233 0
Live alone No 443 1
Yes 58 0

29
As hours worked was the highest score statistic (Table 32) compared to the other
variables, this was entered into the model.
Table 32 Variables Not in the Equation (when only constant used) for Apathy in
Calculation with Hours Worked as Continuous Predictor
Predictor- hours worked Score df Sig.
Variables Step 0 Fulltime (1) 3.975 1 0.046
Qualifications (1) 2.667 1 0.102
Live alone (1) 2.952 1 0.086
Hours worked 7.763 1 0.005
Overall statistics 10.803 4 0.029

30
The following results (Tables 33, 34 & 35) indicate how well this model predicts
group classification. The model for hours worked (step one) (Table 33) correctly
categorises no-one who does not experience apathy and misclassifies 102 (correctly
classifies 0% of cases). For those experiencing apathy, the model correctly categorises
400 and misclassifies no-one (correctly classifies 100% of cases). When the constant
was used only, the model correctly categorised 79.7 per cent of cases and now with
hours worked added into the equation, the model correctly classifies the same
percentage (79.7%) of cases. For this question, people who work longer hours, are
more likely to experience apathy when “stressed” at the p<0.01 level, which was
statistically significant. The other continuous predictors, age and years in the
profession and the categorical predictors, employment status, qualifications and living
alone were insignificant.
Table 33 Model for Predicting Apathy with Significant Variables Included
Observed
N=501
Predicted
no
Predicted
yes
Percentage correct
Apathya no 0 102 0.0%
Apathya
high 0 400 100.0%
Overall percentage 79.7%
a Step one- Hours worked
The significance of the models are displayed in the following tables (Tables 34 & 35).
In Table 34, for hours worked, the B value is positive denoting that the more hours the
person works, the more likely they are to experience apathy when “stressed”, which is
statistically significant at the p<0.01 level. The standard errors of the mean for these
values are 0.382 and 0.011, respectively.

31
The Wald statistics are considerably different from 0 (Table 34), the predictor making
a substantial contribution to predicting the outcome. The degrees of freedom (df) are
equal to 1 which relates to number of observations able to vary (Field, 2005). The exp
b (1.032) for hours worked is the value of the odds ratio which is only a guess or point
estimate of the true value, given the sample data. If the person works longer hours, the
odds for experiencing apathy when “stressed” is 1.032 times higher than for someone
working less hours. The confidence interval (95% CI) is more accurate for the
variable hours worked meaning that there is 95 per cent confidence that the value of
the odds ratio in this sample population lies between 1.009 and 1.056.
Table 34
Significance of Model for Apathy with Hours Worked as Continuous Predictor
N=501 B(SE) Wald df exp b 95% CI
Included Predictor- hours worked
Constant 0.322* 0.712 1 1.380
(0.382)
Hours workeda 0.032** 7.728 1 1.038 1.009 to 1.056
(0.011)
*p=0.399. **p<0.01. a Variable entered on step one.
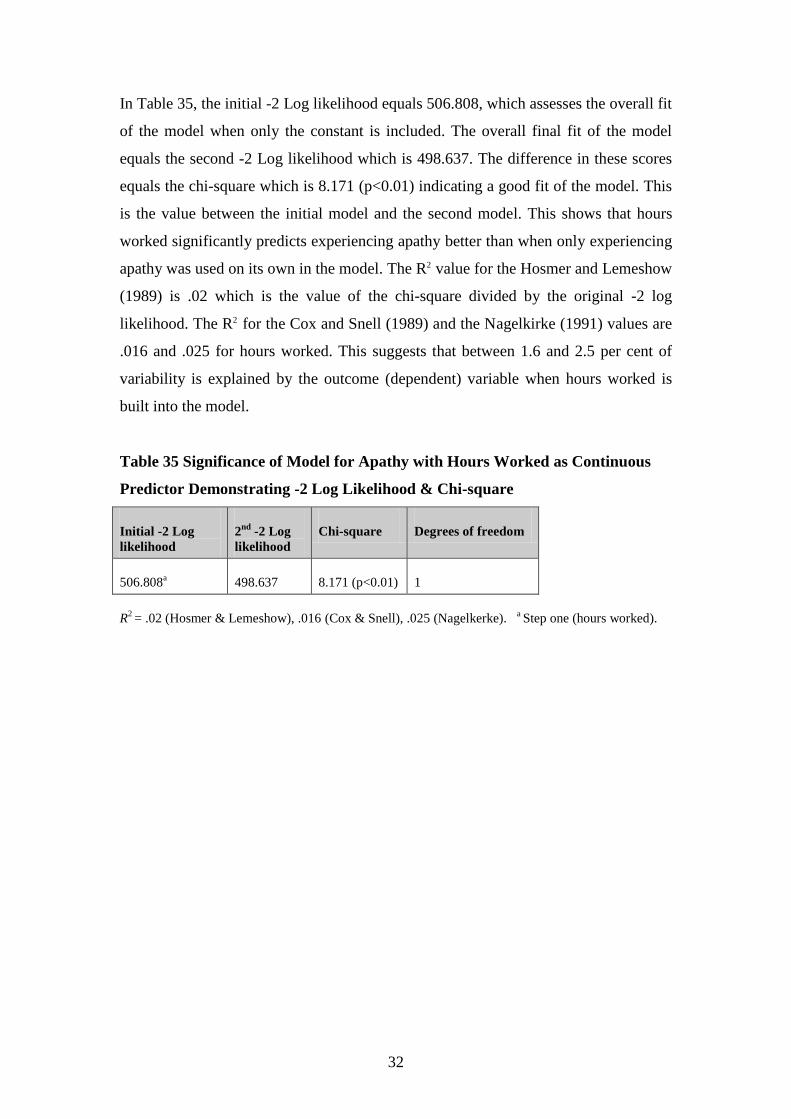
32
In Table 35, the initial -2 Log likelihood equals 506.808, which assesses the overall fit
of the model when only the constant is included. The overall final fit of the model
equals the second -2 Log likelihood which is 498.637. The difference in these scores
equals the chi-square which is 8.171 (p<0.01) indicating a good fit of the model. This
is the value between the initial model and the second model. This shows that hours
worked significantly predicts experiencing apathy better than when only experiencing
apathy was used on its own in the model. The R2 value for the Hosmer and Lemeshow
(1989) is .02 which is the value of the chi-square divided by the original -2 log
likelihood. The R2 for the Cox and Snell (1989) and the Nagelkirke (1991) values are
.016 and .025 for hours worked. This suggests that between 1.6 and 2.5 per cent of
variability is explained by the outcome (dependent) variable when hours worked is
built into the model.
Table 35 Significance of Model for Apathy with Hours Worked as Continuous
Predictor Demonstrating -2 Log Likelihood & Chi-square
Initial -2 Log
likelihood
2nd
-2 Log
likelihood
Chi-square Degrees of freedom
506.808a 498.637 8.171 (p<0.01) 1
R2 = .02 (Hosmer & Lemeshow), .016 (Cox & Snell), .025 (Nagelkerke).
a Step one (hours worked).

33
1.2.3. Feeling emotionally drained (age)
The results using the categorical predictor variables and the continuous predictor age
for the question, “How often do you feel emotionally drained at work?” will be
displayed. The categorical variable results are displayed in Table 36. Table 36 shows
that when considering feeling emotionally drained at work with age as the predictor,
41.9 per cent were fulltimers, 47.1 per cent of nurses and midwives possessed a
degree and 12.1 per cent lived alone. This means that when using age as the predictor
in the equation for logistic regression, over two-fifths (41.9%) feeling emotionally
drained worked fulltime, almost half (47.1%) feeling emotionally drained possessed a
degree and a minority (12.1%) feeling emotionally drained lived alone.
Table 36 Categorical Variable Results for Feeling Emotionally Drained with Age
as Continuous Predictor
Categorical results- How often do you feel emotionally drained at work?
Predictor- age
Fulltime Yes Number = 211 41.9%
N = 503 No Number = 292 58.1%
Possesses a degree Yes Number = 237 47.1%
N = 503 No Number = 266 52.9%
Live alone Yes Number = 61 12.1%
N = 503 No Number = 442 87.9%

34
The first analysis was calculated on a forward stepwise method, so the initial model
was derived using the constant, “How often do you feel emotionally drained at
work?”, in the logistic regression equation (Table 37). Therefore, in this calculation
all of the predictor variables were omitted. If predictions were that all nurses and
midwives did feel emotionally drained at work, it was predicted that this would be
correct 298 times out of 503, that is, 59.2 per cent. If the prediction was that all nurses
and midwives did not feel emotionally drained at work, this prediction would be
correct 205 times out of 503, that is, 40.8 per cent.
Table 37 Predictions for Feeling Emotionally Drained with Only the Constant in
the Model
Question: How often do you feel emotionally drained at work?
Prediction correct for
feeling emotionally
drained
298 / 503 N = 503 59.2%
Prediction correct for not
feeling emotionally
drained
205 / 503 N = 503 40.8%
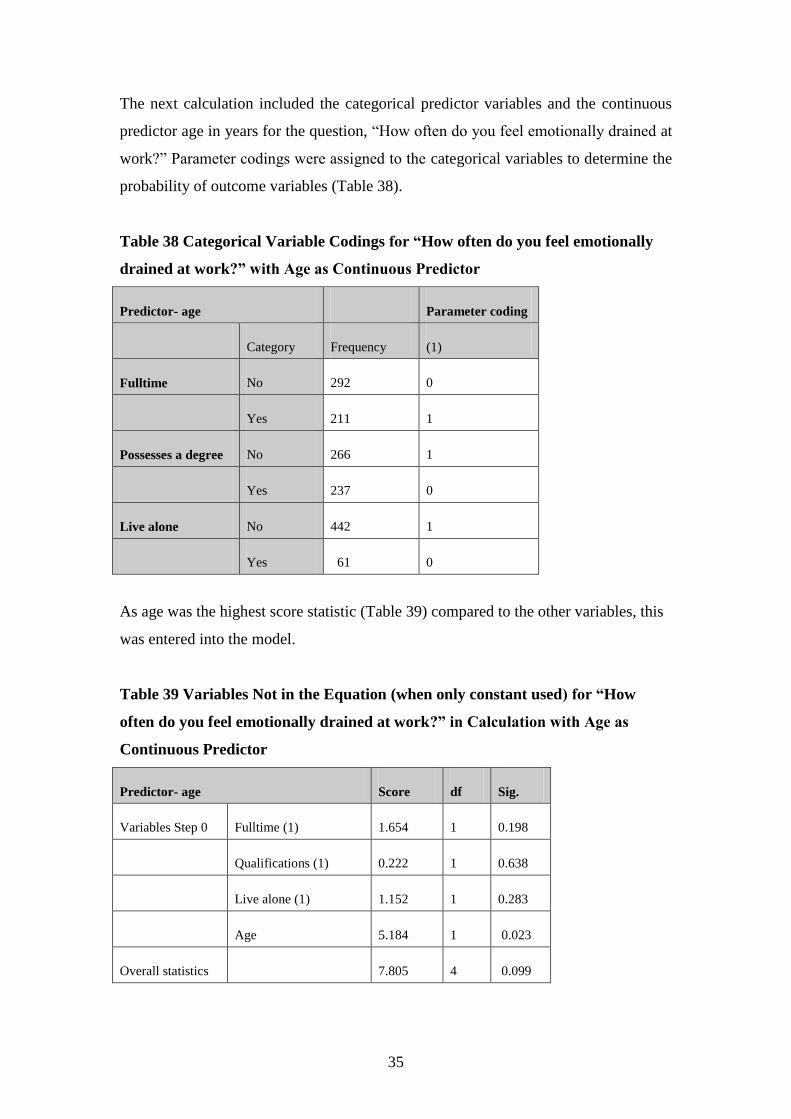
35
The next calculation included the categorical predictor variables and the continuous
predictor age in years for the question, “How often do you feel emotionally drained at
work?” Parameter codings were assigned to the categorical variables to determine the
probability of outcome variables (Table 38).
Table 38 Categorical Variable Codings for “How often do you feel emotionally
drained at work?” with Age as Continuous Predictor
Predictor- age Parameter coding
Category Frequency (1)
Fulltime No 292 0
Yes 211 1
Possesses a degree No 266 1
Yes 237 0
Live alone No 442 1
Yes 61 0
As age was the highest score statistic (Table 39) compared to the other variables, this
was entered into the model.
Table 39 Variables Not in the Equation (when only constant used) for “How
often do you feel emotionally drained at work?” in Calculation with Age as
Continuous Predictor
Predictor- age Score df Sig.
Variables Step 0 Fulltime (1) 1.654 1 0.198
Qualifications (1) 0.222 1 0.638
Live alone (1) 1.152 1 0.283
Age 5.184 1 0.023
Overall statistics 7.805 4 0.099

36
The following results (Tables 40, 41, & 42) indicate how well this model predicts
group classification. The model for predicting feeling emotionally drained with
significant variables is displayed in Table 40. The model for age (step one) (Table 40)
correctly categorises nine who do not feel emotionally drained and misclassifies 196
(correctly classifies 4.4% of cases). For those who do feel emotionally drained, the
model correctly categorises 291 and misclassifies seven (correctly classifies 97.7% of
cases). When the constant was used only, the model correctly categorised 59.2 per
cent of cases and now with age added into the equation, the model correctly classifies
59.6 per cent of cases. For this question, people who are older, are less likely to feel
emotionally drained at the p<0.05 level, which was statistically significant. The other
continuous predictor, years in profession and the categorical predictors, employment
status, qualifications and living alone were insignificant.
Table 40 Model for Predicting Feeling Emotionally Drained with Significant
Variables Included
Observed
N=503
Predicted
no
Predicted
yes
Percentage correct
Feeling emotionally draineda no 9 196 4.4%
Feeling emotionally draineda
yes 7 291 97.7%
Overall percentage 59.6% a Step one- Age
The significance of the models are displayed in the following tables (Tables 41 & 42).
In Table 41, for age, the B value is negative denoting that if the person is older, they
are less likely to feel emotionally drained, which is statistically significant at the
p<0.05 level. The standard errors of the mean for these values are 0.507 and 0.011,
respectively.

37
The Wald statistic is considerably different from 0 (Table 41), the predictor making a
substantial contribution to predicting the outcome. The degrees of freedom (df) are
equal to 1 which relates to number of observations able to vary (Field, 2005). The exp
b (0.975) for age is the value of the odds ratio which is only a guess or point estimate
of the true value, given the sample data. If the person is older, the odds for not feeling
emotionally drained is 0.975 times higher than for someone younger. The confidence
interval (95% CI) is more accurate for the variable age meaning that there is 95 per
cent confidence that the value of the odds ratio in this sample population lies between
0.954 and 0.997.
Table 41 Significance of Model for Feeling Emotionally Drained with Age as
Continuous Predictor
N=503 B(SE) Wald df exp b 95% CI
Included Predictor- age
Constant 1.499* 8.750 1 4.478
(0.507)
Agea -0.025** 5.133 1 0.975 0.954 to 0.997
(0.011)
*p<0.01. **p<0.05. a Variable entered on step one.

38
In Table 42, the initial -2 Log likelihood equals 680.012, which assesses the overall fit
of the model when only the constant is included. The overall final fit of the model
equals the second -2 Log likelihood which is 674.782. The difference in these scores
equals the chi-square which is 5.23 (p<0.05) indicating a good fit of the model. This
is the value between the initial model and the second model. This shows that age
significantly predicts feeling emotionally drained better than when only feeling
emotionally drained was used on its own in the model. The R2 value for the Hosmer
and Lemeshow (1989) is .008 which is the value of the chi-square divided by the
original -2 log likelihood. The R2 for the Cox and Snell (1989) and the Nagelkirke
(1991) values are .010 and .014 for age. This suggests that between 1 and 1.4 per cent
of variability is explained by the outcome (dependent) variable when age is built into
the model.
Table 42 Significance of Model Feeling Emotionally Drained with Age as
Continuous Predictor Demonstrating -2 Log Likelihood & Chi-square
Initial -2 Log
likelihood
2nd
-2 Log
likelihood
Chi-square Degrees of freedom
680.012a 674.782 5.23 (p<0.05) 1
R2 = .008 (Hosmer & Lemeshow), .010 (Cox & Snell), .014 (Nagelkerke).
a Step one (age).
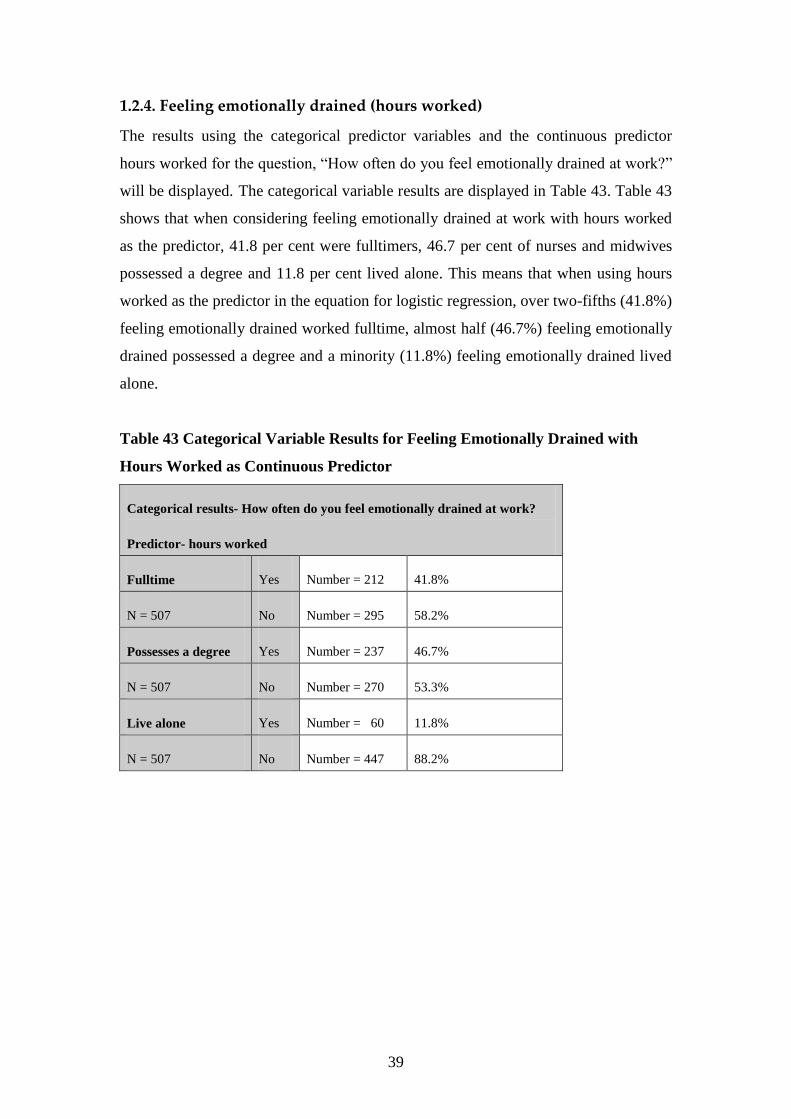
39
1.2.4. Feeling emotionally drained (hours worked)
The results using the categorical predictor variables and the continuous predictor
hours worked for the question, “How often do you feel emotionally drained at work?”
will be displayed. The categorical variable results are displayed in Table 43. Table 43
shows that when considering feeling emotionally drained at work with hours worked
as the predictor, 41.8 per cent were fulltimers, 46.7 per cent of nurses and midwives
possessed a degree and 11.8 per cent lived alone. This means that when using hours
worked as the predictor in the equation for logistic regression, over two-fifths (41.8%)
feeling emotionally drained worked fulltime, almost half (46.7%) feeling emotionally
drained possessed a degree and a minority (11.8%) feeling emotionally drained lived
alone.
Table 43 Categorical Variable Results for Feeling Emotionally Drained with
Hours Worked as Continuous Predictor
Categorical results- How often do you feel emotionally drained at work?
Predictor- hours worked
Fulltime Yes Number = 212 41.8%
N = 507 No Number = 295 58.2%
Possesses a degree Yes Number = 237 46.7%
N = 507 No Number = 270 53.3%
Live alone Yes Number = 60 11.8%
N = 507 No Number = 447 88.2%

40
The first analysis was calculated on a forward stepwise method, so the initial model
was derived using the constant, “How often do you feel emotionally drained at
work?”, in the logistic regression equation (Table 44). Therefore, in this calculation
all of the predictor variables were omitted. If predictions were that all nurses and
midwives did feel emotionally drained at work, it was predicted that this would be
correct 301 times out of 507, that is, 59.4 per cent. If the prediction was that all nurses
and midwives did not feel emotionally drained at work, this prediction would be
correct 206 times out of 507, that is, 40.6 per cent.
Table 44 Predictions for Feeling Emotionally Drained with Only the Constant in
the Model
Question: How often do you feel emotionally drained at work?
Prediction correct for
feeling emotionally
drained
301 / 507 N = 507 59.4%
Prediction correct for not
feeling emotionally
drained
206 / 507 N = 507 40.6%

41
The next calculation included the categorical predictor variables and the continuous
predictor hours worked for the question, “How often do you feel emotionally drained
at work?” Parameter codings were assigned to the categorical variables to determine
the probability of outcome variables (Table 45).
Table 45 Categorical Variable Codings for “How often do you feel emotionally
drained at work?” with Hours Worked as Continuous Predictor
Predictor- hours worked Parameter coding
Category Frequency (1)
Fulltime No 295 0
Yes 212 1
Possesses a degree No 270 1
Yes 237 0
Live alone No 447 1
Yes 60 0

42
As hours worked was the highest score statistic (Table 46) compared to the other
variables, this was entered into the model.
Table 46 Variables Not in the Equation (when only constant used) for “How
often do you feel emotionally drained at work?” in Calculation with Hours
Worked as Continuous Predictor
Predictor- hours worked Score df Sig.
Variables Step 0 Fulltime (1) 1.712 1 0.191
Qualifications (1) 0.173 1 0.677
Live alone (1) 0.895 1 0.344
Hours worked 8.086 1 0.004
Overall statistics 9.329 4 0.053

43
The following results (Tables 47, 48, & 49) indicate how well this model predicts
group classification. The model for predicting feeling emotionally drained with
significant variables is displayed in Table 47. The model for hours worked (step one)
(Table 47) correctly categorises 13 who do not feel emotionally drained and
misclassifies 193 (correctly classifies 6.3% of cases). For those who do feel
emotionally drained, the model correctly categorises 288 and misclassifies 13
(correctly classifies 95.7% of cases). When the constant was used only, the model
correctly categorised 59.4 per cent of cases and now with hours worked added into the
equation, the model correctly classifies 59.4 per cent of cases, which has not changed.
For this question, people who work longer hours are more likely to feel emotionally
drained at the p<0.01 level, which was statistically significant. The other continuous
predictor, years in profession and the categorical predictors, employment status,
qualifications and living alone were insignificant.
Table 47 Model for Predicting Feeling Emotionally Drained with Significant
Variables Included
Observed
N=507
Predicted
no
Predicted
yes
Percentage correct
Feeling emotionally draineda no 13 193 6.3%
Feeling emotionally draineda
yes 13 288 95.7%
Overall percentage 59.4% a Step one- Hours worked
The significance of the models are displayed in the following tables (Tables 48 & 49).
In Table 48, for hours worked, the B value is positive denoting that if the person
works longer hours, they are more likely to feel emotionally drained, which is
statistically significant at the p<0.01 level. The standard errors of the mean for these
values are 0.304 and 0.009, respectively.

44
The Wald statistic is considerably different from 0 (Table 48), the predictor making a
substantial contribution to predicting the outcome. The degrees of freedom (df) are
equal to 1 which relates to number of observations able to vary (Field, 2005). The exp
b (1.026) for hours worked is the value of the odds ratio which is only a guess or point
estimate of the true value, given the sample data. If the person works longer hours, the
odds for feeling emotionally drained is 1.026 times higher than for someone working
less hours. The confidence interval (95% CI) is more accurate for the variable hours
worked meaning that there is 95 per cent confidence that the value of the odds ratio in
this sample population lies between 1.008 and 1.044.
Table 48 Significance of Model for Feeling Emotionally Drained with Hours
Worked as Continuous Predictor
N=508 B(SE) Wald df exp b 95% CI
Included Predictor- hours worked
Constant -0.482* 2.307 1 0.618
(0.317)
Hours workeda 0.026** 7.893 1 1.026 1.008 to 1.044
(0.009)
*p = 0.129. **p<0.01. a Variable entered on step one.

45
In Table 49, the initial -2 Log likelihood equals 684.945, which assesses the overall fit
of the model when only the constant is included. The overall final fit of the model
equals the second -2 Log likelihood which is 676.64. The difference in these scores
equals the chi-square which is 8.305 (p<0.01) indicating a good fit of the model. This
is the value between the initial model and the second model. This shows that hours
worked significantly predicts feeling emotionally drained better than when only
feeling emotionally drained was used on its own in the model. The R2 value for the
Hosmer and Lemeshow (1989) is .01 which is the value of the chi-square divided by
the original -2 log likelihood. The R2 for the Cox and Snell (1989) and the Nagelkirke
(1991) values are .016 and .022 for hours worked. This suggests that between 1.6 and
2.2 per cent of variability is explained by the outcome (dependent) variable when
hours worked is built into the model.
Table 49 Significance of Model Feeling Emotionally Drained with Hours Worked
as Continuous Predictor Demonstrating -2 Log Likelihood & Chi-square
Initial -2 Log
likelihood
2nd
-2 Log
likelihood
Chi-square Degrees of freedom
684.945a 676.640 8.305 (p<0.01) 1
R2 = .01 (Hosmer & Lemeshow), .016 (Cox & Snell), .022 (Nagelkerke).
a Step one (hours worked).

46
1.2.5. Losing empathy for colleagues (age)
The results using the categorical predictor variables and the continuous predictor age
for the question, “Have you ever felt loss of empathy for colleagues while at work?”
will be displayed. The categorical variable results are displayed in Table 50. Table 50
shows that when considering loss of empathy for colleagues while at work with age as
the predictor, 41.1 per cent were fulltimers, 45.4 per cent of nurses and midwives
possessed a degree and 11.6 per cent lived alone. This means that when using age as
the predictor in the equation for logistic regression, over two-fifths (41.1%) losing
empathy for colleagues worked fulltime, almost half (45.4%) losing empathy for
colleagues possessed a degree and a minority (11.6%) losing empathy for colleagues
lived alone.
Table 50 Categorical Variable Results for Loss of Empathy for Colleagues with
Age as Continuous Predictor
Categorical results- Have you ever felt loss of empathy for colleagues?
Predictor- age
Fulltime Yes Number = 180 41.1%
N = 438 No Number = 258 58.9%
Possesses a degree Yes Number = 199 45.4%
N = 438 No Number = 239 54.6%
Live alone Yes Number = 51 11.6%
N = 438 No Number = 387 88.4%
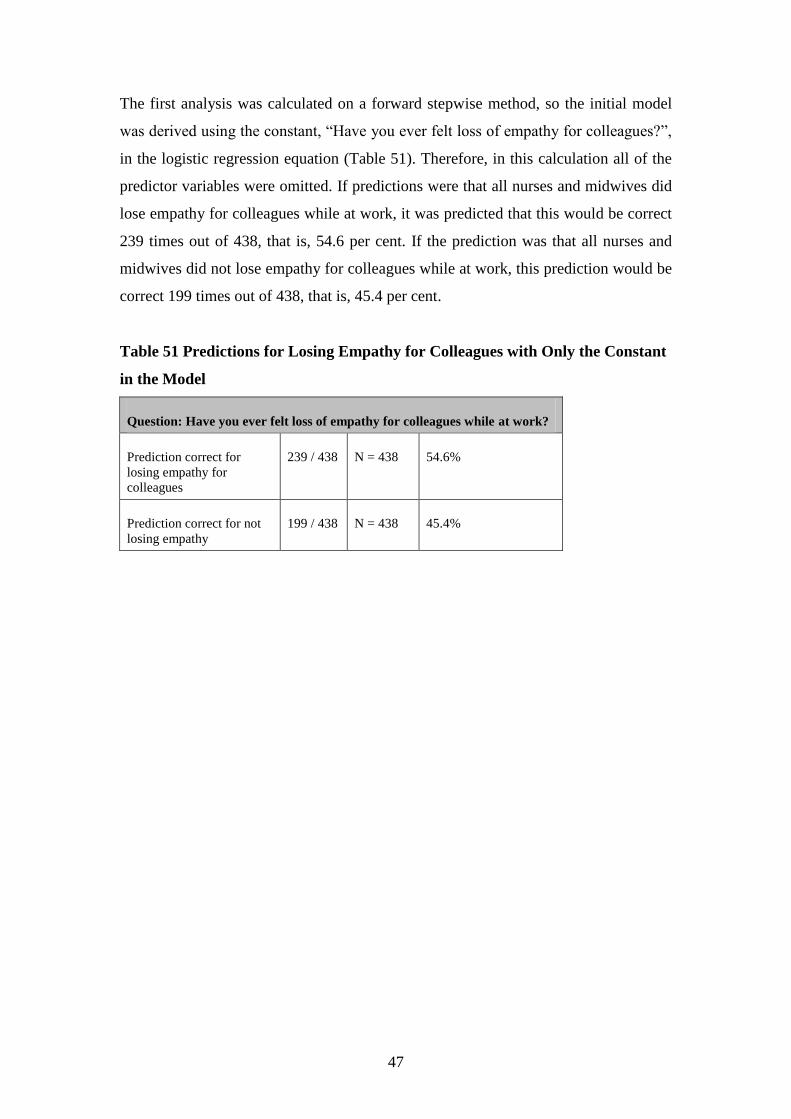
47
The first analysis was calculated on a forward stepwise method, so the initial model
was derived using the constant, “Have you ever felt loss of empathy for colleagues?”,
in the logistic regression equation (Table 51). Therefore, in this calculation all of the
predictor variables were omitted. If predictions were that all nurses and midwives did
lose empathy for colleagues while at work, it was predicted that this would be correct
239 times out of 438, that is, 54.6 per cent. If the prediction was that all nurses and
midwives did not lose empathy for colleagues while at work, this prediction would be
correct 199 times out of 438, that is, 45.4 per cent.
Table 51 Predictions for Losing Empathy for Colleagues with Only the Constant
in the Model
Question: Have you ever felt loss of empathy for colleagues while at work?
Prediction correct for
losing empathy for
colleagues
239 / 438 N = 438 54.6%
Prediction correct for not
losing empathy
199 / 438 N = 438 45.4%

48
The next calculation included the categorical predictor variables and the continuous
predictor age in years for the question, “Have you ever felt loss of empathy for
colleagues while at work?” Parameter codings were assigned to the categorical
variables to determine the probability of outcome variables (Table 52).
Table 52 Categorical Variable Codings for “Have you ever felt loss of empathy
for colleagues at work?” with Age as Continuous Predictor
Predictor- age Parameter coding
Category Frequency (1)
Fulltime No 258 0
Yes 180 1
Possesses a degree No 239 1
Yes 199 0
Live alone No 387 1
Yes 51 0
As qualifications and living alone were the highest score statistics (Table 53)
compared to the other variables, these were entered into the model.
Table 53 Variables Not in the Equation (when only constant used) for “Have you
ever felt loss of empathy for colleagues at work?” in Calculation with Age as
Continuous Predictor
Predictor- age Score df Sig.
Variables Step 0 Fulltime (1) 0.057 1 0.812
Qualifications (1) 6.683 1 0.010
Live alone (1) 4.603 1 0.032
Age 2.460 1 0.117
Overall statistics 12.780 4 0.012

49
The following results (Tables 54, 55, & 56) indicate how well this model predicts
group classification. The model for predicting losing empathy for colleagues with
significant variables is displayed in Table 54. The model for qualifications (step one)
(Table 54) correctly categorises 122 who do not lose empathy for colleagues and
misclassifies 77 (correctly classifies 61.3% of cases). For those who do lose empathy
for colleagues, the model correctly categorises 122 and misclassifies 117 (correctly
classifies 51% of cases). When the constant was used only, the model correctly
categorized 54.6 per cent of cases and now with qualifications added into the
equation, the model correctly classifies 55.7 per cent of cases.

50
The model for living alone and qualifications (step two) (Table 54) correctly
categorises 113 who do not lose empathy for colleagues and misclassifies 86
(correctly classifies 56.8% of cases). For those who do lose empathy for colleagues,
the model correctly categorises 103 and misclassifies 136 (correctly classifies 56.9%
of cases). The model now correctly categorises 56.8 per cent of cases compared to
when only the constant was used (54.6%). For this question, people who possess a
degree (or better educated), are less likely to lose empathy for colleagues at the
p<0.05 level, which was statistically significant. Also people who live alone are less
likely to lose empathy for colleagues at the p<0.05 level, which was also statistically
significant. The other continuous predictors, age, hours worked and years in
profession and the other categorical predictor, being fulltime were insignificant.
Table 54 Model for Predicting Losing Empathy for Colleagues with Significant
Variables Included
Observed
N=438
Predicted
no
Predicted
yes
Percentage correct
Lose empathy for colleaguesa no 122 77 61.3%
Lose empathy for colleaguesa
yes 117 122 51.0%
Overall percentage 55.7%
Lose empathy for colleaguesb no 113 86 56.8%
Lose empathy for colleaguesb yes 103 136 56.9%
Overall percentage 56.8% a Step one- Qualifications
b Step two- Live alone & qualifications
The significance of the models are displayed in the following tables (Tables 55 & 56).
In Table 55, for qualifications, the B value is negative denoting that if the person
holds a degree or any higher qualification, they are less likely to lose empathy for
colleagues, which is statistically significant at the p<0.05 level. The standard errors of
the mean for these values are 0.146 and 0.195, respectively and 0.319 and 0.196.
These are the standard deviations of the sample means (Field, 2005). For living alone,

51
the B value is negative denoting that people living alone are less likely to lose
empathy for colleagues which is statistically significant at the p<0.05 level. The
standard errors of the mean for these values are 0.319 and 0.321, respectively.

52
The Wald statistics are considerably different from 0 (Table 55), the predictor making
a substantial contribution to predicting the outcome. The degrees of freedom (df) are
equal to 1 which relates to number of observations able to vary (Field, 2005). The exp
b (0.605 & 0.619) for qualifications is the value of the odds ratio which is only a
guess or point estimate of the true value, given the sample data. If the person holds a
degree or higher qualification, the odds for not losing empathy for colleagues is 0.605
to 0.619 times higher than for someone not possessing a degree or higher
qualification. The confidence interval (95% CI) is more accurate for the variable
qualifications meaning that there is 95 per cent confidence that the value of the odds
ratio in this sample population lies between 0.413 and 0.909. The exp b (0.532) for
living alone means that if a person lives alone, the odds of losing empathy for
colleagues decreases by a factor equalling 0.532, all factors being equal (Pallatt,
2005). The confidence interval (95% CI) is more accurate for the variable living
alone, being between 0.284 and 0.997.
Table 55 Significance of Model for Losing Empathy for Colleagues with Age as
Continuous Predictor
N=438 B(SE) Wald df exp b 95% CI
Included Predictor- age
Constant 0.460* 9.998 1 1.584
(0.146)
Qualificationsa -0.502** 6.646 1 0.605 0.413 to 0.887
(0.195)
Live aloneb -0.631** 3.874 1 0.532 0.284 to 0.997
(0.321)
Qualificationsb -0.480** 6.000 1 0.619 0.422 to 0.909
(0.196)
Constant 1.010* 10.033 1 2.745
(0.319)
*p<0.01 **p<0.05. a Variable entered on step one.
b Variables entered on step two.

53
In Table 56, the initial -2 Log likelihood equals 603.539, which assesses the overall fit
of the model when only the constant is included. The initial -2 Log likelihood for
living alone equals 596.828. The overall final fits of the model equal the second -2
Log likelihoods which are 596.828 and 592.756. The difference in these scores equals
the chi-squares which are 6.711 (p<0.05) and 4.072 (p<0.05) indicating a good fit of
the model. This is the value between the initial model and the second model. This
shows that better education and living alone significantly predicts not losing empathy
for colleagues better than when only losing empathy for colleagues was used on its
own in the model. The R2 value for the Hosmer and Lemeshow (1989) is .11 for the
first step and .08 for the second step, which is the value of the chi-squares divided by
the original -2 log likelihoods. The R2 for the Cox and Snell (1989) and the
Nagelkirke (1991) values are .015 and .02 for qualifications and .024 and .033 for
living alone. This suggests that between 1.5 and 2 per cent of variability is explained
by the outcome (dependent) variable when qualifications is built into the model and
between 2.4 and 3.3 when living alone is built into the model.
Table 56 Significance of Model Losing Empathy for Colleagues with Age as
Continuous Predictor Demonstrating -2 Log Likelihood & Chi-square
Initial -2 Log
likelihood
2nd
-2 Log
likelihood
Chi-square Degrees of freedom
603.539a 596.828 6.711 (p<0.05) 1
596.828b 592.756 4.072 (p<0.05) 1
R2 = .11 & .08 (Hosmer & Lemeshow), .015 & .024 (Cox & Snell), .02 & .033 (Nagelkerke).
a Step
one (qualifs). b Step two (live alone).

54
1.2.6. Losing empathy for colleagues (hours worked)
The next calculation used the question “Have you ever felt loss of empathy for
colleagues while at work?” and the categorical variable results are displayed in Table
57. The continuous predictor hours worked was used for this analysis. Table 57 shows
that when considering loss of empathy for colleagues while at work with hours
worked as the predictor, 40.9 per cent were fulltimers, 45.5 per cent of nurses and
midwives possessed a degree and 11.6 per cent lived alone. This means that when
using hours worked as the predictor in the equation for logistic regression, over two-
fifths (40.9%) losing empathy for colleagues worked fulltime, almost half (45.5%)
losing empathy for colleagues possessed a degree and a minority (11.6%) losing
empathy for colleagues lived alone.
Table 57 Categorical Variable Results for Loss of Empathy for Colleagues with
Hours Worked as Continuous Predictor
Categorical results- Have you ever felt loss of empathy for colleagues while at work?
Predictor- hours worked
Fulltime Yes Number = 180 40.9%
N = 440 No Number = 260 59.1%
Possesses a degree Yes Number = 200 45.5%
N = 440 No Number = 241 54.5%
Live alone Yes Number = 51 11.6%
N = 440 No Number = 389 88.4%

55
The first analysis was calculated on a forward stepwise likelihood ratio method, so the
initial model was derived using the constant, “Have you ever felt loss of empathy for
colleagues?”, in the logistic regression equation (Table 58). Therefore, in this
calculation all the predictor variables were omitted. If predictions were that all nurses
and midwives did lose empathy for colleagues while at work, it was predicted that this
would be correct 238 times out of 440, that is, 54.1 per cent. If the prediction was that
all nurses and midwives did not lose empathy for colleagues while at work, this
prediction would be correct 202 times out of 440, that is, 45.9 per cent.
Table 58 Predictions for Losing Empathy for Colleagues with Only the Constant
in the Model
Question: Have you ever felt loss of empathy for colleagues while at work?
Prediction correct for
losing empathy for
colleagues
238 / 440 N = 440 54.1%
Prediction correct for not
losing empathy
202 / 440 N = 440 45.9%
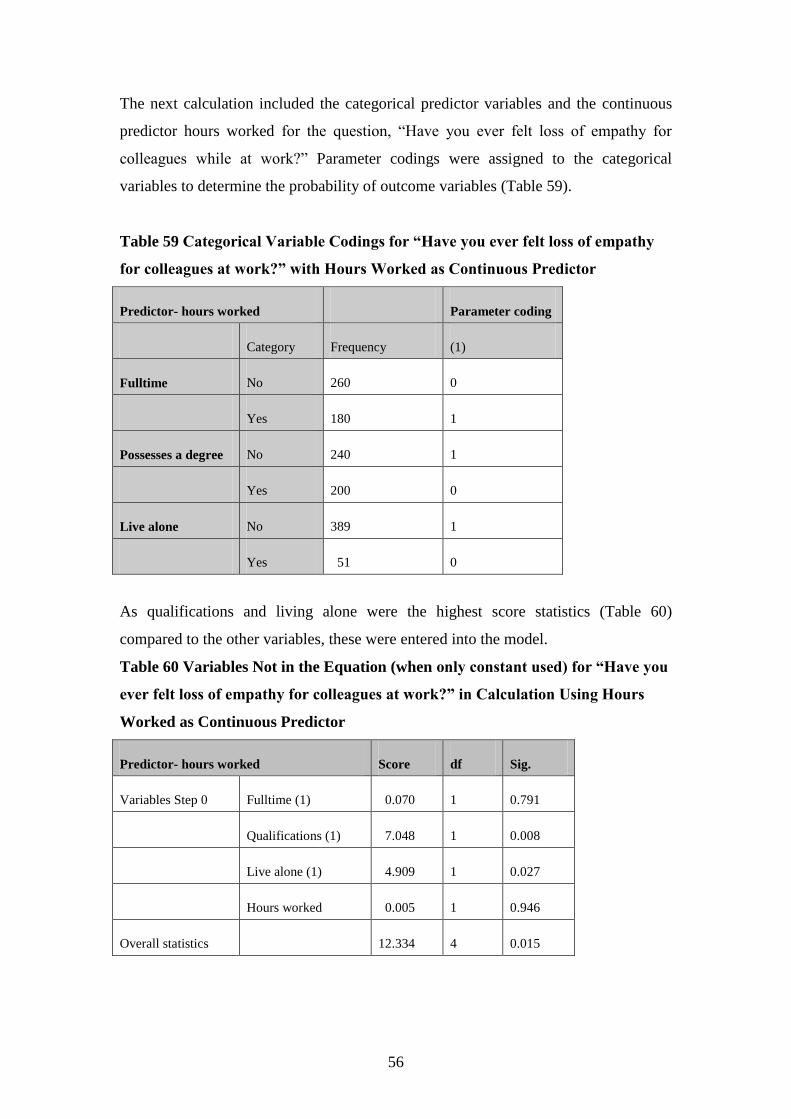
56
The next calculation included the categorical predictor variables and the continuous
predictor hours worked for the question, “Have you ever felt loss of empathy for
colleagues while at work?” Parameter codings were assigned to the categorical
variables to determine the probability of outcome variables (Table 59).
Table 59 Categorical Variable Codings for “Have you ever felt loss of empathy
for colleagues at work?” with Hours Worked as Continuous Predictor
Predictor- hours worked Parameter coding
Category Frequency (1)
Fulltime No 260 0
Yes 180 1
Possesses a degree No 240 1
Yes 200 0
Live alone No 389 1
Yes 51 0
As qualifications and living alone were the highest score statistics (Table 60)
compared to the other variables, these were entered into the model.
Table 60 Variables Not in the Equation (when only constant used) for “Have you
ever felt loss of empathy for colleagues at work?” in Calculation Using Hours
Worked as Continuous Predictor
Predictor- hours worked Score df Sig.
Variables Step 0 Fulltime (1) 0.070 1 0.791
Qualifications (1) 7.048 1 0.008
Live alone (1) 4.909 1 0.027
Hours worked 0.005 1 0.946
Overall statistics 12.334 4 0.015
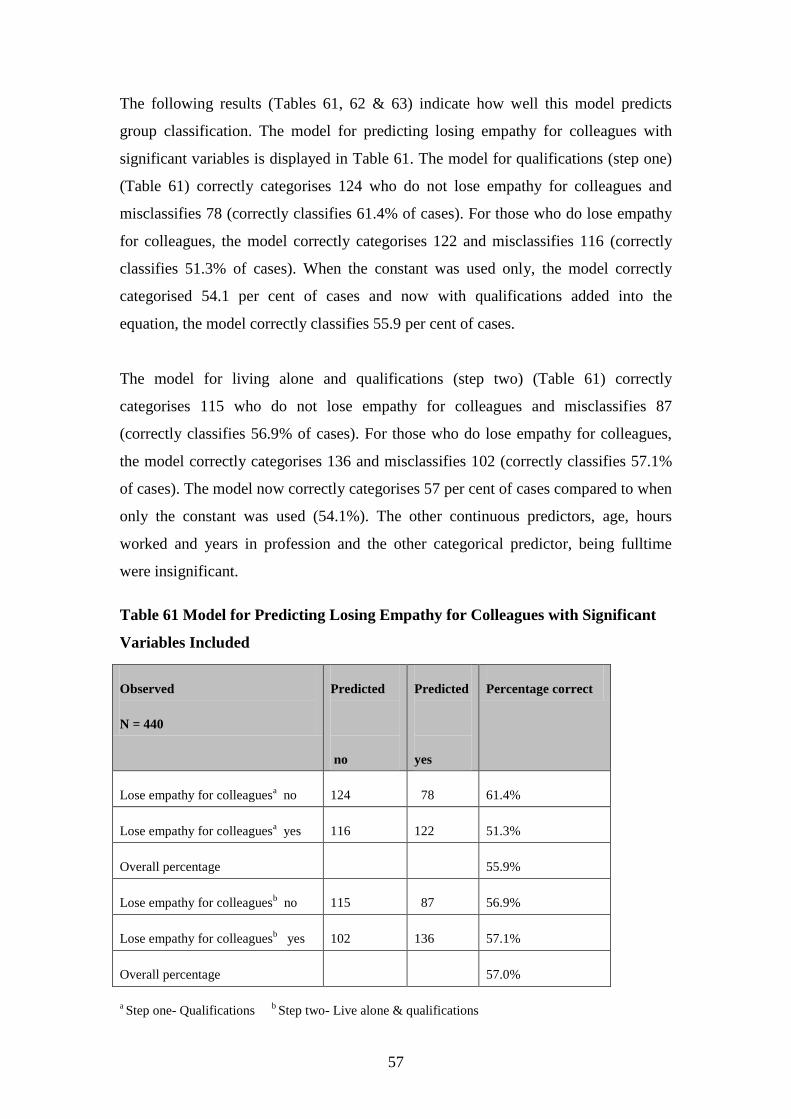
57
The following results (Tables 61, 62 & 63) indicate how well this model predicts
group classification. The model for predicting losing empathy for colleagues with
significant variables is displayed in Table 61. The model for qualifications (step one)
(Table 61) correctly categorises 124 who do not lose empathy for colleagues and
misclassifies 78 (correctly classifies 61.4% of cases). For those who do lose empathy
for colleagues, the model correctly categorises 122 and misclassifies 116 (correctly
classifies 51.3% of cases). When the constant was used only, the model correctly
categorised 54.1 per cent of cases and now with qualifications added into the
equation, the model correctly classifies 55.9 per cent of cases.
The model for living alone and qualifications (step two) (Table 61) correctly
categorises 115 who do not lose empathy for colleagues and misclassifies 87
(correctly classifies 56.9% of cases). For those who do lose empathy for colleagues,
the model correctly categorises 136 and misclassifies 102 (correctly classifies 57.1%
of cases). The model now correctly categorises 57 per cent of cases compared to when
only the constant was used (54.1%). The other continuous predictors, age, hours
worked and years in profession and the other categorical predictor, being fulltime
were insignificant.
Table 61 Model for Predicting Losing Empathy for Colleagues with Significant
Variables Included
Observed
N = 440
Predicted
no
Predicted
yes
Percentage correct
Lose empathy for colleaguesa no 124 78 61.4%
Lose empathy for colleaguesa
yes 116 122 51.3%
Overall percentage 55.9%
Lose empathy for colleaguesb no 115 87 56.9%
Lose empathy for colleaguesb yes 102 136 57.1%
Overall percentage 57.0%
a Step one- Qualifications
b Step two- Live alone & qualifications

58
The significance of the models are displayed in the following tables (Tables 62 & 63).
In Table 62, for qualifications, the B value is negative denoting that if the person
holds a degree or any higher qualification, they are less likely to lose empathy for
colleagues, which is statistically significant at the p<0.01 level (Pallatt, 2005). The
standard errors of the mean for these values are 0.145 and 0.194, respectively and
0.319 and 0.194. These are the standard deviations of the sample means (Field, 2005).
For living alone, the B value is negative denoting that people living alone are less
likely to lose empathy for colleagues which is statistically significant at the p<0.05
level. The standard errors of the mean for these values are 0.319 and 0.321,
respectively.
The Wald statistics are considerably different from 0 (Table 62), the predictor making
a substantial contribution to predicting the outcome. The degrees of freedom (df) are
equal to 1 which relates to number of observations able to vary (Field, 2005). The exp
b (0.598 & 0.612) for qualifications is the value of the odds ratio which is only a
guess or point estimate of the true value, given the sample data.
If the person holds a degree or higher qualification, the odds for not losing empathy
for colleagues is 0.598 to 0.612 times higher than for someone not possessing a
degree or higher qualification. The confidence interval (95% CI) is more accurate for
the variable qualifications meaning that there is 95 per cent confidence that the value
of the odds ratio in this sample population lies between 0.409 and 0.875. The exp b
(0.521) for living alone means that if a person lives alone, the odds of losing empathy
for colleagues decreases by a factor equalling 0.521, all factors being equal (Pallant,
2005). The confidence interval (95% CI) is more accurate for the variable living
alone, being between 0.278 and 0.977.

59
Table 62 Significance of Model for Losing Empathy for Colleagues with Hours
Worked as Continuous Predictor
N=440 B(SE) Wald df exp b 95% CI
Included Predictor- hours worked
Constant 0.447* 9.520 1 1.564
(0.145)
Qualificationsa -0.514* 7.007 1 0.008 0.409 to 0.875
(0.194)
Live aloneb -0.652** 4.134 1 0.521 0.278 to 0.977
(0.321)
Qualificationsb -0.483** 6.118 1 0.617 0.421 to 0.905
(0.195)
Constant 1.015* 10.144 1 2.760
(0.319)
*p<0.01. ** p<0.05. a Variable entered on step one.
b Variables entered on step two.

60
In Table 63, the initial -2 Log likelihood equals 607.021, which assesses the overall fit
of the model when only the constant is included. The initial -2 Log likelihood for
living alone equals 599.943. The overall final fits of the model equal the second -2
Log likelihoods which are 599.943 and 595.592. The difference in these scores equals
the chi-squares which are 7.078 (p<0.01) and 4.351 (p<0.05) indicating a good fit of
the model. This is the value between the initial model and the second model. This
shows that better education and living alone significantly predicts not losing empathy
for colleagues better than when only losing empathy for colleagues was used on its
own in the model. The R2 value for the Hosmer and Lemeshow (1989) is .11 which is
the value of the chi-square divided by the original -2 log likelihood, for both steps.
The R2 for the Cox and Snell (1989) and the Nagelkirke (1991) values are .016 and
.021 for qualifications and .026 and .034 for living alone. This suggests that between
1.6 and 2.1 per cent of variability is explained by the outcome (dependent) variable
when qualifications is built into the model and between 2.6 and 3.4 when living alone
is built into the model.
Table 63
Significance of Model for Losing Empathy for Colleagues with Hours Worked as
Continuous Predictor Demonstrating -2 Log Likelihood & Chi-square
Initial -2 Log
likelihood
2nd
-2 Log
likelihood
Chi-square Degrees of freedom
607.021a 599.943 7.078 (p<0.01) 1
599.943b 595.592 4.351 (p<0.05) 1
R2 = .11 (Hosmer & Lemeshow), .016 & .026 (Cox & Snell), .021 & .034 (Nagelkerke).
a Step one
(qualifs). b Step two (live alone).

61
1.2.7. Losing empathy for colleagues (years in profession)
The next calculation used the same question and the categorical variable results are
displayed in Table 64. The continuous predictor years in profession was used for this
analysis. Table 64 shows that when considering loss of empathy for colleagues while
at work with years in profession as the predictor, 41 per cent were fulltimers, 45.8 per
cent of nurses and midwives possessed a degree and 11.4 per cent lived alone. This
means that when using years in profession as the predictor in the equation for logistic
regression, over two-fifths (41%) losing empathy for colleagues worked fulltime,
almost half (45.8%) losing empathy for colleagues possessed a degree and a minority
(11.4%) losing empathy for colleagues lived alone.
Table 64 Categorical Variable Results for Loss of Empathy for Colleagues with
Years in Profession as Continuous Predictor
Categorical results- Have you ever felt loss of empathy for colleagues while at work?
Predictor- years in profession
Fulltime Yes Number = 179 41.0%
N = 437 No Number = 258 59.0%
Possesses a degree Yes Number = 200 45.8%
N = 437 No Number = 237 54.2%
Live alone Yes Number = 50 11.4%
N = 437 No Number = 387 88.6%

62
The first analysis was calculated on a forward stepwise method, so the initial model
was derived using the constant, “Have you ever felt loss of empathy for colleagues
while at work?”, in the logistic regression equation. Therefore, in this calculation all
of the predictor variables were omitted. If predictions were that all midwives and
nurses did lose empathy for colleagues while at work, it was predicted that this would
be correct 238 times out of 437, that is, 54.5 per cent. If the prediction was that all
nurses and midwives did not lose empathy for clients while at work, this prediction
would be correct 199 times out of 437, that is, 45.5 per cent (Table 65).
Table 65 Predictions for Losing Empathy for Colleagues with Only the Constant
in the Model
Question: Have you ever felt loss of empathy for colleagues while at work?
Prediction correct for
losing empathy for
colleagues
238 / 437 N = 437 54.5%
Prediction correct for not
losing empathy
199 / 437 N = 437 45.5%

63
The next calculation included the categorical predictor variables and the continuous
predictor years in profession for the question, “Have you ever felt loss of empathy for
colleagues while at work?” Parameter codings were assigned to the categorical
variables to determine the probability of outcome variables (Table 66).
Table 66 Categorical Variable Codings for “Have you ever felt loss of empathy
for colleagues at work?” with Years in Profession as Continuous Predictor
Predictor- Years in profession Parameter coding
Frequency (1)
Fulltime No 258 0
Yes 179 1
Possesses a degree No 237 1
Yes 200 0
Live alone No 387 1
Yes 50 0
As qualifications and living alone were the highest score statistics (Table 67)
compared to the other variables, these were entered into the model.
Table 67 Variables Not in the Equation (when only constant used) for “Have you
ever felt loss of empathy for colleagues at work?” in Calculation with Years in
Profession as Continuous Predictor
Predictor- years in profession Score df Sig.
Variables Step 0 Fulltime 0.084 1 0.771
Qualifications (1) 6.356 1 0.012
Live alone (1) 5.496 1 0.019
Years in profession 0.313 1 0.576
Overall statistics 12.168 4 0.016

64
The following results (Tables 68, 69 & 70) indicate how well this model predicts
group classification. The model for qualifications (step one) (Table 68) correctly
categorises 121 who do not lose empathy for colleagues and misclassifies 78
(correctly classifies 60.8% of cases). For those who do lose empathy for colleagues,
the model correctly categorises 122 and misclassifies 116 (correctly classifies 51.3%
of cases). When the constant was used only, the model correctly categorised 54.5 per
cent of cases and now with qualifications added into the equation, the model correctly
classifies 55.6 per cent of cases.

65
The model for living alone and qualifications (step two) (Table 68) correctly
categorises 113 who do not lose empathy for colleagues and misclassifies 86
(correctly classifies 56.8% of cases). For those who do lose empathy for colleagues,
the model correctly categorises 136 and misclassifies 102 (correctly classifies 57.1%
of cases). The model now correctly categorises 57 per cent of cases compared to when
only the constant was used (54.5%). For this question, people who possess a degree
(or more educated), are more likely to lose empathy for colleagues at the p<0.05 level,
which was statistically significant. Also people who live alone are less likely to lose
empathy for colleagues at the p<0.05 level, which was also statistically significant.
The other continuous predictors, age, hours worked and years in profession and the
other categorical predictor, being fulltime were insignificant.
Table 68 Model for Predicting Losing Empathy for Colleagues with Significant
Variables Included
Observed
N=437
Predicted
no
Predicted
yes
Percentage correct
Lose empathy for colleaguesa no 121 78 60.8%
Lose empathy for colleaguesa
yes 116 122 51.3%
Overall percentage 55.6%
Lose empathy for colleaguesb no 113 86 56.8%
Lose empathy for colleaguesb yes 102 136 57.1%
Overall percentage 57.0% a Step one- Qualifications
b Step two- Live alone & qualifications
The significance of the models are displayed in the following tables (Tables 69 & 70).
In Table 69, for qualifications, the B value is negative denoting that if the person
holds a degree or any higher qualification, they are less likely to lose empathy for
colleagues, which is statistically significant at the p<0.05 level. The standard errors of
the mean for these values are 0.145 and 0.195, respectively and 0.325 and 0.196.
These are the standard deviations of the sample means (Field, 2005). For living alone,

66
the B value is negative denoting that people living alone are less likely to lose
empathy for colleagues which is statistically significant at the p<0.05 level. The
standard errors of the mean for these values are 0.325 and 0.327, respectively.

67
The Wald statistics are considerably different from 0 (Table 69), the predictor making
a substantial contribution to predicting the outcome. The degrees of freedom (df) are
equal to 1 which relates to number of observations able to vary (Field, 2005). The exp
b (0.613 & 0.629) for qualifications is the value of the odds ratio which is only a
guess or point estimate of the true value, given the sample data. If the person holds a
degree or higher qualification, the odds for not losing empathy for colleagues is 0.613
to 1.64 times higher than for someone not possessing a degree or higher qualification.
The confidence interval (95% CI) is more accurate for the variable qualifications
meaning that there is 95 per cent confidence that the value of the odds ratio in this
sample population lies between 0.418 and 0.924. The exp b (0.494) for living alone
means that if a person lives alone, the odds of losing empathy for colleagues
decreases by a factor equalling 0.494, all factors being equal (Pallant, 2005). The
confidence interval (95% CI) is more accurate for the variable living alone, being
between 0.260 and 0.939.
Table 69 Significance of Model for Losing Empathy for Colleagues with Years in
Profession as Continuous Predictor
N=437 B(SE) Wald df exp b 95% CI
Included Predictor- years in profession
Constant 0.447* 9.520 1 1.564
(0.145)
Qualificationsa -0.490** 6.322 1 0.613 0.418 to 0.898
(0.195)
Live aloneb -0.704** 4.636 1 0.494 0.260 to 0.939
(0.327)
Qualificationsb -0.463** 5.586 1 0.629 0.429 to 0.924
(0.196)
Constant 1.062* 10.697 1 2.891
(0.325)
*p<0.01. **p<0.05. a Variable entered on step one.
b Variables entered on step two.

68
In Table 70, the initial -2 Log likelihood equals 602.325, which assesses the overall fit
of the model when only the constant is included. The initial -2 Log likelihood for
living alone equals 595.945. The overall final fits of the model equal the second -2
Log likelihoods which are 595.945 and 591.021. The difference in these scores equals
the chi-squares which are 6.38 (p<0.01) and 4.924 (p<0.05) indicating a good fit of
the model. This is the value between the initial model and the second model. This
shows that qualifications and living alone significantly predicts not losing empathy
for colleagues better than when only losing empathy for colleagues was used on its
own in the model. The R2 values for the Hosmer and Lemeshow (1989) are .01 which
are the values of the chi-square divided by the original -2 log likelihoods. The R2 for
the Cox and Snell (1989) and the Nagelkirke (1991) values are .014 and .019 for
qualifications and .026 and .034 for living alone. This suggests that between 1.4 and
1.9 per cent of variability is explained by the outcome (dependent) variable when
qualifications is built into the model and between 2.6 and 3.4 when living alone is
built into the model.
Table 70 Significance of Model for Losing Empathy for Colleagues with Years in
Profession as Continuous Predictor Demonstrating -2 Log Likelihood & Chi-
square
Initial -2 Log
likelihood
2nd
-2 Log
likelihood
Chi-square Degrees of freedom
602.325a 595.945 6.380 (p<0.05) 1
595.945b 591.021 4.924 (p<0.05) 1
R2 = .01 (Hosmer & Lemeshow), .014 & .026 (Cox & Snell), .019 & .034 (Nagelkerke).
a Step one
(qualifs). b Step two (live alone).

69
1.2.8. Losing empathy for clients (age)
The next calculation used the question, “Have you ever felt loss of empathy for clients
while at work?” and the categorical variable results are displayed in Table 71. The
continuous predictor age was used for this analysis. Table 71 shows that when
considering loss of empathy for clients while at work with age as the predictor, 40.6
per cent were fulltimers, 46.9 per cent of nurses and midwives possessed a degree and
11.7 per cent lived alone. This means that when using age as the predictor in the
equation for logistic regression, over two-fifths (40.6%) losing empathy for clients
worked fulltime, almost half (46.9%) losing empathy for clients possessed a degree
and a minority (11.7%) losing empathy for clients lived alone.
Table 71 Categorical Variable Results for Loss of Empathy for Clients with Age
as Continuous Predictor
Categorical results- Have you ever felt loss of empathy for clients while at work?
Predictor- age
Fulltime Yes Number = 188 40.6%
N = 463 No Number = 275 59.4%
Possesses a degree Yes Number = 217 46.9%
N = 463 No Number = 246 53.1%
Live alone Yes Number = 54 11.7%
N = 463 No Number = 409 88.3%

70
The first analysis was calculated on a forward stepwise method, so the initial model
was derived using the constant, “Have you ever felt loss of empathy for clients while
at work?”, in the logistic regression equation. Therefore, in this calculation all of the
predictor variables were omitted. If predictions were that all midwives and nurses did
lose empathy for clients while at work, it was predicted that this would be correct 232
times out of 463, that is, 50.1 per cent. If the prediction was that all midwives and
nurses did not lose empathy for clients while at work, this prediction would be correct
231 times out of 463, that is, 49.9 per cent (Table 72).
Table 72
Predictions for Losing Empathy for Clients with Only the Constant in the Model
Question: Have you ever felt loss of empathy for clients while at work?
Prediction correct for
losing empathy for clients
232 / 463 N = 463 50.1%
Prediction correct for not
losing empathy for clients
231 / 463 N = 463 49.9%
The next calculation included the categorical predictor variables and the continuous
predictor age for the question, “Have you ever felt loss of empathy for clients while at
work?” Parameter codings were assigned to the categorical variables to determine the
probability of outcome variables (Table 73).
Table 73 Categorical Variable Codings for “Have you ever felt loss of empathy
for clients at work?” with Age as Continuous Predictor
Predictor- age Parameter coding
Frequency (1)
Fulltime No 275 0
Yes 188 1
Possesses a degree No 246 1
Yes 217 0
Live alone No 409 1
Yes 54 0

71
As age was the highest score statistic (Table 74) compared to the other variables, this
was entered into the model.
Table 74 Variables Not in the Equation (when only constant used) for “Have you
ever felt loss of empathy for clients at work?” in Calculation with Age as
Continuous Predictor
Predictor- age Score df Sig.
Variables Step 0 Fulltime (1) 0.052 2 0.820
Qualifications (1) 0.370 1 0.543
Live alone (1) 0.726 1 0.394
Age 10.005 1 0.002
Overall statistics 11.622 5 0.020

72
The following results (Tables 75, 76 & 77) indicate how well this model predicts
group classification. The model for age (step one) (Table 75) correctly categorises
138 who do not lose empathy for clients and misclassifies 93 (correctly classifies
59.7% of cases). For those who do lose empathy for clients, the model correctly
categorises 122 and misclassifies 110 (correctly classifies 52.6% of cases). When the
constant was used only, the model correctly categorised 50.1 per cent of cases and
now with age added into the equation, the model correctly classifies 56.2 per cent of
cases. For this question, people who are older are less likely to lose empathy for
clients at the p<0.01 level, which was statistically significant. The other categorical
predictors were insignificant.
Table 75 Model for Predicting Losing Empathy for Clients with Significant
Variable Included
Observed
N=463
Predicted
no
Predicted
yes
Percentage correct
Lose empathy for clientsa no 138 93 59.7%
Lose empathy for clientsa
yes 110 122 52.6%
Overall percentage 56.2% a Step one- age

73
The significance of the model is displayed in the following tables (Tables 76 & 77). In
Table 76, for age, the B value is negative denoting that if the person is older, they are
less likely to lose empathy for clients, which is statistically significant at the p<0.01
level. The standard errors of the mean for these values are 0.529 and .012. These are
the standard deviations of the sample means (Field, 2005). The Wald statistics are
considerably different from 0 (Table 76), the predictor making a substantial
contribution to predicting the outcome. The degrees of freedom (df) are equal to 1
which relates to number of observations able to vary (Field, 2005). The exp b (0.965)
for age means that the older a person is, the odds of losing empathy for clients
decreases by a factor equalling 0.965, all factors being equal (Pallatt, 2005). The
confidence interval (95% CI) is more accurate for the variable age, being between
0.943 and 0.987.
Table 76 Significance of Model for Losing Empathy for Clients with Age as
Continuous Predictor
N=463 B(SE) Wald df exp b 95% CI
Included Predictor- age
Constant 1.622* 9.513 1 5.064
(0.526)
Agea -0.036* 9.793 1 0.964 0.943 to 0.987
(0.012)
*p<0.01. a Variable entered on step one.

74
In Table 77, the initial -2 Log likelihood equals 641.852, which assesses the overall fit
of the model when only the constant is included. The initial -2 Log likelihood for age
equals 632.324 which is the overall final fit of the model. The difference in these
scores equals the chi-square which is 9.528 (p<0.01) indicating a good fit of the
model. This is the value between the initial model and the second model. This shows
that age significantly predicts not losing empathy for clients better than when only
losing empathy for clients was used on its own in the model (Field, 2005). The R2
value for the Hosmer and Lemeshow (1989) is .13 which is the value of the chi-square
divided by the original -2 log likelihood. The R2 for the Cox and Snell (1989) and the
Nagelkirke (1991) values are .022 and .029. This suggests that between 2.2 and 2.9
per cent of variability is explained by the outcome (dependent) variable when age is
built into the model.
Table 77 Significance of Model for Losing Empathy for Clients with Age as
Continuous Predictor Demonstrating -2 Log Likelihood & Chi-square
Initial -2 Log
likelihood
2nd
-2 Log
likelihood
Chi-square Degrees of freedom
641.852a 631.739 10.113 (p<0.01) 1
R2 = .13 (Hosmer & Lemeshow), .022 (Cox & Snell), .029 (Nagelkerke).
a Step one (age).

75
1.2.9. Losing empathy for clients (years in profession)
The next calculation used the same question and the categorical variable results are
displayed in Table 78. The continuous predictor years in profession was used for this
analysis. Table 78 shows that when considering loss of empathy for clients while at
work with years in profession as the predictor, 40.1 per cent were fulltimers, 46.8 per
cent of nurses and midwives possessed a degree and 11.4 per cent lived alone. This
means that when using years in profession as the predictor in the equation for logistic
regression, over two-fifths (40.1%) losing empathy for clients worked fulltime, almost
half (46.8%) losing empathy for clients possessed a degree and a minority (11.4%)
losing empathy for clients lived alone.
Table 78 Categorical Variable Results for Loss of Empathy for Clients with
Years in Profession as Continuous Predictor
Categorical results- Have you ever felt loss of empathy for clients while at work?
Predictor- years in profession
Fulltime Yes Number = 189 40.1%
N = 466 No Number = 277 59.9%
Possesses a degree Yes Number = 218 46.8%
N = 466 No Number = 248 53.2%
Live alone Yes Number = 53 11.4%
N = 466 No Number = 413 88.6%
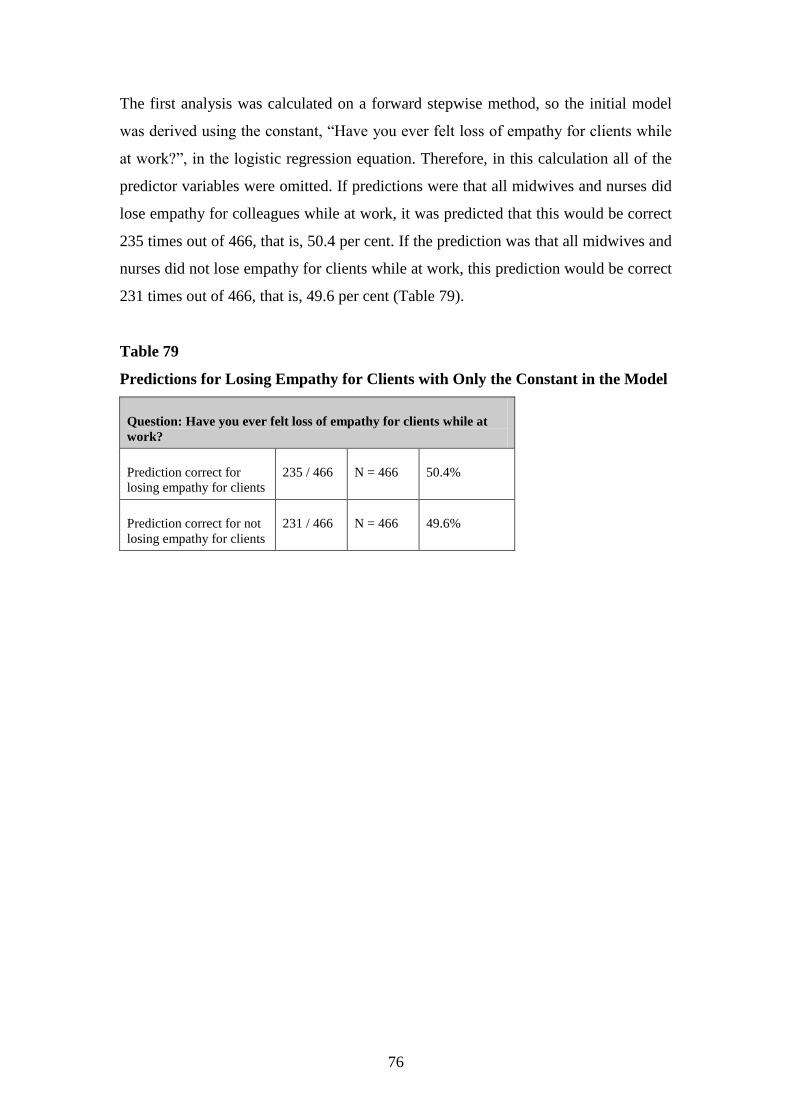
76
The first analysis was calculated on a forward stepwise method, so the initial model
was derived using the constant, “Have you ever felt loss of empathy for clients while
at work?”, in the logistic regression equation. Therefore, in this calculation all of the
predictor variables were omitted. If predictions were that all midwives and nurses did
lose empathy for colleagues while at work, it was predicted that this would be correct
235 times out of 466, that is, 50.4 per cent. If the prediction was that all midwives and
nurses did not lose empathy for clients while at work, this prediction would be correct
231 times out of 466, that is, 49.6 per cent (Table 79).
Table 79
Predictions for Losing Empathy for Clients with Only the Constant in the Model
Question: Have you ever felt loss of empathy for clients while at
work?
Prediction correct for
losing empathy for clients
235 / 466 N = 466 50.4%
Prediction correct for not
losing empathy for clients
231 / 466 N = 466 49.6%

77
The next calculation included the categorical predictor variables and the continuous
predictor age for the question, “Have you ever felt loss of empathy for clients while at
work?” Parameter codings were assigned to the categorical variables to determine the
probability of outcome variables (Table 80).
Table 80 Categorical Variable Codings for “Have you ever felt loss of empathy
for clients at work?” with Years in Profession as Continuous Predictor
Predictor- years in profession Parameter coding
Frequency (1)
Fulltime No 277 1
Yes 189 0
Possesses a degree No 248 0
Yes 218 1
Live alone No 413 1
Yes 53 0
As years in profession was the highest score statistic (Table 81) compared to the other
variables, this was entered into the model.
Table 81 Variables Not in the Equation (when only constant used) for “Have you
ever felt loss of empathy for clients at work?” in Calculation with Years in
Profession as Continuous Predictor
Predictor- years in profession Score df Sig.
Variables Step 0 Fulltime (1) 0.003 1 0.953
Qualifications (1) 0.324 1 0.569
Live alone (1) 0.912 1 0.340
Years in profession 11.310 1 0.001
Overall statistics 12.996 4 0.011

78
The following results (Tables 82, 83 & 84) indicate how well this model predicts
group classification. The model for years in profession (step one) (Table 82) correctly
categorises 134 who do not lose empathy for clients and misclassifies 97 (correctly
classifies 58% of cases). For those who do lose empathy for clients, the model
correctly categorises 127 and misclassifies 108 (correctly classifies 54% of cases).
When the constant was used only, the model correctly categorised 50.4 per cent of
cases and now with years in profession added into the equation, the model correctly
classifies 56 per cent of cases. For this question, people who have been in the
profession longer are less likely to lose empathy for clients at the p<0.01 level, which
was statistically significant. The other categorical predictors were insignificant.
Table 82 Model for Predicting Losing Empathy for Clients with Significant
Variable Included
Observed
N=466
Predicted
no
Predicted
yes
Percentage correct
Lose empathy for clientsa no 134 97 58.0%
Lose empathy for clientsa
yes 108 127 54.0%
Overall percentage 56.0% a Step one- years in profession

79
The significance of the model is displayed in the following tables (Tables 83 & 84). In
Table 83, for years in profession, the B value is negative denoting that the longer the
person has spent in the profession, the less likely they are to lose empathy for clients,
which is statistically significant at the p<0.01 level. The standard errors of the mean
for these values are 0.236 and .01. These are the standard deviations of the sample
means (Field, 2005). The Wald statistics are considerably different from 0 (Table 83),
the predictor making a substantial contribution to predicting the outcome. The degrees
of freedom (df) are equal to 1 which relates to number of observations able to vary
(Field, 2005). The exp b (0.968) for years in profession means that the more years the
person has spent in the profession, the odds of losing empathy for clients decreases by
a factor equalling 0.968, all factors being equal (Pallatt, 2005). The confidence
interval (95% CI) is more accurate for the variable years in profession, being between
0.949 and 0.987.
Table 83 Significance of Model for Losing Empathy for Clients with Years in
Profession as Continuous Predictor Variable
N=465 B(SE) Wald df exp b 95% CI
Included Predictor- years in profession
Constant 0.736* 9.734 1 2.088
(0.236)
Years in profa -0.033* 11.081 1 0.968 0.949 to 0.987
(0.010)
*p<0.01. a Variable entered on step one.

80
In Table 84, the initial -2 Log likelihood equals 645.979, which assesses the overall fit
of the model when only the constant is included. The initial -2 Log likelihood for
years in profession equals 634.550 which is the overall final fit of the model. The
difference in these scores equals the chi-square which is 11.429 (p<0.01) indicating a
good fit of the model. This is the value between the initial model and the second
model. This shows that the years spent in the profession significantly predicts not
losing empathy for clients better than when only losing empathy for clients was used
on its own in the model (Field, 2005). The R2 value for the Hosmer and Lemeshow
(1989) is .13 which is the value of the chi-square divided by the original -2 log
likelihood. The R2 for the Cox and Snell (1989) and the Nagelkirke (1991) values are
.024 and .032. This suggests that between 2.4 and 3.2 per cent of variability is
explained by the outcome (dependent) variable when years in profession is built into
the model.
Table 84 Significance of Model for Losing Empathy for Clients with Years in
Profession as Continuous Predictor Demonstrating -2 Log Likelihood & Chi-
square
Initial -2 Log
likelihood
2nd
-2 Log
likelihood
Chi-square Degrees of
freedom
645.979a 634.550 11.429 (p<0.01) 1
R2 = .13 (Hosmer & Lemeshow), .024 (Cox & Snell), .032 (Nagelkerke).
a Step one (years in
profession).
1.3. Individual responses
In relation to pressure and motivation levels, the data suggest that the respondents
were:
less likely to place unreasonable pressure on themselves if they were more
educated (p<0.05).
The following section presents more detailed information relating to individual
responses in regard to being more educated.

81
1.3.1. Pressure and motivation (age)
The results using the categorical predictor variables and the continuous predictor age
for pressure and motivation levels will be displayed. The categorical variable results
are displayed in Table 85. Table 85 shows that when placing unreasonable pressure on
themselves in relation to work with age as the predictor, 41.8 per cent were fulltimers,
47.1 per cent of nurses and midwives possessed a degree and 11.5 per cent lived
alone. This means that when using age as the predictor in the equation for logistic
regression, over two-fifths (41.8%) scoring moderate to high pressure and motivation
levels worked fulltime, almost half (47.1%) scoring moderate to high pressure and
motivation levels possessed a degree and a minority (11.5%) scoring moderate to high
pressure and motivation levels lived alone.
Table 85 Categorical Variable Results for Pressure and Motivation Levels in
Relation to Work With Age as Continuous Predictor
Categorical results for Pressure and Motivation Levels
Predictor- age
Fulltime Yes Number = 207 41.8%
N = 495 No Number = 288 58.2%
Possesses a degree Yes Number = 233 47.1%
N = 495 No Number = 262 52.9%
Live alone Yes Number = 57 11.5%
N = 495 No Number = 438 88.5%

82
The first analysis was calculated on a forward stepwise method, so the initial model
was derived using pressure and motivation levels as the constant, in the logistic
regression equation (Table 86). Therefore, in this calculation all of the predictor
variables were omitted. If predictions were that all nurses and midwives placed
unreasonable expectations on themselves in relation to work, it was predicted that this
would be correct 352 times out of 495, that is, 71.1 per cent. If the prediction was that
all nurses and midwives experienced low pressure and motivation levels in relation to
work, this prediction would be correct 143 times out of 495, that is, 28.9 per cent.
Table 86 Predictions for Pressure and Motivation Levels with Only the Constant
in the Model
Pressure and motivation levels in relation to work
Prediction correct for high
pressure and motivation
levels in relation to work
352 / 495 N = 495 71.1%
Prediction correct for low
pressure and motivation
levels in relation to work
143 / 495 N = 495 28.9%

83
The next calculation included the categorical predictor variables and the continuous
predictor age for pressure and motivation levels. Parameter codings were assigned to
the categorical variables to determine the probability of outcome variables (Table 87).
Table 87 Categorical Variable Codings for Pressure and Motivation Levels with
Age as Continuous Predictor
Predictor- age Parameter coding
Category Frequency (1)
Fulltime No 288 0
Yes 207 1
Possesses a degree No 262 1
Yes 233 0
Live alone No 438 1
Yes 57 0
As qualifications was the highest score statistic (Table 88) compared to the other
variables, this was entered into the model.
Table 88 Variables Not in the Equation (when only constant used) for Pressure
and Motivation Levels in Calculation with Age as Continuous Predictor
Predictor- age Score df Sig.
Variables Step 0 Fulltime (1) 0.584 1 0.445
Qualifications (1) 5.982 1 0.014
Live alone (1) 1.160 1 0.281
Age 0.997 1 0.318
Overall statistics 7.043 4 0.134

84
The following results indicate how well this model predicts group classification. The
significance of the models are displayed in the following tables (Tables 89, 90 & 91).
The model for predicting pressure and motivation levels with significant variables is
displayed in Table 89. The model for qualifications (step one) (Table 89) correctly
categorises no-one who does not place unreasonable expectations on themselves and
misclassifies 143 (correctly classifies no cases). For those who place unreasonable
expectations on themselves, the model correctly categorises 352 and misclassifies no-
one (correctly classifies all cases). When the constant was used only, the model
correctly categorised 71.1 per cent of cases and now with qualifications added into the
equation, the model correctly classifies the same percentage (71.1%) of cases. For this
question, people who are more educated, are less likely to place unreasonable
expectations on themselves at the p<0.05 level, which was statistically significant.
The other categorical predictors, being fulltime and living alone and the continuous
predictors, age, hours worked and years in the profession, were insignificant.
Table 89 Model for Predicting Pressure and Motivation Levels with Significant
Variables Included
Observed
N = 495
Predicted
low
Predicted
high
Percentage correct
Pressure Motivation
levela low
0 143 0%
Pressure Motivation
levela
high
0 352 100%
Overall percentage 71.1% a Step one- Qualifications
The significance of the models are displayed in the following tables (Tables 90 & 91).
In Table 90, for qualifications, the B value is negative denoting that if the person is
more educated, they are less likely to place unreasonable expectations on themselves,
which is statistically significant at the p<0.05 level. The standard errors of the mean
for these values are 0.154 and 0.202, respectively. These are the standard deviations
of the sample means (Field, 2005).

85
The Wald statistics are considerably different from 0 (Table 90), the predictor making
a substantial contribution to predicting the outcome. The degrees of freedom (df) are
equal to 1 which relates to number of observations able to vary (Field, 2005). The exp
b (0.611) for qualifications is the value of the odds ratio which is only a guess or point
estimate of the true value, given the sample data. If the person is more educated, the
odds for placing unreasonable expectations on themselves is 1.021 to 1.043 times
lower than for someone less educated. The confidence interval (95% CI) is more
accurate for the variable qualifications meaning that there is 95 per cent confidence
that the value of the odds ratio in this sample population lies between 0.411 and
0.908.
Table 90 Significance of Model for Pressure and Motivation Level with Age as
Continuous Predictor
N=495 B(SE) Wald df exp b 95% CI
Included Predictor- age
Constant 1.174* 57.956 1 3.236
(0.154)
Qualificationsa -0.493** 5.935 1 0.611 0.411 to 0.908
(0.202)
*p<0.0001. **p<0.05. a Variable entered on step one.

86
In Table 91, the initial -2 Log likelihood equals 595.142, which assesses the overall fit
of the model when only the constant is included. The overall final fit of the model
equals the second -2 Log likelihood which is 589.112. The difference in these scores
equals the chi-square which is 6.030 (p<0.05) indicating a good fit of the model. This
is the value between the initial model and the second model. This shows that being
more educated significantly predicts not placing unreasonable expectations on
themselves better than when only placing unreasonable expectations on themselves
was used on its own in the model. The R2 value for the Hosmer and Lemeshow (1989)
is .01 which is the value of the chi-square divided by the original -2 log likelihood.
The R2 for the Cox and Snell (1989) and the Nagelkirke (1991) values are .012 and
.017. This suggests that between 1.2 and 1.7 per cent of variability is explained by the
outcome (dependent) variable when qualifications is built into the model.
Table 91 Significance of Model for Pressure and Motivation Levels with Age as
Continuous Predictor Demonstrating -2 Log Likelihood & Chi-square
Initial -2 Log
likelihood
2nd
-2 Log
likelihood
Chi-square Degrees of freedom
595.142a 589.112 6.03 (p<0.05) 1
R2 = .01 (Hosmer & Lemeshow), .012 (Cox & Snell), .017 (Nagelkerke).
a Step one (qualifications).

87
1.3.2. Pressure and motivation (hours worked)
The results using the categorical predictor variables and the continuous predictor
hours worked for pressure and motivation levels will be displayed. The categorical
variable results are displayed in Table 92. Table 92 shows that when placing
unreasonable pressure on themselves in relation to work with hours worked as the
predictor, 41.7 per cent were fulltimers, 46.9 per cent of nurses and midwives
possessed a degree and 11.4 per cent lived alone. This means that when using hours
worked as the predictor in the equation for logistic regression, over two-fifths (41.7%)
scoring moderate to high pressure and motivation levels worked fulltime, almost half
(46.9%) scoring moderate to high pressure and motivation levels possessed a degree
and a minority (11.4%) scoring moderate to high pressure and motivation levels lived
alone.
Table 92 Categorical Variable Results for Pressure and Motivation Levels in
Relation to Work With Hours Worked as Continuous Predictor
Categorical results for Pressure and Motivation Levels
Predictor- hours worked
Fulltime Yes Number = 208 41.7%
N = 499 No Number = 291 58.3%
Possesses a degree Yes Number = 234 46.9%
N = 499 No Number = 265 53.1%
Live alone Yes Number = 57 11.4%
N = 499 No Number = 442 88.6%
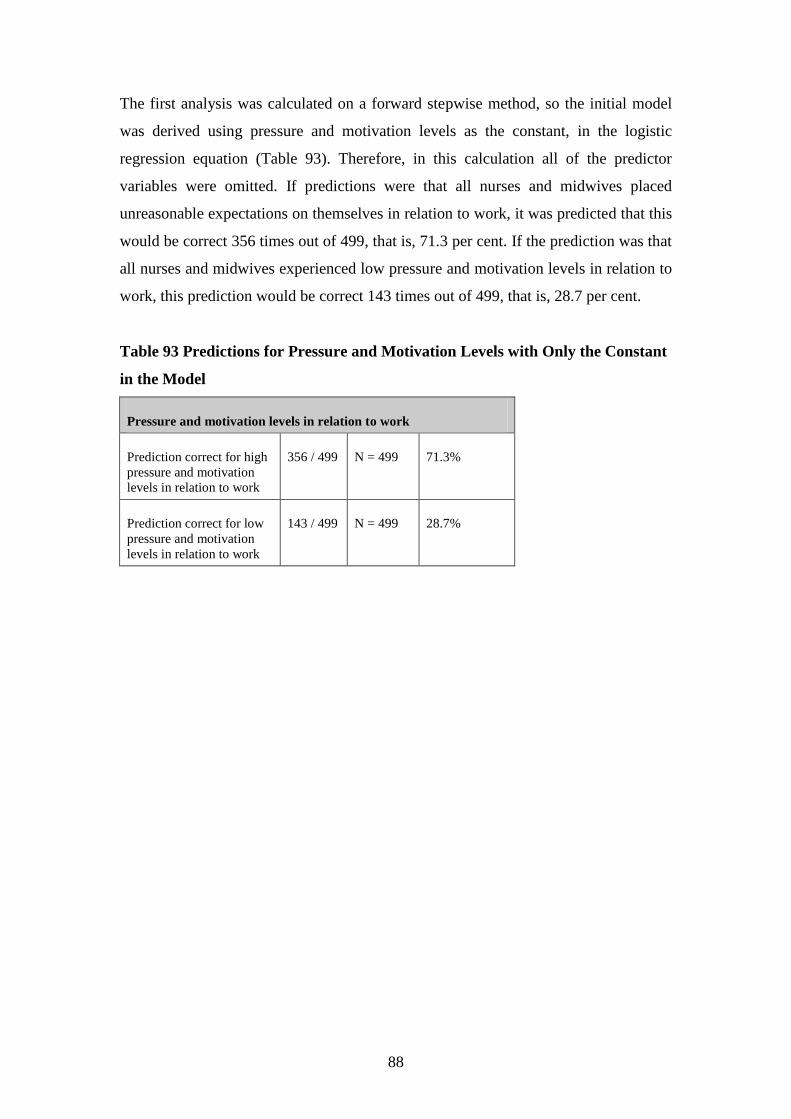
88
The first analysis was calculated on a forward stepwise method, so the initial model
was derived using pressure and motivation levels as the constant, in the logistic
regression equation (Table 93). Therefore, in this calculation all of the predictor
variables were omitted. If predictions were that all nurses and midwives placed
unreasonable expectations on themselves in relation to work, it was predicted that this
would be correct 356 times out of 499, that is, 71.3 per cent. If the prediction was that
all nurses and midwives experienced low pressure and motivation levels in relation to
work, this prediction would be correct 143 times out of 499, that is, 28.7 per cent.
Table 93 Predictions for Pressure and Motivation Levels with Only the Constant
in the Model
Pressure and motivation levels in relation to work
Prediction correct for high
pressure and motivation
levels in relation to work
356 / 499 N = 499 71.3%
Prediction correct for low
pressure and motivation
levels in relation to work
143 / 499 N = 499 28.7%

89
The next calculation included the categorical predictor variables and the continuous
predictor hours worked for pressure and motivation levels. Parameter codings were
assigned to the categorical variables to determine the probability of outcome variables
(Table 94).
Table 94 Categorical Variable Codings for Pressure and Motivation Levels with
Hours Worked as Continuous Predictor
Predictor- hours worked Parameter coding
Category Frequency (1)
Fulltime No 291 0
Yes 208 1
Possesses a degree No 265 1
Yes 234 0
Live alone No 442 1
Yes 57 0
As qualifications was the highest score statistic (Table 95) compared to the other
variables, this was entered into the model.
Table 95 Variables Not in the Equation (when only constant used) for Pressure
and Motivation Levels in Calculation with Hours Worked as Continuous
Predictor
Predictor- hours worked Score df Sig.
Variables Step 0 Fulltime (1) 0.525 1 0.469
Qualifications (1) 5.723 1 0.017
Live alone (1) 1.077 1 0.299
Hours worked 4.593 1 0.032
Overall statistics 10.868 4 0.028
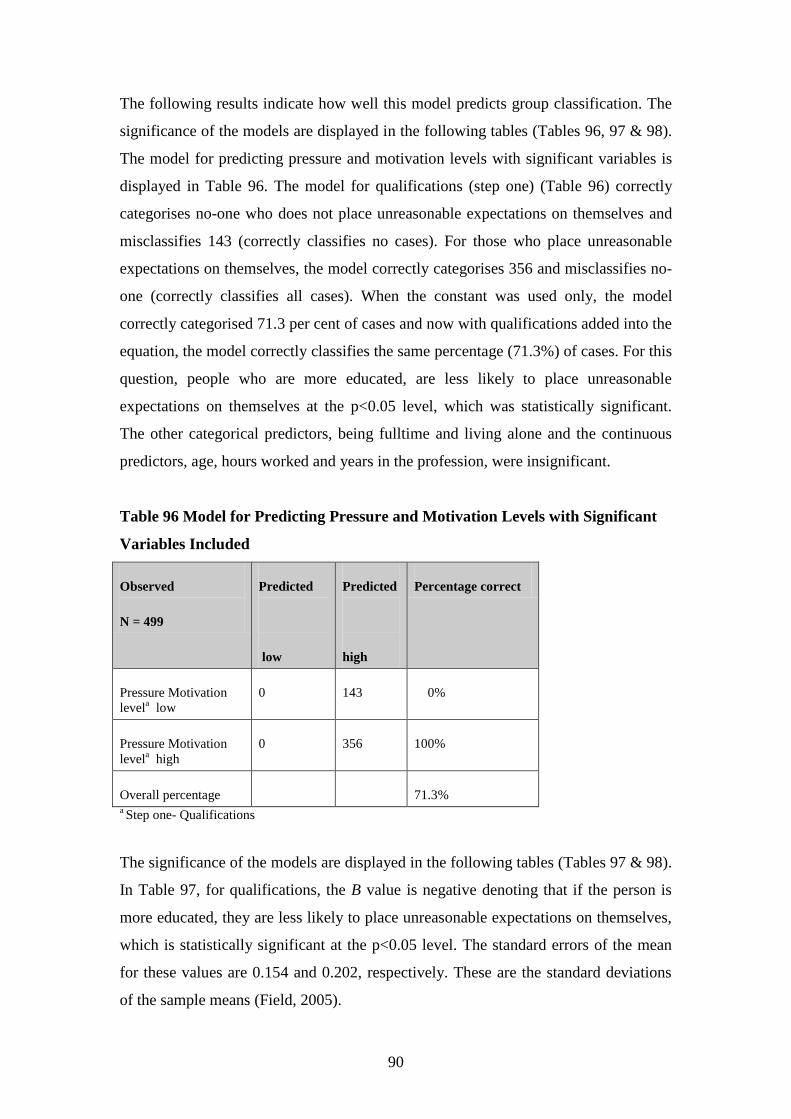
90
The following results indicate how well this model predicts group classification. The
significance of the models are displayed in the following tables (Tables 96, 97 & 98).
The model for predicting pressure and motivation levels with significant variables is
displayed in Table 96. The model for qualifications (step one) (Table 96) correctly
categorises no-one who does not place unreasonable expectations on themselves and
misclassifies 143 (correctly classifies no cases). For those who place unreasonable
expectations on themselves, the model correctly categorises 356 and misclassifies no-
one (correctly classifies all cases). When the constant was used only, the model
correctly categorised 71.3 per cent of cases and now with qualifications added into the
equation, the model correctly classifies the same percentage (71.3%) of cases. For this
question, people who are more educated, are less likely to place unreasonable
expectations on themselves at the p<0.05 level, which was statistically significant.
The other categorical predictors, being fulltime and living alone and the continuous
predictors, age, hours worked and years in the profession, were insignificant.
Table 96 Model for Predicting Pressure and Motivation Levels with Significant
Variables Included
Observed
N = 499
Predicted
low
Predicted
high
Percentage correct
Pressure Motivation
levela low
0 143 0%
Pressure Motivation
levela
high
0 356 100%
Overall percentage 71.3% a Step one- Qualifications
The significance of the models are displayed in the following tables (Tables 97 & 98).
In Table 97, for qualifications, the B value is negative denoting that if the person is
more educated, they are less likely to place unreasonable expectations on themselves,
which is statistically significant at the p<0.05 level. The standard errors of the mean
for these values are 0.154 and 0.202, respectively. These are the standard deviations
of the sample means (Field, 2005).

91
The Wald statistics are considerably different from 0 (Table 97), the predictor making
a substantial contribution to predicting the outcome. The degrees of freedom (df) are
equal to 1 which relates to number of observations able to vary (Field, 2005). The exp
b (0.618) for qualifications is the value of the odds ratio which is only a guess or point
estimate of the true value, given the sample data. If the person is more educated, the
odds for placing unreasonable expectations on themselves is 0.618 times lower than
for someone less educated. The confidence interval (95% CI) is more accurate for the
variable qualifications meaning that there is 95 per cent confidence that the value of
the odds ratio in this sample population lies between 0.416 and 0.908.
Table 97 Significance of Model for Pressure and Motivation Level with Hours
Worked as Continuous Predictor
N=499 B(SE) Wald df exp b 95% CI
Included Predictor- hours worked
Constant 1.180* 58.587 1 3.255
(0.154)
Qualificationsa -0.481** 5.679 1 0.618 0.416 to 0.918
(0.202)
*p<0.0001. **p<0.05. a Variable entered on step one.
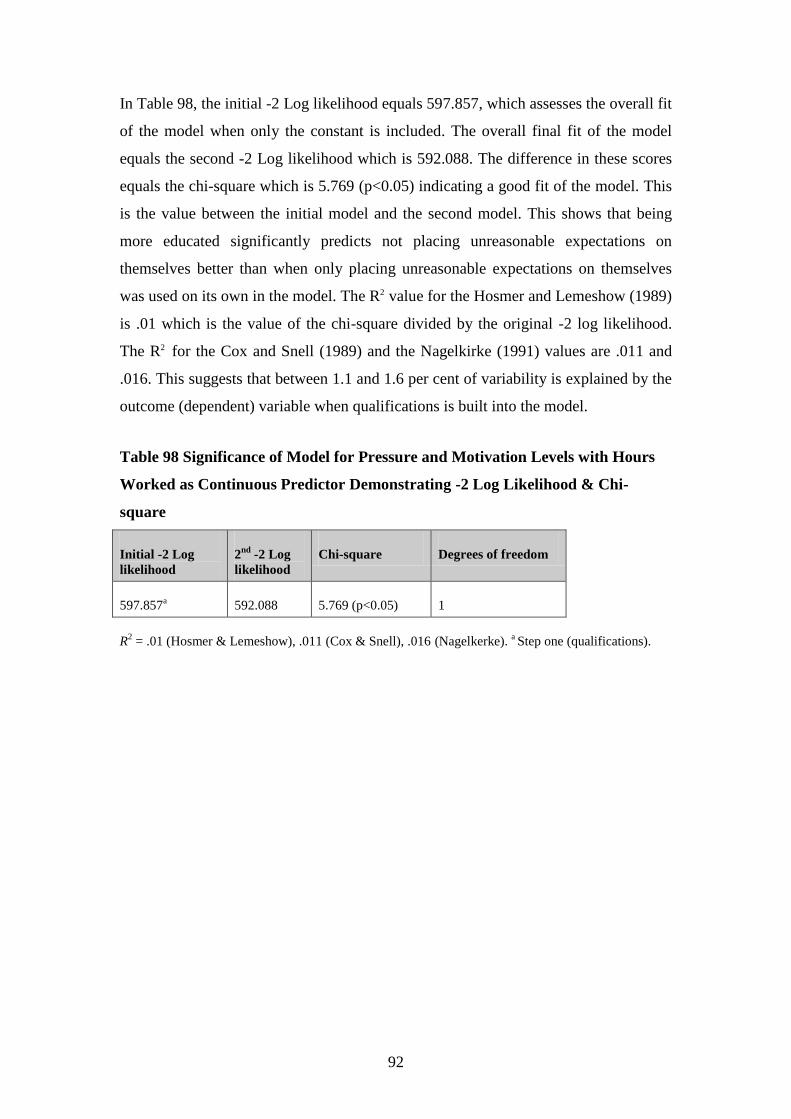
92
In Table 98, the initial -2 Log likelihood equals 597.857, which assesses the overall fit
of the model when only the constant is included. The overall final fit of the model
equals the second -2 Log likelihood which is 592.088. The difference in these scores
equals the chi-square which is 5.769 (p<0.05) indicating a good fit of the model. This
is the value between the initial model and the second model. This shows that being
more educated significantly predicts not placing unreasonable expectations on
themselves better than when only placing unreasonable expectations on themselves
was used on its own in the model. The R2 value for the Hosmer and Lemeshow (1989)
is .01 which is the value of the chi-square divided by the original -2 log likelihood.
The R2 for the Cox and Snell (1989) and the Nagelkirke (1991) values are .011 and
.016. This suggests that between 1.1 and 1.6 per cent of variability is explained by the
outcome (dependent) variable when qualifications is built into the model.
Table 98 Significance of Model for Pressure and Motivation Levels with Hours
Worked as Continuous Predictor Demonstrating -2 Log Likelihood & Chi-
square
Initial -2 Log
likelihood
2nd
-2 Log
likelihood
Chi-square Degrees of freedom
597.857a 592.088 5.769 (p<0.05) 1
R2 = .01 (Hosmer & Lemeshow), .011 (Cox & Snell), .016 (Nagelkerke).
a Step one (qualifications).

93
1.3.3. Pressure and motivation (years in profession)
The results using the categorical predictor variables and the continuous predictor
years in profession for pressure and motivation levels will be displayed. The
categorical variable results are displayed in Table 99. Table 99 shows that when
placing unreasonable pressure on themselves in relation to work with years in
profession as the predictor, 41.7 per cent were fulltimers, 47.4 per cent of nurses and
midwives possessed a degree and 11.3 per cent lived alone. This means that when
using years in profession as the predictor in the equation for logistic regression, over
two-fifths (41.7%) scoring moderate to high pressure and motivation levels worked
fulltime, almost half (47.4%) scoring moderate to high pressure and motivation levels
possessed a degree and a minority (11.3%) scoring moderate to high pressure and
motivation levels lived alone.
Table 99 Categorical Variable Results for Pressure and Motivation Levels in
Relation to Work With Years in Profession as Continuous Predictor
Categorical results for Pressure and Motivation Levels
Predictor- years in profession
Fulltime Yes Number = 207 41.7%
N = 496 No Number = 289 58.3%
Possesses a degree Yes Number = 235 47.4%
N = 496 No Number = 261 52.6%
Live alone Yes Number = 56 11.3%
N = 496 No Number = 440 88.7%

94
The first analysis was calculated on a forward stepwise method, so the initial model
was derived using pressure and motivation levels as the constant, in the logistic
regression equation (Table 100). Therefore, in this calculation all of the predictor
variables were omitted. If predictions were that all nurses and midwives placed
unreasonable expectations on themselves in relation to work, it was predicted that this
would be correct 355 times out of 496, that is, 71.6 per cent. If the prediction was that
all nurses and midwives experienced low pressure and motivation levels in relation to
work, this prediction would be correct 141 times out of 496, that is, 28.7 per cent.
Table 100 Predictions for Pressure and Motivation Levels with Only the
Constant in the Model
Pressure and motivation levels in relation to work
Prediction correct for high
pressure and motivation
levels in relation to work
355 / 496 N = 496 71.6%
Prediction correct for low
pressure and motivation
levels in relation to work
141 / 496 N = 496 28.7%
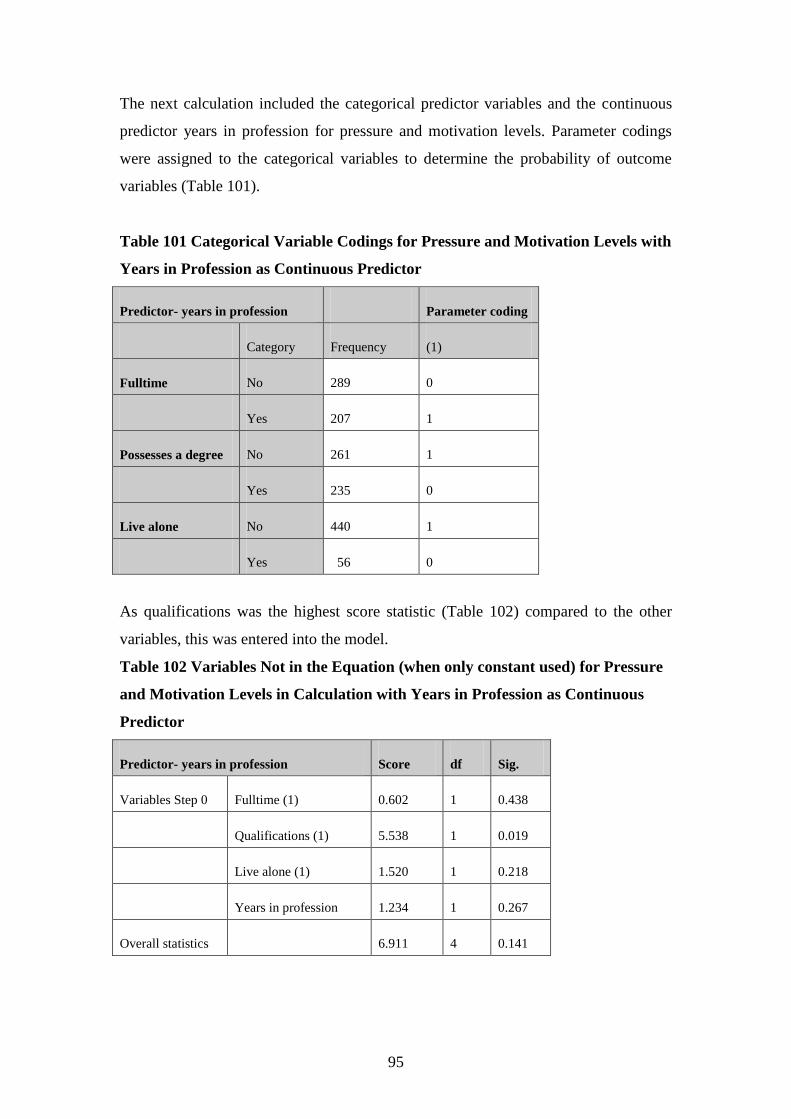
95
The next calculation included the categorical predictor variables and the continuous
predictor years in profession for pressure and motivation levels. Parameter codings
were assigned to the categorical variables to determine the probability of outcome
variables (Table 101).
Table 101 Categorical Variable Codings for Pressure and Motivation Levels with
Years in Profession as Continuous Predictor
Predictor- years in profession Parameter coding
Category Frequency (1)
Fulltime No 289 0
Yes 207 1
Possesses a degree No 261 1
Yes 235 0
Live alone No 440 1
Yes 56 0
As qualifications was the highest score statistic (Table 102) compared to the other
variables, this was entered into the model.
Table 102 Variables Not in the Equation (when only constant used) for Pressure
and Motivation Levels in Calculation with Years in Profession as Continuous
Predictor
Predictor- years in profession Score df Sig.
Variables Step 0 Fulltime (1) 0.602 1 0.438
Qualifications (1) 5.538 1 0.019
Live alone (1) 1.520 1 0.218
Years in profession 1.234 1 0.267
Overall statistics 6.911 4 0.141

96
The following results indicate how well this model predicts group classification. The
significance of the models are displayed in the following tables (Tables 103, 104 &
105). The model for predicting pressure and motivation levels with significant
variables is displayed in Table 103. The model for qualifications (step one) (Table
103) correctly categorises no-one who does not place unreasonable expectations on
themselves and misclassifies 141 (correctly classifies no cases). For those who place
unreasonable expectations on themselves, the model correctly categorises 355 and
misclassifies no-one (correctly classifies all cases). When the constant was used only,
the model correctly categorised 71.6 per cent of cases and now with qualifications
added into the equation, the model correctly classifies the same percentage (71.6%) of
cases. For this question, people who are more educated, are less likely to place
unreasonable expectations on themselves at the p<0.05 level, which was statistically
significant. The other categorical predictors, being fulltime and living alone and the
continuous predictors, age, hours worked and years in the profession, were
insignificant.
Table 103 Model for Predicting Pressure and Motivation Levels with Significant
Variables Included
Observed
N = 496
Predicted
low
Predicted
high
Percentage correct
Pressure Motivation
levela low
0 141 0%
Pressure Motivation
levela
high
0 355 100%
Overall percentage 71.6% a Step one- Qualifications

97
The significance of the models are displayed in the following tables (Tables 104 &
105). In Table 104, for qualifications, the B value is negative denoting that if the
person is more educated, they are less likely to place unreasonable expectations on
themselves, which is statistically significant at the p<0.05 level. The standard errors
of the mean for these values are 0.154 and 0.203, respectively. These are the standard
deviations of the sample means (Field, 2005).
The Wald statistics are considerably different from 0 (Table 105), the predictor
making a substantial contribution to predicting the outcome. The degrees of freedom
(df) are equal to 1 which relates to number of observations able to vary (Field, 2005).
The exp b (0.622) for qualifications is the value of the odds ratio which is only a
guess or point estimate of the true value, given the sample data. If the person is more
educated, the odds for placing unreasonable expectations on themselves is 0.622 times
lower than for someone less educated. The confidence interval (95% CI) is more
accurate for the variable qualifications meaning that there is 95 per cent confidence
that the value of the odds ratio in this sample population lies between 0.418 and
0.925.
Table 104 Significance of Model for Pressure and Motivation Level with Years
as Continuous Predictor
N=496 B(SE) Wald df exp b 95% CI
Included Predictor- years in profession
Constant 1.186* 59.219 1 3.273
(0.154)
Qualificationsa -0.475** 5.497 1 0.622 0.418 to 0.925
(0.203)
*p<0.0001. **p<0.05. a Variable entered on step one.

98
In Table 105, the initial -2 Log likelihood equals 592.169, which assesses the overall
fit of the model when only the constant is included. The overall final fit of the model
equals the second -2 Log likelihood which is 586.591. The difference in these scores
equals the chi-square which is 5.578 (p<0.05) indicating a good fit of the model. This
is the value between the initial model and the second model. This shows that being
more educated significantly predicts not placing unreasonable expectations on
themselves better than when only placing unreasonable expectations on themselves
was used on its own in the model. The R2 value for the Hosmer and Lemeshow (1989)
is 0.1 which is the value of the chi-square divided by the original -2 log likelihood.
The R2 for the Cox and Snell (1989) and the Nagelkirke (1991) values are .011 and
.016. This suggests that between 1.1 and 1.6 per cent of variability is explained by the
outcome (dependent) variable when qualifications is built into the model.
Table 105 Significance of Model for Pressure and Motivation Levels with Years
in Profession as Continuous Predictor Demonstrating -2 Log Likelihood & Chi-
square
Initial -2 Log
likelihood
2nd
-2 Log
likelihood
Chi-square Degrees of freedom
592.169a 586.591 5.578 (p<0.05) 1
R2 = 0.1 (Hosmer & Lemeshow), .011 (Cox & Snell), .016 (Nagelkerke).
a Step one (qualifications).

99
2. Statistically non-significant findings
Insignificant findings (p>0.05) were found in relation to individual responses to stress
and burnout.
2.1. Stress
Different variables did not predict whether respondents were more likely to
experience stress overall. In particular:
if the person was older, worked more hours per week, worked more years in
the profession, worked fulltime as opposed to part-time, was more educated
and whether they lived alone (p>0.05).
The following section presents more detailed information relating to overall stress
levels.

100
2.1.1. Stress levels (age)
Stress levels were calculated with the continuous predictor age being used for the
analysis and the categorical variable results are displayed in the following table (Table
106). Table 106 shows that for stress levels with age as the predictor, 41.7 per cent
were fulltimers, 46.4 per cent of nurses and midwives possessed a degree and 12.3 per
cent lived alone. This means that when using age as the predictor in the equation for
logistic regression, over two-fifths (41.7%) experiencing moderate to high levels of
stress worked fulltime, almost half (46.4%) experiencing moderate to high levels of
stress possessed a degree and a minority (12.3%) experiencing moderate to high
levels of stress lived alone.
Table 106 Categorical Variable Results for Stress Levels with Age as Continuous
Predictor
Categorical results for stress levels
Predictor- age
Fulltime Yes Number = 204 41.7%
N = 489 No Number = 285 58.3%
Possesses a degree Yes Number = 227 46.4%
N = 489 No Number = 262 53.6%
Live alone Yes Number = 60 12.3%
N = 489 No Number = 429 87.7%

101
The first analysis was calculated on a forward stepwise method, so the initial model
was derived using stress as the constant in the logistic regression equation. Therefore,
in this calculation all of the predictor variables were omitted. If predictions were that
all nurses and midwives experienced high stress levels in relation to work, this would
be correct 304 times out of 489, that is, 62.2 per cent. If the prediction was that all
nurses and midwives experienced low stress levels in relation to work, this prediction
would be correct 185 times out of 489, that is, 37.8 per cent (Table 107).
Table 107 Predictions for Stress Levels with Only Constant in the Model
Stress levels in relation to work
Prediction correct for high
stress levels
304 / 489 N = 489 62.2%
Prediction correct for low
stress levels
185 / 489 N = 489 37.8%
The next calculation included the categorical predictor variables and the continuous
predictor age for experiencing stress which did not have any significant effect.

102
2.1.2. Stress levels (hours worked)
Stress levels were calculated with the continuous predictor hours worked being used
for the analysis and the categorical variable results are displayed in the following
table (Table 108). Table 108 shows that for stress levels with hours worked as the
predictor, 41.6 per cent were fulltimers, 46.3 per cent of nurses and midwives
possessed a degree and 12 per cent lived alone. This means that when using hours
worked as the predictor in the equation for logistic regression, over two fifths (41.6%)
experiencing moderate to high levels of stress worked fulltime, almost half (46.3%)
experiencing moderate to high levels of stress possessed a degree and a minority
(12%) experiencing moderate to high levels of stress lived alone.
Table 108 Categorical Variable Results for Stress Levels with Hours Worked as
Continuous Predictor
Categorical results for stress levels
Predictor- hours worked
Fulltime Yes Number = 204 41.6%
N = 490 No Number = 286 58.4%
Possesses a degree Yes Number = 227 46.3%
N = 490 No Number = 263 53.7%
Live alone Yes Number = 59 12.0%
N = 490 No Number = 431 88.0%

103
The first analysis was calculated on a forward stepwise method, so the initial model
was derived using stress as the constant in the logistic regression equation. Therefore,
in this calculation all of the predictor variables were omitted. If predictions were that
all nurses and midwives experienced high stress levels in relation to work, this would
be correct 306 times out of 490, that is, 62.4 per cent. If the prediction was that all
nurses and midwives experienced low stress levels in relation to work, this prediction
would be correct 184 times out of 490, that is, 37.6 per cent (Table 109).
Table 109 Predictions for Stress Levels with Only Constant in the Model
Stress levels in relation to work
Prediction correct for high
stress levels
306 / 490 N = 490 62.4%
Prediction correct for low
stress levels
184 / 490 N = 490 37.6%
The next calculation included the categorical predictor variables and the continuous
predictor hours worked for experiencing stress which did not have any significant
effect.

104
2.1.3. Stress levels (years in profession )
Stress levels were calculated with the continuous predictor years in profession being
used for the analysis and the categorical variable results are displayed in the following
table (Table 110). Table 110 shows that for stress levels with years in profession as
the predictor, 41.9 per cent were fulltimers, 46.8 per cent of nurses and midwives
possessed a degree and 12.1 per cent lived alone. This means that when using years in
profession as the predictor in the equation for logistic regression, over two-fifths
(41.9%) experiencing moderate to high levels of stress worked fulltime, almost half
(46.8%) experiencing moderate to high levels of stress possessed a degree and a
minority (12.1%) experiencing moderate to high levels of stress lived alone.
Table 110 Categorical Variable Results for Stress Levels with Years in
Profession as Continuous Predictor
Categorical results for stress levels
Predictor- years in profession
Fulltime Yes Number = 205 41.9%
N = 489 No Number = 284 58.1%
Possesses a degree Yes Number = 229 46.8%
N = 489 No Number = 260 53.2%
Live alone Yes Number = 59 12.1%
N = 489 No Number = 430 87.9%

105
The first analysis was calculated on a forward stepwise method, so the initial model
was derived using stress as the constant in the logistic regression equation. Therefore,
in this calculation all of the predictor variables were omitted. If predictions were that
all nurses and midwives experienced high stress levels in relation to work, this would
be correct 305 times out of 489, that is, 62.4 per cent. If the prediction was that all
nurses and midwives experienced low stress levels in relation to work, this prediction
would be correct 184 times out of 489, that is, 37.6 per cent (Table 111).
Table 111 Predictions for Stress Levels with Only Constant in the Model
Stress levels in relation to work
Prediction correct for high
stress levels
305 / 489 N = 489 62.4%
Prediction correct for low
stress levels
184 / 489 N = 489 37.6%
The next calculation included the categorical predictor variables and the continuous
predictor years in profession for experiencing stress which did not have any
significant effect.
Different variables did not predict whether respondents were more likely to
experience sleeplessness, experience headaches requiring analgesia, require treatment
for stress, take “mental health” leave, experience depression and want to change area
of practice. In particular:
if the person worked fulltime as opposed to part time, this did not predict any
significant findings for any of the above variables (p>0.05);
if the person was better educated, this did not predict any significant findings
for any of the above variables (p>0.05);
if the person lived alone, this did not predict any significant findings for the
above variables (p>0.05);
if the person was older, this did not predict any significant findings for the
above variables (p>0.05) except for taking “mental health” leave (p<0.0001);

106
if the person worked more hours, this did not predict any significant findings
for the above variables (p>0.05) except for experiencing sleeplessness
(p<0.01) and
the longer the person worked in the profession, this did not predict any
significant findings for the above variables (p>0.05) except for taking “mental
health” leave (p<0.0001).
The following section presents more detailed information relating to stress concerning
experiencing sleeplessness, experiencing headaches, stress requiring treatment, taking
“mental health” leave, length of depression and wanting to change area of practice.

107
2.1.4. Sleeplessness (age)
The question, “How often do you experience sleeplessness in relation to work?” was
calculated with the continuous predictor age being used for the analysis and the
categorical variable results are displayed in the following table (Table 112). Table 112
shows that when experiencing sleeplessness with age as the predictor, 41.9 per cent
were fulltimers, 47.1 per cent of nurses and midwives possessed a degree and 12.1 per
cent lived alone. This means that when using age as the predictor in the equation for
logistic regression, over two-fifths (41.9%) experiencing sleeplessness worked
fulltime, almost half (47.1%) experiencing sleeplessness possessed a degree and a
minority (12.1%) experiencing sleeplessness lived alone.
Table 112
Categorical Variable Results for Sleeplessness with Age as Continuous Predictor
Categorical results- How often do you experience sleeplessness?
Predictor- age
Fulltime Yes Number = 211 41.9%
N = 503 No Number = 292 58.1%
Possesses a degree Yes Number = 237 47.1%
N = 503 No Number = 266 52.9%
Live alone Yes Number = 61 12.1%
N = 503 No Number = 442 87.9%

108
The first analysis was calculated on a forward stepwise method, so the initial model
was derived using the constant, “How often do you experience sleeplessness in
relation to work?”, in the logistic regression equation. Therefore, in this calculation all
of the predictor variables were omitted. If predictions were that all nurses and
midwives experienced sleeplessness, this would be correct 186 times out of 503, that
is, 63 per cent. If the prediction was that all nurses and midwives did not experience
sleeplessness, this prediction would be correct 317 times out of 503, that is, 37 per
cent (Table 113).
Table 113 Predictions for Sleeplessness with Only Constant in the Model
Question: How often do you experience sleeplessness?
Prediction correct for
experiencing sleeplessness
186 / 503 N = 503 63.0%
Prediction correct for not
experiencing sleeplessness
317 / 503 N = 503 37.0%
The next calculation included the categorical predictor variables and the continuous
predictor age for the question, “How often do you experience sleeplessness in relation
to work?” which did not have any significant effect.

109
2.1.5. Sleeplessness (years in profession)
The question, “How often do you experience sleeplessness in relation to work?” was
calculated with the continuous predictor years in profession being used for the
analysis and the categorical variable results are displayed in the following table (Table
114). Table 114 shows that when experiencing sleeplessness with years in profession
as the predictor, 41.9 per cent were fulltimers, 47.1 per cent of nurses and midwives
possessed a degree and 12.1 per cent lived alone. This means that when using years in
profession as the predictor in the equation for logistic regression, over two-fifths
(42%) experiencing sleeplessness worked fulltime, almost half (47.3%) experiencing
sleeplessness possessed a degree and a minority (11.9%) experiencing sleeplessness
lived alone.
Table 114 Categorical Variable Results for Sleeplessness with Years in
Profession as Continuous Predictor
Categorical results- How often do you experience sleeplessness?
Predictor- years in profession
Fulltime Yes Number = 212 42.0%
N = 505 No Number = 293 58.0%
Possesses a degree Yes Number = 239 47.3%
N = 505 No Number = 266 52.7%
Live alone Yes Number = 60 11.9%
N = 505 No Number = 445 88.1%

110
The first analysis was calculated on a forward stepwise method, so the initial model
was derived using the constant, “How often do you experience sleeplessness in
relation to work?”, in the logistic regression equation. Therefore, in this calculation all
of the predictor variables were omitted. If predictions were that all nurses and
midwives experienced sleeplessness, this would be correct 186 times out of 505, that
is, 63.2 per cent. If the prediction was that all nurses and midwives did not experience
sleeplessness, this prediction would be correct 319 times out of 505, that is, 36.8 per
cent (Table 115).
Table 115 Predictions for Sleeplessness with Only Constant in the Model
Question: How often do you experience sleeplessness?
Prediction correct for
experiencing sleeplessness
186 / 505 N = 505 36.8%
Prediction correct for not
experiencing sleeplessness
319 / 505 N = 505 63.2%
The next calculation included the categorical predictor variables and the continuous
predictor years in profession for the question, “How often do you experience
sleeplessness in relation to work?” which did not have any significant effect.

111
2.1.6. Experiencing headaches (age)
The question, “Do you experience headaches that require analgesia?” was calculated
with the continuous predictor age being used for the analysis and the categorical
variable results are displayed in the following table (Table 116). Table 116 shows that
when experiencing headaches with age as the predictor, 41.9 per cent were fulltimers,
47.3 per cent of nurses and midwives possessed a degree and 12.1 per cent lived
alone. This means that when using age as the predictor in the equation for logistic
regression, over two-fifths (41.9%) experiencing headaches worked fulltime, almost
half (47.3%) experiencing headaches possessed a degree and a minority (12.1%)
experiencing headaches lived alone.
Table 116 Categorical Variable Results for Experiencing Headaches with Age as
Continuous Predictor
Categorical results- Do you experience headaches that require
analgesia?
Predictor- age
Fulltime Yes Number = 211 41.9%
N = 503 No Number = 292 58.1%
Possesses a degree Yes Number = 238 47.3%
N = 503 No Number = 265 52.7%
Live alone Yes Number = 61 12.1%
N = 503 No Number = 442 87.9%

112
The first analysis was calculated on a forward stepwise method, so the initial model
was derived using the constant, “Do you experience headaches that require
analgesia?”, in the logistic regression equation. Therefore, in this calculation all of the
predictor variables were omitted. If predictions were that all nurses and midwives
experienced headaches, this would be correct 189 times out of 503, that is, 62.4 per
cent. If the prediction was that all nurses and midwives did not experience headaches,
this prediction would be correct 314 times out of 503, that is, 37.6 per cent (Table
117).
Table 117
Predictions for Experiencing Headaches with Only Constant in the Model
Question: Do you experience headaches that require analgesia?
Prediction correct for
experiencing sleeplessness
189 / 503 N = 503 37.6%
Prediction correct for not
experiencing sleeplessness
314 / 503 N = 503 62.4%
The next calculation included the categorical predictor variables and the continuous
predictor age for the question, “Do you experience headaches that require analgesia?”
which did not have any significant effect.

113
2.1.7. Experiencing headaches (hours worked)
The question, “Do you experience headaches that require analgesia?” was calculated
with the continuous predictor hours worked being used for the analysis and the
categorical variable results are displayed in the following table (Table 118). Table 118
shows that when experiencing headaches with hours worked as the predictor, 41.8 per
cent were fulltimers, 46.9 per cent of nurses and midwives possessed a degree and
11.8 per cent lived alone. This means that when using hours worked as the predictor
in the equation for logistic regression, over two-fifths (41.8%) experiencing
headaches worked fulltime, almost half (46.9%) experiencing headaches possessed a
degree and a minority (11.8%) experiencing headaches lived alone.
Table 118 Categorical Variable Results for Experiencing Headaches with Hours
Worked as Continuous Predictor
Categorical results- Do you experience headaches that require
analgesia?
Predictor- hours worked
Fulltime Yes Number = 212 41.8%
N = 507 No Number = 295 58.2%
Possesses a degree Yes Number = 238 46.9%
N = 507 No Number = 269 53.1%
Live alone Yes Number = 60 11.8%
N = 507 No Number = 447 88.2%
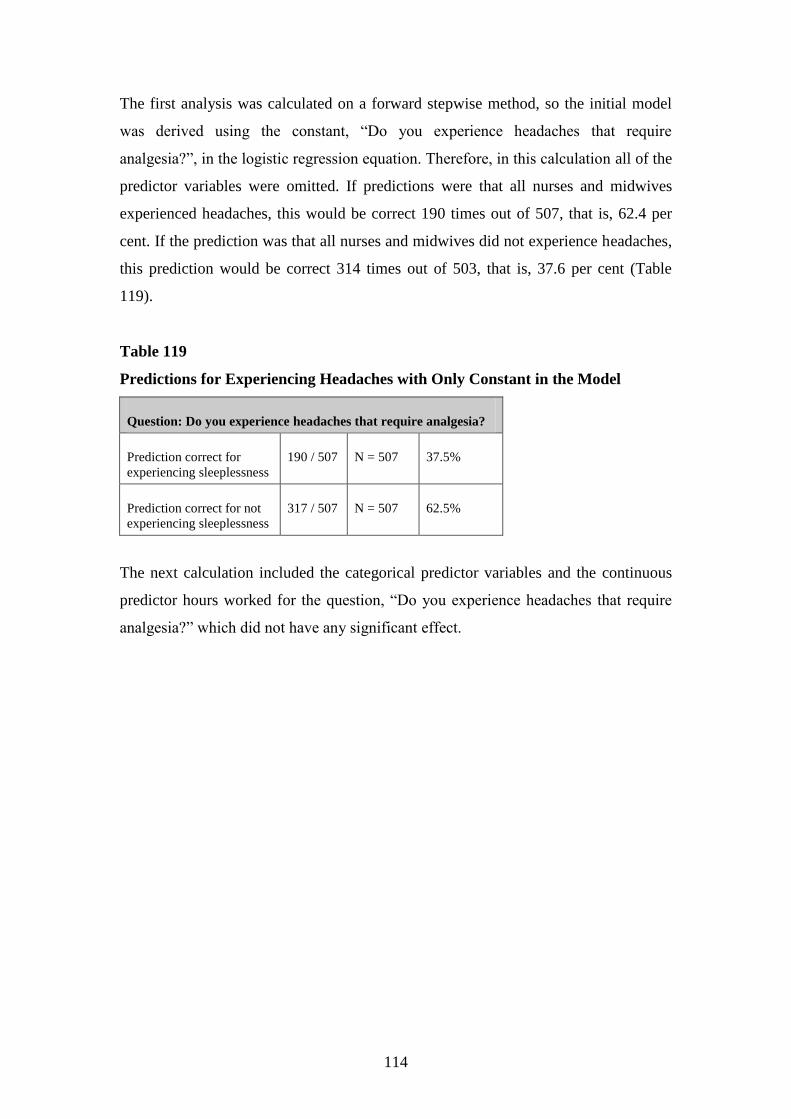
114
The first analysis was calculated on a forward stepwise method, so the initial model
was derived using the constant, “Do you experience headaches that require
analgesia?”, in the logistic regression equation. Therefore, in this calculation all of the
predictor variables were omitted. If predictions were that all nurses and midwives
experienced headaches, this would be correct 190 times out of 507, that is, 62.4 per
cent. If the prediction was that all nurses and midwives did not experience headaches,
this prediction would be correct 314 times out of 503, that is, 37.6 per cent (Table
119).
Table 119
Predictions for Experiencing Headaches with Only Constant in the Model
Question: Do you experience headaches that require analgesia?
Prediction correct for
experiencing sleeplessness
190 / 507 N = 507 37.5%
Prediction correct for not
experiencing sleeplessness
317 / 507 N = 507 62.5%
The next calculation included the categorical predictor variables and the continuous
predictor hours worked for the question, “Do you experience headaches that require
analgesia?” which did not have any significant effect.

115
2.1.8. Experiencing headaches (years in profession)
The question, “Do you experience headaches that require analgesia?” was calculated
with the continuous predictor years in profession being used for the analysis and the
categorical variable results are displayed in the following table (Table 120). Table 120
shows that when experiencing headaches with years in the profession as the predictor,
42.1 per cent were fulltimers, 47.4 per cent of nurses and midwives possessed a
degree and 11.9 per cent lived alone. This means that when using years in profession
as the predictor in the equation for logistic regression, over two-fifths (42.1%)
experiencing headaches worked fulltime, almost half (47.4%) experiencing headaches
possessed a degree and a minority (11.9%) experiencing headaches lived alone.
Table 120 Categorical Variable Results for Experiencing Headaches with Years
in Profession as Continuous Predictor
Categorical results- Do you experience headaches that require
analgesia?
Predictor- years in profession
Fulltime Yes Number = 213 42.1%
N = 506 No Number = 293 57.9%
Possesses a degree Yes Number = 240 47.4%
N = 506 No Number = 266 52.6%
Live alone Yes Number = 60 11.9%
N = 506 No Number = 446 88.1%

116
The first analysis was calculated on a forward stepwise method, so the initial model
was derived using the constant, “Do you experience headaches that require
analgesia?”, in the logistic regression equation. Therefore, in this calculation all of the
predictor variables were omitted. If predictions were that all nurses and midwives
experienced headaches, this would be correct 190 times out of 506, that is, 62.5 per
cent. If the prediction was that all nurses and midwives did not experience headaches,
this prediction would be correct 316 times out of 506, that is, 37.5 per cent (Table
121).
Table 121
Predictions for Experiencing Headaches with Only Constant in the Model
Question: Do you experience headaches that require analgesia?
Prediction correct for
experiencing sleeplessness
190 / 506 N = 506 37.5%
Prediction correct for not
experiencing sleeplessness
316 / 506 N = 506 62.5%
The next calculation included the categorical predictor variables and the continuous
predictor years in the profession for the question, “Do you experience headaches that
require analgesia?” which did not have any significant effect.

117
2.1.9. Stress requiring treatment (age)
The question, “Do you experience “stress” that requires treatment? For example,
panadol, massages” was calculated with the continuous predictor age being used for
the analysis and the categorical variable results are displayed in the following table
(Table 122). Table 122 shows that when treatment for stress was required with age as
the predictor, 42.3 per cent were fulltimers, 47.1 per cent of nurses and midwives
possessed a degree and 12.1 per cent lived alone. This means that when using age as
the predictor in the equation for logistic regression, over two-fifths (42.3%) who
required treatment for stress worked fulltime, almost half (47.1%) who required
treatment for stress possessed a degree and a minority (12.1%) who required
treatment for stress lived alone.
Table 122 Categorical Variable Results for Stress Requiring Treatment with Age
as Continuous Predictor
Categorical results- Do you experience “stress” that requires
treatment?
Predictor- age
Fulltime Yes Number = 213 42.3%
N = 503 No Number = 290 57.7%
Possesses a degree Yes Number = 237 47.1%
N = 503 No Number = 266 52.9%
Live alone Yes Number = 61 12.1%
N = 503 No Number = 442 87.9%

118
The first analysis was calculated on a forward stepwise method, so the initial model
was derived using the constant, “Do you experience “stress” that requires treatment?”,
in the logistic regression equation. Therefore, in this calculation all of the predictor
variables were omitted. If predictions were that all nurses and midwives required
treatement for stress, this would be correct 385 times out of 503, that is, 76.5 per cent.
If the prediction was that all nurses and midwives did not require treatment for stress,
this prediction would be correct 118 times out of 503, that is, 23.5 per cent (Table
123).
Table 123
Predictions for Stress Requiring Treatment with Only Constant in the Model
Question: Do you experience “stress” that requires treatment?
Prediction correct for
stress requiring treatment
385 / 503 N = 503 76.5%
Prediction correct for not
requiring treatment for
stress
118 / 503 N = 503 23.5%
The next calculation included the categorical predictor variables and the continuous
predictor age for the question, “Do you experience “stress” that requires treatment?”
which did not have any significant effect.

119
2.1.10. Stress requiring treatment (hours worked)
The question, “Do you experience “stress” that requires treatment?” was used with the
continuous predictor hours worked for this analysis. Table 124 shows that when
treatment for stress was required with hours worked as the predictor, 42.1 per cent
were fulltimers, 46.8 per cent of nurses and midwives possessed a degree and 11.9 per
cent lived alone. This means that when using hours worked as the predictor in the
equation for logistic regression, over two-fifths (42.1%) who required treatment for
stress worked fulltime, almost half (46.8%) who required treatment for stress
possessed a degree and a minority (11.9%) who required treatment for stress lived
alone.
Table 124 Categorical Variable Results for Stress Requiring Treatment with
Hours Worked as Continuous Predictor
Categorical results- Do you experience “stress” that requires
treatment?
Predictor- hours worked
Fulltime Yes Number = 213 42.1%
N = 506 No Number = 293 57.9%
Possesses a degree Yes Number = 237 46.8%
N = 506 No Number = 269 53.2%
Live alone Yes Number = 60 11.9%
N = 506 No Number = 446 88.1%

120
The first analysis was calculated on a forward stepwise method, so the initial model
was derived using the constant, “Do you experience “stress” that requires treatment?”,
in the logistic regression equation. Therefore, in this calculation all of the predictor
variables were omitted. If predictions were that all nurses and midwives required
treatment for stress, this would be correct 388 times out of 506, that is, 76.7 per cent.
If the prediction was that all nurses and midwives did not require treatment for stress,
this prediction would be correct 118 times out of 506, that is, 23.3 per cent (Table
125).
Table 125
Predictions for Stress Requiring Treatment with Only Constant in the Model
Question: Do you experience “stress” that requires treatment?
Prediction correct for
stress requiring treatment
388 / 506 N = 506 76.7%
Prediction correct for not
requiring treatment for
stress
118 / 506 N = 506 23.3%
The next calculation included the categorical predictor variables and the continuous
predictor hours worked for the question, “Do you experience “stress” that requires
treatment?” which did not have any significant effect.

121
2.1.11. Stress requiring treatment (years in profession)
The same question, “Do you experience “stress” that requires treatment?” was
calculated with the continuous predictor years in profession being used for the
analysis and the categorical variable results are displayed in the following table (Table
126). Table 126 shows that when requiring treatment for stress with years in
profession as the predictor, 42.4 per cent were fulltimers, 47.3 per cent of nurses and
midwives possessed a degree and 11.9 per cent lived alone. This means that when
using years in profession as the predictor in the equation for logistic regression, over
two-fifths (42.2%) who required treatment for stress worked fulltime, almost half
(47.3%) who required treatment for stress possessed a degree and a minority (11.9%)
who required treatment for stress lived alone.
Table 126 Categorical Variable Results for Stress Requiring Treatment with
Years in Profession as Continuous Predictor
Categorical results- Do you experience “stress” that requires
treatment?
Predictor- years in profession
Fulltime Yes Number = 214 42.4%
N = 505 No Number = 291 57.6 %
Possesses a degree Yes Number = 239 47.3%
N = 505 No Number = 266 52.7%
Live alone Yes Number = 60 11.9%
N = 505 No Number = 445 88.1%

122
The first analysis was calculated on a forward stepwise method, so the initial model
was derived using the constant, “Do you experience “stress” that requires treatment?”
in the logistic regression equation. Therefore, in this calculation all of the predictor
variables were omitted. If predictions were that all nurses and midwives required
treatment for stress, this would be correct 386 times out of 505, that is, 76.4 per cent.
If the prediction was that all nurses and midwives did not require treatment for stress,
this prediction would be correct 119 times out of 505, that is, 23.6 per cent (Table
127).
Table 127
Predictions for Stress Requiring Treatment with Only Constant in the Model
Question: Do you experience “stress” that requires treatment?
Prediction correct for
stress requiring treatment
386 / 505 N = 505 76.4%
Prediction correct for not
requiring treatment for
stress
119 / 505 N = 505 23.6%
The next calculation included the categorical predictor variables and the continuous
predictor years in profession for the question, “Do you experience “stress” that
requires treatment?” which did not have any significant effect.

123
2.1.12. Mental health leave (hours worked)
The question, “Over the last year, have you taken leave as “mental health days”?” was
used with the continuous predictor hours worked for this analysis. Table 128 shows
that “mental health” leave with hours worked as the predictor, 41.8 per cent were
fulltimers, 46.7 per cent of nurses and midwives possessed a degree and 11.9 per cent
lived alone. This means that when using hours worked as the predictor in the equation
for logistic regression, over two-fifths (41.8%) who took “mental health” leave
worked fulltime, almost half (46.7%) who took “mental health” leave possessed a
degree and a minority (11.9%) who took “mental health” leave lived alone.
Table 128 Categorical Variable Results for Mental Health Leave with Hours
Worked as Continuous Predictor
Categorical results- Over the last year, have you taken leave as
“mental health” days?
Predictor- hours worked
Fulltime Yes Number = 211 41.8%
N = 505 No Number = 294 58.2%
Possesses a degree Yes Number = 236 46.7%
N = 505 No Number = 269 53.3%
Live alone Yes Number = 60 11.9%
N = 505 No Number = 445 88.1%
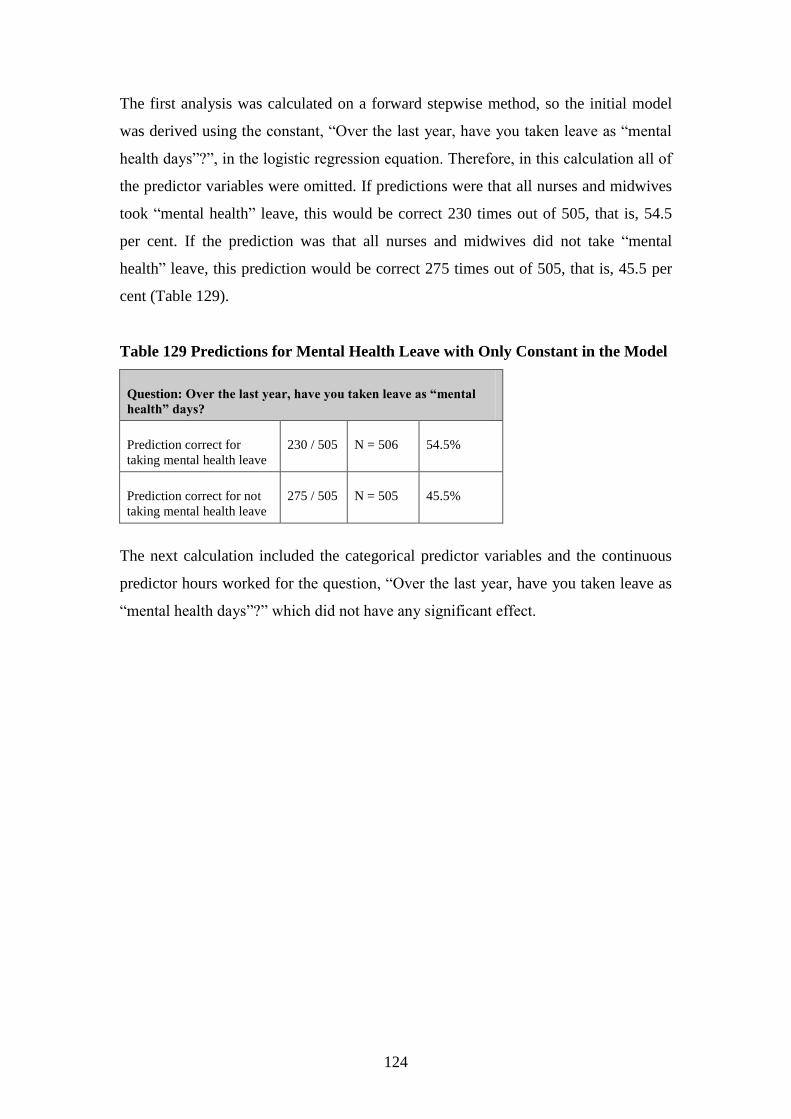
124
The first analysis was calculated on a forward stepwise method, so the initial model
was derived using the constant, “Over the last year, have you taken leave as “mental
health days”?”, in the logistic regression equation. Therefore, in this calculation all of
the predictor variables were omitted. If predictions were that all nurses and midwives
took “mental health” leave, this would be correct 230 times out of 505, that is, 54.5
per cent. If the prediction was that all nurses and midwives did not take “mental
health” leave, this prediction would be correct 275 times out of 505, that is, 45.5 per
cent (Table 129).
Table 129 Predictions for Mental Health Leave with Only Constant in the Model
Question: Over the last year, have you taken leave as “mental
health” days?
Prediction correct for
taking mental health leave
230 / 505 N = 506 54.5%
Prediction correct for not
taking mental health leave
275 / 505 N = 505 45.5%
The next calculation included the categorical predictor variables and the continuous
predictor hours worked for the question, “Over the last year, have you taken leave as
“mental health days”?” which did not have any significant effect.

125
2.1.13. Length of depression (age)
The question, “For how long at one time do you experience depression in relation to
work?” was calculated with the continuous predictor age being used for the analysis
and the categorical variable results are displayed in the following table (Table 130).
Table 130 shows that for length of depression with age as the predictor, 42 per cent
were fulltimers, 46.8 per cent of nurses and midwives possessed a degree and 12 per
cent lived alone. This means that when using age as the predictor in the equation for
logistic regression, over two-fifths (42%) experiencing depression worked fulltime,
almost half (46.8%) experiencing depression possessed a degree and a minority (12%)
experiencing depression lived alone.
Table 130 Categorical Variable Results for Length of Depression with Age as
Continuous Predictor
Categorical results- For how long at one time do you experience
depression in relation to work?
Predictor- age
Fulltime Yes Number = 210 42.0%
N = 500 No Number = 290 58.0%
Possesses a degree Yes Number = 234 46.8%
N = 500 No Number = 266 53.2%
Live alone Yes Number = 60 12.0%
N = 500 No Number = 440 88.0%

126
The first analysis was calculated on a forward stepwise method, so the initial model
was derived using the constant, “For how long at one time do you experience
depression in relation to work?”, in the logistic regression equation. Therefore, in this
calculation all of the predictor variables were omitted. If predictions were that all
nurses and midwives experience depression, this would be correct 311 times out of
500, that is, 62.2 per cent. If the prediction was that all nurses and midwives did not
experience depression, this prediction would be correct 189 times out of 500, that is,
37.8 per cent (Table 131).
Table 131 Predictions for Length of Depression with Only Constant in the Model
Question: For how long at one time do you experience
depression in relation to work?
Prediction correct for
experiencing depression
311 / 500 N = 500 62.2%
Prediction correct for not
experiencing depression
189 / 500 N = 500 37.8%
The next calculation included the categorical predictor variables and the continuous
predictor age for the question, “For how long at one time do you experience
depression in relation to work?” which did not have any significant effect.

127
2.1.14. Length of depression (hours worked)
The question, “For how long at one time do you experience depression in relation to
work?” was calculated with the continuous predictor hours worked being used for the
analysis and the categorical variable results are displayed in the following table (Table
132). Table 132 shows that for length of depression with hours worked as the
predictor, 41.9 per cent were fulltimers, 46.4 per cent of nurses and midwives
possessed a degree and 11.7 per cent lived alone. This means that when using hours
worked as the predictor in the equation for logistic regression, over two-fifths (41.9%)
experiencing depression worked fulltime, almost half (46.4%) experiencing
depression possessed a degree and a minority (11.7%) experiencing depression lived
alone.
Table 132 Categorical Variable Results for Length of Depression with Hours
Worked as Continuous Predictor
Categorical results- For how long at one time do you experience
depression in relation to work?
Predictor- hours worked
Fulltime Yes Number = 211 41.9%
N = 504 No Number = 293 58.1%
Possesses a degree Yes Number = 234 46.4%
N = 504 No Number = 270 53.6%
Live alone Yes Number = 59 11.7%
N = 504 No Number = 445 88.3%
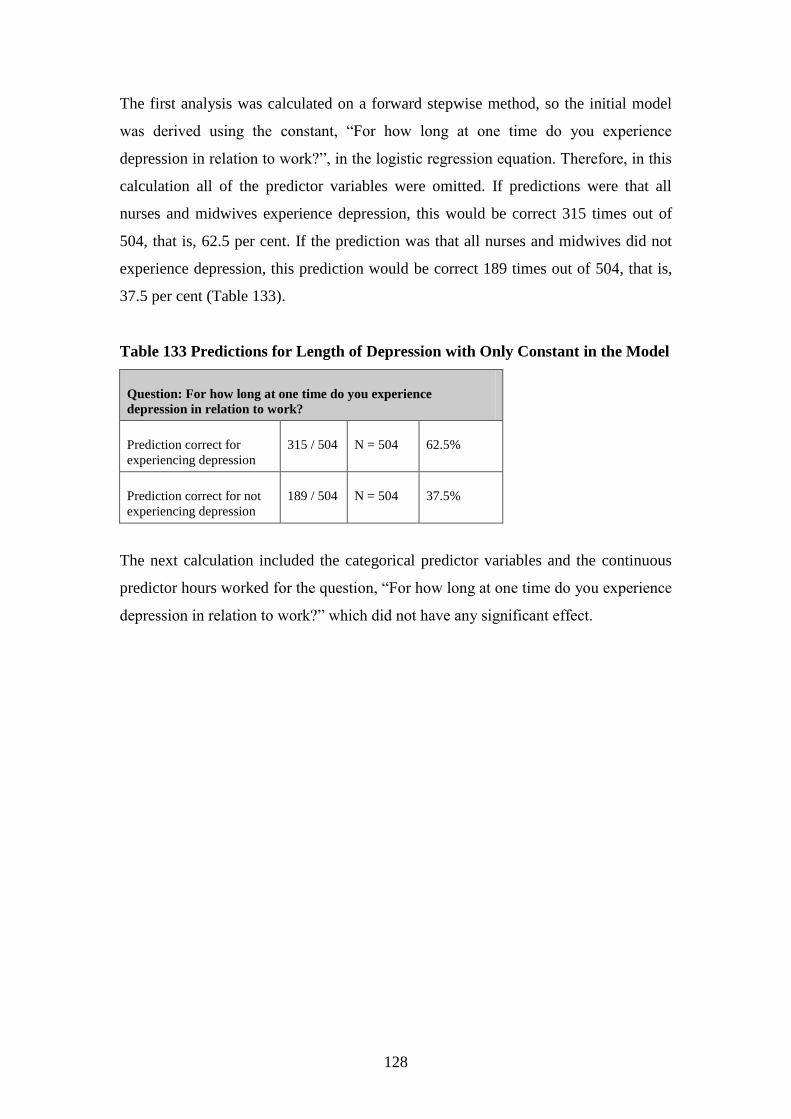
128
The first analysis was calculated on a forward stepwise method, so the initial model
was derived using the constant, “For how long at one time do you experience
depression in relation to work?”, in the logistic regression equation. Therefore, in this
calculation all of the predictor variables were omitted. If predictions were that all
nurses and midwives experience depression, this would be correct 315 times out of
504, that is, 62.5 per cent. If the prediction was that all nurses and midwives did not
experience depression, this prediction would be correct 189 times out of 504, that is,
37.5 per cent (Table 133).
Table 133 Predictions for Length of Depression with Only Constant in the Model
Question: For how long at one time do you experience
depression in relation to work?
Prediction correct for
experiencing depression
315 / 504 N = 504 62.5%
Prediction correct for not
experiencing depression
189 / 504 N = 504 37.5%
The next calculation included the categorical predictor variables and the continuous
predictor hours worked for the question, “For how long at one time do you experience
depression in relation to work?” which did not have any significant effect.

129
2.1.15. Length of depression (years in profession)
The question, “For how long at one time do you experience depression in relation to
work?” was calculated with the continuous predictor years in profession being used
for the analysis and the categorical variable results are displayed in the following
table (Table 134). Table 134 shows that for length of depression with years in
profession as the predictor, 42 per cent were fulltimers, 47 per cent of nurses and
midwives possessed a degree and 11.8 per cent lived alone. This means that when
using years in profession as the predictor in the equation for logistic regression, over
two-fifths (42%) experiencing depression worked fulltime, almost half (47%)
experiencing depression possessed a degree and a minority (11.8%) experiencing
depression lived alone.
Table 134 Categorical Variable Results for Length of Depression with Years in
Profession as Continuous Predictor
Categorical results- For how long at one time do you experience
depression in relation to work?
Predictor- years in profession
Fulltime Yes Number = 211 42.0%
N = 502 No Number = 291 58.0%
Possesses a degree Yes Number = 236 47.0%
N = 502 No Number = 266 53.0%
Live alone Yes Number = 59 11.8%
N = 502 No Number = 443 88.2%

130
The first analysis was calculated on a forward stepwise method, so the initial model
was derived using the constant, “For how long at one time do you experience
depression in relation to work?”, in the logistic regression equation. Therefore, in this
calculation all of the predictor variables were omitted. If predictions were that all
nurses and midwives experience depression, this would be correct 314 times out of
502, that is, 62.5 per cent. If the prediction was that all nurses and midwives did not
experience depression, this prediction would be correct 188 times out of 502, that is,
37.5 per cent (Table 135).
Table 135 Predictions for Length of Depression with Only Constant in the Model
Question: For how long at one time do you experience
depression in relation to work?
Prediction correct for
experiencing depression
314 / 502 N = 502 62.5%
Prediction correct for not
experiencing depression
188 / 502 N = 502 37.5%
The next calculation included the categorical predictor variables and the continuous
predictor years in profession for the question, “For how long at one time do you
experience depression in relation to work?” which did not have any significant effect.

131
2.1.16. Wanting to change area of practice (age)
The question, “Would you like to change your area of practice?” was calculated with
the continuous predictor age being used for the analysis and the categorical variable
results are displayed in the following table (Table 136). Table 136 shows that when
considering wanting to change area of practice with age as the predictor, 44.4 per cent
were fulltimers, 45.8 per cent of nurses and midwives possessed a degree and 13.1 per
cent lived alone. This means that when using age as the predictor in the equation for
logistic regression, over two-fifths (44.6%) wanting to change area of practice worked
fulltime, over two-fifths (45.3%) wanting to change area of practice possessed a
degree and a minority (12.1%) wanting to change area of practice lived alone.
Table 136 Categorical Variable Results for Wanting to Change Area of Practice
with Age as Continuous Predictor
Categorical results- Would you like to change your area of practice?
Predictor- age
Fulltime Yes Number = 133 44.6%
N = 298 No Number = 165 55.3%
Possesses a degree Yes Number = 135 45.3%
N = 298 No Number = 163 54.7%
Live alone Yes Number = 36 12.1%
N = 298 No Number = 262 87.9%

132
The first analysis was calculated on a forward stepwise method, so the initial model
was derived using the constant, “Would you like to change your area of practice?”, in
the logistic regression equation. Therefore, in this calculation all of the predictor
variables were omitted. If predictions were that all nurses and midwives wanted to
change their area of practice, this would be correct 52 times out of 298, that is, 17.4
per cent. If the prediction was that all nurses and midwives did not want to change
their area of practice, this prediction would be correct 246 times out of 298, that is,
82.6 per cent (Table 137).
Table 137 Predictions for Wanting to Change Area of Practice with Only
Constant in the Model
Question: Would you like to change your area of practice?
Prediction correct for
wanting to change area
52 / 298 N = 298 17.4%
Prediction correct for not
wanting to change area
246 / 298 N = 298 82.6%
The next calculation included the categorical predictor variables and the continuous
predictor age for the question, “Would you like to change your area of practice?”
which did not have any significant effect.

133
2.1.17. Wanting to change area of practice (hours worked)
The question, “Would you like to change your area of practice?” and the categorical
variable results are displayed in the following table (Table 138). The continuous
predictor hours worked was used for this analysis. Table 138 shows that when
considering wanting to change area of practice with hours worked as the predictor,
44.3 per cent were fulltimers, 45 per cent of nurses and midwives possessed a degree
and 12 per cent lived alone. This means that when using hours worked as the predictor
in the equation for logistic regression, over two-fifths (44.6%) wanting to change area
of practice worked fulltime, over two-fifths (45.3%) wanting to change area of
practice possessed a degree and a minority (12.1%) wanting to change area of practice
lived alone.
Table 138 Categorical Variable Results for Wanting to Change Area of Practice
with Hours Worked as Continuous Predictor
Categorical results- Would you like to change your area of practice?
Predictor- hours worked
Fulltime Yes Number = 133 44.3%
N = 300 No Number = 167 55.7%
Possesses a degree Yes Number = 135 45.0%
N = 300 No Number = 165 55.0%
Live alone Yes Number = 36 12.0%
N = 300 No Number = 264 88.0%

134
The first analysis was calculated on a forward stepwise method, so the initial model
was derived using the constant, “Would you like to change your area of practice?”, in
the logistic regression equation. Therefore, in this calculation all of the predictor
variables were omitted. If predictions were that all nurses and midwives wanted to
change their area of practice, this would be correct 52 times out of 300, that is, 17.3
per cent. If the prediction was that all nurses and midwives did not want to change
their area of practice, this prediction would be correct 248 times out of 300, that is,
82.7 per cent (Table 139).
Table 139 Predictions for Wanting to Change Area of Practice with Only
Constant in the Model
Question: Would you like to change your area of practice?
Prediction correct for
wanting to change area
52 / 300 N = 300 17.3%
Prediction correct for not
wanting to change area
248 / 300 N = 300 82.7%
The next calculation included the categorical predictor variables and the continuous
predictor hours worked for the question, “Would you like to change your area of
practice?” which did not have any significant effect.

135
2.1.18. Wanting to change area of practice (years in profession)
The question, “Would you like to change your area of practice?” was calculated with
the continuous predictor years in profession being used for the analysis and the
categorical variable results are displayed in the following table (Table 140). Table 140
shows that when considering wanting to change area of practice with years in
profession as the predictor, 44.1 per cent were fulltimers, 45.5 per cent of nurses and
midwives possessed a degree and 11.7 per cent lived alone. This means that when
using years in profession as the predictor in the equation for logistic regression, over
two-fifths (44.1%) wanting to change area of practice worked fulltime, over two-fifths
(45.5%) wanting to change area of practice possessed a degree and a minority
(12.1%) wanting to change area of practice lived alone.
Table 140 Categorical Variable Results for Wanting to Change Area of Practice
with Years in Profession as Continuous Predictor
Categorical results- Would you like to change your area of practice?
Predictor- years in profession
Fulltime Yes Number = 132 44.1%
N = 299 No Number = 167 55.9%
Possesses a degree Yes Number = 136 45.5%
N = 299 No Number = 163 54.5%
Live alone Yes Number = 35 11.7%
N = 299 No Number = 264 88.3%

136
The first analysis was calculated on a forward stepwise method, so the initial model
was derived using the constant, “Would you like to change your area of practice?” in
the logistic regression equation. Therefore, in this calculation all of the predictor
variables were omitted. If predictions were that all nurses and midwives wanted to
change their area of practice, this would be correct 51 times out of 299, that is, 17.1
per cent. If the prediction was that all nurses and midwives did not want to change
their area of practice, this prediction would be correct 248 times out of 299, that is,
82.9 per cent (Table 141).
Table 141 Predictions for Wanting to Change Area of Practice with Only
Constant in the Model
Question: Would you like to change your area of practice?
Prediction correct for
wanting to change area
51 / 299 N = 299 17.1%
Prediction correct for not
wanting to change area
248 / 299 N = 299 82.9%
The next calculation included the categorical predictor variables and the continuous
predictor years in profession for the question, “Would you like to change your area of
practice?” which did not have any significant effect.
2.2. Burnout
Different variables did not predict whether respondents were more likely to
experience burnout overall. In particular,
if the person was older, worked more years in the profession, worked fulltime
as opposed to part time, was more educated and whether they lived alone
(p>0.05).
The following section presents more detailed information relating to overall burnout
levels.
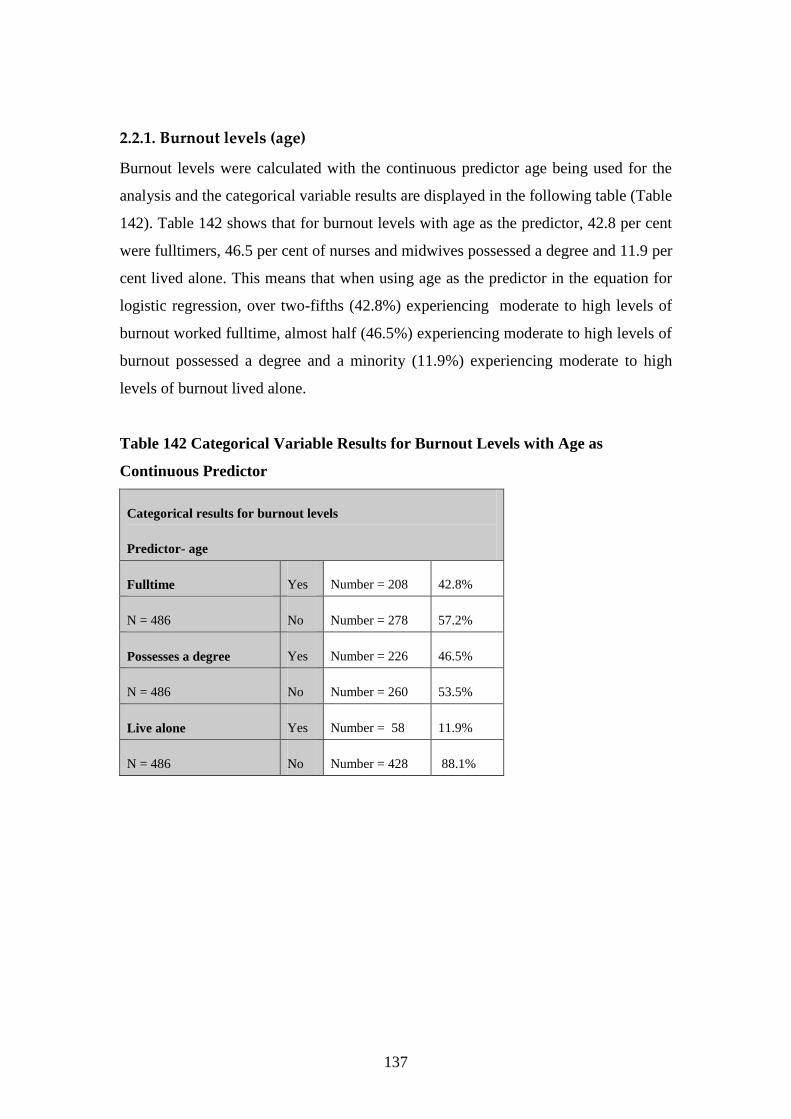
137
2.2.1. Burnout levels (age)
Burnout levels were calculated with the continuous predictor age being used for the
analysis and the categorical variable results are displayed in the following table (Table
142). Table 142 shows that for burnout levels with age as the predictor, 42.8 per cent
were fulltimers, 46.5 per cent of nurses and midwives possessed a degree and 11.9 per
cent lived alone. This means that when using age as the predictor in the equation for
logistic regression, over two-fifths (42.8%) experiencing moderate to high levels of
burnout worked fulltime, almost half (46.5%) experiencing moderate to high levels of
burnout possessed a degree and a minority (11.9%) experiencing moderate to high
levels of burnout lived alone.
Table 142 Categorical Variable Results for Burnout Levels with Age as
Continuous Predictor
Categorical results for burnout levels
Predictor- age
Fulltime Yes Number = 208 42.8%
N = 486 No Number = 278 57.2%
Possesses a degree Yes Number = 226 46.5%
N = 486 No Number = 260 53.5%
Live alone Yes Number = 58 11.9%
N = 486 No Number = 428 88.1%
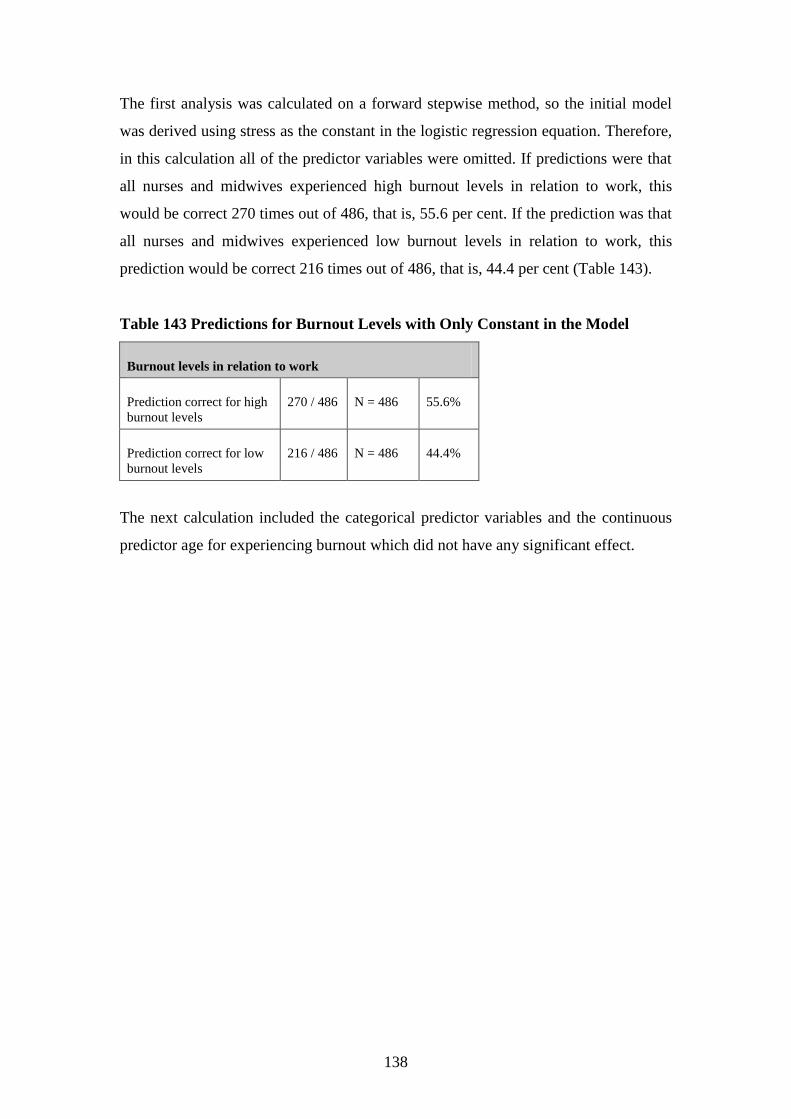
138
The first analysis was calculated on a forward stepwise method, so the initial model
was derived using stress as the constant in the logistic regression equation. Therefore,
in this calculation all of the predictor variables were omitted. If predictions were that
all nurses and midwives experienced high burnout levels in relation to work, this
would be correct 270 times out of 486, that is, 55.6 per cent. If the prediction was that
all nurses and midwives experienced low burnout levels in relation to work, this
prediction would be correct 216 times out of 486, that is, 44.4 per cent (Table 143).
Table 143 Predictions for Burnout Levels with Only Constant in the Model
Burnout levels in relation to work
Prediction correct for high
burnout levels
270 / 486 N = 486 55.6%
Prediction correct for low
burnout levels
216 / 486 N = 486 44.4%
The next calculation included the categorical predictor variables and the continuous
predictor age for experiencing burnout which did not have any significant effect.

139
2.2.2. Burnout levels (years in profession)
Burnout levels were calculated with the continuous predictor years in profession
being used for the analysis and the categorical variable results are displayed in the
following table (Table 144). Table 144 shows that for burnout with years in
profession as the predictor, 42.8 per cent were fulltimers, 46.7 per cent of nurses and
midwives possessed a degree and 11.7 per cent lived alone. This means that when
using years in profession as the predictor in the equation for logistic regression, over
two-fifths (42.8%) experiencing moderate to high levels of burnout worked fulltime,
almost half (46.7%) experiencing moderate to high levels of burnout possessed a
degree and a minority (11.7 %) experiencing moderate to high levels of burnout lived
alone.
Table 144 Categorical Variable Results for Burnout Levels with Years in
Profession as Continuous Predictor
Categorical results for burnout levels
Predictor- years in profession
Fulltime Yes Number = 209 42.8%
N = 488 No Number = 279 57.2%
Possesses a degree Yes Number = 228 46.7%
N = 488 No Number = 260 53.3%
Live alone Yes Number = 57 11.7%
N = 488 No Number = 431 88.3%

140
The first analysis was calculated on a forward stepwise method, so the initial model
was derived using burnout as the constant in the logistic regression equation.
Therefore, in this calculation all of the predictor variables were omitted. If predictions
were that all nurses and midwives experienced high burnout levels in relation to work,
this would be correct 272 times out of 488, that is, 55.7 per cent. If the prediction was
that all nurses and midwives experienced low burnout levels in relation to work, this
prediction would be correct 216 times out of 488, that is, 44.3 per cent (Table 145).
Table 145 Predictions for Burnout Levels with Only Constant in the Model
Burnout levels in relation to work
Prediction correct for high
burnout levels
272 / 488 N = 488 55.7%
Prediction correct for low
burnout levels
216 / 488 N = 488 44.3%
The next calculation included the categorical predictor variables and the continuous
predictor years in profession for experiencing burnout which did not have any
significant effect.
Different variables did not predict whether respondents were more likely to
experience apathy, feel emotionally drained and lose empathy for clients. In
particular:
if the person worked fulltime as opposed to part time, this did not predict any
significant findings for any of the above variables (p>0.05);
if the person was better educated, this did not predict any significant findings
for any of the above variables (p>0.05);
if the person lived alone, this did not predict any significant findings for any of
the above variables (p>0.05);
if the person was older, this did not predict any significant findings for the
above variables (p>0.05) except for feeling emotionally drained (p<0.05) and
losing empathy for clients (p<0.01);
if the person worked more hours, this did not predict any significant findings
for losing empathy for clients (p>0.05) and

141
the longer the person worked in the profession, this did not predict any
significant findings for the above variables (p>0.05) except for losing empathy
for clients (p<0.01).
The following section presents more detailed information relating to burnout
concerning experiencing apathy, feeling emotionally drained and losing empathy for
clients.

142
2.2.3. Experiencing apathy (age)
The question, “Do you become apathetic when “stressed”?” and the categorical
variable results are displayed in the following table (Table 146). The continuous
predictor age was used for this analysis. Table 146 shows that when experiencing
apathy with age as the predictor, 42.3 per cent were fulltimers, 46.7 per cent of nurses
and midwives possessed a degree and 12 per cent lived alone. This means that when
using age as the predictor in the equation for logistic regression, over two-fifths
(42.3%) experiencing apathy worked fulltime, almost half (46.7%) experiencing
apathy possessed a degree and a minority (12%) experiencing apathy lived alone.
Table 146
Categorical Variable Results for Apathy with Age as Continuous Predictor
Categorical results- Do you become apathetic when “stressed”?
Predictor- age
Fulltime Yes Number = 211 42.3%
N = 499 No Number = 288 57.7%
Possesses a degree Yes Number = 233 46.7%
N = 499 No Number = 266 53.3%
Live alone Yes Number = 60 12.0%
N = 499 No Number = 439 88.0%
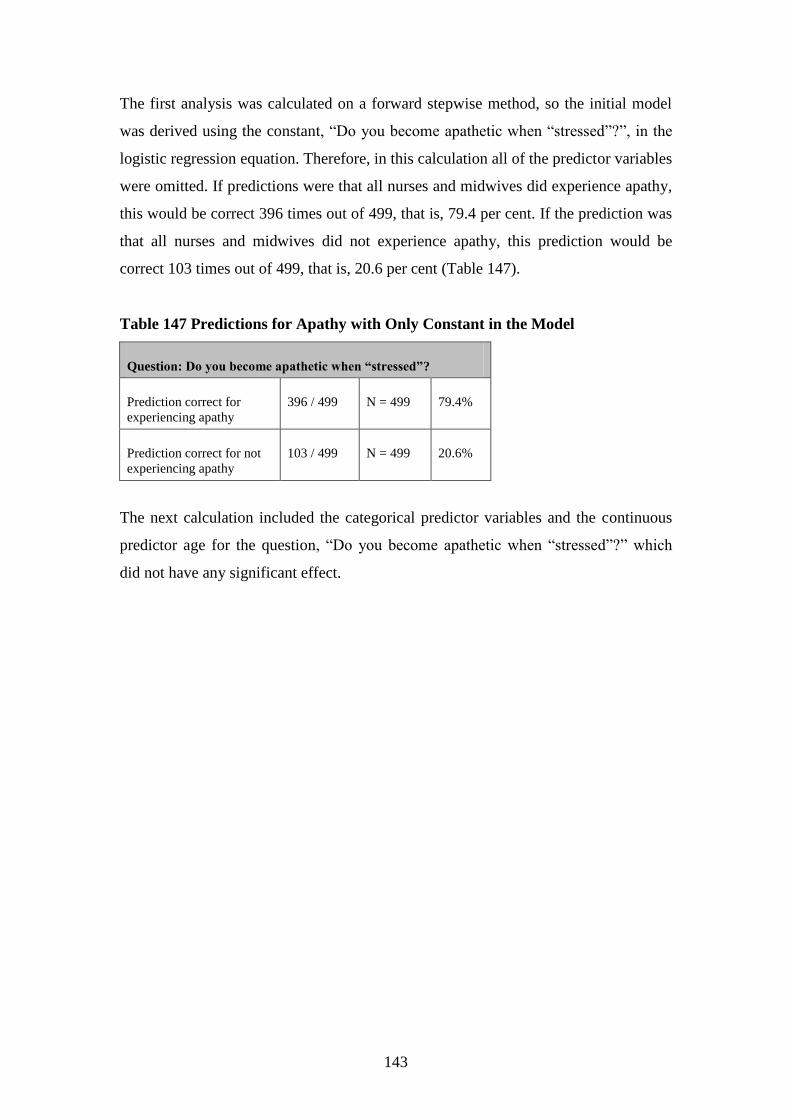
143
The first analysis was calculated on a forward stepwise method, so the initial model
was derived using the constant, “Do you become apathetic when “stressed”?”, in the
logistic regression equation. Therefore, in this calculation all of the predictor variables
were omitted. If predictions were that all nurses and midwives did experience apathy,
this would be correct 396 times out of 499, that is, 79.4 per cent. If the prediction was
that all nurses and midwives did not experience apathy, this prediction would be
correct 103 times out of 499, that is, 20.6 per cent (Table 147).
Table 147 Predictions for Apathy with Only Constant in the Model
Question: Do you become apathetic when “stressed”?
Prediction correct for
experiencing apathy
396 / 499 N = 499 79.4%
Prediction correct for not
experiencing apathy
103 / 499 N = 499 20.6%
The next calculation included the categorical predictor variables and the continuous
predictor age for the question, “Do you become apathetic when “stressed”?” which
did not have any significant effect.

144
2.2.4. Experiencing apathy (years in profession)
The question, “Do you become apathetic when “stressed”?” and the categorical
variable results are displayed in the following table (Table 148). The continuous
predictor years in profession was used for this analysis. Table 148 shows that when
experiencing apathy with years in profession as the predictor, 42.3 per cent were
fulltimers, 46.9 per cent of nurses and midwives possessed a degree and 11.8 per cent
lived alone. This means that when using years in profession as the predictor in the
equation for logistic regression, over two fifths (42.3%) experiencing apathy worked
fulltime, almost half (46.9%) experiencing apathy possessed a degree and a minority
(11.8%) experiencing apathy lived alone.
Table 148 Categorical Variable Results for Apathy with Years in Profession as
Continuous Predictor
Categorical results- Do you become apathetic when “stressed”?
Predictor- years in profession
Fulltime Yes Number = 212 42.3%
N = 501 No Number = 289 57.7%
Possesses a degree Yes Number = 235 46.9%
N = 501 No Number = 266 53.1%
Live alone Yes Number = 59 11.8%
N = 501 No Number = 442 88.2%

145
The first analysis was calculated on a forward stepwise method, so the initial model
was derived using the constant, “Do you become apathetic when “stressed”?”, in the
logistic regression equation. Therefore, in this calculation all of the predictor variables
were omitted. If predictions were that all nurses and midwives did experience apathy,
this would be correct 398 times out of 501, that is, 79.4 per cent. If the prediction was
that all nurses and midwives did not experience apathy, this prediction would be
correct 103 times out of 501, that is, 20.6 per cent (Table 149).
Table 149 Predictions for Apathy with Only Constant in the Model
Question: Do you become apathetic when “stressed”?
Prediction correct for
experiencing apathy
398 / 501 N = 501 79.4%
Prediction correct for not
experiencing apathy
103 / 501 N = 501 20.6%
The next calculation included the categorical predictor variables and the continuous
predictor years in profession for the question, “Do you become apathetic when
“stressed”?” which did not have any significant effect.

146
2.2.5. Feeling emotionally drained (years in profession)
The question, “How often do you feel emotionally drained at work?” and the
categorical variable results are displayed in the following table (Table 150). The
continuous predictor years in profession was used for this analysis. Table 150 shows
that when feeling emotionally drained with years in profession as the predictor, 42 per
cent were fulltimers, 47.3 per cent of nurses and midwives possessed a degree and
11.9 per cent lived alone. This means that when using years in profession as the
predictor in the equation for logistic regression, over two-fifths (42%) feeling
emotionally drained worked fulltime, almost half (47.3%) feeling emotionally drained
possessed a degree and a minority (11.9%) feeling emotionally drained lived alone.
Table 150 Categorical Variable Results for Feeling Emotionally Drained with
Years in Profession as Continuous Predictor
Categorical results- How often do you feel emotionally drained at work?
Predictor- years in profession
Fulltime Yes Number = 212 42.0%
N = 505 No Number = 293 58.0%
Possesses a degree Yes Number = 239 47.3%
N = 505 No Number = 266 52.7%
Live alone Yes Number = 60 11.9%
N = 505 No Number = 445 88.1%

147
The first analysis was calculated on a forward stepwise method, so the initial model
was derived using the constant, “How often do you feel emotionally drained at
work?”, in the logistic regression equation. Therefore, in this calculation all of the
predictor variables were omitted. If predictions were that all nurses and midwives did
feel emotionally drained, this would be correct 300 times out of 505, that is, 59.4 per
cent. If the prediction was that all nurses and midwives did not feel emotionally
drained, this prediction would be correct 205 times out of 505, that is, 40.6 per cent
(Table 151).
Table 151
Predictions for Feeling Emotionally Drained with Only Constant in the Model
Question: How often do you feel emotionally drained at work?
Prediction correct for
feeling emotionally
drained
300 / 505 N = 505 59.4%
Prediction correct for not
feeling emotionally
drained
205 / 505 N = 505 40.6%
The next calculation included the categorical predictor variables and the continuous
predictor years in profession for the question, “How often do you feel emotionally
drained at work?” which did not have any significant effect.
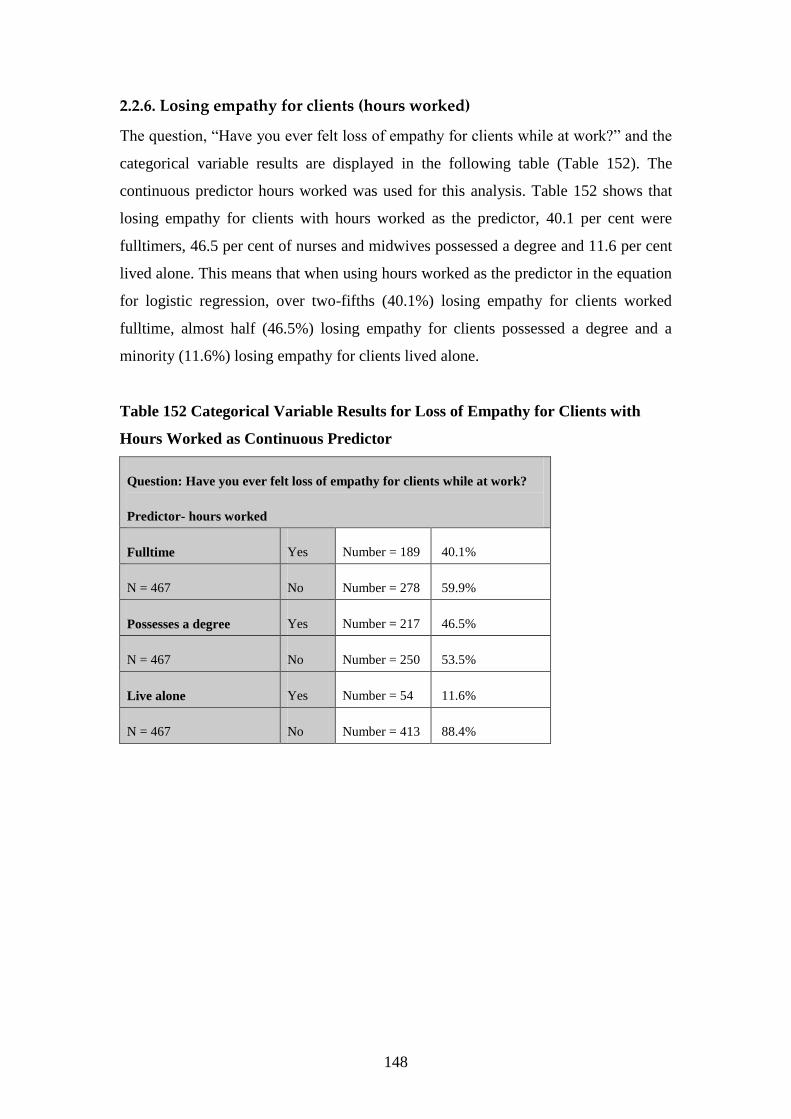
148
2.2.6. Losing empathy for clients (hours worked)
The question, “Have you ever felt loss of empathy for clients while at work?” and the
categorical variable results are displayed in the following table (Table 152). The
continuous predictor hours worked was used for this analysis. Table 152 shows that
losing empathy for clients with hours worked as the predictor, 40.1 per cent were
fulltimers, 46.5 per cent of nurses and midwives possessed a degree and 11.6 per cent
lived alone. This means that when using hours worked as the predictor in the equation
for logistic regression, over two-fifths (40.1%) losing empathy for clients worked
fulltime, almost half (46.5%) losing empathy for clients possessed a degree and a
minority (11.6%) losing empathy for clients lived alone.
Table 152 Categorical Variable Results for Loss of Empathy for Clients with
Hours Worked as Continuous Predictor
Question: Have you ever felt loss of empathy for clients while at work?
Predictor- hours worked
Fulltime Yes Number = 189 40.1%
N = 467 No Number = 278 59.9%
Possesses a degree Yes Number = 217 46.5%
N = 467 No Number = 250 53.5%
Live alone Yes Number = 54 11.6%
N = 467 No Number = 413 88.4%
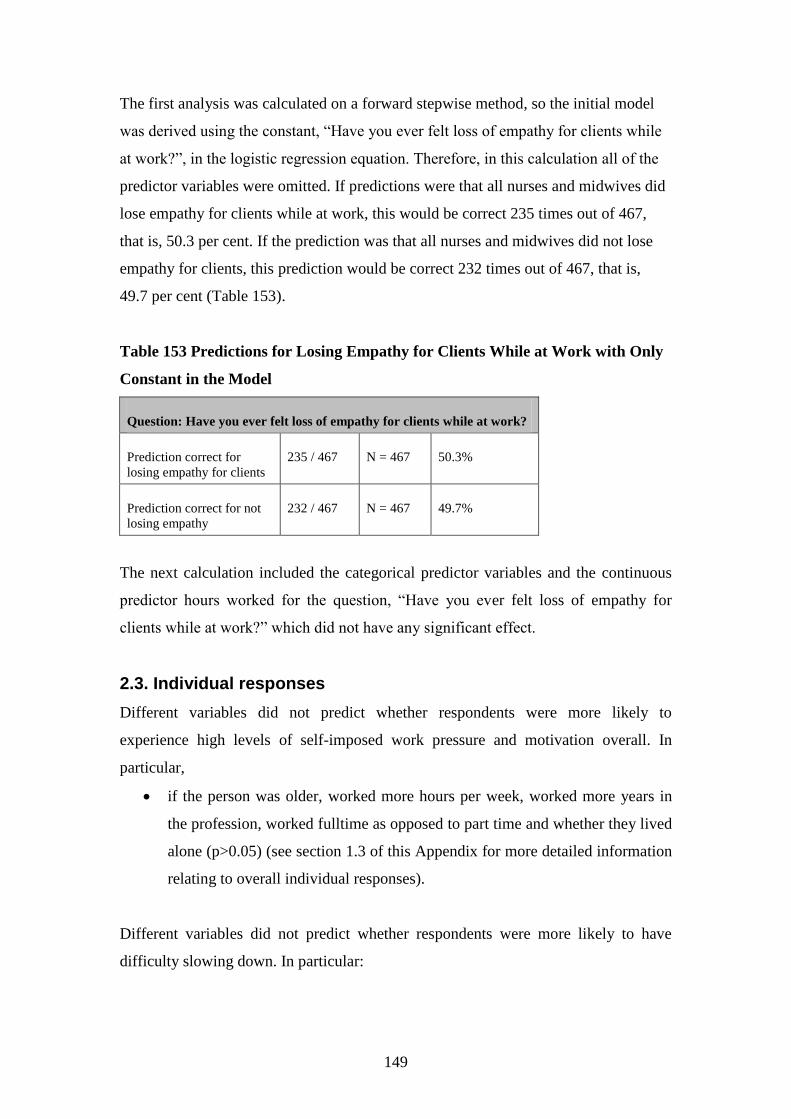
149
The first analysis was calculated on a forward stepwise method, so the initial model
was derived using the constant, “Have you ever felt loss of empathy for clients while
at work?”, in the logistic regression equation. Therefore, in this calculation all of the
predictor variables were omitted. If predictions were that all nurses and midwives did
lose empathy for clients while at work, this would be correct 235 times out of 467,
that is, 50.3 per cent. If the prediction was that all nurses and midwives did not lose
empathy for clients, this prediction would be correct 232 times out of 467, that is,
49.7 per cent (Table 153).
Table 153 Predictions for Losing Empathy for Clients While at Work with Only
Constant in the Model
Question: Have you ever felt loss of empathy for clients while at work?
Prediction correct for
losing empathy for clients
235 / 467 N = 467 50.3%
Prediction correct for not
losing empathy
232 / 467 N = 467 49.7%
The next calculation included the categorical predictor variables and the continuous
predictor hours worked for the question, “Have you ever felt loss of empathy for
clients while at work?” which did not have any significant effect.
2.3. Individual responses
Different variables did not predict whether respondents were more likely to
experience high levels of self-imposed work pressure and motivation overall. In
particular,
if the person was older, worked more hours per week, worked more years in
the profession, worked fulltime as opposed to part time and whether they lived
alone (p>0.05) (see section 1.3 of this Appendix for more detailed information
relating to overall individual responses).
Different variables did not predict whether respondents were more likely to have
difficulty slowing down. In particular:

150
if the person worked fulltime as opposed to part time, this did not predict any
significant findings for difficulty slowing down (p>0.05);
if the person lived alone, this did not predict any significant findings for
difficulty slowing down (p>0.05);
if the person was older, this did not predict any significant findings for
difficulty slowing down (p>0.05);
if the person worked more hours, this did not predict any significant findings
for difficulty slowing down (p>0.05) and
the longer the person worked in the profession, this did not predict any
significant findings for difficulty slowing down (p>0.05).
The following section presents more detailed information relating to individual
responses concerning difficulty slowing down.
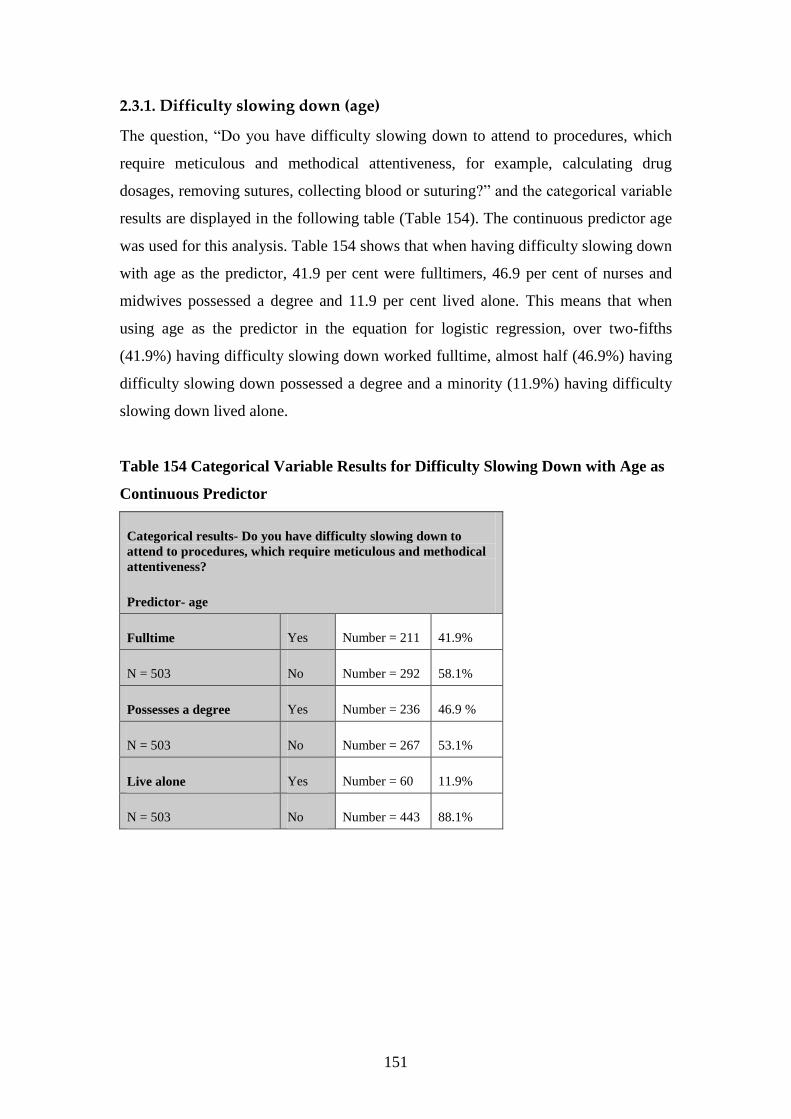
151
2.3.1. Difficulty slowing down (age)
The question, “Do you have difficulty slowing down to attend to procedures, which
require meticulous and methodical attentiveness, for example, calculating drug
dosages, removing sutures, collecting blood or suturing?” and the categorical variable
results are displayed in the following table (Table 154). The continuous predictor age
was used for this analysis. Table 154 shows that when having difficulty slowing down
with age as the predictor, 41.9 per cent were fulltimers, 46.9 per cent of nurses and
midwives possessed a degree and 11.9 per cent lived alone. This means that when
using age as the predictor in the equation for logistic regression, over two-fifths
(41.9%) having difficulty slowing down worked fulltime, almost half (46.9%) having
difficulty slowing down possessed a degree and a minority (11.9%) having difficulty
slowing down lived alone.
Table 154 Categorical Variable Results for Difficulty Slowing Down with Age as
Continuous Predictor
Categorical results- Do you have difficulty slowing down to
attend to procedures, which require meticulous and methodical
attentiveness?
Predictor- age
Fulltime Yes Number = 211 41.9%
N = 503 No Number = 292 58.1%
Possesses a degree Yes Number = 236 46.9 %
N = 503 No Number = 267 53.1%
Live alone Yes Number = 60 11.9%
N = 503 No Number = 443 88.1%

152
The first analysis was calculated on a forward stepwise method, so the initial model
was derived using the constant, “Do you have difficulty slowing down to attend to
procedures, which require meticulous and methodical attentiveness, for example,
calculating drug dosages, removing sutures, collecting blood or suturing?”, in the
logistic regression equation. Therefore, in this calculation all of the predictor variables
were omitted. If predictions were that all nurses and midwives did have difficulty
slowing down, this would be correct 292 times out of 503, that is, 58.1 per cent. If the
prediction was that all nurses and midwives did not have difficulty slowing down, this
prediction would be correct 211 times out of 503, that is, 41.9 per cent (Table 155).
Table 155
Predictions for Difficulty Slowing Down with Only Constant in the Model
Question: Do you have difficulty slowing down to attend to
procedures, which require meticulous and methodical
attentiveness?
Prediction correct for
difficulty slowing down
292 / 503 N = 503 58.1%
Prediction correct for not
having difficulty slowing
down
211 / 503 N = 503 41.9%
The next calculation included the categorical predictor variables and the continuous
predictor age for the question, “Do you have difficulty slowing down to attend to
procedures, which require meticulous and methodical attentiveness, for example,
calculating drug dosages, removing sutures, collecting blood or suturing?” which did
not have any significant effect.

153
2.3.2. Difficulty slowing down (hours worked)
The question, “Do you have difficulty slowing down to attend to procedures, which
require meticulous and methodical attentiveness, for example, calculating drug
dosages, removing sutures, collecting blood or suturing?” and the categorical variable
results are displayed in the following table (Table 156). The continuous predictor
hours worked was used for this analysis. Table 156 shows that having difficulty
slowing down with hours worked as the predictor, 40.7 per cent were fulltimers, 46.6
per cent of nurses and midwives possessed a degree and 11.7 per cent lived alone.
This means that when using hours worked as the predictor in the equation for logistic
regression, over two-fifths (40.7%) having difficulty slowing down worked fulltime,
almost half (46.6%) having difficulty slowing down possessed a degree and a
minority (11.7%) having difficulty slowing down lived alone.
Table 156 Categorical Variable Results for Difficulty Slowing Down with Hours
Worked as Continuous Predictor
Question: Do you have difficulty slowing down to attend to procedures,
which require meticulous and methodical attentiveness?
Predictor- hours worked
Fulltime Yes Number = 211 41.7%
N = 506 No Number = 295 58.3%
Possesses a degree Yes Number = 236 46.6%
N = 506 No Number = 270 53.4%
Live alone Yes Number = 59 11.7%
N = 506 No Number = 447 88.3%
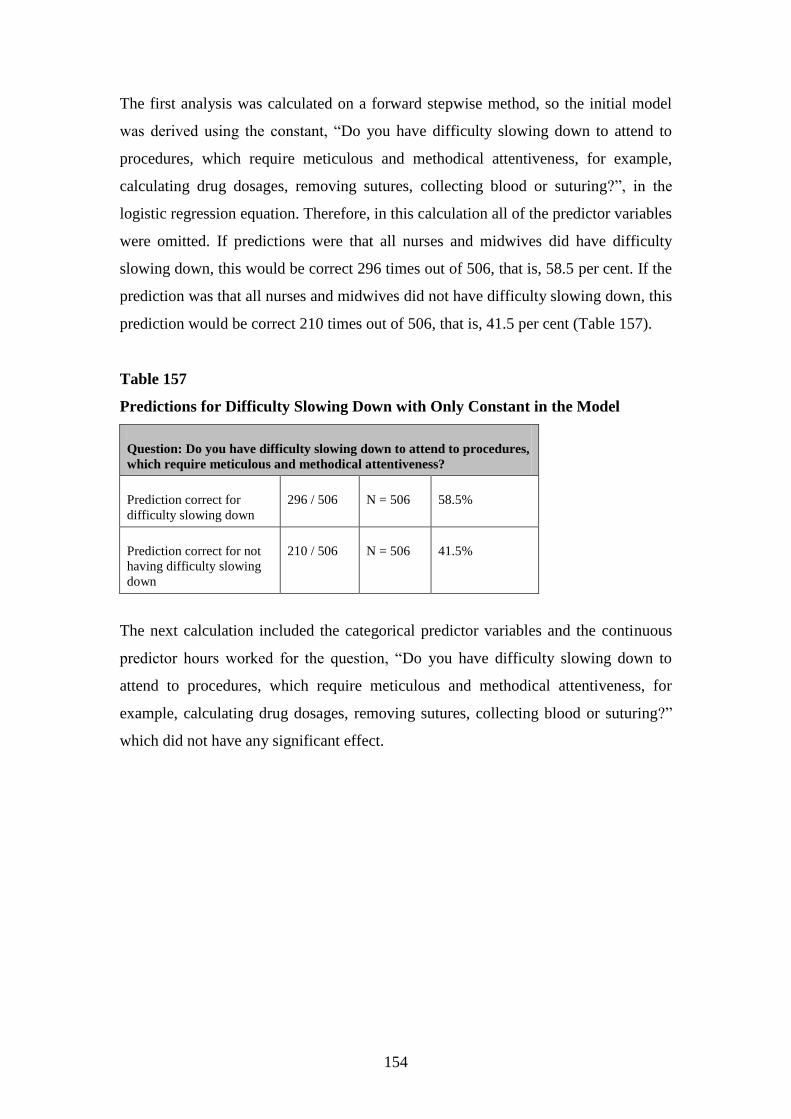
154
The first analysis was calculated on a forward stepwise method, so the initial model
was derived using the constant, “Do you have difficulty slowing down to attend to
procedures, which require meticulous and methodical attentiveness, for example,
calculating drug dosages, removing sutures, collecting blood or suturing?”, in the
logistic regression equation. Therefore, in this calculation all of the predictor variables
were omitted. If predictions were that all nurses and midwives did have difficulty
slowing down, this would be correct 296 times out of 506, that is, 58.5 per cent. If the
prediction was that all nurses and midwives did not have difficulty slowing down, this
prediction would be correct 210 times out of 506, that is, 41.5 per cent (Table 157).
Table 157
Predictions for Difficulty Slowing Down with Only Constant in the Model
Question: Do you have difficulty slowing down to attend to procedures,
which require meticulous and methodical attentiveness?
Prediction correct for
difficulty slowing down
296 / 506 N = 506 58.5%
Prediction correct for not
having difficulty slowing
down
210 / 506 N = 506 41.5%
The next calculation included the categorical predictor variables and the continuous
predictor hours worked for the question, “Do you have difficulty slowing down to
attend to procedures, which require meticulous and methodical attentiveness, for
example, calculating drug dosages, removing sutures, collecting blood or suturing?”
which did not have any significant effect.

155
2.3.3. Difficulty slowing down (years in profession)
The question, “Do you have difficulty slowing down to attend to procedures, which
require meticulous and methodical attentiveness, for example, calculating drug
dosages, removing sutures, collecting blood or suturing?” and the categorical variable
results are displayed in the following table (Table 158). The continuous predictor
years in profession was used for this analysis. Table 158 shows that when having
difficulty slowing down with years in profession as the predictor, 42 per cent were
fulltimers, 47.1 per cent of nurses and midwives possessed a degree and 11.7 per cent
lived alone. This means that when using years in profession as the predictor in the
equation for logistic regression, over two-fifths (42%) having difficulty slowing down
worked fulltime, almost half (47.1%) having difficulty slowing down possessed a
degree and a minority (11.7%) having difficulty slowing down lived alone.
Table 158 Categorical Variable Results for Difficulty Slowing Down with Years
in Profession as Continuous Predictor
Categorical results- Do you have difficulty slowing down to
attend to procedures, which require meticulous and methodical
attentiveness?
Predictor- years in profession
Fulltime Yes Number = 212 42.0%
N = 505 No Number = 293 58.0%
Possesses a degree Yes Number = 238 47.1%
N = 505 No Number = 267 52.9%
Live alone Yes Number = 59 11.7%
N = 505 No Number = 446 88.3%

156
The first analysis was calculated on a forward stepwise method, so the initial model
was derived using the constant, “Do you have difficulty slowing down to attend to
procedures, which require meticulous and methodical attentiveness, for example,
calculating drug dosages, removing sutures, collecting blood or suturing?”, in the
logistic regression equation. Therefore, in this calculation all of the predictor variables
were omitted. If predictions were that all nurses and midwives did have difficulty
slowing down, this would be correct 295 times out of 505, that is, 58.4 per cent. If the
prediction was that all nurses and midwives did not have difficulty slowing down, this
prediction would be correct 210 times out of 505, that is, 41.6 per cent (Table 159).
Table 159
Predictions for Difficulty Slowing Down with Only Constant in the Model
Question: Do you have difficulty slowing down to attend to
procedures, which require meticulous and methodical
attentiveness?
Prediction correct for
difficulty slowing down
295 / 505 N = 505 58.4%
Prediction correct for not
having difficulty slowing
down
210 / 505 N = 505 41.6%
The next calculation included the categorical predictor variables and the continuous
predictor years in profession for the question, “Do you have difficulty slowing down
to attend to procedures, which require meticulous and methodical attentiveness, for
example, calculating drug dosages, removing sutures, collecting blood or suturing?”
which did not have any significant effect.

157
REFERENCES
Cox, D. R., & Snell, D. J. (1989). The analysis of binary data (2nd ed.). London:
Chapman & Hall.
Hosmer, D. W., & Lemeshow, S. (1989). Applied logistic regression. New York:
Wiley.
Nagelkirke, N. J. D. (1991). A note on a general definition of the coefficient of
determination. Biometrika, 78, 691-692.

1
Appendix 7 Multicollinearity for logistic regression
Multicollinearity exists if the predictors in a regression model show strong
correlations between them. If predictors show strong correlations, it is difficult to
assess which predictor is important. A high collinearity level increases the probability
that the good predictors of the outcome might be found non-significant, thereby being
abandoned from the model (known as Type 2 error) (Field, 2005). Variance inflation
factor (VIF) values should not be greater than 10 (Myers, 1990). All VIF values for
these independent variables were less than 1.9, showing that the predictors did not
have strong relationships with the other independent predictors.
Tolerance levels are related to the variance inflation factor, being its reciprocal
(1/VIF) (Field, 2005). All tolerance levels for the independent variables used for
logistic regression in these analyses were above 0.5, indicating no problems with
multicollinearity. All questions included the categorical independent variables,
employment status, qualifications and living arrangement. The other continuous
independent variables age, hours worked and years in profession were put into the
calculation separately with all the categorical independent variables, as they were for
logistic regression.
1. Multicollinearity for statistically significant findings of logistic regression
All results below show that when testing for multicollinearity for the statistically
significant findings of logistic regression, that the variance inflation factors are all
below 10 (1.940 being the highest value) and all tolerance levels are above 0.1 (0.515
being the lowest value). This means that none of these variables overlapped too much
with each other and if they did overlap too much this would mean that some variables
would show high inter-correlations meaning that the variables are measuring the same
thing very closely.

2
1.1. Testing for multicollinearity for stress
1.1.1. Experiencing sleeplessness
The following table (Table 1) shows collinearity results for the variable, experiencing
sleeplessness. Table 1 displays all categorical predictors and the continuous
independent variable, hours worked. Table 1 shows that all VIF values are less than
10, with 1.931 being the highest value. All tolerance levels are above 0.1, being 0.518
to 0.975.
Table 1 Collinearity Statistics for Experiencing Sleeplessness with Hours
Worked as Continuous Independent Variable
Dependent Variable- Experiencing Sleeplessness
Independent Variable Variance Inflation Factor Tolerance Levels
Hours worked 1.911 0.523
Fulltime 1.931 0.518
Possesses a degree 1.043 0.959
Live alone 1.026 0.975
1.1.2. Taking mental health leave
The following tables (Tables 2 & 3) show collinearity results for the variable, taking
“mental health” leave. Table 2 displays all categorical predictors and the continuous
independent variable, age. Table 2 shows that all VIF values are less than 10, with
1.118 being the highest value. All tolerance levels are above 0.1, being 0.894 to
0.966.
Table 2 Collinearity Statistics for Taking Mental Health Leave with Age as
Continuous Independent Variable
Dependent Variable- Taking Mental Health Leave
Independent Variable Variance Inflation Factor Tolerance Levels
Age 1.089 0.919
Fulltime 1.056 0.947
Possesses a degree 1.118 0.894
Live alone 1.035 0.966

3
Table 3 displays all categorical predictors and the continuous independent variable,
years in profession. Table 3 shows that all VIF values are less than 10, with 1.159
being the highest value. All tolerance levels are above 0.1, being 0.862 to 0.971.
Table 3 Collinearity Statistics for Taking Mental Health Leave with Years in
Profession as Continuous Independent Variable
Dependent Variable- Taking Mental Health Leave
Independent Variable Variance Inflation Factor Tolerance Levels
Years in profession 1.118 0.894
Fulltime 1.057 0.946
Possesses a degree 1.159 0.862
Live alone 1.030 0.971
1.2. Testing for multicollinearity for burnout
1.2.1. Burnout levels
The following table (Table 4) shows collinearity results for burnout levels. Table 4
displays all categorical predictors and the continuous independent variable, hours
worked. Table 4 shows that all VIF values are less than 10, with 1.940 being the
highest value. All tolerance levels are above 0.1, being 0.515 to 0.973.
Table 4 Collinearity Statistics for Burnout with Hours Worked as Continuous
Independent Variable
Dependent Variable- Burnout
Independent Variable Variance Inflation Factor Tolerance Levels
Hours worked 1.911 0.523
Fulltime 1.940 0.515
Possesses a degree 1.046 0.956
Live alone 1.027 0.973

4
1.2.2. Apathy
The following table (Table 5) shows collinearity results for the variable, apathy. Table
5 displays all categorical predictors and the continuous independent variable, hours
worked. Table 5 shows that all VIF values are less than 10, with 1.925 being the
highest value. All tolerance levels are above 0.1, being 0.519 to 0.974.
Table 5 Collinearity Statistics for Apathy with Hours Worked as Continuous
Independent Variable
Dependent Variable- Apathy
Independent Variable Variance Inflation Factor Tolerance Levels
Hours worked 1.904 0.525
Fulltime 1.925 0.519
Possesses a degree 1.045 0.957
Live alone 1.027 0.974
1.2.3. Feeling emotionally drained
The following tables (Tables 6 & 7) show collinearity results for the variable, feeling
emotionally drained. Table 6 displays all categorical predictors and the continuous
independent variable, age. Table 6 shows that all VIF values are less than 10, with
1.118 being the highest value. All tolerance levels are above 0.1, being 0.894 to
0.966.
Table 6 Collinearity Statistics for Feeling Emotionally Drained with Age as
Continuous Independent Variable
Dependent Variable- Feeling Emotionally Drained
Independent Variable Variance Inflation Factor Tolerance Levels
Age 1.090 0.918
Fulltime 1.055 0.948
Possesses a degree 1.118 0.894
Live alone 1.035 0.966
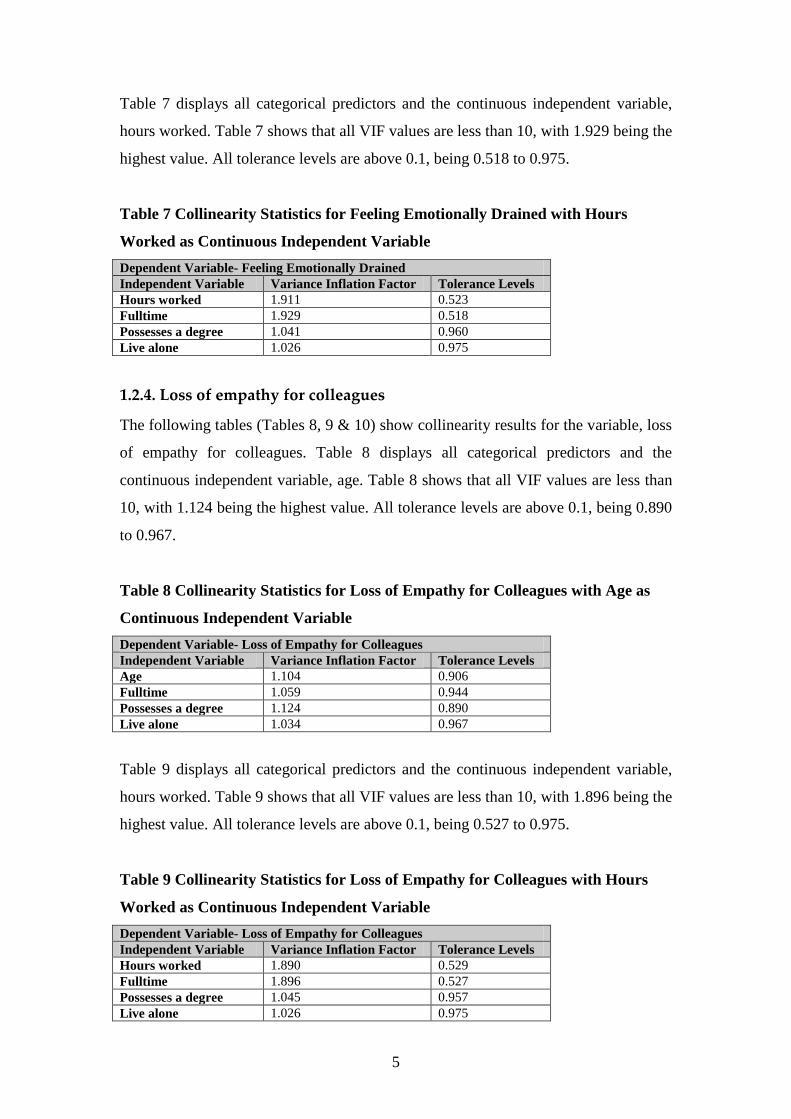
5
Table 7 displays all categorical predictors and the continuous independent variable,
hours worked. Table 7 shows that all VIF values are less than 10, with 1.929 being the
highest value. All tolerance levels are above 0.1, being 0.518 to 0.975.
Table 7 Collinearity Statistics for Feeling Emotionally Drained with Hours
Worked as Continuous Independent Variable
Dependent Variable- Feeling Emotionally Drained
Independent Variable Variance Inflation Factor Tolerance Levels
Hours worked 1.911 0.523
Fulltime 1.929 0.518
Possesses a degree 1.041 0.960
Live alone 1.026 0.975
1.2.4. Loss of empathy for colleagues
The following tables (Tables 8, 9 & 10) show collinearity results for the variable, loss
of empathy for colleagues. Table 8 displays all categorical predictors and the
continuous independent variable, age. Table 8 shows that all VIF values are less than
10, with 1.124 being the highest value. All tolerance levels are above 0.1, being 0.890
to 0.967.
Table 8 Collinearity Statistics for Loss of Empathy for Colleagues with Age as
Continuous Independent Variable
Dependent Variable- Loss of Empathy for Colleagues
Independent Variable Variance Inflation Factor Tolerance Levels
Age 1.104 0.906
Fulltime 1.059 0.944
Possesses a degree 1.124 0.890
Live alone 1.034 0.967
Table 9 displays all categorical predictors and the continuous independent variable,
hours worked. Table 9 shows that all VIF values are less than 10, with 1.896 being the
highest value. All tolerance levels are above 0.1, being 0.527 to 0.975.
Table 9 Collinearity Statistics for Loss of Empathy for Colleagues with Hours
Worked as Continuous Independent Variable
Dependent Variable- Loss of Empathy for Colleagues
Independent Variable Variance Inflation Factor Tolerance Levels
Hours worked 1.890 0.529
Fulltime 1.896 0.527
Possesses a degree 1.045 0.957
Live alone 1.026 0.975

6
Table 10 displays all categorical predictors and the continuous independent variable,
years in profession. Table 10 shows that all VIF values are less than 10, with 1.149
being the highest value. All tolerance levels are above 0.1, being 0.870 to 0.969.
Table 10 Collinearity Statistics for Loss of Empathy for Colleagues with Years in
Profession as Continuous Independent Variable
Dependent Variable- Loss of Empathy for Colleagues
Independent Variable Variance Inflation Factor Tolerance Levels
Years in Profession 1.119 0.893
Fulltime 1.055 0.948
Possesses a degree 1.149 0.870
Live alone 1.032 0.969
1.2.5. Loss of empathy for clients
The following tables (Tables 11 & 12) show collinearity results for the variable, loss
of empathy for clients. Table 11 displays all categorical predictors and the continuous
independent variable, age. Table 11 shows that all VIF values are less than 10, with
1.122 being the highest value. All tolerance levels are above 0.1, being 0.892 to
0.971.
Table 11 Collinearity Statistics for Loss of Empathy for Clients with Age as
Continuous Independent Variable
Dependent Variable- Loss of Empathy for Clients
Independent Variable Variance Inflation Factor Tolerance Levels
Age 1.095 0.913
Fulltime 1.054 0.949
Possesses a degree 1.122 0.892
Live alone 1.030 0.971

7
Table 12 displays all categorical predictors and the continuous independent variable,
years in profession. Table 12 shows that all VIF values are less than 10, with 1.149
being the highest value. All tolerance levels are above 0.1, being 0.870 to 0.975.
Table 12 Collinearity Statistics for Loss of Empathy for Clients with Years in
Profession as Continuous Independent Variable
Dependent Variable- Loss of Empathy for Clients
Independent Variable Variance Inflation Factor Tolerance Levels
Years in profession 1.111 0.900
Fulltime 1.054 0.949
Possesses a degree 1.149 0.870
Live alone 1.025 0.975
1.3. Testing for multicollinearity for individual responses
1.3.1. Pressure and motivation
The following tables (Tables 13, 14 & 15) show collinearity results for overall
pressure and motivation levels. Table 13 displays all categorical predictors and the
continuous independent variable, age. Table 13 shows that all VIF values are less than
10, with 1.118 being the highest value. All tolerance levels are above 0.1, being 0.894
to 0.974.
Table 13 Collinearity Statistics for Pressure and Motivation with Age as
Continuous Independent Variable
Dependent Variable- Pressure and Motivation
Independent Variable Variance Inflation Factor Tolerance Levels
Age 1.091 0.916
Fulltime 1.048 0.954
Possesses a degree 1.118 0.894
Live alone 1.027 0.974

8
Table 14 displays all categorical predictors and the continuous independent variable,
hours worked. Table 14 shows that all VIF values are less than 10, with 1.913 being
the highest value. All tolerance levels are above 0.1, being 0.523 to 0.979.
Table 14 Collinearity Statistics for Pressure and Motivation with Hours Worked
as Continuous Independent Variable
Dependent Variable- Pressure and Motivation
Independent Variable Variance Inflation Factor Tolerance Levels
Hours worked 1.902 0.526
Fulltime 1.913 0.523
Possesses a degree 1.041 0.961
Live alone 1.021 0.979
Table 15 displays all categorical predictors and the continuous independent variable,
years in profession. Table 15 shows that all VIF values are less than 10, with 1.164
being the highest value. All tolerance levels are above 0.1, being 0.859 to 0.979.
Table 15 Collinearity Statistics for Pressure and Motivation with Years in
Profession as Continuous Independent Variable
Dependent Variable- Pressure and Motivation
Independent Variable Variance Inflation Factor Tolerance Levels
Years in profession 1.126 0.888
Fulltime 1.049 0.954
Possesses a degree 1.164 0.859
Live alone 1.021 0.979
2. Multicollinearity for statistically non-significant findings of logistic regression
All results below show that when testing for multicollinearity for the statistically non-
significant findings of logistic regression, that the variance inflation factors are all
below 10 (2.070 being the highest value) and all tolerance levels are above 0.1 (0.483
being the lowest value). This means that none of these variables overlapped too much
with each other. If they did overlap too much this would mean that some variables
would show high inter-correlations meaning that the variables are measuring the same
thing very closely, making them redundant.

9
2.1. Testing for multicollinearity for stress
2.1.1. Stress levels
The following tables (Tables 16, 17 & 18) show collinearity results for stress levels.
Table 16 displays all categorical predictors and the continuous independent variable,
age. Table 16 shows that all VIF values are less than 10, with 1.122 being the highest
value. All tolerance levels are above 0.1, being 0.891 to 0.967.
Table 16
Collinearity Statistics for Stress with Age as Continuous Independent Variable
Dependent Variable- Stress
Independent Variable Variance Inflation Factor Tolerance Levels
Age 1.093 0.915
Fulltime 1.054 0.949
Possesses a degree 1.122 0.891
Live alone 1.034 0.967
Table 17 displays all categorical predictors and the continuous independent variable,
hours worked. Table 17 shows that all VIF values are less than 10, with 1.917 being
the highest value. All tolerance levels are above 0.1, being 0.522 to 0.975.
Table 17 Collinearity Statistics for Stress with Hours Worked as Continuous
Independent Variable
Dependent Variable- Stress
Independent Variable Variance Inflation Factor Tolerance Levels
Hours worked 1.899 0.527
Fulltime 1.917 0.522
Possesses a degree 1.039 0.962
Live alone 1.026 0.975
Table 18 displays all categorical predictors and the continuous independent variable,
years in profession. Table 18 shows that all VIF values are less than 10, with 1.160
being the highest value. All tolerance levels are above 0.1, being 0.862 to 0.972.
Table 18 Collinearity Statistics for Stress with Years in Profession as Continuous
Independent Variable
Dependent Variable- Stress
Independent Variable Variance Inflation Factor Tolerance Levels
Years in profession 1.122 0.891
Fulltime 1.053 0.950
Possesses a degree 1.160 0.862
Live alone 1.029 0.972
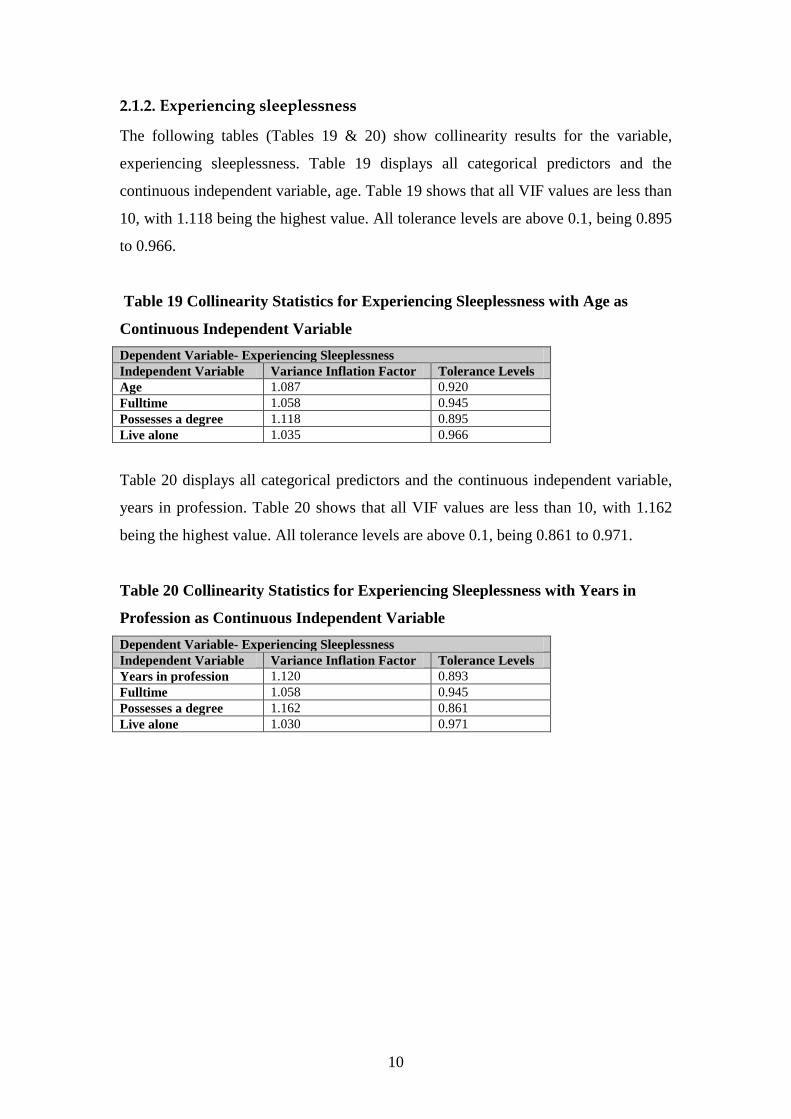
10
2.1.2. Experiencing sleeplessness
The following tables (Tables 19 & 20) show collinearity results for the variable,
experiencing sleeplessness. Table 19 displays all categorical predictors and the
continuous independent variable, age. Table 19 shows that all VIF values are less than
10, with 1.118 being the highest value. All tolerance levels are above 0.1, being 0.895
to 0.966.
Table 19 Collinearity Statistics for Experiencing Sleeplessness with Age as
Continuous Independent Variable
Dependent Variable- Experiencing Sleeplessness
Independent Variable Variance Inflation Factor Tolerance Levels
Age 1.087 0.920
Fulltime 1.058 0.945
Possesses a degree 1.118 0.895
Live alone 1.035 0.966
Table 20 displays all categorical predictors and the continuous independent variable,
years in profession. Table 20 shows that all VIF values are less than 10, with 1.162
being the highest value. All tolerance levels are above 0.1, being 0.861 to 0.971.
Table 20 Collinearity Statistics for Experiencing Sleeplessness with Years in
Profession as Continuous Independent Variable
Dependent Variable- Experiencing Sleeplessness
Independent Variable Variance Inflation Factor Tolerance Levels
Years in profession 1.120 0.893
Fulltime 1.058 0.945
Possesses a degree 1.162 0.861
Live alone 1.030 0.971
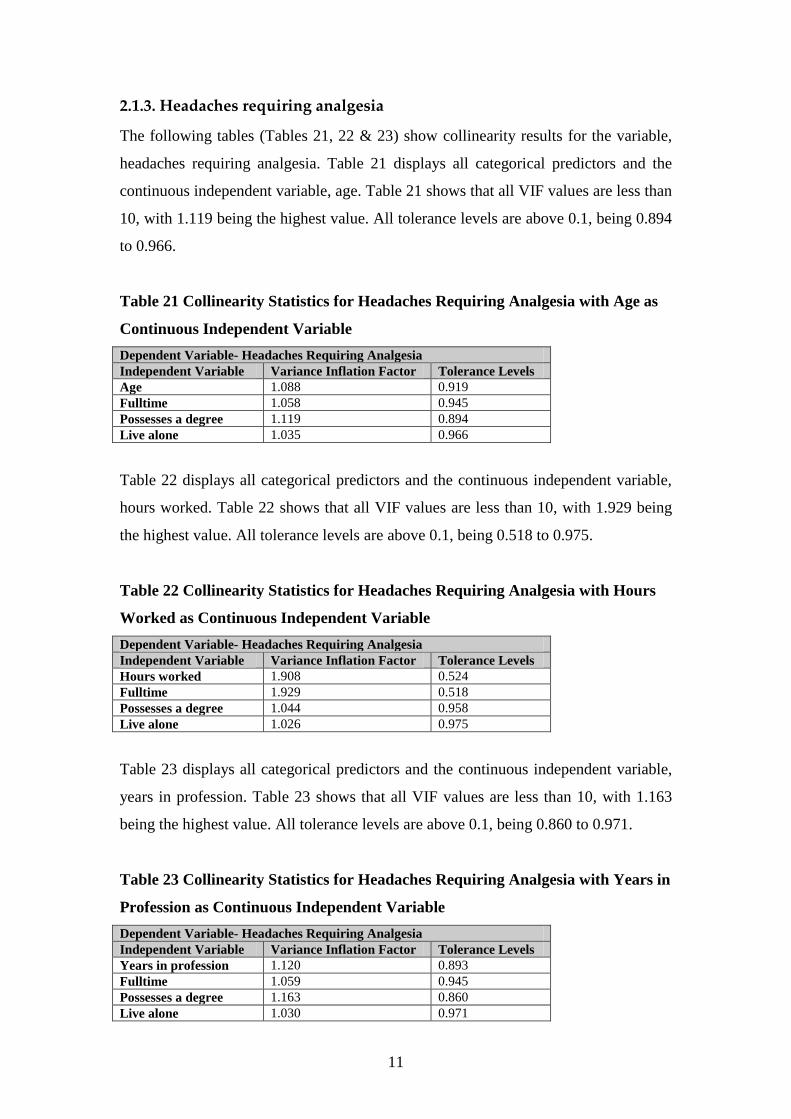
11
2.1.3. Headaches requiring analgesia
The following tables (Tables 21, 22 & 23) show collinearity results for the variable,
headaches requiring analgesia. Table 21 displays all categorical predictors and the
continuous independent variable, age. Table 21 shows that all VIF values are less than
10, with 1.119 being the highest value. All tolerance levels are above 0.1, being 0.894
to 0.966.
Table 21 Collinearity Statistics for Headaches Requiring Analgesia with Age as
Continuous Independent Variable
Dependent Variable- Headaches Requiring Analgesia
Independent Variable Variance Inflation Factor Tolerance Levels
Age 1.088 0.919
Fulltime 1.058 0.945
Possesses a degree 1.119 0.894
Live alone 1.035 0.966
Table 22 displays all categorical predictors and the continuous independent variable,
hours worked. Table 22 shows that all VIF values are less than 10, with 1.929 being
the highest value. All tolerance levels are above 0.1, being 0.518 to 0.975.
Table 22 Collinearity Statistics for Headaches Requiring Analgesia with Hours
Worked as Continuous Independent Variable
Dependent Variable- Headaches Requiring Analgesia
Independent Variable Variance Inflation Factor Tolerance Levels
Hours worked 1.908 0.524
Fulltime 1.929 0.518
Possesses a degree 1.044 0.958
Live alone 1.026 0.975
Table 23 displays all categorical predictors and the continuous independent variable,
years in profession. Table 23 shows that all VIF values are less than 10, with 1.163
being the highest value. All tolerance levels are above 0.1, being 0.860 to 0.971.
Table 23 Collinearity Statistics for Headaches Requiring Analgesia with Years in
Profession as Continuous Independent Variable
Dependent Variable- Headaches Requiring Analgesia
Independent Variable Variance Inflation Factor Tolerance Levels
Years in profession 1.120 0.893
Fulltime 1.059 0.945
Possesses a degree 1.163 0.860
Live alone 1.030 0.971

12
2.1.4. Stress requiring treatment
The following tables (Tables 24, 25 & 26) show collinearity results for the variable,
stress requiring treatment. Table 24 displays all categorical predictors and the
continuous independent variable, age. Table 24 shows that all VIF values are less than
10, with 1.119 being the highest value. All tolerance levels are above 0.1, being 0.894
to 0.967.
Table 24 Collinearity Statistics for Stress Requiring Treatment with Age as
Continuous Independent Variable
Dependent Variable- Stress Requiring Treatment
Independent Variable Variance Inflation Factor Tolerance Levels
Age 1.088 0.919
Fulltime 1.057 0.946
Possesses a degree 1.119 0.894
Live alone 1.034 0.967
Table 25 displays all categorical predictors and the continuous independent variable,
hours worked. Table 25 shows that all VIF values are less than 10, with 1.926 being
the highest value. All tolerance levels are above 0.1, being 0.519 to 0.975.
Table 25 Collinearity Statistics for Stress Requiring Treatment with Hours
Worked as Continuous Independent Variable
Dependent Variable- Stress Requiring Treatment
Independent Variable Variance Inflation Factor Tolerance Levels
Hours worked 1.905 0.525
Fulltime 1.926 0.519
Possesses a degree 1.043 0.959
Live alone 1.025 0.975
Table 26 displays all categorical predictors and the continuous independent variable,
years in profession. Table 26 shows that all VIF values are less than 10, with 1.159
being the highest value. All tolerance levels are above 0.1, being 0.863 to 0.972.
Table 26 Collinearity Statistics for Stress Requiring Treatment with Years in
Profession as Continuous Independent Variable
Dependent Variable- Stress Requiring Treatment
Independent Variable Variance Inflation Factor Tolerance Levels
Years in profession 1.118 0.895
Fulltime 1.057 0.946
Possesses a degree 1.159 0.863
Live alone 1.029 0.972

13
2.1.5. Taking mental health leave
The following table (Table 27) shows collinearity results for the variable, taking
“mental health” leave. Table 27 displays all categorical predictors and the continuous
independent variable, hours worked. Table 27 shows that all VIF values are less than
10, with 1.923 being the highest value. All tolerance levels are above 0.1, being 0.520
to 0.975.
Table 27 Collinearity Statistics for Taking Mental Health Leave with Hours
Worked as Continuous Independent Variable
Dependent Variable- Taking Mental Health Leave
Independent Variable Variance Inflation Factor Tolerance Levels
Hours worked 1.903 0.526
Fulltime 1.923 0.520
Possesses a degree 1.043 0.959
Live alone 1.026 0.975
2.1.6. Length of depression
The following tables (Tables 28, 29 & 30) show collinearity results for the variable,
length of depression. Table 28 displays all categorical predictors and the continuous
independent variable, age. Table 28 shows that all VIF values are less than 10, with
1.120 being the highest value. All tolerance levels are above 0.1, being 0.893 to
0.969.
Table 28 Collinearity Statistics for Length of Depression with Age as Continuous
Independent Variable
Dependent Variable- Length of Depression
Independent Variable Variance Inflation Factor Tolerance Levels
Age 1.090 0.917
Fulltime 1.054 0.949
Possesses a degree 1.120 0.893
Live alone 1.032 0.969

14
Table 29 displays all categorical predictors and the continuous independent variable,
hours worked. Table 29 shows that all VIF values are less than 10, with 1.918 being
the highest value. All tolerance levels are above 0.1, being 0.521 to 0.977.
Table 29 Collinearity Statistics for Length of Depression with Hours Worked as
Continuous Independent Variable
Dependent Variable- Length of Depression
Independent Variable Variance Inflation Factor Tolerance Levels
Hours worked 1.900 0.526
Fulltime 1.918 0.521
Possesses a degree 1.043 0.959
Live alone 1.024 0.977
Table 30 displays all categorical predictors and the continuous independent variable,
years in profession. Table 30 shows that all VIF values are less than 10, with 1.163
being the highest value. All tolerance levels are above 0.1, being 0.860 to 0.971.
Table 30 Collinearity Statistics for Length of Depression with Years in
Profession as Continuous Independent Variable
Dependent Variable- Length of Depression
Independent Variable Variance Inflation Factor Tolerance Levels
Years in profession 1.120 0.893
Fulltime 1.059 0.945
Possesses a degree 1.163 0.860
Live alone 1.030 0.971
2.1.7. Wanting to change area of practice
The following tables (Tables 31, 32 & 33) show collinearity results for the variable,
wanting to change area of practice. Table 31 displays all categorical predictors and the
continuous independent variable, age. Table 31 shows that all VIF values are less than
10, with 1.070 being the highest value. All tolerance levels are above 0.1, being 0.934
to 0.959.
Table 31 Collinearity Statistics for Wanting to Change Area of Practice with Age
as Continuous Independent Variable
Dependent Variable- Wanting to Change Area of Practice
Independent Variable Variance Inflation Factor Tolerance Levels
Age 1.059 0.945
Fulltime 1.060 0.943
Possesses a degree 1.070 0.934
Live alone 1.043 0.959

15
Table 32 displays all categorical predictors and the continuous independent variable,
hours worked. Table 32 shows that all VIF values are less than 10, with 2.070 being
the highest value. All tolerance levels are above 0.1, being 0.483 to 0.971.
Table 32 Collinearity Statistics for Wanting to Change Area of Practice with
Hours Worked as Continuous Independent Variable
Dependent Variable- Wanting to Change Area of Practice
Independent Variable Variance Inflation Factor Tolerance Levels
Hours worked 2.070 0.483
Fulltime 2.061 0.485
Possesses a degree 1.046 0.956
Live alone 1.030 0.971
Table 33 displays all categorical predictors and the continuous independent variable,
years in profession. Table 33 shows that all VIF values are less than 10, with 1.114
being the highest value. All tolerance levels are above 0.1, being 0.898 to 0.971.
Table 33 Collinearity Statistics for Wanting to Change Area of Practice with
Years in Profession as Continuous Independent Variable
Dependent Variable- Wanting to Change Area of Practice
Independent Variable Variance Inflation Factor Tolerance Levels
Years in profession 1.081 0.925
Fulltime 1.062 0.941
Possesses a degree 1.114 0.898
Live alone 1.030 0.971

16
2.2. Testing for multicollinearity for burnout
2.2.1. Burnout levels
The following tables (Tables 34 & 35) show collinearity results for burnout levels.
Table 34 displays all categorical predictors and the continuous independent variable,
age. Table 34 shows that all VIF values are less than 10, with 1.110 being the highest
value. All tolerance levels are above 0.1, being 0.901 to 0.962.
Table 34
Collinearity Statistics for Burnout with Age as Continuous Independent Variable
Dependent Variable- Burnout
Independent Variable Variance Inflation Factor Tolerance Levels
Age 1.083 0.924
Fulltime 1.061 0.942
Possesses a degree 1.110 0.901
Live alone 1.039 0.962
Table 35 displays all categorical predictors and the continuous independent variable,
years in profession. Table 35 shows that all VIF values are less than 10, with 1.171
being the highest value. All tolerance levels are above 0.1, being 0.854 to 0.970.
Table 35 Collinearity Statistics for Burnout with Years in Profession as
Continuous Independent Variable
Dependent Variable- Burnout
Independent Variable Variance Inflation Factor Tolerance Levels
Years in profession 1.128 0.887
Fulltime 1.062 0.942
Possesses a degree 1.171 0.854
Live alone 1.031 0.970
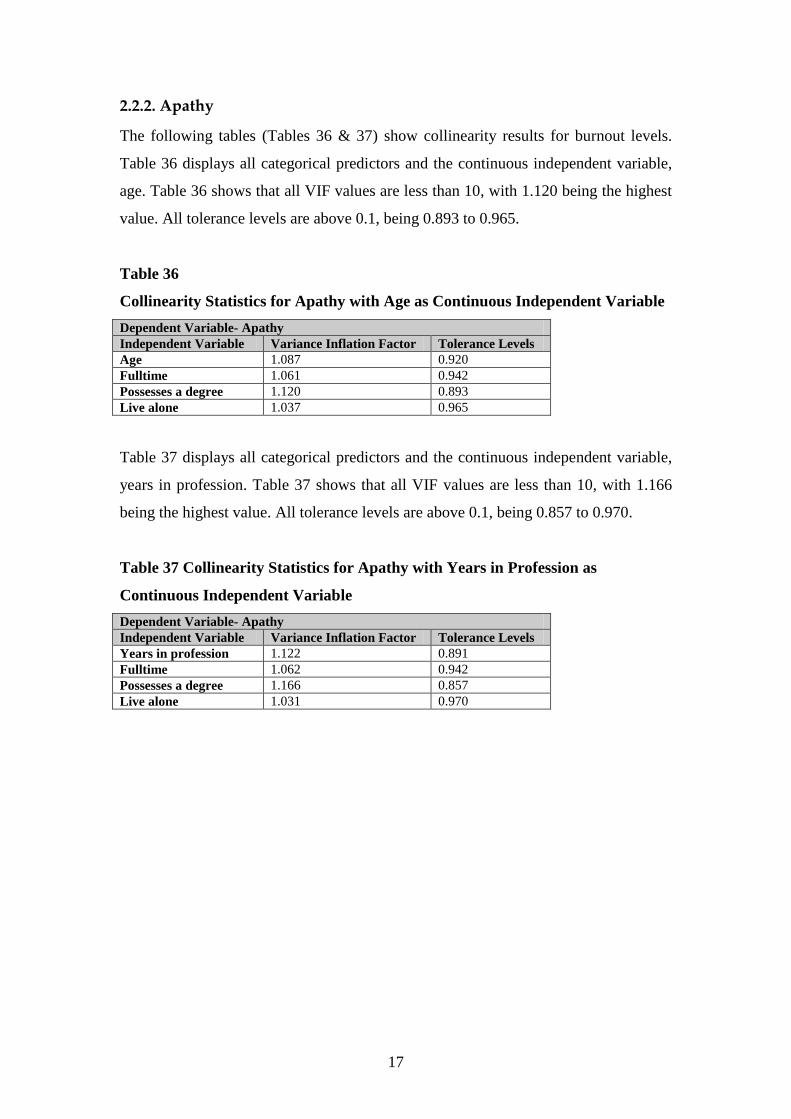
17
2.2.2. Apathy
The following tables (Tables 36 & 37) show collinearity results for burnout levels.
Table 36 displays all categorical predictors and the continuous independent variable,
age. Table 36 shows that all VIF values are less than 10, with 1.120 being the highest
value. All tolerance levels are above 0.1, being 0.893 to 0.965.
Table 36
Collinearity Statistics for Apathy with Age as Continuous Independent Variable
Dependent Variable- Apathy
Independent Variable Variance Inflation Factor Tolerance Levels
Age 1.087 0.920
Fulltime 1.061 0.942
Possesses a degree 1.120 0.893
Live alone 1.037 0.965
Table 37 displays all categorical predictors and the continuous independent variable,
years in profession. Table 37 shows that all VIF values are less than 10, with 1.166
being the highest value. All tolerance levels are above 0.1, being 0.857 to 0.970.
Table 37 Collinearity Statistics for Apathy with Years in Profession as
Continuous Independent Variable
Dependent Variable- Apathy
Independent Variable Variance Inflation Factor Tolerance Levels
Years in profession 1.122 0.891
Fulltime 1.062 0.942
Possesses a degree 1.166 0.857
Live alone 1.031 0.970

18
2.2.3. Feeling emotionally drained
The following table (Table 38) shows collinearity results for feeling emotionally
drained. Table 38 displays all categorical predictors and the continuous independent
variable, years in profession. Table 38 shows that all VIF values are less than 10, with
1.161 being the highest value. All tolerance levels are above 0.1, being 0.861 to
0.971.
Table 38 Collinearity Statistics for Feeling Emotionally Drained with Years in
Profession as Continuous Independent Variable
Dependent Variable- Feeling Emotionally Drained
Independent Variable Variance Inflation Factor Tolerance Levels
Years in profession 1.121 0.892
Fulltime 1.057 0.946
Possesses a degree 1.161 0.861
Live alone 1.030 0.971
2.2.4. Loss of empathy for clients
Table 39 displays all categorical predictors and the continuous independent variable,
hours worked. Table 39 shows that all VIF values are less than 10, with 1.921 being
the highest value. All tolerance levels are above 0.1, being 0.520 to 0.977.
Table 39 Collinearity Statistics for Loss of Empathy for Clients with Hours
Worked as Continuous Independent Variable
Dependent Variable- Loss of Empathy for Clients
Independent Variable Variance Inflation Factor Tolerance Levels
Hours worked 1.911 0.523
Possesses a degree 1.921 0.520
Live alone 1.044 0.958
Fulltime 1.023 0.977

19
2.3. Testing for multicollinearity for individual responses
2.3.1. Difficulty slowing down
The following tables (Tables 40, 41 & 42) show collinearity results for difficulty
slowing down. Table 40 displays all categorical predictors and the continuous
independent variable, age. Table 40 shows that all VIF values are less than 10, with
1.119 being the highest value. All tolerance levels are above 0.1, being 0.894 to
0.969.
Table 40 Collinearity Statistics for Difficulty Slowing Down with Age as
Continuous Independent Variable
Dependent Variable- Difficulty Slowing Down
Independent Variable Variance Inflation Factor Tolerance Levels
Age 1.090 0.917
Fulltime 1.054 0.948
Possesses a degree 1.119 0.894
Live alone 1.032 0.969
Table 41 displays all categorical predictors and the continuous independent variable,
hours worked. Table 41 shows that all VIF values are less than 10, with 1.924 being
the highest value. All tolerance levels are above 0.1, being 0.520 to 0.976.
Table 41 Collinearity Statistics for Difficulty Slowing Down with Hours Worked
as Continuous Independent Variable
Dependent Variable- Difficulty Slowing Down
Independent Variable Variance Inflation Factor Tolerance Levels
Hours worked 1.907 0.524
Possesses a degree 1.924 0.520
Live alone 1.041 0.961
Fulltime 1.024 0.976

20
Table 42 displays all categorical predictors and the continuous independent variable,
years in profession. Table 42 shows that all VIF values are less than 10, with 1.164
being the highest value. All tolerance levels are above 0.1, being 0.859 to 0.974.
Table 42 Collinearity Statistics for Difficulty Slowing Down with Years in
Profession as Continuous Independent Variable
Dependent Variable- Difficulty Slowing Down
Independent Variable Variance Inflation Factor Tolerance Levels
Years in profession 1.125 0.889
Fulltime 1.054 0.948
Possesses a degree 1.164 0.859
Live alone 1.027 0.974

1
Appendix 8 Normality plots for factor analysis
Work Environment Subscale
4.03.53.02.52.01.51.0
Observed Value
2
0
Exp
ecte
d N
orm
al
Normal Q-Q Plot of Frequency of stress

2
4 2 0
Observed Value
3
2
1
0
-1
-2
-3
Ex
pe
cte
d N
orm
al
No
rma
l
Normal Q-Q Plot of Time management

3
420
Observed Value
3
2
1
0
-1
-2
-3
Exp
ecte
d N
orm
al
Normal Q-Q Plot of Rush to complete tasks
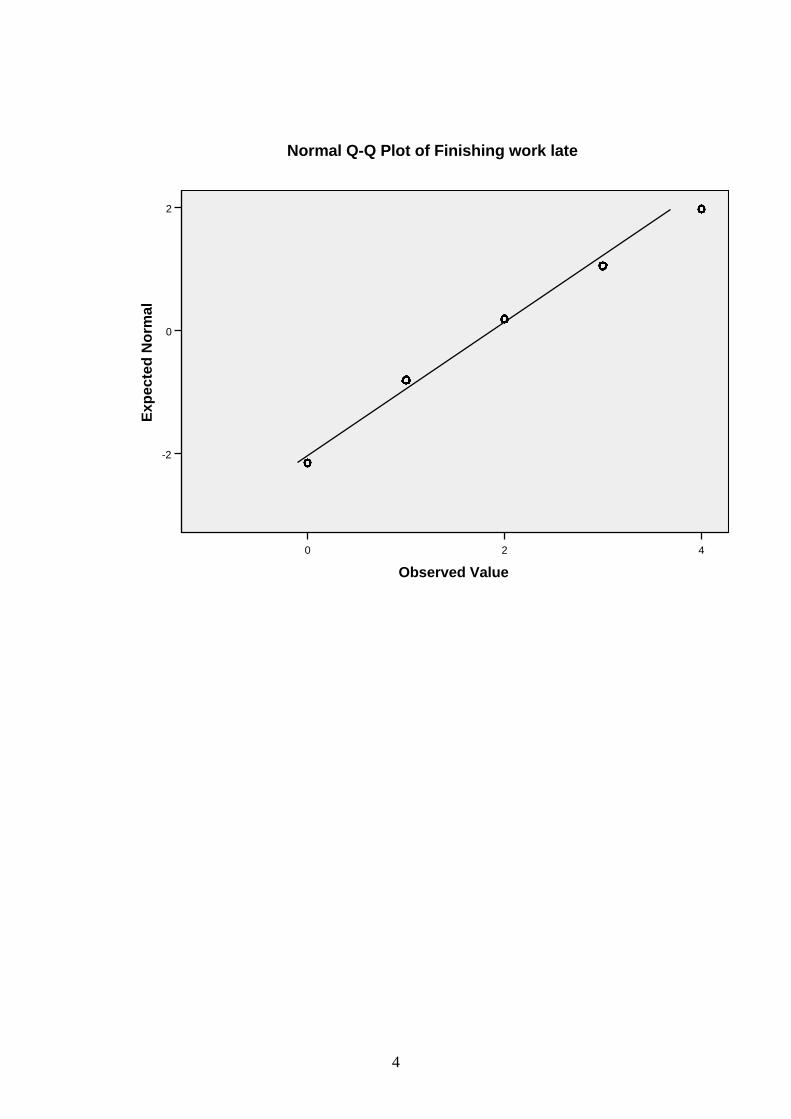
4
420
Observed Value
2
0
-2
Exp
ecte
d N
orm
al
Normal Q-Q Plot of Finishing work late

5
4 2 0
Observed Value
2
1
0
-1
-2
Ex
pe
cte
d N
orm
al
No
rma
l
Normal Q-Q Plot of Organisational support

6
Psychosocial Effects Subscale
7654321
Observed Value
1.5
1.0
0.5
0.0
-0.5
-1.0
-1.5
Exp
ecte
d N
orm
al
Normal Q-Q Plot of Experiencing increased anxiety

7
642
Observed Value
1.5
1.0
0.5
0.0
-0.5
-1.0
Exp
ecte
d N
orm
al
Normal Q-Q Plot of Sleeplessness over past decade

8
642
Observed Value
2.0
1.5
1.0
0.5
0.0
-0.5
Exp
ecte
d N
orm
al
Normal Q-Q Plot of Depression over past decade
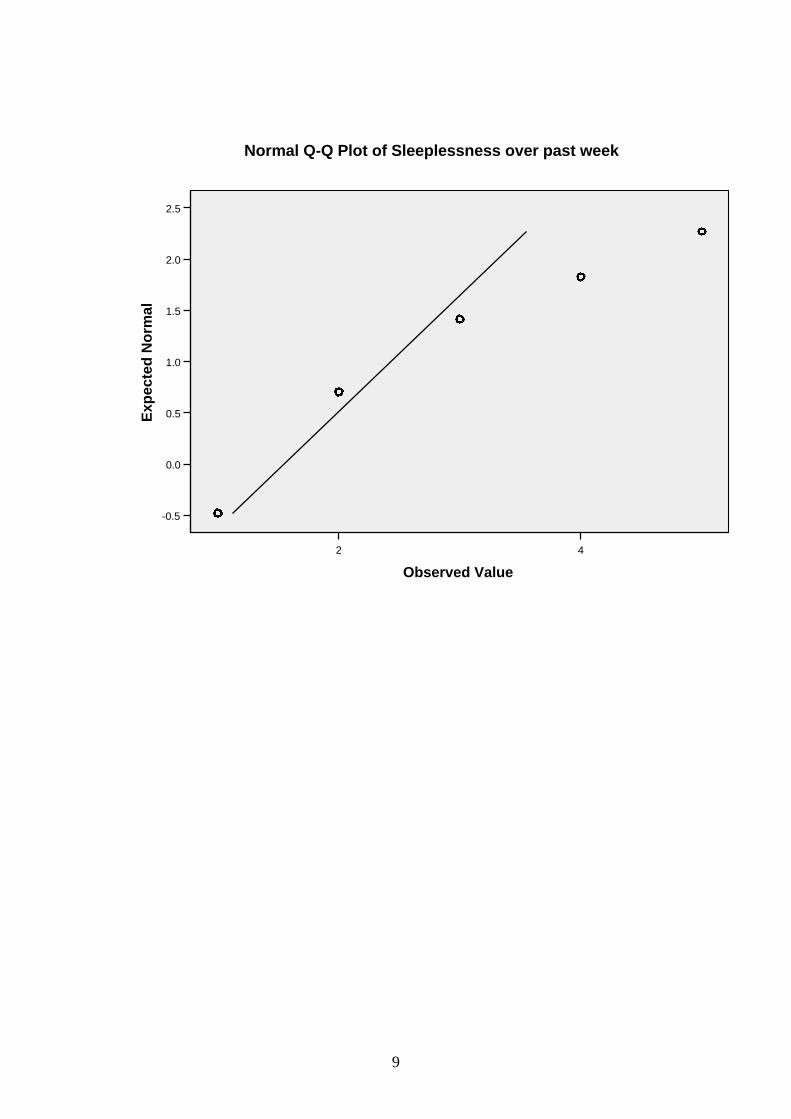
9
42
Observed Value
2.5
2.0
1.5
1.0
0.5
0.0
-0.5
Exp
ecte
d N
orm
al
Normal Q-Q Plot of Sleeplessness over past week

10
42
Observed Value
2.5
2.0
1.5
1.0
0.5
0.0
-0.5
-1.0
Exp
ecte
d N
orm
al
Normal Q-Q Plot of Headaches requiring analgesia

11
86420
Observed Value
2
1
0
-1
Exp
ecte
d N
orm
al
Normal Q-Q Plot of Stress requiring treatment

12
6543210
Observed Value
2
0
Exp
ecte
d N
orm
al
Normal Q-Q Plot of Mental health leave

13
7654321
Observed Value
2.0
1.5
1.0
0.5
0.0
-0.5
-1.0
Exp
ecte
d N
orm
al
Normal Q-Q Plot of Helplessness over past decade

14
6543210
Observed Value
2.5
2.0
1.5
1.0
0.5
0.0
-0.5
-1.0
Exp
ecte
d N
orm
al
Normal Q-Q Plot of Length of depression

15
Job Satisfaction Subscale
420
Observed Value
2
0
Exp
ecte
d N
orm
al
Normal Q-Q Plot of Suited to work
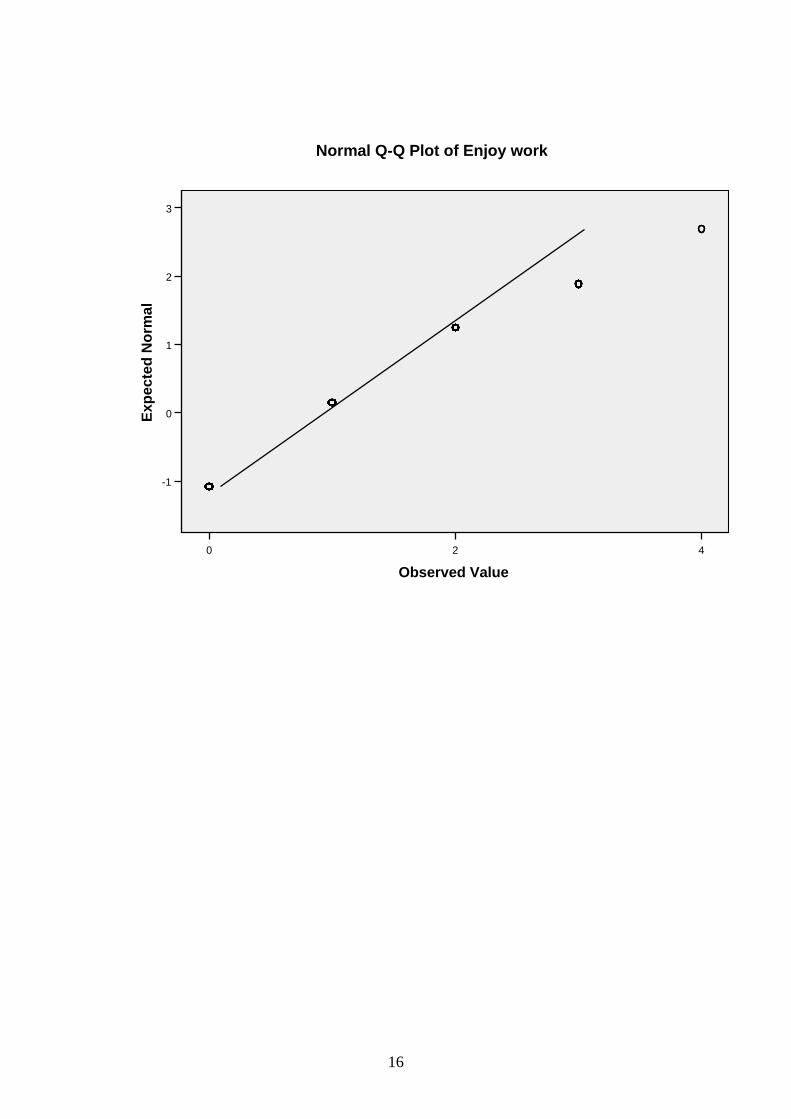
16
420
Observed Value
3
2
1
0
-1
Exp
ecte
d N
orm
al
Normal Q-Q Plot of Enjoy work

17
3.02.52.01.51.00.50.0
Observed Value
2.0
1.5
1.0
0.5
0.0
-0.5
-1.0
Exp
ecte
d N
orm
al
Normal Q-Q Plot of Change area of practice

18
3.02.52.01.51.00.50.0
Observed Value
1.5
1.0
0.5
0.0
-0.5
Exp
ecte
d N
orm
al
Normal Q-Q Plot of Like to leave professional discipline

19
86420
Observed Value
2
0
-2
Exp
ecte
d N
orm
al
Normal Q-Q Plot of Job dissatisfaction

20
Exhaustion Subscale
420
Observed Value
2
1
0
-1
Exp
ecte
d N
orm
al
Normal Q-Q Plot of Apathy
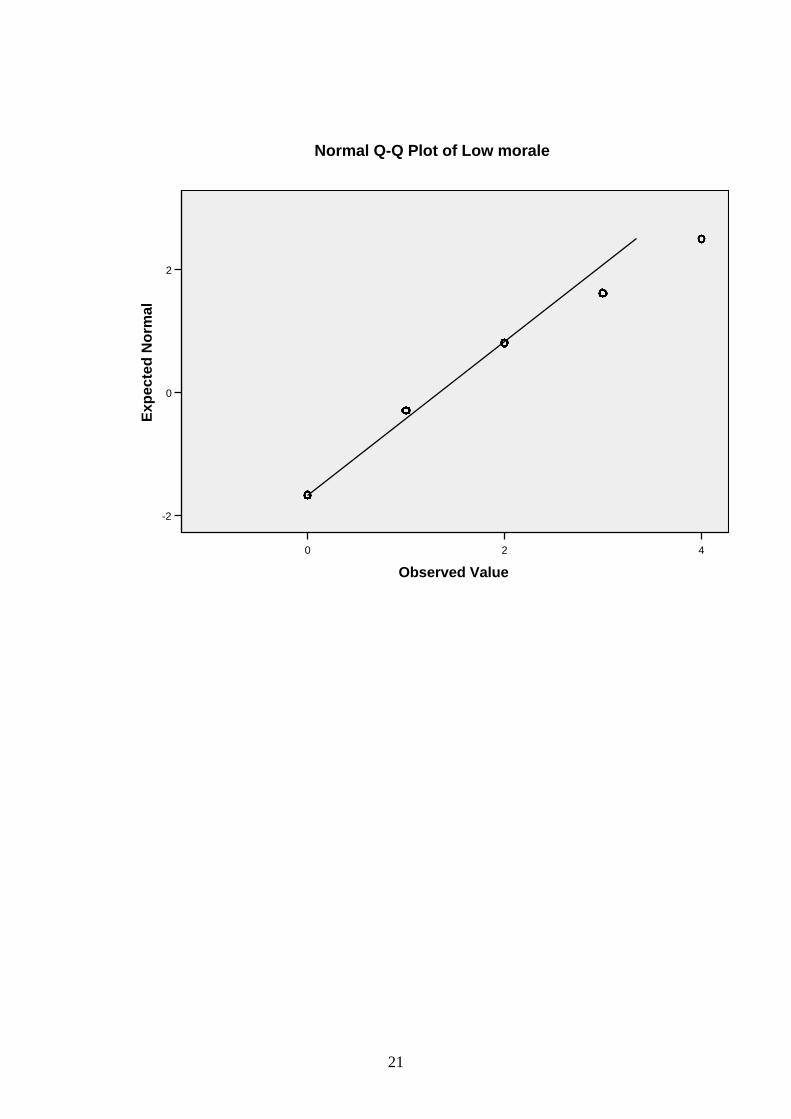
21
420
Observed Value
2
0
-2
Exp
ecte
d N
orm
al
Normal Q-Q Plot of Low morale

22
420
Observed Value
2
0
-2
Exp
ecte
d N
orm
al
Normal Q-Q Plot of Powerlessness

23
420
Observed Value
2
1
0
-1
-2
Exp
ecte
d N
orm
al
Normal Q-Q Plot of Feeling undervalued
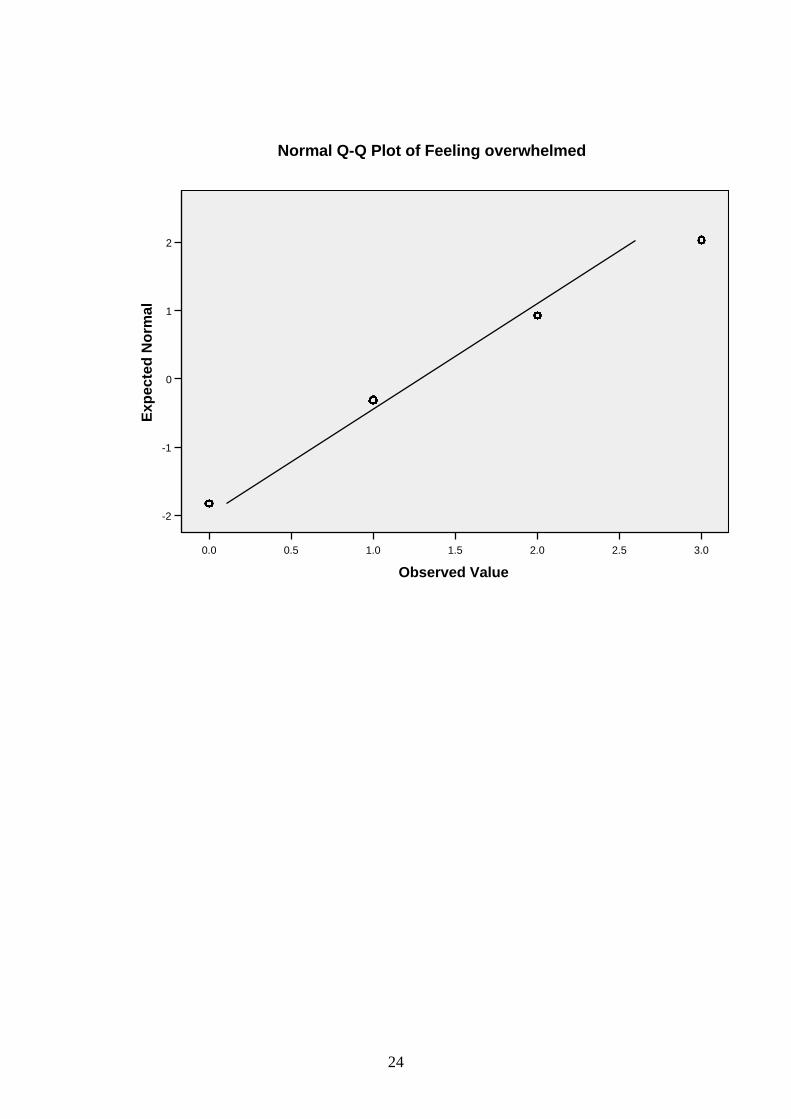
24
3.02.52.01.51.00.50.0
Observed Value
2
1
0
-1
-2
Exp
ecte
d N
orm
al
Normal Q-Q Plot of Feeling overwhelmed

25
420
Observed Value
2
0
-2
Exp
ecte
d N
orm
al
Normal Q-Q Plot of Feelings of incompetence
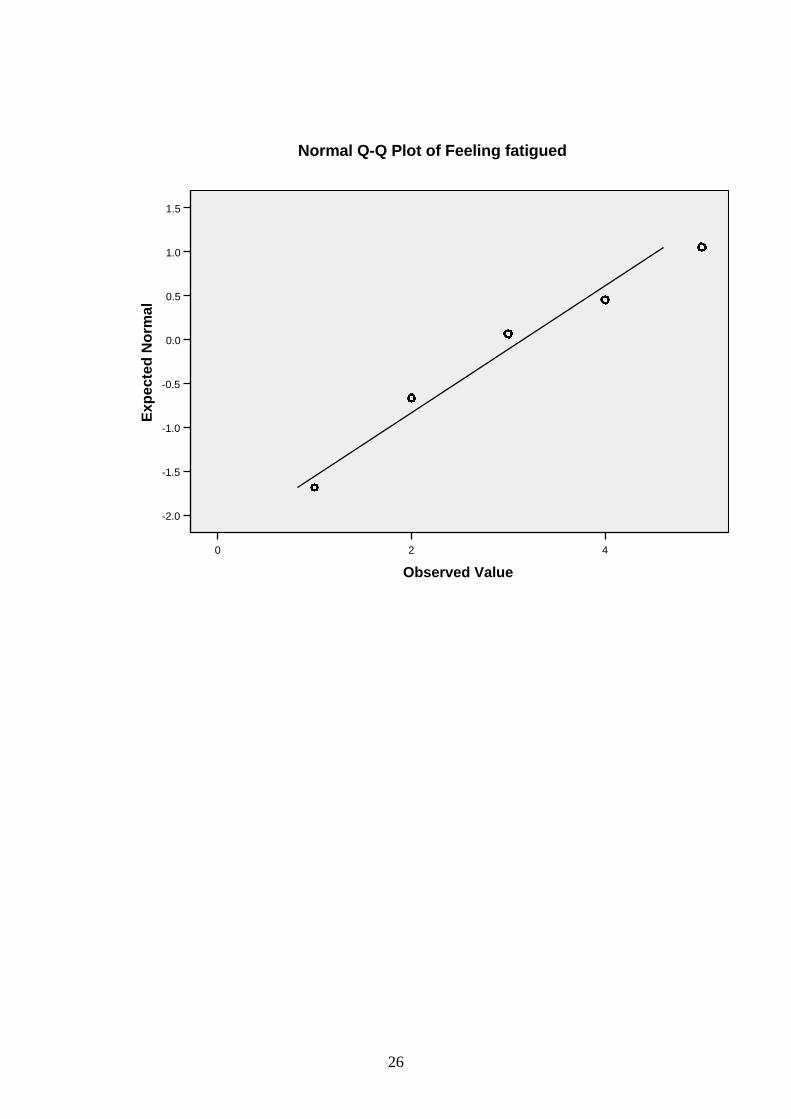
26
420
Observed Value
1.5
1.0
0.5
0.0
-0.5
-1.0
-1.5
-2.0
Exp
ecte
d N
orm
al
Normal Q-Q Plot of Feeling fatigued

27
42
Observed Value
2.0
1.5
1.0
0.5
0.0
-0.5
-1.0
Exp
ecte
d N
orm
al
Normal Q-Q Plot of Feeling emotionally drained

28
2.01.51.00.50.0
Observed Value
0.6
0.3
0.0
-0.3
-0.6
-0.9
Exp
ecte
d N
orm
al
Normal Q-Q Plot of Loss of empathy for colleagues

29
2.01.51.00.50.0
Observed Value
0.6
0.3
0.0
-0.3
-0.6
Exp
ecte
d N
orm
al
Normal Q-Q Plot of Loss of empathy for clients

30
Pressure and Motivation Subscale
420
Observed Value
2.5
0.0
-2.5
Exp
ecte
d N
orm
al
Normal Q-Q Plot of Achieving more in less time

31
420
Observed Value
2
0
-2
Exp
ecte
d N
orm
al
Normal Q-Q Plot of Unreasonable expectations

32
420
Observed Value
2.5
0.0
-2.5
Exp
ecte
d N
orm
al
Normal Q-Q Plot of Irritability

33
420
Observed Value
2
0
-2
Exp
ecte
d N
orm
al
Normal Q-Q Plot of Pushed for time

34
420
Observed Value
2
0
Exp
ecte
d N
orm
al
Normal Q-Q Plot of Difficulty slowing down
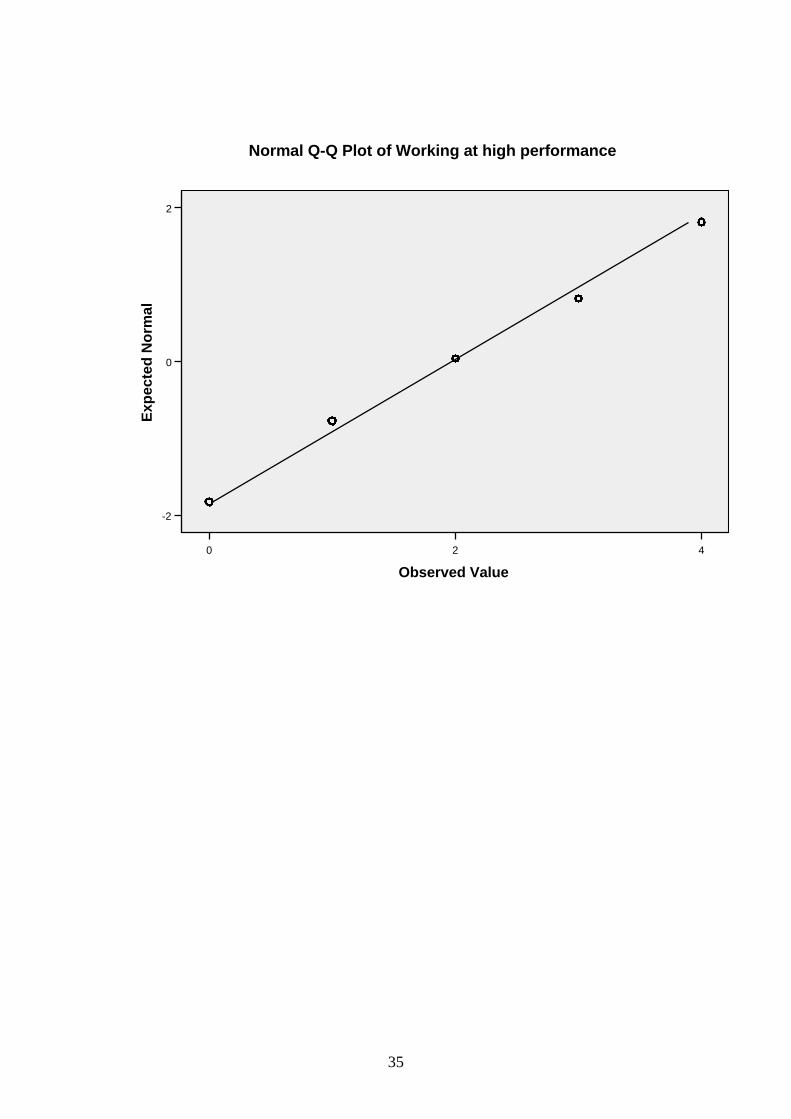
35
420
Observed Value
2
0
-2
Exp
ecte
d N
orm
al
Normal Q-Q Plot of Working at high performance

36
420
Observed Value
2
1
0
-1
-2
Exp
ecte
d N
orm
al
Normal Q-Q Plot of Keyed up

37
4 2 0
Observed Value
2
0
-2
Ex
pe
cte
d N
orm
al
No
rma
l
Normal Q-Q Plot of Multi-tasking
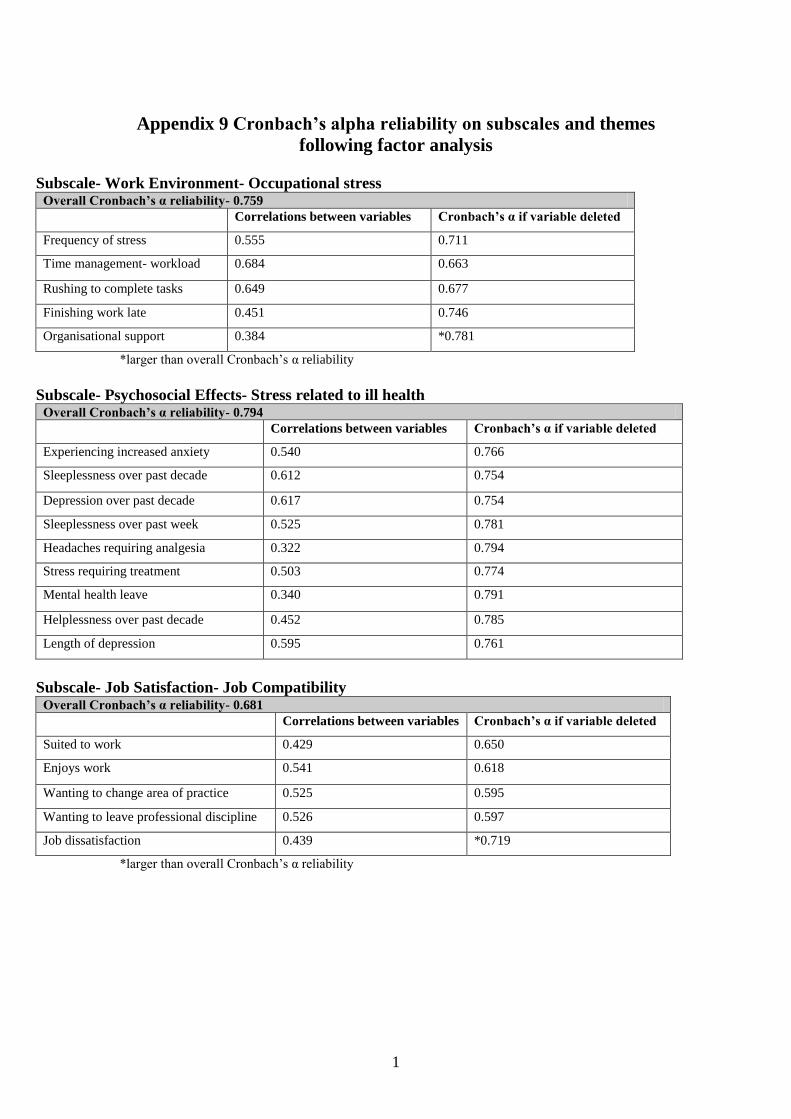
1
Appendix 9 Cronbach’s alpha reliability on subscales and themes
following factor analysis
Subscale- Work Environment- Occupational stress Overall Cronbach’s α reliability- 0.759
Correlations between variables Cronbach’s α if variable deleted
Frequency of stress 0.555 0.711
Time management- workload 0.684 0.663
Rushing to complete tasks 0.649 0.677
Finishing work late 0.451 0.746
Organisational support 0.384 *0.781
*larger than overall Cronbach’s α reliability
Subscale- Psychosocial Effects- Stress related to ill health Overall Cronbach’s α reliability- 0.794
Correlations between variables Cronbach’s α if variable deleted
Experiencing increased anxiety 0.540 0.766
Sleeplessness over past decade 0.612 0.754
Depression over past decade 0.617 0.754
Sleeplessness over past week 0.525 0.781
Headaches requiring analgesia 0.322 0.794
Stress requiring treatment 0.503 0.774
Mental health leave 0.340 0.791
Helplessness over past decade 0.452 0.785
Length of depression 0.595 0.761
Subscale- Job Satisfaction- Job Compatibility Overall Cronbach’s α reliability- 0.681
Correlations between variables Cronbach’s α if variable deleted
Suited to work 0.429 0.650
Enjoys work 0.541 0.618
Wanting to change area of practice 0.525 0.595
Wanting to leave professional discipline 0.526 0.597
Job dissatisfaction 0.439 *0.719
*larger than overall Cronbach’s α reliability
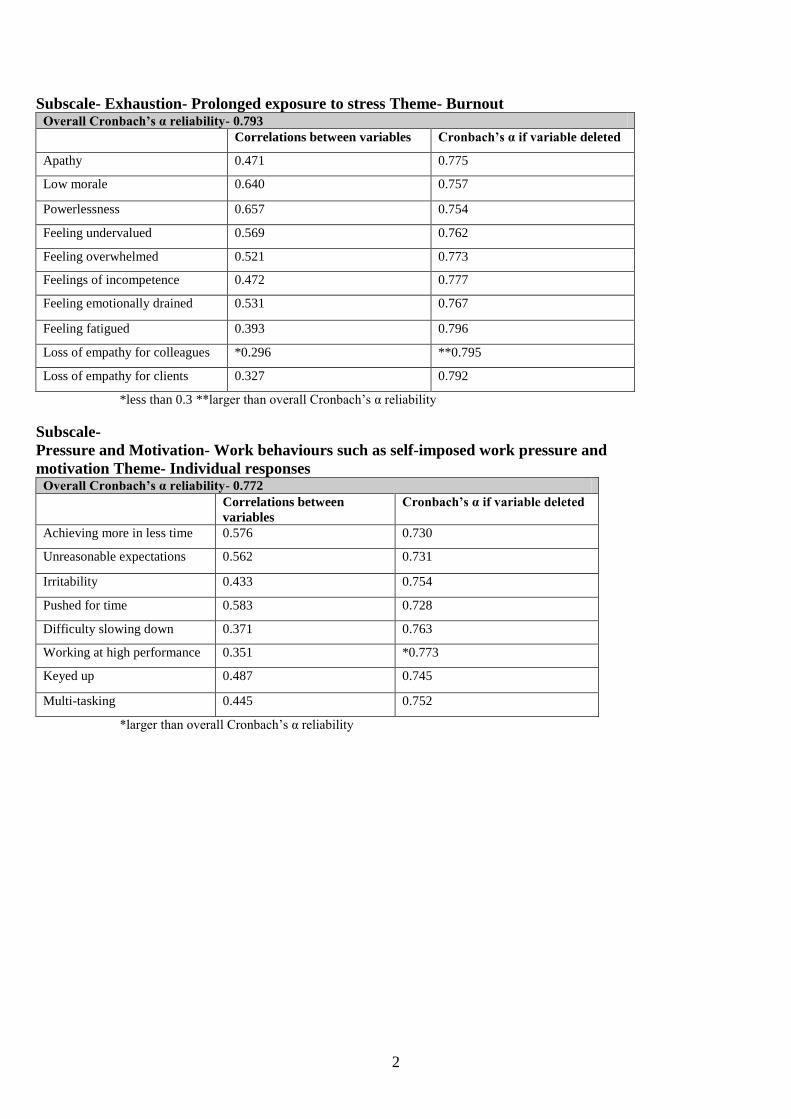
2
Subscale- Exhaustion- Prolonged exposure to stress Theme- Burnout Overall Cronbach’s α reliability- 0.793
Correlations between variables Cronbach’s α if variable deleted
Apathy 0.471 0.775
Low morale 0.640 0.757
Powerlessness 0.657 0.754
Feeling undervalued 0.569 0.762
Feeling overwhelmed 0.521 0.773
Feelings of incompetence 0.472 0.777
Feeling emotionally drained 0.531 0.767
Feeling fatigued 0.393 0.796
Loss of empathy for colleagues *0.296 **0.795
Loss of empathy for clients 0.327 0.792
*less than 0.3 **larger than overall Cronbach’s α reliability
Subscale-
Pressure and Motivation- Work behaviours such as self-imposed work pressure and
motivation Theme- Individual responses Overall Cronbach’s α reliability- 0.772
Correlations between
variables
Cronbach’s α if variable deleted
Achieving more in less time 0.576 0.730
Unreasonable expectations 0.562 0.731
Irritability 0.433 0.754
Pushed for time 0.583 0.728
Difficulty slowing down 0.371 0.763
Working at high performance 0.351 *0.773
Keyed up 0.487 0.745
Multi-tasking 0.445 0.752
*larger than overall Cronbach’s α reliability

3
Theme- Stress Overall Cronbach’s α reliability- 0.843
Correlations between
variables Cronbach’s α if variable deleted
Frequency of stress 0.573 0.835
Time management- workload 0.442 0.838
Rushing to complete tasks 0.461 0.837
Finishing work late *0.236 0.843
Organisational support 0.448 0.836
Experiencing increased anxiety 0.574 0.828
Sleeplessness over past decade 0.565 0.829
Depression over past decade 0.586 0.827
Sleeplessness over past week 0.520 0.835
Headaches requiring analgesia 0.345 0.840
Stress requiring treatment 0.530 0.832
Mental health leave 0.376 0.838
Helplessness over past decade 0.417 0.842
Length of depression 0.589 0.828
Suited to work *0.281 0.842
Enjoys work 0.371 0.839
Wanting to change area of practice 0.383 0.838
Wanting to leave professional discipline 0.382 0.838
Job dissatisfaction 0.531 0.831
*less than 0.3
All Subscales- Calculated on Overall Addition of Scores for Subscales Overall Cronbach’s α reliability- 0.744
Correlations between
subscales
Cronbach’s α if subscale deleted
Work environment (Stress) 0.623 0.706
Psychosocial effects (Stress) 0.636 0.730
Job satisfaction (Stress) 0.508 0.710
Exhaustion (Burnout) 0.725 0.619
Pressure and motivation (Individual
responses)
0.427 0.728
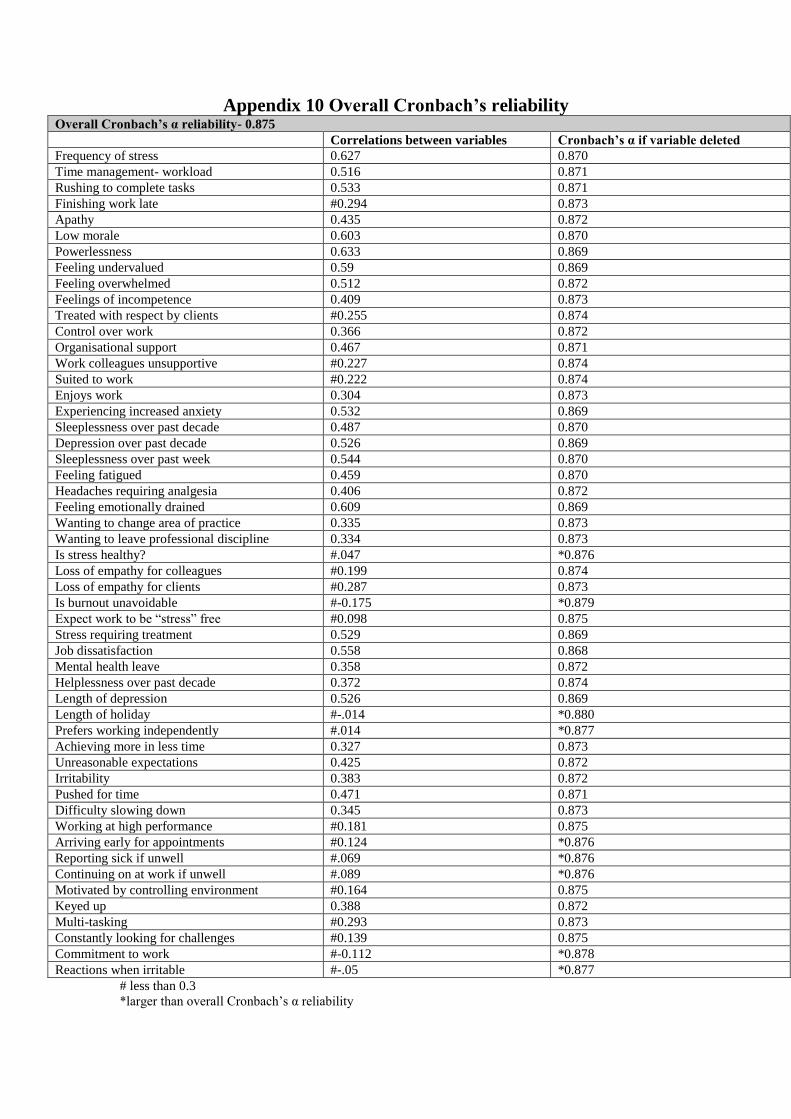
Appendix 10 Overall Cronbach’s reliability Overall Cronbach’s α reliability- 0.875
Correlations between variables Cronbach’s α if variable deleted
Frequency of stress 0.627 0.870
Time management- workload 0.516 0.871
Rushing to complete tasks 0.533 0.871
Finishing work late #0.294 0.873
Apathy 0.435 0.872
Low morale 0.603 0.870
Powerlessness 0.633 0.869
Feeling undervalued 0.59 0.869
Feeling overwhelmed 0.512 0.872
Feelings of incompetence 0.409 0.873
Treated with respect by clients #0.255 0.874
Control over work 0.366 0.872
Organisational support 0.467 0.871
Work colleagues unsupportive #0.227 0.874
Suited to work #0.222 0.874
Enjoys work 0.304 0.873
Experiencing increased anxiety 0.532 0.869
Sleeplessness over past decade 0.487 0.870
Depression over past decade 0.526 0.869
Sleeplessness over past week 0.544 0.870
Feeling fatigued 0.459 0.870
Headaches requiring analgesia 0.406 0.872
Feeling emotionally drained 0.609 0.869
Wanting to change area of practice 0.335 0.873
Wanting to leave professional discipline 0.334 0.873
Is stress healthy? #.047 *0.876
Loss of empathy for colleagues #0.199 0.874
Loss of empathy for clients #0.287 0.873
Is burnout unavoidable #-0.175 *0.879
Expect work to be “stress” free #0.098 0.875
Stress requiring treatment 0.529 0.869
Job dissatisfaction 0.558 0.868
Mental health leave 0.358 0.872
Helplessness over past decade 0.372 0.874
Length of depression 0.526 0.869
Length of holiday #-.014 *0.880
Prefers working independently #.014 *0.877
Achieving more in less time 0.327 0.873
Unreasonable expectations 0.425 0.872
Irritability 0.383 0.872
Pushed for time 0.471 0.871
Difficulty slowing down 0.345 0.873
Working at high performance #0.181 0.875
Arriving early for appointments #0.124 *0.876
Reporting sick if unwell #.069 *0.876
Continuing on at work if unwell #.089 *0.876
Motivated by controlling environment #0.164 0.875
Keyed up 0.388 0.872
Multi-tasking #0.293 0.873
Constantly looking for challenges #0.139 0.875
Commitment to work #-0.112 *0.878
Reactions when irritable #-.05 *0.877
# less than 0.3
*larger than overall Cronbach’s α reliability

1
Appendix 11 Other variables relating to individual responses to
stress and burnout not included in subscales
Question deemed unreliable by work environment subscale
The following question was removed from the work environment subscale as the
variable showed a much higher value (0.759) compared to the overall reliability of
0.728. Following removal of this question the overall reliability for the remaining five
questions for the work environment subscale increased to 0.759. The correlations
between variables was also much less than 0.3, being 0.188.
The majority (83.1%) of nurses and midwives in this sample indicated that they never
or occasionally felt unsupported by their colleagues (Table 1). For 16.9 per cent of
this sample, unsupportive colleagues were a problem.
Table 1 Finding Work Colleagues Unsupportive
Responses Never Occasionally Frequently Most of the time Always Total
Number 110 357 64 25 6 562 Percentage 19.6 63.5 11.4 4.4 1.1 100
Reliable questions
The following two reliable questions were not included in the original pilot study‟s
subscales.
The majority (65.8%) of this sample were treated with respect by their patients most
of the time (Table 2).
Table 2 Respected by Patients
Responses Never Occasionally Frequently Most of the time Always Total
Number 0 30 108 369 54 561 Percentage 0.0 5.3 19.3 65.8 9.6 100

2
Nearly two-fifths (38.3%) of the sample never or occasionally felt as though they had
control over their work (Table 3).
Table 3 Control over Work
Responses Never Occasionally Frequently Most of the time Always Total
Number 38 177 117 212 18 562 Percentage 6.8 31.5 20.8 37.7 3.2 100
Unreliable questions from stress and burnout section of questionnaire
Overall reliability of the questionnaire was assessed and finalised by Cronbach‟s
alpha, (α) on all questions for the total questionnaire (Appendix 10) and each of the
five subscales (Appendix 9) for this sample of 562 nurses and midwives. Even though
12 out of 52 questions were unreliable, it was believed that these questions could
provide important information. Acceptable levels are 0.7 or higher. To determine
reliability, the corrected-item correlations are correlations between each individual
item and the overall total score from the questionnaire. These correlations should be at
least 0.3. With bigger sample sizes, smaller correlations are acceptable. If there are
very low correlation coefficients, (which the following questions demonstrate) these
items do not correlate with the total scale overall. If values for each question are
greater than the alpha (α) level overall, these items are deemed unreliable and may
then be deleted to improve reliability (Field, 2005).
Following removal of the following question from the total questionnaire, the overall
reliability increased from 0.875 to 0.876. The corrected-item correlation was also
much less than 0.3 (0.047). The majority (73.8%) of nurses and midwives thought
that a certain amount of stress was healthy (Table 4).
Table 4 Is Stress Healthy?
Responses Yes No Unsure Total
Number 411 69 77 557
Percentage 73.8 12.4 13.8 100

3
Following removal of the following question the overall reliability increased from
0.875 to 0.879. The corrected-item correlation was also much less than 0.3 (0.175).
There was almost an equal number of nurses and midwives answering „yes‟ (40.8%)
and „no‟ (38.9%) to whether “burnout” was unavoidable in their job (Table 5).
Table 5 Is “Burnout” Unavoidable?
Responses Yes No Unsure Total
Number 227 216 113 556 Percentage 40.8 38.9 20.3 100
For the following question, the corrected-item correlation was much less than 0.3
(0.098), even though the overall reliability (0.875) would have been the same if the
question was removed. The majority (89.8%) of nurses and midwives did not expect a
“stress” free work environment (Table 6).
Table 6 Expecting Work Environment to be “Stress” Free
Responses Yes No Unsure Total
Number 38 502 19 559 Percentage 6.8 89.8 3.4 100
Following removal of the following question the overall reliability increased from
0.875 to 0.88. The corrected-item correlation was also much less than 0.3 (-0.014).
The majority (71.1%) of this samples‟ length of holiday was two or three weeks or
less over the past year (Table 7).
Table 7 Length of Holiday over Past Year
Responses Numbers Percentage
For 7 to 10 weeks 28 5.0
For 5 or 6 weeks 42 7.5
For a month 92 16.4
For 2 or 3 weeks 283 50.5
For a week 69 12.3
For 3 to 5 days 22 3.9
For 2 days 3 0.6
For a day 2 0.4
No holiday 19 3.4
Total 560 100

4
Following removal of the following question the overall reliability increased from
0.875 to 0.877. The corrected-item correlation was also much less than 0.3 (0.014).
Nearly half (49.8%) of this sample occasionally preferred to work independently
(Table 8).
Table 8 Preference for Working Independently
Responses Never Occasionally Frequently Most of the time Always Total
Number 150 278 77 47 6 558 Percentage 26.9 49.8 13.8 8.4 1.1 100
Unreliable questions from individual responses section of questionnaire
Following removal of the following question the overall reliability increased from
0.875 to 0.876. The corrected-item correlation was also much less than 0.3 (0.124).
Over two-thirds (67.6%) of this sample of nurses and midwives arrived early for
appointments either frequently, most of the time or always (Table 9).
Table 9 Arriving Early for Appointments
Responses Never Occasionally Frequently Most of the time Always Total
Number 28 154 96 177 107 562 Percentage 5.0 27.4 17.1 31.5 19.0 100
Following removal of the following question the overall reliability increased from
0.875 to 0.876. The corrected-item correlation was also much less than 0.3 (0.069).
The majority (74.2%) of nurses and midwives never or occasionally reported sick for
work if unwell (Table 10).
Table 10 Reporting Sick if Unwell
Responses Never Occasionally Frequently Most of the time Always Total
Number 99 318 45 79 21 562 Percentage 17.6 56.6 8.0 14.1 3.7 100
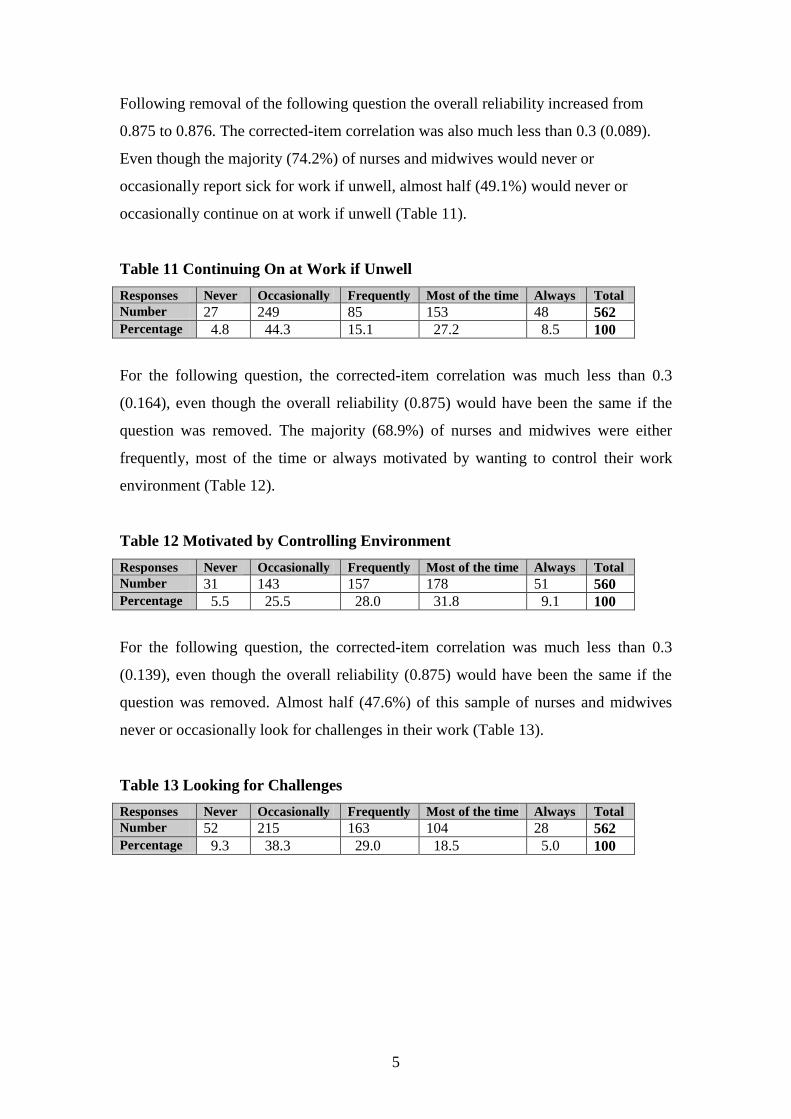
5
Following removal of the following question the overall reliability increased from
0.875 to 0.876. The corrected-item correlation was also much less than 0.3 (0.089).
Even though the majority (74.2%) of nurses and midwives would never or
occasionally report sick for work if unwell, almost half (49.1%) would never or
occasionally continue on at work if unwell (Table 11).
Table 11 Continuing On at Work if Unwell
Responses Never Occasionally Frequently Most of the time Always Total
Number 27 249 85 153 48 562 Percentage 4.8 44.3 15.1 27.2 8.5 100
For the following question, the corrected-item correlation was much less than 0.3
(0.164), even though the overall reliability (0.875) would have been the same if the
question was removed. The majority (68.9%) of nurses and midwives were either
frequently, most of the time or always motivated by wanting to control their work
environment (Table 12).
Table 12 Motivated by Controlling Environment
Responses Never Occasionally Frequently Most of the time Always Total
Number 31 143 157 178 51 560 Percentage 5.5 25.5 28.0 31.8 9.1 100
For the following question, the corrected-item correlation was much less than 0.3
(0.139), even though the overall reliability (0.875) would have been the same if the
question was removed. Almost half (47.6%) of this sample of nurses and midwives
never or occasionally look for challenges in their work (Table 13).
Table 13 Looking for Challenges
Responses Never Occasionally Frequently Most of the time Always Total
Number 52 215 163 104 28 562 Percentage 9.3 38.3 29.0 18.5 5.0 100

6
Following removal of the following question the overall reliability increased from
0.875 to 0.878. The corrected-item correlation was also much less than 0.3 (-0.112).
The majority (83.2%) of nurses and midwives occasionally or never had a strong
commitment to work (Table 14).
Table 14 Strong Commitment to Work
Responses Never Occasionally Frequently Most of the time Always Total
Number 216 252 60 31 3 562 Percentage 38.4 44.8 10.7 5.5 0.5 100
Following removal of the following question the overall reliability increased from
0.875 to 0.877. The corrected-item correlation was also much less than 0.3 (-0.05).
The majority (88.4%) of nurses and midwives reacted mildly when irritable (Table
15).
Table 15 Reactions when Irritable
Responses Numbers Percentage
Bottle your feelings inside 142 25.7
Verbalise your feelings in a controlled manner 347 62.7
Verbalise your feelings in a disruptive manner 41 7.4
Swear and shout 23 4.2
Total 553 100

Appendix 12 Comparison of study sample with state and national
statistics of areas of practice in all jobs
Numbers of nurses / midwives in areas of work, all jobs, study
sample, N = 554, Australia, 2005, national sample, N = 201,753, Australia, 2001
and NSW sample, N = 35,664, NSW, 2003
Area of work Study
sample
Number
Research
sample
%
National
sample
Number
National
sample %
NSW
sample
Number
NSW
sample %
Accident &
Emergency
38 6.9% 7,531 3.7% 2,341 3.7%
Aged care 15 2.7% 32,218 16% 8,505 15.1%
Community 124 22.4% 8,564 4.2% 3,088 5.2%
Critical care 23 4.2% 10,665 5.3% 2,662 5%
Education 31 5.6% Not
reported
Not
reported
Not
reported
Not
reported
Management 20 3.6% Not
reported
Not
reported
Not
reported
Not
reported
Medical 36 6.5% 20, 462 10.1% 4,918 8.8%
Midwife 309 55.8% 13,865 6.9% 3,713 6.4%
Neonatal 80 14.4% Not
reported
Not
reported
628 1%
Oncology 5 0.9% 3,685 1.8% 937 1.2%
Operating
Theatre /
Recovery
18 3.2% 15,256 7.6% 4,552 7.7%
Surgical 36 6.5% 16,175 8% 2,398 4.1%
Other 29 5.2% 7,499 3.7% 1,922 4%
Percentages of critical care areas, accident and emergency, oncology and medical
areas are almost the same for the study and NSW Health sample. These areas are very
similar for the national sample. Percentages of the midwifery study sample are
substantially greater than the NSW Health and national sample. Percentages of
neonatal and community areas are greater in the study sample than the NSW Health
sample. The percentage of the community study sample is also much larger than the
national sample. Percentages of operating theatres, recovery and surgical areas are
similar in all samples. Percentages of nurses working in other areas are greater in the
NSW Health sample compared to the study and national samples. The percentages of
nurses working in the aged care sector are considerably lower in the study sample
compared with the NSW Health and national samples.
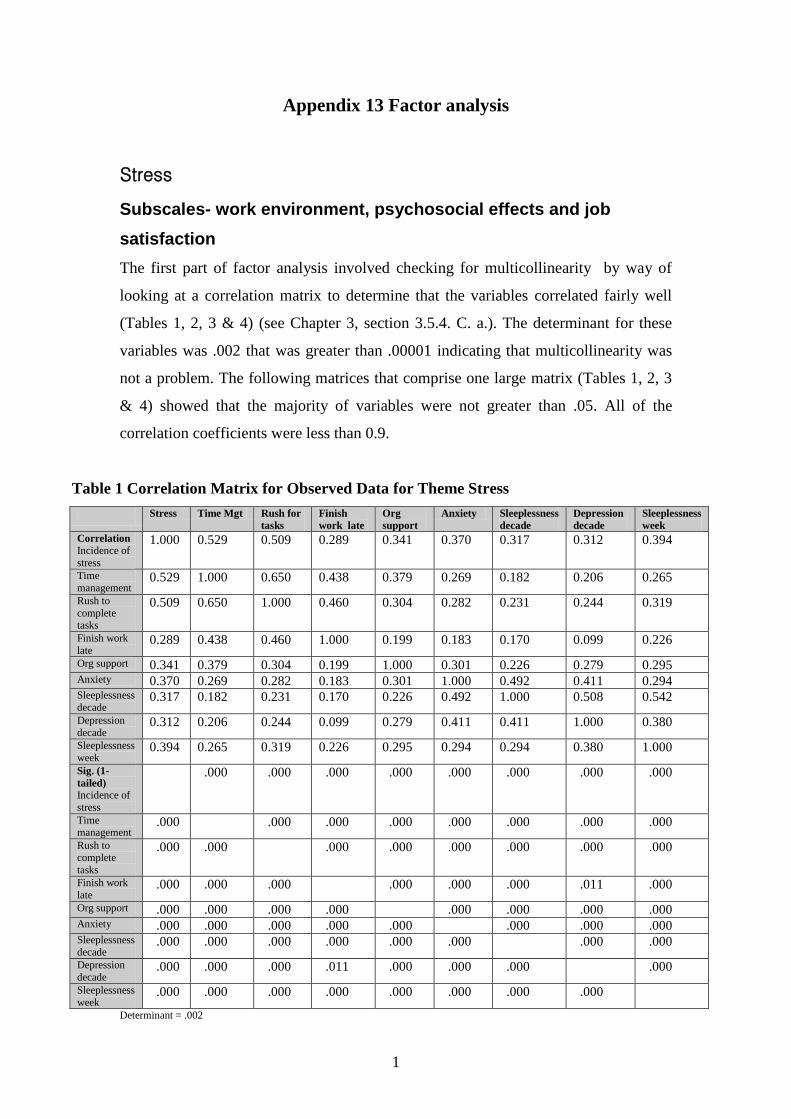
1
Appendix 13 Factor analysis
Stress
Subscales- work environment, psychosocial effects and job
satisfaction
The first part of factor analysis involved checking for multicollinearity by way of
looking at a correlation matrix to determine that the variables correlated fairly well
(Tables 1, 2, 3 & 4) (see Chapter 3, section 3.5.4. C. a.). The determinant for these
variables was .002 that was greater than .00001 indicating that multicollinearity was
not a problem. The following matrices that comprise one large matrix (Tables 1, 2, 3
& 4) showed that the majority of variables were not greater than .05. All of the
correlation coefficients were less than 0.9.
Table 1 Correlation Matrix for Observed Data for Theme Stress
Stress Time Mgt Rush for
tasks
Finish
work late
Org
support
Anxiety Sleeplessness
decade Depression
decade Sleeplessness
week Correlation
Incidence of
stress
1.000 0.529 0.509 0.289 0.341 0.370 0.317 0.312 0.394
Time
management 0.529 1.000 0.650 0.438 0.379 0.269 0.182 0.206 0.265
Rush to
complete tasks
0.509 0.650 1.000 0.460 0.304 0.282 0.231 0.244 0.319
Finish work
late 0.289 0.438 0.460 1.000 0.199 0.183 0.170 0.099 0.226
Org support 0.341 0.379 0.304 0.199 1.000 0.301 0.226 0.279 0.295 Anxiety 0.370 0.269 0.282 0.183 0.301 1.000 0.492 0.411 0.294 Sleeplessness
decade 0.317 0.182 0.231 0.170 0.226 0.492 1.000 0.508 0.542
Depression
decade 0.312 0.206 0.244 0.099 0.279 0.411 0.411 1.000 0.380
Sleeplessness
week 0.394 0.265 0.319 0.226 0.295 0.294 0.294 0.380 1.000
Sig. (1-
tailed)
Incidence of
stress
.000 .000 .000 .000 .000 .000 .000 .000
Time management
.000 .000 .000 .000 .000 .000 .000 .000
Rush to
complete
tasks
.000 .000 .000 .000 .000 .000 .000 .000
Finish work
late .000 .000 .000 .000 .000 .000 .011 .000
Org support .000 .000 .000 .000 .000 .000 .000 .000 Anxiety .000 .000 .000 .000 .000 .000 .000 .000 Sleeplessness
decade .000 .000 .000 .000 .000 .000 .000 .000
Depression
decade .000 .000 .000 .011 .000 .000 .000 .000
Sleeplessness
week .000 .000 .000 .000 .000 .000 .000 .000
Determinant = .002

2
Table 2 Correlation Matrix for Observed Data for Theme Stress
Headaches Treatment Leave Helplessness Depression Suited
to
work
Enjoy
work Change
area Leave
discipline Dissatisfaction
Correlation
Incidence of
stress
0.265 0.392 0.239 0.250 0.345 0.107 0.180 0.211 0.213 0.394
Time
management 0.190 0.226 0.194 0.172 0.225 0.079 0.143 0.157 0.108 0.341
Rush to
complete
tasks
0.212 0.265 0.139 0.193 0.265 0.007 0.101 0.141 0.096 0.353
Finish work late
0.159 0.127 -
0.009
0.109 0.118 -
0.051
-
0.038
-0.003 -0.002 0.129
Org support 0.160 0.233 0.146 0.170 0.276 0.177 0.214 0.255 0.184 0.377
Anxiety 0.175 0.332 0.210 0.374 0.346 0.153 0.215 0.206 0.262 0.340
Sleeplessness
decade 0.187 0.345 0.185 0.361 0.418 0.160 0.179 0.181 0.187 0.228
Depression decade
0.205 0.345 0.281 0.355 0.584 0.205 0.230 0.198 0.210 0.242
Sleeplessness
week 0.325 0.338 0.196 0.220 0.406 0.071 0.068 0.127 0.123 0.277
Sig. (1-
tailed)
Incidence of stress
.000 .000 .000 .000 .000 .007 .000 .000 .000 .000
Time
management .000 .000 .000 .000 .000 .035 .000 .000 .006 .000
Rush to
complete
tasks
.000 .000 .001 .000 .000 0.440 .010 .001 .013 .000
Finish work
late .000 .002 0.421 .006 .003 0.122 0.191 0.477 0.482 .001
Org support .000 .000 .000 .000 .000 .000 .000 .000 .000 .000 Anxiety .000 .000 .000 .000 .000 .000 .000 .000 .000 .000 Sleeplessness
decade .000 .000 .000 .000 .000 .000 .000 .000 .000 .000
Depression
decade .000 .000 .000 .000 .000 .000 .000 .000 .000 .000
Sleeplessness
week .000 .000 .000 .000 .000 .051 .059 .002 .002 .000
Determinant = .002

3
Table 3 Correlation Matrix for Observed Data for Theme Stress
Stress Time Mgt Rush for
tasks
Finish
work late
Org
support
Anxiety Sleeplessness
decade Depression
decade Sleeplessness
week Correlation
Headaches 0.265 0.190 0.212 0.159 0.160 0.175 0.187 0.205 0.326
Treatment 0.392 0.226 0.265 0.127 0.233 0.332 0.345 0.345 0.338 Leave 0.239 0.194 0.139 -0.009 0.146 0.210 0.185 0.281 0.196 Helplessness 0.250 0.172 0.193 0.109 0.170 0.374 0.361 0.355 0.220 Depression 0.345 0.225 0.265 0.118 0.276 0.346 0.418 0.584 0.406 Suited to work 0.107 0.079 0.007 -0.051 0.177 0.153 0.160 0.205 0.071 Enjoy work 0.180 0.143 0.101 -0.038 0.214 0.215 0.179 0.230 0.068 Change area 0.211 0.157 0.141 -0.003 0.255 0.206 0.181 0.198 0.127 Leave discipline
0.213 0.108 0.096 -0.002 0.184 0.262 0.187 0.210 0.123
Dissatisfaction 0.394 0.341 0.353 0.129 0.377 0.340 0.228 0.242 0.277 Sig. (1-tailed)
Headaches .000 .000 .000 .000 .000 .000 .000 .000 .000
Treatment .000 .000 .000 .000 .002 .000 .000 .000 .000 Leave .000 .000 .001 0.421 .000 .000 .000 .000 Helplessness .000 .000 .000 .000 .006 .000 .000 .000 .000 Depression .000 .000 .000 .000 .003 .000 .000 .000 .000 Suited to work .007 .035 0.440 .000 0.122 .000 .000 .000 .000 Enjoy work .000 .000 .010 .011 0.191 .000 .000 .000 .000 Change area .000 .000 .001 .000 0.477 .000 .000 .000 .000 Leave
discipline .000 .006 .000 .013 0.482 .000 .000 .000 .000
Dissatisfaction .000 .000 .000 .000 .001 .000 .000 .000 .000 Determinant = .002

4
Table 4 Correlation Matrix for Observed Data for Theme Stress
Headaches Treatment Leave Helplessness Depression Suited
to
work
Enjoy
work Change
area Leave
discipline Dissatisfaction
Correlation
Headaches 1.000 0.476 0.112 0.063 0.196 0.005 0.041 0.129 0.117 0.239
Treatment 0.476 1.000 0.257 0.240 0.399 0.124 0.201 0.215 0.183 0.379
Leave 0.112 0.257 1.000 0.228 0.277 0.150 0.183 0.269 0.227 0.262
Helplessness 0.063 0.240 0.228 1.000 0.338 0.084 0.164 0.067 0.143 0.206
Depression 0.196 0.399 0.277 0.338 1.000 0.135 0.145 0.250 0.209 0.323
Suited to work 0.005 0.124 0.150 0.084 0.135 1.000 0.533 0.307 0.328 0.241
Enjoy work 0.041 0.201 0.183 0.164 0.145 0.533 1.000 0.370 0.410 0.337
Change area 0.129 0.215 0.269 0.067 0.250 0.307 0.370 1.000 0.482 0.364
Leave discipline
0.117 0.183 0.227 0.143 0.209 0.328 0.410 0.482 1.000 0.339
Dissatisfaction 0.239 0.379 0.262 0.206 0.323 0.241 0.337 0.364 0.339 1.000 Sig. (1-tailed)
Headaches .000 .005 .073 .000 0.452 0.176 .001 .003 .000
Treatment .000 .000 .000 .000 .002 .000 .000 .000 .000 Leave .005 .00 .000 .000 .000 .000 .000 .000 .000 Helplessness .073 .000 .000 .000 .026 .000 .062 .000 .000 Depression .000 .000 .000 .000 .001 .000 .000 .000 .000 Suited to work 0.452 .002 .000 .026 .001 .000 .000 .000 .000 Enjoy work 0.176 .000 .000 .000 .000 .000 .000 .000 .000 Change area .001 .000 .000 .062 .000 .000 .000 .000 .000
Leave
discipline .003 .000 .000 .000 .000 .000 .000 .000 .000
Dissatisfaction .000 .000 .000 .000 .000 .000 .000 .000 .000
Determinant = .002
Bartlett’s test was highly significant, (p<0.001), meaning factor analysis was
appropriate for these data (see Chapter 3, section 3.5.4. C. c.). Based on the above
results (Tables 1-4), an inspection of these data by way of an anti-image correlation
matrix was warranted in order to establish whether any variable running diagonally
had a value of at least 0.5 (Tables 5 & 6) (see Chapter 3, section 3.5.4. C. d.). Tables
5 and 6 comprise one large matrix. In this instance the values ranged between 0.785
(headaches and suited to work) and 0.933 (incidence of stress). All off-diagonal
variable correlations should be very small, representing partial correlations between
the variables (they are for these data) (Tables 5 & 6) (Field, 2005).

5
Table 5 Correlation Matrix to Assess Suitability for Factor Analysis and Measure of
Sampling Adequacy for Stress
Variables Stress Time Mgt Rush for
tasks
Finish
work
late
Org
support
Anxiety Sleeplessness
decade Depression
decade Sleeplessness
week
Incidence of
stress -
0.933
-0.243 -0.158 -0.009 -0.040 -0.091 -0.001 -0.004 -0.130
Time
management -
0.243 0.830 0.427 -0.204 -0.172 -0.017 0.042 0.017 0.026
Rush to
complete
tasks
-
0.158
-0.427 0.851 -0.230 0.021 -0.017 0.012 -0.050 -0.062
Finish work
late -
0.009
-0.204 -0.230 0.855 -0.038 -0.045 -0.052 0.042 -0.050
Org support -
0.040
-0.172 0.021 -0.038 0.923 -0.090 0.048 -0.075 -0.114
Anxiety -
0.091
-0.017 -0.017 -0.045 -0.090 0.910 -0.281 -0.101 0.083
Sleeplessness
decade -
0.001
0.042 0.012 -0.052 0.048 -0.281 0.841 -0.218 -0.395
Depression
decade -
0.004
0.017 -0.050 0.042 -0.075 -0.101 -0.218 0.873 -0.019
Sleeplessness
week -
0.130
0.026 -0.062 -0.050 -0.114 0.083 -0.395 -0.019 0.856
Headaches -
0.019
-0.023 0.000 -0.053 0.008 0.002 0.059 -0.064 -0.181
Treatment -
0.136
0.052 -0.018 0.013 0.008 -0.057 -0.084 -.0009 0.009
Leave -
0.039
-0.102 0.043 0.092 0.050 -0.008 0.046 -0.097 -0.056
Helplessness -
0.034
0.002 -0.019 -0.017 -0.003 -0.160 -0.129 -0.083 0.036
Depression -.038 0.010 -0.021 0.010 -0.028 0.005 -0.024 -0.391 -0.130 Suited to
work 0.011 -0.034 0.091 0.014 -0.043 0.012 -0.040 -0.070 -0.003
Enjoy work -
0.006
-0.034 -0.014 0.065 -0.034 -0.004 -0.025 -0.074 0.068
Change area -
0.003
0.000 -0.024 0.041 -0.098 0.011 -0.052 0.037 0.053
Leave
discipline -
0.059
0.046 0.030 -0.001 0.025 -0.097 0.002 -0.006 0.008
Dissatisfaction -
0.068
-0.041 -0.122 0.046 -0.154 -0.101 0.061 0.089 -0.054
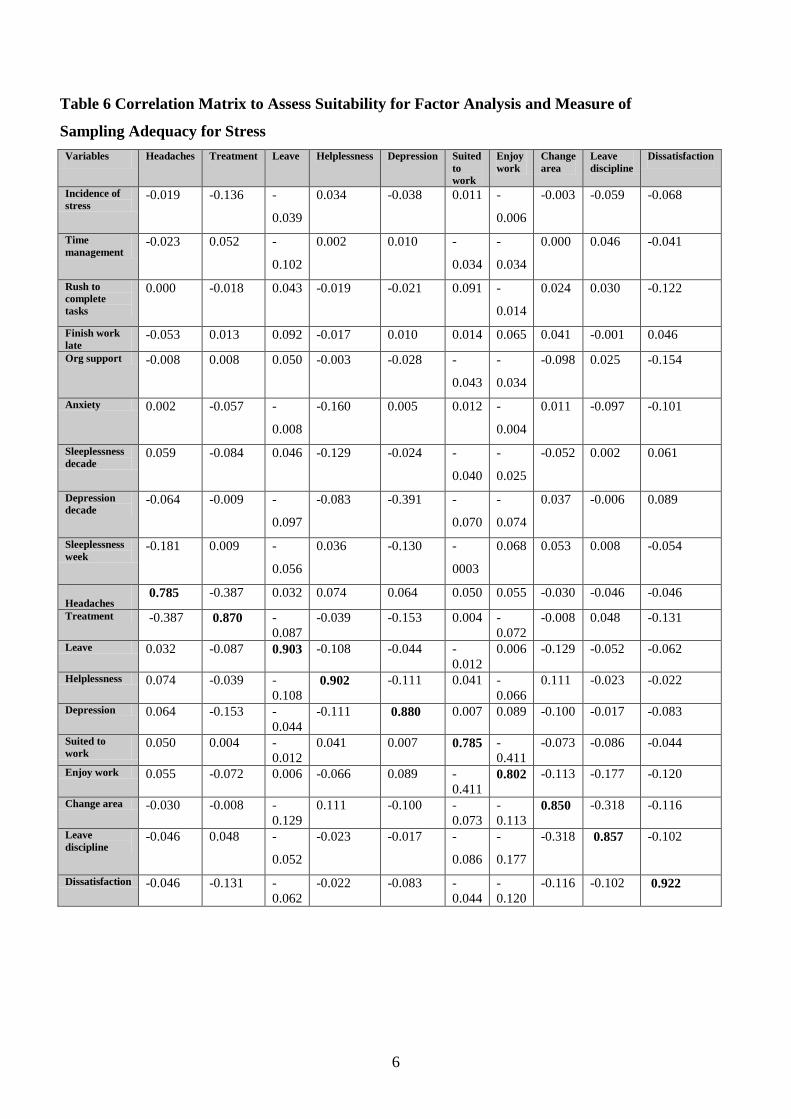
6
Table 6 Correlation Matrix to Assess Suitability for Factor Analysis and Measure of
Sampling Adequacy for Stress
Variables Headaches Treatment Leave Helplessness Depression Suited
to
work
Enjoy
work Change
area Leave
discipline Dissatisfaction
Incidence of
stress -0.019 -0.136 -
0.039
0.034 -0.038 0.011 -
0.006
-0.003 -0.059 -0.068
Time
management -0.023 0.052 -
0.102
0.002 0.010 -
0.034
-
0.034
0.000 0.046 -0.041
Rush to
complete
tasks
0.000 -0.018 0.043 -0.019 -0.021 0.091 -
0.014
0.024 0.030 -0.122
Finish work
late -0.053 0.013 0.092 -0.017 0.010 0.014 0.065 0.041 -0.001 0.046
Org support -0.008 0.008 0.050 -0.003 -0.028 -
0.043
-
0.034
-0.098 0.025 -0.154
Anxiety 0.002 -0.057 -
0.008
-0.160 0.005 0.012 -
0.004
0.011 -0.097 -0.101
Sleeplessness
decade 0.059 -0.084 0.046 -0.129 -0.024 -
0.040
-
0.025
-0.052 0.002 0.061
Depression
decade -0.064 -0.009 -
0.097
-0.083 -0.391 -
0.070
-
0.074
0.037 -0.006 0.089
Sleeplessness
week -0.181 0.009 -
0.056
0.036 -0.130 -
0003
0.068 0.053 0.008 -0.054
Headaches 0.785 -0.387 0.032 0.074 0.064 0.050 0.055 -0.030 -0.046 -0.046
Treatment -0.387 0.870 -
0.087
-0.039 -0.153 0.004 -
0.072
-0.008 0.048 -0.131
Leave 0.032 -0.087 0.903 -0.108 -0.044 -
0.012
0.006 -0.129 -0.052 -0.062
Helplessness 0.074 -0.039 -
0.108 0.902 -0.111 0.041 -
0.066
0.111 -0.023 -0.022
Depression 0.064 -0.153 -
0.044
-0.111 0.880 0.007 0.089 -0.100 -0.017 -0.083
Suited to
work 0.050 0.004 -
0.012
0.041 0.007 0.785 -
0.411
-0.073 -0.086 -0.044
Enjoy work 0.055 -0.072 0.006 -0.066 0.089 -
0.411 0.802 -0.113 -0.177 -0.120
Change area -0.030 -0.008 -
0.129
0.111 -0.100 -
0.073
-
0.113 0.850 -0.318 -0.116
Leave
discipline -0.046 0.048 -
0.052
-0.023 -0.017 -
0.086
-
0.177
-0.318 0.857 -0.102
Dissatisfaction -0.046 -0.131 -
0.062
-0.022 -0.083 -
0.044
-
0.120
-0.116 -0.102 0.922

7
As no variables were required to be excluded, progression to the next step, extracting
communalities, could be embarked upon. This was done by principal component
analysis (see Chapter 3, section 3.5.4. C. f.). As factor analysis involves discovering
underlying dimensions, it is essential to discover common variance. The
communalities are a percentage of variance explaining the underlying factor. Once
factors are extracted, it is easier to distinguish, in reality, the amount of common
variance (Field, 2005). For the variable inefficient time management (for example,
due to excessive workloads), 72.7 per cent of variance is shared or common variance
for stress (Table 7).
Table 7 Communalities for Stress
Stress Factor
Question or variable Extraction
Mental health leave 0.242
Organisational support 0.360
Experiencing increased anxiety 0.480
Helplessness over past decade 0.483
Sleeplessness over past week 0.505
Leave professional discipline 0.514
Job dissatisfaction 0.515
Being suited to the work 0.521
Finish work late 0.528
Change area of practice 0.532
Length of depression 0.539
Incidence of stress 0.558
Enjoying the type of work 0.606
Depression over past decade 0.611
Sleeplessness over past decade 0.617
Stress requiring treatment 0.627
Rush to complete tasks 0.699
Headaches requiring analgesia 0.716
Time management- workload 0.727
The following matrices that comprise one large matrix (Tables 8, 9, 10 & 11) contain
correlation coefficients between all questions based on this factor model. The matrices
diagonals contain the communalities (bold type) as seen in table 7. These reproduced
correlations stem from the factor model rather than observed data (as seen in Tables 1,
2, 3 & 4) (see Chapter 3, section 3.5.4. C. h.). If the model was perfect, the
reproduced correlations would be exactly the same as those original correlations
(Tables 1, 2, 3 & 4) (Field, 2005).

8
To assess the model’s fit, differences between correlations from the observed data and
model correlations are calculated. For example, the observed data correlation for rush
to complete tasks is 0.509 (Table 1). The model correlation for rush to complete tasks
is 0.576 (Table 8). This residual, the difference between the observed and model
correlation, is -0.067 (residual = robserved – rfrom model 0.509 – 0.576 = -0.067) (Table 4).
For a good model, all values will be small, and 50 per cent should be preferably less
than 0.05, otherwise generalisations to other samples is limited (Field, 2005). Tables
8, 9, 10 & 11 also illustrate that 39 per cent of residuals have a value greater than
0.05. This means that factor analysis results relating to stress can be generalised to a
wider population.
Table 8 Reproduced Model Correlations and Residuals for Stress
Reproduced
Correlation Stress Time Mgt Rush for
tasks
Finish
work late
Org
support
Anxiety Sleeplessness
decade Depression
decade Sleeplessness
week Incidence of
stress 0.558 0.572 0.576 0.418 0.422 0.387 0.343 0.337 0.416
Time
management 0.572 0.727 0.705 0.575 0.449 0.306 0.185 0.168 0.291
Rush to
complete tasks
0.576 0.705 0.699 0.576 0.430 0.322 0.231 0.206 0.342
Finish work
late 0.418 0.575 0.576 0.528 0.290 0.195 0.126 0.084 0.230
Org support 0.422 0.449 0.430 0.290 0.360 0.320 0.253 0.264 0.265 Anxiety 0.387 0.306 0.322 0.195 0.320 0.480 0.512 0.514 0.401 Sleeplessness decade
0.343 0.185 0.231 0.126 0.253 0.512 0.617 0.608 0.485
Depression
decade 0.337 0.168 0.206 0.084 0.264 0.514 0.608 0.611 0.466
Sleeplessness week
0.416 0.291 0.342 0.230 0.265 0.401 0.485 0.466 0.505
Residuals Stress Time mgt Rush for
tasks
Finish
work late
Org
support
Anxiety Sleeplessness
decade Depression
decade Sleeplessness
week Incidence of stress
-0.043 -0.0671
(1)
-0.1291
(2)
-0.0811
(3)
-0.016 -0.026 -0.024 -0.022
Time
management -
0.043
-0.0551
(4)
-0.1361
(5)
-0.0691
(6)
-0.037 -0.002 0.038 -0.026
Rush to
complete tasks
-
0.0671
(1)
-0.0551 (4)
-0.1171
(7)
-0.1261
(8)
-0.040 0.000 0.038 -0.024
Finish work late
-
0.1291
(2)
-0.1361 (5)
-0.1171
(7)
-0.0911
(9)
-0.012 0.044 0.015 -0.004
Org support -
0.0811
(3)
-0.0691 (6)
-0.1261
(8)
-0.0911
(9)
-0.019 -0.027 0.014 0.030
Anxiety -
0.016
-0.037 -0.040 -0.012 -0.027 -0.020 -0.1031
(10)
-0.1071 (11)
Sleeplessness
decade -
0.026
-0.002 0.000 0.044 0.014 -0.020 -0.1001
(12)
0.0571 (13)
Depression decade
-
0.024
0.038 0.038 0.015 0.030 -0.1031
(10)
-0.1001 (12)
-0.0861 (14)
Sleeplessness week
-
0.022
-0.026 -0.024 -0.004 0.002 -0.1071
(11)
0.0571 (13)
-0.0861
(14)
1. These 14 (out of 67 for Tables 8, 9, 10 & 11) (total 39%) nonredundant residuals have absolute values greater than 0.05.

9
Table 9 Reproduced Model Correlations and Residuals for Stress
Reproduced
Correlation
Headaches Treatment Leave Helplessness Depression Suited
to
work
Enjoy
work Change
area Leave
discipline Dissatisfaction
Correlation
Incidence of
stress
0.328 0.402 0.231 0.249 0.366 0.110 0.188 0.245 0.210 0.447
Time management
0.173 0.216 0.121 0.170 0.201 0.066 0.148 0.171 0.130 0.406
Rush to
complete tasks
0.220 0.257 0.122 0.195 0.241 0.008 0.085 0.125 0.084 0.382
Finish work
late 0.100 0.097 0.002 0.129 0.112 -
0.127
-
0.077
-0.054 -0.085 0.189
Org support 0.158 0.259 0.206 0.211 0.271 0.214 0.278 0.279 0.263 0.388
Anxiety 0.114 0.312 0.274 0.443 0.475 0.211 0.252 0.250 0.235 0.316
Sleeplessness decade
0.176 0.379 0.287 0.508 0.563 0.127 0.153 0.129 0.164 0.245
Depression
decade 0.176 0.390 0.314 0.499 0.564 0.194 0.223 0.195 0.230 0.281
Sleeplessness week
0.395 0.478 0.243 0.331 0.478 -
0.011
0.032 0.112 0.098 0.292
Residuals Headaches Treatment Leave Helplessness Depression Suited
to
work
Enjoy
work Change
area Leave
discipline Dissatisfaction
Incidence of
stress -0.063
1
(15)
-0.010 0.008 0.002 -0.021 -
0.003
-
0.008
-0.034 0.002 -0.0531 (39)
Time
management 0.018 0.010 0.073
1
(20)
0.001 0.024 0.013 -
0.006
-0.014 -0.022 -0.0661 (40)
Rush to
complete tasks
-0.008 0.009 0.017 -0.002 0.024 -
0.001
0.016 0.017 0.012 -0.029
Finish work
late 0.059
1
(16)
0.030 -
0.011
-0.021 0.005
0.0761
(31)
0.039 0.0511
(35) 0.083
1
(37) -0.060
1 (41)
Org support 0.002 -0.026 -
0.0591
(21)
-0.041 0.005 -
0.036
-
0.0631
(34)
-0.024 -0.0791
(38) -0.011
Anxiety 0.0601
(17)
0.021 -
0.0641
(22)
-0.0691 (24)
0.1291
(28)
-
0.0581
(32)
0.037 -0.004 0.027 0.024
Sleeplessness
decade 0.011 -0.034 -
0.1021
(23)
-0.1471
(25) -0.145
1
(29)
0.033 0.026 0.0521
(36) 0.023 -0.017
Depression decade
0.029 -0.045 -
0.033
-0.1441 (26)
0.020 0.011 0.007 0.003 -0.020 -0.039
Sleeplessness
week -0.069
1
(18)
-0.1401
(19)
-
0.047
-0.1111 (27)
-0.0731
(30)
0.0821
(33)
0.036 0.015 0.025 -0.015
1. These 27 (15-41 out of 67 for Tables 8, 9, 10 & 11) (total 39%) nonredundant residuals have absolute values greater than 005.

10
Table 10 Reproduced Model Correlations and Residuals for Stress
Reproduced
Correlation Stress Time mgt Rush for
tasks
Finish
work late
Org
support
Anxiety Sleeplessness
decade Depression
decade Sleeplessness
week Headaches 0.328 0.173 0.220 0.100 0.158 0.114 0.176 0.176 0.395 Treatment 0.402 0.216 0.257 0.097 0.259 0.312 0.379 0.390 0.478 Leave 0.231 0.121 0.122 0.002 0.206 0.274 0.287 0.314 0.243 Helplessness 0.249 0.170 0.195 0.129 0.211 0.443 0.508 0.499 0.331 Depression 0.366 0.201 0.241 0.112 0.271 0.475 0.563 0.564 0.478 Suited to work 0.110 0.066 0.008 -0.127 0.214 0.211 0.127 0.194 -0.011 Enjoy work 0.188 0.148 0.085 -0.077 0.278 0.252 0.153 0.223 0.032 Change area 0.245 0.171 0.125 -0.054 0.279 0.210 0.129 0.195 0.112 Leave
discipline 0.210 0.130 0.084 -0.085 0.263 0.235 0.164 0.230 0.098
Dissatisfaction 0.447 0.406 0.382 0.189 0.388 0.316 0.245 0.281 0.292 Residuals Stress Workload Rush for
tasks
Finish
work late
Org
support
Anxiety Sleeplessness
decade Depression
decade Sleeplessness
week Headaches -
0.0631
(15)
0.018 -0.008 0.0591
(16) 0.002 0.060
1
(17) 0.011 0.029 -0.069
1 (18)
Treatment -
0.010
0.010 0.009 0.030 -0.026 0.021 -0.034 -0.045 -0.1401 (19)
Leave 0.008 0.0731 (20)
0.017 -0.011 0.0591
(21) -0.064
1
(22) -0.102
1 (23) -0.033 -0.047
Helplessness 0.002 0.001 -0.002 -0.021 -0.041 -0.0691
(24) -0.147
1 (25) -0.144
1
(26) -0.111
1 (27)
Depression -
0.021
0.024 0.024 0.005 0.005 -0.1291
(28) -0.145
1 (29) 0.020 -0.073
1 (30)
Suited to work -
0.003
0.013 -0.001 0.0761
(31) -0.036 -0.058
1
(32) 0.033 0.011 0.082
1 (33)
Enjoy work -
0.008
-0.006 0.016 0.039 -0.0631
(34) -0.037 0.026 0.007 0.036
Change area -
0.034
-0.014 0.017 0.0511
(35) -0.024 -0.004 0.052
1 (36) 0.003 0.015
Leave
discipline 0.002 -0.022 0.012 0.083
1
(37) -0.079
1
(38) 0.027 0.023 -0.020 0.025
Dissatisfaction -
0.0531
(39)
-0.0661
(40) -0.029 -0.060
1
(41) -0.011 0.024 -0.017 -0.039 -0.015
1. These 27 (15-41 out of 67 for Tables 8, 9, 10 & 11) (total 39%) nonredundant residuals have absolute values greater than 0.05.

11
Table 11 Reproduced Model Correlations and Residuals for Stress
Reproduced
Correlation
Headaches Treatment Leave Helplessness Depression Suited
to
work
Enjoy
work Change
area Leave
discipline Dissatisfaction
Headaches 0.716 0.607 0.197 -0.054 0.271 -
0.097
-
0.044
0.194 0.112 0.326
Treatment 0.607 0.627 0.306 0.163 0.441 0.077 0.136 0.296 0.248 0.411
Leave 0.197 0.306 0.242 0.202 0.307 0.239 0.275 0.288 0.289 0.294
Helplessness -0.054 0.163 0.202 0.483 0.431 0.145 0.158 0.065 0.117 0.146
Depression 0.271 0.441 0.307 0.431 0.539 0.153 0.189 0.203 0.219 0.309
Suited to work -0.097 0.077 0.239 0.145 0.153 0.521 0.557 0.461 0.486 0.321
Enjoy work -0.044 0.136 0.275 0.158 0.189 0.557 0.606 0.522 0.539 0.400
Change area 0.194 0.296 0.288 0.065 0.203 0.461 0.522 0.532 0.515 0.452
Leave discipline
0.112 0.248 0.289 0.117 0.219 0.486 0.539 0.515 0.514 0.417
Dissatisfaction 0.326 0.411 0.294 0.146 0.309 0.321 0.400 0.452 0.417 0.515 Residuals Headaches Treatment Leave Helplessness Depression Suited
to
work
Enjoy
work Change
area Leave
discipline Dissatisfaction
Headaches -0.1301
(42) -
0.0851
(43)
0.1181 (44)
-0.0751
(45) 0.102
1
(46) 0.084
1
(47) -
0.0651
(48)
0.005 -0.0871 (49)
Treatment -0.1301
(42) -
0.049
0.0771 (50)
-0.041 0.047 0.0661
(51) -
0.0801
(52)
-0.0651
(53) -0.032
Leave -0.0851
(43) -0.049 0.026 -0.030 -
0.0891
(54)
-
0.0921
(55)
-0.020 -0.0621
(56) -0.032
Helplessness 0.1181
(44) 0.077
1
(50) 0.026 -0.093
1
(57) -
0.0611
(58)
0.006 0.002 0.026 0.0591 (59)
Depression -0.0751
(45) -0.041 -
0.030
-0.0931 (57)
-
0.018
-
0.044
0.047 -0.011 0.014
Suited to work 0.1021
(46) 0.047 -
0.0891
(54)
-0.0611 (58)
-0.018 -
0.024
-
0.1541
(60)
-0.1581
(61) -0.080
1 (62)
Enjoy work 0.0841
(47)
0.0661
(55)
-
0.0921
(55)
0.006 -0.044 -
0.024
-
0.1521
(63)
-0.1291
(64)
-0.0631 (65)
Change area -0.0651
(48) -0.080
1
(52) -
0.020
0.002 0.047 -
0.1541
(60)
-
0.1521
(63)
-0.033 0.088
1 (66)
Leave
discipline 0.005 -0.065
1
(53)
-
0.0621
(56)
0.026 -0.011 -
0.1581
(61)
-
0.1291
(64)
-0.033 -0.0781 (67)
Dissatisfaction -0.0871
(49)
-0.032 -
0.032
0.0591 (59)
0.014 -
0.0801
(62)
-
0.0631
(65)
-
0.0881
(66)
-0.0781
(67)
1. These 26 (42-67 out of 67 for Tables 8, 9, 10 & 11) (total 39%) nonredundant residuals have absolute values greater than 0.05.

12
The structure matrix (Table 12) shows the relationship between the factors and is
produced from the pattern matrix that contains information about unique contributions
of variables to a factor (see Chapter 3, section 3.5.4. C. i.). Four variables load onto
two or three factors (sleeplessness over past week, job dissatisfaction, incidence of
stress and stress requiring treatment) (0.598, 0.454, 0.406 and 0.748).
Table 12 Relationships Between Factors Following Oblique Rotation for Stress
(Structure Matrix)
Stress Factor 1
Psychosocial
effects
Factor 2 Job
satisfaction
Factor 3
Work
environment
Factor 4
Physical
Ailments
Question or variable Unique
contribution
Unique
contribution
Unique
contribution
Unique
contribution
Sleeplessness over past decade 0.783
Depression over decade 0.776
Length of depression 0.711
Experiencing increased anxiety 0.665
Helplessness over past decade 0.660
Sleeplessness over past week 0.598 0.497
Enjoying the type of work 0.767
Leave professional discipline 0.714
Change area of practice 0.709
Suited to work 0.695
Job dissatisfaction 0.566 0.454 0.423
Mental health leave
Time management- workload 0.848
Rush to complete tasks 0.835
Finishing work late 0.690
Incidence of stress 0.443 0.681 0.406
Organisational support 0.515
Headaches requiring analgesia 0.841
Stress requiring treatment 0.455 0.748
Discrepancies between the pattern matrix for oblique (direct oblimin) rotation and the
orthogonal (varimax) rotation component matrix (see Chapter 4, section 2.3.1. A.
Tables 80 & 82) further reinforce interrelated factors and amalgamation of the four
factors into three (Pallant, 2005).
Burnout
Subscale- exhaustion
For the fourth subscale, exhaustion, inspection of a correlation matrix showed that all
significance values were less than .05 and there were no correlation coefficients

13
greater than 0.9; the determinant was .057. This means that multicollinearity was not a
problem (Table 13) (see Chapter 3, section 3.5.4. C. a.).
Table 13 Correlation Matrix for Observed Data for Factor Exhaustion
Apathy Low
morale Powerless Undervalued Overwhelmed Incompetence Fatigue Drained Loss of
empathy
colleagues
Loss of
empathy
clients Correlation
Apathy 1.000 0.461 0.375 0.298 0.333 0.267 0.225 0.291 0.202 0.223
Low morale 0.461 1.000 0.644 0.575 0.459 0.404 0.280 0.403 0.147 0.191 Powerless 0.375 0.644 1.000 0.620 0.424 0.372 0.327 0.403 0.196 0.231 Undervalued 0.298 0.575 0.620 1.000 0.436 0.278 0.280 0.411 0.161 0.124 Overwhelmed 0.333 0.459 0.424 0.436 1.000 0.403 0.213 0.430 0.094 0.161 Feeling incompetent
0.267 0.404 0.372 0.278 0.403 1.000 0.272 0.282 0.176 0.222
Fatigue 0.225 0.280 0.327 0.280 0.213 0.272 1.000 0.377 0.112 0.116 Emotionally
drained 0.291 0.403 0.403 0.411 0.430 0.282 0.377 1.000 0.135 0.180
Loss of empathy colleagues
0.202 0.147 0.196 0.161 0.094 0.176 0.112 0.135 1.000 0.450
Loss of empathy
clients 0.223 0.191 0.231 0.124 0.161 0.222 0.116 0.180 0.450 1.000
Sig. 1-tailed
Apathy .000 .000 .000 .000 .000 .000 .000 .000 .000
Low morale .000 .000 .000 .000 .000 .000 .000 .000 .000 Powerless .000 .000 .000 .000 .000 .000 .000 .000 .000 Undervalued .000 .000 .000 .000 .000 .000 .000 .000 .002 Overwhelmed .000 .000 .000 .000 .000 .000 .014 .000 Feeling
incompetent .000 .000 .000 .000 .000 .000 .000 .000 .000
Fatigue .000 .000 .000 .000 .010 .000 .000 .004 .003 Emotionally drained
.000 .000 .000 .000 .000 .000 .000 .001 .000
Loss of empathy
colleagues .000 .000 .000 .000 .014 .000 .004 .001 .000
Loss of empathy clients
.000 .000 .000 .002 .000 .000 .003 .000 .000
Determinant = .057

14
Bartlett’s test was highly significant, (p<0.001), meaning factor analysis was
appropriate for these data. Inspection of an anti-image correlation matrix showed the
values ranged between 0.678 (loss of empathy for colleagues) and 0.895 (apathy)
(Table 14) (see Chapter 3, section 3.5.4. C. d.). All off-diagonal variable correlations
should be very small (they are for these data) (Table 14).
Table 14 Correlation Matrix to Assess Suitability for Factor Analysis and Measure of
Sampling Adequacy for Exhaustion
Apathy Low
morale Powerless Undervalued Overwhelmed Incompetence Fatigue Drained Loss of
empathy
colleagues
Loss of
empathy
clients Apathy 0.895 -
0.252
-0.053 0.036 -0.108 -0.016 -
0.062
-0.050 -0.090 -0.076
Low morale -
0.252
0.857
-0.337 -0.235 -0.101 -0.152 0.006 -0.064 0.043 -0.008
Powerless -
0.053
-
0.337 0.857 -0.350 -.046 -0.083 -
0.105
-0.048 -0.033 -0.087
Undervalued 0.036 -
0.235
-0.350 0.851 -0.157 0.058 -
0.045
-0.125 -0.077 0.081
Overwhelmed -
0.108
-
0.101
-0.046 -0.157 0.876 -0.229 0.052 -0.225 0.061 -0.027
Feeling
incompetent -
0.016
-
0.152
-0.083 0.058 -0.229 0.881 -
0.133
-0.010 -0.060 -0.085
Fatigue -
0.062
0.006 -0.105 -.045 0.052 -0.133 0.859 -0.247 -0.015 0.012
Emotionally
drained -
0.050
-
0.064
-0.048 -0.125 -0.225 -0.010 -
0.247 0.881 -0.006 -0.059
Loss of
empathy
colleagues
-
0.090
0.043 -0.033 -.077 0.061 -0.060 -
0.015
-0.006 0.678 -0.407
Loss of
empathy
clients
-
0.076
-
0.008
-0.087 .081 -0.027 -0.085 0.012 -0.059 -0.407 0.708
Table 15 displays the communalities extracted by principal component analysis (see
Chapter 3, section 3.5.4. C. f.). For the variable, loss of empathy for colleagues, 70.8
per cent of variance is shared or common variance for exhaustion.
Table 15 Communalities for Exhaustion
Exhaustion Factor
Question or variable Extraction
Feeling fatigued 0.263
Feeling of incompetence 0.356
Apathy 0.364
Feeling emotionally drained 0.440
Feeling overwhelmed 0.485
Feeling undervalued 0.578
Powerless 0.635
Low morale 0.651
Loss of empathy for clients 0.707
Loss of empathy for colleagues 0.708
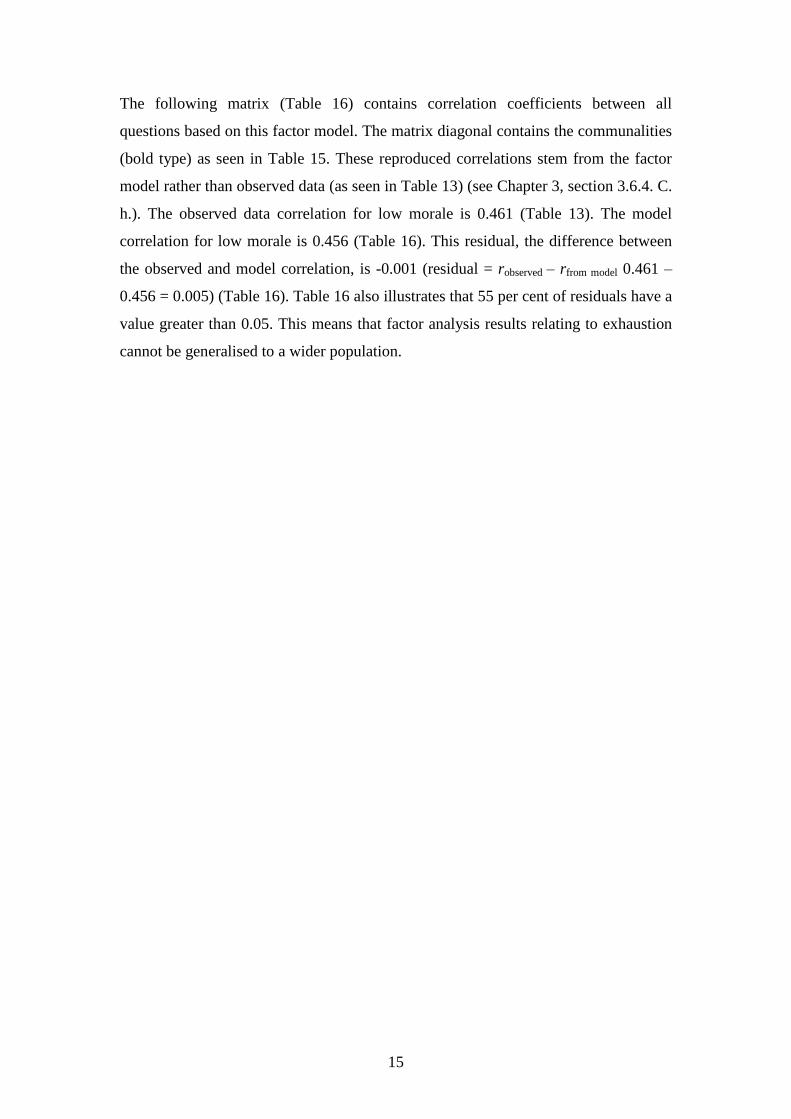
15
The following matrix (Table 16) contains correlation coefficients between all
questions based on this factor model. The matrix diagonal contains the communalities
(bold type) as seen in Table 15. These reproduced correlations stem from the factor
model rather than observed data (as seen in Table 13) (see Chapter 3, section 3.6.4. C.
h.). The observed data correlation for low morale is 0.461 (Table 13). The model
correlation for low morale is 0.456 (Table 16). This residual, the difference between
the observed and model correlation, is -0.001 (residual = robserved – rfrom model 0.461 –
0.456 = 0.005) (Table 16). Table 16 also illustrates that 55 per cent of residuals have a
value greater than 0.05. This means that factor analysis results relating to exhaustion
cannot be generalised to a wider population.

16
Table 16 Reproduced Model Correlations and Residuals for Exhaustion
Reproduced
Correlation Apathy Low
morale Powerless Undervalued Overwhelmed Incompetence Fatigue Drained Loss of
empathy
colleagues
Loss of
empathy
clients Apathy 0.364 0.462 0.460 0.412 0.383 0.359 0.292 0.375 0.276 0.301 Low morale 0.456 0.651 0.642 0.611 0.561 0.461 0.414 0.535 0.148 0.187 Powerless 0.460 0.642 0.635 0.598 0.550 0.463 0.408 0.527 0.187 0.225 Undervalued 0.412 0.611 0.598 0.578 0.529 0.420 0.387 0.502 0.078 0.116 Overwhelmed 0.383 0.561 0.550 0.529 0.485 0.389 0.356 0.461 0.090 0.125 Feeling
incompetent 0.359 0.461 0.463 0.420 0.389 0.356 0.294 0.379 0.245 0.271
Fatigue 0.292 0.414 0.408 0.387 0.356 0.294 0.363 0.340 0.101 0.126 Emotionally
drained 0.375 0.535 0.527 0.502 0.461 0.379 0.340 0.440 0.122 0.154
Loss of
empathy
colleagues
0.276 0.148 0.187 0.078 0.090 0.245 0.101 0.122 0.708 0.706
Loss of
empathy
clients
0.301 0.187 0.225 0.116 0.125 0.271 0.126 0.154 0.706 0.707
Residual Apathy Low
morale Powerless Undervalued Overwhelmed Incompetence Fatigue Drained Loss of
empathy
colleagues
Loss of
empathy
clients Apathy 0.005 -0.085
1
(1)
-0.1141 (2)
-0.0511 (3)
-0.0921 (4)
-
0.0661
(5)
-
0.0841
(6)
-0.0741
(7) -0.077
1
(8)
Low morale 0.005 0.002 -0.036 -0.1021 (9)
-0.0571 (9)
-
0.1341
(11)
-
0.1321
(12)
0.000 0.004
Powerless -
0.0851
(1)
0.002 0.022 -0.1261 (22)
-0.0911 (14)
-
0.0811
(15)
-
0.1241
(16)
0.009
0.005
Undervalued -
0.1141
(2)
-
0.036
0.022
-0.0931 (17)
-0.1421 (18)
-
0.1071
(19)
-
0.0911
(120
0.0831
(21) 0.008
Overwhelmed -
0.0511
(3)
-
0.1021
(9)
-0.1261
(13) -0.093
1 (17) 0.014 -
0.1421
(18)
-0.031
0.004
0.036
Feeling
incompetent -
0.0921
(4)
-
0.0571
(10)
-0.0911
(14) -0.142
1 (18) 0.014
-
0.022
-
0.0971
(23)
-0.0691
(24) -0.049
Fatigue -
0.0661
(5)
-
0.1341
(11)
-0.0811
(15) -0.107
1 (19) -0.142
1 (18) -0.022
0.037 0.011 -0.010
Emotionally
drained -
0.0841
(6)
-
0.1321
(12)
-0.1241
(16) -0.091
1 (20) -0.031 -0.097
1 (23) 0.037 0.013 0.026
Loss of
empathy
colleagues
-
0.0741
(7)
0.000 0.009 0.0831 (21)
0.004 -0.0691 (24)
0.011 0.013
-0.2561
(25)
Loss of
empathy
clients
-
0.0771
(8)
0.004 0.005 0.008 0.036 -0.049 -
0.010
0.026 -0.2561
(25)
1. These 25 nonredundant residuals have absolute values greater than 0.05.

17
The structure matrix (Table 17) shows the relationship between the factors.
Table 17 Relationships Between Factors Following Oblique Rotation for
Exhaustion (Structure Matrix)
Exhaustion Factor 1 Related to Individual Factor 2 Related to Others
Question or variable Relationships Relationships
Low morale 0.806
Powerless 0.796
Feeling undervalued 0.753
Feeling overwhelmed 0.693
Feeling emotionally drained 0.663
Feelings of incompetence 0.578
Apathy 0.573
Feeling fatigued 0.513
Loss of empathy for colleagues 0.841
Loss of empathy for clients 0.840
Discrepancies between the pattern matrix for oblique (direct oblimin) rotation and the
orthogonal (varimax) rotation component matrix (see Chapter 4, section 2.3.1. B.
Tables 85 & 87) further reinforce interrelated factors and amalgamation of the two
factors into one (Pallant, 2005).

18
Individual responses
Subscale- pressure and motivation
For the fifth subscale, pressure and motivation, inspection of a correlation matrix
showed that none of the significance values were over .05 and all of the correlation
coefficients were less than 0.9; the determinant value was 0.163. This means that
there was no multicollinearity in the data (Table 18) (see Chapter 3, section 3.5.4. C.
a.).
Table 18 Correlation Matrix for Observed Data for Factor Pressure and Motivation
Achieving
more
Unreasonable
expectations
Irritability Pushed for
time
Difficulty slowing
down
Working at high
performance
Keyed
up
Mtask
Correlation
Achieving more in less
time
1.000 0.615 0.315 0.496 0.216 0.297 0.272 0.268
Unreasonable expectations 0.615 1.000 0.361 0.443 0.245 0.255 0.293 0.250 Irritability 0.315 0.361 1.000 0.387 0.320 0.136 0.261 0.182 Pushed for time 0.496 0.443 0.387 1.000 0.311 0.238 0.346 0.329 Difficulty slowing down 0.216 0.245 0.320 0.311 1.000 0.155 0.309 0.190 Working at high performance
0.297 0.255 0.136 0.238 0.155 1.000 0.246 0.291
Keyed up 0.272 0.293 0.261 0.346 0.309 0.246 1.000 0.439 Multi-tasking 0.268 0.250 0.182 0.329 0.190 0.291 0.439 1.000 Sig. (1-tailed) Achieving
more in less time .000 .000 .000 .000 .000 .000 .000
Unreasonable expectations .000 .000 .000 .000 .000 .000 .000 Irritability .000 .000 .000 .000 .001 .000 .000 Pushed for time .000 .000 .000 .000 .000 .000 .000 Difficulty slowing down .000 .000 .000 .000 .003 .000 .000 Working at high performance
.000 .000 .001 .000 .003 .000 .000
Keyed up .000 .000 .000 .000 .000 .000 .000 Multi-tasking .000 .000 .000 .000 .000 .000 .000
Determinant = 0.163
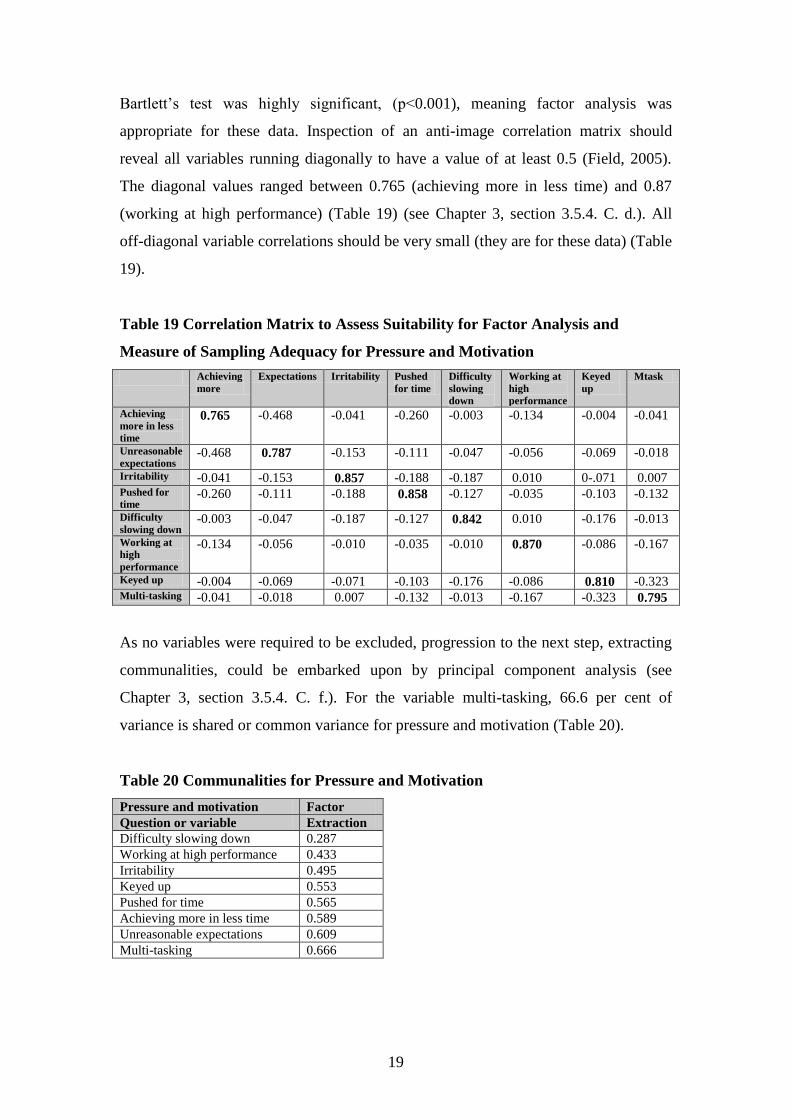
19
Bartlett’s test was highly significant, (p<0.001), meaning factor analysis was
appropriate for these data. Inspection of an anti-image correlation matrix should
reveal all variables running diagonally to have a value of at least 0.5 (Field, 2005).
The diagonal values ranged between 0.765 (achieving more in less time) and 0.87
(working at high performance) (Table 19) (see Chapter 3, section 3.5.4. C. d.). All
off-diagonal variable correlations should be very small (they are for these data) (Table
19).
Table 19 Correlation Matrix to Assess Suitability for Factor Analysis and
Measure of Sampling Adequacy for Pressure and Motivation
Achieving
more
Expectations Irritability Pushed
for time
Difficulty
slowing
down
Working at
high
performance
Keyed
up
Mtask
Achieving
more in less
time
0.765 -0.468 -0.041 -0.260 -0.003 -0.134 -0.004 -0.041
Unreasonable
expectations -0.468 0.787 -0.153 -0.111 -0.047 -0.056 -0.069 -0.018
Irritability -0.041 -0.153 0.857 -0.188 -0.187 0.010 0-.071 0.007 Pushed for
time -0.260 -0.111 -0.188 0.858 -0.127 -0.035 -0.103 -0.132
Difficulty
slowing down -0.003 -0.047 -0.187 -0.127 0.842 0.010 -0.176 -0.013
Working at
high
performance
-0.134 -0.056 -0.010 -0.035 -0.010 0.870 -0.086 -0.167
Keyed up -0.004 -0.069 -0.071 -0.103 -0.176 -0.086 0.810 -0.323 Multi-tasking -0.041 -0.018 0.007 -0.132 -0.013 -0.167 -0.323 0.795
As no variables were required to be excluded, progression to the next step, extracting
communalities, could be embarked upon by principal component analysis (see
Chapter 3, section 3.5.4. C. f.). For the variable multi-tasking, 66.6 per cent of
variance is shared or common variance for pressure and motivation (Table 20).
Table 20 Communalities for Pressure and Motivation
Pressure and motivation Factor
Question or variable Extraction
Difficulty slowing down 0.287
Working at high performance 0.433
Irritability 0.495
Keyed up 0.553
Pushed for time 0.565
Achieving more in less time 0.589
Unreasonable expectations 0.609
Multi-tasking 0.666

20
The following matrix (Table 21) contains correlation coefficients between all
questions based on this factor model. The matrix diagonal contains the communalities
(bold type) as seen in Table 20. These reproduced correlations stem from the factor
model rather than observed data (as seen in Table 18) (see Chapter 3, section 3.5.4. C.
h.). The observed data correlation for irritability is 0.315 (Table 18). The model
correlation for irritability is 0.522 (Table 21). This residual, the difference between
the observed and model correlation, is -0.207 (residual = robserved – rfrom model 0.315 –
0.522 = -0.207 (Table 21). Table 21 also illustrates that 57 per cent of residuals have a
value greater than 0.05. This means that factor analysis results relating to pressure and
motivation cannot be generalised to a wider population.

21
Table 21
Reproduced Model Correlations and Residuals for Pressure and Motivation
Reproduced
Correlation
Achieving
more
Expectations Irritability Pushed
for time
Difficulty
slowing
down
Working at
high
performance
Keyed
up
Mtask
Achieving
more in less
time
0.589 0.597 0.522 0.573 0.411 0.242 0.358 0.279
Unreasonable
expectations 0.597 0.609 0.539 0.577 0.416 0.216 0.334 0.245
Irritability 0.522 0.539 0.495 0.493 0.361 0.111 0.213 0.115 Pushed for
time 0.573 0.577 0.493 0.565 0.401 0.285 0.398 0.334
Difficulty
slowing down 0.411 0.416 0.361 0.401 0.287 0.179 0.260 0.207
Working at
high
performance
0.242 0.216 0.111 0.285 0.179 0.433 0.482 0.536
Keyed up 0.358 0.334 0.213 0.398 0.260 0.482 0.553 0.593 Multi-tasking 0.279 0.245 0.115 0.334 0.207 0.536 0.593 0.666 Residual Achieving
more
Expectations Irritability Pushed
for time
Difficulty
slowing
down
Working at
high
performance
Keyed
up
Mtask
Achieving
more in less
time
0.017 -0.2071
(1)
-0.0771
(2) -0.194
1
(3) 0.055
1 (4) -
0.0861
(5)
-0.011
Unreasonable
expectations 0.017 -0.178
1
(6) -0.134
1
(7) -0.171
1
(8) 0.039 -0.041 0.005
Irritability -0.2071
(1) -0.178
1 (6) -0.105
1
(9) -0.042 0.026 0.048 0.067
1
(10)
Pushed for
time -0.077
1
(2) -0.134
1 (7) -0.105
1
(9) -0.091
1
(11) -0.048 -
0.0521
(12)
-0.005
Difficulty
slowing down -0.194
1
(3) -0.171
1 (8) -0.042 -0.091
1
(11) -0.064
1 (13) 0.049 -0.017
Working at
high
performance
0.0551 (4)
0.039 0.026 -0.048 -0.0641
(13) -
0.2351
(14)
-
0.2451
(15)
Keyed up 0-.0861
(5) -0.041 0.048 -0.052
1
(12) 0.049 -0.235
1 (14) -
0.1541
(16)
Multi-tasking -0.011 0.005 0.0671
(10) -0.005 -0.017 -0.245
1 (15) -
0.1541
(16)
1. These 16 nonredundant residuals have absolute values greater than 0.05.

22
The structure matrix (Table 22) shows the relationship between the factors and is
produced from the pattern matrix that contains information about unique contributions
of variables to a factor (see Chapter 3, section 3.5.4. C. i.). Two variables load onto
two factors (pushed for time and keyed up) (0.739 and 0.734).
Table 22 Relationships Between Factors Following Oblique Rotation for
Pressure and Motivation (Structure Matrix)
Pressure and motivation Factor 1Pressure Factor 2 Motivation
Question or variable Relationships Relationships
Unreasonable expectations 0.780
Achieving more in less time 0.765
Pushed for time 0.739 0.442
Irritability 0.691
Difficulty slowing down 0.533
Multi-tasking 0.815
Keyed up 0.426 0.734
Working at high performance 0.658
As oblique (direct oblimin) rotation for the subscale pressure and motivation, resulted
in correlations above 0.3 (0.431) (see Chapter 4, section 2.3.1. C. Table 91), this
shows that the factors are interrelated and this was the most accurate rotation to use.

1
Appendix 14 Kruskal-Wallis calculations
The following Kruskal-Wallis statistics satisfy all data requirements for Kruskal-
Wallis calculations (Chapter 4, section 2.4.). When establishing the significance of the
finding in large samples, the Monte Carlo method is more accurate if this result is
different from the asymptotic value. It creates a distribution similar to the one found
in this sample and then takes several samples from this distribution. The mean
significance and confidence interval can then be created (Field, 2005).
1. Statistically significant findings
1.1. Demographics
1.1.1. Age
Age was significantly different among all predominant areas of practice (H(13) =
34.986, p<0.0001) (Table 1).
Table 1 Test Statistics for Age
Predominant Area of Work Age
Chi-square 34.986
df 13
Asymp. Sig. 0.001
Monte Carlo 0.000
99% Confidence Interval Lower Bound 0.000
Upper Bound 0.001
Nurses working in aged care and accident and emergency were the oldest groups, with
the youngest working in oncology (Table 2).
Table 2 Age Ranks Among Predominant Area of Work
Predominant Area of Work Number Mean Rank Age
Aged care 3 432.33
Accident & Emergency 19 320.47
Management 14 310.50
Community 111 305.49
Midwife 243 261.33
Education 14 249.46
Medical 12 241.75
Neonatal Care 54 239.93
Operating Theatre 9 224.17
Other area 18 217.14
Recovery 2 206.75
Surgical 11 204.55
Critical Care 16 159.88
Oncology 2 7.50
Total 528

2
1.1.2. Hours worked
Hours worked were highly significantly different among all predominant areas of
practice (H(13) = 35.159, p<0.0001) (Table 3).
Table 3 Test Statistics for Hours Worked
Predominant Area of Work Hours Worked
Chi-square 35.159
df 13
Asymp. Sig. 0.001
Monte Carlo 0.000
99% Confidence Interval Lower Bound 0.000
Upper Bound 0.000
Nurses and midwives working in management and oncology worked the longest hours
whereas nurses working in the operating theatre worked the least amount of hours
(Table 4).
Table 4 Hours Worked Ranks Among Predominant Area of Work
Predominant Area of Work Number Mean Rank Hours Worked
Management 14 427.75
Oncology 2 391.00
Other area 18 347.44
Medical 12 343.42
Recovery 2 331.50
Education 14 325.64
Surgical 11 290.77
Critical Care 16 271.47
Midwife 247 264.61
Accident & Emergency 20 257.78
Community 110 243.14
Aged Care 3 234.17
Neonatal Care 55 226.52
Operating Theatre 9 220.28
Total 533

3
1.1.3. Years in profession
Years in the profession were significantly different among all predominant areas of
practice (H(13) = 23.954, p<0.05) (Table 5).
Table 5 Test Statistics for Years in Profession
Predominant Area of Work Years in Profession
Chi-square 23.954
df 13
Asymp. Sig. 0.032
Monte Carlo 0.026
99% Confidence Interval Lower Bound 0.022
Upper Bound 0.030
Nurses and midwives working in accident and emergency and management have
spent the most number of years in the profession, with nurses working in oncology
having spent the least number of years in the profession (Table 6).
Table 6 Years in Profession Ranks Among Predominant Area of Work
Predominant Area of Work Number Mean Rank Years in Profession
Accident & Emergency 20 348.03
Management 14 341.79
Community 111 289.69
Education 13 277.46
Aged Care 3 271.50
Operating Theatre 9 260.94
Midwife 245 258.87
Neonatal Care 54 257.76
Recovery 2 253.00
Medical 13 249.73
Other area 18 220.53
Surgical 11 220.05
Critical Care 16 193.56
Oncology 2 23.50
Total 531

4
1.2. Stress
1.2.1. Incidence of stress
Incidence of stress at work was significantly different among all predominant areas of
practice (H(13) = 22.566, p<0.05) (Table 7).
Table 7 Test Statistics for Incidence of Stress
Predominant Area of Work Incidence of Stress
Chi-square 22.566
df 13
Asymp. Sig. 0.047
Monte Carlo 0.042
99% Confidence Interval Lower Bound 0.037
Upper Bound 0.047
Operating theatre and surgical areas had the highest scores, with recovery area
reporting the lowest (Table 8).
Table 8 Incidence of Stress Among Predominant Area of Work
Predominant Area of Work Number Mean Rank Incidence of Stress
Operating Theatre 9 355.28
Surgical 11 343.32
Accident & Emergency 20 326.10
Oncology 2 309.00
Critical Care 16 307.00
Aged Care 3 298.83
Midwife 247 273.21
Medical 12 269.08
Management 13 258.42
Other area 17 257.74
Community 110 232.15
Education 14 252.93
Neonatal Care 54 238.02
Recovery 2 204.50
Total 530

5
1.2.2. Anxiety
Experiencing anxiety as a psychosocial effect was significantly different among all
predominant areas of practice (H(13) = 22.036, p<0.05) (Table 9).
Table 9 Test Statistics for Anxiety
Predominant Area of Work Anxiety
Chi-square 22.036
df 13
Asymp. Sig. 0.055
Monte Carlo 0.047
99% Confidence Interval Lower Bound 0.041
Upper Bound 0.052
Aged care areas and accident and emergency reported experiencing most anxiety,
with critical care area reporting the least anxiety (Table 10).
Table 10 Anxiety Among Predominant Area of Work
Predominant Area of Work Number Mean Rank Anxiety
Aged Care 3 351.67
Accident & Emergency 20 314.23
Surgical 11 312.64
Management 14 302.86
Education 14 289.82
Midwife 246 282.23
Community 110 252.65
Medical 12 247.13
Neonatal Care 55 237.93
Other area 18 233.53
Recovery 2 212.25
Oncology 2 203.00
Operating Theatre 9 178.61
Critical Care 16 174.31
Total 532

6
1.3. Burnout
1.3.1. Feelings of powerlessness
Feelings of powerlessness as an effect of prolonged exposure to stress were
significantly different among all predominant areas of practice (H(13) = 23.129,
p<0.05) (Table 11).
Table11 Test Statistics for Powerlessness
Predominant Area of Work Powerlessness
Chi-square 23.129
df 13
Asymp. Sig. 0.040
Monte Carlo 0.034
99% Confidence Interval Lower Bound 0.029
Upper Bound 0.038
Accident and emergency and oncology areas had the highest scores, with recovery
area reporting the lowest (Table 12).
Table 12 Powerlessness Among Predominant Area of Work
Predominant Area of Work Number Mean Rank Powerlessness
Accident & Emergency 20 377.80
Oncology 2 348.50
Aged Care 3 340.67
Critical Care 16 301.94
Medical 12 293.88
Other area 18 292.53
Operating Theatre 9 273.06
Midwife 247 270.28
Surgical 11 267.05
Neonatal Care 55 250.96
Management 14 244.68
Community 111 244.00
Education 14 220.61
Recovery 2 196.00
Total 534
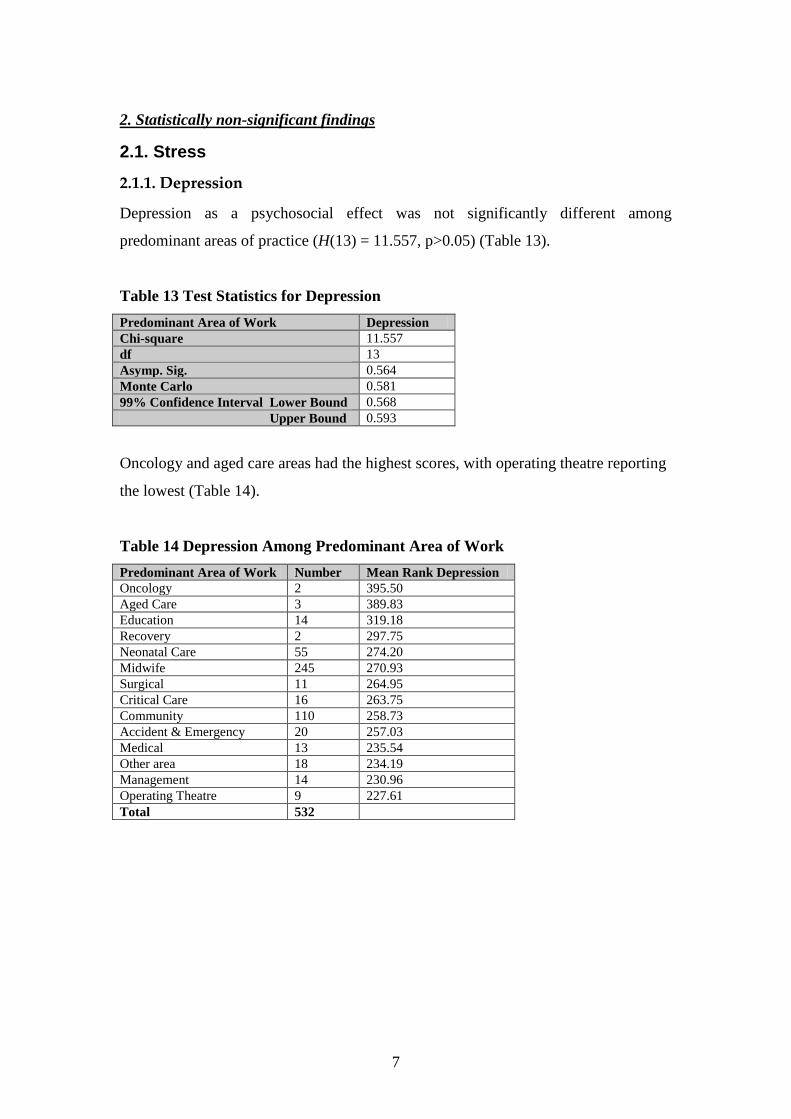
7
2. Statistically non-significant findings
2.1. Stress
2.1.1. Depression
Depression as a psychosocial effect was not significantly different among
predominant areas of practice (H(13) = 11.557, p>0.05) (Table 13).
Table 13 Test Statistics for Depression
Predominant Area of Work Depression
Chi-square 11.557
df 13
Asymp. Sig. 0.564
Monte Carlo 0.581
99% Confidence Interval Lower Bound 0.568
Upper Bound 0.593
Oncology and aged care areas had the highest scores, with operating theatre reporting
the lowest (Table 14).
Table 14 Depression Among Predominant Area of Work
Predominant Area of Work Number Mean Rank Depression
Oncology 2 395.50
Aged Care 3 389.83
Education 14 319.18
Recovery 2 297.75
Neonatal Care 55 274.20
Midwife 245 270.93
Surgical 11 264.95
Critical Care 16 263.75
Community 110 258.73
Accident & Emergency 20 257.03
Medical 13 235.54
Other area 18 234.19
Management 14 230.96
Operating Theatre 9 227.61
Total 532
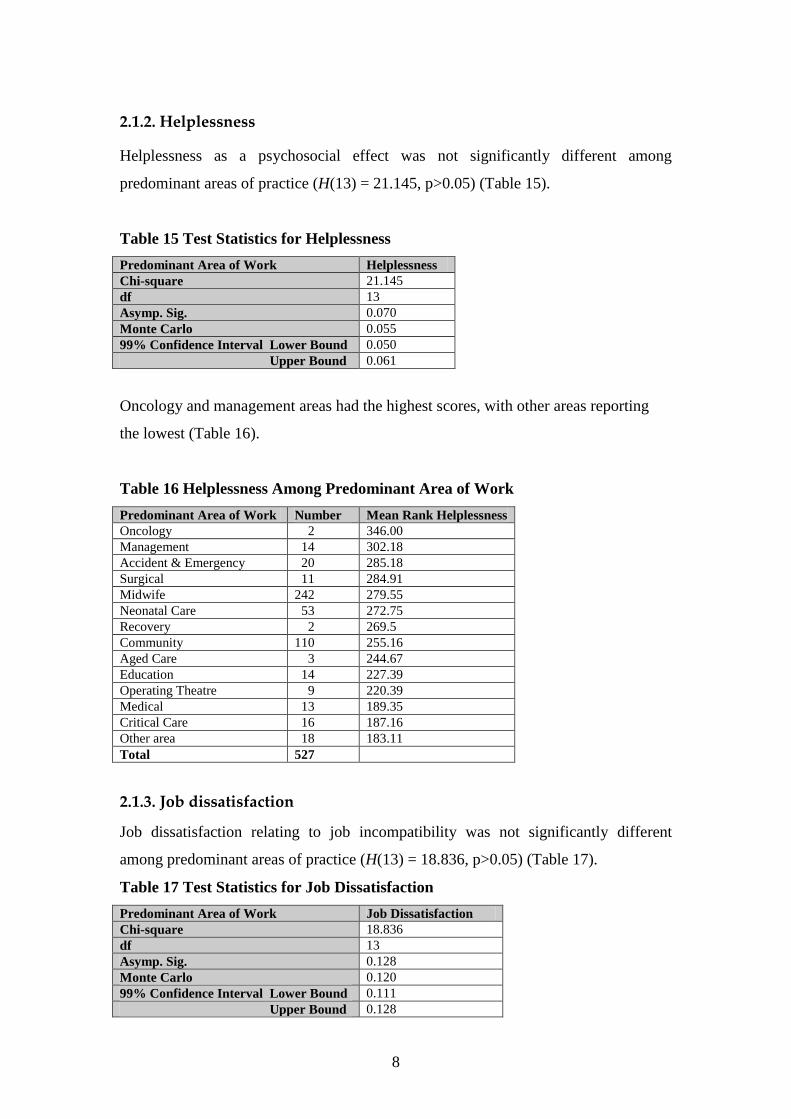
8
2.1.2. Helplessness
Helplessness as a psychosocial effect was not significantly different among
predominant areas of practice (H(13) = 21.145, p>0.05) (Table 15).
Table 15 Test Statistics for Helplessness
Predominant Area of Work Helplessness
Chi-square 21.145
df 13
Asymp. Sig. 0.070
Monte Carlo 0.055
99% Confidence Interval Lower Bound 0.050
Upper Bound 0.061
Oncology and management areas had the highest scores, with other areas reporting
the lowest (Table 16).
Table 16 Helplessness Among Predominant Area of Work
Predominant Area of Work Number Mean Rank Helplessness
Oncology 2 346.00
Management 14 302.18
Accident & Emergency 20 285.18
Surgical 11 284.91
Midwife 242 279.55
Neonatal Care 53 272.75
Recovery 2 269.5
Community 110 255.16
Aged Care 3 244.67
Education 14 227.39
Operating Theatre 9 220.39
Medical 13 189.35
Critical Care 16 187.16
Other area 18 183.11
Total 527
2.1.3. Job dissatisfaction
Job dissatisfaction relating to job incompatibility was not significantly different
among predominant areas of practice (H(13) = 18.836, p>0.05) (Table 17).
Table 17 Test Statistics for Job Dissatisfaction
Predominant Area of Work Job Dissatisfaction
Chi-square 18.836
df 13
Asymp. Sig. 0.128
Monte Carlo 0.120
99% Confidence Interval Lower Bound 0.111
Upper Bound 0.128

9
Accident and emergency and aged care areas had the highest scores, with other areas
reporting the lowest (Table 18).
Table 18 Job Dissatisfaction Among Predominant Area of Work
Predominant Area of Work Number Mean Rank Job Dissatisfaction
Accident & Emergency 20 358.25
Aged Care 3 334.50
Oncology 2 326.00
Operating Theatre 9 283.11
Midwife 244 279.89
Surgical 11 272.36
Education 14 260.96
Medical 13 257.54
Community 109 247.37
Recovery 2 239.25
Neonatal Care 55 236.14
Critical Care 16 232.31
Management 14 220.64
Other area 18 212.33
Total 530
2.2. Burnout
2.2.1. Apathy
Apathy as an effect of prolonged exposure to stress was not significantly different
among predominant areas of practice (H(13) = 8.446, p>0.05) (Table 19).
Table 19 Test Statistics for Apathy
Predominant Area of Work Apathy
Chi-square 8.446
df 13
Asymp. Sig. 0.813
Monte Carlo 0.823
99% Confidence Interval Lower Bound 0.813
Upper Bound 0.832

10
Oncology and aged care areas had the highest scores, with other areas reporting the
lowest (Table 20).
Table 20 Apathy Among Predominant Area of Work
Predominant Area of Work Number Mean Rank Apathy
Oncology 1 459.50
Aged Care 3 341.17
Education 14 308.79
Surgical 10 302.30
Operating Theatre 9 289.06
Accident & Emergency 20 283.95
Medical 13 276.04
Critical Care 16 269.28
Neonatal Care 55 268.61
Recovery 2 263.00
Community 110 261.70
Midwife 243 259.76
Management 14 235.71
Other area 18 230.11
Total 528
2.2.2. Low morale
Low morale as an effect of prolonged exposure to stress was not significantly
different among predominant areas of practice (H(13) = 20.958, p>0.05) (Table 21).
Table 21 Test Statistics for Low Morale
Predominant Area of Work Low Morale
Chi-square 20.958
df 13
Asymp. Sig. 0.074
Monte Carlo 0.065
99% Confidence Interval Lower Bound 0.058
Upper Bound 0.071

11
Oncology and aged care areas had the highest scores, with recovery reporting the
lowest (Table 22).
Table 22 Low Morale Among Predominant Area of Work
Predominant Area of Work Number Mean Rank Low Morale
Oncology 2 519.00
Aged Care 3 352.00
Accident & Emergency 20 325.80
Medical 12 289.38
Operating Theatre 9 279.50
Midwife 247 272.16
Surgical 11 269.59
Neonatal Care 55 269.10
Community 110 258.91
Management 14 231.00
Other area 18 227.08
Education 14 225.11
Critical Care 16 221.16
Recovery 2 116.25
Total 533
2.2.3. Fatigue
Fatigue as an effect of prolonged exposure to stress was not significantly different
among predominant areas of practice (H(13) = 10.981, p>0.05) (Table 23).
Table 23 Test Statistics for Fatigue
Predominant Area of Work Fatigue
Chi-square 10.981
df 13
Asymp. Sig. 0.612
Monte Carlo 0.635
99% Confidence Interval Lower Bound 0.622
Upper Bound 0.647

12
Aged care areas and oncology had the highest scores, with recovery reporting the
lowest (Table 24).
Table 24 Fatigue Among Predominant Area of Work
Predominant Area of Work Number Mean Rank Fatigue
Aged Care 3 398.33
Oncology 2 369.75
Accident & Emergency 20 312.63
Surgical 11 306.55
Operating Theatre 9 297.06
Education 14 294.21
Medical 12 285.29
Midwife 247 269.88
Neonatal Care 55 265.05
Critical Care 16 259.19
Other area 14 258.64
Community 110 244.16
Management 14 229.71
Recovery 2 211.00
Total 533
2.2.4. Feeling emotionally drained
Feeling emotionally drained as an effect of prolonged exposure to stress was not
significantly different among predominant areas of practice (H(13) = 13.381, p>0.05)
(Table 25).
Table 25 Test Statistics for Feeling Emotionally Drained
Predominant Area of Work Feeling Emotionally Drained
Chi-square 13.381
df 13
Asymp. Sig. 0.419
Monte Carlo 0.427
99% Confidence Interval Lower Bound 0.414
Upper Bound 0.440
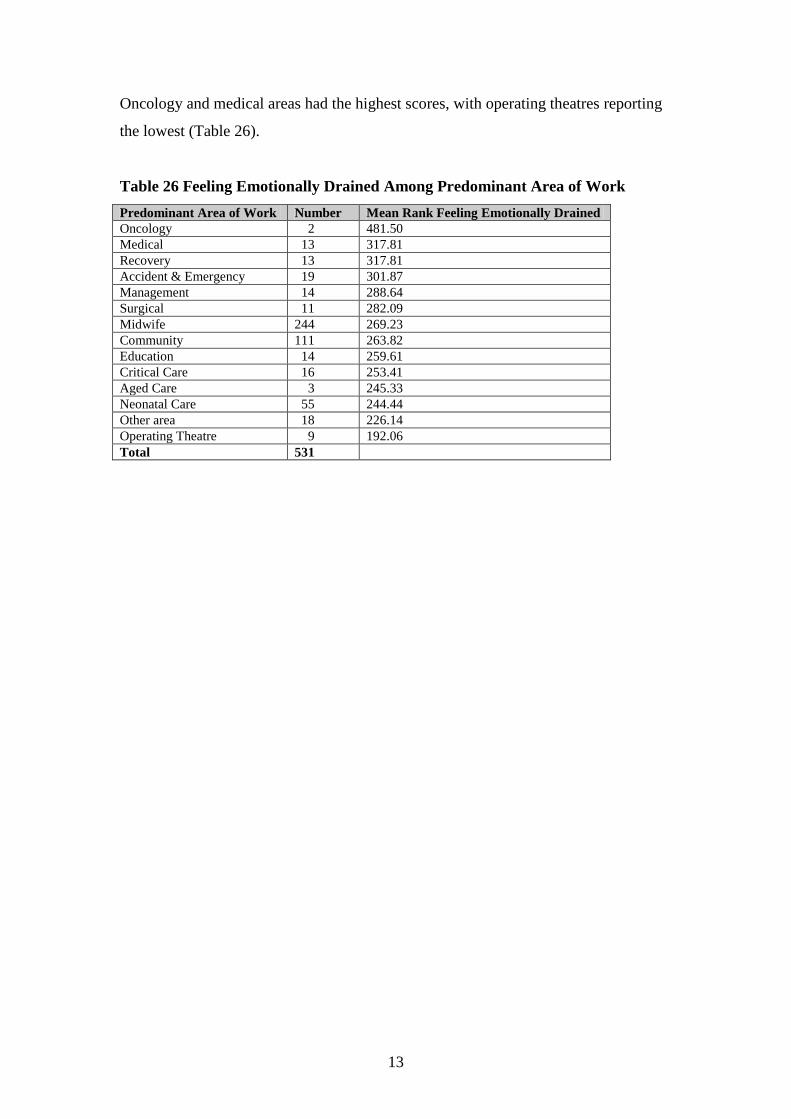
13
Oncology and medical areas had the highest scores, with operating theatres reporting
the lowest (Table 26).
Table 26 Feeling Emotionally Drained Among Predominant Area of Work
Predominant Area of Work Number Mean Rank Feeling Emotionally Drained
Oncology 2 481.50
Medical 13 317.81
Recovery 13 317.81
Accident & Emergency 19 301.87
Management 14 288.64
Surgical 11 282.09
Midwife 244 269.23
Community 111 263.82
Education 14 259.61
Critical Care 16 253.41
Aged Care 3 245.33
Neonatal Care 55 244.44
Other area 18 226.14
Operating Theatre 9 192.06
Total 531
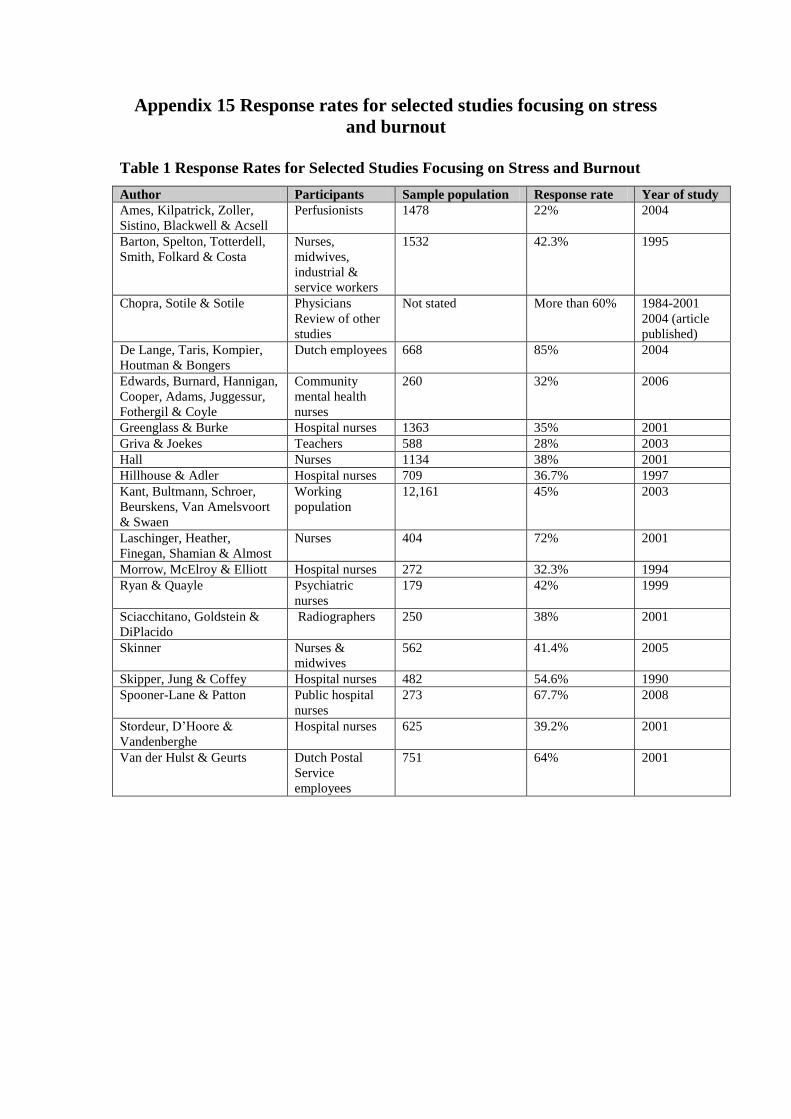
Appendix 15 Response rates for selected studies focusing on stress
and burnout
Table 1 Response Rates for Selected Studies Focusing on Stress and Burnout
Author Participants Sample population Response rate Year of study
Ames, Kilpatrick, Zoller,
Sistino, Blackwell & Acsell
Perfusionists 1478 22% 2004
Barton, Spelton, Totterdell,
Smith, Folkard & Costa
Nurses,
midwives,
industrial &
service workers
1532 42.3% 1995
Chopra, Sotile & Sotile Physicians
Review of other
studies
Not stated More than 60% 1984-2001
2004 (article
published)
De Lange, Taris, Kompier,
Houtman & Bongers
Dutch employees 668 85% 2004
Edwards, Burnard, Hannigan,
Cooper, Adams, Juggessur,
Fothergil & Coyle
Community
mental health
nurses
260 32% 2006
Greenglass & Burke Hospital nurses 1363 35% 2001
Griva & Joekes Teachers 588 28% 2003
Hall Nurses 1134 38% 2001
Hillhouse & Adler Hospital nurses 709 36.7% 1997
Kant, Bultmann, Schroer,
Beurskens, Van Amelsvoort
& Swaen
Working
population
12,161 45% 2003
Laschinger, Heather,
Finegan, Shamian & Almost
Nurses 404 72% 2001
Morrow, McElroy & Elliott Hospital nurses 272 32.3% 1994
Ryan & Quayle Psychiatric
nurses
179 42% 1999
Sciacchitano, Goldstein &
DiPlacido
Radiographers 250 38% 2001
Skinner Nurses &
midwives
562 41.4% 2005
Skipper, Jung & Coffey Hospital nurses 482 54.6% 1990
Spooner-Lane & Patton Public hospital
nurses
273 67.7% 2008
Stordeur, D’Hoore &
Vandenberghe
Hospital nurses 625 39.2% 2001
Van der Hulst & Geurts Dutch Postal
Service
employees
751 64% 2001

1
Appendix 16 Age and hours per week comparison with study sample,
NSW and National statistics
The 35-39 and 55-59 year age groups showed similar percentages for both NSW
(11.3% and 9.5%, respectively) and this study sample (11.2% and 9.2%, respectively)
(see Figure 1). The remaining age groups were similar which suggests the study
sample closely mirrors the NSW sample.
Figure 1 Age Comparison Between Study and NSW Samples
Age between study & NSW samples
0
5
10
15
20
25
30
Under
25
25-29 30-34 35-39 40-44 45-49 50-54 55-59 60-64 65-69
Perc
en
tag
es o
f n
urs
es/m
idw
ives
Study
NSW

2
The 35-44 and 55+ age categories were similar percentages for NSW (28.8% and
15.3%, respectively), national (33.5% and 11.8%, respectively) and this study sample
(31.7% and 12.3%, respectively) (see Figure 2). The percentage of 45-54 age category
was higher in the study sample (44%) than the other two samples (34.7% for NSW
and 30% for national). The percentage of under 25 and 25-34 age categories were
lower in the study sample (1.1% and 10.8%, respectively compared to NSW, 2.3%
and 18.5%, respectively and national, 3.7% and 21%, respectively).
Figure 2 Age Among Study, NSW and National Samples
Age among all samples
0
5
10
15
20
25
30
35
40
45
50
Under 25 25-34 35-44 45-54 55+
Perc
en
tag
es o
f n
urs
es/m
idw
ives
Study
NSW
National
All of the following information is displayed in Table 1. The most commonly
occurring age in this study sample was 44 years. Similarly, in 2001, the Australian
Health and Welfare Institute reported the average age for all employed nurses and
midwives in Australia was 42.2 years and 41.8 years for all employed clinical nurses
(Chrisopoulos and Waters 2003). The average age for nurses and midwives working
in NSW in 2003 was 43.7 years and the modal age range was 45 to 49 years
(Workforce Planning NSW Health 1999-2003). In 2004, the average age for nurses
and midwives in Australia was 43.2 years (AIHW, 2006).
Table 1 Descriptive Statistics for Study, NSW and National Samples
Samples Australia NSW Australia Current Study
Year 2001 2003 2004 2005
Mean 42.2 43.7 43.2 45
Mode 45-49 44

3
The number of hours worked per week in NSW by enrolled nurses in 2003 was 38 to
44 hours per week and for registered nurses, 40 to 44 hours per week from 1999 to
2003 (Workforce Planning NSW Health 1999-2003). The Australian statistics
(Chrisopolous & Waters, 2003) collected information on fulltime equivalent nurses
per 100,000 population and comparisons of average hours worked by state or territory
of Australia were made. As the state of work was only able to be determined for 314
respondents (56%) of the study sample, a comparison to Australian statistics was not
meaningful (eg. FTE/100,000 population).