individual differences in human eye movements: an...
TRANSCRIPT
Vision Research 141 (2017) 157–169
Contents lists available at ScienceDirect
Vision Research
journal homepage: www.elsevier .com/locate /v isres
Individual differences in human eye movements: An oculomotorsignature?
http://dx.doi.org/10.1016/j.visres.2017.03.0010042-6989/� 2017 Elsevier Ltd. All rights reserved.
⇑ Corresponding author.E-mail address: [email protected] (J.D. Mollon).
Gary Bargary a,b, Jenny M. Bosten a,c, Patrick T. Goodbourn a,d, Adam J. Lawrance-Owen a, Ruth E. Hogg a,e,J.D. Mollon a,⇑aDepartment of Experimental Psychology, University of Cambridge, Downing Street, Cambridge CB2 3EB, United KingdombDepartment of Optometry and Visual Science, City University London, Northampton Square, London EC1V 0HB, United Kingdomc School of Psychology, University of Sussex, Brighton, United Kingdomd School of Psychology, University of Melbourne, AustraliaeCentre for Vision Science and Vascular Biology, Queen’s University Belfast, University Road, Belfast BT7 1NN, United Kingdom
a r t i c l e i n f o a b s t r a c t
Article history:Received 1 August 2016Received in revised form 28 February 2017Accepted 4 March 2017Available online 12 April 2017
Number of Reviews = 2
Keywords:Eye movementReliabilityIndividual differencesBiometricSaccadesAnti-saccadesSmooth pursuitFactor analysisSex differencesHandednessEye dominancePersonalityExtraversionAutism spectrum quotientEndophenotype
Human eye movements are stereotyped and repeatable, but how specific to a normal individual are thequantitative properties of his or her eye movements? We recorded saccades, anti-saccades and smooth-pursuit eye movements in a sample of over 1000 healthy young adults. A randomly selected subsample(10%) of participants were re-tested on a second occasion after a median interval of 18.8 days, allowing usto estimate reliabilities. Each of several derived measures, including latencies, accuracies, velocities, andleft-right asymmetries, proved to be very reliable. We give normative means and distributions for eachmeasure and describe the pattern of correlations amongst them. We identify several measures that exhi-bit significant sex differences. The profile of our oculomotor measures for an individual constitutes a per-sonal oculomotor signature that distinguishes that individual from most other members of the sample of1000.
� 2017 Elsevier Ltd. All rights reserved.
1. Introduction identification (e.g. Kasprowski & Ober, 2004; Komogortsev, Karpov,
Eye movements are the most common of all human actions:every second of our waking life we make approximately three ofthe rapid, stereotyped movements that are saccades (Carpenter,2004). It is known, however, that there are reliable individual dif-ferences in the characteristics of both saccades and smooth-pursuiteye movements (Ettinger et al., 2003; Katsanis, Taylor, Iacono, &Hammer, 2000; Klein & Fischer, 2005; Meyhofer, Bertsch, Esser,& Ettinger, 2016; Smyrnis, 2008; Vikesdal & Langaas, 2016;Wostmann et al., 2013); and it has sometimes been suggested thatoculomotor measures are specific enough to be used for biometric
& Holland, 2016; Komogortsev, Karpov, Price, & Aragon, 2012;Poynter, Barber, Inman, & Wiggins, 2013; Zhang, Laurikkala, &Juhola, 2015). We have obtained a comprehensive set of oculomo-tor measures for over 1000 healthy young adults and have estab-lished the reliabilities of the measures by re-testing 10% of theparticipants after a median interval of 18.8 days. Each measure initself proves highly reliable; and the profile of these parametersdoes constitute a motor signature that distinguishes an individualfrom most other members of the cohort.
We included in our battery three types of oculomotor task. Inthe pro-saccade task, the observer fixates centrally, a peripheralvisual target appears suddenly, and he or she is required to fixatethe target as quickly as possible (Leigh & Kennard, 2004). In theanti-saccade task, the participant is required to fixate in the exact

158 G. Bargary et al. / Vision Research 141 (2017) 157–169
opposite direction from that of the target (Evdokimidis et al., 2002;Hallett, 1978). In the smooth-pursuit task the participant is askedto maintain fixation on a moving visual target.
Abnormalities of these three tasks have been reported in manypsychiatric and neurological pathologies (Klein & Ettinger, 2008;Leigh & Zee, 2015) and have sometimes been proposed asendophenotypes (Gottesman & Gould, 2003); this is a further rea-son to know the range of variation of oculomotor measures in thenormal population and their test-retest reliabilities. In the anti-saccade task, for example, schizophrenic patients make moredirection errors, i.e. make more erroneous pro-saccades, than docontrols (e.g. Fukushima et al., 1988) and their anti-saccades havelonger latencies (Fukushima, Fukushima, Morita, & Yamashita,1990); for a review, see Hutton and Ettinger (2006). In ocular track-ing (‘smooth pursuit’) tasks, schizophrenics show an increasednumber of intrusive saccades and a reduced pursuit gain – definedas the ratio of eye velocity to target velocity (see e.g. Damilou,Apostolakis, Thrapsanioti, Theleritis, & Smyrnis, 2016; Diefendorf& Dodge, 1908; Leigh & Zee, 2015; Levy, Holzman, Matthysse, &Mendell, 1993; O’Driscoll & Callahan, 2008). The latencies of pro-saccades, and the distributions of latencies, are also known to beabnormal in, for example, Parkinson’s disease (Perneczky et al.,2011) and in Huntington’s disease (Lasker & Zee, 1997).
In the case of normal subjects, only a few studies have exam-ined how variation in one eye-movement task relates to that inanother. To what extent do different measures depend on a singleunderlying mechanism or are the several oculomotor measurescompletely independent? To address such questions, one canexamine the correlations between various eye-movement mea-sures for a large number of individuals: both the absence and thepresence of correlations will then give insights into the underlyingmechanisms (see Wilmer (2008) for a recent review). Typically, alatent variable analysis (Loehlin, 2004), such as factor analysis, isused to examine the relationship between different variables.One study that has analysed eye movements in this way was thatby Fischer, Biscaldi, and Gezeck (1997), who applied factor analysisto six measures derived from pro- and anti-saccade tasks: theyfound two factors, one relating to anti-saccade performance andone relating to pro-saccade performance. We here extend suchan analysis to a wider range of eye-movement measures.
To allow comparisons between eye-movement studies and todisentangle whether the variation between studies arises fromthe different populations studied or from the idiosyncratic tasksused, it is desirable to standardise the tasks. Smyrnis (2008), in acomprehensive review of the methodology of saccadic andsmooth-pursuit paradigms, sets out recommendations for experi-mental design, target parameters, sampling frequency and dataanalysis. The present study has been guided by these recommen-dations. For a group of over 1000 adults, we report the range, dis-tribution and reliability of a large number of oculomotor measures.Correlations were carried out to establish the relationship betweeneach pair of measures. We used factor analysis to investigatewhether the observed covariation could be explained by a smallernumber of hypothetical factors. We also report correlations withsex and with personality measures. Finally, we examine the extentthese standard eye-movement measures constitute a unique signa-ture for a particular individual.
2. Methods
2.1. Participants
There were 1058 participants (413 male and 645 female; agerange 16–40, mean = 22.14, SD = 4.09). They were recruited to takepart in the PERGENIC test battery, which consisted of a number of
optometric, perceptual and oculomotor tests (Goodbourn et al.,2012). All participants were of European ancestry. A large propor-tion were students from Cambridge University.
In order to establish the test–retest reliability of our measures, arandomly selected 10% of the sample (105 participants; 42 maleand 63 female; age range 16–39, mean = 21.66, SD = 4.01) com-pleted the PERGENIC test battery twice. In all but three cases, thetwo testing sessions were at least one week apart: the range was2–105 days, with a mean of 26.4 days and a standard deviationof 23.3 days. The median was 18.8 days.
The oculomotor tests occupied approximately 25 min of thetotal 2.5-h testing duration. Before completing the psychophysicaland oculomotor tests, participants underwent an optometricassessment.
The study received approval from the Cambridge PsychologyResearch Ethics Committee and was carried out in accordance withthe Code of Ethics of the World Medical Association (Declaration ofHelsinki). All participants gave written consent after having beengiven information about the experiment. They were paid a fee of£25 for their participation.
2.2. Apparatus
Stimuli were presented in a darkened room on a Sony GDM-F520 CRT monitor using a Cambridge Research Systems VSG 2/5graphics card. The refresh rate of the monitor was 100 Hz. The tar-get for each task was a white disk with a diameter of 0.3� of visualangle presented on a grey background; the target and backgroundhad luminances of 75 cd/m2 and 25 cd/m2 respectively. The back-ground was continuously present during inter-stimulus intervals.A chin-rest was used to minimise head movements and maintaina viewing distance of 60 cm.
Eye movements were recorded using the head-mounted JAZZ-novo multisensory system (Ober Consulting, Poznan, Poland). TheJAZZ-novo measures horizontal and vertical eye rotations usinginfrared oculography. It is also equipped with two uni-axial gyro-scopes that measure the velocity of horizontal and vertical headrotations. All signals are sampled at 1 kHz. The measurable rangesfor horizontal and vertical eye rotations are ±35� and ±25�, respec-tively. The noise level (along the horizontal axis) is equivalent to6 min of visual angle. Each measurement of eye rotation is anaverage of the two eyes; this cycloptic measure is intrinsic to theJAZZ-novo sensor system. The signals from the JAZZ-novo were syn-chronised with the CRT by means of the Windows-independenttimer present on the Cambridge Research Systems VSG 2/5 graphicscard. The synchronization was accurate to 1 ms (tested empirically).
2.3. Analysis of oculomotor data
All oculomotor data were processed and analysed usingpurpose-built programs written in MATLAB (MathWorks, UK).The raw output from the JAZZ-novo system is a digital 12-bit sig-nal. The JAZZ-novo has an in-built mechanism to centre the signalif it approaches the limit of the 12-bit range (0–4096); correctionwas made for this effect before data processing.
Nine calibrations were performed in the course of testing eachparticipant (see below, §2.4). The gain and the offset for each cali-bration were calculated using linear regression of the eye signalagainst the target amplitudes. These factors were applied to theeye-movement data following the calibration. On rare occasions,a particular calibration did not yield an adequate calibration factor(as assessed with goodness of fit statistics) and the closest calibra-tion in time (of the nine) was used in its place.
The eye-movement signal was processed following Bahill,Kallman, and Lieberman (1982). The raw amplitude signal (hori-zontal and vertical) was filtered with a 300 Hz low-pass filter. A

G. Bargary et al. / Vision Research 141 (2017) 157–169 159
two-point central difference algorithm (±3 ms spread) was appliedto the filtered amplitude data to obtain eye velocity, resulting in avelocity record with a 3 dB bandwidth of 74 Hz. The acceleration ofthe eye was obtained by applying another two-point central differ-ence algorithm (±4 ms spread) to the velocity record, resulting inan acceleration record with a 3 dB bandwidth of 45 Hz. Thissequence of steps, a low-pass filter followed by a two-point centraldifference algorithm, approximates an ideal differentiator (Bahillet al., 1982). The raw horizontal and vertical head velocity signalswere filtered with a 300-Hz low-pass filter. Trials with excessivehead movements were removed from further analysis: the algo-rithm used the standard deviation of the head velocity signal fora given portion of a trial (0–500 ms for the saccadic tasks and thecomplete trial for smooth-pursuit tasks) as an index of head move-ment. A trial was excluded if the head-movement index was morethan four standard deviations above the mean index for all trials;this resulted in an average of 3.5% of trials excluded perparticipant.
All saccades in each of the tasks were detected with the samepurpose-built saccade algorithm. This algorithm used both eyeacceleration and eye velocity criteria to detect and profile a sac-cade. The presence of a saccade was detected if the eye accelera-tion exceeded a relative threshold value (six times the medianvalue of the standard deviation of the acceleration signal duringthe first 80 ms of all trials for a particular person), or if the eyevelocity exceeded an absolute threshold of 50�/s (the latter crite-rion was used very rarely). After detection, the saccade was pro-filed using the eye velocity record: borders of the saccade weredefined as the regions where the eye velocity dropped below threetimes the median value of the standard deviation of the eye veloc-ity record during the first 80 ms of all trials for a particular person.
2.4. Oculomotor tasks
There were four tasks presented in separate blocks. Block 1 con-tained a pro-saccade task and Block 2 an anti-saccade task. Blocks 3and 4 contained smooth-pursuit tasks: a standard smooth-pursuittask and a task designed to capture the initial stages of smoothpursuit. There was a break every 2–3 min; some breaks coincidedwith block intervals. A seven-point horizontal calibration taskwas presented at the start of the experiment and after every break:in each calibration, targets were presented at 15�, 10�, 5�, 0�, �5�,�10�, �15� relative to the central fixation point; target durationwas 1000 ms. The first calibration also contained a five-point ver-tical calibration (10�, 5�, 0�, �5�, �10�).
2.4.1. Pro-saccade taskA pro-saccade trial began with the presentation of the target in
a central location for a random duration of 500–1500 ms. The tar-get then moved abruptly (next refresh of the monitor) to one of tenperipheral horizontal locations (±3�, ±6�, ±9�, ±12� and ±15�),where it remained for 600 ms. Each peripheral location was pre-sented 20 times in random order, resulting in a total of 200 trials.The participant was instructed to look at the target as quickly andas accurately as possible. There was an inter-trial interval of1000 ms.
2.4.2. Anti-saccade taskThe anti-saccade task was identical to the pro-saccade task
except for three features: the number of trials (50 instead of 200;five presentations at each of the ten peripheral locations), the tar-get duration (1000 ms instead of 600 ms) and the instructions (theparticipants were instructed to look in the exact opposite directionand location to the target as quickly and as accurately as possible).
2.4.3. Smooth-pursuit tasksA smooth-pursuit trial began with the target located centrally
for a random duration of 500–1500 ms. The target then began tomove horizontally (in a random direction) at a constant speed(10�/s, 20�/s and 30�/s) until it reached 15� eccentricity where itabruptly changed direction and continued to the opposite side.Each trial contained 5.5 cycles across the screen. There were 8 tri-als for each speed (four beginning with leftward motion, four withrightward), resulting in a total of 24 trials. The instructions were toremain fixated on the target at all times. The second smooth-pursuit task was identical except that the number of trials was60 instead of 24 (20 presentations of each target speed) and thestimulus contained only the first half-cycle of the smooth-pursuitwaveform.
2.4.4. ExclusionsOwing to equipment failure, 13 people had to be excluded from
all four eye-movement tasks; a further 4 had to be removed fromboth smooth-pursuit tasks; and one further person had to beremoved from the second smooth-pursuit task. This gave a totalof 1045 participants in the pro- and anti-saccade tasks, 1041 inthe standard smooth-pursuit and 1040 in the short trial smooth-pursuit. In the re-test group (105 participants), owing again toequipment failure, one person had to be removed from the saccadictasks and two from both smooth-pursuit tasks.
2.5. Measures derived from the oculomotor data
2.5.1. Pro-saccade measuresA pro-saccade was characterised as the first saccade in a trial
(without any preceding blink) greater than 1.5� and in the samedirection as the target. Pro-saccades with latencies below 50 msor above 500 ms were excluded from analysis. Saccades with laten-cies that deviated by 2.5 standard deviations from the mean foreach participant were also excluded (these comprised 2% of allsaccades.)
The primary pro-saccade measures extracted were the latencyof a saccade and the relationship between the amplitude and thepeak velocity of a saccade, dubbed ‘the main sequence’ (Bahill,Clark, & Stark, 1975). To allow comparison with other studies,the latency was defined as the median latency. As a measure ofthe variability of latency we used the standard deviation of thereciprocal latency, instead of the more common standard deviationof latency, since the former is typically found to be more normallydistributed. We also give measures derived from the LATER modelof Carpenter (1981). Express saccades were defined as pro-saccades that occurred before 125 ms. The mean reciprocal laten-cies of left and right saccades varied within individuals and theratio of the two values was taken as a measure of this asymmetry.
The relationship between the peak velocity and amplitude of asaccade was characterised by applying a square root fit, where thepeak velocity equals the square root of the amplitude multiplied bya constant (Lebedev, Van Gelder, & Tsui, 1996). The constant repre-sents the predicted peak velocity of a one-degree saccade. This par-ticular fit has the advantage that the main-sequence relationship ischaracterised by only one parameter. Also, in comparison to othercommon main-sequence models (inverse linear and power mod-els) it has been shown to be the most accurate and robust fit forsaccades with amplitudes between 1.5� and 30� (amplitudes wherethe peak velocity has yet to saturate) (Lebedev et al., 1996).
In calculating the main sequence, prior to applying the squareroot fit, saccades with abnormal velocity profiles were excludedfrom the analysis. To assess abnormality, we took the ratio of thevelocity in the first half of the saccade (before peak velocity) to thatin the secondhalf of the saccade (after peak velocity): if thismeasurewas outside 2.5 times its standard deviation for an individual, it was
160 G. Bargary et al. / Vision Research 141 (2017) 157–169
excluded (these exclusions comprised an average of 1.6% ofsaccades.)
Secondary pro-saccade measures extracted were the proportionof dynamic overshoots and the number of corrective saccades (alsocalled static overshoots or undershoots) (Bahill & Stark, 1975). Theformer are overshoots that directly follow the saccade with no per-iod of fixation or reduction of the eye velocity; they had to be atleast 5 ms in duration. Corrective saccades or two-step saccadesare saccades that occur following a brief fixation after the initialsaccade. The second saccade can be in the same direction as theinitial saccade (referred to as a static undershoot) or in the oppo-site direction (static overshoot). The criteria for a corrective sac-cade were that it occurred between 50 and 300 ms following apro-saccade and that it was in the direction of the target.
2.5.2. Anti-saccade measuresThe primary measures from the anti-saccade task were the pro-
portion of anti-saccade errors (trials on which the participantmade an erroneous pro-saccade) and the latency of correctanti-saccades (saccades in the opposite direction to the target).Secondary measures included the median latency of erroneouspro-saccades and the amplitude gain of correct anti-saccades(anti-saccade amplitude divided by target amplitude).
2.5.3. Smooth-pursuit measuresThe primary measure for smooth pursuit was the pursuit gain:
eye velocity divided by the target velocity. Blinks and saccadeswereremoved. Also, the regions in the periphery where the target chan-ged direction were excluded, i.e. regions where the target had anabsolute eccentricity greater than10�. Thepursuit segments for eachtarget speed were combined and the absolute median velocitydetermined for each of the three speeds. The gain for each speedwas calculated by dividing the median eye velocity by the targetvelocity for that speed. The mean of the three values is the pursuitgain reported.
As a global measure of pursuit performance, we also calculatedthe root mean square error of the eye position versus the targetposition. The complete pursuit signal was used excluding blinks.The frequency of intruding saccades and the type of saccades(catch-up saccades, anticipatory saccades or square wave jerks)were also quantified. A catch-up saccade (CUS) was defined as asaccade in the direction of pursuit that decreased positional error.An anticipatory saccade (AS) was defined as a saccade in the direc-tion of pursuit that increased positional error and was greater than1.5� in amplitude (Smyrnis, 2008). Square-wave jerks occurredinfrequently and were excluded from further analysis. The num-bers of CUS and AS were divided by the total pursuit time to givethe number per second of each.
Two measures were obtained from the second smooth-pursuittask: the median latency to the first saccade in the direction ofthe target, and the pre-saccadic acceleration – a slight accelerationin eye position just prior to a saccade and in the same direction(Carl & Gellman, 1987; Wilmer & Nakayama, 2007). The constantacceleration was quantified by fitting a regression line to theeye-velocity signal from the onset of acceleration to saccadiconset; the mean slope of all trials was obtained representing themean constant acceleration. Acceleration onset was detected byexamining the amplitude signal immediately preceding saccadiconset: onset occurred when this amplitude signal went withinthe confidence intervals (three times the error of the fit) of aregression line fitted to the first 80 ms of the amplitude signalfor each trial.
2.6. Statistical analysis
To establish the test–retest reliability of each of the 21 oculo-motor measures, the scores from the two independent sessionswere correlated for the subset of re-tested participants. To allowcomparisons with other studies, we calculated three different cor-relation coefficients: Pearson’s, Spearman’s and intra-class correla-tion (ICC) coefficients. Spearman rank correlation is not typicallyreported in the oculomotor literature but it is a useful metric inthat deviations from normality (particularly in the tails of the dis-tribution) do not affect it, whereas small deviations from normalitycan result in an over- or under-estimation of the correlation whenPearson’s or ICC are used.
Internal consistency for each measure was established by divid-ing the data from the complete first session sample into two por-tions and then carrying out a Spearman rank correlation betweenthese two portions. In the odd-even method a score for each mea-sure was determined separately for odd- and even-numbered tri-als; in the split-half method a score for each measure wasdetermined separately for the first and the second half of the trials.
In carrying out the factor analysis a Box–Cox transformation(Box & Cox, 1964) was performed on each measure to achieve dis-tributions that were close to Gaussian, since many of the measureshad skewed distributions. The factor analysis used principal com-ponent analysis with oblique promax rotation to determine thefactors (Jolliffe, 2002).
2.7. Questionnaire measures
Prior to attending the testing session in the laboratory, partici-pants completed a 75-item online questionnaire. Included in thequestionnaire were items to gather demographic information(age, sex, ancestry, level of education), two items to establish pre-ferred hand (for throwing and for writing), and items about visualand auditory attributes (Bosten et al., 2015). The questionnaire alsoincorporated a 20-item self-report personality scale, the Mini-IPIP(International Personality Item Pool; Donnellan, Oswald, Baird, &Lucas, 2006), which assesses the ‘Big Five’ personality factors:Openness, Conscientiousness, Extraversion, Agreeableness andNeuroticism (Costa & McCrae, 1992). Each response was on afive-point Likert scale and there were four items per factor. Toobtain an individual’s factor score, responses to the four itemswere summed and normalised to the interval [�1, 1].
In a follow-up study (see Verhallen et al., 2017) we obtainedscores on the Autism-Spectrum Quotient (Baron-Cohen,Wheelwright, Skinner, Martin, & Clubley, 2001). These scores wereavailable for 521 of the participants from our original laboratorystudy (333 female) and were obtained via a 50-item on-line ques-tionnaire. The mean AQ score was 17.32 (SD = 7.58, range 3–39).Twenty-five participants scored at or above 32: scores in this rangeare suggestive of autism-spectrum disorder.
2.8. Sighting dominance
The optometric testing included a variant of the Miles test toestimate sighting dominance (Miles, 1929): the participant, seatedin front of an acuity chart, was asked to outstretch both arms andto overlay the hands to create a small aperture between thethumbs and index fingers. The experimenter then asked the partic-ipant to position the aperture so that it revealed on designated let-ter on the chart. The participant was then asked to slowly draw thehands towards the face, keeping both eyes open, and keeping theletter visually centred within the aperture. The participant invari-ably drew the hands towards one or other eye, which was recordedas preferred.

Table 1Reliability and descriptive statistics of eye-movement measures.
Measure Units Descriptive statistics Test–retest reliability Internal consistency
Mean Median sd Range P r ICC Odd-even Split-half
Pro-saccade measuresMain sequence � s�1 114.5 114.1 13.6 69.9–164.2 0.86 0.88 0.88 0.99 0.94Median latency m s 177.2 174 18.52 142–322 0.83 0.84 0.84 0.93 0.85Latency standard deviation s d�1 0.001 0.001 0.0002 0.0005–0.0021 0.78 0.75 0.74 0.82 0.70Express saccades Proportion 0.044 0.026 0.0573 0–0.420 0.70 0.82 0.81 0.74 0.67LATER median m s�1 0.006 0.006 0.0006 0.0037–0.0076 0.80 0.83 0.83 0.95 0.86LATER slope z ms�2 1009 976.5 222.7 389–1861 0.80 0.79 0.76 0.78 0.66LATER intercept z �5.714 �5.464 1.401 �11.43–(�2.63) 0.77 0.77 0.74 0.80 0.66Left-right latency ratio Ratio 0.985 0.983 0.078 0.608–1.37 0.77 0.83 0.83 0.72 0.62Dynamic overshoots Proportion 0.813 0.845 0.145 0.265–1 0.82 0.83 0.82 0.92 0.84Static overshoots Proportion 0.08 0.065 0.06 0–0.374 0.71 0.71 0.71 0.76 0.68Static undershoots Proportion 0.49 0.497 0.163 0.032–0.898 0.79 0.83 0.83 0.91 0.81
Anti-saccade measuresError rate Proportion 0.377 0.35 0.215 0–1 0.82 0.84 0.84 0.83 0.74anti-saccade latency ms 305.5 301 43.06 113–539 0.73 0.73 0.73 0.76 0.65Error saccade latency ms 187.7 182 31.272 128–518 0.77 0.72 0.72 0.61 0.59anti-saccade gain Amplitude ratio 0.93 0.897 0.253 0.256–3.05 0.78 0.77 0.74 0.56 0.54
Smooth pursuit measuresGain Velocity ratio 0.795 0.814 0.138 0.307–1.076 0.88 0.86 0.86 0.96 0.89RMSE � 3.095 2.5 1.834 0.874–13.54 0.79 0.81 0.80 0.91 0.86Catch-up saccades Hz 0.641 0.607 0.298 0.067–1.979 0.78 0.74 0.72 0.93 0.87Anticipatory saccades Hz 0.234 0.197 0.167 0–0.837 0.83 0.83 0.83 0.93 0.89Median latency ms 197.4 196 20.02 152–282 0.85 0.84 0.84 0.85 0.82Pre-saccadic acceleration � s�2 36.65 33.93 18.75 �15.07–153.2 0.72 0.78 0.76 0.73 0.70
G.Bargary
etal./V
isionResearch
141(2017)
157–169
161

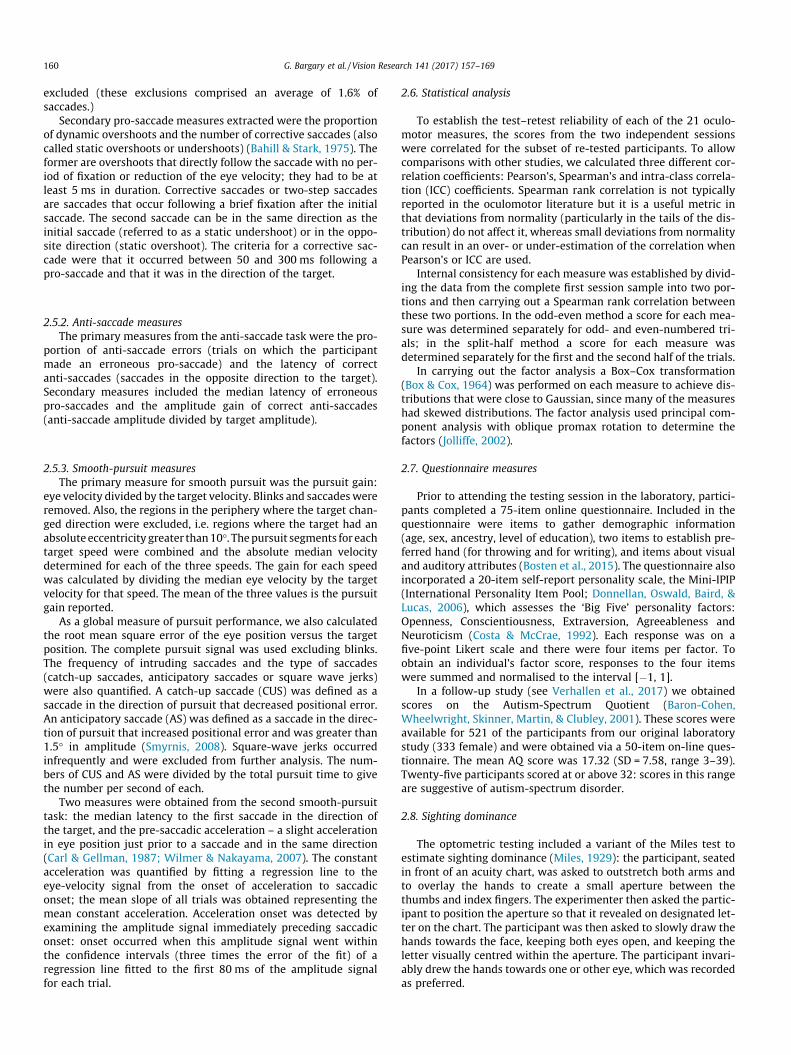
Fig. 1. Distribution of each eye-movement measure. The units for each distribution are given in Table 1.
162 G. Bargary et al. / Vision Research 141 (2017) 157–169
3. Results
3.1. Distributions and reliabilities
Table 1 shows the mean, standard deviation and range ofeach of the 21 eye-movement measures for the full cohort ofparticipants who took part in the first session. The correspondingdistributions are shown graphically in Fig. 1. The Lilliefors testshowed that most of the distributions deviated significantly fromnormality (0.0236 � Dn � 0.22; 0 � p � 0.184; a = 0.0025), the
three exceptions being: main sequence, LATER median and staticundershoots.
All measures show individual differences: most exhibit 2- to 3-fold differences between participants, while some show greaterthan 10-fold differences. These ranges are consistent with rangespreviously reported (Smyrnis, 2008). However, variance in mea-surements made on a single occasion can never be taken as evi-dence for individual differences, since the variance may beinstrumental or may be within-subject in its origin. It was criticalto our purposes to estimate the reliability over time of individual

Table 2Sex differences within eye-movement measures.
Measures Male mean Female mean t-stat p-value df
Main sequence 114.24 114.66 0.469 0.63936 1038Pro-saccade latency 174.98 178.54 3.052 0.00233 1038Latency variability 0.00104 0.00100 �2.237 0.02549 1038Express saccades 0.053 0.0387 �3.944 0.00009 1038LATER median 0.0058 0.0056 �4.711 0.00000 1038LATER slope 991.32 1020.1 2.038 0.04182 1038LATER intercept �5.7167 �5.7112 0.053 0.95748 1038Left–right latency ratio 0.9894 0.9827 �1.368 0.17162 1038Dynamic overshoots 0.7583 0.8478 10.201 0.00000 1038Static overshoots 0.0846 0.0773 �1.953 0.05114 1038Static undershoots 0.5011 0.4823 �1.826 0.06818 1038Anti-saccade error rate 0.3507 0.3946 3.238 0.00124 1038Anti-saccade latency 297.44 310.6 4.892 0.00000 1037Anti-saccade error latency 183 190.67 3.909 0.00010 1036Anti-saccade gain 0.9114 0.9415 1.881 0.06027 1037Smooth pursuit gain 0.8139 0.7819 �3.681 0.00024 1038Smooth pursuit RMSE 2.7841 3.2968 4.444 0.00001 1038Catch-up saccades 0.7458 0.5732 �9.495 0.00000 1038Anticipatory saccades 0.2112 0.2493 3.625 0.00030 1038Smooth pursuit latency 193.63 199.84 4.950 0.00000 1038Pre-saccadic acceleration 36.487 36.752 0.222 0.82399 1038
G. Bargary et al. / Vision Research 141 (2017) 157–169 163
variation; and to this end, 10% of participants completed the mea-surements a second time, after a mean interval of 26 days.
The right-hand columns of Table 1 show reliabilities and inter-nal consistencies for each oculomotor measure. All the correlationsare highly significant, (p < 0.0001; a = 0.001 with Bonferroni cor-rection for 48 tests). The test–retest reliabilities ranged from0.685 to 0.884. For each measure, Pearson’s, Spearman’s and ICCcorrelations were similar (with means of 0.8, 0.789 and 0.793,
Table 3Correlation matrix. Spearman rank correlations between each pair of oculomotor measureSignificant correlations following a Bonferroni correction for 210 tests (a = 0.000238) are
0198765432
1. Main sequence -0.182 -0.073 0.071 0.166 0.060 -0.123 0.034 0.437 0.301
2. Pro-saccade latency 0.141 -0.470 -0.945 -0.051 0.422 -0.044 -0.109 -0.085
3. Latency variability 0.529 -0.083 -0.975 0.920 -0.011 -0.068 0.098
4. Express saccades 0.592 -0.576 0.285 0.076 0.012 0.166
5. LATER median 0.004 -0.395 0.059 0.095 0.112
6. LATER slope -0.905 0.010 0.064 -0.100
7. LATER intercept -0.026 -0.102 0.041
8. Left-right latency ratio -0.014 0.031
9. Dynamic shoots 0.138
10. Static Overshoots
11. Static Undershoots
12. Anti-saccade error rate
13. Anti-saccade latency
14. Anti-saccade error latency
15. Anti-saccade gain
16. Smooth pursuit gain
17. Smooth pursuit RMSE
18. Catch-up saccades p < 0.000238, significant
19. Anticipatory saccades p < 0.05
20. Smooth pursuit latency
21. Pre-saccadic acceleration
respectively). In the internal consistency measures, the odd-evenmethod resulted in higher consistency for the two measures thandid the split-half method: Odd-even results ranged from 0.558 to0.989 (mean = 0.827), whereas the split-half results ranged from0.542 to 0.937 (mean = 0.755). In sum, the oculomotor measuresextracted are stable not only within a single session but also acrosssessions that are separated by a median interval of 18.8 days. Allmeasures exhibit substantial individual differences.
s. Nominally significant correlations (a = 0.05, uncorrected) are shown in light grey.shown in dark grey.
1202918171615141312111
-0.081 -0.023 -0.079 -0.112 0.160 0.070 -0.079 -0.049 0.020 -0.124 0.113
-0.280 -0.171 0.328 0.691 0.070 -0.250 0.265 -0.119 0.155 0.530 -0.100
-0.065 0.229 0.185 -0.127 0.056 -0.262 0.272 -0.091 0.181 0.170 -0.147
0.191 0.326 -0.120 -0.474 0.038 -0.044 0.056 0.009 0.054 -0.193 -0.014
0.300 0.177 -0.357 -0.682 -0.031 0.247 -0.253 0.143 -0.150 -0.525 0.115
0.032 -0.249 -0.158 0.191 -0.047 0.252 -0.259 0.078 -0.184 -0.126 0.153
-0.159 0.151 0.289 0.091 0.057 -0.321 0.337 -0.135 0.228 0.321 -0.186
0.028 0.008 -0.031 -0.041 -0.033 0.041 -0.036 -0.002 0.001 -0.075 -0.014
-0.084 0.002 -0.034 -0.045 0.099 -0.009 -0.062 -0.217 0.062 -0.095 0.060
-0.369 0.011 -0.121 -0.068 0.200 -0.051 0.032 -0.072 0.061 -0.051 0.005
0.186 -0.060 -0.187 -0.178 0.024 -0.066 0.303 -0.012 -0.174 -0.032
0.083 -0.304 0.117 -0.297 0.341 -0.131 0.254 0.067 -0.190
0.300 -0.167 -0.132 0.136 -0.091 0.042 0.330 -0.128
-0.014 -0.088 0.099 -0.039 0.031 0.315 -0.014
-0.179 0.167 -0.207 0.198 0.111 0.014
-0.748 0.280 -0.756 -0.429 0.435
-0.414 0.707 0.435 -0.268
-0.438 -0.215 0.030
0.278 -0.263
-0.250

164 G. Bargary et al. / Vision Research 141 (2017) 157–169
3.2. Relationship to sex and personality
Table 2 shows the mean values and t-test statistics for malesand females for each oculomotor measure. Significant sex differ-ences (after Bonferroni correction; a = 0.0024) are observed in overhalf of the measures. Substantial, and highly significant, differencesbetweenmen and women occur in the proportion of dynamic over-shoots in pro-saccades and in the frequency of catch-up saccadesin smooth pursuit, with greater than 10% differences betweensexes. Other significant sex differences have more modest effectsizes, but are systematic in direction: regardless of the task, mentend to be faster than women at initiating saccades; and men tendto have better smooth pursuit (judged by their smooth-pursuitgain and RMSE values) and better anti-saccade performance thando women. The significantly higher anti-saccadic error rate shownby women is consistent with an earlier report by Crawford et al.(1998), who studied a combined group of schizophrenic andhealthy subjects.
Removing the effects of sex, we calculated partial correlationsbetween oculomotor measures and five dimensions of personalityderived from a short, self-report questionnaire (Donnellan et al.,2006). We selected ten eye-movement measures, choosing onesthat were reasonably uncorrelated or were ones that are used reg-ularly in the literature. One correlation was very highly significantfollowing Bonferroni correction for 45 tests (Α = 0.0011): extraver-sion was positively correlated with smooth-pursuit RMSE (Spear-man’s q = 0.150). In other words, higher levels of extraversion areassociated with poorer accuracy in tracking a moving target.Extraversion also correlated significantly with the variability ofsaccadic latencies (Spearman’s q = 0.103).
None of our eye-movement variables showed a Spearman cor-relation with Autism-Spectrum Quotient greater than 0.06 whensex was used as a covariate; and none of these correlations was sig-nificant after Bonferroni correction.
3.3. Handedness and sighting dominance
Table 1 shows that there are highly reliable individual differ-ences in the asymmetry of pro-saccadic latencies, the Spearmantest-retest correlation being 0.83. When such asymmetries havepreviously been reported they have sometimes been found to beassociated with handedness (e.g. Pirozzolo & Rayner, 1980) or witheye dominance (e.g. Kolesnikova, Tereshchenko, Latanov, &Shulgovskii, 2010), although in a large sample Constantinidiset al. (2003) found no relationship between a composite measureof lateral preference and asymmetry of prosaccadic latency (seealso Vergilino-Perez et al. (2012). We therefore record here thatin our own large sample we observed little relationship betweenasymmetry of pro-saccadic latency and either preferred hand(composite of preference for throwing and writing; Spearman’sq = 0.00, p = 0.99) or sighting dominance (Spearman’s q = 0.06,p = 0.047 before Bonferroni correction).
3.4. Correlations between eye-movement measures
The wide range of variation among the population coupled withthe high intra-individual reliability (Table 1 and Fig. 1) shows thatpeople vary systematically in their oculomotor control. To under-stand the underlying sources of this variance, it is instructive todetermine how each eye-movement parameter varies with eachother.
Table 3 shows the Spearman rank correlations between eachpossible pair of eye-movement measures. Nominally significantcorrelations (a = 0.05, uncorrected) are shown in light grey. Signif-icant correlations following a Bonferroni correction for 210 tests(a = 0.000238) are shown in dark grey; these comprise more than
half (111 of 210) of the correlations. However, the majority of thesignificant correlations (91 of 111) had a Spearman q < 0.3; thelarge sample size allows us to detect quite modest relationshipsbetween the measures. Many of the higher correlations, with aSpearman q � 0.3 (20 of 210), are between measures that fallwithin the same subset. For example, many latency measures cor-relate highly, independently of the task. Similarly, smooth-pursuitmeasures correlate with each other more than they do with mea-sures from other tasks. As would be expected from the model ofFriedman, Jesberger, and Meltzer (1991), and in agreement withRadant and Hommer (1992), we found a large negative correlation(�0.756) between smooth-pursuit gain and the frequency of antic-ipatory saccades. In agreement with Zanelli et al. (2005), who stud-ied a mixed group of normal and schizophrenic subjects, we find asignificant negative correlation (of �0.3) between smooth-pursuitgain and error rate in the anti-saccade task – a correlation thatmay reflect a general trait of distractibility.
One of our measures, the left–right ratio of latencies, had no sig-nificant correlates and thus appears to vary independently of allthe other measures. An asymmetry in latency has previously beenattributed to an asymmetry in the number of express saccades(Weber & Fischer, 1995). This was not found here: in our sampleonly 13% of the variance is shared between these two measuresof asymmetry.
3.5. Factor analysis
To determine whether the dimensionality of the data set couldbe reduced, a factor analysis was carried out. We excluded theLATER variables from the analysis as these are closely related to,and very highly correlated with, pro-saccade latency or latencyvariability. Also omitted was left–right latency ratio, as it corre-lated with no other measure. In order that slower reaction timesgave higher scores on all latency measures, the proportion ofexpress saccades was transformed to 1 – proportion of expresssaccades.
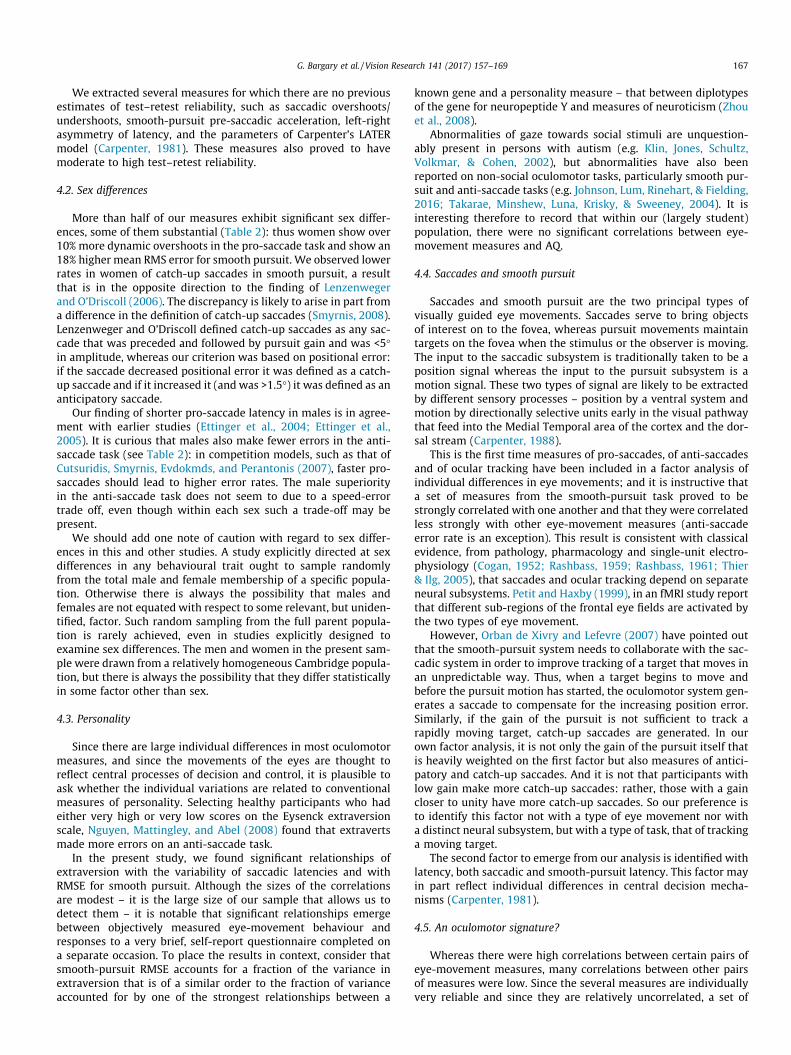
Fig. 2 shows a scree plot (A) and a pareto plot (B) of the principalcomponent analysis. The first two factors account for 38% of thevariance, and the loadings for a two-factor solution are shown inFig. 2C. The first factor represents a dimension of ocular-trackingperformance: there are positive loadings for smooth-pursuit gain,catch-up saccades and pre-saccadic acceleration, and negativeloadings for smooth-pursuit RMSE and anticipatory saccades. Thus,as would be expected, a greater number of anticipatory saccadesare associated with a drop in smooth-pursuit gain and an increasein smooth-pursuit RMSE. The second factor has high positive load-ings from latency measures, irrespective of task, and it has negativeloadings from anti-saccade error and static-undershoots. This fac-tor may represent a speed-accuracy dimension: people who haveshorter latencies make more anti-saccade errors and make moresaccadic eye movements before final fixation.
3.5. The oculomotor signature
In the previous section we were concerned with the correla-tions between measures. However, Fig. 2A and B show that theproportion of explained variance increases only gradually as largernumbers of components are included in the analysis: so it is notpossible to completely categorise an individual by his or her load-ings on a small number of factors. Although our own purpose is notto offer a biometric procedure, the reliability of our measures illus-trate the biometric potential of oculomotor measures, and here weask how specifically an individual person can be characterised if alarge number of measures (or derived components) are taken intoaccount.

Fig. 2. Factor analysis. (A) Scree plot: eigenvalues for each principal component ordered by the most significant eigenvalue. (B) Pareto plot illustrating the percentagevariance explained by the 10 most significant components (bar graph) and cumulatively (line). (C) Loadings for the two-factor solution illustrated as vectors originating fromthe origin. Measures from the ocular tracking task load strongly on Factor 1, whereas latency measures load strongly on Factor 2.
G. Bargary et al. / Vision Research 141 (2017) 157–169 165
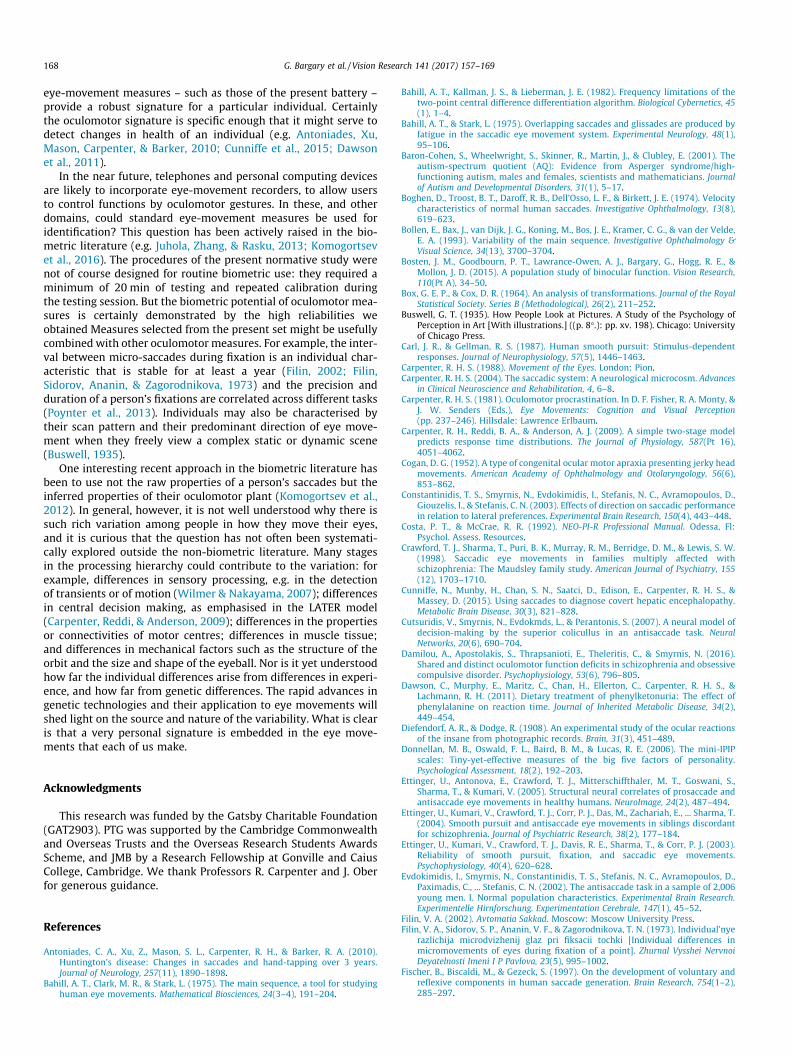
To examine to what extent a given person has a characteristiceye-movement signature we carried out a simple classificationprocedure. Eighteen of the twenty-one eye-movement measures(the LATER measures were excluded) were treated as dimensionsof a multidimensional space. Each person was represented by apoint in this 18-dimensional space, corresponding to his or herscores on the 18 measures. If each person had a unique eye-movement signature it would be possible to identify this personon a subsequent testing session by his or her location in the mul-tidimensional space. A critical feature of our study is that a ran-domly selected subset of individuals, comprising 10% of thesample, returned for a second, independent, test session. Theseparticipants were used in the present analysis. Prior to the classifi-cation procedure, each eye-movement measure for the separatesessions was normalised by transformation to z-scores. The Eucli-dean distance in 18-dimensional space between each second-session participant (n = 103) and every first-session participant(n = 1040) was calculated. These distances were ranked and wecounted how many participants separated the second-session par-ticipant from his or her position in the first session. The results areshown in Fig. 3.
In 61 of the 103 cases the nearest neighbour in multidimen-sional space between session 2 and session 1 was the same partic-ipant. In other words, from their performance on second test,approximately 60% of our participants identify themselvesuniquely in the original cohort of 1040. In 84 cases a second-session participant was a distance of fewer than five participantsaway from his or her first-session location (there were at most fourother participants closer to the second-session location); and in 95cases a second-session participant was fewer than 10 people awayfrom his or her first-session point. Thus, even with only one sessionand only one estimate of each eye-movement measure, a person’seye movements can be used to identify him or her with moderatesuccess, among more than one thousand people.
We have seen above that there are strong correlations amongthe individual measures (Table 3). Could a classification of similaraccuracy be achieved by using a space of fewer dimensions, eitherby eliminating some of measures or by using not the raw measuresbut components drawn from a Principal Component Analysis?Fig. 3B offers an answer to these questions. The solid black lineshows the increase in accuracy as more and more of the raweye-movement measures are used, each measure being introduced

Fig. 3. The uniqueness of a person’s eye movements. A. To obtain these results each of the 103 participants who were re-tested on a second session was located in a 18-dimensional space, where the dimensions correspond to each of our oculomotor measures. We then calculated the Euclidean distance of each of these participants to each ofthe 1040 first-session participants in this same space. These distances were ranked and we counted how many participants separated the second-session participant from hisown position in the first session. In the present histogram we plot the absolute number of second-session participants against the number of intervening participants. Formore than half of our re-tested participants there was no intervening participant, i.e. the closest neighbour to the second-session participant was his own first-session self. B.Here we show how the number of uniquely identified participants increases with the number of eye-movement measures (black line) or with the number of principalcomponents taken into account (dashed lines).
166 G. Bargary et al. / Vision Research 141 (2017) 157–169
in order of its reliability (Table 1). When the measures are intro-duced in this sequence, it does appear that almost all of them areneeded to achieve a high level of classification. It is true thereare a very large number of alternative permutations that couldbe used for the sequence of adding measures, but the remainingtwo curves in Fig. 3B point to a similar conclusion. Here we plotthe increase in the number of uniquely identified individuals aswe use more and more components derived from a Principal Com-ponent Analysis (using either unrotated or rotated components).Here components are being added in order of the variance thatthey account for. To achieve the same accuracy as achieved inour original 18-dimensional space, the number of components thatare needed is similar to the number of raw measures.
4. Discussion
4.1. The range and the reliability of individual differences
Substantial individual variations are apparent for all our oculo-motor measures, and in this finding our results are consistent withearlier large population studies of saccades (Constantinidis et al.,2003), of anti-saccades (Evdokimidis et al., 2002) and of smoothpursuit (Lenzenweger & O’Driscoll, 2006). Most of our measures
exhibit a range of two- to three-fold, while somemeasures, notablyRMS error for smooth pursuit, show a more than ten-fold range.Fig. 1 and Table 1 show the means and the distributions that areobserved within the healthy population studied here: these normaldata need to be taken into consideration when interpreting oculo-motor behaviours in clinical groups.
Most importantly both the saccadic and the smooth-pursuitmeasures were very reliable within testing sessions and werestable between sessions – a stability that is required if oculomotormeasures are to be used as endophenotypes. The present resultsreplicate, and in many cases improve on, the high reliability ofindividual oculomotor measures reported in the literature(Ettinger et al., 2003; Iacono & Lykken, 1981; Klein & Fischer,2005). Our main-sequence measure (peak velocity versus ampli-tude) shows the greatest increase in reliability in comparison toprevious studies (Boghen, Troost, Daroff, Dell’Osso, & Birkett,1974; Bollen et al., 1993; Versino, Castelnovo, Bergamaschi,Romani, & Cosi, 1992). The largest of these studies had 58 partici-pants (Bollen et al., 1993), but had a very low test–retest reliabilitywith an ICC of 0.23 for the slope of the log peak velocity versus logamplitude. Our improved reliability may reflect sampling rate(1000 Hz vs 200 Hz) or the fitting procedure (Bahill et al., 1982;Lebedev et al., 1996).
G. Bargary et al. / Vision Research 141 (2017) 157–169 167
We extracted several measures for which there are no previousestimates of test–retest reliability, such as saccadic overshoots/undershoots, smooth-pursuit pre-saccadic acceleration, left-rightasymmetry of latency, and the parameters of Carpenter’s LATERmodel (Carpenter, 1981). These measures also proved to havemoderate to high test–retest reliability.
4.2. Sex differences
More than half of our measures exhibit significant sex differ-ences, some of them substantial (Table 2): thus women show over10% more dynamic overshoots in the pro-saccade task and show an18% higher mean RMS error for smooth pursuit. We observed lowerrates in women of catch-up saccades in smooth pursuit, a resultthat is in the opposite direction to the finding of Lenzenwegerand O’Driscoll (2006). The discrepancy is likely to arise in part froma difference in the definition of catch-up saccades (Smyrnis, 2008).Lenzenweger and O’Driscoll defined catch-up saccades as any sac-cade that was preceded and followed by pursuit gain and was <5�in amplitude, whereas our criterion was based on positional error:if the saccade decreased positional error it was defined as a catch-up saccade and if it increased it (and was >1.5�) it was defined as ananticipatory saccade.
Our finding of shorter pro-saccade latency in males is in agree-ment with earlier studies (Ettinger et al., 2004; Ettinger et al.,2005). It is curious that males also make fewer errors in the anti-saccade task (see Table 2): in competition models, such as that ofCutsuridis, Smyrnis, Evdokmds, and Perantonis (2007), faster pro-saccades should lead to higher error rates. The male superiorityin the anti-saccade task does not seem to due to a speed-errortrade off, even though within each sex such a trade-off may bepresent.
We should add one note of caution with regard to sex differ-ences in this and other studies. A study explicitly directed at sexdifferences in any behavioural trait ought to sample randomlyfrom the total male and female membership of a specific popula-tion. Otherwise there is always the possibility that males andfemales are not equated with respect to some relevant, but uniden-tified, factor. Such random sampling from the full parent popula-tion is rarely achieved, even in studies explicitly designed toexamine sex differences. The men and women in the present sam-ple were drawn from a relatively homogeneous Cambridge popula-tion, but there is always the possibility that they differ statisticallyin some factor other than sex.
4.3. Personality
Since there are large individual differences in most oculomotormeasures, and since the movements of the eyes are thought toreflect central processes of decision and control, it is plausible toask whether the individual variations are related to conventionalmeasures of personality. Selecting healthy participants who hadeither very high or very low scores on the Eysenck extraversionscale, Nguyen, Mattingley, and Abel (2008) found that extravertsmade more errors on an anti-saccade task.
In the present study, we found significant relationships ofextraversion with the variability of saccadic latencies and withRMSE for smooth pursuit. Although the sizes of the correlationsare modest – it is the large size of our sample that allows us todetect them – it is notable that significant relationships emergebetween objectively measured eye-movement behaviour andresponses to a very brief, self-report questionnaire completed ona separate occasion. To place the results in context, consider thatsmooth-pursuit RMSE accounts for a fraction of the variance inextraversion that is of a similar order to the fraction of varianceaccounted for by one of the strongest relationships between a
known gene and a personality measure – that between diplotypesof the gene for neuropeptide Y and measures of neuroticism (Zhouet al., 2008).
Abnormalities of gaze towards social stimuli are unquestion-ably present in persons with autism (e.g. Klin, Jones, Schultz,Volkmar, & Cohen, 2002), but abnormalities have also beenreported on non-social oculomotor tasks, particularly smooth pur-suit and anti-saccade tasks (e.g. Johnson, Lum, Rinehart, & Fielding,2016; Takarae, Minshew, Luna, Krisky, & Sweeney, 2004). It isinteresting therefore to record that within our (largely student)population, there were no significant correlations between eye-movement measures and AQ.
4.4. Saccades and smooth pursuit
Saccades and smooth pursuit are the two principal types ofvisually guided eye movements. Saccades serve to bring objectsof interest on to the fovea, whereas pursuit movements maintaintargets on the fovea when the stimulus or the observer is moving.The input to the saccadic subsystem is traditionally taken to be aposition signal whereas the input to the pursuit subsystem is amotion signal. These two types of signal are likely to be extractedby different sensory processes – position by a ventral system andmotion by directionally selective units early in the visual pathwaythat feed into the Medial Temporal area of the cortex and the dor-sal stream (Carpenter, 1988).
This is the first time measures of pro-saccades, of anti-saccadesand of ocular tracking have been included in a factor analysis ofindividual differences in eye movements; and it is instructive thata set of measures from the smooth-pursuit task proved to bestrongly correlated with one another and that they were correlatedless strongly with other eye-movement measures (anti-saccadeerror rate is an exception). This result is consistent with classicalevidence, from pathology, pharmacology and single-unit electro-physiology (Cogan, 1952; Rashbass, 1959; Rashbass, 1961; Thier& Ilg, 2005), that saccades and ocular tracking depend on separateneural subsystems. Petit and Haxby (1999), in an fMRI study reportthat different sub-regions of the frontal eye fields are activated bythe two types of eye movement.
However, Orban de Xivry and Lefevre (2007) have pointed outthat the smooth-pursuit system needs to collaborate with the sac-cadic system in order to improve tracking of a target that moves inan unpredictable way. Thus, when a target begins to move andbefore the pursuit motion has started, the oculomotor system gen-erates a saccade to compensate for the increasing position error.Similarly, if the gain of the pursuit is not sufficient to track arapidly moving target, catch-up saccades are generated. In ourown factor analysis, it is not only the gain of the pursuit itself thatis heavily weighted on the first factor but also measures of antici-patory and catch-up saccades. And it is not that participants withlow gain make more catch-up saccades: rather, those with a gaincloser to unity have more catch-up saccades. So our preference isto identify this factor not with a type of eye movement nor witha distinct neural subsystem, but with a type of task, that of trackinga moving target.
The second factor to emerge from our analysis is identified withlatency, both saccadic and smooth-pursuit latency. This factor mayin part reflect individual differences in central decision mecha-nisms (Carpenter, 1981).
4.5. An oculomotor signature?
Whereas there were high correlations between certain pairs ofeye-movement measures, many correlations between other pairsof measures were low. Since the several measures are individuallyvery reliable and since they are relatively uncorrelated, a set of
168 G. Bargary et al. / Vision Research 141 (2017) 157–169
eye-movement measures – such as those of the present battery –provide a robust signature for a particular individual. Certainlythe oculomotor signature is specific enough that it might serve todetect changes in health of an individual (e.g. Antoniades, Xu,Mason, Carpenter, & Barker, 2010; Cunniffe et al., 2015; Dawsonet al., 2011).
In the near future, telephones and personal computing devicesare likely to incorporate eye-movement recorders, to allow usersto control functions by oculomotor gestures. In these, and otherdomains, could standard eye-movement measures be used foridentification? This question has been actively raised in the bio-metric literature (e.g. Juhola, Zhang, & Rasku, 2013; Komogortsevet al., 2016). The procedures of the present normative study werenot of course designed for routine biometric use: they required aminimum of 20 min of testing and repeated calibration duringthe testing session. But the biometric potential of oculomotor mea-sures is certainly demonstrated by the high reliabilities weobtained Measures selected from the present set might be usefullycombined with other oculomotor measures. For example, the inter-val between micro-saccades during fixation is an individual char-acteristic that is stable for at least a year (Filin, 2002; Filin,Sidorov, Ananin, & Zagorodnikova, 1973) and the precision andduration of a person’s fixations are correlated across different tasks(Poynter et al., 2013). Individuals may also be characterised bytheir scan pattern and their predominant direction of eye move-ment when they freely view a complex static or dynamic scene(Buswell, 1935).
One interesting recent approach in the biometric literature hasbeen to use not the raw properties of a person’s saccades but theinferred properties of their oculomotor plant (Komogortsev et al.,2012). In general, however, it is not well understood why there issuch rich variation among people in how they move their eyes,and it is curious that the question has not often been systemati-cally explored outside the non-biometric literature. Many stagesin the processing hierarchy could contribute to the variation: forexample, differences in sensory processing, e.g. in the detectionof transients or of motion (Wilmer & Nakayama, 2007); differencesin central decision making, as emphasised in the LATER model(Carpenter, Reddi, & Anderson, 2009); differences in the propertiesor connectivities of motor centres; differences in muscle tissue;and differences in mechanical factors such as the structure of theorbit and the size and shape of the eyeball. Nor is it yet understoodhow far the individual differences arise from differences in experi-ence, and how far from genetic differences. The rapid advances ingenetic technologies and their application to eye movements willshed light on the source and nature of the variability. What is clearis that a very personal signature is embedded in the eye move-ments that each of us make.
Acknowledgments
This research was funded by the Gatsby Charitable Foundation(GAT2903). PTG was supported by the Cambridge Commonwealthand Overseas Trusts and the Overseas Research Students AwardsScheme, and JMB by a Research Fellowship at Gonville and CaiusCollege, Cambridge. We thank Professors R. Carpenter and J. Oberfor generous guidance.
References
Antoniades, C. A., Xu, Z., Mason, S. L., Carpenter, R. H., & Barker, R. A. (2010).Huntington’s disease: Changes in saccades and hand-tapping over 3 years.Journal of Neurology, 257(11), 1890–1898.
Bahill, A. T., Clark, M. R., & Stark, L. (1975). The main sequence, a tool for studyinghuman eye movements. Mathematical Biosciences, 24(3–4), 191–204.
Bahill, A. T., Kallman, J. S., & Lieberman, J. E. (1982). Frequency limitations of thetwo-point central difference differentiation algorithm. Biological Cybernetics, 45(1), 1–4.
Bahill, A. T., & Stark, L. (1975). Overlapping saccades and glissades are produced byfatigue in the saccadic eye movement system. Experimental Neurology, 48(1),95–106.
Baron-Cohen, S., Wheelwright, S., Skinner, R., Martin, J., & Clubley, E. (2001). Theautism-spectrum quotient (AQ): Evidence from Asperger syndrome/high-functioning autism, males and females, scientists and mathematicians. Journalof Autism and Developmental Disorders, 31(1), 5–17.
Boghen, D., Troost, B. T., Daroff, R. B., Dell’Osso, L. F., & Birkett, J. E. (1974). Velocitycharacteristics of normal human saccades. Investigative Ophthalmology, 13(8),619–623.
Bollen, E., Bax, J., van Dijk, J. G., Koning, M., Bos, J. E., Kramer, C. G., & van der Velde,E. A. (1993). Variability of the main sequence. Investigative Ophthalmology &Visual Science, 34(13), 3700–3704.
Bosten, J. M., Goodbourn, P. T., Lawrance-Owen, A. J., Bargary, G., Hogg, R. E., &Mollon, J. D. (2015). A population study of binocular function. Vision Research,110(Pt A), 34–50.
Box, G. E. P., & Cox, D. R. (1964). An analysis of transformations. Journal of the RoyalStatistical Society. Series B (Methodological), 26(2), 211–252.
Buswell, G. T. (1935). How People Look at Pictures. A Study of the Psychology ofPerception in Art [With illustrations.] ((p. 8�.): pp. xv. 198). Chicago: Universityof Chicago Press.
Carl, J. R., & Gellman, R. S. (1987). Human smooth pursuit: Stimulus-dependentresponses. Journal of Neurophysiology, 57(5), 1446–1463.
Carpenter, R. H. S. (1988). Movement of the Eyes. London: Pion.Carpenter, R. H. S. (2004). The saccadic system: A neurological microcosm. Advances
in Clinical Neuroscience and Rehabilitation, 4, 6–8.Carpenter, R. H. S. (1981). Oculomotor procrastination. In D. F. Fisher, R. A. Monty, &
J. W. Senders (Eds.), Eye Movements: Cognition and Visual Perception(pp. 237–246). Hillsdale: Lawrence Erlbaum.
Carpenter, R. H., Reddi, B. A., & Anderson, A. J. (2009). A simple two-stage modelpredicts response time distributions. The Journal of Physiology, 587(Pt 16),4051–4062.
Cogan, D. G. (1952). A type of congenital ocular motor apraxia presenting jerky headmovements. American Academy of Ophthalmology and Otolaryngology, 56(6),853–862.
Constantinidis, T. S., Smyrnis, N., Evdokimidis, I., Stefanis, N. C., Avramopoulos, D.,Giouzelis, I., & Stefanis, C. N. (2003). Effects of direction on saccadic performancein relation to lateral preferences. Experimental Brain Research, 150(4), 443–448.
Costa, P. T., & McCrae, R. R. (1992). NEO-PI-R Professional Manual. Odessa, Fl:Psychol. Assess. Resources.
Crawford, T. J., Sharma, T., Puri, B. K., Murray, R. M., Berridge, D. M., & Lewis, S. W.(1998). Saccadic eye movements in families multiply affected withschizophrenia: The Maudsley family study. American Journal of Psychiatry, 155(12), 1703–1710.
Cunniffe, N., Munby, H., Chan, S. N., Saatci, D., Edison, E., Carpenter, R. H. S., &Massey, D. (2015). Using saccades to diagnose covert hepatic encephalopathy.Metabolic Brain Disease, 30(3), 821–828.
Cutsuridis, V., Smyrnis, N., Evdokmds, L., & Perantonis, S. (2007). A neural model ofdecision-making by the superior colicullus in an antisaccade task. NeuralNetworks, 20(6), 690–704.
Damilou, A., Apostolakis, S., Thrapsanioti, E., Theleritis, C., & Smyrnis, N. (2016).Shared and distinct oculomotor function deficits in schizophrenia and obsessivecompulsive disorder. Psychophysiology, 53(6), 796–805.
Dawson, C., Murphy, E., Maritz, C., Chan, H., Ellerton, C., Carpenter, R. H. S., &Lachmann, R. H. (2011). Dietary treatment of phenylketonuria: The effect ofphenylalanine on reaction time. Journal of Inherited Metabolic Disease, 34(2),449–454.
Diefendorf, A. R., & Dodge, R. (1908). An experimental study of the ocular reactionsof the insane from photographic records. Brain, 31(3), 451–489.
Donnellan, M. B., Oswald, F. L., Baird, B. M., & Lucas, R. E. (2006). The mini-IPIPscales: Tiny-yet-effective measures of the big five factors of personality.Psychological Assessment, 18(2), 192–203.
Ettinger, U., Antonova, E., Crawford, T. J., Mitterschiffthaler, M. T., Goswani, S.,Sharma, T., & Kumari, V. (2005). Structural neural correlates of prosaccade andantisaccade eye movements in healthy humans. NeuroImage, 24(2), 487–494.
Ettinger, U., Kumari, V., Crawford, T. J., Corr, P. J., Das, M., Zachariah, E., ... Sharma, T.(2004). Smooth pursuit and antisaccade eye movements in siblings discordantfor schizophrenia. Journal of Psychiatric Research, 38(2), 177–184.
Ettinger, U., Kumari, V., Crawford, T. J., Davis, R. E., Sharma, T., & Corr, P. J. (2003).Reliability of smooth pursuit, fixation, and saccadic eye movements.Psychophysiology, 40(4), 620–628.
Evdokimidis, I., Smyrnis, N., Constantinidis, T. S., Stefanis, N. C., Avramopoulos, D.,Paximadis, C., ... Stefanis, C. N. (2002). The antisaccade task in a sample of 2,006young men. I. Normal population characteristics. Experimental Brain Research.Experimentelle Hirnforschung. Experimentation Cerebrale, 147(1), 45–52.
Filin, V. A. (2002). Avtomatia Sakkad. Moscow: Moscow University Press.Filin, V. A., Sidorov, S. P., Ananin, V. F., & Zagorodnikova, T. N. (1973). Individual’nye
razlichija microdvizhenij glaz pri fiksacii tochki [Individual differences inmicromovements of eyes during fixation of a point]. Zhurnal Vysshei NervnoiDeyatelnosti Imeni I P Pavlova, 23(5), 995–1002.
Fischer, B., Biscaldi, M., & Gezeck, S. (1997). On the development of voluntary andreflexive components in human saccade generation. Brain Research, 754(1–2),285–297.

G. Bargary et al. / Vision Research 141 (2017) 157–169 169
Friedman, L., Jesberger, J. A., & Meltzer, H. Y. (1991). A model of smooth pursuitperformance illustrates the relationship between gain, catch-up saccade rate,and catch-up saccade amplitude in normal controls and patients withSchizophrenia. Biological Psychiatry, 30(6), 537–556.
Fukushima, J., Fukushima, K., Chiba, T., Tanaka, S., Yamashita, I., & Kato, M. (1988).Disturbances of voluntary control of saccadic eye movements in schizophrenicpatients. Biological Psychiatry, 23(7), 670–677.
Fukushima, J., Fukushima, K., Morita, N., & Yamashita, I. (1990). Further analysis ofthe control of voluntary saccadic eye movements in schizophrenic patients.Biological Psychiatry, 28(11), 943–958.
Goodbourn, P. T., Bosten, J. M., Hogg, R. E., Bargary, G., Lawrance-Owen, A. J., &Mollon, J. D. (2012). Do different ‘magnocellular tasks’ probe the same neuralsubstrate? Proceedings of the Royal Society B-Biological Sciences, 279(1745),4263–4271.
Gottesman, I. I., & Gould, T. D. (2003). The endophenotype concept in psychiatry:Etymology and strategic intentions. American Journal of Psychiatry, 160(4),636–645.
Hallett, P. E. (1978). Primary and secondary saccades to goals defined byinstructions. Vision Research, 18(10), 1279–1296.
Hutton, S. B., & Ettinger, U. (2006). The antisaccade task as a research tool inpsychopathology: A critical review. Psychophysiology, 43(3), 302–313.
Iacono, W. G., & Lykken, D. T. (1981). Two-year retest stability of eye trackingperformance and a comparison of electro-oculographic and infrared recordingtechniques: Evidence of EEG in the electro-oculogram. Psychophysiology, 18(1),49–55.
Johnson, B. P., Lum, J. A., Rinehart, N. J., & Fielding, J. (2016). Ocular motordisturbances in autism spectrum disorders: Systematic review andcomprehensive meta-analysis. Neuroscience and Biobehavioral Reviews, 69,260–279.
Jolliffe, I. T. (2002). Principal Component Analysis (p. 500). Berlin; London: Springer.Juhola, M., Zhang, Y. M., & Rasku, J. (2013). Biometric verification of a subject
through eye movements. Computers in Biology and Medicine, 43(1), 42–50.Kasprowski, P., & Ober, J. (2004). Eye movements in biometrics. In D. Maltoni & A.
Jain (Eds.), Lecture Notes in Computer Science (pp. 248–258). Berlin/Heidelberg:Springer. 3087.
Katsanis, J., Taylor, J., Iacono, W. G., & Hammer, M. A. (2000). Heritability of differentmeasures of smooth pursuit eye tracking dysfunction: A study of normal twins.Psychophysiology, 37(6), 724–730.
Klein, C., & Ettinger, U. (2008). A hundred years of eye movement research inpsychiatry. Brain and Cognition, 68(3), 215–218.
Klein, C., & Fischer, B. (2005). Instrumental and test-retest reliability of saccadicmeasures. Biological Psychology, 68(3), 201–213.
Klin, A., Jones, W., Schultz, R., Volkmar, F., & Cohen, D. (2002). Visual fixationpatterns during viewing of naturalistic social situations as predictors of socialcompetence in individuals with autism. Archives of General Psychiatry, 59(9),809–816.
Kolesnikova, O. V., Tereshchenko, L. V., Latanov, A. V., & Shulgovskii, V. V. (2010).Effects of visual environment complexity on saccade performance in humanswith different functional asymmetry profiles. Neuroscience and BehavioralPhysiology, 40, 869–876.
Komogortsev, O. V., Karpov, A., Price, L. R., & Aragon, C. (2012). Biometricauthentication via oculomotor plant characteristics. 2012 5th IAPRInternational Conference on Biometrics (ICB) (pp. 413–420): IEEE.
Komogortsev, O., Karpov, A., & Holland, C. (2016). Oculomotor plant characteristics:The effects of environment and stimulus. IEEE Transactions on InformationForensics and Security, 11(3), 621–632.
Lasker, A. G., & Zee, D. S. (1997). Ocular motor abnormalities in Huntington’sdisease. Vision Research, 37(24), 3639–3645.
Lebedev, S., Van Gelder, P., & Tsui, W. H. (1996). Square-root relations between mainsaccadic parameters. Investigative Ophthalmology & Visual Science, 37(13),2750–2758.
Leigh, R. J., & Kennard, C. (2004). Using saccades as a research tool in the clinicalneurosciences. Brain: A Journal of Neurology, 127(Pt 3), 460–477.
Leigh, R. J., & Zee, D. S. (2015). The Neurology of Eye Movements. Oxford: OUP.Lenzenweger, M. F., & O’Driscoll, G. A. (2006). Smooth pursuit eye movement and
schizotypy in the community. Journal of Abnormal Psychology, 115(4), 779–786.Levy, D. L., Holzman, P. S., Matthysse, S., & Mendell, N. R. (1993). Eye tracking
dysfunction and schizophrenia: a critical perspective. Schizophrenia Bulletin, 19(3), 461–536.
Loehlin, J. C. (2004). Latent Variable Models: An Introduction to Factor, Path, andStructural Equation Analysis (p. xi). Mahwah, N.J.; London: Lawrence ErlbaumAssociates. 317p.
Meyhofer, I., Bertsch, K., Esser, M., & Ettinger, U. (2016). Variance in saccadic eyemovements reflects stable traits. Psychophysiology, 53(4), 566–578.
Miles, W. (1929). Ocular dominance demonstrated by unconscious sighting. Journalof Experimental Psychology, 12, 113–126.
Nguyen, H. N., Mattingley, J. B., & Abel, L. A. (2008). Extraversion degradesperformance on the antisaccade task. Brain Research, 1231, 81–85.
O’Driscoll, G. A., & Callahan, B. L. (2008). Smooth pursuit in schizophrenia: A meta-analytic review of research since 1993. Brain and Cognition, 68(3), 359–370.
Orban de Xivry, J. J., & Lefevre, P. (2007). Saccades and pursuit: Two outcomes of asingle sensorimotor process. The Journal of Physiology, 584(Pt 1), 11–23.
Perneczky, R., Ghosh, B. C., Hughes, L., Carpenter, R. H., Barker, R. A., & Rowe, J. B.(2011). Saccadic latency in Parkinson’s disease correlates with executivefunction and brain atrophy, but not motor severity. Neurobiology of Disease,43(1), 79–85.
Petit, L., & Haxby, J. V. (1999). Functional anatomy of pursuit eye movements inhumans as revealed by fMRI. Journal of Neurophysiology, 82(1), 463–471.
Pirozzolo, F. J., & Rayner, K. (1980). Handedness, hemispheric-specialization andsaccadic eye-movement latencies. Neuropsychologia, 18(2), 225–229.
Poynter, W., Barber, M., Inman, J., & Wiggins, C. (2013). Individuals exhibitidiosyncratic eye-movement behavior profiles across tasks. Vision Research,89, 32–38.
Radant, A. D., & Hommer, D. W. (1992). A quantitative analysis of saccades andsmooth pursuit during visual pursuit tracking. A comparison of schizophrenicswith normals and substance abusing controls. Schizophrenia Research, 6(3),225–235.
Rashbass, C. (1959). Barbiturate nystagmus and the mechanisms of visual fixation.Nature, 183(4665), 897–898.
Rashbass, C. (1961). The relationship between saccadic and smooth tracking eyemovements. The Journal of physiology, 159, 326–338.
Smyrnis, N. (2008). Metric issues in the study of eye movements in psychiatry. Brainand Cognition, 68(3), 341–358.
Takarae, Y., Minshew, N. J., Luna, B., Krisky, C. M., & Sweeney, J. A. (2004). Pursuiteye movement deficits in autism. Brain, 127(Pt 12), 2584–2594.
Thier, P., & Ilg, U. J. (2005). The neural basis of smooth-pursuit eye movements.Current Opinion in Neurobiology, 15(6), 645–652.
Vergilino-Perez, D., Fayel, A., Lemoine, C., Senot, P., Vergne, J., & Dore-Mazars, K.(2012). Are there any left-right asymmetries in saccade parameters?Examination of latency, gain, and peak velocity. Investigative Ophthalmology &Visual Science, 53(7), 3340–3348.
Verhallen, R. J., Bosten, J. M., Goodbourn, P. T., Lawrance-Owen, A. J., Bargary, G., &Mollon, J. D. (2017). The oxytocin receptor gene (OXTR) and face recognition.Psychological Science, 28(1), 47–55.
Versino, M., Castelnovo, G., Bergamaschi, R., Romani, A., & Cosi, V. (1992). Thereliability of eye movement quantitative evaluation. I. Saccadic eye movements.Bollettino Della Societa Italiana Di Biologia Sperimentale, 68(6), 387–394.
Vikesdal, G. H., & Langaas, T. (2016). Saccade latency and fixation stability:Repeatability and reliability. Journal of Eye Movement Research, 9(2).
Weber, H., & Fischer, B. (1995). Gap duration and location of attention focusmodulate the occurrence of left/right asymmetries in the saccadic reactiontimes of human subjects. Vision Research, 35(7), 987–998.
Wilmer, J. B. (2008). How to use individual differences to isolate functionalorganization, biology, and utility of visual functions; with illustrative proposalsfor stereopsis. Spatial Vision, 21(6), 561–579.
Wilmer, J. B., & Nakayama, K. (2007). Two distinct visual motion mechanisms forsmooth pursuit: Evidence from individual differences. Neuron, 54(6), 987–1000.
Wostmann, N. M., Aichert, D. S., Costa, A., Rubia, K., Moller, H. J., & Ettinger, U.(2013). Reliability and plasticity of response inhibition and interference control.Brain and Cognition, 81(1), 82–94.
Zanelli, J., Simon, H., Rabe-Hesketh, S., Walshe, M., McDonald, C., Murray, R. M., &MacCabe, J. H. (2005). Eye tracking in schizophrenia: Does the antisaccade taskmeasure anything that the smooth pursuit task does not? Psychiatry Research,136(2–3), 181–188.
Zhang, Y. M., Laurikkala, J., & Juhola, M. (2015). Biometric verification with eyemovements: Results from a long-term recording series. IET Biometrics, 4(3),162–168.
Zhou, Z., Zhu, G., Hariri, A. R., Enoch, M. A., Scott, D., Sinha, R., ... Goldman, D. (2008).Genetic variation in human NPY expression affects stress response and emotion.Nature, 452(7190), 997–1001.