individual account investment options and portfolio choice
TRANSCRIPT
m/locate/econbase
Journal of Public Economics 91 (2007) 1992–2013www.elsevier.co
Individual account investment options and portfoliochoice: Behavioral lessons from 401(k) plans
Jeffrey R. Brown a, Nellie Liang b, Scott Weisbenner a,⁎
a University of Illinois at Urbana-Champaign and NBER, United Statesb Federal Reserve Board of Governors, United States
Received 2 October 2006; received in revised form 29 March 2007; accepted 30 March 2007Available online 12 April 2007
Abstract
This paper examines how the menu of investment options made available to workers in definedcontribution plans influences portfolio choice. Using unique panel data of 401(k) plans in the U.S., wepresent three principle findings. First, we show that the share of investment options in a particular assetclass (i.e., company stock, equities, fixed income, and balanced funds) has a significant effect on aggregateparticipant portfolio allocations across these asset classes. Second, we document that the vast majority ofthe new funds added to 401(k) plans are high-cost actively-managed equity funds, as opposed to lower-costequity index funds. Third, because the average share of assets invested in low-cost equity index fundsdeclines with an increase in the number of options, average portfolio expenses increase and averageportfolio performance is thus depressed. All of these findings are obtained from a panel data set, enabling usto control for heterogeneity in the investment preferences of workers across firms and across time.© 2007 Elsevier B.V. All rights reserved.
Keywords: Portfolio choice; Behavioral finance; Pension plans
1. Introduction
Over two dozen countries around the world now include individual investment accounts aspart of their public pension systems. Other countries, notably including the U.S., are alsoconsidering reforms that would allow individuals to directly invest part of their Social Securitycontributions in individual accounts. A key issue in designing such a program is determining whatinvestment choices to offer individual participants. The simplest portfolio theory suggests that it is
⁎ Corresponding author.E-mail address: [email protected] (S. Weisbenner).
0047-2727/$ - see front matter © 2007 Elsevier B.V. All rights reserved.doi:10.1016/j.jpubeco.2007.03.012

1993J.R. Brown et al. / Journal of Public Economics 91 (2007) 1992–2013
sufficient to provide a choice consisting of one portfolio of risky assets – the market portfolio –and one risk-free asset, and then to allow individuals to mix these two portfolios in accordancewith their individual risk preferences. Most public and private plans in the U.S. and abroad,however, provide a large number and broad range of choices. For example, in the U.S., the vastmajority of private sector defined contribution pension plans offer multiple investment options,often allowing individuals to choose from among several equity, bond, market and balanced fundoptions. Individuals also have thousands of mutual funds to choose from when allocating theirnon-pension portfolios. In Sweden, the Social Security system provides participants a menu ofinvestment options that includes over 650 funds from which to choose.
The central question of this paper is whether the mix of investment options available toparticipants in an individual accounts program matters for portfolio allocation. In particular, weare interested in the “behavioral” response to the selection of fund options, over and above any“mechanical” link by which we mean changes that flow directly from adding or relaxing a bindingconstraint. For example, suppose an individual is prohibited from owning a particular asset class.It is clearly the case that this constraint will alter their portfolio choice if, in the absence of theconstraint, the individual would have invested in this asset class. Instead, our focus is on the“behavioral” response, which might occur when a change in the menu of investment options leadsto a large change in asset allocation, even though the investment opportunity set has notsignificantly changed. For example, imagine that an investor, faced with a choice between adiversified stock fund and a diversified bond fund, chose to allocate 50% of her portfolio to eachfund. If this individual were provided a second diversified stock fund as a third investmentalternative, then the overall investment opportunity set of this individual has not substantiallychanged because the additional stock fund is largely redundant of the first. In this case, standardportfolio theory suggests that this individual's optimal allocation would still be close to 50%bonds and 50% stocks.
A growing body of evidence suggests, however, that many individual portfolio decisions maybe influenced by plan design. For example, Benartzi and Thaler (2001) suggest that many peoplefollow a “naïve” diversification strategy, such as evenly dividing contributions across all availableassets (e.g., a “1 /n” strategy). If this is the case, then simply changing the relative number of stockand bond funds may alter the allocation of an investor's portfolio between stocks and bonds. Ifpeople behave in this way, then firm managers or policymakers who are charged with determiningthe set of investment options to make available to participants in a corporate or governmentindividual accounts program should consider how the choice of fund options will influenceindividual portfolio allocations.
The private pension system in the U.S. – in particular, 401(k) plans, which are now the singlemost common private pension in the U.S. – provides a useful research laboratory with which tolearn about these issues. Because plan sponsors have significant leeway in choosing whichinvestment options to make available, there is considerable time series and cross-sectionalvariation in the set of investment opportunities facing 401(k) participants. Using a rich panel dataset on fund options and fund contributions to 401(k) plans during the 1990s, we examine severalissues in this paper related to how the structure of investment options within a plan affectsparticipant diversification. Unlike past work in this area that focuses on cross-sectional analyses,we are able to exploit the panel nature of our data to control for differences in the investmentpreferences of workers across firms and over time to better identify the effect of a change in 401(k)plan characteristics on participant behavior.
We focus primarily on how the set of investment alternatives affects portfolio diversification.While some prior research has suggested that overall portfolio diversification is affected by the
1994 J.R. Brown et al. / Journal of Public Economics 91 (2007) 1992–2013
menu of options (Benartzi and Thaler, 2001), Huberman and Jiang (2006) highlight some of thedifficulties in making inferences about individual behavior based on plan level data. For example,even if there is evidence at the plan level that contributions are divided roughly evenly across planoptions, this could be because individuals are each following a 1 /n strategy, 1 /n of the individualsare each concentrating their portfolio in one option, or other intermediate combinations.Nonetheless, in considering the set of investment options to make available to individuals througha large national pension system, the effect of the plan choice set on aggregate portfolio allocations isof substantial interest.
Our data allow us to do a more comprehensive examination of plan level portfolio responsesboth within and across multiple asset classes over many years. We find evidence that theallocation of contributions is significantly affected by the number and mix of investment optionsavailable, even after accounting for plan-level fixed effects. For example, our estimates suggestthat by increasing the share of equity funds from 1 /3 to 1 /2 (such as by adding an additionalequity fund option to a plan that already offers company stock, one equity fund, and one bondfund), overall participant allocations to equity funds increase by 7.5 percentage points. We findsimilar strong effects for allocations to bond funds and balanced funds. Given that the fraction ofequity options in the plan tends to increase substantially and the fraction of bond options tends todecrease substantially as plans offer more options over time, this leads to 401(k) participantstaking on greater risk in their retirement portfolios with their higher equity allocations.
We also address how the composition of actively versus passively managed fund options hasaffected allocation decisions within 401(k) plans. From 1990 to 2003, the number of mutualfunds available to investors in the U.S. rose from 3100 to 8100, with the dramatic growth inactively-managed equity funds (which quadrupled over the period) accounting for nearly 70% ofthe total increase (Investment Company Institute, 2005). Consistent with this, we find the vastmajority of the new funds added to 401(k) plans are also high-cost actively-managed equityfunds as opposed to lower-cost equity index funds. For example, actively-managed equity fundsrepresent nearly 2 / 3 of the new funds added to 401(k) plans in our sample over the period 1998–2002, while index funds represent only 8 percent of the new funds added. This result has strongimplications for the relation between the investment performance of these retirement plans andthe composition and number of fund options provided. For example, we estimate that a movefrom a plan with only index funds to a plan with only actively-managed funds is associated with a35 basis point increase in the annual plan-wide expense ratio paid by participants (as participantsare investing more in higher-cost funds which are much more likely to be added on the margin).Given historically that actively-managed funds do not outperform index funds (even beforeexpenses), these investment patterns (coupled with actively-managed funds being much morelikely to be the marginal fund added to the plan) could result in a nontrivial reduction in resourcesavailable for retirement.
While not the main focus of our paper, we also address the importance of firm-levelheterogeneity and investment restrictions upon the investment behavior of 401(k) participants. Aconcern with any of the past cross-sectional analyses that have documented a strong relationbetween plan parameters and participant decisions is that an omitted factor such as differences ineither the firms or the workers across firms could explain both the design of the 401(k) plan aswell as the workers' investment decisions (e.g., differences in the risk aversion or investmentphilosophy of workers across firms). Ruling out such an alternative explanation is essential foridentifying what role the characteristics of the plan (as opposed to unobserved characteristics ofthe participants of the plan) play in influencing investment decisions and is thus essential forpublic policy purposes.
1995J.R. Brown et al. / Journal of Public Economics 91 (2007) 1992–2013
We present evidence that both plan parameters and firm-level heterogeneity are importantdeterminants of how 401(k) assets are allocated across asset classes. For example, the number ofequity and bond options in the 401(k) plan is an important predictor of contributions to equity andbond funds, respectively, even after accounting for firm-level fixed effects. On the other hand,while both the relation between the number of options in the plan and allocations to companystock and the “endorsement” effect found by Benartzi (2001)1 are very strong in the cross section,they are substantially diminished once firm-specific effects are accounted for in the regression.This suggests that investments in company stock in pension plans appear to be driven in no smallpart by firm-level heterogeneity in the desirability of company stock investment, which manifestsitself both in employee contributions to company stock, how many non-company stock optionsare present in the 401(k) plan, and employer match policy.
This paper proceeds as follows. Section 2 provides background information on the range ofinvestment options offered in selected pension systems around the world, as well as in some U.S.reform proposals. We also review the relevant literature relating to the influence of investmentoptions on portfolio allocation. In Section 3, we describe our data on 401(k) plans and providesome initial summary statistics about the range of investment options available. In Section 4, weprovide evidence on how the number and mix of investment options influences the allocation ofcontributions in 401(k) plans. Section 5 demonstrates how trends in the mutual fund industry overthe past decade such as the explosion of high-cost, actively-managed equity funds have affected401(k) plans and participants. Section 6 concludes with a discussion of policy implications.
2. Background
2.1. Brief overview of range of investment options in public pension plans around the world
Over the past two decades, a large number of countries have incorporated individual accountsinto their public pension systems. These countries span the globe, and include highly developedeconomies of Western Europe, transition economies from the former Soviet Union, anddeveloping countries. A notable exception to this trend is the United States, whose public SocialSecurity program is entirely a traditional pay-as-you-go, defined benefit system. Even in the U.S.,however, proposals to introduce personal accounts as part of, or in addition to, the Social Securitysystem have been forwarded by numerous commissions, think tanks, academics, members ofCongress, and even the President.
The plans that have been implemented around the world, as well as those proposed in the U.S.,vary along many dimensions, including account size, the source of funding, and the degree ofaccess to funds before and during retirement, just to name a few. One particularly importantdifference is the degree of portfolio choice provided to individuals, particularly during the accountaccumulation phase. In general, architects of alternative plans have made different choices whenfaced with the trade-offs between allowing individual choice, ensuring some minimum level ofportfolio diversification, and keeping administrative costs low. As a result, different plans providevery different degrees of choice.
At one end of the spectrum are plans that provide very limited choice. As discussed in a recentsurvey by the GAO, “initially, several countries offered individuals choice among a limited
1 Benartzi (2001) finds that workers in firms where the employer provides a match in company stock tend to invesubstantially more of their own contributions in company stock and attributes this to the workers viewing a firm matchcompany stock as implicit investment advice.
stin
1996 J.R. Brown et al. / Journal of Public Economics 91 (2007) 1992–2013
number of investment options and often restricted the portion of assets that could be invested incertain products, such as publicly traded equities, private equities and foreign securities”(Government Accountability Office, 2005). For example, in Australia as of the late 1990s, theemployer was generally given the authority to select the fund for the workers, and thus mostworkers had minimal choice in how to invest their retirement savings (Congressional BudgetOffice, 1999). Some U.S. reform proposals, such as Rep. Shaw's “Social Security Guarantee PlusAct of 2003,” severely restrict choice. For example, Shaw's plan would require individuals tohold all account assets in a single fund that can be changed at most once per year.2 The defaultoption would be a portfolio allocation of 60% stock index funds and 40% high-grade corporatebond index funds. The only two alternative options simply allow slight deviations in theallocations (65% stock/35% bonds or 70% stock/30% bonds). Another plan that starts out withtight restrictions on choice is the Rep. DeMint's “Social Security Savings Act of 2003,” in whichaccount balances would initially be maintained in a default portfolio with 65% in a specifiedbroad index fund of equities of U.S. corporations and 35% in long-term bonds issued by theFederal government.3
At the other end of the spectrum are plans that provide an extraordinarily wide range of choice.In Sweden, for example, participants are able to choose from a menu of approximately 650 mutualfunds (Palme et al., 2004). However, participants are restricted to selecting at most five fundsfrom this extensive menu (Government Accountability Office, 2005). In the U.S. context, thePersonal Security Account option (commonly referred to as the Schieber/Weaver plan) from the1994–96 Social Security Advisory Council would have allowed virtually unfettered access to abroad universe of private sector investments.
In between these two extremes is a wide range of plans. For example, Mexico now has age-based investment options available. Chile requires each pension administrator to offer four typesof funds with varying degrees of risk, including a higher risk fund and a fixed income fund (GAO,2005). For younger workers, a fifth option (higher risk) is also available.
How does the degree of investment choice affect portfolio behavior? In some cases, the answeris obvious. For example, in the U.S. Shaw proposal mentioned above, individuals are clearlyforced into one of three pre-specified combinations of equities and bonds. In most other cases,however, there are enough choices available that individual decisions about general assetallocations are not restricted. Even in these cases, however, the potential exists for the menu ofinvestment options to influence participant decisions about how to invest their individual accountbalances. For example, if, as the number of investment options rises, the fraction of investmentsthat are in actively-managed equity funds also rises, might this influence overall portfolioallocations?
The objective of this study is to provide empirical evidence on how the menu of investmentoptions offered in an individual accounts system is likely to influence participant portfoliochoices. We will do this by using data on private sector 401(k) plans, which like individualaccount programs around the world, are defined contribution retirement plans that provideparticipants with a specified set of investment options. We can use both the time-series and cross-
2 Details on Rep. Shaw's proposal are taken from the January 7, 2003 memorandum to Rep. Shaw from the SocialSecurity Office of the Chief Actuary “OASDI Financial Effects of the Social Security Guarantee Plus Act of 2003 (H.R.75) — Information.”3 Once the individual account balance reaches a specified level, two additional investments are available — a broad
index of small-cap equities and a broad index of mid-cap equities. Details on Rep. DeMint's proposal are taken from theSeptember 26, 2003 memorandum to Rep. DeMint from the Social Security Office of the Chief Actuary “EstimatedFinancial Effects of H.R. 3177, the Social Security Savings Act of 2003 — Information.”
1997J.R. Brown et al. / Journal of Public Economics 91 (2007) 1992–2013
sectional variation in the number and type of investment options available to employees to learnhow portfolio allocation is influenced by plan parameters. Exploiting such data can help addressthe concern that firm-level differences in worker investment preferences may explain any cross-sectional correlations found. This is an area that has been receiving increased attention in theeconomics literature, which we now briefly review.
2.2. Literature on investment options and portfolio choice
Within a neoclassical economics framework, the number of investment options available to aninvestor should matter only insofar as it alters one's ability to diversify. For example, ifparticipants in a defined contribution account were provided with bond investment options only,and no equity investment options, then their portfolio choices would be constrained in an obviousway. In reality, however, most 401(k) plans do not restrict investments in such an overt way.Rather, the typical 401(k) plan offers participants a range of funds that invest in equities andbonds and allow participants to cover a wide range of the risk/return spectrum. As such, in a worldwhere all participants behave according to standard finance theory, the constraints imposed by thefirm's choice of options are unlikely to have a first order effect on an individual's portfolioallocation across different asset classes.
Nonetheless, more recent “behavioral” research has shown that the composition of investmentoptions selected by an employer can have a significant influence on participant portfolioallocation. For example, Benartzi (2001) and Brown et al. (2006) examine the effect of employer401(k) match policy, and find that when employers restrict individuals to hold employer stock,employees tend to purchase more employer stock in their own accounts, rather than less, as wouldbe predicted by standard portfolio models. Also, Benartzi and Thaler (2001) find evidenceconsistent with employees following “naïve diversification strategies,” i.e., allocating e /n of theircontributions to equities when there are n investment choices available, e of which are equityfunds, while Karlsson et al. (2006) suggest that investors choose assets as a function of the waythey are represented in the menu available to them.
Plan design can influence numerous other behaviors as well. Huberman et al. (2007) show thatthe availability of an employer match increases participation and contributions, especially amonglow-income employees. Samuelson and Zeckhauser (1988) and Ameriks and Zeldes (2001) showthat investors are slow to rebalance portfolios, which can lead to allocations of total holdings thatlook very different than allocations of contributions. Madrian and Shea (2001), Agnew et al.(2003), and Choi et al. (2004a) document the importance of plan design and employee inertia asthey show that many new plan participants invest in the plan's default investment option and areslow to move out of that option for potentially higher-return assets. Agnew and Szykman (2005)also provide evidence that individuals with below average financial knowledge become“overwhelmed” by making investment decisions.
3. Data
3.1. Data source
The primary source of data for this project is 401(k) plan level financial data from the 1990s.This rich source of data is compiled by hand from 11-k filings with the SEC, which a companyfiles when it provides an option to invest in company stock that is deemed an offering ofsecurities. From these filings, we collect information about the number and type of investment
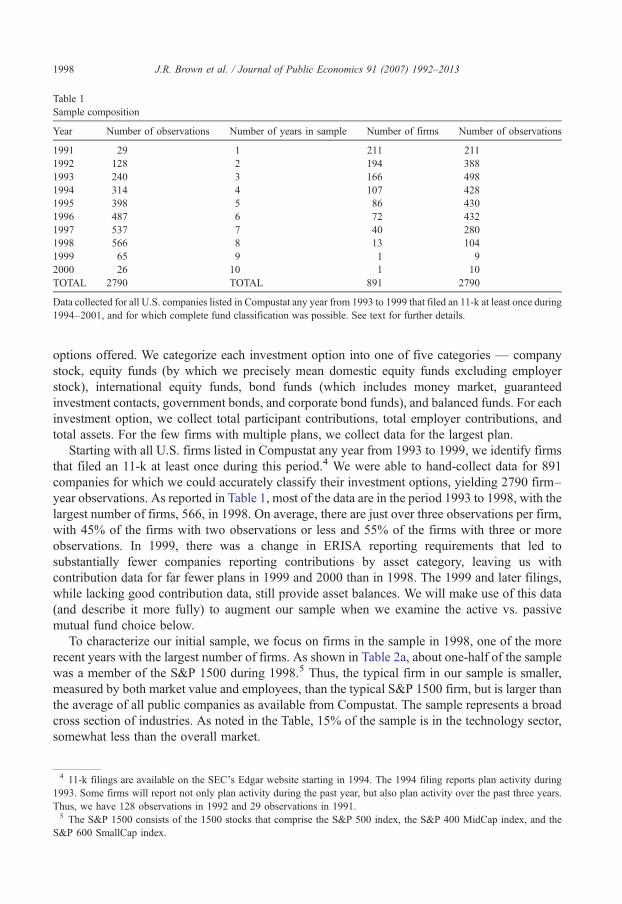
Table 1Sample composition
Year Number of observations Number of years in sample Number of firms Number of observations
1991 29 1 211 2111992 128 2 194 3881993 240 3 166 4981994 314 4 107 4281995 398 5 86 4301996 487 6 72 4321997 537 7 40 2801998 566 8 13 1041999 65 9 1 92000 26 10 1 10TOTAL 2790 TOTAL 891 2790
Data collected for all U.S. companies listed in Compustat any year from 1993 to 1999 that filed an 11-k at least once during1994–2001, and for which complete fund classification was possible. See text for further details.
1998 J.R. Brown et al. / Journal of Public Economics 91 (2007) 1992–2013
options offered. We categorize each investment option into one of five categories — companystock, equity funds (by which we precisely mean domestic equity funds excluding employerstock), international equity funds, bond funds (which includes money market, guaranteedinvestment contacts, government bonds, and corporate bond funds), and balanced funds. For eachinvestment option, we collect total participant contributions, total employer contributions, andtotal assets. For the few firms with multiple plans, we collect data for the largest plan.
Starting with all U.S. firms listed in Compustat any year from 1993 to 1999, we identify firmsthat filed an 11-k at least once during this period.4 We were able to hand-collect data for 891companies for which we could accurately classify their investment options, yielding 2790 firm–year observations. As reported in Table 1, most of the data are in the period 1993 to 1998, with thelargest number of firms, 566, in 1998. On average, there are just over three observations per firm,with 45% of the firms with two observations or less and 55% of the firms with three or moreobservations. In 1999, there was a change in ERISA reporting requirements that led tosubstantially fewer companies reporting contributions by asset category, leaving us withcontribution data for far fewer plans in 1999 and 2000 than in 1998. The 1999 and later filings,while lacking good contribution data, still provide asset balances. We will make use of this data(and describe it more fully) to augment our sample when we examine the active vs. passivemutual fund choice below.
To characterize our initial sample, we focus on firms in the sample in 1998, one of the morerecent years with the largest number of firms. As shown in Table 2a, about one-half of the samplewas a member of the S&P 1500 during 1998.5 Thus, the typical firm in our sample is smaller,measured by both market value and employees, than the typical S&P 1500 firm, but is larger thanthe average of all public companies as available from Compustat. The sample represents a broadcross section of industries. As noted in the Table, 15% of the sample is in the technology sector,somewhat less than the overall market.
4 11-k filings are available on the SEC's Edgar website starting in 1994. The 1994 filing reports plan activity during1993. Some firms will report not only plan activity during the past year, but also plan activity over the past three years.Thus, we have 128 observations in 1992 and 29 observations in 1991.5 The S&P 1500 consists of the 1500 stocks that comprise the S&P 500 index, the S&P 400 MidCap index, and the
S&P 600 SmallCap index.
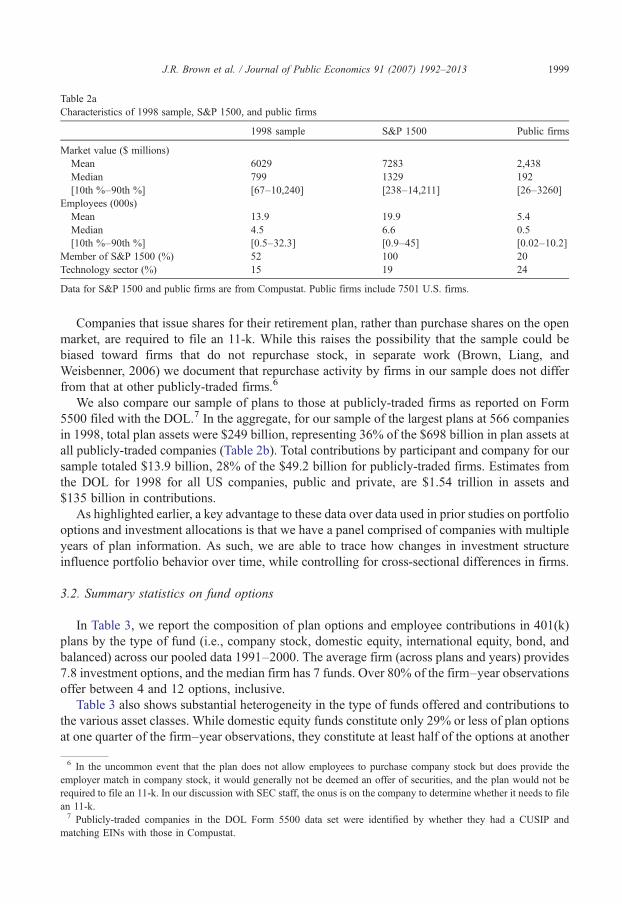
Table 2aCharacteristics of 1998 sample, S&P 1500, and public firms
1998 sample S&P 1500 Public firms
Market value ($ millions)Mean 6029 7283 2,438Median 799 1329 192[10th %–90th %] [67–10,240] [238–14,211] [26–3260]
Employees (000s)Mean 13.9 19.9 5.4Median 4.5 6.6 0.5[10th %–90th %] [0.5–32.3] [0.9–45] [0.02–10.2]
Member of S&P 1500 (%) 52 100 20Technology sector (%) 15 19 24
Data for S&P 1500 and public firms are from Compustat. Public firms include 7501 U.S. firms.
1999J.R. Brown et al. / Journal of Public Economics 91 (2007) 1992–2013
Companies that issue shares for their retirement plan, rather than purchase shares on the openmarket, are required to file an 11-k. While this raises the possibility that the sample could bebiased toward firms that do not repurchase stock, in separate work (Brown, Liang, andWeisbenner, 2006) we document that repurchase activity by firms in our sample does not differfrom that at other publicly-traded firms.6
We also compare our sample of plans to those at publicly-traded firms as reported on Form5500 filed with the DOL.7 In the aggregate, for our sample of the largest plans at 566 companiesin 1998, total plan assets were $249 billion, representing 36% of the $698 billion in plan assets atall publicly-traded companies (Table 2b). Total contributions by participant and company for oursample totaled $13.9 billion, 28% of the $49.2 billion for publicly-traded firms. Estimates fromthe DOL for 1998 for all US companies, public and private, are $1.54 trillion in assets and$135 billion in contributions.
As highlighted earlier, a key advantage to these data over data used in prior studies on portfoliooptions and investment allocations is that we have a panel comprised of companies with multipleyears of plan information. As such, we are able to trace how changes in investment structureinfluence portfolio behavior over time, while controlling for cross-sectional differences in firms.
3.2. Summary statistics on fund options
In Table 3, we report the composition of plan options and employee contributions in 401(k)plans by the type of fund (i.e., company stock, domestic equity, international equity, bond, andbalanced) across our pooled data 1991–2000. The average firm (across plans and years) provides7.8 investment options, and the median firm has 7 funds. Over 80% of the firm–year observationsoffer between 4 and 12 options, inclusive.
Table 3 also shows substantial heterogeneity in the type of funds offered and contributions tothe various asset classes. While domestic equity funds constitute only 29% or less of plan optionsat one quarter of the firm–year observations, they constitute at least half of the options at another
6 In the uncommon event that the plan does not allow employees to purchase company stock but does provide temployer match in company stock, it would generally not be deemed an offer of securities, and the plan would notrequired to file an 11-k. In our discussion with SEC staff, the onus is on the company to determine whether it needs to fan 11-k.7 Publicly-traded companies in the DOL Form 5500 data set were identified by whether they had a CUSIP an
matching EINs with those in Compustat.
hebeile
d
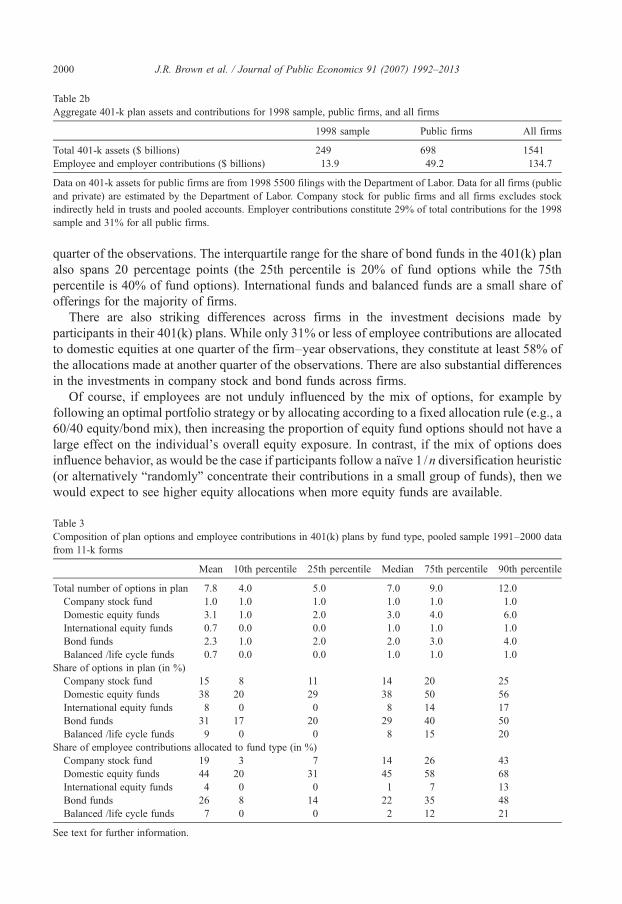
Table 2bAggregate 401-k plan assets and contributions for 1998 sample, public firms, and all firms
1998 sample Public firms All firms
Total 401-k assets ($ billions) 249 698 1541Employee and employer contributions ($ billions) 13.9 49.2 134.7
Data on 401-k assets for public firms are from 1998 5500 filings with the Department of Labor. Data for all firms (publicand private) are estimated by the Department of Labor. Company stock for public firms and all firms excludes stockindirectly held in trusts and pooled accounts. Employer contributions constitute 29% of total contributions for the 1998sample and 31% for all public firms.
2000 J.R. Brown et al. / Journal of Public Economics 91 (2007) 1992–2013
quarter of the observations. The interquartile range for the share of bond funds in the 401(k) planalso spans 20 percentage points (the 25th percentile is 20% of fund options while the 75thpercentile is 40% of fund options). International funds and balanced funds are a small share ofofferings for the majority of firms.
There are also striking differences across firms in the investment decisions made byparticipants in their 401(k) plans. While only 31% or less of employee contributions are allocatedto domestic equities at one quarter of the firm–year observations, they constitute at least 58% ofthe allocations made at another quarter of the observations. There are also substantial differencesin the investments in company stock and bond funds across firms.
Of course, if employees are not unduly influenced by the mix of options, for example byfollowing an optimal portfolio strategy or by allocating according to a fixed allocation rule (e.g., a60/40 equity/bond mix), then increasing the proportion of equity fund options should not have alarge effect on the individual's overall equity exposure. In contrast, if the mix of options doesinfluence behavior, as would be the case if participants follow a naïve 1 /n diversification heuristic(or alternatively “randomly” concentrate their contributions in a small group of funds), then wewould expect to see higher equity allocations when more equity funds are available.
Table 3Composition of plan options and employee contributions in 401(k) plans by fund type, pooled sample 1991–2000 datafrom 11-k forms
Mean 10th percentile 25th percentile Median 75th percentile 90th percentile
Total number of options in plan 7.8 4.0 5.0 7.0 9.0 12.0Company stock fund 1.0 1.0 1.0 1.0 1.0 1.0Domestic equity funds 3.1 1.0 2.0 3.0 4.0 6.0International equity funds 0.7 0.0 0.0 1.0 1.0 1.0Bond funds 2.3 1.0 2.0 2.0 3.0 4.0Balanced /life cycle funds 0.7 0.0 0.0 1.0 1.0 1.0
Share of options in plan (in %)Company stock fund 15 8 11 14 20 25Domestic equity funds 38 20 29 38 50 56International equity funds 8 0 0 8 14 17Bond funds 31 17 20 29 40 50Balanced /life cycle funds 9 0 0 8 15 20
Share of employee contributions allocated to fund type (in %)Company stock fund 19 3 7 14 26 43Domestic equity funds 44 20 31 45 58 68International equity funds 4 0 0 1 7 13Bond funds 26 8 14 22 35 48Balanced /life cycle funds 7 0 0 2 12 21
See text for further information.
2001J.R. Brown et al. / Journal of Public Economics 91 (2007) 1992–2013
4. How the number and mix of investment options influence portfolio decisions
4.1. Composition of investment options and investment choices by number of funds
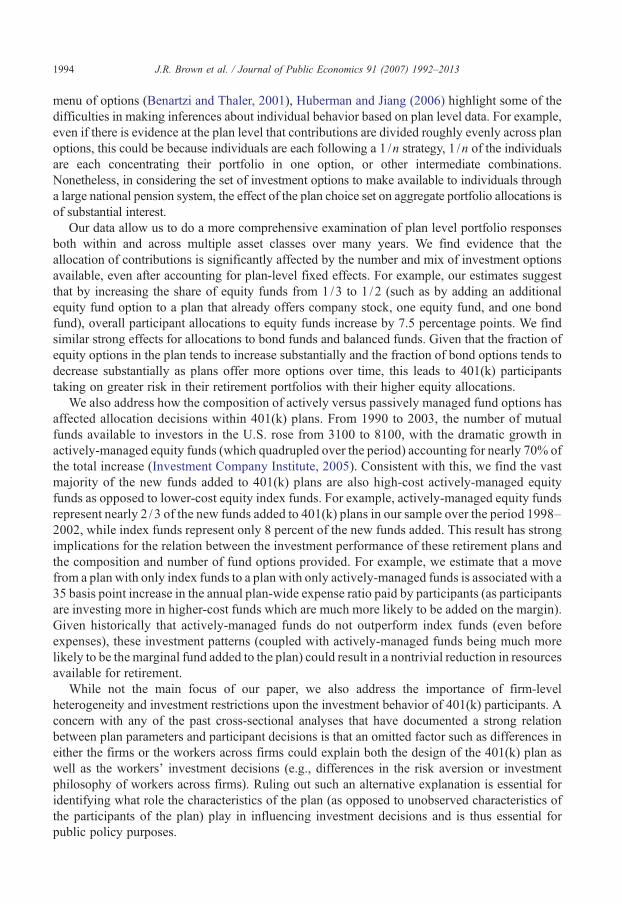
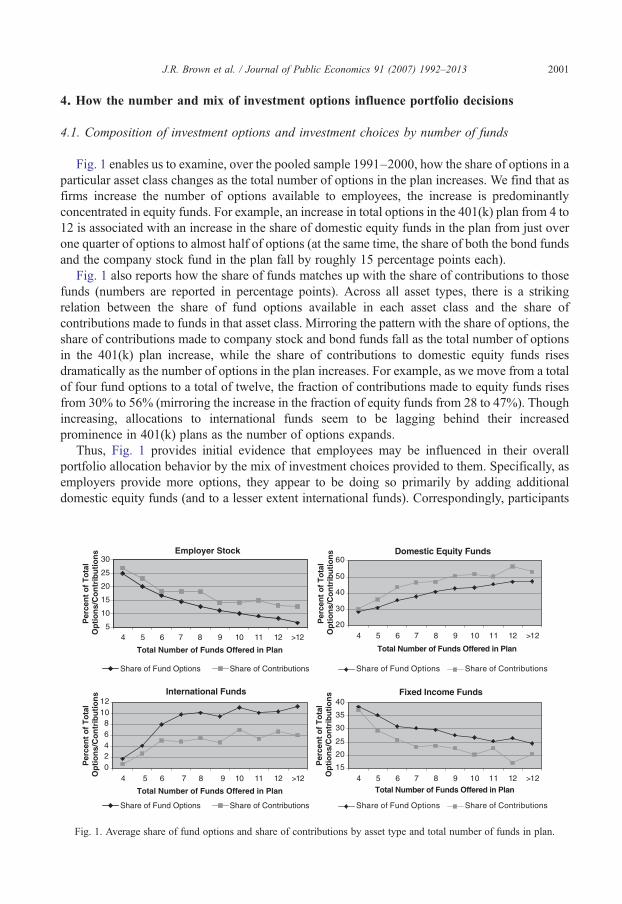
Fig. 1 enables us to examine, over the pooled sample 1991–2000, how the share of options in aparticular asset class changes as the total number of options in the plan increases. We find that asfirms increase the number of options available to employees, the increase is predominantlyconcentrated in equity funds. For example, an increase in total options in the 401(k) plan from 4 to12 is associated with an increase in the share of domestic equity funds in the plan from just overone quarter of options to almost half of options (at the same time, the share of both the bond fundsand the company stock fund in the plan fall by roughly 15 percentage points each).
Fig. 1 also reports how the share of funds matches up with the share of contributions to thosefunds (numbers are reported in percentage points). Across all asset types, there is a strikingrelation between the share of fund options available in each asset class and the share ofcontributions made to funds in that asset class. Mirroring the pattern with the share of options, theshare of contributions made to company stock and bond funds fall as the total number of optionsin the 401(k) plan increase, while the share of contributions to domestic equity funds risesdramatically as the number of options in the plan increases. For example, as we move from a totalof four fund options to a total of twelve, the fraction of contributions made to equity funds risesfrom 30% to 56% (mirroring the increase in the fraction of equity funds from 28 to 47%). Thoughincreasing, allocations to international funds seem to be lagging behind their increasedprominence in 401(k) plans as the number of options expands.
Thus, Fig. 1 provides initial evidence that employees may be influenced in their overallportfolio allocation behavior by the mix of investment choices provided to them. Specifically, asemployers provide more options, they appear to be doing so primarily by adding additionaldomestic equity funds (and to a lesser extent international funds). Correspondingly, participants
Employer Stock
5
10
15
20
25
30
4 5 6 7 8 9 10 11 12 >12
Total Number of Funds Offered in Plan
Per
cen
t o
f T
ota
l O
pti
on
s/C
on
trib
uti
on
sP
erce
nt
of
To
tal
Op
tio
ns/
Co
ntr
ibu
tio
ns
Per
cen
t o
f T
ota
l O
pti
on
s/C
on
trib
uti
on
sP
erce
nt
of
To
tal
Op
tio
ns/
Co
ntr
ibu
tio
ns
Share of Fund Options Share of Contributions
Domestic Equity Funds
20
30
40
50
60
4 5 6 7 8 9 10 11 12 >12
Total Number of Funds Offered in Plan
Total Number of Funds Offered in Plan Total Number of Funds Offered in Plan
Share of Fund Options Share of Contributions
Share of Fund Options Share of Contributions Share of Fund Options Share of Contributions
International Funds
02468
1012
4 5 6 7 8 9 10 11 12 >12
Fixed Income Funds
15
20
25
30
35
40
4 5 6 7 8 9 10 11 12 >12
Fig. 1. Average share of fund options and share of contributions by asset type and total number of funds in plan.
2002 J.R. Brown et al. / Journal of Public Economics 91 (2007) 1992–2013
appear to be placing a higher fraction of their portfolio in equities as the fraction of equity optionsrises. However, clearly other factors, such as asset returns, also affect allocation decisions withinthe plan. Further, the correlation between the share of options and the share of contributions neednot be causal, as it could simply reflect firms with risk-averse workers do not invest in equitiesand thus demand fewer equity funds in their 401(k) plans. To address these concerns, we turn to aregression framework.
4.2. Regression framework
We begin by estimating pooled cross-sectional regressions in which the dependent variable isthe share of contributions allocated to each of our five investment categories. On the right handside, our primary variable of interest is the fraction of investment options that are in this category.Thus, when testing for employer stock, we regress the share of contributions to company stockagainst 1 /n, which represents the share of total investment options that are comprised by theemployer stock fund. For domestic equity funds, we regress the share of contributions against e /n,where e is the number of domestic equity funds and n is the total number of investment options.Wefollow a similar approach for international equity funds, bond funds, and balanced funds.
If the coefficient on the share of fund options is zero, it indicates that individual portfolioallocations are not influenced by the mix of investment choices available. At the other extreme, acoefficient of one suggests that individuals, on average, follow a “1 /n” strategy, implying that themix of investment options translates nearly one-for-one into changes in portfolio allocations.Significant intermediate results would indicate that the mix of investment choice clearly matters,though not to the full extent predicted by a strict 1 /n hypothesis.
There are at least two possible explanations that are consistent with there being a positiverelation between contribution shares and the share of options. The first possibility is that allworkers naively diversify across multiple options and thus an increase in the number of optionswould reduce all workers' allocations to company stock. A second possibility is that workersrandomly put their entire 401(k) portfolio in one option, with different workers concentrating theirpurchases in different options, in which case an increase in the number of options would reducethe fraction of workers that concentrate all of their holdings in company stock. Benartzi andThaler (2001) provide evidence of the former and Huberman and Jiang (2006), Agnew (2006),and Holden and VanDerhei (2001) provide evidence for the latter, suggesting that both types ofinvestors may exist. With plan-level rather than worker-level data, it is not possible for us todistinguish which of these two stories is driving the result.
Besides the composition of options in the 401(k) plan, we also control for several other firm/plan characteristics as well as year effects in our regressions. To do this, we merge our sample of11-k filings with Center of Research in Security Prices (CRSP) and Compustat data. Motivated byBenartzi (2001), we include in our regressions a binary variable for whether the firm restricts itsemployer match to company stock. We also control for past five-year returns on the employer'sstock (taken from CRSP), the company's stock price volatility (measured as the standarddeviation of total returns over the past 24 months), market-to-book ratio, log of plan assets,whether the firm has a defined benefit plan, whether the firm's bonds are investment grade as aproxy for bankruptcy risk, and year effects.
Including year effects are important for two reasons. First, given the unbalanced nature of ourpanel, as discussed in Table 1, it is important to ensure that the “naïve diversification” results arenot being driven by differences in market returns. For example, if firms increase the number ofoptions over time, in our sample this corresponds with a period of rising equity markets. Thus it is
2003J.R. Brown et al. / Journal of Public Economics 91 (2007) 1992–2013
important to ensure that the results are not being driven by individuals placing more money intoequity funds in response to rising equity markets (this effect will be absorbed in the year effects inour regression). Second, it is likely that the increase in the number of investment alternatives overtime was due in large part to the proliferation of different types of mutual funds offered over thepast decade. For example, the ICI reports that the total number of mutual funds rose from 3403 in1991 to 8155 in 2000 (Investment Company Institute, 2005), with the vast majority of these fundsbeing equity funds. Year effects will pick up this potential “demand” for equities as manifested bygreater fund offerings.
4.3. Cross-sectional regression results
Table 4 displays the results of the pooled cross-sectional regressions of the share of employeecontributions in a particular asset class against the share of fund options in this same class using oursample of 401(k) plans over the period 1991–2000. Regressions are estimated separately for eachassert class and are only estimated over firm–year observations that offered at least one option ofthat particular type in their 401(k) plan. For all five asset classes, we find positive and significantrelations between the share of contributions and the share of options in the plan, confirming that thepatterns displayed in Fig. 1 also hold in the presence of firm-specific characteristics and yearcontrols. For domestic equity funds, the coefficient on the share of equity options in the plan is
Table 4Regression of share of contributions against share of fund options, pooled cross sections 1991–2000
Share of contributions in:
Company stockfund
Domestic equityfunds
International equityfunds
Bondfunds
Balancedfunds
Share of fund options in assetclass
0.850⁎⁎⁎ 0.703⁎⁎⁎ 0.533⁎⁎⁎ 0.265⁎⁎⁎ 0.494⁎⁎⁎
(0.129) (0.048) (0.069) (0.050) (0.117)Co stock match required? 0.070⁎⁎⁎ −0.021⁎ −0.005 −0.032⁎⁎⁎ −0.029⁎⁎⁎
(0.014) (0.011) (0.005) (0.012) (0.009)Past 5 year return on 0.005⁎ −0.003⁎⁎⁎ 0.001⁎ −0.002 −0.000
company stock (0.003) (0.001) (0.001) (0.002) (0.001)S.D. of co. stock −0.467⁎⁎⁎ 0.089 0.133⁎ 0.328⁎⁎ 0.022
(0.156) (0.140) (0.073) (0.155) (0.130)Market-to-book ratio 0.013⁎⁎⁎ −0.003 −0.002 0.009⁎⁎⁎ −0.007⁎⁎⁎
(0.005) (0.005) (0.002) (0.003) (0.002)Ln (assets) 0.030⁎⁎⁎ −0.020⁎⁎⁎ −0.007⁎⁎⁎ 0.002 −0.010⁎⁎⁎
(0.005) (0.003) (0.002) (0.004) (0.003)DB plan? −0.018 0.016 −0.001 0.010 −0.013
(0.013) (0.013) (0.006) (0.012) (0.010)Inv. Grade Bonds? −0.017 −0.017 −0.008 0.017 −0.001
(0.018) (0.011) (0.006) (0.014) (0.011)Year fixed effects? Yes Yes Yes Yes YesFirm-fixed effects? No No No No NoAdjusted R2 0.272 0.477 0.271 0.321 0.244# of observations 1935 1900 1045 1911 1065
⁎, ⁎⁎, and ⁎⁎⁎ denote significance at the 0.10, 0.05, and 0.01 level respectively.Each column of this table represents a separate regression. The dependent variable is the share of contributions allocated toa particular asset class, and the regression is estimated for the sample of firms that offer at least one option in that assetclass. The robust standard errors, which are reported in parentheses, are clustered on each firm in order to account forcorrelation across time for a given firm. See text for further information.
2004 J.R. Brown et al. / Journal of Public Economics 91 (2007) 1992–2013
0.70. To assist in the literal interpretation of this coefficient, imagine a firm has five investmentoptions available, three of which are equity funds and two of which are fixed income funds. If thefirm added another equity option, the share of equity choices changes from 3/5 to 4/6, or anincrease of 6.7 percentage points. Multiplying by the 0.70 coefficient implies that participantswould be expected, on average, to increase their allocation to equities by 4.7 percentage points. Forcompany stock investments, we cannot reject the “1 /n” hypothesis (i.e., cannot reject a coefficientof one on the share of options). This would suggest, at first glance, that the trend of adding moreoptions to 401(k) plans has contributed considerably to a reduction in contributions to companystock over the past decade. The coefficient on the share of options in the plan is the smallest forbond funds, but still highly significant. The smaller sensitivity for bond funds is not surprisinggiven that fixed income funds are often chosen as the “default” investment for participants who donot make an active alternative selection.
Our results on the other variables are generally consistent with previous findings. Consistentwith Benartzi (2001) and Brown et al. (2006), we find that employees at firms where the employermatch is restricted to company stock direct, on average, 7.0 percentage points more of their owncontributions to company stock. Only about one-third of this 7.0 percentage point increase comesout of allocations to other equity funds, while 44% comes out of fixed income investments. Priorresearch (e.g., Benartzi, 2001; Huberman and Sengmueller, 2004; Choi et al., 2004b; Agnew,2006) suggests that individuals are more likely to invest in their employer's stock if it hasperformed well in recent years. We also find that holdings of own employer stock are positivelyrelated to past 5 year returns on that stock, while the share of contributions directed toward otherequity investments is significantly negatively related to own company stock performance. Thecompany stock purchase rate is higher at less volatile firms, larger firms, and firms with highermarket-to-book ratios (a proxy for growth opportunities). The presence of a defined benefit planor an investment grade bond rating has little effect on participant investment decisions.
4.4. Panel regression results
A potential concern with any cross-sectional regression is that there is tremendousheterogeneity across firms (and the workers across firms), and thus one might be concernedabout spurious correlation, such as differences in risk tolerance across workers in different firms.To address this, we add firm-fixed effects to our regression specification. The inclusion of these891 firm-specific fixed effects absorb all of the variation in the allocation of contributions that canbe attributed to time-invariant differences in the characteristics of firms and their employees. Inother words, with firm-fixed effects in place, the coefficient on the share of options in an assetclass is identifying the relationship of interest from within-firm changes over time in the numberof investment options offered.
The results of these fixed effects regressions are displayed in Table 5. By comparing the resultswith those obtained in the cross-sectional regressions presented in Table 4, two conclusionsemerge. First, in general, pension plan parameters remain important determinants of investorbehavior after controlling for firm-level fixed effects. Importantly, the influence of the numberand mix of investment options on portfolio choice is still quite strong for equity funds. Forexample, controlling for firm-level fixed effects, the coefficient on the share of equity funds ishighly significant 0.45 (compared to 0.70 in the cross-sectional regression). To put this coefficientinto perspective, imagine a firm that began with three equity funds and two bond funds adds afourth equity fund. Applying the 0.452 coefficient indicates that this change would be expected toincrease the allocation of contributions to equity by 3.0 percentage points, which represents a
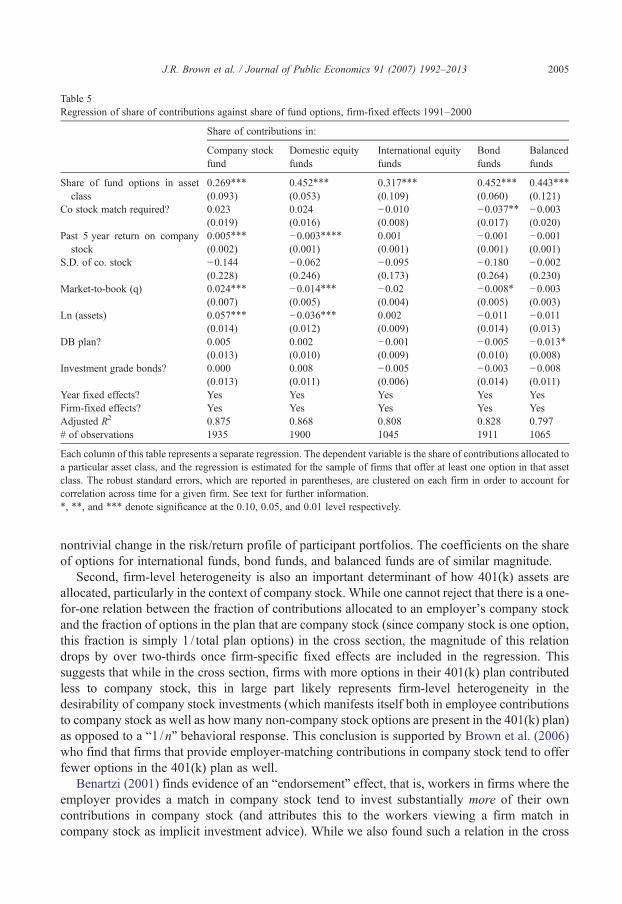
Table 5Regression of share of contributions against share of fund options, firm-fixed effects 1991–2000
Share of contributions in:
Company stockfund
Domestic equityfunds
International equityfunds
Bondfunds
Balancedfunds
Share of fund options in assetclass
0.269⁎⁎⁎ 0.452⁎⁎⁎ 0.317⁎⁎⁎ 0.452⁎⁎⁎ 0.443⁎⁎⁎
(0.093) (0.053) (0.109) (0.060) (0.121)Co stock match required? 0.023 0.024 −0.010 −0.037⁎⁎ −0.003
(0.019) (0.016) (0.008) (0.017) (0.020)Past 5 year return on company
stock0.005⁎⁎⁎ −0.003⁎⁎⁎⁎ 0.001 −0.001 −0.001(0.002) (0.001) (0.001) (0.001) (0.001)
S.D. of co. stock −0.144 −0.062 −0.095 −0.180 −0.002(0.228) (0.246) (0.173) (0.264) (0.230)
Market-to-book (q) 0.024⁎⁎⁎ −0.014⁎⁎⁎ −0.02 −0.008⁎ −0.003(0.007) (0.005) (0.004) (0.005) (0.003)
Ln (assets) 0.057⁎⁎⁎ −0.036⁎⁎⁎ 0.002 −0.011 −0.011(0.014) (0.012) (0.009) (0.014) (0.013)
DB plan? 0.005 0.002 −0.001 −0.005 −0.013⁎(0.013) (0.010) (0.009) (0.010) (0.008)
Investment grade bonds? 0.000 0.008 −0.005 −0.003 −0.008(0.013) (0.011) (0.006) (0.014) (0.011)
Year fixed effects? Yes Yes Yes Yes YesFirm-fixed effects? Yes Yes Yes Yes YesAdjusted R2 0.875 0.868 0.808 0.828 0.797# of observations 1935 1900 1045 1911 1065
Each column of this table represents a separate regression. The dependent variable is the share of contributions allocated toa particular asset class, and the regression is estimated for the sample of firms that offer at least one option in that assetclass. The robust standard errors, which are reported in parentheses, are clustered on each firm in order to account forcorrelation across time for a given firm. See text for further information.⁎, ⁎⁎, and ⁎⁎⁎ denote significance at the 0.10, 0.05, and 0.01 level respectively.
2005J.R. Brown et al. / Journal of Public Economics 91 (2007) 1992–2013
nontrivial change in the risk/return profile of participant portfolios. The coefficients on the shareof options for international funds, bond funds, and balanced funds are of similar magnitude.
Second, firm-level heterogeneity is also an important determinant of how 401(k) assets areallocated, particularly in the context of company stock. While one cannot reject that there is a one-for-one relation between the fraction of contributions allocated to an employer's company stockand the fraction of options in the plan that are company stock (since company stock is one option,this fraction is simply 1 / total plan options) in the cross section, the magnitude of this relationdrops by over two-thirds once firm-specific fixed effects are included in the regression. Thissuggests that while in the cross section, firms with more options in their 401(k) plan contributedless to company stock, this in large part likely represents firm-level heterogeneity in thedesirability of company stock investments (which manifests itself both in employee contributionsto company stock as well as how many non-company stock options are present in the 401(k) plan)as opposed to a “1 /n” behavioral response. This conclusion is supported by Brown et al. (2006)who find that firms that provide employer-matching contributions in company stock tend to offerfewer options in the 401(k) plan as well.
Benartzi (2001) finds evidence of an “endorsement” effect, that is, workers in firms where theemployer provides a match in company stock tend to invest substantially more of their owncontributions in company stock (and attributes this to the workers viewing a firm match incompany stock as implicit investment advice). While we also found such a relation in the cross
2006 J.R. Brown et al. / Journal of Public Economics 91 (2007) 1992–2013
section, the relation between match policy and employee contributions disappears once wecontrol for firm-level fixed effects (the coefficient falls over 2 /3 in magnitude and is no longerstatistically significant).8 Thus, investments in company stock in the pension plan appear to bedriven in no small part by firm or worker-specific characteristics outside of the pension plan.
These results provide clear evidence that the number and mix of investment options matter indetermining the equity/bond mix in retirement plans. An important policy implication of thisfinding is that the choice of investment options to make available in an individual accountsprogram is likely to have a first-order effect on the portfolio allocations that individuals make.This finding is not based on cross-sectional correlations, but rather is obtained from a panel dataset, enabling us to control for heterogeneity in the investment preferences of workers across firmsand across time.
4.5. Robustness checks of panel regression results
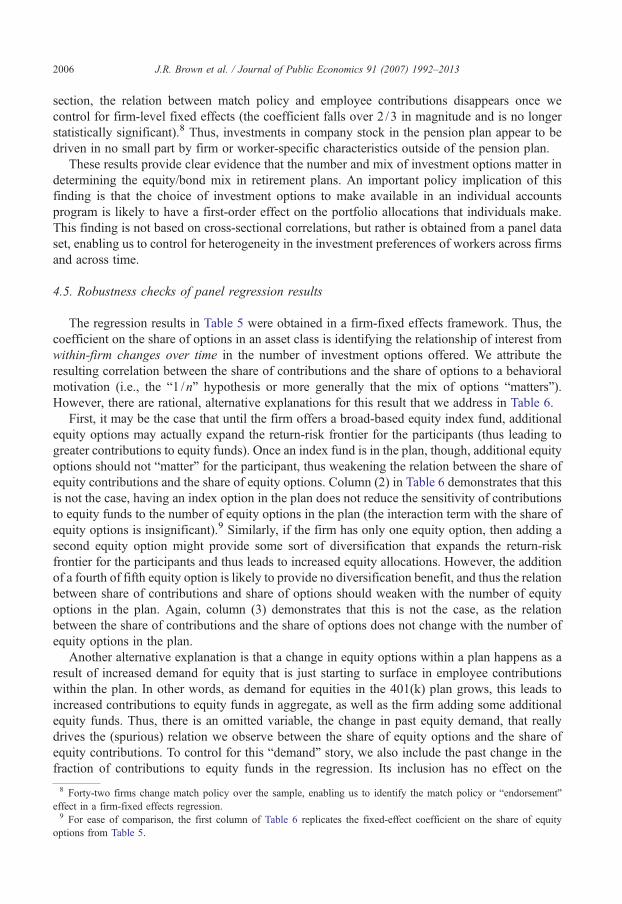
The regression results in Table 5 were obtained in a firm-fixed effects framework. Thus, thecoefficient on the share of options in an asset class is identifying the relationship of interest fromwithin-firm changes over time in the number of investment options offered. We attribute theresulting correlation between the share of contributions and the share of options to a behavioralmotivation (i.e., the “1 /n” hypothesis or more generally that the mix of options “matters”).However, there are rational, alternative explanations for this result that we address in Table 6.
First, it may be the case that until the firm offers a broad-based equity index fund, additionalequity options may actually expand the return-risk frontier for the participants (thus leading togreater contributions to equity funds). Once an index fund is in the plan, though, additional equityoptions should not “matter” for the participant, thus weakening the relation between the share ofequity contributions and the share of equity options. Column (2) in Table 6 demonstrates that thisis not the case, having an index option in the plan does not reduce the sensitivity of contributionsto equity funds to the number of equity options in the plan (the interaction term with the share ofequity options is insignificant).9 Similarly, if the firm has only one equity option, then adding asecond equity option might provide some sort of diversification that expands the return-riskfrontier for the participants and thus leads to increased equity allocations. However, the additionof a fourth of fifth equity option is likely to provide no diversification benefit, and thus the relationbetween share of contributions and share of options should weaken with the number of equityoptions in the plan. Again, column (3) demonstrates that this is not the case, as the relationbetween the share of contributions and the share of options does not change with the number ofequity options in the plan.
Another alternative explanation is that a change in equity options within a plan happens as aresult of increased demand for equity that is just starting to surface in employee contributionswithin the plan. In other words, as demand for equities in the 401(k) plan grows, this leads toincreased contributions to equity funds in aggregate, as well as the firm adding some additionalequity funds. Thus, there is an omitted variable, the change in past equity demand, that reallydrives the (spurious) relation we observe between the share of equity options and the share ofequity contributions. To control for this “demand” story, we also include the past change in thefraction of contributions to equity funds in the regression. Its inclusion has no effect on the
8 Forty-two firms change match policy over the sample, enabling us to identify the match policy or “endorsement”effect in a firm-fixed effects regression.9 For ease of comparison, the first column of Table 6 replicates the fixed-effect coefficient on the share of equity
options from Table 5.
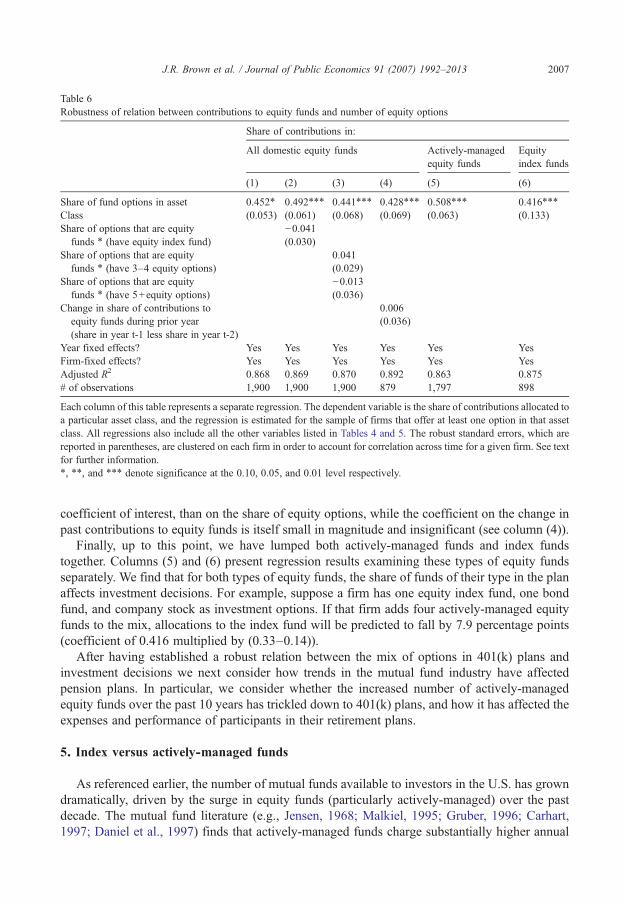
Table 6Robustness of relation between contributions to equity funds and number of equity options
Share of contributions in:
All domestic equity funds Actively-managedequity funds
Equityindex funds
(1) (2) (3) (4) (5) (6)
Share of fund options in asset 0.452⁎ 0.492⁎⁎⁎ 0.441⁎⁎⁎ 0.428⁎⁎⁎ 0.508⁎⁎⁎ 0.416⁎⁎⁎
Class (0.053) (0.061) (0.068) (0.069) (0.063) (0.133)Share of options that are equity −0.041
funds ⁎ (have equity index fund) (0.030)Share of options that are equity 0.041
funds ⁎ (have 3–4 equity options) (0.029)Share of options that are equity −0.013
funds ⁎ (have 5+equity options) (0.036)Change in share of contributions to
equity funds during prior year(share in year t-1 less share in year t-2)
0.006(0.036)
Year fixed effects? Yes Yes Yes Yes Yes YesFirm-fixed effects? Yes Yes Yes Yes Yes YesAdjusted R2 0.868 0.869 0.870 0.892 0.863 0.875# of observations 1,900 1,900 1,900 879 1,797 898
Each column of this table represents a separate regression. The dependent variable is the share of contributions allocated toa particular asset class, and the regression is estimated for the sample of firms that offer at least one option in that assetclass. All regressions also include all the other variables listed in Tables 4 and 5. The robust standard errors, which arereported in parentheses, are clustered on each firm in order to account for correlation across time for a given firm. See textfor further information.⁎, ⁎⁎, and ⁎⁎⁎ denote significance at the 0.10, 0.05, and 0.01 level respectively.
2007J.R. Brown et al. / Journal of Public Economics 91 (2007) 1992–2013
coefficient of interest, than on the share of equity options, while the coefficient on the change inpast contributions to equity funds is itself small in magnitude and insignificant (see column (4)).
Finally, up to this point, we have lumped both actively-managed funds and index fundstogether. Columns (5) and (6) present regression results examining these types of equity fundsseparately. We find that for both types of equity funds, the share of funds of their type in the planaffects investment decisions. For example, suppose a firm has one equity index fund, one bondfund, and company stock as investment options. If that firm adds four actively-managed equityfunds to the mix, allocations to the index fund will be predicted to fall by 7.9 percentage points(coefficient of 0.416 multiplied by (0.33–0.14)).
After having established a robust relation between the mix of options in 401(k) plans andinvestment decisions we next consider how trends in the mutual fund industry have affectedpension plans. In particular, we consider whether the increased number of actively-managedequity funds over the past 10 years has trickled down to 401(k) plans, and how it has affected theexpenses and performance of participants in their retirement plans.
5. Index versus actively-managed funds
As referenced earlier, the number of mutual funds available to investors in the U.S. has growndramatically, driven by the surge in equity funds (particularly actively-managed) over the pastdecade. The mutual fund literature (e.g., Jensen, 1968; Malkiel, 1995; Gruber, 1996; Carhart,1997; Daniel et al., 1997) finds that actively-managed funds charge substantially higher annual
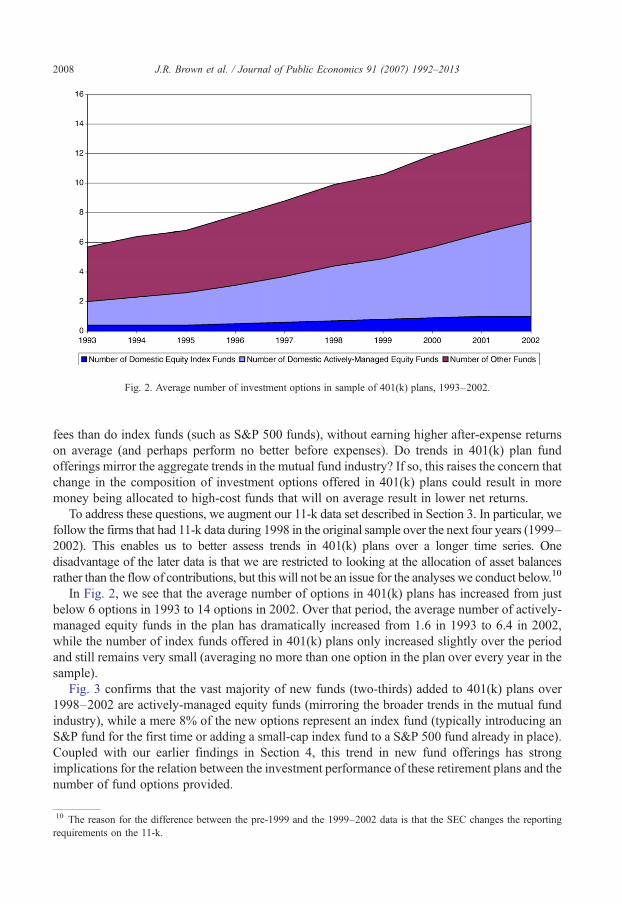
Fig. 2. Average number of investment options in sample of 401(k) plans, 1993–2002.
2008 J.R. Brown et al. / Journal of Public Economics 91 (2007) 1992–2013
fees than do index funds (such as S&P 500 funds), without earning higher after-expense returnson average (and perhaps perform no better before expenses). Do trends in 401(k) plan fundofferings mirror the aggregate trends in the mutual fund industry? If so, this raises the concern thatchange in the composition of investment options offered in 401(k) plans could result in moremoney being allocated to high-cost funds that will on average result in lower net returns.
To address these questions, we augment our 11-k data set described in Section 3. In particular, wefollow the firms that had 11-k data during 1998 in the original sample over the next four years (1999–2002). This enables us to better assess trends in 401(k) plans over a longer time series. Onedisadvantage of the later data is that we are restricted to looking at the allocation of asset balancesrather than the flow of contributions, but this will not be an issue for the analyses we conduct below.10
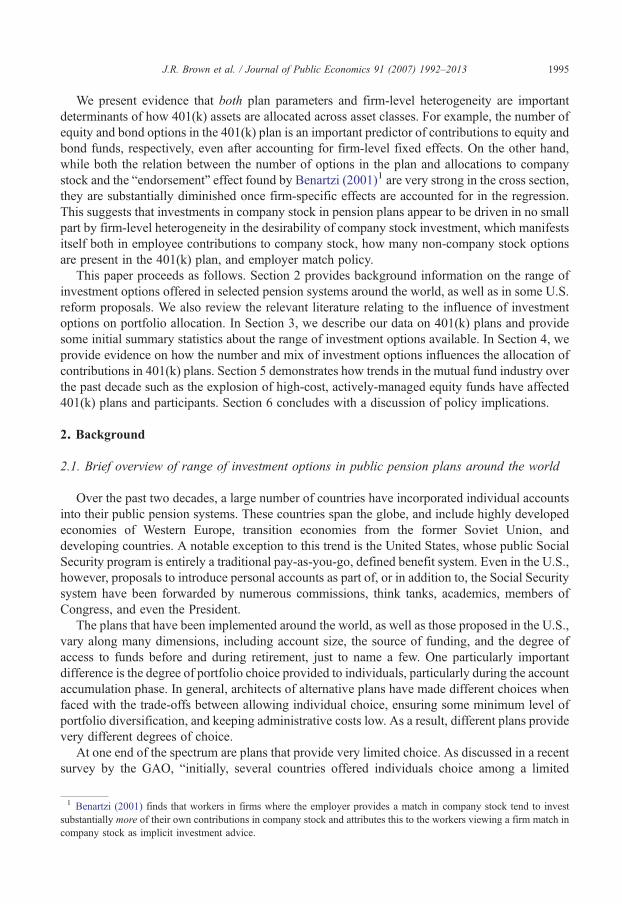
In Fig. 2, we see that the average number of options in 401(k) plans has increased from justbelow 6 options in 1993 to 14 options in 2002. Over that period, the average number of actively-managed equity funds in the plan has dramatically increased from 1.6 in 1993 to 6.4 in 2002,while the number of index funds offered in 401(k) plans only increased slightly over the periodand still remains very small (averaging no more than one option in the plan over every year in thesample).
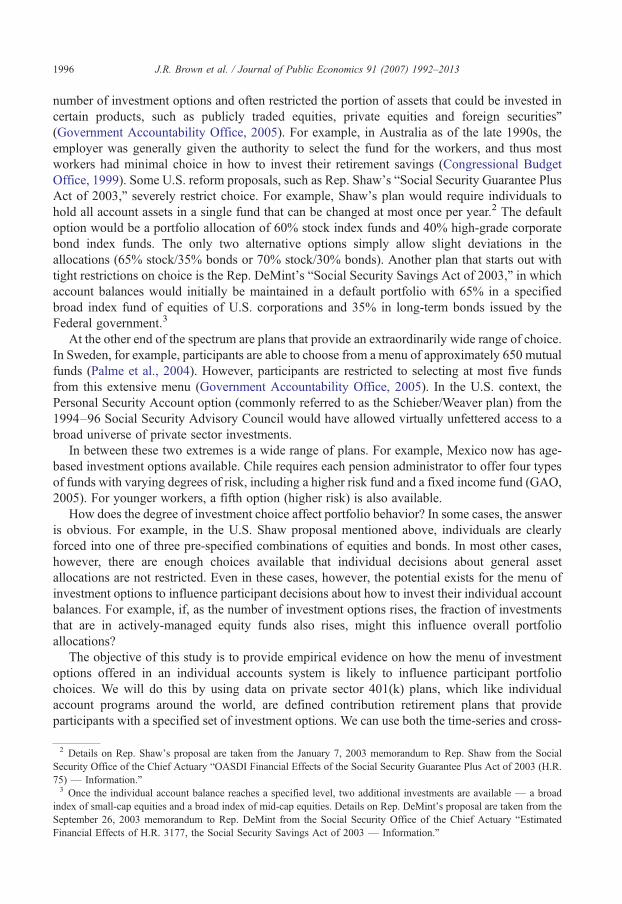
Fig. 3 confirms that the vast majority of new funds (two-thirds) added to 401(k) plans over1998–2002 are actively-managed equity funds (mirroring the broader trends in the mutual fundindustry), while a mere 8% of the new options represent an index fund (typically introducing anS&P fund for the first time or adding a small-cap index fund to a S&P 500 fund already in place).Coupled with our earlier findings in Section 4, this trend in new fund offerings has strongimplications for the relation between the investment performance of these retirement plans and thenumber of fund options provided.
10 The reason for the difference between the pre-1999 and the 1999–2002 data is that the SEC changes the reportingrequirements on the 11-k.
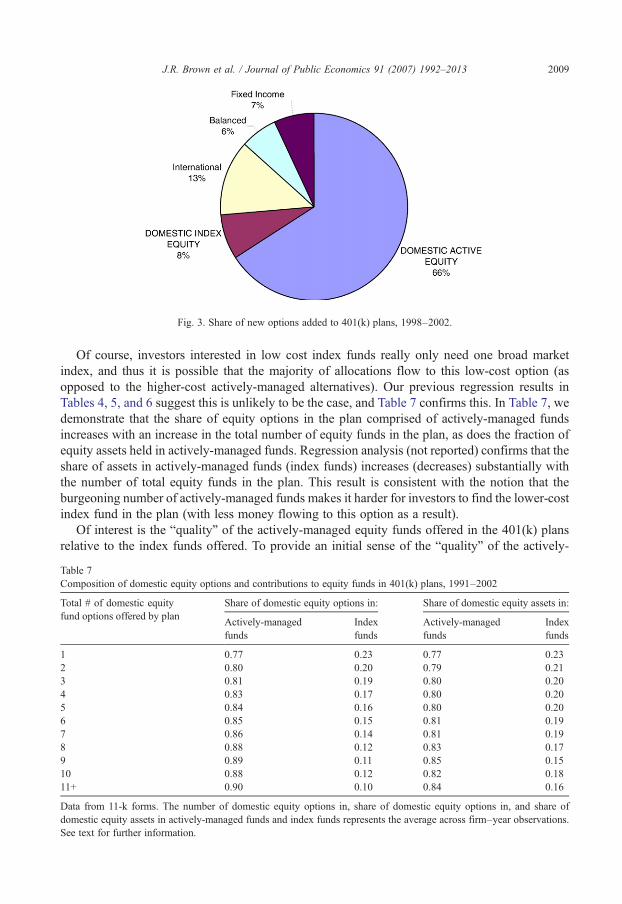
Fig. 3. Share of new options added to 401(k) plans, 1998–2002.
2009J.R. Brown et al. / Journal of Public Economics 91 (2007) 1992–2013
Of course, investors interested in low cost index funds really only need one broad marketindex, and thus it is possible that the majority of allocations flow to this low-cost option (asopposed to the higher-cost actively-managed alternatives). Our previous regression results inTables 4, 5, and 6 suggest this is unlikely to be the case, and Table 7 confirms this. In Table 7, wedemonstrate that the share of equity options in the plan comprised of actively-managed fundsincreases with an increase in the total number of equity funds in the plan, as does the fraction ofequity assets held in actively-managed funds. Regression analysis (not reported) confirms that theshare of assets in actively-managed funds (index funds) increases (decreases) substantially withthe number of total equity funds in the plan. This result is consistent with the notion that theburgeoning number of actively-managed funds makes it harder for investors to find the lower-costindex fund in the plan (with less money flowing to this option as a result).
Of interest is the “quality” of the actively-managed equity funds offered in the 401(k) plansrelative to the index funds offered. To provide an initial sense of the “quality” of the actively-
Table 7Composition of domestic equity options and contributions to equity funds in 401(k) plans, 1991–2002
Total # of domestic equityfund options offered by plan
Share of domestic equity options in: Share of domestic equity assets in:
Actively-managedfunds
Indexfunds
Actively-managedfunds
Indexfunds
1 0.77 0.23 0.77 0.232 0.80 0.20 0.79 0.213 0.81 0.19 0.80 0.204 0.83 0.17 0.80 0.205 0.84 0.16 0.80 0.206 0.85 0.15 0.81 0.197 0.86 0.14 0.81 0.198 0.88 0.12 0.83 0.179 0.89 0.11 0.85 0.1510 0.88 0.12 0.82 0.1811+ 0.90 0.10 0.84 0.16
Data from 11-k forms. The number of domestic equity options in, share of domestic equity options in, and share ofdomestic equity assets in actively-managed funds and index funds represents the average across firm–year observations.See text for further information.
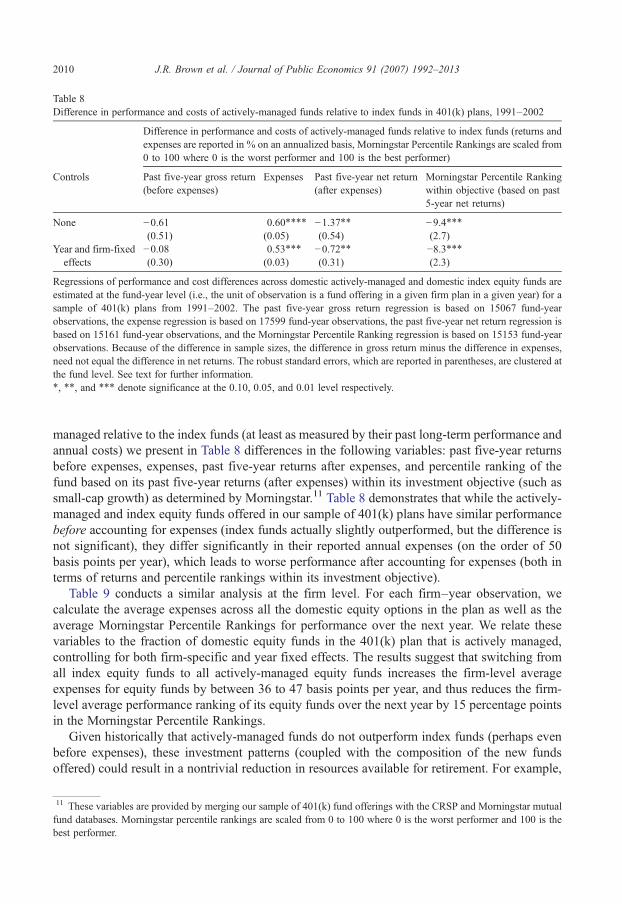
Table 8Difference in performance and costs of actively-managed funds relative to index funds in 401(k) plans, 1991–2002
Difference in performance and costs of actively-managed funds relative to index funds (returns andexpenses are reported in % on an annualized basis, Morningstar Percentile Rankings are scaled from0 to 100 where 0 is the worst performer and 100 is the best performer)
Controls Past five-year gross return(before expenses)
Expenses Past five-year net return(after expenses)
Morningstar Percentile Rankingwithin objective (based on past5-year net returns)
None −0.61 0.60⁎⁎⁎⁎ −1.37⁎⁎ −9.4⁎⁎⁎(0.51) (0.05) (0.54) (2.7)
Year and firm-fixedeffects
−0.08 0.53⁎⁎⁎ −0.72⁎⁎ −8.3⁎⁎⁎(0.30) (0.03) (0.31) (2.3)
Regressions of performance and cost differences across domestic actively-managed and domestic index equity funds areestimated at the fund-year level (i.e., the unit of observation is a fund offering in a given firm plan in a given year) for asample of 401(k) plans from 1991–2002. The past five-year gross return regression is based on 15067 fund-yearobservations, the expense regression is based on 17599 fund-year observations, the past five-year net return regression isbased on 15161 fund-year observations, and the Morningstar Percentile Ranking regression is based on 15153 fund-yearobservations. Because of the difference in sample sizes, the difference in gross return minus the difference in expenses,need not equal the difference in net returns. The robust standard errors, which are reported in parentheses, are clustered atthe fund level. See text for further information.⁎, ⁎⁎, and ⁎⁎⁎ denote significance at the 0.10, 0.05, and 0.01 level respectively.
2010 J.R. Brown et al. / Journal of Public Economics 91 (2007) 1992–2013
managed relative to the index funds (at least as measured by their past long-term performance andannual costs) we present in Table 8 differences in the following variables: past five-year returnsbefore expenses, expenses, past five-year returns after expenses, and percentile ranking of thefund based on its past five-year returns (after expenses) within its investment objective (such assmall-cap growth) as determined by Morningstar.11 Table 8 demonstrates that while the actively-managed and index equity funds offered in our sample of 401(k) plans have similar performancebefore accounting for expenses (index funds actually slightly outperformed, but the difference isnot significant), they differ significantly in their reported annual expenses (on the order of 50basis points per year), which leads to worse performance after accounting for expenses (both interms of returns and percentile rankings within its investment objective).
Table 9 conducts a similar analysis at the firm level. For each firm–year observation, wecalculate the average expenses across all the domestic equity options in the plan as well as theaverage Morningstar Percentile Rankings for performance over the next year. We relate thesevariables to the fraction of domestic equity funds in the 401(k) plan that is actively managed,controlling for both firm-specific and year fixed effects. The results suggest that switching fromall index equity funds to all actively-managed equity funds increases the firm-level averageexpenses for equity funds by between 36 to 47 basis points per year, and thus reduces the firm-level average performance ranking of its equity funds over the next year by 15 percentage pointsin the Morningstar Percentile Rankings.
Given historically that actively-managed funds do not outperform index funds (perhaps evenbefore expenses), these investment patterns (coupled with the composition of the new fundsoffered) could result in a nontrivial reduction in resources available for retirement. For example,
11 These variables are provided by merging our sample of 401(k) fund offerings with the CRSP and Morningstar mutualfund databases. Morningstar percentile rankings are scaled from 0 to 100 where 0 is the worst performer and 100 is thebest performer.
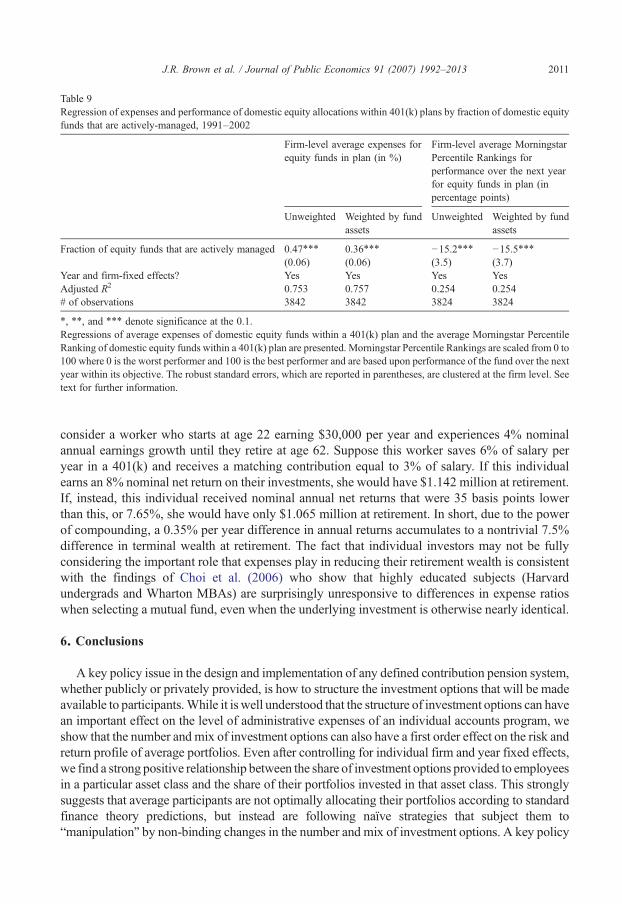
Table 9Regression of expenses and performance of domestic equity allocations within 401(k) plans by fraction of domestic equityfunds that are actively-managed, 1991–2002
Firm-level average expenses forequity funds in plan (in %)
Firm-level average MorningstarPercentile Rankings forperformance over the next yearfor equity funds in plan (inpercentage points)
Unweighted Weighted by fundassets
Unweighted Weighted by fundassets
Fraction of equity funds that are actively managed 0.47⁎⁎⁎ 0.36⁎⁎⁎ −15.2⁎⁎⁎ −15.5⁎⁎⁎(0.06) (0.06) (3.5) (3.7)
Year and firm-fixed effects? Yes Yes Yes YesAdjusted R2 0.753 0.757 0.254 0.254# of observations 3842 3842 3824 3824
⁎, ⁎⁎, and ⁎⁎⁎ denote significance at the 0.1.Regressions of average expenses of domestic equity funds within a 401(k) plan and the average Morningstar PercentileRanking of domestic equity funds within a 401(k) plan are presented. Morningstar Percentile Rankings are scaled from 0 to100 where 0 is the worst performer and 100 is the best performer and are based upon performance of the fund over the nextyear within its objective. The robust standard errors, which are reported in parentheses, are clustered at the firm level. Seetext for further information.
2011J.R. Brown et al. / Journal of Public Economics 91 (2007) 1992–2013
consider a worker who starts at age 22 earning $30,000 per year and experiences 4% nominalannual earnings growth until they retire at age 62. Suppose this worker saves 6% of salary peryear in a 401(k) and receives a matching contribution equal to 3% of salary. If this individualearns an 8% nominal net return on their investments, she would have $1.142 million at retirement.If, instead, this individual received nominal annual net returns that were 35 basis points lowerthan this, or 7.65%, she would have only $1.065 million at retirement. In short, due to the powerof compounding, a 0.35% per year difference in annual returns accumulates to a nontrivial 7.5%difference in terminal wealth at retirement. The fact that individual investors may not be fullyconsidering the important role that expenses play in reducing their retirement wealth is consistentwith the findings of Choi et al. (2006) who show that highly educated subjects (Harvardundergrads and Wharton MBAs) are surprisingly unresponsive to differences in expense ratioswhen selecting a mutual fund, even when the underlying investment is otherwise nearly identical.
6. Conclusions
A key policy issue in the design and implementation of any defined contribution pension system,whether publicly or privately provided, is how to structure the investment options that will be madeavailable to participants.While it is well understood that the structure of investment options can havean important effect on the level of administrative expenses of an individual accounts program, weshow that the number and mix of investment options can also have a first order effect on the risk andreturn profile of average portfolios. Even after controlling for individual firm and year fixed effects,we find a strong positive relationship between the share of investment options provided to employeesin a particular asset class and the share of their portfolios invested in that asset class. This stronglysuggests that average participants are not optimally allocating their portfolios according to standardfinance theory predictions, but instead are following naïve strategies that subject them to“manipulation” by non-binding changes in the number and mix of investment options. A key policy
2012 J.R. Brown et al. / Journal of Public Economics 91 (2007) 1992–2013
implication is that the number andmix of investment options will have an important effect on overallasset allocation in the individual accounts. In short, it appears to be possible to influence the portfolioallocation of individual participants by altering the mix of equity and bond funds, even if the overallinvestment opportunity set remains unchanged.
By exploiting panel data on 401(k) plans, we find that both plan parameters and firm-levelheterogeneity are important in explaining investment decisions. Investments in company stock, inparticular, seem to be driven more by differences in workers across firms (or unobserveddifferences in the firms themselves) than by cross-sectional differences in pension plancharacteristics (such as whether the match is in company stock or the number of non-companystock options in the retirement plan). This highlights the importance of exploiting panel data inidentifying behavioral responses to pension plan characteristics.
Finally, the proliferation of actively-managed equity funds in general, which has trickled downto offerings in 401(k) plans as well, has resulted in the vast majority of money in retirement plansflowing into higher-cost actively-managed equity funds as opposed to lower-cost equity indexfunds (such as S&P 500 funds). This results in plan participants paying higher fees, which willdepress overall portfolio performance, and thus, in the long-term, depress retirement wealth.
Acknowledgements
This research was supported by the U.S. Social Security Administration through grant #10-P-98363-1 to the National Bureau of Economic Research as part of the SSA Retirement ResearchConsortium. The opinions and conclusions expressed are solely those of the author(s) and do notrepresent the opinions or policy of SSA, any agency of the Federal Government, or the NBER.We are grateful to the Social Security Administration for this financial support. We thank JulieAgnew, Matias Eklof, Wei Jiang, Brigitte Madrian, Clemens Sialm, and conference participants atthe 2005 Retirement Research Consortium, the 2006 American Economic Association meetings,the 2006 Trans-Atlantic Public Economics Seminar, and the 2007 Wharton Household PortfolioChoice and Financial Decision-Making conference. Vivek Choudhary, Soonho Lee, and YoonSok Lee provided excellent research assistance.
References
Agnew, Julie, 2006. Do behavioral biases vary across individuals: evidence from individual level data. Journal of Financialand Quantitative Analysis 41, 939–962.
Agnew, Julie, Szykman, Lisa R., 2005. Asset allocation and information overload: the influence of information display,asset choice, and investor experience. Journal of Behavioral Finance 6-2, 57–70.
Agnew, Julie, Balduzzi, Pierluigi, Sunden, Annika, 2003. Portfolio choice and trading in a large 401(k) plan. AmericanEconomic Review 93-1, 193–215.
Ameriks, John, Zeldes, Stephen, 2001. How do household portfolio shares vary with age? Working Paper. ColumbiaUniversity. December.
Benartzi, Shlomo, 2001. Excessive extrapolation and the allocation of 401(k) accounts to company stock. Journal ofFinance 56, 1747–1764.
Benartzi, Shlomo, Thaler, Richard H., 2001. Naïve diversification strategies in retirement savings plans. AmericanEconomic Review 91-1, 79–98.
Brown, Jeffrey, Liang, Nellie, Weisbenner, Scott, 2006. 401(k) matching contributions in company stock: costs andbenefits for firms and workers. Journal of Public Economics 90, 1315–1346.
Carhart, Mark M., 1997. On persistence in mutual fund performance. Journal of Finance 52, 57–82.Choi, James, Laibson, David,Madrian, Brigitte,Metrick, Andrew, 2004a. For better or for worse: default effects and 401(K)
savings behavior. In: Wise, David. (Ed.), Perspectives in the Economics of Aging. University of Chicago Press,Chicago, pp. 81–121.
2013J.R. Brown et al. / Journal of Public Economics 91 (2007) 1992–2013
Choi, James, Laibson, David, Madrian, Brigitte, Metrick, Andrew, 2004b. Employee's investment decisions aboutcompany stock. In: Mitchell, Olivia S., Utkus, Stephen P. (Eds.), Pension Design and Structure: New Lessons fromBehavioral Finance. Oxford University Press, Oxford, pp. 121–136.
Choi, James, Laibson, David, Madrian, Brigitte, 2006. Why does the law of one price fail? An Experiment on IndexMutual Funds, Working Paper. March 30.
Congressional Budget Office, 1999. Social Security Privatization: Experiences Abroad. January.Daniel, Kent, Grinblatt, Mark, Titman, Sheridan, Wermers, Russ, 1997. Measuring mutual fund performance with
characteristic-based benchmarks. Journal of Finance 52, 1035–1058.Government Accountability Office, 2005. Social Security Reform: Other Countries' Experiences Provide Lessons for the
United States GAO-06-126. October.Gruber, Martin J., 1996. Another puzzle: the growth in actively managed mutual funds. Journal of Finance 51, 783–810.Holden, Sarah, VanDerhei, Jack, 2001. The impact of employer-selected investment options on 401(k) plan participants'
asset allocations: Preliminary findings, Working Paper, Investment Company Institute and Temple University.Huberman, Gur, Sheena Iyengar, Wei Jiang, 2007. Defined contribution pension plans: determinants of participation and
contribution rates. Journal of Financial Services Research 31, 1–32.Huberman, Gur, Jiang, Wei, 2006. Offerings vs. choices in 401(k) plans: equity exposure and number of funds. Journal of
Finance 61-2, 763–801.Huberman, Gur, Sengmueller, Paul, 2004. Performance and employer stock in 401(k) plans. Review of Finance 8-3,
403–443.2005 Investment Company Fact Book, Investment Company Institute, 45th edition. Washington, DC.Jensen, Michael C., 1968. The performance of mutual funds in the period 1945–1964. Journal of Finance 23, 389–416.Karlsson, Anders, Massa, Massimo, Simonov, Andrei, 2006. Portfolio Choice and Menu Exposure, Working Paper.
August.Madrian, Brigitte, Shea, Dennis, 2001. The power of suggestion: inertia in 401(k) participation and savings behavior. The
Quarterly Journal of Economics 116, 1149–1525.Malkiel, Burton G., 1995. Returns from investing in equity mutual funds from 1971 to 1991. Journal of Finance 50,
549–572.Palme, Marten, Sunden, Annika, Soderlind, Paul, 2004. Investment Choice in the Swedish Premium Pension Plan,
Working Paper. December 21.Samuelson, William, Zeckhauser, Richard, 1988. Status quo bias in decision making. Journal of Risk and Uncertainty 1,
7–59 March.