indirect evaporative air conditioning for a … · pg&e’s emerging technologies program...
TRANSCRIPT

PG&E’s Emerging Technologies Program ET12PGE3101
INDIRECT EVAPORATIVE AIR CONDITIONING FOR A RESTAURANT, ROCKLIN CA ET Project Number: ET12PGE3101
Product Managers: Marshall Hunt, Peter Beirmayer Pacific Gas & Electric Company
Prepared By: Jonathan Woolley, Christian Young & Caton Mande Western Cooling Efficiency Center University of California, Davis 215 Sage St Davis, CA 95616 wcec.ucdavis.edu
Issued: September 1, 2015

i
PG&E’s Emerging Technologies Program ET12PGE3101
ACKNOWLEDGEMENTS Pacific Gas and Electric Company’s Emerging Technologies Program is responsible for this project. It was developed as part of Pacific Gas and Electric Company’s Emerging Technology program under internal project number ET12PGE3101. The University of California, Davis Western Cooling Efficiency Center conducted this technology evaluation for Pacific Gas and Electric Company with overall guidance and management from PG&E including Marshall Hunt, Keith Forseman, Peter Beirmayer, Chris Li and Phillip Broaddus.
The project core team is grateful for collaboration and support from Seeley International and L&H Airco who provided major technical input and cooperation throughout the project, and who have shown great leadership in advancing the application of climate appropriate cooling solutions. Much appreciation is also owed to the restaurant that hosted the field evaluation; the management and staff were encouraging and accommodating in all regards.
LEGAL NOTICE This report was prepared for Pacific Gas and Electric Company for use by its employees and agents. Neither Pacific Gas and Electric Company nor any of its employees and agents:
1. makes any written or oral warranty, expressed or implied, including, but not limited to those concerning merchantability or fitness for a particular purpose;
2. assumes any legal liability or responsibility for the accuracy, completeness, or usefulness of any information, apparatus, product, process, method, or policy contained herein; or
3. represents that its use would not infringe any privately owned rights, including, but not limited to, patents, trademarks, or copyrights.
ii
PG&E’s Emerging Technologies Program ET12PGE3101
ABBREVIATIONS AND ACRONYMS CEC California Energy Commission
cfm Cubic Feet Per Minute
COP Coefficient of Performance (dimensionless)
cp Specific Heat Capacity (e.g. Btu/lbm-°F)
CX Concentration (of constituent X) (eg. ppm)
Electric Power, (Rate of Electric Energy Consumption) (e.g. kW)
EA Exhaust Air
EER Energy Efficiency Ratio
Cooling Capacity, (Enthalpy Flow Rate) (e.g. kBtu/h)
Specific Enthalpy (e.g. Btu/lbm-dryair)
IEC Indirect Evaporative Air Conditioner (Indirect Evaporative Cooling)
Mass Flow Rate (e.g. lbm/h)
MMT CO2e Million Metric Tons CO2 Equivalent Greenhouse Gas Emissions
OSA Outside Air
ΔP Differential Static Pressure (e.g. inWC)
PID Proportional Integral Derivative (a generic control scheme for dynamic systems)
RA Return Air
RH Relative Humidity (%)
RTU Rooftop Air Conditioning Unit
SA Supply Air
T Temperature (e.g. °F)
Volume Flow Rate (e.g. scfm)
WBD Wet Bulb Depression
WBE Wet Bulb Effectiveness
iii
PG&E’s Emerging Technologies Program ET12PGE3101
FIGURES FIGURE 1. CONCEPTUAL SCHEMATIC FOR INDIRECT EVAPORATIVE COOLING UTILIZING ONLY OUTSIDE AIR .............................................. 3 FIGURE 2. CONCEPTUAL SCHEMATIC FOR CLIMATE WIZARD UNIT ................................................................................................. 4 FIGURE 3. RESTAURANT INTERIOR VIEW (GOOGLE 2015) AND LINK TO VIEW ONLINE ....................................................................... 5 FIGURE 4. HVAC EQUIPMENT LAYOUT (GOOGLE 2015) ............................................................................................................ 6 FIGURE 5. AIR BALANCE SCHEMATIC ....................................................................................................................................... 7 FIGURE 6. LOCATION OF FIELD DEMONSTRATION SITE AND REGIONAL CLIMATE ZONE MAP ................................................................. 9 FIGURE 7. INSTRUMENTATION SCHEMATIC FOR MONITORING OF THE INDIRECT EVAPORATIVE AIR CONDITIONER .................................. 11 FIGURE 8. A. PHOTO OF THE CLIMATE WIZARD, AND B. RELEVANT MEASUREMENTS COLLECTED FROM OTHER ROOFTOP UNITS ............. 11 FIGURE 9. A. SUPPLY AIRFLOW AND SYSTEM POWER MEASURED AS A FUNCTION OF PRODUCT DAMPER DIFFERENTIAL PRESSURE B.
EXAMPLE TIME SERIES FOR PRODUCT DAMPER DIFFERENTIAL PRESSURE AND THE CALCULATED SUPPLY AIRFLOW .................. 15 FIGURE 10. ENERGY EFFICIENCY RATIO AS A FUNCTION OF OUTSIDE AIR TEMPERATURE FOR A. SENSIBLE SYSTEM COOLING, AND B.
SENSIBLE ROOM COOLING .................................................................................................................................. 17 FIGURE 11. COOLING CAPACITY AS A FUNCTION OF OUTSIDE AIR TEMPERATURE FOR A. SENSIBLE SYSTEM COOLING, AND B. SENSIBLE
ROOM COOLING ............................................................................................................................................... 18 FIGURE 12. A. SUPPLY AIR TEMPERATURE AS A FUNCTION OF OUTSIDE TEMPERATURE B. TIME SERIES FOR SUPPLY AIR TEMPERATURE AND
SUPPLY AIRFLOW RATE ....................................................................................................................................... 19 FIGURE 13. A. SYSTEM POWER DRAW AS A FUNCTION OF OUTSIDE AIR TEMPERATURE , AND B. SUM OF POWER DRAW FROM ALL AIR
CONDITIONERS FOR ONE EXAMPLE DAY .................................................................................................................. 20 FIGURE 14. POWER DRAW FROM EACH COOLING SYSTEM FOR AN EXAMPLE PERIOD IN AUGUST 2013 .............................................. 21 FIGURE 15. A. SUM OF SENSIBLE COOLING GENERATED BY EACH SYSTEM IN EACH HOUR OF THE DAY FOR ONE MONTH B. SUM OF
ELECTRICITY CONSUMED BY EACH SYSTEM IN EACH HOUR OF THE DAY FOR ONE MONTH................................................... 22 FIGURE 16. HOURLY ROOM COOLING LOAD OBSERVED AS A FUNCTION OF OUTSIDE TEMPERATURE ................................................... 22 FIGURE 17. A. WET BULB EFFECTIVENESS AS A FUNCTION OF WET BULB DEPRESSION AND B. WET BULB APPROACH FOR ALL INSTANCES IN
INDIRECT EVAPORATIVE MODE ............................................................................................................................. 23 FIGURE 18. A. SUM OF WATER CONSUMED ON EACH DAY FOR ONE MOTH AND CORRESPONDING DAILY AMBIENT CONDITIONS B. HOURLY
WATER CONSUMPTION RATE AS A FUNCTION OF AMBIENT CONDITIONS FOR FULL SPEED OPERATION .................................. 24 FIGURE 19. A. ENERGY EFFICIENCY RATIO FOR A CONVENTIONAL ROOFTOP UNIT AS A FUNCTION OF OUTSIDE AIR TEMPERATURE B. ENERGY
EFFICIENCY RATIO FOR THE CLIMATE WIZARD AS A FUNCTION OF OUTSIDE AIR TEMPERATURE .......................................... 25 FIGURE 20. A. EXAMPLE TIME SERIES COMPARISON OF MEASURED POWER DRAW TO PROJECTED BASELINE POWER DRAW B. COMPARISON
OF MEASURED ANNUAL ENERGY CONSUMPTION TO PROJECTED BASELINE ENERGY CONSUMPTION ..................................... 25 FIGURE 21. A. AVERAGE DAILY ELECTRIC ENERGY USE AND AVERAGE DAILY GAS CONSUMPTION FOR 2008 – 2015 B. MAXIMUM ELECTRIC
DEMAND IN EACH MONTH FOR 2008‐2015 .......................................................................................................... 26
TABLES TABLE 1. INSTRUMENTATION SCHEDULE ............................................................................................................................... 12

iv
PG&E’s Emerging Technologies Program ET12PGE3101
CONTENTS EXECUTIVE SUMMARY ....................................................................................................................................... V
Project Objectives .................................................................................................................................................. v Technology Review & Results ................................................................................................................................ v Recommendations ................................................................................................................................................ vi
INTRODUCTION.................................................................................................................................................. 1
PROJECT OVERVIEW ........................................................................................................................................... 2
CLIMATE APPROPRIATE COOLING ....................................................................................................................................... 2 TECHNOLOGY BACKGROUND AND OVERVIEW ....................................................................................................................... 3
DESIGN AND APPLICATION ................................................................................................................................. 5
TEST METHODOLOGY ......................................................................................................................................... 8
GENERAL APPROACH ....................................................................................................................................................... 8 MONITORING PLAN ...................................................................................................................................................... 10 DATA ANALYSIS ............................................................................................................................................................ 13 Airflow Measurements ........................................................................................................................................ 13 Calculating Cooling Capacity ............................................................................................................................... 13 Calculating Coefficient of Performance ............................................................................................................... 14 Calculating Wet Bulb Effectiveness ...................................................................................................................... 14
RESULTS ............................................................................................................................................................ 15
Supply Airflow and Unit Power Characteristics .................................................................................................... 15 Energy Efficiency Ratio......................................................................................................................................... 17 Cooling Capacity .................................................................................................................................................. 18 Supply Air Temperature ....................................................................................................................................... 19 Electric Power and Peak Demand ........................................................................................................................ 20 System Prioritization in Sequence of Operations ................................................................................................. 21 Cumulative Cooling & Energy Consumption for All Systems ................................................................................ 22 Wet Bulb Effectiveness ........................................................................................................................................ 23 Water Consumption ............................................................................................................................................. 24 Comparison to Baseline System Efficiency & Energy Consumption ..................................................................... 25 Whole Building Energy Consumption ................................................................................................................... 26
DISCUSSION AND CONCLUSIONS ....................................................................................................................... 27
REFERENCES ...................................................................................................................................................... 28

v
PG&E’s Emerging Technologies Program ET12PGE3101
EXECUTIVE SUMMARY The electricity and gas consumption for cooling, heating, and ventilation account for more than 30% of the annual greenhouse gas emissions associated with commercial buildings in California. This amasses to annual statewide emission of more than 23 MMT CO2e (CEC 2006, CARB 2014). Rooftop packaged air conditioners are largely responsible for this energy consumption – they service approximately 65% of all conditioned commercial floor.
In addition to the greenhouse gas emissions, air conditioning is the most significant contributor to peak demand. California’s electric grid is especially stressed during summer periods when generation requirements can be twice as high as other seasons. On the hottest summer days, air conditioning alone accounts for more than 30% of the peak demand on the statewide electric network (EIA 2012, CEC 2006). Although the massive adoption of solar photovoltaics and other intermittent renewable resources is expected to introduce new dynamic grid management challenges, air conditioning will remain as the largest driver for conventional generating capacity on the network.
There are a variety of emerging products that promise to reduce energy use and electric demand for cooling and ventilation. These new technologies deserve attention because the status quo vapor compression systems are inneficient and block the path to achieving our energy and environmental policy goals. California’s Energy Efficiency Strategic Plan highlights the need for climate appropriate air conditioning technologies – strategies that are especially efficient for hot dry mediteranean climates. Some solutions include:
1. System designs and controls that avoid unnecessary dehumidification and reheat 2. Strategies that benefit from large diurnal temperature swings to reduce or eliminate mechanical cooling 3. Technologies that use water-efficient evaporative techniques for substantial gains in cooling efficiency
The research reported herein directly supports California Energy Efficiency Strategic Plan goals to accelerate marketplace penetration of climate appropriate air conditioning technologies. This study evaluates the performance of one product – the Climate Wizard indirect evaporative air conditioner. For this project, the system was installed as a retrofit for a small restaurant in Rocklin, California. The technology was setup to operate in parallel with three existing rooftop air conditoners, and to provide all ventilation for the space.
The research work was executed by the UC Davis Western Cooling Efficiency Center and the PG&E Emerging Technology Program in collaboration with the customer, and with technical support from the technology manufacturer, and the design-build engineer and controls contractor.
PROJECT OBJECTIVES The main objectives of this project were to:
1. Provide reliable energy and water performance data for the technology in real world operation 2. Facilitate, review, and document application and operation of the technology 3. Develop practical design guidance and recommendations based on in field experience with the technology
To accomplish these objectives, the research team collaborated closely with the manufacturer and the controls contractor to understand the way in which the technology was applied, then installed a thorough instrumentation scheme to monitor thermodynamic and electrical performance of the Climate Wizard.
TECHNOLOGY REVIEW & RESULTS This study demonstrated that the indirect evaporative air conditioner operates with extraordinary cooling efficiency. At times, we observed EER>80 for operation at part speed during mild conditions. At peak conditions, when conventional air conditioners might operate with EER < 8.0, the Climate Wizard consistently achieved EER=50–60. Moreover, while evaporative coolers have traditionally been limited to cooling toward the wet bulb temperature, this indirect evaporative system is uniquely capable of coling air well beyond the supposed limit. A good direct evaporative system may cool with 85% effectiveness, while this system regularly operates with 100–120% effectiveness. Part speed operation achives wet bulb effectiveness as high as 130%. The supply air temperatures achieved by this unit are nearly as low as that of a conventional air conditioner. This is a meaningful breakthrough since it enables evaporative cooling to cover the cooling needs in a wider array of climates and applications.
vi
PG&E’s Emerging Technologies Program ET12PGE3101
Despite the clear performance advantages demonstrated by the technology, this study also found that the project did not achieve annual energy savings for the building, and did not reduce peak demand from the site. This failure can be attributed to the way that the technology was applied in the building, and to the way that it was controlled.
Section “Comparison to Baseline System Efficiency & Energy Consumption” presents a hypothetical estimate of how much energy could have been saved if the baseline scenario had operated in a comparable way to the retrofit. The hypothetical assessment suggests that the system used 68% less electricity than a conventional rooftop unit would have for the same sensible cooling capacity, with a peak demand reduction of 90%. However, as a result of the way that the system was managed in reality:
1. The indirect evaporative system did not dislodge operation for the conventional rooftop units 2. The indirect evaporative system operated for many hours when air conditoing was not needed 3. Peak demand increased because the connected load increased 4. The new air balance scheme may have resulted in an unintended increase for heating loads
RECOMMENDATIONS Indirect evaporative cooling offers an opportunity for substantial cooling energy savings. The efficiency demonstrated by the strategy is currently not matched by other market available commercial air handling products. Moreover, indirect evaporative cooling promises substantial peak demand savings without the need for load shifting, and without the consequences of demand response. However, as this study exemplifies, the technology is largely unfamiliar to practitioners and the nuances of application and control can substantially reduce the energy and demand savings that are realized. The challenges observed in this project are not flaws with the indirect evaporative cooling technology per se – they are typical of issues encountered by most emerging technologies. However, the experiences in this project do highlight the importance of careful application and control for the technology.
We strongly recommend further efforts to advance the broad application of indirect evaporative cooling. The technology directly supports California Energy Efficiency Strategic Plan goals related to climate appropriate air conditioning. The initiatives outlined there target 50% improvement in efficiency by 2020, and a 75% improvement by 2030. However, a broad range of efforts are needed to help to transform the marketplace in different ways. While incentive programs can help to offset challenges with capital cost constraints, a narrow focus on financial rebate products will only have limited effect. Utilities and other industry stakeholders should engage in and support activities and initiatives such as:
1. Demonstrations and case studies that illustrate best practices and which validate savings achieved 2. Outreach and professional training programs that build familiarity with the technology 3. Development of design guidelines and industry standards for performance ratings 4. Expansion and validation of building energy simulation tools capable of modeling these technologies 5. Rebate programs that link financial incentives to verified savings 6. Development of controls strategies that allow for simple and reliable application 7. Evolution of technology capabilities to ensure more fool proof application 8. Application of fault detection and diagnostic functions to ensure appropriate operation and performance
As identified in the California Energy Efficiency Strategic Plan, energy savings and demand reduction for HVAC in commercial buildings will require “long-lasting sustainable changes in the structure or functioning of the market”. Technology is available to deliver the level of savings that is desired for cooling in commercial buildings, but achieving broad and successful adoption will require the coordinated action of a variety of market actors who affect the availability, application, and operation of these systems.

1
PG&E’s Emerging Technologies Program ET12PGE3101
INTRODUCTION This report presents findings from a field study of the Climate Wizard indirect evaporative air conditioner installed as a retrofit at a small restaurant in Rocklin, CA. The study broadens general understanding about application of indirect evaporative cooling systems, documents the level of performance that is achievable by this HVAC efficiency measure, and identifies opportunities for improved integration and control in future applications. The study contributes directly to California Energy Efficiency Strategic Plan goals that aim to advance broad marketplace application of climate-appropriate HVAC technologies.
Cooling and ventilation account for more than 25% of the annual electricity consumption for commercial buildings in California. If natural gas uses are also considered, heating, cooling and ventilation typically account for more than 35% of the annual primary energy footprint for a commercial building (EIA 2012). Further, HVAC accounts for more than 30% of the greenhouse gas emissions associated with commercial buildings in California, amounting to statewide emission of more than 23 MMT CO2e (CEC 2006, CARB 2014). Efficiency for these systems must improve to reach strategic environmental goals, and state policy targets related to energy and climate change.
Air conditioning is the largest contributor to electrical demand at peak. Rooftop units are usually the largest connected load in a commercial building, and can account for more than 50% of the on-peak demand from commercial facilities. California’s electric grid is especially stressed during summer periods when generation requirements can be twice as high as other seasons. On the hottest summer days, air conditioning alone accounts for more than 30% of the peak demand on the statewide electric network (EIA 2012, CEC 2006). Therefore, it is especially important that cooling efficiency measures address electrical demand at peak. This is a unique challenge that is not easily achieved. For example, advanced variable speed rooftop air conditioners may achieve substantial annual energy savings, but they generally do not provide significant benefits at peak.
Indirect evaporative air conditioning is one strategy to reduce energy use for cooling in buildings. The technology is most often configured to replace conventional rooftop air conditioners (RTUs), which are predominately responsible for heating and cooling in commercial buildings. Rooftop units utilize technology that has not evolved to keep pace with the efficiency improvements that have been achieved for other key end-use systems – such as lighting. Indirect evaporative may not replace all of the rooftop air conditioners on a building; often it must be applied in combination with vapor-compression to achieve adequate cooling at all times. However, the technology offers a pathway to reduce energy use for cooling by roughly 40-65% and has demonstrated substantial peak demand savings.
Indirect evaporative cooling is especially well suited to California climates and to alleviating California’s challenges with peak electrical demand. Whereas cooling capacity and efficiency of vapor-compression systems is generally lower at high outdoor air temperatures, the capacity and efficiency for indirect evaporative cooling components is improved when treating high temperature outdoor air. Subsequently, the largest savings can be achieved when indirect evaporative is applied to supply ventilation cooling requirements. The technology also provides some room cooling capacity and so reduces the amount of sensible room cooling that is required from compressor systems.
This study focuses on application of the Climate Wizard indirect evaporative air conditioner in a small restaurant. Food service is a significant commercial building energy use sector. In California, these buildings account for almost 10% of the electrical use, and 25% of the natural gas use for all commercial facilities. Next to grocery stores, food service facilities have the highest annual electric energy use intensity of all commercial buildings – more than twice that of any other building type (CEC 2006). Luckily, there are a variety of technical opportunities to reduce energy use in these buildings. However, most restaurants are relatively small, and the restaurant market is characterized by disaggregate ownership and by a variety of challenges such as the principal-agent problem. These factors complicate the pathway to quick adoption of efficiency measures in food service facilities, creative efforts will be required to overcome these challenges. The technology studied here is an appealing measure because it offers major cooling energy savings without requiring substantial renovation or replacement of existing equipment.
The core of this study documents characteristic performance of the Climate Wizard across a wide range of operating conditions. However, it is important to recognize that the savings achieved by this technology in practice will depend significantly on factors such as control strategies and building air distribution characteristics. Accordingly, this study also reviews the overall design and application of the system, and presents clear recommendations as guidelines to help future projects achieve the greatest possible energy savings.

2
PG&E’s Emerging Technologies Program ET12PGE3101
PROJECT OVERVIEW CLIMATE APPROPRIATE COOLING California’s Long Term Energy Efficiency Strategic Plan outlines four major programmatic initiatives, as “Big Bold Energy Efficiency Strategies” to facilitate broad energy savings for our built environment:
All new residential construction will be zero net energy by 2020 All new commercial construction will be zero net energy by 2030 HVAC will be transformed to ensure that its energy performance is optimal for California’s climate All low-income customers will have the opportunity to participate in energy efficiency programs by 2020
The third initiative targets a 50% efficiency improvement for HVAC by 2020, and a 75% improvement by 2030. The plan recognizes that cooling and ventilation is the single largest contributor to peak electrical demand in California, which results in “enormous and costly impacts on generation, transmission, and distribution resources as well as a concurrent lowering of utility load factors.” Strategic goals to transform the HVAC industry focus on:
1. Code compliance 2. Quality installation and maintenance 3. Whole-building integrated design practices, and 4. Development and accelerated implementation of new climate-appropriate equipment and controls
The efficiency measure studied in this project specifically targets the fourth goal: it advances the evaluation and application of climate appropriate systems and controls. Air conditioning equipment has traditionally been designed and rated according to a single number efficiency metric that does not accurately represent the performance of air conditioners in California climates. Optimizing for this metric, manufacturers have mainly sold a single type of air conditioner that functions reliably in any climate, but is also inefficient in every climate. Luckily, there are many climate appropriate technologies and system design strategies that use far less energy than the “one-size fits all” approach. Climate appropriate air conditioning systems and controls are designed and tuned specifically for local climate conditions, and occupant comfort needs; they provide an equal (or better) quality of service with less energy input. Some examples of cooling strategies appropriate for California climates include:
Sensible-only cooling measures that do not waste energy on unnecessary dehumidification Indirect evaporative cooling (and other evaporative measures), when water is used efficiently Advanced economizer controls, natural ventilation cooling, nighttime ventilation pre-cooling, and other
passive or semi-active systems that capitalize on large diurnal outdoor temperature swings to reduce the amount of active cooling required at other periods
Adaptive comfort controls, and predictive control strategies that conserve energy by allowing indoor conditions to drift across a wider range, in concert with dynamic human comfort considerations.
Any technology that uses substantially less energy for cooling (especially at peak) than the industry standard “one size fits all” minimum efficiency equipment
Climate appropriate cooling technologies have reliably demonstrated peak demand reduction of more than 40% (Woolley 2012). Some solutions have shown annual cooling energy savings beyond 65% (Harrington 2015).
One should also note that current single number industry standard rating methods are generally not appropriate for describing performance of climate appropriate technologies. The problem is not that the limited range of standard test conditions are not exactly representative of every application in California; the issue is that the standard methods of test can actually portray climate optimized products as less efficient than traditional air conditioners. These standards unintentionally disadvantage climate appropriate strategies by misrepresenting their performance in comparison to the status quo. In many circumstances climate appropriate strategies cannot even be tested by industry standard methods because they operate in configurations that are fundamentally different than the scenario for which current standards were designed. This shortcoming is especially true for whole building integrated design practices.
The project reported here contributes to a body of research, evaluation, and pilot demonstrations recently advanced by PG&E and other California entities to advance the understanding and market introduction of climate appropriate HVAC solutions. The findings from this project should guide the development and implementation of programs and policies designed to accelerate the broad and successful uptake of these solutions for new and existing buildings.

3
PG&E’s Emerging Technologies Program ET12PGE3101
TECHNOLOGY BACKGROUND AND OVERVIEW Indirect evaporative air conditioners employ specially designed heat exchangers that use water evaporation in one air stream to impart sensible cooling to another air stream without any moisture addition to the conditioned space. The wetted air stream is generally referred to as the “secondary” air stream. At its outlet the secondary air stream is typically near 100% relative humidity and is exhausted to outdoors. The dry side of an indirect evaporative device is referred to as the “primary” air stream.
Indirect evaporative cooling can be very efficient. It is different from a direct evaporative cooling in three significant ways: (1) does not add moisture to the conditioned space; (2) can cool to a lower temperature; and (3) exhausts a portion of the air moved. Subsequently, indirect evaporative systems require more fan power per delivered air-flow (W/cfm) than a conventional direct evaporative cooler. Since the fan(s) in an indirect evaporative cooler are the only significant energy consuming component(s), the details of heat exchanger design can result in significant differences for equipment performance and energy efficiency.
There are a variety of configurations for indirect evaporative systems. Some equipment is constructed using cross-flow plate heat exchangers similar to those utilized for exhaust heat recovery, some utilize a tube-in-flow approach similar to an evaporative fluid cooler, while other systems utilize heat pipes or runaround hydronic circuits to transfer heat between two physically separate airstreams. The Climate Wizard studied in this project uses a specially developed polymer heat exchanger that uses a portion of the primary air stream as the inlet for the secondary air stream. As a result, these systems can generate product air at a temperature lower than the wet-bulb of the system inlet. This is possible because flow diverted from the primary air stream has already been cooled sensibly and therefore enters the secondary channels with a wet-bulb temperature that is lower than at the system inlet. As evaporation occurs in the secondary air stream the process drives product air toward the lower wet-bulb temperature.
FIGURE 1. CONCEPTUAL SCHEMATIC FOR INDIRECT EVAPORATIVE COOLING UTILIZING ONLY OUTSIDE AIR
Some indirect evaporative cooling systems can utilize building exhaust air as the source for the secondary air stream. This approach is beneficial for system efficiency because it effectively combines heat recovery with indirect evaporative cooling to increase the system cooling capacity. Other systems have mixed return air with outside air as the source for primary air-flow, not unlike a conventional packaged rooftop unit.
The technology studied here uses outside air only. Roughly half of the primary flow is diverted as inlet for the secondary air stream. The remaining primary flow is delivered to the room as supply air, and the secondary flow is exhausted. This type of system provides positive pressurization of a building, and requires some air relief, or building exhaust to maintain air balance within the building. While exhaust air exits the system near saturation, this air-flow is cooler than outside air, and so in some cases may be applied for some useful purpose.
As the results of this study show, indirect evaporative air conditioners can achieve much higher sensible cooling efficiencies than conventional vapor-compression systems. The technology has the greatest benefit when used for cooling code-required ventilation air. In fact, the full-speed system cooling capacity and efficiency of these systems increase as outside air temperature increases. However, while indirect evaporative air conditioners can sustain the room-cooling requirements in commercial applications for many hours, they are typically not able to cover the peak sensible room-cooling loads. Accordingly, the current state of indirect evaporative cooling must usually be applied to operate in cooperation with vapor-compression systems. There are many applications where indirect evaporative
Product Air
Secondary Flow
Primary Flow Primary Inlet
Exhaust Air
Water Evaporation
Sensible Heat Transfer

4
PG&E’s Emerging Technologies Program ET12PGE3101
cooling may be sufficient without supplementary mechanical cooling, however this pilot was mainly concerned with an application where vapor-compression cooling would be needed at times for adequate cooling.
The system studied here utilized a variable speed fan. This allows the equipment to operate at part speed during part load conditions. Since fan power declines rapidly as air-flow decreases, part speed operation can achieve higher cooling efficiency. However, since the system operates with 100% outside air it makes sense to use product air to meet ventilation requirements for a space. Under such a scenario, the potential for part speed operation can be limited since the equipment must continue to provide ventilation regardless of load.
Air Filters Pumps
Variable Speed Fan Sump
Drain Solenoid Ind. Evap. Heat Exchanger
Balancing Damper
FIGURE 2. CONCEPTUAL SCHEMATIC FOR CLIMATE WIZARD UNIT
Since the cooling-capacity for the system is directly coupled to its flow rate, there can be a mismatch between instantaneous room-cooling needs and ventilation requirements. In certain scenarios, and without proper control, this could result in overcooling a zone. When indirect evaporative air conditioners are used to supply ventilation air, and to operate together with vapor-compression, we find that there are several main technical constraints that must be addressed as part of the engineering design for the overall HVAC systems:
1. Systems must maintain ventilation requirements without overcooling the zone 2. Systems must maintain ventilation requirements even when heating is required 3. Controls should give priority to indirect evaporative cooling over vapor-compression cooling 4. Controls should give priority to economizer cooling over indirect evaporative cooling 5. Systems should not impact air flow distribution in a way that tends to increase the total cooling required 6. Design must maintain proper balance for the overall HVAC system
12
7
Exhaust
Out
side
Air
Water In
Drain
5
6
3 4
Pro
duct
Air
1
2
3 6
7
4
5
5
PG&E’s Emerging Technologies Program ET12PGE3101
The product evaluated here is a stand-alone indirect evaporative air conditioner, not a hybrid system that incorporates other components and functions. Application of the system in a way that achieves these technical constraints currently requires custom engineering and controls. The following section, Design and Application, discusses the way that the technology was applied and controlled in this study.
Generally, it is expected that the Climate Wizard will not have adequate capacity to address all room cooling loads in a building. In these cases it would operation in concert with other cooling components. However, it does have significantly more cooling capacity than is needed to deliver room-neutral ventilation air. Previous laboratory testing showed that in western climate conditions, the Climate Wizard is always more efficient at sensible room cooling than a conventional vapor-compression system operating as recirculation only. Therefore, whenever the Climate Wizard can contribute room cooling capacity in place of less efficient cooling components, it will provide additional energy savings beyond its role as a ventilation cooling system.
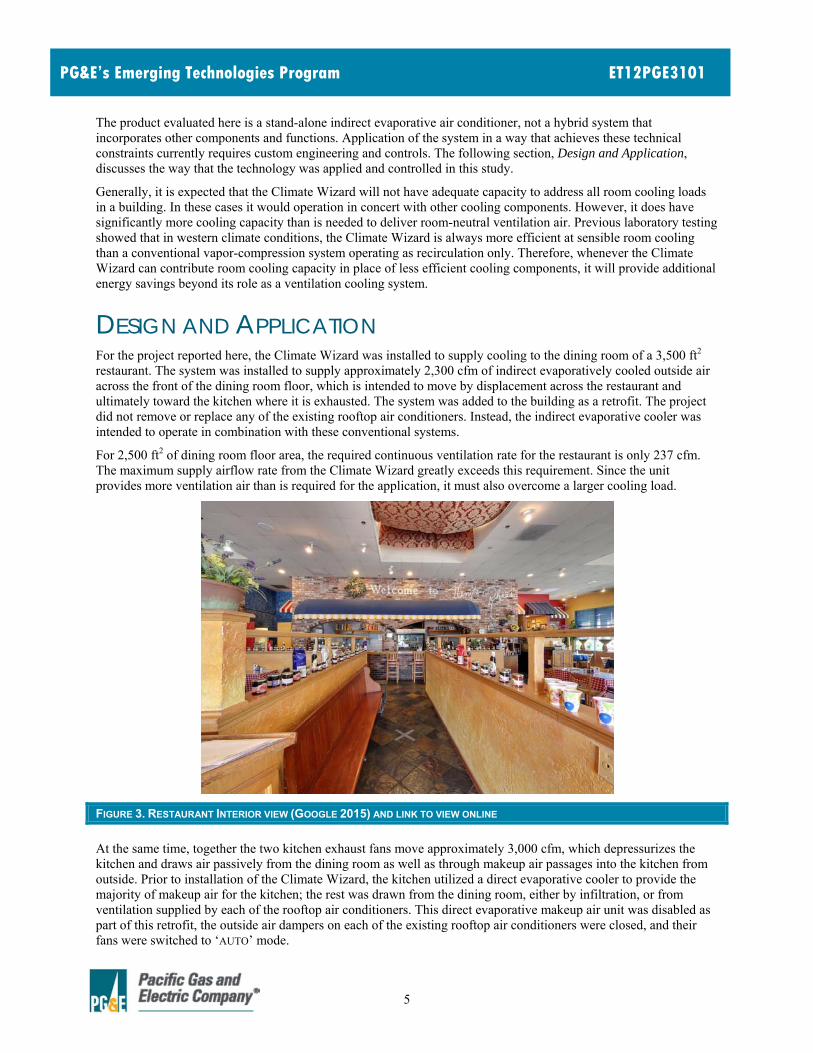
DESIGN AND APPLICATION For the project reported here, the Climate Wizard was installed to supply cooling to the dining room of a 3,500 ft2 restaurant. The system was installed to supply approximately 2,300 cfm of indirect evaporatively cooled outside air across the front of the dining room floor, which is intended to move by displacement across the restaurant and ultimately toward the kitchen where it is exhausted. The system was added to the building as a retrofit. The project did not remove or replace any of the existing rooftop air conditioners. Instead, the indirect evaporative cooler was intended to operate in combination with these conventional systems.
For 2,500 ft2 of dining room floor area, the required continuous ventilation rate for the restaurant is only 237 cfm. The maximum supply airflow rate from the Climate Wizard greatly exceeds this requirement. Since the unit provides more ventilation air than is required for the application, it must also overcome a larger cooling load.
FIGURE 3. RESTAURANT INTERIOR VIEW (GOOGLE 2015) AND LINK TO VIEW ONLINE
At the same time, together the two kitchen exhaust fans move approximately 3,000 cfm, which depressurizes the kitchen and draws air passively from the dining room as well as through makeup air passages into the kitchen from outside. Prior to installation of the Climate Wizard, the kitchen utilized a direct evaporative cooler to provide the majority of makeup air for the kitchen; the rest was drawn from the dining room, either by infiltration, or from ventilation supplied by each of the rooftop air conditioners. This direct evaporative makeup air unit was disabled as part of this retrofit, the outside air dampers on each of the existing rooftop air conditioners were closed, and their fans were switched to ‘AUTO’ mode.

6
PG&E’s Emerging Technologies Program ET12PGE3101
These changes substantially shifted the airflow distribution scheme in the facility. Most importantly, the ventilation rate on the dining room floor was increased to a point well beyond the standard prescribed target ventilation rate, and conditioned air from the dining room is now drawn into the kitchen to provide makeup air. This change increases the amount of conditioning that is required to maintain comfort in the dining room.
The design concept that was deployed here does not align with California’s 2013 Building Energy Efficiency Standards (CEC 2012). Namely, the standards do not permit increasing the general ventilation supplied to a space in order to serve the makeup air requirements of a large kitchen exhaust system. Doing so introduces excess conditioning loads for the dining room. The approach that is applied does not comply with any of the perscripitve options listed in Title 24 140.9 (b) 2 - Kitchen Ventilation.
FIGURE 4. HVAC EQUIPMENT LAYOUT (GOOGLE 2015)
5
IEC
EXH
RTU 1
RTU 2
MAU
RTU 4
RTU 3
EXH

7
PG&E’s Emerging Technologies Program ET12PGE3101
According to 140.9 (b) 2 - Kitchen Ventilation (CEC 2012):
B. A … facility having a total … kitchen hood exhaust airflow rate greater than 5,000 cfm shall have one of the following:
a. At least 50% of all replacement air is transfer air that would otherwise be exhausted; or b. Demand ventilation system(s) on at least 75% of the exhaust air.
… …
c. Listed energy recovery devices with a sensible heat recovery effectiveness of not less than 40% on at least 50% of the total exhaust airflow; and
d. A minimum of 75% of makeup air volume that is: i. Unheated or heated to no more than 60°F; and
ii. Uncooled or cooled without the use of mechanical cooling.
Technically, the building studied here does comply with the letter of the standard because the total kitchen exhaust ventilation rate is less than 5,000 cfm. However, the practice does not align with the concept of the standard, and might not be allowed when scaled up in practice for larger restaurants.
However, increasing the general ventilation rate with an indirect evaporative cooler does not result in the same energy penalty that would be incurred for an increased ventilation rate in a vapor-compression system. In fact – as discussed later in the Results section – the sensible room cooling efficiency for the Climate Wizard is always higher than the room cooling efficiency for a recirculation only vapor-compression system. This is even true at high ambient conditions. From this perspective, the added ventilation rate and changed air distribution scheme should actually result in reduced energy consumption. However, it is not indubitably clear that the increase in ventilation rate associated with indirect evaporative cooling will always save energy compared to vapor-compression cooling with less ventilation air. Other field observations have suggested that the significant changes in airflow distribution can void the opportunity for overall energy savings in some circumstances. The question deserves further consideration, and will certainly need to be addressed within California’s Building Energy Efficiency Standards and within future design guidelines.
Best practices for design makeup air systems that meet these goals have been well documented elsewhere, including through the Food Service Technology Center’s Commercial Kitchen Ventilation Design Guides (AEC 2002).
FIGURE 5. AIR BALANCE SCHEMATIC
Figure 5 illustrates the schematic air balance for the building as configured for this project. It should be noted that since cooling capacity for the indirect evaporative air conditioner is tied inextricably to airflow from the system, the whole air balance scheme for the building may change from day to day and season to season in response to cooling load. This is a unique challenge that might complicate the proper balance of makeup air in the restaurant. The most significant example is in the wintertime when the indirect evaporative air conditioner is not enabled. At this time the makeup air for the kitchen exhaust must come from somewhere, and since it is not supplied directly to the kitchen it
0 – 2,300 cfm
KITCHEN
Indirect Evap AC RTUs (TYP 3)
Exhaust
DINING ROOM
~3,000 cfm
~400 – 3,000 cfm
Passive Makeup
Transfer
Infiltration

8
PG&E’s Emerging Technologies Program ET12PGE3101
will consequently increase the amount of ventilation in the dining room and will increase heating required in the dining room. A similar issue may occur on other days when the indirect evaporative cooler operates at part speed.
In the cooling season, there could be some opportunity to utilize the variable speed indirect evaporative system to maintain balanced makeup air in combination with a demand controlled kitchen ventilation system. However, conflict would regularly arise between the required cooling capacity and the required makeup air. It is not clear what strategy could be utilized to serve both needs most appropriately. Possibly, future versions of indirect evaporative air conditioners could be controlled to adjust supply air temperature and supply airflow rate separately.
Proper application of indirect evaporative cooling should control all systems in such a way that the indirect evaporative system is used as the priority source for cooling. An efficient cooling machine will not generate savings if it does not displace the operation of less efficient cooling systems. This goal can be difficult to accomplish. If the system is installed without an integrated controls system that coordinates operation of all systems, there is nothing to keep the conventional air conditioners from operating as priority – in which case the indirect evaporative air conditioner would not operate at all.
It has been recommended that the setpoint for the Climate Wizard be programmed to remain at 3 °F lower than the setpoint for conventional air conditioners. In this way, the indirect evaporative cooler would be given ample opportunity to provide cooling and vapor-compression systems would only operate if indirect evaporative cooling did not provide adequate capacity. However, there are two main problems with this approach. First, holding the setpoint 3 °F lower than is needed to maintain comfort can have significant implications to overall energy use in a facility. It should be better to coordinate the operation of systems in a more sophisticated way that maintains the least energy intensive set point but keeps the indirect evaporative cooler as priority. This could be accomplished with PID control sequences, or with model predictive control. Second, it is not reasonable to expect that separate manual controls in a light commercial building could be reliably coordinated in the long term. For example, if a user were to accidentally adjust the setpoint on one rooftop unit thermostat, it could obviate all savings opportunity for the Climate Wizard. These issues underline the importance of integrated controls for all affected HVAC systems in a building that employs indirect evaporative cooling.
Furthermore, there are some complications with coordination of multiple systems in a building when some operate as recirculation, and some cool by displacement. For example, in the building studied here, transfer air from the dining room to the kitchen passes mostly through a passageway at the southwestern corner end of the dining room. Supply air from the Climate Wizard is delivered across the eastern flank of the dining room, mixes some within the vicinity of the diffusers and passes by displacement toward the kitchen passageway. This leaves the northeast corner of the restaurant somewhat underserved by indirect evaporative cooling. Moreover, since some air passes across the zones by displacement, application of indirect evaporative cooling can complicate the thermal interaction between zones that were previously more isolated. For example, in the current application, there is a substantial amount of transfer air pulled into the kitchen from the restaurant dining room. Depending on the location of sensors used for control of the rooftop units, this transfer air might be displaced from the room without impacting the sensor used for control. At the same time, the increased transfer air also would also help to maintain more comfortable conditions in the kitchen, without any additional cooling in the kitchen. From this perspective, it could be argued that drawing all kitchen makeup air from the dining room has comfort benefits, even if the annual energy use implications of the increased ventilation rate on the sales floor is uncertain.
TEST METHODOLOGY GENERAL APPROACH The overarching intent of this pilot was to explore, evaluate, and advance the application of an indirect evaporative air conditioner installed as retrofit to a small restaurant. The technology was laboratory tested by UC Davis and PG&E in 2014 (Harrington 2015, Davis 2015), and was studied in a separate field project in 2012 and 2013 (Woolley 2014). This field study builds from the findings of those two studies and expands the understanding about the opportunities and challenges surrounding application of this technology in various scenarios. This field study focuses mainly on evaluation of characteristic performance for the indirect evaporative air conditioner across a range of operating conditions, presents some observations related to interactions with other equipment in the building, and utilizes electric meter data to describe whole building energy use for multiple years before and after the retrofit.

9
PG&E’s Emerging Technologies Program ET12PGE3101
The results presented here provide a clear map of performance for the Climate Wizard across a range of fan speeds and ambient operating conditions. This characterization could serve as the basis for building energy simulations and other analysis designed to project savings in various applications and climates. Results from this field evaluation corroborate the very high cooling efficiency that was observed in laboratory tests, as well as a previous field evaluation. However, while the laboratory study estimated that the technology could reduce peak demand by 20% and annual cooling energy use by 65%, the whole building meter data from this project does not support such substantial savings estimates.
The restaurant selected for this field evaluation constitutes an excellent setting for field evaluation of the technology. First, at ~38 kWh/ft2-yr, the site compares well with the reported average electric energy use intensity for restaurants in California of 40.2 kWh/ft2-yr. The buildings natural gas energy use intensity of 250 kBtu/ft2-year also compares reasonably well with statewide averages of 210 kBtu/ft2-year (CEC 2006). Second, small restaurants represent a unique energy end user, and these facilities have unique design considerations for which indirect evaporative cooling should be well suited, and from which we can learn about the possibilities and limitations of the technology.
FIGURE 6. LOCATION OF FIELD DEMONSTRATION SITE AND REGIONAL CLIMATE ZONE MAP
Figure 5 identifies the site location on a regional climate zone map. Rocklin is located in California Climate Zone 11, in Placer County, in the low foothills on the eastern end of the Sacramento metro area. The site experiences hot and dry summer days, with large diurnal temperature shifts. Average daily high temperature from June – September is 87 – 95 °F, though daily high temperature above 100 °F is a regular occurrence, and record highs are above 110 °F. The 0.4% design condition for the Sacramento region is 101.6 °F and 68.8 °F mean coincident wet bulb (ASHRAE 2009). The average nighttime low temperature in the summer period is 58 – 61 °F (NOAA 2015). The region experiences cool winters with average daily high temperature 53–60 °F. Rocklin usually freezes a few nights each year – the record low for the region is 16 °F.
Design and application of the measure was facilitated mainly by L&H Airco, in cooperation with PG&E, Seeley International, and the customer. UC Davis provided initial design consultation to the team prior to installation, and then later encouraged a revision to controls in order to ensure proper coordination of the systems. The system was initially installed in August 2012 and the controls revision occurred in May 2013. In May 2013, UC Davis installed a thorough suite of instrumentation to monitor thermodynamic performance of the unit, as described in the following section Monitoring Plan. Data for the Climate Wizard was collected on one-minute intervals starting the first week in May 2013. Monitoring was expanded in July 2013 to capture operating status and power draw from the three conventional rooftop units. Minute-by-minute data collection persisted through the conclusion of the study.
The results for characteristic system performance presented in this report focus on data from July 2014. This period of time experienced a wide range of ambient conditions and serves as a good example of regular summertime operations. Operating data is available for two full summers of operation. Data presented for whole building energy consumption spans from 2008 – 2015.
10
PG&E’s Emerging Technologies Program ET12PGE3101
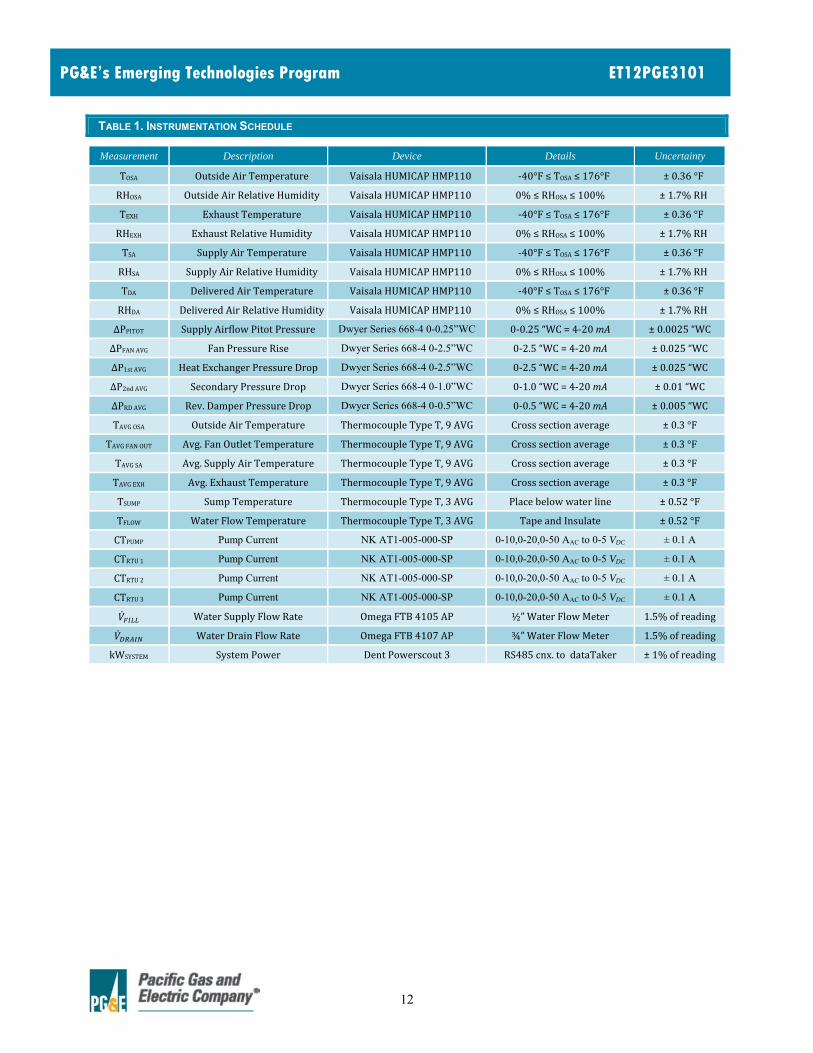
MONITORING PLAN The research team developed a monitoring plan that allowed for (1) assessment of overall performance for system inputs and outputs, as well as (2) evaluation of sub-component performance characteristics. The study also collected data about other rooftop units on the building, and about whole building energy consumption, in order to characterize building scale effects. The monitoring scheme utilized for the study is illustrated schematically in Figure 7. Figure 8 identifies the current measurements that were made on other rooftop units at the facility. Table 1 provides a simple description of each measurement marked in the instrumentation schematic, and documents the performance specifications for the sensors utilized for each corresponding measurement. Some important attributes about the monitoring approach include:
Current transducers listed in the monitoring plan are used mainly for sensing component operations to determine operating status, not for determining power consumption
System amperage, line voltage, and power factor are recorded to accurately determine the total power draw for the Climate Wizard in each minute of operation
The combined temperature and humidity measurements identified in the schematic represent single-point measurements and not space averages
Each space average temperature measurements identified in the schematic utilizes an array of nine parallel thermocouple junctions that are electrically averaged and measured as a group
Outside air temperature is measured in a radiation shield, and immediately next to the outside air intake Delivered air temperature and humidity was measured in the supply air duct immediately before the nearest
diffuser
Analog and digital measurements from the unit were collected by a data acquisition module located on board the equipment. The data acquisition device connects wirelessly to the EDGE cellular network and communicates records to an SFTP sever hosted by UC Davis. One minute interval data was collected from the system over the course of the study, with minor gaps during any period when the equipment was shut down for service, or for the purposes of diagnostic measurements. The minute interval data was stored on board the data acquisition module for 24 hours, then automatically uploaded over the EDGE cellular network to the SFTP server. Data for each unit is collected on this server as a separate CSV file each day.
Raw day-by-day datasets for each unit were concatenated into larger datasets that group minute interval data into month long time series sets. These month-long files were then used as manageable chunks for further data analysis and visualization. One minute increment data was collected from May 2013 through until the conclusion of this study.

11
PG&E’s Emerging Technologies Program ET12PGE3101
FIGURE 7. INSTRUMENTATION SCHEMATIC FOR MONITORING OF THE INDIRECT EVAPORATIVE AIR CONDITIONER
FIGURE 8. A. PHOTO OF THE CLIMATE WIZARD, AND B. RELEVANT MEASUREMENTS COLLECTED FROM OTHER ROOFTOP UNITS
T/RH OSA (°F)
CT PUMP (A)
T FLOW (°F)
kWSYS (kW)
CTFAN (A)
TSUMP (°F)
TOSAAVG (°F)
ΔPFANAVG (“WC)
TFAN OUT AVG (°F)
TEXH AVG (°F)
ΔP2NDAVG (“WC)
T/RH EXH (°F)
ΔPRDAVG (“WC)
T/RH DA (°F)
ΔP PITOT (“WC)
T/RH SA (°F)
TSAAVG (°F)
CT RTU 1
CT RTU 2
CT RTU 3
B
A
12
PG&E’s Emerging Technologies Program ET12PGE3101
TABLE 1. INSTRUMENTATION SCHEDULE
Measurement Description Device Details Uncertainty
TOSA OutsideAirTemperature VaisalaHUMICAPHMP110 ‐40°F≤TOSA≤176°F ±0.36°F
RHOSA OutsideAirRelativeHumidity VaisalaHUMICAPHMP110 0%≤RHOSA≤100% ±1.7%RH
TEXH ExhaustTemperature VaisalaHUMICAPHMP110 ‐40°F≤TOSA≤176°F ±0.36°F
RHEXH ExhaustRelativeHumidity VaisalaHUMICAPHMP110 0%≤RHOSA≤100% ±1.7%RH
TSA SupplyAirTemperature VaisalaHUMICAPHMP110 ‐40°F≤TOSA≤176°F ±0.36°F
RHSA SupplyAirRelativeHumidity VaisalaHUMICAPHMP110 0%≤RHOSA≤100% ±1.7%RH
TDA DeliveredAirTemperature VaisalaHUMICAPHMP110 ‐40°F≤TOSA≤176°F ±0.36°F
RHDA DeliveredAirRelativeHumidity VaisalaHUMICAPHMP110 0%≤RHOSA≤100% ±1.7%RH
∆PPITOT SupplyAirflowPitotPressure Dwyer Series 668-4 0-0.25”WC 0‐0.25“WC=4‐20mA ±0.0025“WC
∆PFANAVG FanPressureRise Dwyer Series 668-4 0-2.5”WC 0‐2.5“WC=4‐20mA ±0.025“WC
∆P1stAVG HeatExchangerPressureDrop Dwyer Series 668-4 0-2.5”WC 0‐2.5“WC=4‐20mA ±0.025“WC
∆P2ndAVG SecondaryPressureDrop Dwyer Series 668-4 0-1.0”WC 0‐1.0“WC=4‐20mA ±0.01“WC
∆PRDAVG Rev.DamperPressureDrop Dwyer Series 668-4 0-0.5”WC 0‐0.5“WC=4‐20mA ±0.005“WC
TAVGOSA OutsideAirTemperature ThermocoupleTypeT,9AVG Crosssectionaverage ±0.3°F
TAVGFANOUT Avg.FanOutletTemperature ThermocoupleTypeT,9AVG Crosssectionaverage ±0.3°F
TAVGSA Avg.SupplyAirTemperature ThermocoupleTypeT,9AVG Crosssectionaverage ±0.3°F
TAVGEXH Avg.ExhaustTemperature ThermocoupleTypeT,9AVG Crosssectionaverage ±0.3°F
TSUMP SumpTemperature ThermocoupleTypeT,3AVG Placebelowwaterline ±0.52°F
TFLOW WaterFlowTemperature ThermocoupleTypeT,3AVG TapeandInsulate ±0.52°F
CTPUMP Pump Current NK AT1-005-000-SP 0-10,0-20,0-50 AAC to 0-5 VDC ± 0.1 A
CTRTU1 Pump Current NK AT1-005-000-SP 0-10,0-20,0-50 AAC to 0-5 VDC ± 0.1 A
CTRTU2 Pump Current NK AT1-005-000-SP 0-10,0-20,0-50 AAC to 0-5 VDC ± 0.1 A
CTRTU3 Pump Current NK AT1-005-000-SP 0-10,0-20,0-50 AAC to 0-5 VDC ± 0.1 A
WaterSupplyFlowRate OmegaFTB4105AP ½”WaterFlowMeter 1.5%ofreading
WaterDrainFlowRate OmegaFTB4107AP ¾”WaterFlowMeter 1.5%ofreading
kWSYSTEM SystemPower DentPowerscout3 RS485cnx.todataTaker ±1%ofreading
13
PG&E’s Emerging Technologies Program ET12PGE3101
DATA ANALYSIS
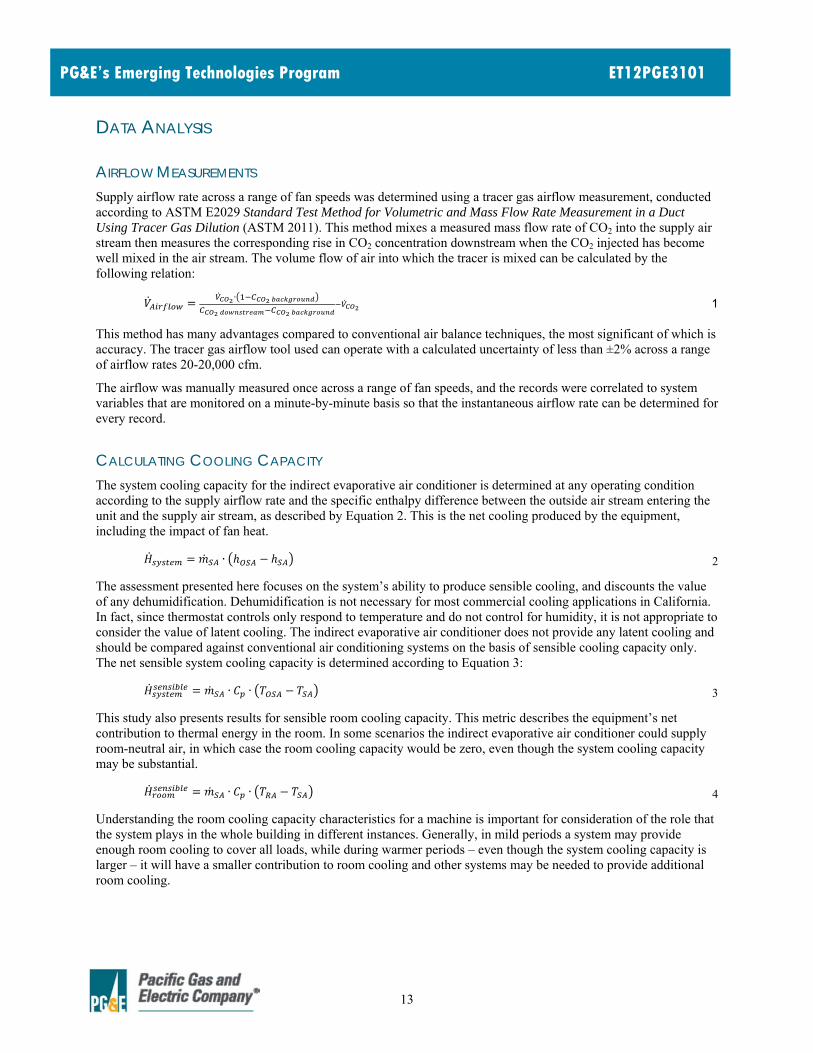
AIRFLOW MEASUREMENTS Supply airflow rate across a range of fan speeds was determined using a tracer gas airflow measurement, conducted according to ASTM E2029 Standard Test Method for Volumetric and Mass Flow Rate Measurement in a Duct Using Tracer Gas Dilution (ASTM 2011). This method mixes a measured mass flow rate of CO2 into the supply air stream then measures the corresponding rise in CO2 concentration downstream when the CO2 injected has become well mixed in the air stream. The volume flow of air into which the tracer is mixed can be calculated by the following relation:
∙
1
This method has many advantages compared to conventional air balance techniques, the most significant of which is accuracy. The tracer gas airflow tool used can operate with a calculated uncertainty of less than ±2% across a range of airflow rates 20-20,000 cfm.
The airflow was manually measured once across a range of fan speeds, and the records were correlated to system variables that are monitored on a minute-by-minute basis so that the instantaneous airflow rate can be determined for every record.
CALCULATING COOLING CAPACITY The system cooling capacity for the indirect evaporative air conditioner is determined at any operating condition according to the supply airflow rate and the specific enthalpy difference between the outside air stream entering the unit and the supply air stream, as described by Equation 2. This is the net cooling produced by the equipment, including the impact of fan heat.
∙ 2
The assessment presented here focuses on the system’s ability to produce sensible cooling, and discounts the value of any dehumidification. Dehumidification is not necessary for most commercial cooling applications in California. In fact, since thermostat controls only respond to temperature and do not control for humidity, it is not appropriate to consider the value of latent cooling. The indirect evaporative air conditioner does not provide any latent cooling and should be compared against conventional air conditioning systems on the basis of sensible cooling capacity only. The net sensible system cooling capacity is determined according to Equation 3:
∙ ∙ 3
This study also presents results for sensible room cooling capacity. This metric describes the equipment’s net contribution to thermal energy in the room. In some scenarios the indirect evaporative air conditioner could supply room-neutral air, in which case the room cooling capacity would be zero, even though the system cooling capacity may be substantial.
∙ ∙ 4
Understanding the room cooling capacity characteristics for a machine is important for consideration of the role that the system plays in the whole building in different instances. Generally, in mild periods a system may provide enough room cooling to cover all loads, while during warmer periods – even though the system cooling capacity is larger – it will have a smaller contribution to room cooling and other systems may be needed to provide additional room cooling.

14
PG&E’s Emerging Technologies Program ET12PGE3101
CALCULATING COEFFICIENT OF PERFORMANCE Energy efficiency at any given operating condition is expressed as the dimensionless ratio of useful thermal capacity delivered to electrical power consumed by the system – the coefficient of performance:
5
Analysis in this report focuses on the sensible cooling generated by the equipment. Although the indirect evaporative air conditioner does not generate any dehumidification, this approach discounts any enthalpy associated with reduced humidity. The sensible system coefficient of performance can be expressed as:
6
Similarly, the sensible room coefficient of performance is defined as:
7
CALCULATING WET BULB EFFECTIVENESS Wet bulb effectiveness (WBE) measures the extent to which an evaporative system is able to cool toward the wet bulb temperature of the inlet air. For simple direct evaporative systems, this metric tends to remain steady for a given system configuration even while meteorological conditions and system cooling capacity vary. WBE is the most common metric to describe performance of evaporative systems and is used as an input for models of evaporative cooling systems in most building energy simulation tools.
8
The metric has traditionally been used to describe performance of direct evaporative coolers, but it can also be applied to indirect evaporative equipment. Since indirect evaporative heat exchangers use a secondary air stream that can have an inlet wet bulb temperature that is lower than that of the primary inlet, it is possible to achieve better than 100% effectiveness.
15
PG&E’s Emerging Technologies Program ET12PGE3101
RESULTS
SUPPLY AIRFLOW AND UNIT POWER CHARACTERISTICS
Air
flow
(sc
fm)
Pow
er (
kW)
Air
flow
(sc
fm)
ΔP
(in
H2O
)
Product Damper ΔP (inH2O) Time LEGEND: Unit Power Supply Airflow Product Damper ΔP
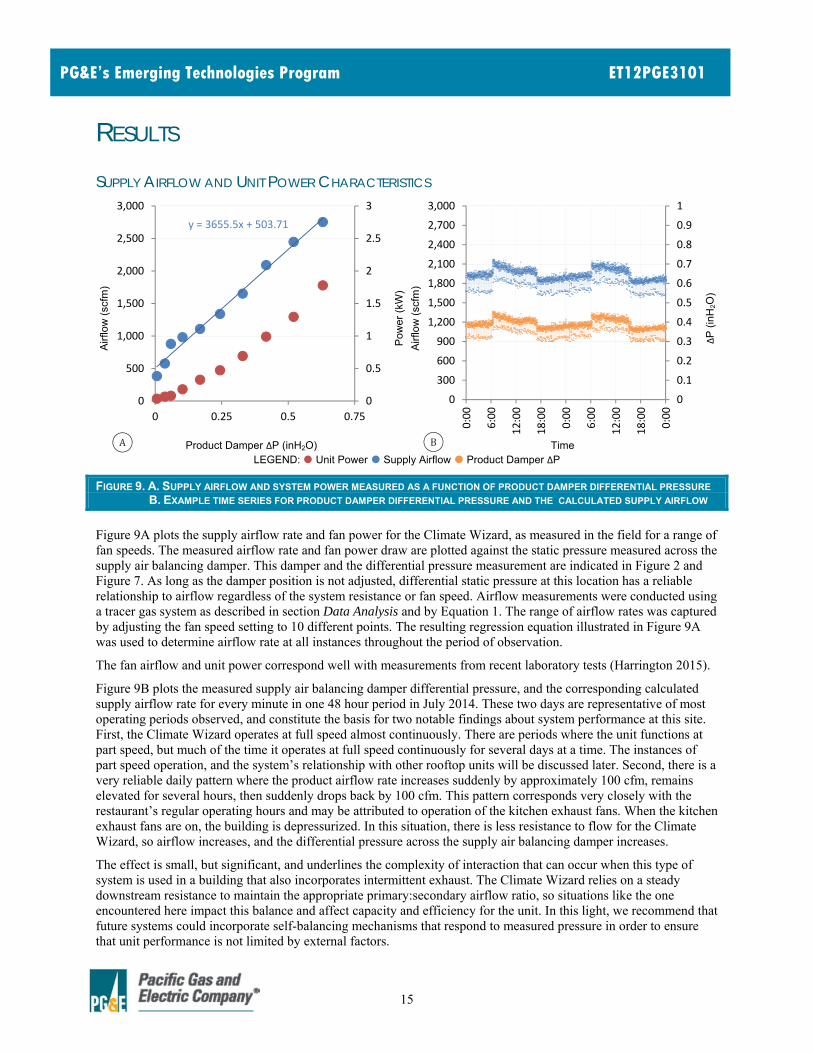
FIGURE 9. A. SUPPLY AIRFLOW AND SYSTEM POWER MEASURED AS A FUNCTION OF PRODUCT DAMPER DIFFERENTIAL PRESSURE B. EXAMPLE TIME SERIES FOR PRODUCT DAMPER DIFFERENTIAL PRESSURE AND THE CALCULATED SUPPLY AIRFLOW
Figure 9A plots the supply airflow rate and fan power for the Climate Wizard, as measured in the field for a range of fan speeds. The measured airflow rate and fan power draw are plotted against the static pressure measured across the supply air balancing damper. This damper and the differential pressure measurement are indicated in Figure 2 and Figure 7. As long as the damper position is not adjusted, differential static pressure at this location has a reliable relationship to airflow regardless of the system resistance or fan speed. Airflow measurements were conducted using a tracer gas system as described in section Data Analysis and by Equation 1. The range of airflow rates was captured by adjusting the fan speed setting to 10 different points. The resulting regression equation illustrated in Figure 9A was used to determine airflow rate at all instances throughout the period of observation.
The fan airflow and unit power correspond well with measurements from recent laboratory tests (Harrington 2015).
Figure 9B plots the measured supply air balancing damper differential pressure, and the corresponding calculated supply airflow rate for every minute in one 48 hour period in July 2014. These two days are representative of most operating periods observed, and constitute the basis for two notable findings about system performance at this site. First, the Climate Wizard operates at full speed almost continuously. There are periods where the unit functions at part speed, but much of the time it operates at full speed continuously for several days at a time. The instances of part speed operation, and the system’s relationship with other rooftop units will be discussed later. Second, there is a very reliable daily pattern where the product airflow rate increases suddenly by approximately 100 cfm, remains elevated for several hours, then suddenly drops back by 100 cfm. This pattern corresponds very closely with the restaurant’s regular operating hours and may be attributed to operation of the kitchen exhaust fans. When the kitchen exhaust fans are on, the building is depressurized. In this situation, there is less resistance to flow for the Climate Wizard, so airflow increases, and the differential pressure across the supply air balancing damper increases.
The effect is small, but significant, and underlines the complexity of interaction that can occur when this type of system is used in a building that also incorporates intermittent exhaust. The Climate Wizard relies on a steady downstream resistance to maintain the appropriate primary:secondary airflow ratio, so situations like the one encountered here impact this balance and affect capacity and efficiency for the unit. In this light, we recommend that future systems could incorporate self-balancing mechanisms that respond to measured pressure in order to ensure that unit performance is not limited by external factors.
y = 3655.5x + 503.71
0
0.5
1
1.5
2
2.5
3
0
500
1,000
1,500
2,000
2,500
3,000
0 0.25 0.5 0.75
0
0.1
0.2
0.3
0.4
0.5
0.6
0.7
0.8
0.9
1
0
300
600
900
1,200
1,500
1,800
2,100
2,400
2,700
3,000
0:00
6:00
12:00
18:00
0:00
6:00
12:00
18:00
0:00
A B

16
PG&E’s Emerging Technologies Program ET12PGE3101
It is not clear why the system operates continuously at full speed on most days. The restaurant shuts down at 3:00 pm – there is no reason that the Climate Wizard should continue to run during these closed periods. It is likely that this pattern of operation contributes to the fact that whole building monthly energy consumption was not obviously reduced by the measure.
During many of the overnight periods when the unit operated continuously, it was generating 40 – 60 kBtu of sensible room cooling, with a supply air temperature of 50 – 60 °F. One possible explanation for this is that the room setpoint may have been adjusted to an inappropriate low target so that even full capacity operation was not able to reach the set point. It is also possible that the custom controller did not operate according to its intended sequence of operations and the indirect evaporative system was held at full speed operation accidentally. Either way, this constitutes a major unintended energy use in the building. As discussed later in section: Cumulative Cooling & Energy Consumption for All Systems, roughly 60% of the energy used by the Climate Wizard occured in hours when the restaurant was not open.
This type of irrational system behavior is one reason that the majority of results in this report focus specifically on the characteristic performance achieved by the Climate Wizard across a range of operating conditions. As will be discussed, the system provides cooling with an outstanding efficiency. If operated appropriately, it should yield substantial savings.
Lastly, it may also be noted from Figure 9B that the supply airflow rate periodically decreases by approximately 200 cfm. This occurs whether or not the exhaust fans are operating, and occurs at a very regular interval anytime the unit is running in cooling mode. The behavior is a part of normal operation for the equipment, and is associated with periodic wetting of the media. During these instances the fan slows down and pumps operate to circulate water over the media. After the media is adequately wet the pumps shut off and the supply fan returns to full speed.
17
PG&E’s Emerging Technologies Program ET12PGE3101
ENERGY EFFICIENCY RATIO
Sen
sibl
e S
yste
m E
ER
(kB
tu/k
W)
Sen
sibl
e R
oom
EE
R (
kBtu
/kW
)
Outside Air Temperature (°F) Outside Air Temperature (°F) LEGEND: 80-100% Airflow 0-80% Airflow
FIGURE 10. ENERGY EFFICIENCY RATIO AS A FUNCTION OF OUTSIDE AIR TEMPERATURE FOR A. SENSIBLE SYSTEM COOLING, AND B. SENSIBLE ROOM COOLING
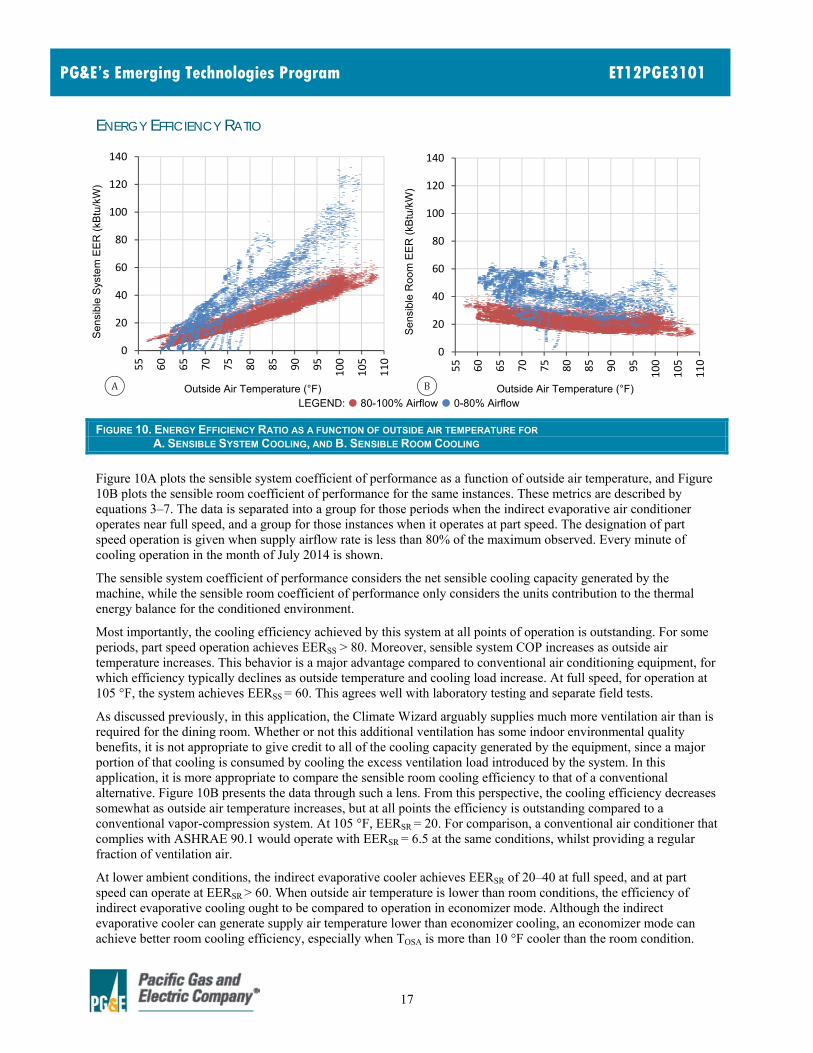
Figure 10A plots the sensible system coefficient of performance as a function of outside air temperature, and Figure 10B plots the sensible room coefficient of performance for the same instances. These metrics are described by equations 3–7. The data is separated into a group for those periods when the indirect evaporative air conditioner operates near full speed, and a group for those instances when it operates at part speed. The designation of part speed operation is given when supply airflow rate is less than 80% of the maximum observed. Every minute of cooling operation in the month of July 2014 is shown.
The sensible system coefficient of performance considers the net sensible cooling capacity generated by the machine, while the sensible room coefficient of performance only considers the units contribution to the thermal energy balance for the conditioned environment.
Most importantly, the cooling efficiency achieved by this system at all points of operation is outstanding. For some periods, part speed operation achieves EERSS > 80. Moreover, sensible system COP increases as outside air temperature increases. This behavior is a major advantage compared to conventional air conditioning equipment, for which efficiency typically declines as outside temperature and cooling load increase. At full speed, for operation at 105 °F, the system achieves EERSS = 60. This agrees well with laboratory testing and separate field tests.
As discussed previously, in this application, the Climate Wizard arguably supplies much more ventilation air than is required for the dining room. Whether or not this additional ventilation has some indoor environmental quality benefits, it is not appropriate to give credit to all of the cooling capacity generated by the equipment, since a major portion of that cooling is consumed by cooling the excess ventilation load introduced by the system. In this application, it is more appropriate to compare the sensible room cooling efficiency to that of a conventional alternative. Figure 10B presents the data through such a lens. From this perspective, the cooling efficiency decreases somewhat as outside air temperature increases, but at all points the efficiency is outstanding compared to a conventional vapor-compression system. At 105 °F, EERSR = 20. For comparison, a conventional air conditioner that complies with ASHRAE 90.1 would operate with EERSR = 6.5 at the same conditions, whilst providing a regular fraction of ventilation air.
At lower ambient conditions, the indirect evaporative cooler achieves EERSR of 20–40 at full speed, and at part speed can operate at EERSR > 60. When outside air temperature is lower than room conditions, the efficiency of indirect evaporative cooling ought to be compared to operation in economizer mode. Although the indirect evaporative cooler can generate supply air temperature lower than economizer cooling, an economizer mode can achieve better room cooling efficiency, especially when TOSA is more than 10 °F cooler than the room condition.
0
20
40
60
80
100
120
140
55
60
65
70
75
80
85
90
95
100
105
110
0
20
40
60
80
100
120
140
55
60
65
70
75
80
85
90
95
100
105
110
A B
18
PG&E’s Emerging Technologies Program ET12PGE3101
COOLING CAPACITY
Sen
sibl
e S
yste
m C
oolin
g (k
Btu
/hr)
Sen
sibl
e R
oom
Coo
ling
(kB
tu/h
r)
Outside Air Temperature (°F) Outside Air Temperature (°F) LEGEND: 80-100% Airflow 0-80% Airflow
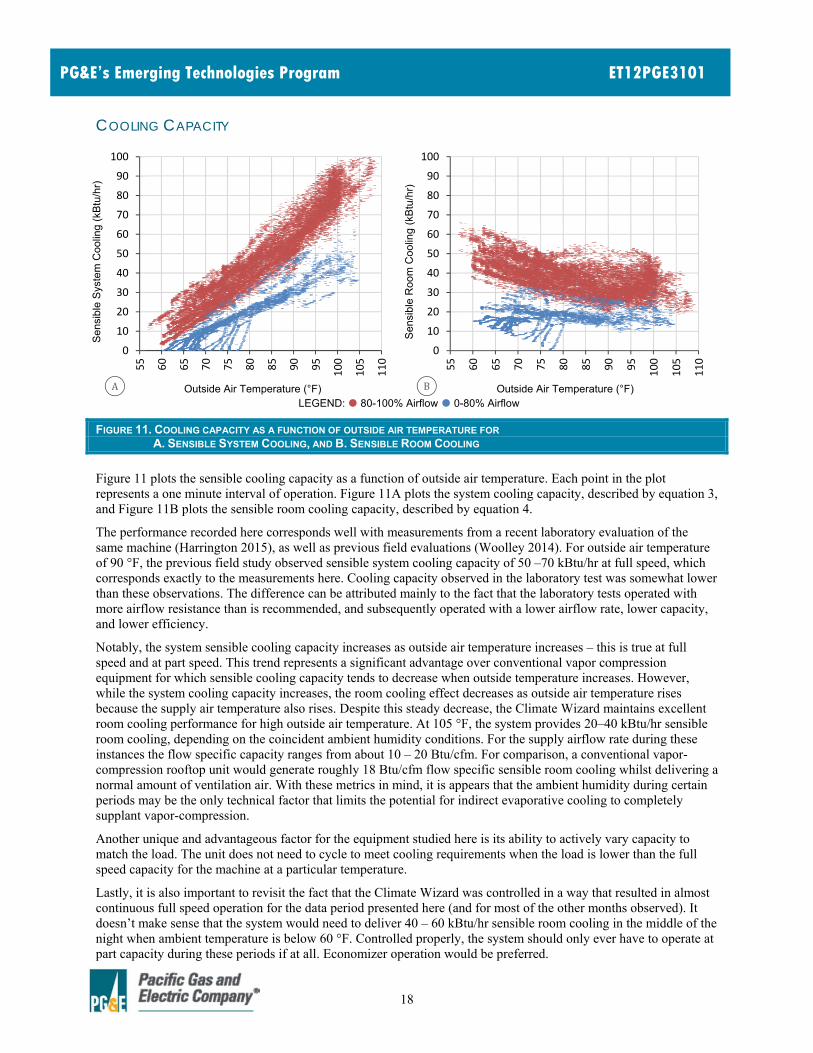
FIGURE 11. COOLING CAPACITY AS A FUNCTION OF OUTSIDE AIR TEMPERATURE FOR A. SENSIBLE SYSTEM COOLING, AND B. SENSIBLE ROOM COOLING
Figure 11 plots the sensible cooling capacity as a function of outside air temperature. Each point in the plot represents a one minute interval of operation. Figure 11A plots the system cooling capacity, described by equation 3, and Figure 11B plots the sensible room cooling capacity, described by equation 4.
The performance recorded here corresponds well with measurements from a recent laboratory evaluation of the same machine (Harrington 2015), as well as previous field evaluations (Woolley 2014). For outside air temperature of 90 °F, the previous field study observed sensible system cooling capacity of 50 –70 kBtu/hr at full speed, which corresponds exactly to the measurements here. Cooling capacity observed in the laboratory test was somewhat lower than these observations. The difference can be attributed mainly to the fact that the laboratory tests operated with more airflow resistance than is recommended, and subsequently operated with a lower airflow rate, lower capacity, and lower efficiency.
Notably, the system sensible cooling capacity increases as outside air temperature increases – this is true at full speed and at part speed. This trend represents a significant advantage over conventional vapor compression equipment for which sensible cooling capacity tends to decrease when outside temperature increases. However, while the system cooling capacity increases, the room cooling effect decreases as outside air temperature rises because the supply air temperature also rises. Despite this steady decrease, the Climate Wizard maintains excellent room cooling performance for high outside air temperature. At 105 °F, the system provides 20–40 kBtu/hr sensible room cooling, depending on the coincident ambient humidity conditions. For the supply airflow rate during these instances the flow specific capacity ranges from about 10 – 20 Btu/cfm. For comparison, a conventional vapor-compression rooftop unit would generate roughly 18 Btu/cfm flow specific sensible room cooling whilst delivering a normal amount of ventilation air. With these metrics in mind, it is appears that the ambient humidity during certain periods may be the only technical factor that limits the potential for indirect evaporative cooling to completely supplant vapor-compression.
Another unique and advantageous factor for the equipment studied here is its ability to actively vary capacity to match the load. The unit does not need to cycle to meet cooling requirements when the load is lower than the full speed capacity for the machine at a particular temperature.
Lastly, it is also important to revisit the fact that the Climate Wizard was controlled in a way that resulted in almost continuous full speed operation for the data period presented here (and for most of the other months observed). It doesn’t make sense that the system would need to deliver 40 – 60 kBtu/hr sensible room cooling in the middle of the night when ambient temperature is below 60 °F. Controlled properly, the system should only ever have to operate at part capacity during these periods if at all. Economizer operation would be preferred.
0
10
20
30
40
50
60
70
80
90
100
55
60
65
70
75
80
85
90
95
100
105
110
0
10
20
30
40
50
60
70
80
90
100
55
60
65
70
75
80
85
90
95
100
105
110
A B

19
PG&E’s Emerging Technologies Program ET12PGE3101
SUPPLY AIR TEMPERATURE S
uppl
y A
ir T
emp
erat
ure
(°F
)
Air
flow
(cf
m)
Tem
pera
ture
(°F
)
Outside Air Temperature (°F) Time LEGEND: 80-100% Airflow 0-80% Airflow Supply Airflow Rate Supply Air Temperature
FIGURE 12. A. SUPPLY AIR TEMPERATURE AS A FUNCTION OF OUTSIDE TEMPERATURE B. TIME SERIES FOR SUPPLY AIR TEMPERATURE AND SUPPLY AIRFLOW RATE
Figure 12A plots supply air temperature from the Climate Wizard as a function of outside air temperature. Then, Figure 12B plots the time series of supply airflow and supply air temperature for a four hour period on July 6, 2014.
The supply air temperature observed at full speed agrees relatively well with the supply air temperatures observed in a parallel field study with the same technology (Woolley 2014) and with recent laboratory test data (Harrington 2015). There are some differences between these tests that can be attributed to differences in ambient humidity, as well as differences in the primary:secondary airflow ratio and the corresponding supply airflow rates. It is clear that supply air temperature changes significantly with ambient humidity and with fan speed. For example, at 100 °F Figure 12A shows that supply air temperature might be anywhere between 55-70 °F for this application.
Currently, there are not adequate software tools that allow engineers and practitioners to readily model the dynamics that are apparent in these results. Although characteristic performance data is available from studies like this one, there is not a straightforward way to translate the information presented here into models that predict application specific performance. This makes it difficult to estimate the savings that will be achieved in real world scenarios, or to project the range of climates that are most appropriate for installation of indirect evaporative cooling. These results underscore the need for simple and flexible modeling tools that bridge this gap.
Figure 12A clearly illustrates that the temperature split achieved by the unit increases rapidly as outside temperature increases, even though the supply air temperature climbs somewhat. This behavior explains the reason that system cooling capacity increases with outside air temperature, while room cooling capacity tends to decreases.
It is also worthwhile to note that the assessment of room cooling capacity presented here assumes that supply air from the indirect evaporative system is working against a static room temperature. However, the most recent research and standards surrounding human comfort recognize that comfort is dynamic, and that room temperature should be allowed to drift (ASHRAE 2010). Doing so can save energy and improve comfort. From this perspective although the supply air temperature rises with outside air temperature, if the target room temperature is allowed to rise concurrently, then the so called “room cooling capacity” of the equipment may actually not decline as outside air temperature increases. That is to say, even though the supply air temperature increases, the useful service provided to maintain human thermal comfort remains very much the same, regardless of operating conditions.
Figure 12B illustrates the way that supply air flow rate and supply air temperature respond to the periodic watering cycle for the machine. The decrease in supply airflow rate is followed by a small but sudden increase in the supply temperature, which then slowly declines once the fan returns to full speed.
45
50
55
60
65
70
75
80
85
90
95
10055
60
65
70
75
80
85
90
95
100
105
110
45
50
55
60
65
70
75
80
85
90
95
100
0
200
400
600
800
1,000
1,200
1,400
1,600
1,800
2,000
2,200
12:00
13:00
14:00
15:00
A B
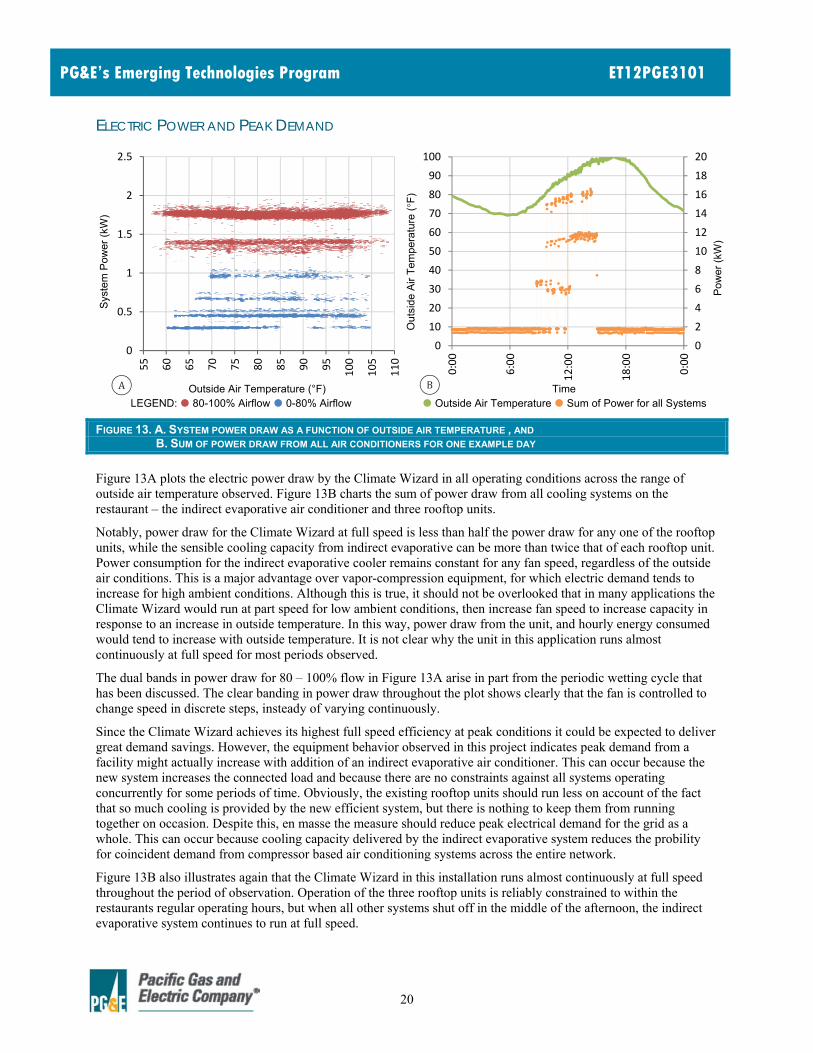
20
PG&E’s Emerging Technologies Program ET12PGE3101
ELECTRIC POWER AND PEAK DEMAND S
yste
m P
ower
(kW
)
Out
side
Air
Tem
pera
ture
(°F
)
Pow
er (
kW)
Outside Air Temperature (°F) Time LEGEND: 80-100% Airflow 0-80% Airflow Outside Air Temperature Sum of Power for all Systems
FIGURE 13. A. SYSTEM POWER DRAW AS A FUNCTION OF OUTSIDE AIR TEMPERATURE , AND B. SUM OF POWER DRAW FROM ALL AIR CONDITIONERS FOR ONE EXAMPLE DAY
Figure 13A plots the electric power draw by the Climate Wizard in all operating conditions across the range of outside air temperature observed. Figure 13B charts the sum of power draw from all cooling systems on the restaurant – the indirect evaporative air conditioner and three rooftop units.
Notably, power draw for the Climate Wizard at full speed is less than half the power draw for any one of the rooftop units, while the sensible cooling capacity from indirect evaporative can be more than twice that of each rooftop unit. Power consumption for the indirect evaporative cooler remains constant for any fan speed, regardless of the outside air conditions. This is a major advantage over vapor-compression equipment, for which electric demand tends to increase for high ambient conditions. Although this is true, it should not be overlooked that in many applications the Climate Wizard would run at part speed for low ambient conditions, then increase fan speed to increase capacity in response to an increase in outside temperature. In this way, power draw from the unit, and hourly energy consumed would tend to increase with outside temperature. It is not clear why the unit in this application runs almost continuously at full speed for most periods observed.
The dual bands in power draw for 80 – 100% flow in Figure 13A arise in part from the periodic wetting cycle that has been discussed. The clear banding in power draw throughout the plot shows clearly that the fan is controlled to change speed in discrete steps, insteady of varying continuously.
Since the Climate Wizard achieves its highest full speed efficiency at peak conditions it could be expected to deliver great demand savings. However, the equipment behavior observed in this project indicates peak demand from a facility might actually increase with addition of an indirect evaporative air conditioner. This can occur because the new system increases the connected load and because there are no constraints against all systems operating concurrently for some periods of time. Obviously, the existing rooftop units should run less on account of the fact that so much cooling is provided by the new efficient system, but there is nothing to keep them from running together on occasion. Despite this, en masse the measure should reduce peak electrical demand for the grid as a whole. This can occur because cooling capacity delivered by the indirect evaporative system reduces the probility for coincident demand from compressor based air conditioning systems across the entire network.
Figure 13B also illustrates again that the Climate Wizard in this installation runs almost continuously at full speed throughout the period of observation. Operation of the three rooftop units is reliably constrained to within the restaurants regular operating hours, but when all other systems shut off in the middle of the afternoon, the indirect evaporative system continues to run at full speed.
0
0.5
1
1.5
2
2.555
60
65
70
75
80
85
90
95
100
105
110
0
2
4
6
8
10
12
14
16
18
20
0
10
20
30
40
50
60
70
80
90
100
0:00
6:00
12:00
18:00
0:00
A B

21
PG&E’s Emerging Technologies Program ET12PGE3101
SYSTEM PRIORITIZATION IN SEQUENCE OF OPERATIONS As discussed in section Design and Application, the realization of energy savings for this measure requires proper application and control. In particular, as part of a whole building HVAC system that also includes standard efficiency air conditioners, indirect evaporative cooling should be applied in a way that it operates as the priority source for cooling, and such that the cooling generated offsets compressor operation. If the indirect evaporative air conditioner is controlled in a way that results in more cooling than would be generated by a conventional system, or if a standard efficiency machine responds to the cooling load before the indirect evaporative system has a chance to do so, the potential savings for the measure will be eroded or completely negated. Unfortunately, it appears that both of these factors were issues at different times during the two years of operation observed.
First, for a large portion of hours in 2014, the indirect evaporative system operated continuously at full speed during all hours of the day, apparently regardless of load, and without response to the regular operating hours for the restaurant in which it was installed. In 2014 there were 4,700 hours of indirect evaporative cooler operation during hours when the restaurant was not open. This amounts to more than 3,200 kWh of energy consumed when HVAC would generally not operate. Although the indirect evaporative unit could be said to have served as the priority source for cooling during those periods when it did not turn off, it appears to have operated far more than necessary.
Second, during periods when the unit was not operated in an undiscerning continuous fashion, it did not operate as the priority source for cooling. Figure 14 plots the time series trend of power draw for each system for a six day period in August 2013. One series represents the sum of electric power from the three rooftop units for each minute of operation over the period. This series does not discern between each rooftop unit, but the trend clearly illustrates the number of units that are active at any given point in time. The second series shows electric power draw from the Climate Wizard during the same period.
There are two behaviors apparent in Figure 14 that have significant implications for the overall energy used in this application. First, for Aug 16-18, the Climate Wizard does not operate, even though cooling is needed from about 7:00 AM – 3:00 PM, and cooling loads are large enough that all three rooftop units are needed in each afternoon. On Aug 16-17, it appears that the indirect evaporative system might have started to operate in the early morning, but then shut off once conventional air conditioning was enabled. Obviously, the measure does not have value in these periods – it does not even run. Then, for the following three days, although the Climate Wizard does run, it only operates at part speed during regular occupied hours while each of the three rooftop units cycle through the day. Somewhere after 3:00 PM on these days the conventional rooftop units turn off, at which point the Climate Wizard ramps to full speed for several hours. On these days, the Climate Wizard is not utilized to its fullest extent during the day when it is needed, then it is allowed to run at full speed for most of the night when the restaurant is not open.
These behaviors are not unique to the period show here. In fact, there was no period identified in 2013 or 2014 where the indirect evaporative cooler consistently provided priority cooling without also just running continuously.
Sys
tem
Pow
er (
kW)
Date
LEGEND: Sum of Power from 3 RTUs Climate Wizard Power
FIGURE 14. POWER DRAW FROM EACH COOLING SYSTEM FOR AN EXAMPLE PERIOD IN AUGUST 2013
0
2
4
6
8
10
12
14
16
18
8/16/2013 8/17/2013 8/18/2013 8/19/2013 8/20/2013 8/21/2013 8/22/2013

22
PG&E’s Emerging Technologies Program ET12PGE3101
CUMULATIVE COOLING & ENERGY CONSUMPTION FOR ALL SYSTEMS
Sum
of
Sen
sibl
e S
yste
m C
oolin
g (k
Btu
)
Sum
of
Ene
rgy
Con
sum
ptio
n (k
Wh)
Hour of the Day Hour of the Day LEGEND: Climate Wizard RTU 1 RTU 2 RTU 3
FIGURE 15. A. SUM OF SENSIBLE COOLING GENERATED BY EACH SYSTEM IN EACH HOUR OF THE DAY FOR ONE MONTH B. SUM OF ELECTRICITY CONSUMED BY EACH SYSTEM IN EACH HOUR OF THE DAY FOR ONE MONTH
Figure 15A plots distribution of sensible system cooling capacity generated by each system over the course of the month of July 2014. The plot sums the amount of cooling generated in the month during each hour of the day. Similarly, Figure 15B illustrates the distribution of electrical energy consumption by each system.
These plots show, once again, that the Climate Wizard tends to run continuously throughout every hour of the day. The total energy consumed by the Climate Wizard is basically the same in every hour. At the same time, since the cooling capacity changes with outside temperature, there is substantially more cooling generated by indirect evaporative through the daytime hours of the month than there are overnight. The plots also show that while the indirect evaporative cooler is responsible for more than 75% of the cooling in the month of July, it accounts for less than half of the energy consumed..
Hou
rly R
oom
Co
olin
g Lo
ad (
kBtu
)
Outside Temperature (°F)
FIGURE 16. HOURLY ROOM COOLING LOAD OBSERVED AS A
FUNCTION OF OUTSIDE TEMPERATURE
Additionally, data about operation of each machine reveals that the sensible room cooling load during normal operating hours increases reliably as a function of outside temperature, as illustrated in Figure 16.
The load in this figure is derived from the cumulative amount of room cooling that is actually delivered by each system in each hour. Each data points represents the load and coincident outside temperature for a single hour of operation during regular hours.
This figure indicates that building controls call for some cooling when the hour average outside air temperature is as low as 60 °F. When compared with Figure 11B, it is clear that the indirect evaporative system is only large enough to cover the room cooling needs up to 70–75 °F, depending on the conditions. Beyond this point, some compressor cooling is also needed. This conclusion is supported by observation of the outside temperatures at which the vapor-compression systems typically begin to cycle – as can be seen in Figure 13B.
0
500
1,000
1,500
2,000
2,500
3,000
3,500
4,000
4,50012 AM
2 AM
4 AM
6 AM
8 AM
10 AM
12 PM
2 PM
4 PM
6 PM
8 PM
10 PM
0
50
100
150
200
250
300
350
400
12 AM
2 AM
4 AM
6 AM
8 AM
10 AM
12 PM
2 PM
4 PM
6 PM
8 PM
10 PM
0
20
40
60
80
100
120
140
160
55
60
65
70
75
80
85
90
95
100
105
110
A B
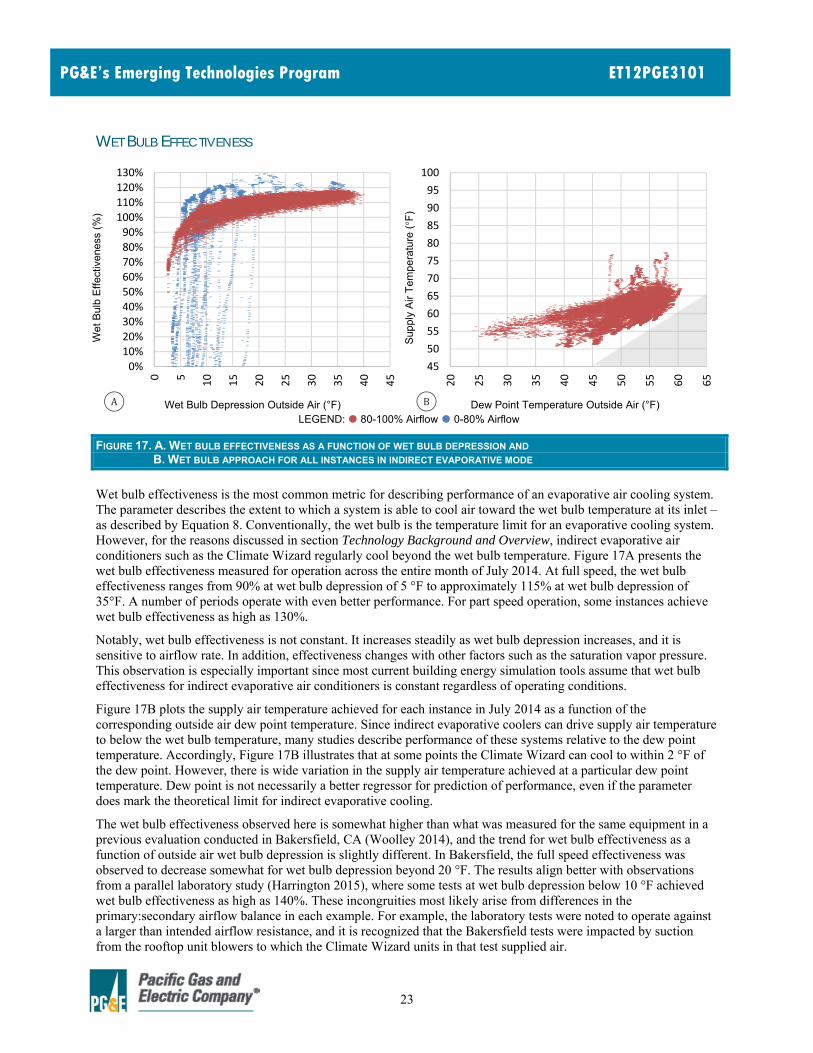
23
PG&E’s Emerging Technologies Program ET12PGE3101
WET BULB EFFECTIVENESS
Wet
Bul
b E
ffec
tiven
ess
(%)
Sup
ply
Air
Tem
per
atur
e (°
F)
Wet Bulb Depression Outside Air (°F) Dew Point Temperature Outside Air (°F) LEGEND: 80-100% Airflow 0-80% Airflow
FIGURE 17. A. WET BULB EFFECTIVENESS AS A FUNCTION OF WET BULB DEPRESSION AND B. WET BULB APPROACH FOR ALL INSTANCES IN INDIRECT EVAPORATIVE MODE
Wet bulb effectiveness is the most common metric for describing performance of an evaporative air cooling system. The parameter describes the extent to which a system is able to cool air toward the wet bulb temperature at its inlet – as described by Equation 8. Conventionally, the wet bulb is the temperature limit for an evaporative cooling system. However, for the reasons discussed in section Technology Background and Overview, indirect evaporative air conditioners such as the Climate Wizard regularly cool beyond the wet bulb temperature. Figure 17A presents the wet bulb effectiveness measured for operation across the entire month of July 2014. At full speed, the wet bulb effectiveness ranges from 90% at wet bulb depression of 5 °F to approximately 115% at wet bulb depression of 35°F. A number of periods operate with even better performance. For part speed operation, some instances achieve wet bulb effectiveness as high as 130%.
Notably, wet bulb effectiveness is not constant. It increases steadily as wet bulb depression increases, and it is sensitive to airflow rate. In addition, effectiveness changes with other factors such as the saturation vapor pressure. This observation is especially important since most current building energy simulation tools assume that wet bulb effectiveness for indirect evaporative air conditioners is constant regardless of operating conditions.
Figure 17B plots the supply air temperature achieved for each instance in July 2014 as a function of the corresponding outside air dew point temperature. Since indirect evaporative coolers can drive supply air temperature to below the wet bulb temperature, many studies describe performance of these systems relative to the dew point temperature. Accordingly, Figure 17B illustrates that at some points the Climate Wizard can cool to within 2 °F of the dew point. However, there is wide variation in the supply air temperature achieved at a particular dew point temperature. Dew point is not necessarily a better regressor for prediction of performance, even if the parameter does mark the theoretical limit for indirect evaporative cooling.
The wet bulb effectiveness observed here is somewhat higher than what was measured for the same equipment in a previous evaluation conducted in Bakersfield, CA (Woolley 2014), and the trend for wet bulb effectiveness as a function of outside air wet bulb depression is slightly different. In Bakersfield, the full speed effectiveness was observed to decrease somewhat for wet bulb depression beyond 20 °F. The results align better with observations from a parallel laboratory study (Harrington 2015), where some tests at wet bulb depression below 10 °F achieved wet bulb effectiveness as high as 140%. These incongruities most likely arise from differences in the primary:secondary airflow balance in each example. For example, the laboratory tests were noted to operate against a larger than intended airflow resistance, and it is recognized that the Bakersfield tests were impacted by suction from the rooftop unit blowers to which the Climate Wizard units in that test supplied air.
0%10%20%30%40%50%60%70%80%90%100%110%120%130%
0 5
10
15
20
25
30
35
40
45
45
50
55
60
65
70
75
80
85
90
95
100
20
25
30
35
40
45
50
55
60
65
A B

24
PG&E’s Emerging Technologies Program ET12PGE3101
WATER CONSUMPTION
Dai
ly W
ater
Con
sum
ptio
n (g
al)
Tem
pera
ture
(°F
)
Hou
rly W
ater
Co
nsum
ptio
n (g
al/h
r)
Day of the Month Hour Avg. Outside Air Temperature (°F)
LEGEND: Water Consumption Day Average Outside Temp Day Min/Max Outside Temp
Measured Water Use
FIGURE 18. A. SUM OF WATER CONSUMED ON EACH DAY FOR ONE MOTH AND CORRESPONDING DAILY AMBIENT CONDITIONS B. HOURLY WATER CONSUMPTION RATE AS A FUNCTION OF AMBIENT CONDITIONS FOR FULL SPEED OPERATION
Figure 18 describes water consumption characteristics for the Climate Wizard. Figure 18A charts the sum of water consumed in each day over the course of July 2013. Warmer days generally result in larger water consumption in part because the instantaneous evaporation rate increases with outside air temperature, and in part because the number of cooling hours and time spent at full speed tends to increase on hotter days. The unit did not run for several days at the end of the month shown – this period corresponded to a time that the unit was shut off intentionally for unrelated purposes.
Figure 18B plots measured hourly water consumption data as a function of the average outside air temperature in each hour. These observations illustrate a strong correlation between water consumption and outside air temperature, but also confirm that hourly water use at any given outside condition can vary significantly. Other factors that influence water consumption include water quality, outside air humidity, as well as the circumstances of timing for sump fill and drain sequences. Moreover, the period assessed here captures instances of full speed operation and instances of part speed operation across the range of outside air conditions. Thus, while these results describe the water use for this particular scenario, the water use characteristics may be different for other applications.
At peak conditions, the indirect evaporative air conditioner consumes roughly 20 gal/hr. Given that the sensible system energy efficiency ratio at this point is between EERSS = 50 – 60, and that use of this system would reduce energy use for cooling and ventilation by 13.7 kWh/h, we estimate that the ratio of water use to electrical energy savings at peak is approximately 1.5 gal/kWh savings. At milder temperatures the water use and energy savings both decrease, so the ratio of water use to energy savings declines somewhat to about 0.8 gal/kWh savings at 70°F.
Given the fact that California is in the midst of a severe drought, water use for air conditioning might be a concern. However, on site water use can be offset by upstream water savings associated with reduced electricity generation. Estimates of the water use intensity for electricity generation range by more than an order of magnitude, and depend significantly on the source mix for electricity generation. However, the most well founded research estimates a water use intensity of 1.41 gal/kWh for California’s grid mix, on average, including evaporative losses from reservoirs for hydroelectric generation (Pistochini 2011, Torcellini 2003, Larson 2007). This means, from a statewide water use perspective, the local water consumption for these retrofits might be completely offset by the water savings associated with reduced electrical generation.
‐20
0
20
40
60
80
100
120
0
50
100
150
200
250
300
3501 4 7
10
13
16
19
22
25
28
31
0
5
10
15
20
25
30
35
55
60
65
70
75
80
85
90
95
100
105
110
A B
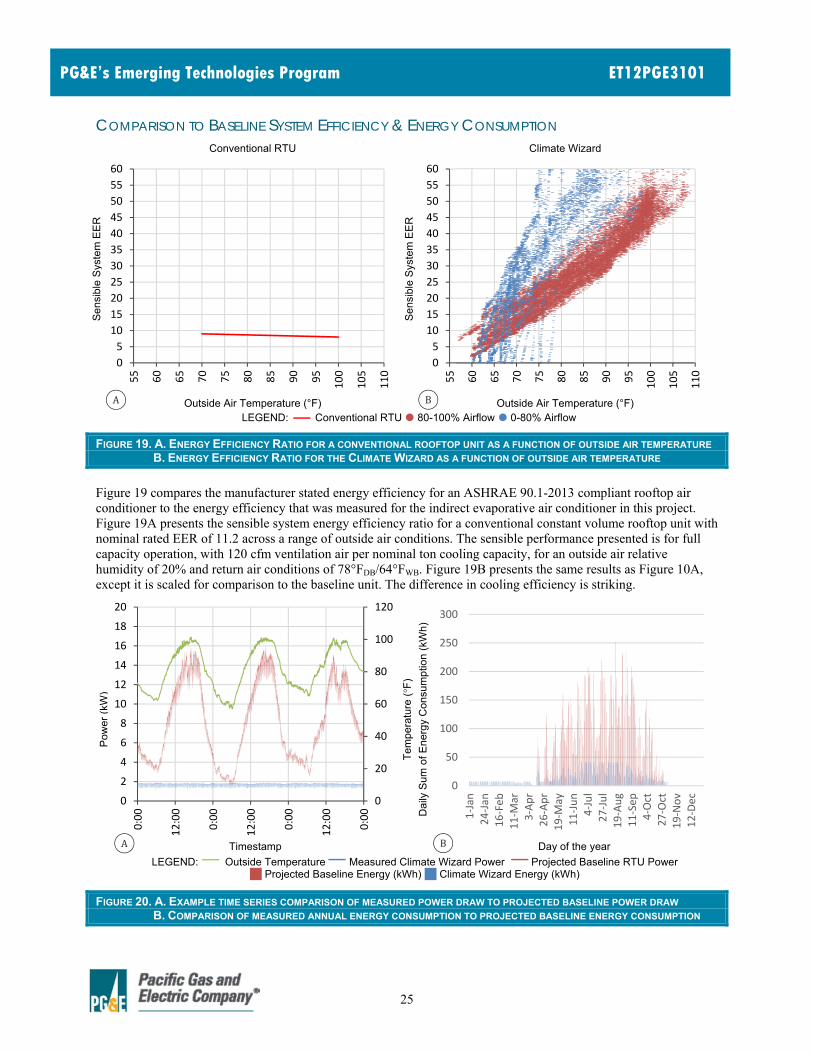
25
PG&E’s Emerging Technologies Program ET12PGE3101
COMPARISON TO BASELINE SYSTEM EFFICIENCY & ENERGY CONSUMPTION
Sen
sibl
e S
yste
m E
ER
Conventional RTU
Sen
sibl
e S
yste
m E
ER
Climate Wizard
Outside Air Temperature (°F) Outside Air Temperature (°F) LEGEND: Conventional RTU 80-100% Airflow 0-80% Airflow
FIGURE 19. A. ENERGY EFFICIENCY RATIO FOR A CONVENTIONAL ROOFTOP UNIT AS A FUNCTION OF OUTSIDE AIR TEMPERATURE B. ENERGY EFFICIENCY RATIO FOR THE CLIMATE WIZARD AS A FUNCTION OF OUTSIDE AIR TEMPERATURE
Figure 19 compares the manufacturer stated energy efficiency for an ASHRAE 90.1-2013 compliant rooftop air conditioner to the energy efficiency that was measured for the indirect evaporative air conditioner in this project. Figure 19A presents the sensible system energy efficiency ratio for a conventional constant volume rooftop unit with nominal rated EER of 11.2 across a range of outside air conditions. The sensible performance presented is for full capacity operation, with 120 cfm ventilation air per nominal ton cooling capacity, for an outside air relative humidity of 20% and return air conditions of 78°FDB/64°FWB. Figure 19B presents the same results as Figure 10A, except it is scaled for comparison to the baseline unit. The difference in cooling efficiency is striking.
Pow
er (
kW)
Tem
pera
ture
(°F
)
Dai
ly S
um o
f E
nerg
y C
onsu
mpt
ion
(kW
h)
Timestamp Day of the year
LEGEND: Outside Temperature Measured Climate Wizard Power Projected Baseline RTU Power
Projected Baseline Energy (kWh) Climate Wizard Energy (kWh)
FIGURE 20. A. EXAMPLE TIME SERIES COMPARISON OF MEASURED POWER DRAW TO PROJECTED BASELINE POWER DRAW B. COMPARISON OF MEASURED ANNUAL ENERGY CONSUMPTION TO PROJECTED BASELINE ENERGY CONSUMPTION
0
5
10
15
20
25
30
35
40
45
50
55
60
55
60
65
70
75
80
85
90
95
100
105
110
0
5
10
15
20
25
30
35
40
45
50
55
60
55
60
65
70
75
80
85
90
95
100
105
110
0
20
40
60
80
100
120
0
2
4
6
8
10
12
14
16
18
20
0:00
12:00
0:00
12:00
0:00
12:00
0:00
0
50
100
150
200
250
300
1‐Jan
24‐Jan
16‐Feb
11‐M
ar3‐Apr
26‐Apr
19‐M
ay11‐Jun
4‐Jul
27‐Jul
19‐Aug
11‐Sep
4‐Oct
27‐Oct
19‐Nov
12‐Dec
A B
A B
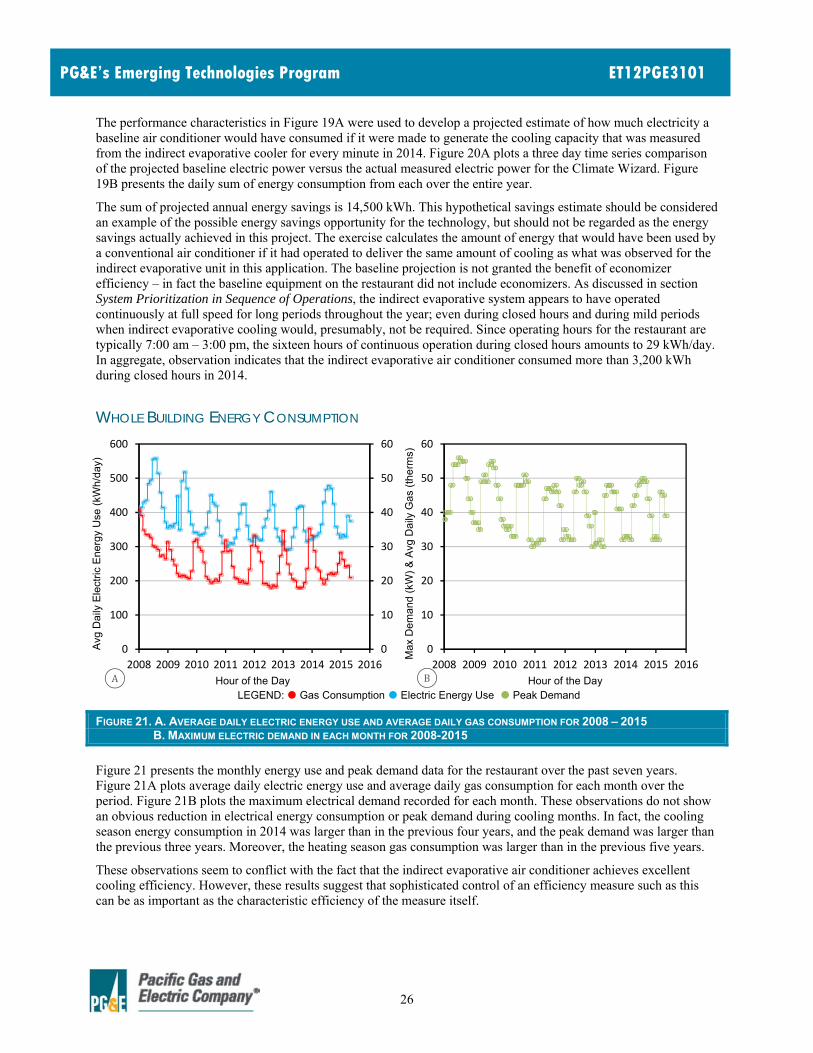
26
PG&E’s Emerging Technologies Program ET12PGE3101
The performance characteristics in Figure 19A were used to develop a projected estimate of how much electricity a baseline air conditioner would have consumed if it were made to generate the cooling capacity that was measured from the indirect evaporative cooler for every minute in 2014. Figure 20A plots a three day time series comparison of the projected baseline electric power versus the actual measured electric power for the Climate Wizard. Figure 19B presents the daily sum of energy consumption from each over the entire year.
The sum of projected annual energy savings is 14,500 kWh. This hypothetical savings estimate should be considered an example of the possible energy savings opportunity for the technology, but should not be regarded as the energy savings actually achieved in this project. The exercise calculates the amount of energy that would have been used by a conventional air conditioner if it had operated to deliver the same amount of cooling as what was observed for the indirect evaporative unit in this application. The baseline projection is not granted the benefit of economizer efficiency – in fact the baseline equipment on the restaurant did not include economizers. As discussed in section System Prioritization in Sequence of Operations, the indirect evaporative system appears to have operated continuously at full speed for long periods throughout the year; even during closed hours and during mild periods when indirect evaporative cooling would, presumably, not be required. Since operating hours for the restaurant are typically 7:00 am – 3:00 pm, the sixteen hours of continuous operation during closed hours amounts to 29 kWh/day. In aggregate, observation indicates that the indirect evaporative air conditioner consumed more than 3,200 kWh during closed hours in 2014.
WHOLE BUILDING ENERGY CONSUMPTION
Avg
Dai
ly E
lect
ric E
nerg
y U
se (
kWh/
day)
Max
Dem
and
(kW
) &
Avg
Dai
ly G
as (
the
rms)
Hour of the Day Hour of the Day LEGEND: Gas Consumption Electric Energy Use Peak Demand
FIGURE 21. A. AVERAGE DAILY ELECTRIC ENERGY USE AND AVERAGE DAILY GAS CONSUMPTION FOR 2008 – 2015 B. MAXIMUM ELECTRIC DEMAND IN EACH MONTH FOR 2008-2015
Figure 21 presents the monthly energy use and peak demand data for the restaurant over the past seven years. Figure 21A plots average daily electric energy use and average daily gas consumption for each month over the period. Figure 21B plots the maximum electrical demand recorded for each month. These observations do not show an obvious reduction in electrical energy consumption or peak demand during cooling months. In fact, the cooling season energy consumption in 2014 was larger than in the previous four years, and the peak demand was larger than the previous three years. Moreover, the heating season gas consumption was larger than in the previous five years.
These observations seem to conflict with the fact that the indirect evaporative air conditioner achieves excellent cooling efficiency. However, these results suggest that sophisticated control of an efficiency measure such as this can be as important as the characteristic efficiency of the measure itself.
0
10
20
30
40
50
60
0
100
200
300
400
500
600
2008 2009 2010 2011 2012 2013 2014 2015 2016
0
10
20
30
40
50
60
2008 2009 2010 2011 2012 2013 2014 2015 2016A B
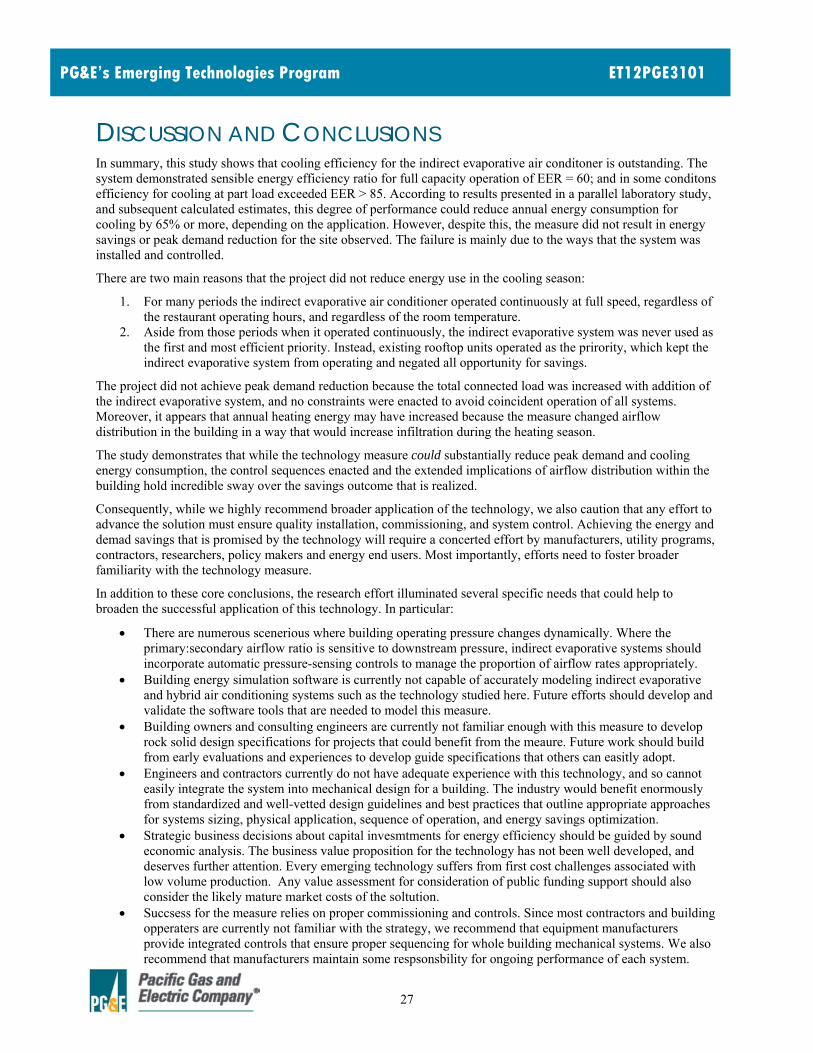
27
PG&E’s Emerging Technologies Program ET12PGE3101
DISCUSSION AND CONCLUSIONS In summary, this study shows that cooling efficiency for the indirect evaporative air conditoner is outstanding. The system demonstrated sensible energy efficiency ratio for full capacity operation of EER = 60; and in some conditons efficiency for cooling at part load exceeded EER > 85. According to results presented in a parallel laboratory study, and subsequent calculated estimates, this degree of performance could reduce annual energy consumption for cooling by 65% or more, depending on the application. However, despite this, the measure did not result in energy savings or peak demand reduction for the site observed. The failure is mainly due to the ways that the system was installed and controlled.
There are two main reasons that the project did not reduce energy use in the cooling season:
1. For many periods the indirect evaporative air conditioner operated continuously at full speed, regardless of the restaurant operating hours, and regardless of the room temperature.
2. Aside from those periods when it operated continuously, the indirect evaporative system was never used as the first and most efficient priority. Instead, existing rooftop units operated as the prirority, which kept the indirect evaporative system from operating and negated all opportunity for savings.
The project did not achieve peak demand reduction because the total connected load was increased with addition of the indirect evaporative system, and no constraints were enacted to avoid coincident operation of all systems. Moreover, it appears that annual heating energy may have increased because the measure changed airflow distribution in the building in a way that would increase infiltration during the heating season.
The study demonstrates that while the technology measure could substantially reduce peak demand and cooling energy consumption, the control sequences enacted and the extended implications of airflow distribution within the building hold incredible sway over the savings outcome that is realized.
Consequently, while we highly recommend broader application of the technology, we also caution that any effort to advance the solution must ensure quality installation, commissioning, and system control. Achieving the energy and demad savings that is promised by the technology will require a concerted effort by manufacturers, utility programs, contractors, researchers, policy makers and energy end users. Most importantly, efforts need to foster broader familiarity with the technology measure.
In addition to these core conclusions, the research effort illuminated several specific needs that could help to broaden the successful application of this technology. In particular:
There are numerous scenerious where building operating pressure changes dynamically. Where the primary:secondary airflow ratio is sensitive to downstream pressure, indirect evaporative systems should incorporate automatic pressure-sensing controls to manage the proportion of airflow rates appropriately.
Building energy simulation software is currently not capable of accurately modeling indirect evaporative and hybrid air conditioning systems such as the technology studied here. Future efforts should develop and validate the software tools that are needed to model this measure.
Building owners and consulting engineers are currently not familiar enough with this measure to develop rock solid design specifications for projects that could benefit from the meaure. Future work should build from early evaluations and experiences to develop guide specifications that others can easitly adopt.
Engineers and contractors currently do not have adequate experience with this technology, and so cannot easily integrate the system into mechanical design for a building. The industry would benefit enormously from standardized and well-vetted design guidelines and best practices that outline appropriate approaches for systems sizing, physical application, sequence of operation, and energy savings optimization.
Strategic business decisions about capital invesmtments for energy efficiency should be guided by sound economic analysis. The business value proposition for the technology has not been well developed, and deserves further attention. Every emerging technology suffers from first cost challenges associated with low volume production. Any value assessment for consideration of public funding support should also consider the likely mature market costs of the soltution.
Succsess for the measure relies on proper commissioning and controls. Since most contractors and building opperaters are currently not familiar with the strategy, we recommend that equipment manufacturers provide integrated controls that ensure proper sequencing for whole building mechanical systems. We also recommend that manufacturers maintain some respsonsbility for ongoing performance of each system.
28
PG&E’s Emerging Technologies Program ET12PGE3101
REFERENCES Architectural Energy Corporation, and Fisher Nickel Inc. Commercial Kitchen Ventilation Design Guides. Improving Commercial Kitchen Ventilation System Performance. Updated March 2004. Appendix to report: Makeup Air Effects on the Performance of Kitchen Exhaust Systems. CEC #500-98-031. December 2002. Online: http://www.fishnick.com/ventilation/designguides/
ASHRAE. 2009. ASHRAE Handbook – Fundamentals. IP Edition. American Society of Heating Refrigeration and Air-Conditioning Engineers, Inc. Atlanta GA. 2009.
ASHRAE. ANSI/ASHRAE Standard 55-2010: Thermal Environmental Conditoins for Human Occupancy. ISSN 1041-2336. American Socieity of Heating Refrigeration and Air-Conditioning Engineers, Inc. Atlanta GA. 2010.
ASTM E2029 Standard Test Method for Volumetric and Mass Flow Rate Measurement in a Duct Using Tracer Gas Dilution
CARB. California Greenhouse Gas Emission Inventory. Air Resources Board. California Environmental Protection Agency. 2014. Online. http://www.arb.ca.gov/cc/inventory/inventory_current.htm
California Energy Commission. California Commercial End-Use Survey. CEC 400-2006-005. March 2006. Online. http://www.energy.ca.gov/ceus/
California Energy Commission. 2013 Building Energy Efficiency Standards for Residential and Nonresidential Buildings. Title 24, Part 6 and Associated Administrative Regulations in Part 1. CEC-400-2012-004-CMF-REV2. Edmund G. Brown Jr., Governor. California Energy Commission. May 2012. Online. http://www.energy.ca.gov/2012publications/CEC-400-2012-004/CEC-400-2012-004-CMF-REV2.pdf
Davis R., Hunt M. Laboratory Testing of Performance Enhancements for Rooftop Packaged Air Conditioners. Pacific Gas and Electric Company. Emerging Technologies Program. Project Number: ET13PGE1241. February 2015. Online. http://www.etcc-ca.com/sites/default/files/reports/et13pge1241_rtu_enhancements.pdf
Energy Information Administration. Commercial Buildings Energy Consumption Survey. 2012. Online. http://www.eia.gov/consumption/commercial/
Harrington, C. Woolley, J. Davis, R. Laboratory Performance Results: Indirect Evaporative Air Conditioning & Condenser Pre Cooling as Climate Appropriate Retrofits for Packaged Rooftop Units. Southern California Edison. Customer Programs and Services. 2015. Online. http://www.etcc-ca.com/ (submission pending publication)
D. Larson, California's Energy-Water Nexus: Water Use in Electricity Generation, Southwest Hydrology, September/October 2007.
NOAA. Quality Controlled Local Climatological Data. National Climatic Data Center. National Oceanic and Atmospheric Administration. 2015. Online. http://www.ncdc.noaa.gov/data-access/land-based-station-data/land-based-datasets/quality-controlled-local-climatological-data-qclcd.
Pistochini, T. Modera, M. Water-use efficiency for alternative cooling technologies in arid climates. Energy and Buildings. Volume 43, Issues 2–3, February–March 2011, Pages 631–638 (2011)
Torcellini, P. Consumptive Water Use for U.S. Power Production. National Renewable Energy Laboratory. Golden, CO. 2003.
Woolley.J.WesternCoolingChallengeLaboratoryResults:TraneVoyagerDCHybridRooftopUnit.ReportforSouthernCaliforniaEdisonHVACTechnologies&SystemsDiagnosticsAdvocacyProgram.October2012.
Woolley,J.Mande,C.Modera,M.Side‐by‐SideEvaluationofTwoIndirectEvaporativeAirConditionersAddedtoExistingPackagedRooftopUnits.ResearchReportPreparedforPacificGas&Electric.ET12PGE3101.August2014.