indicators improve planning vocational education planning ......contents list of acronyms 4...
TRANSCRIPT

NCVER
indicators
training indicatorsvocational education
planning
Using trainingimprove planning
indicators training
vocational education
S Saunders
to improve planning forUsing training indicators
vocational education and training

© 2001 National Centre for Vocational Education Research Ltd
ISBN 0 87397 716 5 print edition
0 87397 717 3 web edition
TD/TNC 66.15
Published by
National Centre for Vocational Education Research Ltd
ABN 87 007 967 311
252 Kensington Road, Leabrook, SA 5068
PO Box 115, Kensington Park, SA 5068, Australia
www.ncver.edu.au
Qua
lity
Syst
em
QualityEndorsedCompany
ISO 9001Lic. No. 4331
Standards Australia

ContentsList of acronyms 4
Acknowledgements 6
Executive summary 7
Project and policy background 11Key background paper 11Defining training indicators 12The policy environment for training indicators 12
Recent practice and use of training indicators 16Indicators of youth transition 16Analyses and indicators for the trades 19Occupational analyses and indicators 21Indicators for vocational guidance and graduate outcomes 22VET planning processes and indicators 25Practice—themes 31
Issues and directions 34The national planning background for indicators 34The place of indicators in the VET planning process 35The market for training indicators 35Needs and gaps for training indicators 36Useful classifications for VET planning and training indicators 37The usefulness of forecasts and other training indicators 40Resourcing the work of training indicators 41The aptness of training indicators for the VET climate 42
Proposals for improvements in training indicators 44Good practice in the use of training indicators 44Developing the range of training indicators 45Improving the implementation of Key Performance Measure 2 47Improving the dissemination of training indicators 49
Summaries and suggested actions 52Project and policy summary 52Summary of training indicators 52Summary of issues and directions 54Summary propositions and suggested actions 55
References 61
Contents 3

List of acronymsABS Australian Bureau of Statistics
ACER Australian Council for Educational Research
ACT Australian Capital Territory
AEC Australian Education Council
AGPS Australian Government Publishing Service
ANTA Australian National Training Authority
ANZSIC Australian and New Zealand Standard Industrial Classification
AQF Australian Qualifications Framework
ASCED Australian Standard Classification of Education
ASCO Australian Standard Classification of Occupations
AVETMISS Australian Vocational Education and Training Management Information Statistical Standard
BVET Board of Vocational Education and Training (New South Wales)
CCTE Chamber of Commerce, Training and Enterprise (United Kingdom)
CLMR Centre for Labour Market Research (Murdoch University, WA)
DEET Department of Employment, Education and Training
DEETYA Department of Employment, Education, Training and Youth Affairs
DEIR Department of Employment and Industrial Relations
DETE Department of Education, Training and Employment (SA)
DETIR Department of Employment, Training and Industrial Relations (Queensland)
DETYA Department of Education, Training and Youth Affairs
DEWRSB Department of Employment, Workplace Relations and Small Business
DEYA Department of Employment and Youth Affairs
Using training indicators to improve planning for vocational education and training
4

List of acronyms 5
DOLAC Departments of Labour Advisory Committee (Commonwealth-State)
DTE Department of Training and Employment (WA)
GCCA Graduate Careers Council of Australia
GREAT Group for Research in Employment and Training (Charles Sturt University, NSW)
ITAB Industry Training Advisory Body (or Board)
KPM key performance measure (for VET)
NAC New Apprenticeships Centre
NCVER National Centre for Vocational Education Research
NSW New South Wales
OECD Organisation for Economic Co-operation and Development (based in Paris)
OTFE Office of Training and Further Education (Victoria)
OVET Office of Vocational Education and Training (Tasmania)
OZJAC Australian Jobs and Courses (Directory)
RERU Regional Economic Research Unit (Charles Sturt University, New South Wales)
SA South Australia
TAFE technical and further education
TEC Training and Enterprise Council (United Kingdom)
VET vocational education and training
WA Western Australia
Note: If not otherwise indicated, departments are Commonwealth departments.

AcknowledgementsDuring 2000, this project and its report have had the benefit of advice andcommentary from Commonwealth and State employment or training departments,technical and further education (TAFE) institutes, and certain education andtraining consultants.
The author acknowledges the Department of Employment, Workplace Relationsand Small Business, Canberra (Labour Market Group), Department of Educationand Training, TAFE New South Wales (TAFE Planning), Department of Educationand Training, TAFE New South Wales (State Planning Managers’ Meeting),Victorian Office of Post Compulsory Education, Training and Employment (Policyand Planning Division), South Australian Department of Education, Training andEmployment (VET Strategy Branch); Kaye Schofield and Associates (Sydney),Richard Curtain (Melbourne), Miles Morgan Australia (Perth) and the GoodUniversities Guide (Perth and Melbourne).
Using training indicators to improve planning for vocational education and training
6

Executive summaryIn response to the need for information about labour market changes, skillshortages, and social and economic indicators, this report has attempted to developtraining indicators for vocational education and training (VET) policy andproviders. It follows from a critique, published by the National Centre forVocational Education Research (NCVER), of various approaches to measuring theadequacy of the stock of VET skills, a key performance measure for the VET systemas a whole.
Training indicators are taken to mean functional suites of quantitative andqualitative indicators of current or future VET supply and demand, potentiallyincluding economic, social, labour market, training, and other indicators, whichgovernments, enterprises, training providers or individuals may bring together toguide decisions about investments for skill training, especially at the industry,occupational, regional and course levels.
In that sense, training indicators are crucial to the VET planning cycle. Toimplement the National Strategy for VET and give best effect to the pool of VETfunds, the Australian National Training Authority (ANTA) and State and TerritoryGovernments use a wide range of training indicators in developing and reviewingtheir VET plans. Training indicators are an important NCVER area of interest,particularly in terms of key publications on enrolments, apprenticeships andtraineeships, and student outcomes.
The report begins with recent developments in the training system and the trainingmarket. Information relating to the national strategy and key performance measures(KPMs) for VET follows. The current strategy’s market emphases, and the newdiversity of training providers and pathways to skills, are taken to imply increasingneeds for diversified training information to improve the operation of the market.
The report describes and classifies major Commonwealth, State and other uses oftraining indicators since the 1970s—for youth education and training, trainingpolicy, skilled migration, job placement needs and vocational guidance. The overallassessment is that this work has proved its worth for policy and program purposes,especially when it successfully synthesises major demand-side and supply-sidetraining indicators, or derives actual measures that compare training demand totraining supply.
Various 1990s initiatives in the VET sector (new employer and student surveys) andin employment and education (new job outlook and student information programs)are seen to create fresh possibilities for the use of training indicators in VETplanning and vocational guidance. State and regional VET planning occupy animportant place in the report, as this is increasingly where important VET plans anddecisions are made and where training indicators can have a major impact. Whereas
7Executive summary

Using training indicators to improve planning for vocational education and training
8
State and regional VET plans appear to be organised primarily along industry lines,institute-level plans appear to be expressed more in terms of the (adjustments to)provision of educational courses that will give effect to industry and regionalplanning priorities.
The issues and directions for training indicators are discussed in terms of thenational planning background; the place of indicators in VET planning; the marketfor training indicators; needs and gaps; classification, forecasting and resourcingissues; and the aptness of indicators for the VET climate.
Training indicators help in meeting the needs of the national strategy and themeasurement framework for the VET system. In recent years, they have often beendeveloped to assess stocks of skills and client outcomes, now KPM 2 and KPM 4.
A range of supply and demand training indicators are used in national and StateVET planning and region–industry planning. There appears to be limited formalassessment of the usefulness and accuracy of the indicators used in developingsuccessive plans. The processes and indicators used for VET performancemeasurement and evaluation tend to follow somewhat different tracks from thoseused for VET forward planning.
There is evidence of persistent demand for training indicators, which in this reportare regarded as a ‘public good’.
NCVER responds to demands for training indicators with a range of national andState analyses of VET enrolment, training and student outcomes. For State VETplanning purposes, States and Territories may supplement these analyses with theirown systems data on VET students, other statistical analyses and industry surveysources.
With increasing diversification and deregulation of the training market, there areimportant needs and gaps for training indicators directed to regional and technicaland further education (TAFE) institute planning processes and decisions. The toolsand indicators available at these levels can be improved.
Institute planning and the use of indicators for institute comparisons are issues ofsome sensitivity. Also discussed in this report are the most useful frameworks(industry, discipline, field of study or unit of competency) for VET planning andindicators, and the extent to which the training indicators do or should use(industry) forecasts.
The preference among State VET planners is to use industry and occupationalforecasts as one, if not necessarily the predominant, set of training indicators whichcontribute to VET plans and planning decisions. This seems reasonable if, as arguedhere, VET systems have both leading and following roles in developing skillsolutions for industry and individuals.
The debate tends to focus on the best techniques and training indicators for VETplanning, but continuity in VET organisational resources and expertise is just asimportant as technique in improving judgments and inferences. Resources andexpertise, in NCVER and State VET agencies, matter greatly if training indicatorsare to make their best contribution to sustainable improvements in VET planning.

Tabl
e 1:
Se
lect
ed t
rain
ing
indi
cato
rs f
or a
sses
smen
ts o
f ch
angi
ng V
ET d
eman
d, a
t na
tiona
l, St
ate
and
regi
onal
leve
ls
Trai
ning
dem
and
indi
cato
rs (
for
a no
min
al in
dust
ry):
Trai
ning
sup
ply
indi
cato
rs (
nom
inal
indu
stry
, dis
cipl
ine
or f
ield
of
stud
y):
•O
utp
ut
and p
roductivity,
and g
row
th f
ore
cast
s •
VET f
undin
g,
and t
rends
•Em
plo
ym
ent, r
ecent
em
plo
ym
ent
change,
gro
wth
fore
cast
•
Tra
inin
g p
rovid
ers
(num
bers
, ty
pes,
locations
and t
rends)
•A
ssess
ment
of
stra
tegic
im
port
ance (
of
an i
ndust
ry t
o t
he e
conom
y)
•Tra
inin
g a
ctivity a
nd t
rends
•In
dust
ry c
hara
cte
rist
ics
(siz
e a
nd d
istr
ibution o
f firm
s)–
students
, enro
lments
, hours
and t
rends
•In
dust
ry t
rain
ing n
eeds
(em
erg
ing o
r contr
acting s
kills
dem
ands)
•
Tra
inin
g t
rends
in d
eta
il
•R
epla
cem
ent
dem
and l
evels
–cours
e e
nro
lments
, le
vels
, com
ple
tions
and t
rends
•V
ET g
raduate
em
plo
ym
ent
and s
ala
ries,
and t
rends
–enro
lments
by p
ackage (
com
pete
ncie
s),
and t
rends
•Em
plo
yer
and s
tudent
satisf
action,
and t
rends
–contr
acts
of
train
ing,
com
ple
tions,
and t
rends
•Jo
b m
ark
et
trends
(wages
and c
onditio
ns)
–m
odule
enro
lments
, com
ple
tions
and t
rends
•(R
egio
nal) d
em
ogra
phic
s •
Share
s of
train
ing m
ark
et
(by p
rovid
er,
by p
ath
way,
by l
evel)
•O
ther
supply
sourc
es
(exis
ting w
ork
ers
, re
train
ing,
mig
ration)
•(R
egio
nal) e
nro
lment
dem
ogra
phic
s
Der
ived
mea
sure
s (c
ompa
ring
dem
and
to s
uppl
y):
•O
utp
ut
or
stra
tegic
im
port
ance (
of
an i
ndust
ry i
n t
he e
conom
y)
vers
us
VET f
undin
g l
evels
•Em
plo
ym
ent
levels
vers
us
VET f
undin
g l
evels
•Em
plo
ym
ent
levels
vers
us
levels
of
train
ing h
ours
•Em
plo
ym
ent
levels
and t
rends
vers
us
enro
lments
, contr
acts
of
train
ing,
com
ple
tions
•G
row
th a
nd r
epla
cem
ent
needs
vers
us
train
ing c
om
ple
tions
•R
egio
nal
dem
ogra
phic
s vers
us
regio
nal
enro
lment
dem
ogra
phic
s
•In
dust
ry m
ark
et
needs
vers
us
train
ing t
rends
and t
rain
ing m
ark
et
share
s
•Suggest
ed d
irection o
f tr
ain
ing e
ffort
(+
, 0,
-)
•Suggest
ed t
rain
ing g
aps
and (
purc
hasi
ng)
opport
unitie
s
Not
e: I
ndic
ator
s an
d c
ompa
riso
ns m
ay b
e qu
anti
tati
ve o
r qu
alit
ativ
e. T
he f
ourt
h ch
apte
r in
this
rep
ort p
rovi
des
fur
ther
exp
lana
tion
s.
To emphasise this point, the report notes that available and current trainingindicators have been used successfully to make judgments about some of thecritical VET policy questions (for example, the quantity and quality of traineeships).Over the period 2000–05, these indicators offer suitable measures to assessprospects and performance in a VET system under policy and resource stresses, andflexible measures to examine VET responses to changing industry, skill anddemographic trends. In particular, training indicators can be used to analyseimportant lines of inquiry (including youth transition issues) that follow from thebasic concept of KPM 2: stocks of VET skills against desired levels.
The report develops summary propositions for good practice in the use of trainingindicators, for increasing the range of training indicators, for improving theimplementation of KPM 2, and for improving the dissemination of trainingindicators for VET planning.
Consistent with the project aim, and to distil its results, table 1 proposes a selectionof training indicators—on the demand side, on the supply side, and comparingdemand to supply—which may be used for improving assessments of changingVET demand at national, State and regional levels. The table presumes thatindicators would usually need to be applied to particular industries, disciplines andfields of study.
Using training indicators to improve planning for vocational education and training
10

Project and policy background
This chapter provides research and policy context for the project and defines terms.
This project on the development of training indicators responds to the need forinformation about labour market changes, skill shortages, and social and economicindicators, to inform training providers about changes in training demand. The aimis to develop a range of indicators, to assist policy-makers and training providers toidentify new areas of demand and the subsequent need for reskilling in declining orrestructuring industries.
The project follows a recent critique (Blandy & Freeland 2000) of economicmodelling and benchmarking as means of measuring the adequacy of the stock ofvocational education and training (VET) skills, one of eight key performancemeasures (KPM 2) for the VET system identified in the 1999 Australian NationalTraining Authority (ANTA) publication, Key performance measures for vocationaleducation and training (ANTA 1999d).
Key background paper Blandy and Freeland (2000) is the main background paper for the project. Thispaper identifies four broad approaches to assessing the adequacy of the stock ofVET skills.
The manpower requirements approach attempts to derive skill requirements implicitin national and industry forecasts, to compare these to projected supplies, andformulate training programs to eliminate excess demands and supplies. The primeexample cited by Blandy and Freeland is the Organisation for Economic Co-operation and Development (OECD) Mediterranean Regional Project of the 1960s(see Hollister 1967).
The international, national and industry comparisons approach compares national,State or industry skill profiles with model, target or yardstick profiles andbenchmarks and formulates training programs so as to achieve the model profile(s).The ANTA workskill benchmarking reports of the late 1990s (Cullen 1997a, 1997b,1998) are key examples given.
The labour market analysis approach employs models of markets for skilled labour toforecast excess demands and supplies and formulate corrective policies. Freeman’s(1976) study of the American college graduate market is the main study putforward.
The training indicators approach looks at indicators of present and likely futureconditions for skilled labour and forms judgments about the most appropriatecourses of action to improve skilled labour outcomes.
11Project and policy background

Using training indicators to improve planning for vocational education and training
12
Blandy and Freeland query the usefulness of the first three approaches in assessingthe adequacy of VET stocks—KPM 2 for the VET system (ANTA 1999d).
To paraphrase their critique, the first and third approaches tend to fail becauseskilled labour markets, whatever the forecasts and their timeframes, tend to self-correct for better or for worse by varying labour prices, varying internal orinternational migration, varying occupational entry and exit rates, varying the ratesof movement from adjoining qualifications and occupations, and so on. That is, thetraining supplies, generated by the VET system, operate inside a larger frameworkof supply and demand adjustment mechanisms. It is difficult to isolate and forecastthe exact industry or occupational shortages of skills so that these can be prescribedto the VET system as the required systemic response.
The second approach tends to fail because there is no compelling economic logicthat says why the skill profile of the area (national, State or industry) underexamination should match the assigned benchmark drawn from elsewhere.
Rather than the first three approaches, the authors recommend approaches to KPM2 based on the use of training indicators. They give examples of what they deem tobe such approaches. These and other examples are discussed in the followingchapter. Thereafter, the report aims to develop the range of indicators.
Defining training indicatorsFor the purposes of this report, it may be useful to define the term trainingindicators, as it is not a common term in the VET sector.
Here, training indicators are taken as any functional suite of quantitative andqualitative indicators of current or future VET supply and demand, potentiallyincluding economic, social, labour market, vocational, and other indicators, whichgovernments, enterprises, training providers or individuals may bring together toguide decisions about investments for skill training, especially at the industry,occupational, regional and course levels.
The policy environment for training indicatorsIn the recent evolution of the Australian training system and training market, therehave been conscious policy shifts toward the industry or demand side of thetraining market (Allen Consulting Group 1994), including user choice (Kemp 1996).
There have also been considerable increases in government funding effort. Publicand private VET providers can now offer more diverse forms of skills andqualifications both inside and outside contracts of training. The regulatory systemhas evolved into the current system, whereby government and non-governmentproviders can offer competency-based training and qualifications under the samerecognition framework (ANTA 1999b).
Australia now has a mixed or semi-competitive VET funding model rather than amarket of pure competitive forces. Training costs are shared among employers,government and individuals, but employers appear to carry significant costs(Dockery, Kosky, Strombach & Wiwi Ying 1997) in the case of apprentices. In theirmarket interventions, governments (see OTFE 1998) may attempt to target the more

13Project and policy background
general types of vocational skills represented by many apprenticeships (Billett &Cooper 1998), or they may target what they regard as strategic industries for theeconomy.
These developments in the Australian training market, and the more recent ANTAand State VET planning protocols, have tended to create fresh needs and demandsfor training information and training indicators.
An important issue in the training market, and particularly relevant to thedevelopment of training indicators, is the kind of attention that the system gives toVET clients and to their VET information needs. Organised surveys of consumersatisfaction and outcomes are quite a new (1995) feature of the VET system. Suchsurveys have now been adopted as KPM 3 and KPM 4 (ANTA 1999d) for thesystem.
Anderson (1997a), Billett (1998), and Billett and Hayes (2000), have argued that VETstudents and trainees still tend to be defined out of the client loop and are unlikelyto have an appreciable consumer impact under current VET planning and allocationmodels. Kilpatrick and Allen (2000) contend that industry has been overplayed asthe principal VET client compared to enterprises, communities, families andindividuals.
Anderson (1997b) sees gaps in information relating to the size and structure of theVET market, and limited research on VET supply–demand and VET products.Anderson (1998) and Robinson (1998) contend that VET lacks the preconditions(multiple buyers and sellers, standard products, supply and demand information)for a truly competitive market. Freeland (1999), reviewing supply–demand forces inselected VET markets, describes subtle supply–demand interplays, rather than apure market. Both supply and demand sides, he observes, make essentialcontributions to the successful outcomes derived from VET.
Robinson suggests an emphasis on better VET information and more diverseproducts, rather than on the commodity-market approach of multiplying the sellersof standardised products. As described later, an issue here is that the diversificationof market (provider) information does not appear to be keeping pace with theexpansion of the VET market.
Drawing on Anderson’s work, Freeland describes the development of the trainingmarket as a shift from a dual (public–private) market to a sectoral one. Most publicVET funds flow directly to technical and further education (TAFE), some publicfunds are up for competition (user choice), and there is also an open marketavailable to both private and public providers. The unifying feature is that allmarkets and registered providers can offer the same qualifications under the post-1998 recognition framework.
The medium-term directions for VET policy are set by A bridge to the future:Australia’s national strategy for vocational education training 1998–2003 (ANTA 1998a).Within that, VET ministers agree to annual national priorities each year, whichprovide the context for State and Territory planning and funding priorities.
The strategy responds to globalisation, the increasing service and knowledge basesof the economy, and changes in demography and job distributions. Its fiveobjectives are equipping Australians for the world of work, enhancing mobility in

Using training indicators to improve planning for vocational education and training
14
the labour market, achieving equitable outcomes in VET, increasing investment inVET, and maximising the value of public VET expenditure.
Public VET funding exceeds $4 billion (NCVER 1999c), most of which is allocatedthrough the State training profiles and strategies. NCVER (1998a, p.12) commentsthat resource allocations, at least in terms of annual hours, have recently moved‘toward areas such as business and clerical, community services, health andeducation, tourism and hospitality, indicating that some key features of the VETmarket are finding an appropriate response from the VET systems’.
This perceived responsiveness relates in part to the coincidence that more liberaltraineeship policies and more diverse traineeship programs have enabled thegrowth industries for employment to become the growth sectors forapprenticeships and traineeships. States and Territories, consistent with recent(ANTA 1996, 1998e, 1999c) policy, maintain commitments to apprenticeships andtraineeships in their State training profiles.
A comparison of the NCVER paper and an industry monograph (Murphy 1998)suggests that the more recent ANTA resource shifts tend to match up with lowoutput growth–high job growth industries rather more than high outputgrowth–low job growth industries. There is an element of this in the recent StateVET profiles and planning documents.
The ANTA resource allocation plan for 2000 (ANTA 1999c) moves resources infavour of industries with the greatest projected 1997–2006 employment growth—cultural and recreational services, education, retail, business services, and healthand community services. State VET plans are generally similar, with somevariations for local industry circumstances.
These approaches are a shift from recent (Cullen 1997a, 1997b, 1998) efforts tobenchmark VET skill requirements against international or Australian yardsticks.
At the macro level, it could be said that projected employment growth is being usedas the training indicator of choice for (marginal) shifts of training resources.Including these shifts, the projected total national VET provision for 2000 is nearly260 million hours and the top five industry totals are community and health (nearly26m), tourism (nearly 20m), arts–entertainment, building, and engineering (each15–16m).
Billett (1998) contends that the centralised training model and the industry-ledtraining model are not necessarily the only two options. He calls for a voluntaristicmiddle ground where local VET planning is pursued to meet the needs ofindividuals, enterprises, regions and industries. Billett and Hayes (2000) urge aparticipative model of regional planning that responds the unique features ofdifferent regions. Their model is sensitive to, rather than intensive of, regionaltraining indicators.
State planning processes do include regional consultations and regional input. Thisis set out in the following chapter. Projected employment growth is an importantplanning indicator, but other indicators assume increasing importance at theregional and institute levels of planning.
The final part of the VET planning loop is that of performance measurement andevaluation. The Report on government services 1999 (Steering Committee 1999), while

15
acknowledging ongoing ANTA improvements, contends that national VET skilloutputs (and gaps) are areas of deficits in VET measurement.
Following on from the national strategy ANTA (1999d) produced Key performancemeasures for VET to take full effect in reporting for 2001. There are eight KPMswhich, in brief, cover skill outputs, stocks of skills, employers’ views, studentoutcomes and prospects, participation and outcomes by client groups, publicexpenditure per publicly funded output, public expenditure per total output, andtotal VET expenditure.
Project and policy background

Recent practice and use of training indicators
Blandy and Freeland (2000) point to notable overseas and Australian efforts to usetraining indicators in the VET field and for a wider range of skilled occupations andlabour markets.
Their main Australian examples are the work of Departments of Labour AdvisoryCommittee (DOLAC), the Department of Employment and Industrial Relations(DEIR) Occupational outlook program (see DEIR 1986), and training indicators asused by ANTA itself.
This chapter reconsiders these examples, with a wider selection of Australianpapers, reports, and ongoing programs, which could be said to use trainingindicators as defined above. Table 2 provides a summary of these examples.
The examples are discussed in terms of the type of analysis, the types of indicators,the motivations for using the indicators approach, and its degree of persistence orsuccess over time. More often than not, the search is for indicators of VET forparticular industries and occupations. The exception is the youth transition issue,where the search is for indicators of the adequacy of (VET) preparation forparticular education or age cohorts of young people.
In this treatment, the distinction between industry-occupational forecasting andtraining indicators methods is one of degree rather than one of kind. Some of themethods below certainly use forecasts but as one element of a total approach. Whilethe focus is on training indicators for VET, the discussion takes in indicators acrosspost-secondary education and training generally, whenever this is the sensibleapproach.
Indicators of youth transitionThe adequacy of Australia’s youth transition—from school to education, trainingand work—is an important measure of the national health of the VET system. Thisissue has prompted many of the most important VET reforms and numerousindicators may be used to assess the adequacy of the transition.
Rising youth employment and low school retention (only 40% continuing to Year 12at the time) were important measures in the Kirby Inquiry into Labour MarketPrograms (Kirby 1985) that led to traineeships. The Australian Education Council(AEC) report (Finn 1991) also supported increasing investment in Australia’s skillbase. Governments embraced Finn’s Year 2001 goals. As currently interpreted, theseare that:
❖ 95% of 19-year-olds should be participating in or have completed Year 12, or have Year 10 or 11 and be participating in or have completed some formally recognised education and training
Using training indicators to improve planning for vocational education and training
16

17
❖ 60% of 22-year-olds should be participating in or have completed an AQF level 3 qualification or be participating in or have completed equivalent higher education (diploma or degree)
Perceived deficits in youth education and training led successive CommonwealthGovernments to put forward Working nation (Keating 1994) and later the NewApprenticeships agenda (Kemp 1996). In the contemporary setting, differingmeasures lead to differing opinions on the overall adequacy of young people’s VETopportunities.
Sweet (1995, 1996) asserts that young Australians are greatly undersupplied withVET opportunities. He estimates only 25% of all education and training placesavailable to those of upper secondary age are in the VET sector, scarcely more thanthe 20% of 1985 and well under the OECD average of 50%.
To some extent, this is subject to the same criticism of international comparisonapproaches as that discussed in the first chapter. It does not fully test theassumption that a participation rate of 25% in VET by teenagers is insufficient forAustralia’s particular economy and labour market.
Concerned that Australia will fall short of Finn’s targets, Lundberg (1998) concedesthat the case for targets weakens when the enterprise perspective is considered. Balland Robinson (1998), Robinson (1999), Wooden (1998) and Misko (1999) seem lessconvinced of a large deficit in youth VET places. Playing down internationalcomparisons, but taking broader perspectives and measures of the Australianexperience, the authors imply that young people are making other valid educationand work choices, be they recognised VET or otherwise.
Misko classifies young people’s main education and training pathways between1996 and 1997. She notes:
❖ the recent 5–6% fall in apparent retention to Year 12 (down to 72% in 1997)
❖ that 35–40% of Year 12s go on to university
❖ almost a quarter of Year 11–12 completers go on to TAFE
❖ only about 10% of students undertake VET in Schools programs
❖ the numbers of students entering apprenticeships have declined since 1989
Following Ball and Robinson, Misko notes that the percentage of 15–19-year-oldteenagers in VET remains around the 20% mark over 1990–96. She suggests that theslight decline in Year 12 school retention rates may be due to changing studentpreferences and perceptions and not just unfavourable family or personalsituations.
Wooden (1998), and Lewis and Kosky (1998), infer that the big shift since Kirby isnot the proportion of (15–19-year-old) teenagers in employment but the proportionin part-time employment. About 275 000 of these teenagers are said to be in part-time employment and also in school, whereas the numbers in apprenticeships andtraineeships are now 80 000 or fewer. The first figure is about 30% of all teenagestudents or 20% of all teenagers. Perhaps, these informal work-and-study optionshave to be given some place along with formal schooling (Year 12) and VET optionsin sets of measures of the adequacy of youth transition.
Recent practice and use of training indicators

Tabl
e 2:
Ex
ampl
es o
f pr
actic
e an
d us
e of
tra
inin
g in
dica
tors
, 197
0s t
o da
te
Prog
ram
or
auth
ors
Type
s of
ana
lysi
sTy
pes
of in
dica
tors
Ratio
nale
s
Youth
tra
nsi
tion i
ssues,
•analy
sis
of
path
ways
•sh
are
s of
young p
eople
in d
iffe
rent
education a
nd t
rain
ing p
ath
s•
motivate
d b
y c
on
cern
s fo
r
1980s
to d
ate
and j
ob-s
kill
outc
om
es
•sh
are
s of
young p
eople
achie
vin
g s
kills
, qualifications
or
jobs
pro
ductive w
ork
forc
e a
nd
for
youth
supply
•in
tern
ational
com
pari
sons
of
youth
tra
nsi
tions
and o
utc
om
es
econom
y,
som
etim
es
by
concern
s fo
r young p
eople
fail
ing
Analy
ses
of
the t
rades,
•
dem
and–su
pply
•
dem
and s
ide:
econom
ic a
ctivity,
em
plo
ym
ent
trends,
str
uctu
ral
•m
otivate
d b
y s
upply
and
1980s
to d
ate
synth
ese
s of
train
ing
and d
em
ogra
phic
change,
gov’t p
olicy,
repla
cem
ent
dem
and
wast
age (
not
gro
wth
)
(DO
LA
C,
DEET e
tc.)
concern
s
•su
pply
sid
e:
enro
lments
, m
igra
tion,
upsk
illing,
•m
ade g
ood i
nfe
rences
unem
plo
ym
ent
levels
, etc
.about
the f
utu
re (
main
ly
repla
cem
ent) n
eeds
•deri
ved m
easu
res
as
•ra
tes
(%)
of
repla
cem
ent
of
stock,
or
appre
nticesh
ips
as
% o
f tr
ades
•pro
mpte
d b
y t
rade r
efo
rm
train
ing i
ndic
ato
rs(o
r to
tal
pare
nt
indust
ry)
em
plo
ym
ent
issu
es,
or
ass
ess
ing ‘
decline’
(Sta
te G
ov’t,
academ
ic)
in t
rades
Occupational
analy
sis,
•
dem
and–su
pply
synth
esi
s,•
work
forc
e s
ize a
nd p
rofile
, w
ork
ing c
onditio
ns,
type o
f tr
ain
ing,
•im
port
ant
for
train
ing,
1970s
to d
ate
deri
ved m
easu
res
(1980s)
train
ing r
ate
s (%
), s
upply
–dem
and b
ala
nce,
labour
mark
et
outlook
imm
igra
tion,
care
ers
, jo
b
(DEIR
to D
EW
RSB
)pla
cem
ent, u
ses
•dem
and-s
upply
synth
esi
s •
sim
ilar
to 1
980s,
but
with e
mphasi
s on s
um
mary
occupational
•
sim
ilar
to 1
980s,
but
job
(1990s)
pro
spects
accord
ing t
o
pro
jecte
d j
ob g
row
th a
nd l
abour
turn
over
pla
cem
ent
more
so a
nd
imm
igra
tion l
ess
so
Vocational
guid
ance
•care
er-
cours
e d
irecto
ries
•fa
ctu
al
desc
riptions
of
care
ers
(Jo
b G
uid
e)
or
cours
es
(OZ
JAC
)•
wid
ely
available
, basi
c
and g
raduate
outc
om
es,
in
form
ation
1970s
to d
ate
•deri
ved m
easu
res
•gra
duate
em
plo
ym
ent
and s
ala
ry r
ate
s (G
CC
A), i
nst
itutions,
cours
es,
•w
idely
accepte
d a
s m
ark
et
cours
e p
rofile
s, c
ours
e s
atisf
action (
Good U
niv
ers
itie
s G
uid
e)
indic
ato
rs f
or
inst
itutions,
students
•gra
duate
em
plo
ym
ent
rate
s, j
ob a
nd s
ala
ry b
enefits
, cours
e
•new
(post
-1995)
surv
eys
and e
mplo
yer
satisf
action (
VET S
tudent
and E
mplo
yer
Surv
eys)
now
part
of
KPM
s fo
r V
ET
Sta
te V
ET p
lannin
g p
rocess
es
•dem
and–su
pply
synth
esi
s•
dem
and s
ide:
indust
ry n
eeds
advic
e,
pri
ori
ty i
ndust
ries,
indust
ry a
nd
•se
ekin
g t
o g
ive b
est
effect
to
(Sta
te,
regio
n,
inst
itute
levels
),(s
om
e d
eri
ved m
easu
res)
outp
ut
fore
cast
s, r
egio
n s
ocio
-econom
ics,
regio
nal
indust
ry a
nd
nation
al
and S
tate
VET
from
1990s
em
plo
ym
ent, a
nd s
o o
nst
rate
gie
s and p
lans
•su
pply
sid
e:
dem
ogra
phic
s, l
abour
forc
e t
rends,
qualification p
rofile
s,•
findin
g b
est
use
s of
public
skill
pro
file
s or
gaps,
volu
me o
f tr
ain
ing f
unds,
volu
me o
f enro
lments
,V
ET f
unds
to b
ala
nce
volu
me o
f tr
ain
ing,
volu
me o
f com
ple
tions,
and s
o o
ncom
peting d
em
ands
from
indust
ries
and c
lient
gro
ups
Not
e: S
ee f
ollo
win
g fo
r d
etai
ls a
nd e
xpla
nati
ons
of te
rms.
See
tabl
e 3
for
mor
e d
etai
ls o
n St
ate
VE
T p
lans
.
19
A recent OECD (2000) report gives Australia a fair report card for youth transition.For example, Australia’s post-secondary participation at the first age at which suchparticipation is at a maximum is estimated at 35%—25% in university and 10% inother pathways. This percentage ranks fifth of 18 nations. Australia scores very lowon legal school leaving age (15), but much higher on average age (19.8) of actuallyleaving education.
However, Kirby (2000) himself remains critical of education and training for youngVictorians (Australians), drawing a link between education and literacy levels andeconomic outcomes. He cites poor youth participation, poor outcomes(qualifications, jobs and literacy) among certain groups and geographic regions,lack of co-ordination in education and training, and a lack of system accountabilitytowards all young people.
Indeed, despite steady increases in the 1990s, Australian Bureau of Statistics (ABS)transition data suggests that Finn’s 2001 target for 19-year-olds may be undershotby 10% or more. This is acknowledged in the 1998 ANTA Annual national report(ANTA 1999a, p.10) for VET, which also estimates that the Finn target for 22-year-olds is on track.
Use of agreed or common sets of indicators might help to bridge the divergentviews and indicators of the youth transition. Perhaps the emphasis needs to shiftmore to the experiences and outcomes of the young people themselves. In thatsense, diverse (national, regional and demographic) indicators of labour market andskill (qualification) experiences and outcomes appear to have greater value thanindicators of the outputs of the various education and training systems that servethem. It is to be noted that the framework of transition indicators proposed in theOECD report emphasises the context, duration, pathways and outcomes oftransition more than the detailed processes (educational outputs).
A greater or lesser weight may be placed on Australia-to-OECD comparisons,according to the perceived strength of the link between member nations’ youth(education and skill) outcomes and their economic outcomes. In either event, thereappears to be a strong case for intensifying the indicators placed over the sizeableminority of young Australians who are still failing to make an adequate transitionwithin a reasonable period.
Analyses and indicators for the tradesBefore the establishment of ANTA, DOLAC was a key Commonwealth–Statecommittee of employment and training officials. Their 1983 report (DEIR 1983b)studies supply and demand for skilled trades labour, specifically eight major trades.
Rather than manpower planning, DOLAC recommends what it calls an analyticapproach. Analysis of the skill stocks in various trades is considered in the contextof demand factors for the various trades (economic activity, employment trends inemploying industries, structural and technological change, government policy,demographic change and replacement demand) and supply factors (courseenrolments, occupational migration, informal upgrading, unemployment levels,and so on).
Recent practice and use of training indicators
Using training indicators to improve planning for vocational education and training
20
DOLAC finds that the trades under consideration have had more or less staticworkforces over the preceding ten years. Acknowledging the vagaries ofoccupational forecasting, the officials anticipate—with some justification as itturned out—limited growth over the following ten years.
Notably, DOLAC also estimates the supply into and wastage from the trades aspercentages of the employed workforce, after the manner of DEIR's Employmentprospects by industry and occupation (DEIR 1983a) of the same period.
Similar emphases are found in a later DOLAC paper (DOLAC 1988) oncompetency-based training in the trades, which examines structural trends andgovernment policies in the trades, rather than employing detailed forecasts of, orbenchmarks for, them.
The DOLAC papers are prompted by concerns about supply into and wastage fromthe trades, rather than by substantial growth expectations. While DOLAC itself isno longer an important part of the VET system and its measurement, its papers areimportant milestones.
Other official bodies leaned towards training indicators in analysing supply anddemand for trades and other occupations. A 1987 ACT paper (Office of ACTAdministration 1987) is an intensive application of the Occupational outlooktechniques. Issued for a consultative review of the local training authority, thispaper measures the rates of training (annual ACT graduations as a percentage ofemployed persons) for a variety of professional, middle-level and tradeoccupations.
Comparing training rates across occupations in the ACT, and across Australia, thepaper infers that ACT training is over-geared in some professions (annual trainingrates over 10%) whereas most trade training rates sit at a low 2–4%. Informationtechnology and tourism are signalled as priority areas for VET development.Indeed, over the following ten years these areas gained a much stronger place in theACT economy and vocational training provision.
Companion papers to the 1988 DOLAC report are Segal and Johnson (1987),Dawkins (1988) and State Training Board of Victoria (1989). These papers argue thecase for reform of trade training (including competency-based training) in terms ofreducing persistent trades shortages and improving flexibility of supply to respondto demand. They tend to rely more on practical evaluations of the supply anddemand indicators, as they stand at the time, rather than attempting detailedforecasts of future markets for the trades.
In this author’s (Saunders 1999) review of apprenticeships and traineeships policydevelopments, the type of analysis represented by DOLAC and the ACT papersappears to fall away after the late 1980s. There appears to be a similar pause in theDEIR work (see below) over the corresponding period.
In the mid 1990s, a number of VET-related studies make a definite return to trainingindicators of one form or another. Dandie (1996), Pickersgill and Walsh (1998),Natarajan and Misson (1998) for Victoria, and Smith (1998) for Queensland,measure apprenticeships as a proportion of employment in trades, or in parentindustries, or in the workforce as a whole.

21
Using these simple measures as something of a sobriety test to counter speculationabout trades being in decline, the authors find that the overall proportions arerelatively stable over time. Re-applying the measures to individual trade groups,they uncover greater problems in more recent years in certain trades.
Smith’s (1998) analysis leads him to query whether there is still the same need fortrades in the future skill mix of the Queensland economy. Significantly, the highcross-industry variability that the author observes on nearly all of the supply-and-demand-side training indicators suggests to him that training issues should beapproached industry by industry. In its prescriptions for training indicators, thisreport will follow a similar logic.
Like the DOLAC papers, the government and academic papers cited here tend to beprompted by concerns about the balance of supply and (replacement) demand inthe trades. The ACT paper is unusual in considering trades together with the rangeof skilled occupations, but such an approach is characteristic of the DEIR work nowconsidered.
Occupational analyses and indicatorsThe Department of Employment and Industrial Relations (DEIR), subsequently theDepartment of Employment, Education and Training (DEET) and now theDepartment of Employment, Workplace Relations and Small Business (DEWRSB),has a substantial record in the use of training indicators for the analysis of (skilled)occupational requirements. Over the years, this national program has been co-ordinated by the economic or labour market group in the department’s nationaloffice and supported by staff researchers based in the State offices.
In the middle 1970s, DEIR began to research and publish its Employment prospects byindustry and occupation (for example, DEIR 1983a), later issued as Occupationaloutlook (DEIR 1986).
The publication deals with about 200 key skilled occupations in the Australianlabour force—professional occupations, paraprofessional and middle-leveloccupations, and trade and other skilled occupations. For each occupation, thetraining indicators covered include workforce numbers, wages or workingconditions, training, (percentage) training or workforce replenishment rates, supplyand demand, and labour market outlook.
Also included are similar summaries of industries, including output and exportfigures, employment (skilled), occupations and training, and summary industryforecasts.
The main purposes for the program are stated as ‘training’ (training programs andpolicy rather than training providers), ‘immigration’ (including guidance for skilledlabour migration intakes), ‘careers’ (career advice in schools, TAFE and so on), ’jobplacement’ (the then Commonwealth Employment Service), and ‘general purposes’.
The immigration purpose was so important that, over 1984–89, DEIR and DEETissued a separate training indicators publication (for example, DEET 1988) forskilled migration. Based on economic and occupational analyses (similar toOccupational outlook), estimates were prepared for skilled occupations of
Recent practice and use of training indicators

Using training indicators to improve planning for vocational education and training
22
employment, annual domestic output, and (proportionate) occupational sharesfrom migration where these were deemed appropriate.
Careers usages were also very important, even though the recognised DEIR careerguidance program and products lay elsewhere in the organisational structure.
The occupational outlook program narrowed towards the end of the 1980s, tendingto focus on occupations in shortage rather than the broad range of skilledoccupations. Over the course of the 1990s, DEET, later Department of Employment,Education, Training and Youth Affairs (DEETYA), and then DEWRSB, continued toresearch skills in shortage. Skills in Australia (DEETYA 1998) is a representativepaper.
The DEWRSB program has broadened again since 1998, once again taking in awider range of occupations (nearing 400) and of supply-and-demand-side trainingindicators. The state of the art is represented by publications such as Job futures(DEWSRB 1999, 2000a) and websites such as Job outlook (DEWRSB 2000b).
The range of indicators in Job outlook and Job futures is similar to that found inOccupational outlook, but actual rates of training are no longer computed. These havebeen supplanted by ranged estimates (above average, average, below average) ofoccupational unemployment rates and projected growth and turnover.
The skilled migration emphasis having fallen away, the current job outlookprogram has been boosted by government’s needs for job placement information inthe deregulated Job Network. Job outlook links directly to actual jobs availablethrough DEWRSB’s job search (2000b) site. Another impetus is the currentgovernment’s interest in skill shortages, as evidenced by several recent studies (forexample, Electrotechnology Working Group 2000) under the auspices of thegovernment-industry National Industry Skills Forum.
Informally, the program is still widely used for vocational guidance purposes,although, once again, the recognised Commonwealth career guidance program lieselsewhere in the portfolios (see below).
The coincidence that present-day information technology can economically storeand disseminate multivariate job and job vacancy information, for immediateretrieval and search, should not be underestimated as a factor in the resurgence ofJob outlook.
In years past, the lack of such a capacity has inhibited the production andmarketing of Occupational outlook and other occupational and career informationpackages developed in Australia and overseas.
Indicators for vocational guidance and graduate outcomesThe continuing informal uses of the DEIR job outlook work for career guidancepurposes are one sign of the underlying demand from governments, enterprisesand individuals for information on vocations and their prospects.
Well-known government and commercial programs have addressed these needsover the years and, in so doing, have used training indicators to a greater or lesser

23
degree. Of particular note are the DEIR (now the Department of Education,Training and Youth Affairs (DETYA)) national career guidance program and thelarge-sample Graduate Careers and Graduate Destination programs for universityand TAFE, auspiced by the Graduate Careers Council of Australia.
From (at least) the 1970s, DEIR and its successors, Department of Employment andYouth Affairs (DEYA), DEET, DEETYA and DETYA, have had a national careerguidance program which has issued summary career prospects, usually under thetitle Job guide. The program is now located in DETYA (see DETYA 2000), issuing theJob guide publication to Australian secondary schools and reissuing the samematerial on a website.
Job guide covers the broad range of Australian occupations and jobs, primarilydelivering State-by-State factual descriptive information on job, personal andtraining requirements rather than training indicators as such.
There was, however, a well-regarded WA careers publication that used quantitativeand qualitative training indicators adapted from the occupational outlook work.Careers WA, which ran from 1980 to 1994 (DEET WA 1994), was produced by thedepartment’s labour market rather than careers group.
In a similar vein to Job guide, OZJAC (Curriculum Corporation 2000) is a recognisedweb directory for the types of professional and vocational courses available throughAustralian universities and VET providers. Variously, other web sites package upsimilar career and course directories for particular jurisdictions (for example, DTEWA 2000) or parts of the skills and training market (for example, the NacInfo(ANTA 2000b) national site for new apprenticeships).
More robust kinds of training indicators are found in the Graduate Careers (GCCA,1998, 1999a, and 1999b), Good Universities (Ashenden & Milligan 1999, 2000) andVET Student Outcomes (NCVER 1999d, 1999e) programs.
The GCCA series (for example, Grad stats (GCCA 1999a)) is of long standing and isbased on a large sample of each year’s Australian university graduates. It does notdirectly compare supply (graduate numbers) to demand (numbers in employmentor vacancies). The key measures are graduate employment rates and salary rates,from which inferences about the changing balance of supply and demand may bemade.
The privately managed Good universities guide reapplies the Grad stats measures,adding detailed information on individual institutions and their courses, studentprofiles and student satisfaction ratings. Once again, the focus is primarily onuniversities and professions. There is information on VET sector outcomes, but forState TAFE systems as a whole rather than for individual institutions. Much of theVET information is derived from the Student outcomes survey (see below) for VET.
In Grad stats (GCCA 1999a) the full-time employment rate for those universitygraduates seeking it varies from near 90% (late 1980s) to 70% (early 1990s) andreturns to 81% (1999). The full-time employment rates for 1998 graduates vary fromaround 90–95% (certain health, engineering and law professions) to as low as60–70% (natural, social sciences or humanities).
Over the period 1977–99, graduate starting salaries indicated a trend downwardsfrom 95–100% of average weekly earnings to about 80%. In 1999, the average starter
Recent practice and use of training indicators

Using training indicators to improve planning for vocational education and training
24
earns about $31 000. A few health, technical and science occupations earn salarieswhich are between $5 000 and $10 000 higher.
The time series is sufficiently well established to give clear evidence of the changinggraduate prospects over time and by occupation. These labour market variationswould correlate with varying degrees of control or growth in the rates of training,as defined in the ACT study above. For example, the above-average salariesenjoyed in certain health disciplines tend to reflect controls on vocational supply.Those in certain technical disciplines may be more a factor of growth in vocationaldemand.
Turning to VET courses, the Survey of employer views on VET (NCVER 1999f) andStudent outcomes survey (NCVER 1999e) can be seen to parallel some of theapproaches used to analyse graduate prospects in the Graduate Careers and GoodUniversities programs.
The first of these reports is a general survey of employer hiring of, and satisfactionwith, recent VET graduates. The second is a survey (50–55% response, over 250 000persons) of all graduates from certificate and 200-hour and above TAFE coursesfrom 1998. For the first time, the latter report also covers persons who havecompleted individual training modules as well as complete courses.
The key indicators in Student outcomes survey are graduate employment rates andjob and salary benefits. In the 1999 report, these indicators remain fairly stablecompared to the 1998 and 1997 reports. In May 1999, about 73% of the 1998 VETgraduates were employed, although the average is over 80% for some fields ofstudy and below 65% in others. After graduating, about 88% were working or instudy, compared to 78% before the course began.
About 63% of employed graduates received at least one employment benefit (morepay, promotion or new job) from their training. For graduates in their first full-timejob at May 1999, average earnings were about $460 a week ($24 000 per annum),with high variation by occupation and industry.
Having only commenced in 1995, the VET employer and student surveys cannot atthis stage be expected to provide employment trend-lines comparable to thoseavailable from Graduate Career publications. DEWRSB and State training agencieshave suggested that the surveys might become more useful over time for VET andoccupational planning with the injection of greater industry, occupational orregional analysis.
Recent (NCVER 2000f, Ryan 2000) studies compare TAFE and university graduateoutcomes at a point in time (1999 data). The two sectors’ employment outcomes arefound to be fairly similar, but the respective industry and occupation spectra arequite different.
For his analytical purposes, Ryan finds that the TAFE and university outcome data(destinations) provides a more robust indicator than the output data (enrolments).The Billett and Hayes paper, Meeting the demand (2000) is another recent example ofthe VET employment outcome data being used as a planning indicator. Such usesare not common. This points to the relative under-use of VET outcome data as atraining indicator.

25
With their most recent Good universities guide (Ashenden & Milligan 2000), theauthors observe that some States have given permission for the use of comparativestudent outcomes data as it relates to individual fields of study, but not toindividual TAFE institutions.
While the conservative information policies are understandable, they have theircosts. Despite a decade of reform in the VET system and VET funding, a recentNCVER report (James 2000) reiterates the overwhelmingly greater inclination ofsenior secondary students towards university rather than to TAFE. Within thecurrent levels of information and understanding, many school leavers are said to be‘poorly informed and unrealistic in their expectations. VET does not have a highprofile among school students’ (James 2000, p.viii).
Significant improvements have occurred in the range of options available to seniorsecondary students, mainly through VET in Schools programs and the broaderdevelopments in vocational learning (see Curriculum Corporation 2000). However,this has not been matched by strengthening the provision of careers education orguidance to assist students to make informed choices.
In his paper, James doubts that the national imperative of lifelong education andlearning is well served by the disparate systems and conceptions of highereducation and TAFE. As Ryan (2000) observes, the first-order comparison betweenTAFE and university graduate job outcomes is not particularly unfavourable toTAFE.
VET planning processes and indicatorsThe inauguration of the training market and of ANTA has lent new dimensions tothe VET (TAFE) planning processes. Since 1992, these have acquired greater co-ordination and consistency within the States and Territories and considerableamounts of labour market and industry input. Within that, States maintain theirdistinctive approaches to the detail and implementation of VET planning.
The Blandy and Freeland (2000) assessment is that ANTA is using the indicatorsapproach to assess the balance of skills in its annual national report evaluations (seeANTA 1998b, 1999a).
In a similar sense, ANTA could be said to use an indicators approach prospectivelyto allocate VET funds. As noted, most public VET funding is allocated through anational ANTA plan and corresponding State VET plans which divide resources(annual hours) among broad industry areas.
VET planning and indicators
At the national level, and in turn at State levels, marginal year-to-year shifts inindustry resourcing appear to broadly follow a key indicator, in the form of thenational or State industry employment growth forecasts.
The ANTA plan and its marginal shifts of industry VET resources have beendiscussed above. The ANTA (1999c) plan for 2000 moves resources in favour ofindustries with the greatest projected 1997–2006 employment growth—cultural andrecreational services, education, retail, business services, and health and communityservices.
Recent practice and use of training indicators

Using training indicators to improve planning for vocational education and training
26
These five industries align approximately with five of the 19 industry training areasthat are employed in the ANTA planning grid. Nominally, if not by intent, these 19groups are similar to Australian and New Zealand Standard IndustrialClassification (ANZSIC, ABS 1993) industry divisions, although there are threecross-industry groups and one general workforce group. Most States follow theindustry training areas when they offer broad summaries of shifts in trainingactivity in their VET plans.
Recent (up to year 2000) documents of State planning processes at work are those ofthe South Australian Department of Education, Training and Employment (DETESA 1998, 1999), the Queensland Department of Employment, Training andIndustrial Relations (DETIR 1999a, 1999b, 1999c, 2000), NSW Department ofEducation and Training (NSW BVET 2000), the WA Department of Training(Department of Training WA 1999), the Victorian Office of Training and FurtherEducation (OTFE 1999a, 1999b), and the Tasmanian Office of VET (OVET Tasmania1999). Table 3 summarises State VET plans, their industry and regional dimensions,and their uses of training indicators.
The SA plan, covering the period 1998–2000, employs a forecasting process similarto that of ANTA (1999c) to award the biggest (2–5%) 1998 funding increases to foodprocessing, tourism and hospitality, community services, computing, and transportand storage. This contrasts with the NSW plan for 1999–2000, where the industryfunding increases cluster around 1%.
The nature of industry, occupational and regional input to State VET plans is worthnoting. States have sophisticated industry planning processes, with the Stateindustry training advisory bodies (ITABs) or regional development boards (as inSouth Australia) having key roles. These processes fall short of those envisaged byBurns and Shanahan (2000), who call for timely information on changing labourmarket conditions which is ‘highly disaggregated’ (Burns & Shanahan 2000, p.v),identifying likely imbalances in occupational labour markets rather than simplyattempting employment forecasts.
In the South Australian plan, for example (DETE SA 1998), the industry profiles andtraining priorities are underpinned by industry training plans and notes thatconsider the ‘four-way’ interaction of structural, cyclical, quantitative andqualitative influences on labour demand. The SA plan makes allowance for (15)regional training priorities (priority industries and occupations, selected majorgrowth areas and skills needed), based on input from the regional training boardsand regional official visits. As would be expected, the regional industry trainingpriorities exhibit subtle regional variations on the expressed State industrypriorities.
The SA regional industry priorities are updated in DETE (1999), including industrytraining priorities under the open market (general tender) program. It is noted inthe update that course discipline codes are to supplant the ANTA grid of 19 in SAplanning.
The Queensland VET plans for 1999 and 2000 (DETIR 1999a, 1999c) direct marginalfunding growth to the growth in key industries. The 1999 plan puts a particularemphasis on State-wide and regional skill shortages, which align to some extentwith skill shortages reported by DEWRSB in the same period. The DEWRSB

27
analysis is not often applied to State VET planning, although it also appears in theSA planning update (DETE SA 1999).
Queensland also publishes industry training plans and rolling VET resource plans(for example, Resource priorities 2000–2002 (DETIR 1999b) and Resource priorities2000/2001–2002/2003 (DETIR 2000). The resource plans summarise, by industry, thekey employment and training issues, and set out ‘the resource priorities for thetraining market and the purchasing strategies that will be used’ (DETIR 1999b, p.5).These priorities deal with questions of occupational restructuring and reskilling ofinterest to this project. In effect, emerging skill needs are being assessed for whetherthey should be picked up through public funding mechanisms (TAFE, competitivefunding and user choice) or left to the private (fee-for-service) market.
The methodology in the rolling plans takes in training indicators, such as priorityindustries and output measures, industry employment and forecasts, skill demandsand shortages, the amount and adequacy of existing training, training products andmarkets, regional socioeconomic factors, and so on.
In the New South Wales VET plan, the Department of Education and Training (seeNSW BVET 2000) develops regional VET profiles for each of nine regions. Theseprofiles identify emerging regional VET issues, inform central policy and planningprocesses and the regional purchasing strategy. They cover regional industry andemployment and projections, demographics, current VET activity, training needsand skill gaps, and regional training issues. New South Wales also publishes (20)industry VET profiles, each identifying skill shortages by region, and givingindustry overviews with information on the target groups for training and thefactors required for an effective training market.
In addition to the NSW State plan and its underpinning regional and industryprofiles, NSW TAFE notes that each TAFE institute has its own operational andeducational plan, based rather more on course fields of study than on industries oroccupations. Each institute has access to local industry data and online access to thestudent information system for up-to-date information on institute, college,program, and course, enrolment numbers. This is enrolment information that, indue course, would be reflected in national data collections compiled and publishedby NCVER.
The Western Australian State training profile 1999–2001 (Department of Training WA1999) delivers a broad treatment of VET system priorities by industry, and priorityareas for occupational or industry-specific training. This is followed up bydiscussion of the regional priorities, in terms of demographic, economic, labourmarket, industry, and VET, change drivers. The industry and regional priorities areexpanded into separate industry and regional profile documents. These profiles goto some lengths to justify the training responses in terms of theemployment–industry forecasts and the change drivers.
The Victorian VET plan (OTFE 1999b) is supplemented by a Planning guide forproviders (OTFE 1999a), which offers industry trend analyses of productivity andemployment, VET delivery, apprenticeship commencements, and student contacthours. A measure of student contact hours per industry employee is derived. This isfound to vary greatly by industry.
Recent practice and use of training indicators

Tabl
e 3:
Ex
ampl
es o
f St
ate
VET
pla
ns, S
tate
VET
indu
stry
and
reg
iona
l pla
ns, a
nd t
heir
use
of
trai
ning
indi
cato
rs, 1
998–
2000
Stat
e an
d V
ET p
lans
C
onte
nts
and
trai
ning
indi
cato
rs
Com
men
ts
VET
NSW
200
0 Pl
an
• S
um
mari
ses
stra
tegic
dir
ections,
initia
tives,
shifts
in t
rain
ing a
ctivity
in t
he (
19)
AN
TA
indust
ry t
rain
ing a
reas.
•N
SW
indust
ry V
ET p
rofile
s•
Conta
in s
kill
short
ages
by n
um
bers
and r
egio
ns,
indust
ry o
verv
iew
s,
•Pri
ori
ties
and r
ecom
mendation
s fo
r in
dust
ry V
ET
2001–03
targ
et
gro
ups
for
train
ing,
facto
rs f
or
effective V
ET m
ark
et, e
tc.
•N
SW
regio
nal
VET p
rofile
s
• C
onta
in r
egio
n i
ndust
ry–em
plo
ym
ent
pro
file
s, d
em
ogra
phic
s, c
urr
ent
•Lin
ked t
o r
egio
nal
VET p
urc
hasi
ng s
trate
gie
s
1999–2000
VET a
ctivity l
evels
, tr
ain
ing n
eeds
and s
kill
gaps,
tra
inin
g i
ssues,
etc
.
Vic
tori
an T
AFE
Pla
n 20
00•
Sum
mari
ses
actions
again
st n
ational
pri
ori
ties,
shifts
in t
rain
ing a
ctivity
X 1
9 i
ndust
ry t
rain
ing a
reas.
•V
icto
rian P
lannin
g G
uid
e f
or
• O
ffers
policy a
nd p
lannin
g c
onte
xt
and i
ndust
ry t
rend a
naly
ses
•A
measu
re o
f conta
ct
hours
per
indust
ry e
mplo
yee
Pro
vid
ers
of
TA
FE 2
000–02
(pro
ductivity,
em
plo
ym
ent, V
ET f
undin
g,
appre
nticesh
ip
is d
eri
ved
com
mencem
ents
, conta
ct
hours
, etc
.).
•A
lso o
ffers
indust
ry t
rain
ing n
eeds
advic
e,
pri
mari
ly b
ase
d o
n
•In
dust
ry a
dvic
e s
uggest
s changes
in d
irection o
f tr
ain
ing
ITA
B a
dvic
e.
effort
s, i
f any,
by s
kill
level
and b
y r
egio
n
Que
ensl
and
2000
VET
Pla
n•
Sum
mari
ses
actions
again
st n
ational
pri
ori
ties,
shifts
in t
rain
ing a
ctivity X
19
indust
ry t
rain
ing a
reas.
•Q
ueensl
and 2
000 I
ndust
ry
•C
over
indust
ry d
efinitio
ns,
entr
y-l
evel
and o
ther
train
ing p
riori
ties,
tra
inin
g
Tra
inin
g P
lans
dri
vers
and i
ssues,
pri
ori
ty r
ecom
mendations.
•Q
ueensl
and R
eso
urc
e P
riori
ties
•C
onta
ins,
by i
ndust
ry,
a s
um
mary
of: r
egio
nal
em
plo
ym
ent, r
egio
nal
key
2000/2
001–2002/2
003
(tra
inin
g)
poin
ts,
targ
ets
for
TA
FE g
rants
+ c
om
petitive p
urc
hase
+ u
ser
choic
e
+ f
ee f
or
serv
ice,
train
ing p
roducts
, and t
rain
ing m
ark
ets
.
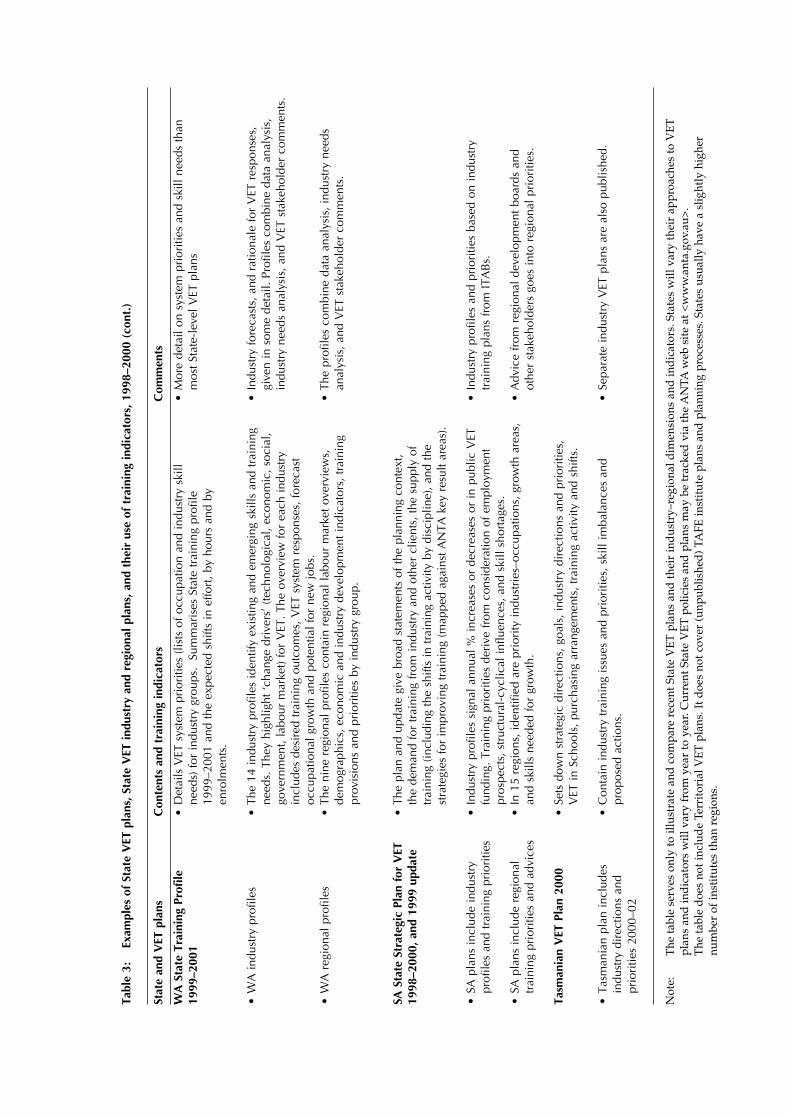
Tabl
e 3:
Ex
ampl
es o
f St
ate
VET
pla
ns, S
tate
VET
indu
stry
and
reg
iona
l pla
ns, a
nd t
heir
use
of
trai
ning
indi
cato
rs, 1
998–
2000
(co
nt.)
Stat
e an
d V
ET p
lans
C
onte
nts
and
trai
ning
indi
cato
rs
Com
men
ts
WA
Sta
te T
rain
ing
Prof
ile•
Deta
ils
VET s
yst
em
pri
ori
ties
(lis
ts o
f occupation a
nd i
ndust
ry s
kill
•M
ore
deta
il o
n s
yst
em
pri
ori
ties
and s
kill
needs
than
1999
–200
1needs)
for
indust
ry g
roups.
Sum
mari
ses
Sta
te t
rain
ing p
rofile
most
Sta
te-l
evel
VET p
lans
1999–2001 a
nd t
he e
xpecte
d s
hifts
in e
ffort
, by h
ours
and b
y
enro
lments
.
•W
A i
ndust
ry p
rofile
s •
The 1
4 i
ndust
ry p
rofile
s id
entify
exis
ting a
nd e
merg
ing s
kills
and t
rain
ing
•In
dust
ry f
ore
cast
s, a
nd r
ationale
for
VET r
esp
onse
s,
needs.
They h
ighlight
‘change d
rivers
’ (technolo
gic
al, e
conom
ic,
socia
l,
giv
en i
n s
om
e d
eta
il.
Pro
file
s com
bin
e d
ata
analy
sis,
govern
ment, l
abour
mark
et) f
or
VET.
The o
verv
iew
for
each i
ndust
ryin
dust
ry n
eeds
analy
sis,
and V
ET s
takehold
er
com
ments
.
inclu
des
desi
red t
rain
ing o
utc
om
es,
VET s
yst
em
resp
onse
s, f
ore
cast
occupational
gro
wth
and p
ote
ntial
for
new
jobs.
•W
A r
egio
nal
pro
file
s •
The n
ine r
egio
nal
pro
file
s conta
in r
egio
nal
labour
mark
et
overv
iew
s,
•The p
rofile
s com
bin
e d
ata
analy
sis,
indust
ry n
eeds
dem
ogra
phic
s, e
conom
ic a
nd i
ndust
ry d
evelo
pm
ent
indic
ato
rs,
train
ing
analy
sis,
and V
ET s
takehold
er
com
ments
.
pro
vis
ions
and p
riori
ties
by i
ndust
ry g
roup.
SA S
tate
Str
ateg
ic P
lan
for
VET
•The p
lan a
nd u
pdate
giv
e b
road s
tate
ments
of
the p
lannin
g c
onte
xt,
1998
–200
0, a
nd 1
999
upda
teth
e d
em
and f
or
train
ing f
rom
indust
ry a
nd o
ther
clients
, th
e s
upply
of
train
ing (
inclu
din
g t
he s
hifts
in t
rain
ing a
ctivity b
y d
iscip
line), a
nd t
he
stra
tegie
s fo
r im
pro
vin
g t
rain
ing (
mapped a
gain
st A
NTA
key r
esu
lt a
reas)
.
•SA
pla
ns
inclu
de i
ndust
ry
•In
dust
ry p
rofile
s si
gnal
annual
% i
ncre
ase
s or
decre
ase
s or
in p
ublic V
ET
•
Indust
ry p
rofile
s and p
riori
ties
base
d o
n i
ndust
ry
pro
file
s and t
rain
ing p
riori
ties
fundin
g.
Tra
inin
g p
riori
ties
deri
ve f
rom
consi
dera
tion o
f em
plo
ym
ent
tr
ain
ing p
lans
from
ITA
Bs.
pro
spects
, st
ructu
ral-
cyclical
influences,
and s
kill
short
ages.
•SA
pla
ns
inclu
de r
egio
nal
•In
15 r
egio
ns,
identified a
re p
riori
ty i
ndust
ries–
occupations,
gro
wth
are
as,
•A
dvic
e f
rom
regio
nal
develo
pm
ent
board
s and
train
ing p
riori
ties
and a
dvic
es
and s
kills
needed f
or
gro
wth
.oth
er
stakehold
ers
goes
into
regio
nal
pri
ori
ties.
Tasm
ania
n V
ET P
lan
2000
•Sets
dow
n s
trate
gic
dir
ections,
goals
, in
dust
ry d
irections
and p
riori
ties,
VET i
n S
chools
, purc
hasi
ng a
rrangem
ents
, tr
ain
ing a
ctivity a
nd s
hifts
.
•Tasm
ania
n p
lan i
nclu
des
•C
onta
in i
ndust
ry t
rain
ing i
ssues
and p
riori
ties,
skill
imbala
nces
and
•
Separa
te i
ndust
ry V
ET p
lans
are
als
o p
ublish
ed.
indust
ry d
irections
and
pro
pose
d a
ctions.
pri
ori
ties
2000–02
Not
e:T
he ta
ble
serv
es o
nly
to il
lust
rate
and
com
pare
rec
ent S
tate
VE
T p
lans
and
thei
r in
dus
try–
regi
onal
dim
ensi
ons
and
ind
icat
ors.
Sta
tes
will
var
y th
eir
appr
oach
es to
VE
T
plan
s an
d in
dic
ator
s w
ill v
ary
from
yea
r to
yea
r. C
urre
nt S
tate
VE
T p
olic
ies
and
pla
ns m
ay b
e tr
acke
d v
ia th
e A
NTA
web
sit
e at
<w
ww
.ant
a.go
v.au
>.
T
he ta
ble
doe
s no
t inc
lud
e Te
rrit
oria
l VE
T p
lans
. It d
oes
not c
over
(un
publ
ishe
d)
TAFE
inst
itut
e pl
ans
and
pla
nnin
g pr
oces
ses.
Sta
tes
usua
lly h
ave
a sl
ight
ly h
ighe
r nu
mbe
r of
inst
itut
es th
an r
egio
ns.

Using training indicators to improve planning for vocational education and training
30
As a variation on other States’ emphases on regional training profiles, the Victorianplanning guide employs industry training profiles, which then have a regionalcomponent. These profiles include a set of industry training needs advices, drivenby ITAB input, which are directed at TAFE institutes and other training providers.These advices suggest changes in direction (increase, maintain, decrease, or newcourse) by industry, skill level and region.
Victorian planning officials note that the advices are directional, rather thannumerically precise, because of the planning practicalities of incremental (ratherthan wholesale) changes in courses from year to year. They note that subsequentVET plans, while maintaining a similar methodology, will sort the regional profilesinto separate documents. Victorian VET planning may also have to respond torecent recommendations (Kirby 2000) for regional planning networks in postcompulsory education, including VET.
The Tasmanian VET Plan (OVET Tasmania 1999) also takes an industry-firstapproach, including a set of industry directions and priorities 2000–02. In their turn,these industry priorities take up the regional dimensions of skill needs.
The impression is that industry is the dominating concept and main organising unitin national and State VET planning. In practice, this is deceptive, especially since, asone draws closer to the regional or institute level, States tend to plan more aroundcourses. These may be aggregated in terms of fields of study (a concept of thecourse’s major vocational outcome and content) or discipline groups (a concept ofthe course’s primary educational content, not vocational or industry context). Inpractice, the 19-tier plans provided to ANTA are parallel to rather than central tothe actual planning process.
At regional and institute level, and in the short run, planning is more a business ofincremental adjustment than of wholesale change. It could be said that courses andtheir levels of provision are the given which is adjusted from year to year accordingto the observable changes in (regional) supply and (industry) demand.
In the current climate of market testing for many public services and programs,including VET itself, a noteworthy aspect of State VET planning is the substantialamount of organisational memory and expertise maintained over the recent years(DEWRSB is similar). States do, however, vary in the size of their planning teamsand the extent to which VET planning and purchasing autonomy (and skills) aredevolved to regions and institutes.
Having their own organisational expertise, and their own sources of supply anddemand data, States may need to be convinced of the merits when new approachesto VET planning and training indicators are proposed.
VET evaluation and indicators
The training indicators used for evaluation of VET plans and VET stocks tend to bedissimilar to the indicators used to establish the plans in the first place.
As one example, the 1998 report (ANTA 1999a) does not attempt direct assessmentsof the accuracy of industry forecasts used to allocate VET funds, or the resultantadequacy of VET supplies in keeping VET stocks up to desired levels (KPM 2).

31
Putting it into the context of this project, the report is limited in its assessment ofVET responses to changing industry, skill and demographic trends.
At present, the ANTA reports rely on a generalised analysis of the VET supply side(the qualification profile of Australian industry and against international profiles)and the demand side (the overall labour market and output and employmenttrends by industry and occupation). The pertinent findings are that VEToccupational funding shares continue to be in line with occupational employmentshares and that unmet VET demand is relatively stable.
The evaluation of VET stocks could be said to service a particular VET clientele—ANTA and its Commonwealth stakeholder, DETYA. By virtue of their policy roles,these agencies will have a keen interest in the outcomes against the KPMs. Byvirtue of their national positions, they do not have a singular focus on any onejurisdiction and lack direct access to the kinds of dedicated sources of trainingindicator data that States and Territories have.
States and Territories do not mirror the ANTA planning grid or KPM 2 in reportingagainst their own VET plans. They are more inclined to plan and report against theannual national priorities set each year under the ANTA National strategy 1998–2003.States tend not to publish evaluations of the effectiveness of their various kinds ofindustry and regional training sub-plans, although there is no doubt that informalevaluation of one year’s plans is part of the industry and regional consultation andformulation of the next year’s plan.
Recent NCVER (2000a, 2000b, 2000c) analyses of auto, electrical and mechanicaltrades show how there can be a continuum between evaluative and forwardplanning approaches in VET.
These papers, in common with Australian apprentice and trainee statistics 1998(NCVER 1999b) and other trade analyses summarised earlier in this chapter, use themeasure of apprentices relative to employed tradespersons. This is said to becurrently about 10%, or closer to 15% in auto trades. However, recent apprenticegrowth is taken to suggest that the percentage may rise in the near future. In otherwords, training information about the present and recent past can be helpful inmaking informed estimates of the situation in the near future.
Practice—themes This survey of work suggests that, whatever the influence of the large-scale nationalforecasting and benchmarking exercises that have taken place in VET recently,training indicators of one kind or another have always managed to hold a respectedand useful place in VET policy and analysis. There is a sense of organisationalcontinuity and expertise in State VET planning work, as there is in DEWRSB workusing training indicators.
In the work examined, it is as if there are two or three broad schools of trainingindicator thought, although these often merge in practice. The most straightforwardapproach, exemplified by DETYA, and other, career and course programs, might becalled a careers-course directory. Facts and descriptions of training courses, jobs oroccupations are put together, sometimes with the addition of qualitativeimpressions of job prospects.
Recent practice and use of training indicators

Using training indicators to improve planning for vocational education and training
32
The most widespread approach is what might be termed a demand–supply synthesisof training. This is represented by the DOLAC work and also by the recent ANTAand State VET planning paradigms. The youth transition work, although it issomething of a special case, is related. Its concern is to examine whether theworthwhile job and skill outcomes for young people clear the market in terms ofthe ongoing supplies of young people.
In the demand–supply synthesis, a range of quantitative and qualitative demand-side indicators for certain groups, industries or occupations including:
❖ overall economic trends, employment numbers, employment trends, structural and cyclical trends, emerging skills and skill gaps, changing government and regulatory requirements, wages and conditions, levels of replacement demand, and so on
is compared to a similar range of supply-side indicators for the same groups,industries or occupations (or fields of study related to the industries or occupations)including:
❖ labour force and demographic trends, training investment levels, training activity and trends, training pathways and flexibility, unemployment rates, upskilling, and migration
From the synthesis of the demand and supply sides, a judgment arises about thelikely training needs and balance of supply and demand in the future. In the youthtransition case, there is also a special concern about the needs and futures of thoseyoung people who appear to fail, or who are excess to the supply–demandequation.
Another influential approach, found in the DOLAC work, particularly in the DEIRand GCCA examples, and also in recent NCVER papers, is what might be termedderived measures as training indicators. Distinctive measures (such as rates of training,employment rates or salary rates) of the balance of supply and demand are appliedcomparatively to groups of occupations (their new graduates) and groups ofindustries over time.
There are various motivations for the work examined. Particular influences aretraining policy, career and vocational guidance, job placement needs, immigrationpolicy and skilled migration, and general advice to employers and industry.
With the wisdom of hindsight evaluation, numerically based approaches (forexample, of DOLAC, by DEIR for careers and immigration purposes, by Office ofACT Administration, by GCCA) can be said to have been workable and useful. Attimes, these approaches appear to have ebbed and flowed through no particularfaults in their own quality, but rather more because of changes in overallgovernment policy preferences or because of internal organisational preferences.
Nonetheless, the persistence of the DEIR (DEWSRB) occupational and GCCAcareers programs is suggestive of strong underlying community needs for trainingindicators in job and career information. Also of interest, and a factor in theresurgence of the DEWRSB program, is the enabling influence of informationtechnology for training indicators.
The recent developments in indicators for VET planning and VET evaluation,particularly KPM 2, are significant.

33
States usually have a broad annual VET plan applying funds to the ANTA (19)industry training areas, or to a broad discipline grid. This plan is usually based onemployment (and perhaps) output forecasts; it may include syntheses of supplyand demand; and it may identify priority industries, occupations and skills.
The State VET planning processes (see table 3) commonly have a second level ofpublic or semi-public industry or regional training plans, guided by a range ofdemand–supply indicators and with substantial ITAB input. States use thesesubplans to express regional and industry–occupation skill priorities, to suggestregional demand shifts and shifts in training provision, and to express Statepurchasing priorities by industry or occupation. Institutes will also have plans,which express, in terms of courses, disciplines or fields of study the programsrequired to give effect to industry and regional planning priorities.
Industry or regional subplans may use a range of quantitative and qualitativeregional training demand and supply indicators. The demand side may berepresented by industry training needs, priority industries and output measures,regional socioeconomics, regional employment, industry employment, industryforecasts, industry training levels compared to employment levels, and so on. Thesupply side may be represented by demographics, qualification profiles,qualification or skill gaps, volumes of training funds, proposed training purchases,volumes of training, and so on.
At the national level, evaluation against KPM 2 proceeds by a general comparisonof the VET supply side (qualification profiles) and demand side (labour market andoutput-employment trends). States tend to plan against a more specific set ofindicators and to report against the annual national priorities set each year underthe national strategy.
Recent practice and use of training indicators

Issues and directionsThis chapter discusses the policy and practical issues that may impact on thefurther development of a range of indicators to assist policy-makers and trainingproviders to identify new areas of training demand and reskilling.
Where appropriate, reference is made to the commentary of relevantCommonwealth and State employment or training departments and other agencies.These are cited in the acknowledgments.
The national planning background for indicators National VET planning is essential background to the further consideration anddevelopment of training indicators. Important statements of the national VETplanning framework are ANTA’s national strategy (ANTA 1998a) and keyperformance measures (ANTA 1999d) for 1998–2003.
The strategy has been summarised above. Its five objectives relate to equippingAustralians for work, enhancing labour market mobility, achieving equitableoutcomes, increasing investment in VET, and maximising the value of public VETfunding.
Training indicators have the potential to serve all of these objectives, particularlymaximising the value of public VET (efficiency and effectiveness), achievingequitable outcomes, and equipping Australians for work (choice and flexibility inlearning pathways).
Linked to the first objective, the strategy calls for training providers to respond tochanging client needs with quality, tailored products and for school students tohave accurate and balanced career and course information. The analysis in thesecond chapter points to the gaps between university-type career and courseinformation and VET or schools information, although the VET sector has institutedconsumer surveys since 1995.
Linked to the fourth objective, the strategy takes it that the skills and knowledge ofthe Australian workforce lag behind other countries on most key measures.Indicators of youth transition are prominent in the debate on these key measures.
As noted, there are eight KPMs for the VET system. This project is directed to arange of training indicators for VET, and to the implementation of KPM 2, stocks ofVET skills against desired levels.
In the second chapter it is shown that, from DOLAC in the 1980s through to ANTAtoday, the issue that is now represented by KPM 2 has been an important anduseful instigator for national work on training indicators.
Using training indicators to improve planning for vocational education and training
34

35
Also of significance is the issue now represented by KPM 4, student employmentoutcomes and prospects. Information on VET graduate employment outcomes(KPM 4) is also relevant to the measurement of how well the system is performingagainst KPM 2.
The project calls for identification of the range of training indicators that will helpto interpret changes in training demand arising from industry, skill anddemographic changes. In the following chapter, it is argued that the useful range ofindicators will relate to a number of the KPMs, including KPM 2 and KPM 4.
The place of indicators in the VET planning processIn the second chapter, training indicators are seen to have an important place inyouth VET planning and national and State VET planning. One group of industrytraining indicators (industry employment forecasts and also detailed regional-industry indicators work) has a key role in determining national and State VETplans and funding allocations. A related set of supply–demand indicators is used toassess performance under KPM 2.
As NSW TAFE (Planning) and DETE SA (VET Strategy) note, the planning gridused for the broad allocation of annual VET resources operates on a rather differentlevel from the planning processes used for more detailed allocation of resourcesdown at regional and TAFE institute level.
The survey of State VET plans confirms that a substantial amount of regionaltraining analysis (in terms of priority industries and occupations, growth areas andskills needed) finds its way into the State planning processes.
As one commentator (Miles Morgan) put it, an effective indicators approach wouldneed to be part of the loop. This means that the advice in indicators should lead todecisions and allocations, hence to performance and implementation, then on tofeedback and the next round of advice.
An issue here is that there appears to be limited formal or public assessment of theaccuracy and usefulness of (the up-front indicators used in) the national and Stateplanning processes. That is not to say that there is not substantial consultation onone year’s plans in the formulation of their successors.
The market for training indicatorsThe issue here is that training indicators ought to develop in accord with known orreasonably inferable demand.
Training indicators appear to be in the nature of a complex public good rather thana simple commodity with many buyers and sellers of standardised products. In thatsense, they are not dissimilar to VET itself.
That point taken, there is evidence of persistent demand for training indicators forVET and youth policy, job placement needs and vocational guidance. These needscontinue to be met mainly through public agencies and programs, but the extent ofthe demand lends support to the idea that there is a market for training indicators.
Issues and directions

Using training indicators to improve planning for vocational education and training
36
Since 1995, important public sector developments in training indicators are theresurgence of Job outlook for job placement and career needs, the inception ofemployer and student surveys in VET, and the more intensive use of trainingindicators for VET planning. A commercial development is the Good universitiesguide, whose brief is universities and university courses but which also contains ageneral treatment of State VET systems and comparative information on their fieldsof study (but not, thus far, their institutes).
While the focus here is on training indicators for VET policy and providers,enterprises and individuals may also represent significant markets for trainingindicators.
NCVER, by virtue of its charter (see NCVER 1999a), is already a national compilerand producer of training indicators for VET policy, especially VET statistics,apprenticeship and traineeship statistics, and student outcomes. States have otherneeds for up-to-date regional, industry, and institute, data in their VET planning.Some of this data may be sourced from NCVER and some from State industry oroccupational forecasts, State enrolment systems, other local research, ITAB andstakeholder consultations.
The uneven history of receptiveness to training indicators suggests that it would beprudent to market-test further public sector developments for desirability andapplicability to the presumed consumers, especially where these are trainingproviders.
Needs and gaps for training indicatorsFurther development of training indicators which align to some degree with themost pressing needs and gaps is an important issue here.
Arguably, there is a corrective need for common (cross-sectoral) nationalevaluations for, and indicators of, the youth transition issues. Existing ANTAreporting emphasises the Finn targets for 19 and 22-year-olds, rather than givingdeeper analyses of remedies for young people’s situations should these targets (asappears likely) fail to be met for a significant minority of 19-year-olds. If anything,with the increasing average age of the Australian workforce, the needs of olderworkers are more prominent in reporting against KPMs and key result areas. It isknown (Robinson 1999) that older workers have gained significantly more thanyounger workers in the post-1995 growth spurt of apprenticeships and traineeships.
Similarly, there appears to be a need for better evaluations against KPM 2—stocksof VET skills against desired levels—and this might bring into play broader sets ofsupply and demand indicators (training indicators).
The view taken here is that prospective training indicators for State and regionalVET planning, the levels at which the important practical decisions about VETresources and courses are made, are also areas of need for exploration andimprovement.
Indeed, the analysis here suggests that training indicators have developed thus farwith more of a view towards the requirements of government, enterprises andindividuals. With the deregulation of the training market, and diversification of

37
training programs and pathways, it is reasonable that the information needs ofregions and training providers should come closer to the fore.
Comments from State training agencies and planners at the TAFE institute levelsuggest that these needs are assuming greater prominence. If institutes, however,are genuinely to have greater autonomy to plan, then a greater need for devolvedplanning skills and planning information is implied. The extent of such devolutionvaries considerably around the States.
A related point is that States appear to give greater prominence to regional trainingplans (profiles) than to institute plans, which do not appear to be as readilyavailable in the public domain.
To some extent, this is a commercial matter, given that TAFE institutes are now incompetition with other VET providers for parts of their total funding bases.Institute plans could become a source of attention and contention among providersand stakeholders in relation to their shares of the VET funding pie.
On the other hand, institutes and institute planning may benefit from giving greaterpublic expression to what their colleges propose (subject to variations) to give tolocal communities from year to year, and the indicators on which their proposalsand allocations are based.
While there is a substantial public emphasis on national and State VET planningand plans, this appears to diminish the closer the observer moves to the regional,institute and community levels. But these are probably the levels at whichinformation might well attract the greatest interest and feedback from significantVET clients (including enterprises and individuals).
Related to this, there are gaps in readily available indicators about VET providers(comparative information on service quality and outcomes) and in persuasiveinformation on VET-related careers for school students.
The conservatism of the VET system in this regard can be seen as principled,especially in an environment where there is increasing pressure for simplisticuniversity (and school) performance ladders. However, as James (2000) suggests, inthe absence of any better information, secondary students may continue to formtheir own (negative) impressions of VET possibilities in relation to universityeducation options.
Existing sources of performance data such as the student outcomes survey, if takendown near to the institute level, may be pushing the boundaries of statisticalreliability and usefulness. However, these sources could be improved over time,and augmented by other sources of qualitative and quantitative information oninstitutes.
Useful classifications for VET planning and trainingindicatorsThe issue here is one of useful, practical frameworks for training indicator work,which would meet the diverse needs of policy-makers and training providers.
Leaving aside youth transition indicators, much of the existing work on trainingindicators is pitched at national and State levels, and is in effect carried out by
Issues and directions

Using training indicators to improve planning for vocational education and training
38
teams in organisations such as NCVER, State training authorities, DEWRSB, GCCAand so on. Some training authorities maintain somewhat larger VET planningteams than others.
To go beyond the existing work, whether by industry and occupation or by regionand provider, would require careful planning in terms of who might conduct thework and at what level of detail it could be resourced.
The ANTA planning grid uses 19 industry training areas, which roughly resemble(but are not in fact) ANZSIC industry divisions. A similar quasi-industry grid isused in the ANTA KPM 2 evaluations of the last 2–3 years.
Ultimately, the statistics that fill out national and State industry training area gridsare compiled by assigning VET courses to Australian Standard Classification ofOccupations (ASCO) (ABS 1997) categories. This process is fraught withinconsistencies, partly because the majority of courses are not tied to a contract ofemployment.
To use an industry grid for the further development of training indicators, it isprobably necessary to go to the ANZSIC industry division level. Another commonapproach is to use industry divisions, although the grid is usually expanded out toindustry subdivisions when the industry division under consideration ismanufacturing. This means between 20 to 30 categories altogether.
In total, there are nearly 100 industry subdivisions in ANZSIC. It would be adaunting task to develop and maintain training indicators for all of these. It is notsomething that has ever really been attempted in any of the examples given in thesecond chapter.
To develop training indicators according to occupations, as DEWRSB does, thetested approach is to use the ASCO unit group level, which roughly corresponds toindividual internal labour markets for individual (skilled) occupations. It isprobably necessary to have at least 100 and perhaps 200 occupations for a labourmarket-wide analysis. DEWRSB is now going close to 400 occupations in itsanalysis, but this includes many so-called semi-skilled occupations. Given theworkloads involved, and recalling DEWRSB’s demand-side portfolioresponsibilities, it is hardly surprising that the DEWRSB analysis is limited in itstreatment of the supply side of this large number of occupations.
A simplified occupational approach, targeting the trades sector, is to focus on tradesand related occupations. That would only involve about 15 ASCO minor groupsand 65 unit groups (occupations) but would not do justice to the breadth of VETprovision for a range of middle-level occupations in short courses. Also, historically,the trade occupations and their supply-demand conditions vary significantly withinthe minor groups.
Neither is the analytical framework particularly simplified by focussing primarilyon regions or providers. States and Territories, for example, use 50 or more regionsfor indicative VET planning purposes. To divide up the regional market anotherway, Australia has about 85 large TAFE institutes that pick up the bulk of the publicVET market, and many hundreds more private providers deliver public VETprograms. (South Australia is unusual in that, nominally, it has fewer institutes thanplanning regions.)
39
Evidently, any fresh efforts to develop useful training indicators at State andregional level have the potential to be highly resource-intensive.
A common-sense approach is to relate training indicators to the present frameworksand methodologies of ANTA and State VET planning. An understanding of the wayallocations are made through these frameworks is crucial for training providers inan increasingly competitive market.
As discussed, VET planning and the corresponding evaluations appear to bebroadly industry-based at the national and State levels but are actually more field ofstudy or discipline-based as one moves toward the institute level. Most Statesmaintain their institute-level plans with the aid of national (or State-adapted) studyor discipline classifications.
Billett and Hayes (2000) query the persistent emphasis on industries and enterprisesin VET planning. They mount a strong argument, particularly in the context ofregional VET planning, that occupations or vocations represent a very usefulorganising concept for VET demand. They do not, however, demonstrate that theindustry concept should be discarded in favour of occupations, or that such a shiftwould lead to a more egalitarian or whole-of-career model of VET planning.
In 2000, an ANTA project has been examining the possibilities of re-organising theVET planning supply grid along the lines of discipline groups (the SA approach) orother kinds of industry groups (in effect, these might well be industry trainingpackage groups).
Evidently, discipline groups and fields of study are central to VET planning andreporting. Whether formally or informally, they are important concepts in State,regional and institute-level VET planning. They are basic classifications andorganising concepts for key VET publications, including the annual national report,produced by NCVER.
While the central classifications used in the VET planning grids may change, therewill always be a need to relate the provisions back to employment and industry.Employers, industries and governments are keenly interested in the amount oftraining provided to their favoured strategic industries, and in the variations fromyear to year.
If they are to be relevant, training indicators cannot avoid the untidy problem ofmeasuring educational provisions against changing industries and industry skillneeds.
The planning and measurement problems might be simplified if the VET systemorganised courses and the supply side of VET plans consistently around disciplines(a non-vocational concept), fields of study (a quasi-vocational concept), or trainingpackages (a quasi industry-vocational concept). However, the likelihood is thatmore than one of these concepts will continue to be used and useful at national andState levels.
Disciplines are integral to the national training information standard of theAustralian Vocational Education and Training Management Information StatisticalStandard (AVETMISS) (ANTA 1998c, 1998d). At present, published NCVERstatistics may relate to any or all of disciplines, fields of study, or units ofcompetency from training packages. The proposed Australian Standard
Issues and directions

Using training indicators to improve planning for vocational education and training
40
Classification of Education (ASCED) comprises all of these concepts as well as levelof education (study).
In the Billett and Hayes paper, industry is portrayed as a centralising, enterprise-dominated building block for the demand side of VET planning and indicators. Itcan also be perceived as a flexible organising concept for a VET system that, bydefinition and by policy intent, is increasingly directed to employment-oriented,modular, skill outcomes and lifelong learning as well as formal qualifications andvocational outcomes.
The usefulness of forecasts and other training indicators Recent studies, while diverging on the usefulness of industry-occupationalforecasts, nominate lists of training indicators that overlap to a greater or lesserdegree.
Blandy and Freeland (2000) list over 20 indicators that might be used at the broadoccupational–industry level. These include variables such as employment, forecastemployment, unemployment levels, vacancy levels, labour sources, recruitment andretention, qualification profiles, wages, rates of investment and rates of marketchange, and so on. The authors suggest that occupation–industry databases bemaintained centrally by ANTA or NCVER, and also locally (for local inputs) byagencies such as ITABs and TAFEs.
Burns and Shanahan (2000) urge that micro-level information and occupationalforecasts be used as principal training indicators. They endorse the value of timelyinformation on changing labour market conditions, especially where this is ‘highlydisaggregated’ (Burns & Shanahan 2000, p.v) and identifying likely imbalances inoccupational labour markets rather than simply attempting employment forecasts.However, it is acknowledged that extant Australian econometric models do notmodel either supply for VET or likely imbalances.
Other indicators valued by Burns and Shanahan include: workforce outflows,population by age and sex, net migration, changes in participation, projections ofskills in labour supply, effects of occupational substitution, changes in wagerelativities, and time lags to overcome supply–demand imbalances. The authors puta heavy weight not only on projected labour market imbalances, but also on theextent to which they require public sector interventions. This is a critical point—theuse of comparative training indicators does not imply that the distribution of VETdollars must be equalised or normalised in some way across all industries oroccupations.
Billett and Hayes (2000) offer a contrasting planning model. They recommendoccupations as an important organising concept for national and regional VETplanning. Their approach to planning at the regional level is consensual andindicative rather than industry and forecast-intensive. Hence, the authors tend tohave a shorter list of key regional factors, as it were, to be used in planning. Theseinclude type of industries, employment opportunities (for VET participants),educational provisions, and demographic factors.

41
While practices vary from State to State, the approach to VET planning and theindicators used are closer in spirit to the Blandy or Billett models and somewhatremoved from the Burns and Shanahan model, which contends that State VETsystems should have more in-house expertise in economic analysis and forecasting.State VET planners and DEWRSB do not readily accept that the forecast-intensivemodel is a realistic alternative to present methods, which synthesise (industry)forecasts with a range of other quantitative and qualitative indicators.
Some objections are discussed in Blandy and Freeland (2000). The Victorian VETplanners note that the forecasts themselves, in common with many other trainingindicators, cannot escape an element of subjectivity in the compilation of theirnecessary inputs. There is no strong conviction among practitioners that theforecasts are accurate or useful beyond the level of broad industry or occupationaggregates, which is the finding in a recent United Kingdom review (Haskel & Holt1999) of three national occupational–industry forecasting exercises since 1976.Practitioners tend to value the forecasts as stimulants and guides to thoughtfulanalysis and planning, rather than as a writ for the plans themselves.
Another pertinent objection is that, even if the forecasts could be fine-tuned todetailed industry, occupation and regional levels, this would not necessarily lead tothe most effective responses in VET provisions.
The presumed exactness of the modelled employment forecasts would seem at oddswith the incremental and approximate nature of real-world planning adjustments tocourses in VET regions and TAFE institutes. ‘The most unsatisfactory aspect’, asDumbrell (1995, p. 259) notes, ‘of our present use of model-generated forecasts isthe reliance on employment trends as a proxy for likely training demand’.
To some extent, it can be argued that the VET system and its institutes are there torespond faithfully to stated or forecasted needs and demands of industry. However,as South Australia (VET Strategy) points out, persistently reported skill gaps andskill shortages in trades sometimes relate to industrial relations issues (wages andconditions). Such shortages may not be resolved readily through increasinginvestment of scarce public VET funds.
While accepting the responsive role, institutes can also be said to have leading andanticipatory roles in working with industry, enterprises, and individuals to developcreative skill mixes and skill solutions for continually emerging skill needs in thelabour force and industry. The introduction to the VET sector of the open market,and user choice among TAFE institutes and other VET providers, can be said tointensify this anticipatory role.
With differing demographics and differing industry structures, skill solutions thatfit an industry in one region may not fit the same industry in another region of thesame State. This creative role of VET appears to be less well served by themechanics of the micro-level industry and occupational forecasting model.
Resourcing the work of training indicators The practicality of various classifications for and approaches to training indicatorshighlights a related issue, the practicality of resourcing and managing trainingindicators over time. Training indicators have to be disaggregated and analysed to a
Issues and directions

Using training indicators to improve planning for vocational education and training
42
reasonably high degree to in any way represent the complexity of regional and localVET markets, but the relative scarcity of planning resources and expert personnelmay bring the process to a standstill if it is taken to technical extremes.
Highly ambitious approaches using economic modelling or benchmarking (Cullen)may tend to have limited impact, not necessarily because the methodology isunsound but because the work is too highly labour-intensive or too complex tofollow up or evaluate over time. The more expansive projects may falter and createplanning discouragement through lack of ongoing resourcing and evaluation.Provided they are not trivial, work programs more attuned to the planningresources and skills realistically available may stand a better chance of beingfollowed up and having a positive impact over time on the levels of quality andawareness in VET planning.
It has been noted that resources used by State VET systems and DEWRSB fortraining indicator work, while variable in size, do not appear to be very large whenadded together.
It is therefore important that the collegiate (Commonwealth and State) resourcesavailable to NCVER be used to best effect, in sustainable improvements to trainingindicators that complement the detailed work that States will continue to performfor regional and institute planning. The history of uses and successes in trainingindicators suggests that it will always be a challenge to strike a reasonable balance.
The aptness of training indicators for the VET climate One idea identified in this report is that of changing policy and programpreferences over time for training indicators as a prime means of implementinglabour market planning and VET planning. Another is that, despite these changingpreferences, a solid core of organisational expertise and work in training indicatorshas continued.
One prompt for this report was the need to find alternative ways and means ofaddressing KPM 2, ways different from the international and national comparisonsapproach that peaked with the ANTA workskills benchmarking reports of 1997–98(Cullen 1997a, 1997b, 1998).
Using simple statistical analyses, Schofield’s independent (1999a, 1999b, 2000)reviews show that the period after 1995 was also one when States’ VET systemswere being stretched by the sharply rising quantities and falling quality oftraineeships. Similar points were being made in earlier departmental papers—forexample, that of Smith (1998) in the case of Queensland.
The problems may have been addressed earlier, with less need for major externalreview, if less ambitious (but not less rigorous) forms of VET planning andindicative measurement had been in the national ascendancy.
Training indicators could also play a part in VET planning for the period 2000–05.Although there may not be the same levels of growth in VET funding andenrolments, or apprenticeships and traineeships, the system will still be underpressure to deliver the quality and diversity of skill outcomes that are implied bythe five national VET objectives.

43
It is likely that partial failure to meet Finn targets will keep up the pressure forimproving VET outcomes for young people, who have struggled to maintain theirshare of apprenticeships and traineeships. As Schofield (2000) notes, there will alsobe continuing pressure to deliver employment outcomes through employment-based training. In 1998, the Commonwealth established an entirely new nationalnetwork of training intermediaries, New Apprenticeships Centres, whose primepurpose and commercial goal is to facilitate employment-based training.
Employment-based training is rather less than 25% of an average State’s VETenrolment profile, or rather less than 50% of enrolments for certificate IIqualifications or higher. However, a high proportion of public concern and scrutinyof the VET system relates to employment-based training.
Schofield (2000) and Kirby (2000) note the historical importance of VET, and itspotential future role, in middle and advanced-level skills and qualifications outsideand beyond apprenticeships. Curtain’s earlier (1996) paper makes a similar plea.NCVER analyses for National Industry Skills Forum (for example,Electrotechnology Working Group 2000) confirm the importance of non-apprenticeship pathways, even in traditional apprenticeships areas. ANTA (2000a)has issued a report on alternative pathways to qualifications in the trades.
In this environment, training indicators appear to have relevance in the disciplinesof VET planning for 2000–05. They may provide suitable measures to assessprospects and performance in a system that faces policy stresses and may continueto face diminishing growth in resources. They may provide flexible measures toexamine critically the adequacy of VET responses to changing industry, skill anddemographic requirements.
Issues and directions

Using training indicators to improve planning for vocational education and training
44
Proposals for improvementsin training indicators
This chapter develops the issues and directions into proposals for improvements intraining indicators.
The first chapter described the two main elements of the project brief. The first wasthe development of a range of indicators to assist policy-makers and trainingproviders to identify new areas of demand; and the second was to progress theimplementation of KPM 2, stocks of VET skills.
Both these elements are considered, as are better prospects for the dissemination oftraining indicators.
Good practice in the use of training indicators The consideration of recent practice suggests that the context for trainingindicators—the ‘why, when and how’ of their use—is as important as the ‘what’ oftheir content. Their popularity has varied over time, and they operate in a VETpolicy and planning context where there may only be certain markets for their useto fill certain needs and gaps.
For these reasons, responses to the project brief should be preceded by aconsideration of the elements of good practice in improving training indicators.
This is relevant to the work of agencies such as the NCVER and the ABS, which isthat of research and reporting, but also relevant to agencies such as State trainingauthorities who may be responsible for VET planning. Both types of agency facesimilar challenges in striving for best practice.
Apart from NCVER, the review of recent practice discloses a range of producers of‘training indicators’ that are or could be used in VET planning. These include theABS, key economic forecasting units, DEWRSB, State training agencies, ITABs,training providers, and so on. In VET planning, there are variable levels ofawareness and use of these different sources. For example, they could be profiledmore often at key VET forums. There may be value in greater networking (at Statelevels and below) to ensure that planners are aware of successive issues ofinformation and their potential uses or misuses.
It would seem logical to develop training indicators that are pitched to themainstream of national and State VET planning, but which also respond positivelyto the increasing importance of planning decisions made at regional levels forenterprise and individual client needs.
A systematic review (Embleton et al. 1999) of the United Kingdom training andenterprise council (TEC) planning practices for VET found high regional variabilityin TEC skill and excellence, especially for planning inputs and indicators related to

45Proposals for improvements in training indicators
workforce, business and enterprise development. There do not appear to becomparable studies of good practice across the Australian VET planning regions,such as they are. It can only be said that the degree of planning devolution and thepractices vary as does the quality and timeliness of data available.
To make sustainable improvements in training indicators, it is necessary to respectthe limitations of (economic, labour market, and training) data and to recognise thatthe development of more reliable and useful products makes considerable demandson organisational continuity and skill. The long history of the DEWRSB and GCCAwork is evidence.
Good practice (table 2) in training indicators may use several different assessmentsof the demand side and of the supply side and often will make a considered effortto compare or measure the supply side against the demand side.
This kind of practice can increase the probability of correct inferences and goodjudgments about VET training and investments and reduce the possibilities of poorjudgments based on the use of insufficient or inappropriate indicators. To giveexamples, it would not necessarily be good practice to change the institute level oftraining provision in a course solely on the basis of industry training advisory bodyinput, or solely on the basis of State-level VET graduate outcomes.
With the use of a variety of supply-and-demand assessments to makesupply–demand comparisons, greater possibilities also arise to use trainingindicators to study and answer important questions that may arise from KPM 2 andfrom changing patterns of VET demand and supply.
An important practice, not always strongly in evidence, is the deliberate evaluationof the training indicators for applicability and accuracy. Related to that is the idea ofa feedback loop whereby training indicators evolve consistently according toongoing feedback from the VET system and other clients. The current situation isthat VET planning and subsequently VET evaluation, whether at national or Stateand regional levels, proceed on somewhat different conceptual tracks usingsomewhat different sets of indicators.
Blandy and Freeland (2000) touch on another useful practice, that of widening theavailability of training indicators. Increasingly, online dissemination, an option thatwas not really practicable 20 years ago, can play a part. The easy option is to putentire publications online. Recent and present data sets (such as employment levelsor enrolment levels) can also be circulated online, with the possibility of interactiveinquiry and analysis.
Developing the range of training indicatorsEvidently, there is a spectrum of views about the best organising concepts andclassifications for training indicators, and especially about the extent to which theyshould be forecast-intensive.
Views on these issues will always be evolving. It is as important to apply goodpractice to the use of training indicators as it is to strive for the ideal set ofindicators.
Nonetheless, there is some consistency about the features of training indicators thathave been used fruitfully over time by Commonwealth and State departments of

Using training indicators to improve planning for vocational education and training
46
employment and training, are being used more recently by national and State VETplanners, and are recommended by recent studies.
It may be partly a question of pulling together heavily used indicators (for example,employment levels and enrolment levels) with those that appear relatively under-used (for example, VET outcomes and VET market shares) and urging greater useof derived measures or direct demand–supply comparisons.
It is also a question of recognising that the most useful sets of indicators, whilemaintaining some consistency in approach and content, will undergo shifts in detailand emphasis as one moves from national through to State and region and institute-level planning. To give a single example, both the national and regional plannerwould be interested in VET job outcomes. For better or worse, the localised plannermay instinctively prefer local VET job outcomes intelligence to inferences drawnfrom national student outcome data.
Table 1, which appears in the executive summary, is a selection of trainingindicators, demand side, supply side, and comparative demand–supply, that couldbe used for improving assessments of changing VET demand at national, State andregional levels. It is assumed that the indicators will often need to be applied toparticular industries, or, alternatively, to industries, disciplines and fields of study.
On the demand side, the indicators in table 1 relate to (industry) productivity,employment and strategic importance, industry characteristics and needs,replacement demands, job outcomes and trends; and on the supply side to VETfunding, training providers and pathways, training activity, trends and marketshares, other supply sources and demographics. The comparative demand–supplymeasures may compare productivity, strategic importance, and employment on theone side to VET funding, enrolments and completions on the other. They mayderive indicators of market shares and market opportunities.
Evidently, this list comes with a number of provisos. It is a generic set. As notedabove, the most useful selection of indicators and comparisons, and the precisestatistical or research sources, will vary, depending on whether the assessment has anational, State or regional (institute) focus.
The list combines items that are readily quantified or commonly forecasted(employment and enrolment levels) with items that are not so, but are more likelyto be derived by survey of industry or of training providers. The list combines avariety of demand, supply, and derived demand–supply measures. The secondchapter shows that these are useful ways to get practical results and derive usefulpolicy inferences over time.
The list introduces derived measures that attempt to measure the state of themarket, to identify necessary changes in training direction, and to identify training(purchasing) gaps and opportunities. These kinds of measures seem moreappropriate for the diversified market of recent years. Although they arequalitative, it may still be possible to evaluate whether or not the suggestedchanges in direction have been followed and with what degree of success.
The list presumes that similar sets of indicators can and should be used consistentlyfor forward planning as well as for review and evaluation. The suggestion is thatboth VET reporting and VET planning agencies can gain by studying the presentand recent past as a guide to the future, using consistent sets of indicators.

47Proposals for improvements in training indicators
The list is not entirely predicated on KPM 2. A useful range and variety of trainingindicators, to deal with changing VET demand, will tend to pick up elements ofother KPMs; for example, KPM 1 (skill outputs), KPMs 3 and 4 (employer responsesand student outcomes), and KPM 6 (public expenditure per public output).
Important questions in the project brief concern the adequacy of responses tochanges in training demand—arising from new areas of training, reskilling needs,demographic changes and associated labour market adjustments. The implication intable 1 is that these types of questions can be addressed by the persistentapplication of derived measures comparing demand and supply, qualitatively aswell as quantitatively.
The subtext in the table is that it, in so doing, is not always possible or appropriateto compare like with like.
It would be very tidy, for example, to compare State or regional industry demandand industry supply. Underlying the present ANTA review of the VET planninggrid is the problem that industry supply is not well defined in the VET sector.Neither is occupational supply as easy to define as it may have been 20 years ago,in a labour market of rapidly shifting skill mixes and rapidly evolving (modular,competency-based) VET skill responses.
Planning and measurement should follow national VET policy rather than lead it.At times it may be more practical to accept, as institute planners have to, thenecessity and usefulness of continually comparing changing educational provisionsto changing industry, regional or occupational demands. The challenges of makingmeaningful supply–demand comparisons at regional levels will only increase asdistance learning and open learning increase.
Finally, developing the range of training indicators should not be uncoupled fromthe range of strategies for implementation and dissemination.
Improving the implementation of Key PerformanceMeasure 2Stocks of VET skills against desired levels, KPM 2, is one of eight KPMsrecommended in the formative report of the Performance Review Committee(ANTA 1999d).
The report concedes that there are no exact answers for KPM 2 but argues that it is‘directly related’ to the goal of VET, the creation and maintenance of a national poolof skilled Australians sufficient to support internationally competitive commerceand industry.
The ANTA report proposes that the required data for KPM measurement falls intothree categories—measurement of VET skills (primarily about qualification and skillprofiles by industry), comparison of current against desired stock (primarily aboutmodelling and measuring industry demands and shortages for skills), andinternational benchmarking (our qualification profile against other countries).
A related way of addressing the problem is to unpack KPM 2 into linked topics thatmay respond to intensive and timely analysis using training indicators.

Using training indicators to improve planning for vocational education and training
48
The topics can be analysed using a variety of supply–demand indicators andsupply–demand comparisons. This approach may well draw in indicators that, informal terms, belong to other KPMs.
The third chapter argues the relevance of training indicators for the current VETclimate, following on from recent youth transition concerns and reviews of thequantity and quality of traineeships.
Youth transition concerns cannot be restricted solely to the VET system and its KPM2 since, in formal terms, they go beyond ANTA to DETYA matters such as qualityand inclusiveness of schooling and the post-secondary education system generally.
However, a co-operative effort to measure youth transition (and the VETcontribution to transition) more effectively would offer a better perspective on theoverall effectiveness of VET in furnishing adequate stocks of VET skills to meetchanging demographic needs.
At least, adequate measures of youth transition need to examine the duration oftransition, the extent of use of VET and other post-secondary pathways, major skilland labour market outcomes for those making the transition, and degrees of skilland labour market difficulties experienced by those failing to make an adequatetransition. It may also be useful to compare the Australian youth transitionoutcomes to those for the OECD.
Other lines of KPM 2 inquiry in relation to the adequacy of VET system responsesto changes in training demand, might be:
❖ Will VET continue to deliver the various mixes of skills required for the growth of various industries and for the achievement of individual careers?
❖ Is the VET system responding to strategic market opportunities and emergingskill needs through visible adjustments of funding profiles and course profiles?
❖ Is the development of the training market leading to diversity of market shareamong training providers and training pathways in order to provide multiple pathways to skills for diverse industry needs?
❖ Is the amount of VET training and skilling, especially for trades and qualifications, measurably sufficient for replacement, or growth and replacement, in key industry sectors?
❖ In what ways, and how successfully from year to year, is the VET system responding to skill gaps and skill shortages identified by governments, industries and regions?
One way to address these questions is to apply and re-apply training indicators(past, present, and future; by industry, occupation or region) until a consistentanalysis appears to emerge. Similar methods are found in recent NCVER papers(for example, Electrotechnology Working Group 2000, NCVER 2000a, 2000b, 2000c)already cited. The key result area evaluations employed by States are also similar inintent, although they are less concerned with the measurement of outcomes.
For question (1), for example, the analysis might first examine broad trends intraining providers and enrolments, followed by the more specific measurement andanalysis of enrolment trends (by levels of qualification, by apprenticeships andother pathways, training packages, modules, completions, and so on).
49Proposals for improvements in training indicators
The patterns and trends of skill acquisition may be analysed against the patterns ofindustry employment and demand, this leading to an assessment of the adequacyof the amount and mix of skill provisions, and an analysis of the drivers orimpediments that affect different providers and their pathways to skills. In turn,this may lead to an assessment of the extent to which the different pathways in theskill mix are being used by different groups in the community seeking skills(especially those affected by restructuring).
Ultimate goals of the chain of supply–demand comparisons might be thehighlighting of emerging areas of imbalance in the skill mix, directional orincremental changes in the different types of training activity in the skill mix, or theidentification of training gaps and opportunities for providers. Similar approachescan be developed for questions 2–5.
An aspect of the approaches proposed here is that they are intended to have abroad conception of the clients for VET and for the analyses of VET. These includepolicy-makers, training providers, enterprises, communities and individuals.
Improving the dissemination of training indicators This section considers prospects for the better dissemination of training indicators,by ANTA, NCVER, and other bodies, to facilitate meeting VET planning andvocational (career) planning needs.
From the published VET plans, discussions with DEWRSB, and VET and instituteplanners, the impression is that NCVER, with better dissemination of key researchfindings, and by improving the timeliness, accessibility, interpretation, range, andcontent of the training indicators now available in key VET statistical and outcomepublications, could have a more substantial impact on VET planning processes anddecisions.
A VET supply–side digest is the recognised format of useful NCVER publications.Examples are those on student outcomes (NCVER 1999d), VET statistics (NCVER2000d) and TAFE and university graduates (NCVER 2000f). Similarly, on thedemand side, Job futures (DEWRSB 1999) summarises industry and occupationalprospects at a glance.
What might be useful to diverse VET clients—policy-makers, training providers,industries and enterprises—would be some form of VET digest that makes theeffort to consider the supply side in the context of the demand side.
Such a digest might summarise and discuss a range of VET–supply (includingNCVER) and VET–demand (that is, non-NCVER) indicators and their implications.It could elaborate the VET implications of national and State trends in employment,industries, student outcomes, job outcomes, training providers, student andenrolment numbers, apprenticeships and traineeships, package or moduleenrolments, and so on. For major industry groups, it could possibly compare thedemand side to the supply side in a similar manner to that of table 1.
This concept is best considered in conjunction with parallel needs for improvementsin the KPM analysis (above) and in core NCVER statistical work on enrolments,apprenticeships and traineeships, and student outcomes.

Using training indicators to improve planning for vocational education and training
50
Given its relatively recent origin, the analysis and interpretation in the studentoutcomes publications stand up well to that of the enrolment and apprenticeshippublications.
For greater impact on State and regional VET planning, the timeliness and qualityof interpretation in these latter publications can be improved, particularly in termsof identifying critical enrolment trends, relating enrolment trends to broad labourforce and employment trends, and developing the regional and providerimplications of the analysis.
The kinds of analysis found in occasional, lengthier NCVER industry (1998a, 1998b)and training (2000a, 2000b, 2000c) publications could become part of regularpractice. The challenge is to strike a practical balance between the span andusefulness of the analysis and the resources required for its maintenance over time.
Billett and Hayes (2000) recognise that the student outcome surveys alreadyprovide for VET planners useful summary data on the main regional industrydestinations of VET graduates. The surveys also enable numerical estimates ofgraduates and module completers by field of study and industry of employment,these being increasingly important training indicators.
Despite its advantages, and its large sample size, the VET student outcome series(rather like the DEWRSB occupational analyses) is not particularly widely used byVET planners. This may be because the VET series is of recent origin, compared tothe well-established outcome series for university graduates. Some users wouldprefer to be able to access VET job outcome data more directly and reliably atregional (industry–occupational–institute) levels. However, this would stretch thepresent cost and technical envelopes of the surveys.
Like the enrolment and apprenticeship collections, the student outcomes surveyshave a time lag of some months between the date of the observations and theirpublication. These limitations may reduce the impact of NCVER work onestablished, budget-driven, annual cycles of State and regional VET planning.
As well as NCVER material, VET planners can use information banks that includeenrolment data from State information systems, local compilations of ABSemployment and industry data, State and regional industry employment forecasts,State or regional surveys of industry skill needs and shortages, and so on. Some ofthis data (enrolments) may be close to real time, while other data may have timelags similar to that of NCVER material.
User-friendly, online development of key NCVER material (relating to providers,enrolments, contracts of training and skill outcomes) could lead to greater influenceat the level of regional and institute VET planning.
This is a different way of putting training indicators into a digest. The costs andrisks are higher. The earlier discussion of best practice warns against thedevelopment of VET indicators in isolation from the evaluation and feedback loops.
However, there could be substantial benefits for NCVER and for the quality andinformation-inclusiveness of VET planning at regional levels. DEWRSB’s recenteffort in revitalising its occupational analysis research for an online presentation(DEWRSB 2000b discussed in the second chapter) is an example of what can bedone.

51Proposals for improvements in training indicators
If policy-makers, enterprises and training providers deserve informed, topicaltraining information and indicators, then, as the National Strategy acknowledges,so do school leavers and other prospective VET clients.
In the second chapter, the range and coherency of VET student information iscompared to the relative abundance of student information now available in theuniversities sector, which tends to be the first choice of school students. Theprevious chapter discusses the relevance of enhanced VET information (in schools)to the national strategy and the logical links between improving system informationand improving system performance under KPM 2 and associated measures.
If, overall, VET student and careers information is assessed as moderate in quality,it is not for want of potential providers. NCVER surveys the job and salaryexperiences of VET graduates and module completers. State VET systems haveTAFE directories and provide online information on apprenticeship opportunitiesand other VET career options. DETYA New Apprenticeships Centres promoteapprenticeships and traineeships. Some career information for VET-relatedoccupations is provided by the DETYA careers program and by DEWRSB throughJob outlook. Comparative, although limited, information on VET student outcomes isderived from the student outcome surveys and published in Good universities guide.
The VET system might well review the various providers and products to make aconcerted effort to improve the range and quality of VET careers informationavailable. Some combination of NCVER student VET outcomes and systemic StateVET information might offer a good base.
It would be consistent with the approach in this paper if greater efforts were madeto integrate and compare the supply-and-demand-side information in the form ofrelevant training indicators. The experience with Careers WA, as noted in the secondchapter, is a reminder that these things can be done in a useful manner. Also, recentimprovements in the quality of university information available, and continuingevidence of mixed senior-school attitudes towards TAFE, suggest that there is everyreason for VET careers information to work towards more definite indicators andcomparisons on individual institutes.

Using training indicators to improve planning for vocational education and training
52
Summaries and suggested actions
So far in this report, the project background, the policy environment, the practice oftraining indicators, issues and directions, and proposals for improvements havebeen discussed. This concluding chapter summarises key points and suggestsactions.
Project and policy summaryThe aim of this project is to develop a range of training indicators to assist VETpolicy and providers to identify changes in training demand arising from industry,skill and demographic changes.
The project examines critiques of various approaches to measuring the adequacy ofthe stock of VET skills, which is a KPM for the VET system as a whole. Anotherapplication of this project could be that ranges of indicators are proposed in(NCVER) magazines.
Training indicators are taken here to refer to quantitative and qualitative indicatorsof current or future VET supply and demand, potentially economic, social, labourmarket, vocational, and other indicators, which governments, enterprises, trainingproviders and individuals utilise to guide decisions about training investments inskills, especially at the industry, occupational, regional and course levels.
The discussion of training indicators is set against recent developments in thetraining system and the training market. The semi-competitive VET funding model,the particular nature of VET as a public good, and the new diversity of trainingproviders and pathways to skills, are taken to imply new demands for diversetraining information to improve the operation of the market.
The national strategy and KPMs for VET are introduced, particularly in terms oftheir training objectives and training information requirements. The broadframework for national and State VET planning has been identified, including itsuse of industry and industry forecasts as broad indicators of funding allocations.
Summary of training indicatorsFrom the 1970s, Commonwealth, State and other agencies have used trainingindicators for youth and training policy needs, skilled migration, job placementneeds and vocational guidance.
Their work is grouped under the broad headings of indicators for youth transition,analyses and indicators for the trades, occupational analyses and indicators,indicators for vocational guidance and graduate outcomes, and ANTA or State VETplanning processes.

53Summaries and suggested actions
Three broad streams of training indicator work might be identified. These arereferred to as the careers-course directory (for example, the DETYA career guidanceprogram), the demand–supply synthesis of training (DOLAC and later approachesto State VET planning, youth transition work), and derived measures used astraining indicators (Occupational outlook, graduate destination surveys and NCVERwork).
The second stream relates to current State VET planning processes. In generalterms, this might include:
❖ indicators for the demand side in terms of overall economic trends, employment numbers, employment trends, structural cyclical trends, demographic demands, employment rates, emerging skills and skill gaps, changing government and regulatory requirements, wages and conditions, levels of replacement demand, and so on
❖ indicators for the supply side in terms of labour force trends, training investment and funding levels, training trends, training pathways and flexibility, unemployment rates, upskilling and reskilling, migration, and so on
❖ from the synthesis, judgments arise about likely training needs and the balance of demand and supply in the future
The demand–supply syntheses and the derived measures have been realistic anduseful for policy and program improvements and for advisory purposes. Examplesare the DOLAC analyses on supply and demand for the trades, DEWRSB’soccupational (job) outlook analyses, DEWRSB’s Occupational Shares System formigration, and the graduate careers (GCCA) surveys on university graduateemployment prospects.
New initiatives of the 1990s create fresh possibilities for the use of trainingindicators in VET planning and vocational guidance. Outside the VET sector, theDEWRSB work has been refreshed and the Good universities guide has beendeveloped. In the VET sector, new employer and student surveys have becomeintegral to the VET system and its key performance measures.
Since the establishment of ANTA, the national and State VET planning processeshave used a range of training indicators, including labour market and industryemployment forecasts, to guide funding allocations and training investments.
States usually have a broad annual VET plan applying funds to the ANTA (19)industry training areas, or to a broad discipline-study grid. The broad plan isusually based on employment and perhaps on output forecasts. It may includesupply–demand syntheses and may identify priority industries, occupations andskills.
The State VET planning processes commonly have a second level of industry orregional training plans, guided by a range of supply–demand indicators, which canexpress regional and occupational-industry skill priorities, suggest regional demandshifts or regional-industry VET purchasing priorities:
❖ the demand side might be represented by industry training needs, priority industries and output measures, regional socioeconomics, regional

Using training indicators to improve planning for vocational education and training
54
employment, industry employment, industry forecasts, industry employment compared to training levels, and so on
❖ the supply side might be represented by demographics, qualification profiles, qualification or skill gaps, volumes of training funds, volumes of training, and so on
Published VET plans and their industry inputs create the impression that industryis the dominant organising concept of State and regional VET planning. TAFEinstitutes also have (usually unpublished) plans, expressed more in terms of thecourses, disciplines or fields of study of the programs required to give effect toindustry and regional planning priorities. Their planning tends to be a matter ofincremental adjustment of courses to take account of observed changes indemographics and demand, not to mention observable outcomes during the actualplanning periods.
At the national level, VET evaluation against KPM 2 proceeds by a generalcomparison of the VET supply side (qualification profiles) and demand side (labourmarket and output-employment trends). States tend to plan against a more specificset of training indicators and to report against the annual national priorities set eachyear under the national strategy.
Better practice would tend towards more visible evaluations of State (and regional)VET plans against what was planned or indicated in the first place.
Summary of issues and directions In this section the issues and directions for training indicators are discussed interms of the national planning background, the place of indicators in VET planning,the market for training indicators, needs and gaps, classification issues, forecastingand related issues, and the aptness of indicators for the VET climate.
The national strategy and the eight key performance measures for VET are taken asessential to directions and proposals. It is argued that training indicators have thepotential to service the objectives, particularly those related to best value for publicVET funds, and equipping Australians for the world of work.
In recent years, training indicators have often been developed to assess stocks ofskills and client outcomes, issues which now correspond to KPMs 2 and 4 for VET.A useful range of training indicators for the future may relate to several of theKPMs.
A range of training indicators, and their demand–supply syntheses, are seen to beused widely in national and State VET planning and regional-industry VETplanning. There appears to be limited formal assessment of the accuracy andusefulness of the indicators in developing successive plans, although informalconsultation and evaluation are important.
The evaluations of national and State VET plans, and the indicators used, tend tofollow different tracks from the processes and indicators used in the formation ofthe plans.
Training indicators are in the nature of a public good. There is persistent demandfor these indicators for VET policy and planning, job placement and career

55Summaries and suggested actions
guidance needs. The inception of the VET employer and student surveys and theirplacement in a KPM framework make for significant changes in the importance andavailability of training indicators.
NCVER responds to demands for training indicators with a range of VET studentsurveys and analyses, which States may use together with data from their ownstudent enrolment systems, other statistical data and industry or stakeholdersurveys.
With diversification and deregulation of the training market, there are importantand increasing needs for training indicators directed to the regional and instituteplanning processes and decisions. There are reasonable arguments for greateropenness and more information about institute planning and comparisons, butthese are matters of contention.
There is debate and review of the most useful frameworks for VET planning andindicators. There may be changes in the broad ANTA planning grid of industrytraining areas, used to aggregate VET supplies. States may prefer to plan againstdisciplines, fields of study, or training packages (units of competency), all of thesebeing important in NCVER statistics and current or intended supply-sideclassifications. At the region-institute level, there remains the practical necessity ofrelating course provisions to changing industry and skill demands.
Recent studies may diverge on the usefulness of micro-level industry andoccupational forecasting, while nominating lists of preferred training indicators thatoverlap to some degree. Direct appeal to industry forecasts as a proxy for trainingdemand is debatable, and the preference among State VET planners is to useforecasts as one substantial contribution to the plans and planning decisions. Thisseems reasonable if VET systems have leading as well as following roles indeveloping skills and skill solutions, and cannot always respond uncritically toreported or forecasted skill shortages by allocation of scarce VET funds.
Practical attention to the resources and personnel available in NCVER and StateVET systems emerges as an important issue in making sustainable improvements inVET planning in the future. In recent years, the use of training indicators has beenmaintained over time and despite different fashions in VET planning. Theseindicators have addressed key questions of the 1995–2000 period, particularly thequantity and quality of traineeships. They could have an apt role over the period2000–05, offering suitable measures to assess prospects and performance in a VETsystem under policy and resource stresses, and flexible measures to examine VETresponses to changing industry, skill and demographic trends.
Summary propositions and suggested actionsThe summary propositions relate to good practice in the use of training indicators,developing the range of training indicators, improving the implementation of KPM2, and improvements in dissemination for greater impacts on VET planning.
Good practice in training indicators is put forward as a necessary part of proposalsto improve their range and their implementation.

Using training indicators to improve planning for vocational education and training
56
There could be improvements in the profiling of the key sources for trainingindicators and greater State and regional networking of training indicators’availability and their uses.
It seems most relevant to develop training indicators that respond to the policycontext and the mainstream needs of national VET planning and evaluation andState VET planning, but also to the increasing importance (with diversification andderegulation) of regional planning decisions for enterprises and for individualneeds.
There appear to be needs and gaps in training indicators at regional levels, and theextent of variability in quality of regional VET planning practices has not beenstudied closely.
Sustainable improvements in training indicators require intense organisationalcontinuity and skill. Other elements of good practice include the use of a range of(quantitative and qualitative) supply-and-demand assessments andsupply–demand comparisons, greater evaluation of training indicators for accuracyand usefulness, and greater consistency in the processes and indicators for VETplanning and VET evaluation.
Within a consistent framework, the exact selection and emphasis of the indicatorswill change in shifts from the national to State and regional levels. It is useful torecognise that the supply side (courses) cannot always be equated neatly to thedemand side (employment, industry and occupation) forecasts and indicators.
Suggested actions
For ANTA, States and Territories, NCVER
1. Increasing the networking and exchange of training indicators
There would be value in greater profiling of training indicators at key VET forums, and more networking among the key producers of training indicators, to ensure that State and regional planners are aware of, and working effectively with, the most timely range of supply-and-demand indicators.
For ANTA, States and Territories
2. Focussing training indicators on the VET planning mainstream
The prime focus for training indicators ought to be the mainstream of national VET planning and evaluation and State VET planning, but with increasing recognition of the importance of indicators for regional planning decisions in the diversified and deregulated training market.
For ANTA, States and Territories
3. Evaluating regional VET planning practices
Recognising different State practices and preferences, consideration should be given to a comparative evaluation of regional planning practices, for the exchange of better practice and improvement in the comparative quality and availability of training indicators used.

57Summaries and suggested actions
For ANTA, States and Territories, NCVER
4. Improving VET planning through good practice in training indicators
For sustainable improvements in the quality of judgments made over VET training and investment, it is good practice to use a range of VET demand and VET supply indicators, to compare and measure demand against supply, to continually assess the accuracy and usefulness of indicators, to use consistent processes and indicators for VET planning and VET evaluation, and to recognise that the supply side (courses) cannot be neatly equated to thedemand side (employment).
There is a range of views about the best concepts and classifications for trainingindicators and the relative merit of intensive forecasting among indicators.However, there is a certain consistency about the features of training indicators thathave been used over time in national and State employment and trainingdepartments, are currently being used in VET planning and are recommended inrecent studies.
For particular industries and fields of study, a range of demand, supply, anddemand–supply, indicators and measures can be identified which could be used forimproving assessments of changing VET demand at national, State and regionallevels.
Suggested action
For NCVER, States and Territories
5. Assessing changing VET demand by using a range of demand and supply indicators
A range of demand, supply, and demand–supply, indicators and measures (see table 1) can be used to improve assessments of changing VET demand:
❖ On the demand side, (industry’s) productivity, employment, and strategic importance to the economy, industry characteristics and needs, replacement demand, job outcomes and trends could be utilised.
❖ On the supply side, VET funding, training providers and pathways, training activity and trends, training market shares, other supply sources, and demographics could be utilised.
❖ The demand–supply measures may compare (industry’s) productivity, employment, and strategic importance to the economy, on the one side to funding, enrolments, and completions on the other. From this, indicators ofmarket shares and opportunities could be derived.
In the formative ANTA KPM report of 1999, KPM 2, stocks of VET skills againstdesired levels, is seen to relate directly to Australia’s maintenance of a pool of skillsfor internationally competitive commerce and industry. The report divides data forKPM measurement into measurement of VET skills (qualifications), comparingcurrent and desired (industry) stocks, and international benchmarking (ofqualifications).
In this report, training indicators are seen to be apt for assessments in the currentVET climate and its policy and resource pressures, and apt for lines of inquiryunder KPM 2.

Using training indicators to improve planning for vocational education and training
58
In the particular case of the youth transition issue, a co-operative effort to identifycommon indicators to measure youth transition (and the VET contribution totransition) more effectively is recommended. This should cover the duration oftransition, nature of transition pathways, skill and labour market outcomes forthose succeeding and those failing to make adequate transitions.
Other linked KPM 2 topics are proposed. In each instance, it suggested that trainingindicators be applied and re-applied at increasing levels of detail until a consistentanalysis begins to emerge. The goal would be to identify gaps, suggest changes, andrecommend opportunities, in the skill mix and in skill provisions.
Suggested actions
For NCVER, ANTA, States and Territories
6. Using training indicators to measure the responsiveness of the VET system
Training indicators have an apt role to play in the VET system over 2000–05, offering suitable measures for a system under policy and resource pressures, and flexible measures to examine system responses to changing industry, skilland demographic trends.
For NCVER, ANTA, DETYA
7. Developing better indicators of the youth transition
A better perspective on KPM 2 could be obtained by agreement on, and co-operative development of, better measures of the adequacy of youth transition through VET and other forms of post-secondary education. This should cover transition duration, pathways, successful skill and labour market outcomes, and unsuccessful outcomes.
For NCVER, ANTA, DETYA
8. Improving the analysis and measurement of KPM 2
KPM 2 can be separated into lines of inquiry which can be addressed and analysed with the use of training indicators. These relate to the adequacy of the skill mix, responsiveness to strategic skill needs, diversity of skills provision and pathways, adequate replacement of industry skills, and responsiveness to skill gaps in industry. For example:
❖ Will VET continue to deliver the various mixes of skills required for the growth of various industries and for the achievement of individual careers?
❖ Is the VET system responding to strategic market opportunities and emerging skill needs through visible adjustments of funding profiles and course profiles?
❖ Is the development of the training market leading to diversity of market share among training providers and training pathways, to provide multiple pathways to skills for diverse industry needs?
❖ Is the amount of VET training and skilling, especially for trades and qualifications, measurably sufficient for replacement, or growth and replacement, in key industry sectors?
59Summaries and suggested actions
❖ In what ways, and how successfully from year to year, is the VET system responding to skill gaps and skill shortages identified by governments, industries and regions?
Published VET plans, and discussions with State institute VET planners, imply thatNCVER could impact more on VET planning by improving the timeliness,accessibility and interpretation of key publications and their training indicators.
Useful NCVER (and DEWRSB) publications separately summarise VET supply, anddemand, training indicators at a glance. Diverse VET clients might appreciate someform of VET digest which brought the supply and demand sides together andcompared them (after the style of table 1). Such a digest might draw out the VETimplications of national–State trends in demand and supply indicators such asemployment, industries, occupations, outcomes, providers, enrolments andtraining. It might use indicators to analyse youth transition issues from time totime.
The VET student outcome surveys have made good progress since 1995. Theyenable useful estimates of graduate and module completer numbers and industryshares of regional graduate destinations. The outcomes data might be used morewidely if greater regional (industries and providers) detail were available.
Similarly, there could be greater impacts on VET planning with sustainedimprovements in the timeliness and interpretive quality of key enrolment andapprenticeship publications, in terms of identifying critical trends and relating theseto labour force and employment trends, and developing the analysis for regionsand providers. Occasional NCVER industry and training papers may be a usefulpointer.
Key NCVER publications of training indicators are time-lagged and may be limitedin their impact on budget or calendar-driven cycles of State VET planning.Moreover, States also have access to their own (possibly online) enrolment systems,other employment and industry data banks, and regional or industry surveys.While there are costs and risks, a user-friendly, online development of key NCVERtraining indicators could lead to their having a greater influence in State VETplanning and regional VET planning.
The information needs of school leavers and other VET clients are acknowledged asimportant in improving system performance under the national strategy. Despite arange of potential and actual providers, the quality and inclusiveness of VETstudent and career information is only moderate when compared with recentprogress in student information for the universities sector, which remains the strongfirst preference of school students.
The VET system might review the potential providers and products of VET studentand careers information, with a view to proposing more influential and inclusiveranges of information and indicators. NCVER (highlighting student outcomes) andState (highlighting careers and courses) material may offer a good base.

Using training indicators to improve planning for vocational education and training
60
Suggested actions
For NCVER, ANTA, DETYA
9. Putting VET supply and demand indicators together to assist clients of VET
To give greater planning assistance to a range of VET clients, VET supply-and-demand indicators should be brought together in a digest considering (after the manner of table 1) the implications of recent trends in demand–supply indicators such as employment, industries, student outcomes, job outcomes, training providers, enrolments, and training.
For NCVER, States and Territories
10. Enhancing the student outcome surveys for VET planning
The usefulness for regional and institute planning of the job outcome and destination indicators in the student outcome surveys could be more widely recognised and, being mindful of cost and technical issues, consideration could be given to expanding their regional (industry, provider) detail.
For NCVER, States and Territories
11. Enhancing enrolment-apprenticeship indicators and publications for VET planning
Training indicators could have greater impacts on State and regional VET planning if the timeliness and interpretive quality of key enrolment and apprenticeship publications were improved, relating critical supply trends to labour force and employment trends.
For NCVER, States and Territories in discussion with training providers
12. Developing online training indicators for VET planning
Noting the challenges of timeliness and relevance, a user-friendly, online development of key NCVER training indicators could increase the influence of these indicators in State and regional VET planning. There are greater costs and risks than (11) and such an option should be market-tested first.
For ANTA, NCVER, States and Territories
13. Reforming VET student and careers information for VET system performance
Recognising the important leverage of VET student and careers information inimproving system performance under the national strategy, the VET system ought to review its quality and inclusiveness of the information in order to develop a more influential and informed student careers voice. That should include working towards better institute information and comparisons.

61
ReferencesABS (Australian Bureau of Statistics) 1997, Australian standard classification of occupations, 2nd edition,
ABS, Canberra. ABS & Department of Statistics New Zealand (Australian Bureau of Statistics and Department of
Statistics New Zealand) 1993, Australian and New Zealand standard industrial classification, ABS,Canberra and Department of Statistics, Wellington.
Allen Consulting Group 1994, Successful reform: Competitive skills for Australians and Australianenterprises, report to the Australian National Training Authority, Brisbane.
Anderson, D 1997a, ‘Clients in the training market: Facts and fiction’, in Good thinking good practice:Research perspectives on learning and work, 5th Annual International Conference on Post-compulsoryEducation and Training, Surfers Paradise, Centre for Learning and Work Research, GriffithUniversity, pp.13–30.
——1997b, Competition and market reform in the Australian VET sector, Review of research, NationalCentre for Vocational Education Research, Adelaide.
——1998, ‘Training markets’, in Readings in Australian vocational education and training research, eds C Robinson and P Thomson, NCVER, Adelaide, pp.143–217.
ANTA (Australian National Training Authority) 1996, Directions and resource allocations for 1997,ANTA, Brisbane.
——1998a, A bridge to the future: Australia’s national strategy for vocational education and training, ANTA, Brisbane.
——1998b, Annual national report 1997: Volume 3, vocational education and training performance, ANTA, Brisbane.
——1998c, AVETMISS—the guidelines for VET providers, ANTA, Brisbane.——1998d, AVETMISS—the standard for VET providers, ANTA, Brisbane.——1998e, Directions and resource allocations for 1998: Report to the Ministerial Council, ANTA, Brisbane.——1999a, Annual national report 1998: Volume 3, vocational education and training performance,
ANTA, Brisbane.——1999b, Australian Recognition Framework arrangements, ANTA, Brisbane.——1999c, Directions and resource allocations for 2000, ANTA, Brisbane.——1999d, Key performance measures for vocational education and training, ANTA, Brisbane.——2000a, Alternative pathways to AQF certificate III qualifications in trade occupations, ANTA, Brisbane.——2000b, NacInfo service (www.nacinfo.com.au), ANTA, Brisbane [accessed: 6 December 2000].
Ashenden, D & Milligan, S 1999, The good universities guide to universities, TAFE & private colleges in2000, 9th edition, Hobsons, Perth.
——2000, The good universities guide to universities, TAFEs and private providers, Hobsons, Perth.Ball, K & Robinson, C 1998, ‘Young people’s participation in and outcomes from vocational education
and training’, in Australia’s youth: Reality and risk, Dusseldorp Skills Forum, Sydney, pp.66–73.Billett, S 1998, ‘Changing relationships between the vocational education systems and their clients’,
Unicorn, vol.24, no.3, Australian College of Education, Deakin West ACT, pp.60–72.—— & Cooper, M 1998, ‘Returns to enterprises from investment in vocational education and training’,
in Readings in Australian vocational education and training research, eds C Robinson and P Thomson,NCVER, Adelaide, pp.57–90.
—— & Hayes, S 2000, Meeting the demand: The needs of vocational education and training clients, NCVER,Adelaide.
Blandy, R & Freeland, B 2000, Is the stock of VET skills adequate? Assessment methodologies, NCVER,Adelaide.
Burns, M & Shanahan, M 2000, Labour market models and their use in projecting vocational education andtraining requirements, NCVER, Adelaide.
References
Using training indicators to improve planning for vocational education and training
62
Cullen, RB 1997a, Workskills and national competitiveness: A benchmarking framework, ANTA, Brisbane.——1997b, Workskills and national competitiveness: External benchmarks, ANTA, Brisbane.——1998, Workskills and national competitiveness: Internal benchmarks, ANTA, Brisbane.Curriculum Corporation 2000, OZJAC: The Australian courses and careers database
(www.curriculum.edu.au/ozjacweb), Curriculum Corporation, Carlton South, Victoria [accessed: 13 September 2000].
Curtain, R 1996, Is Australia locked into a low skills/low quality cycle? Working paper no.10, MonashUniversity—ACER Centre for the Economics of Education and Training, Melbourne.
Dandie, S 1996, Economic analysis of employment based entry level training: An analysis of trends inapprenticeship training, Discussion paper 96/4, CLMR, Murdoch University, Perth.
Dawkins, J 1988, Industry training in Australia: The need for change, AGPS, Canberra.DEET (Department of Employment, Education and Training) 1988, Meeting Australia’s skill needs: Fifth
report on the occupational share system for skilled migration, AGPS, Canberra.DEET WA (Department of Employment, Education and Training WA) 1994, Careers WA, final issue,
DEET State Office, Perth.DEETYA (Department of Employment, Education, Training and Youth Affairs) 1998, Skills in Australia:
Trends and shortages, Analytical series 98/5, DEETYA, Canberra.DEIR (Department of Employment and Industrial Relations) 1983a, Employment prospects by industry
and occupation: A labour market analysis, DEIR, Canberra.——1983b, The supply and demand for skilled labour: A framework, DEIR for DOLAC, Canberra.——1986, Occupational outlook: The supply and demand for skilled labour, DEIR, Canberra.Department of Training WA 1999, Western Australian State training strategy: Western Australian State
training profile 1999–2001, Department of Training WA, Perth.DETE SA (Department of Education, Training and Employment of SA) 1998, The State strategic plan for
vocational education and training, DETE, Adelaide.——1999, The State strategic plan for vocational education and training: 1999 update—priorities and targets,
DETE, Adelaide.DETIR (Department of Employment, Training and Industrial Relations) 1999a, 1999 Queensland annual
VET plan, DETIR, Brisbane.——1999b, Resource priorities 2000–2002, DETIR, Brisbane.——1999c, Year 2000 Queensland annual VET plan, DETIR, Brisbane.——2000, Resource priorities 2000/2001–2002/2003, DETIR, Brisbane.DETYA (Department of Education, Training and Youth Affairs) 2000, Job guide, DETYA, Canberra.
<www.detya.gov.au/jobguideonline> [accessed: 13 September 2000].DEWRSB (Department of Employment, Workplace Relations and Small Business) 1999, DEWRSB Job
futures: April 1999, DEWRSB, Canberra.——2000a, DEWRSB Job futures: September 2000, DEWRSB, Canberra.——2000b, Job outlook, DEWRSB, Canberra. <www.jobsearch.gov.au/joboutlook> [accessed: 29 August
2000].Dockery, AM, Kosky, P, Stromback, T & Wiwi, Ying 1997, The cost of training apprentices in Australian
firms, Discussion paper 97/3, CLMR, Murdoch University, Perth. DOLAC (Departments of Labour Advisory Committee) 1988, A discussion paper on competency- based
trade training, DOLAC, Canberra. DTE WA (Department of Training and Employment WA) 2000, Get access, DTE WA, Perth.
<www.westone.gov.au> [accessed: 2 July 2000]. Dumbrell, T 1995, ‘Targeting resources to industry needs’, in Towards a skilled Australia: National
conference on vocational education and training, ANTA, Brisbane, pp.253–260.Electrotechnology Working Group 2000, A report on skill shortages in electrotechnology, DETYA,
Canberra.Embleton, J, Barry, J, Gordon, A, Parsons, D & Rowe, R 1999, The labour market relevance of TEC/CCTE
activities, Research report 129, Department for Education and Employment, London.Finn, B 1991, Young people’s participation in post-compulsory education and training, AGPS, Canberra. Freeland, B 1999, How supply and demand forces shape VET markets, NCVER, Adelaide.Freeman, RB 1976, The overeducated American, Academic Press, New York.GCCA (Graduate Careers Council of Australia) 1998, Grad Stats, no.3, GCCA, Melbourne.——1999a, Grad Stats, no.4, GCCA, Melbourne. <www.gradlink.edu.au> [accessed: 9 July 2000]. ——1999b, Graduate destination survey 1998, GCCA, Melbourne. Haskel, J & Holt, R 1999, Anticipating future skill needs: Can it be done? Does it need to be done? Skills Task
Force research paper 1, Skills Task Force, Department for Education and Employment, London.

63References
Hollister, R 1967, A technical evaluation of the first stage of the Mediterranean Regional Project, Organizationfor Economic Co-operation and Development, Paris.
James, R 2000, TAFE, university or work: The early preferences and choices of students in years 10, 11 and 12,NCVER, Adelaide.
Keating, PJ 1994, Working nation: Policies and programs, AGPS, Canberra.Kemp, D 1996, Training for real jobs, AGPS, Canberra.Kilpatrick, S & Allen, K 2000, ‘Demand issues in vocational education and training’, unpublished,
NCVER, Adelaide.Kirby, P (chair) 1985, Report of the committee of inquiry into labour market programs, AGPS, Canberra.——2000, Ministerial review of post compulsory education and training pathways in Victoria: Final report,
Department of Education, Employment and Training, Melbourne.Lewis, PET & Kosky, P 1998, Youth employment, unemployment and school participation, Discussion paper
98/3, CLMR, Murdoch University, Perth.Lundberg, D 1998, ‘Entry-level training’, in Readings in Australian vocational education and training
research, eds C Robinson and P Thomson, NCVER, Adelaide, pp.218–244.Misko, J 1999, Transition pathways: What happens to young people when they leave school, prepared for
DETYA, NCVER, Adelaide.Murphy, C 1998, ‘Where the jobs are: The outlook for jobs’, in Future training issues in training
Australia's industries: A collection of the papers presented at the NCVER 1998 conference: Industry outlook'98, Sydney, 12–13 October 1998, ed. P Curtin, NCVER, Adelaide, pp.43–68.
Natarajan, L & Misson, E 1998, Apprenticeships and traineeships: Victorian trends, State Training Board ofVictoria, Melbourne.
NCVER (National Centre for Vocational Education Research) 1998a, Industry training monograph: Theoverview, NCVER, Adelaide.
——1998b, The outlook for training in Australia’s industries, NCVER, Adelaide. ——1999a, Annual report 1998–99, NCVER, Adelaide.——1999b, Australian apprentice and trainee statistics 1998, vol.4, no.6, NCVER, Adelaide.——1999c, Australian vocational education and training statistics 1998: An overview, NCVER, Adelaide.——1999d, Australian vocational education and training statistics 1999: Student outcomes survey: At a
glance, NCVER, Adelaide.——1999e, Australian vocational education and training statistics 1999: Student outcomes survey: National
report, NCVER, Adelaide.——1999f, Survey of employer views on vocational education and training: National report, NCVER,
Adelaide.——2000a, Australian apprentice and trainee statistics: Automotive repairs and service trades 1995–99,
NCVER, Adelaide.——2000b, Australian apprentice and trainee statistics: Electrical and electronic trades 1995–99, NCVER,
Adelaide.——2000c, Australian apprentice and trainee statistics: Mechanical engineering and fabrication trades
1995–99, NCVER, Adelaide.——2000d, Australian VET statistics: At a glance, NCVER, Adelaide.——2000e, TAFE and university graduates at a glance, NCVER, Adelaide.NSW BVET (New South Wales Board of VET) 2000, VET NSW 2000 plan, BVET, Sydney.OECD (Organization for Economic Co-operation and Development) 2000, From initial education to
working life: Making transitions work, OECD, Paris. Office of ACT Administration 1987, The development of employment and training responsibilities in the
ACT: A community discussion paper, AGPS, Canberra.OTFE (Office of Training and Further Education) 1998, Benefits to employers from an investment in
training: Literature review, OTFE, Melbourne.——1999a, Planning guide for providers of TAFE in Victoria 2000–2002, OTFE, Melbourne.——1999b, Training and further education plan: Victoria–2000, OTFE, Melbourne.OVET Tasmania (Office of VET Tasmania) 1999, Tasmanian VET plan 2000, OVET, Hobart.Pickersgill, R & Walsh, M 1998, ‘The experience of training reform in Australia’, paper presented to the
NCVER Seventh Annual VET Researchers Conference, Charles Sturt University, Wagga Wagga.Robinson, C 1998, ‘The VET product and the development of the training market’, in The market for
vocational education and training, eds C Robinson and P Kenyon, NCVER, Adelaide, pp.102–124.——1999, ‘The development of traineeships and the impact of research’, in The impact of R&D on VET
decision making, ed. C Selby Smith, NCVER, Adelaide.Ryan, C 2000, Where to next?: Graduate outcomes from the Australian higher education and vocational
education and training sectors, NCVER, Adelaide.

Using training indicators to improve planning for vocational education and training
64
Saunders, S 1999, ‘Issues and directions from a review of the Australian apprenticeship andtraineeship literature’, unpublished, NCVER, Adelaide.
Schofield, K 1999a, A risky business: Review of the quality of Tasmania’s traineeship system, Department ofEducation, Office of Vocational Education and Training, Hobart.
——1999b, Independent investigation into the quality of training in Queensland's traineeship system, DETIR,Brisbane.
——2000, Report of the independent review of the quality of training in Victoria's apprenticeship andtraineeship system, Office of Post Compulsory Education, Training and Employment, Melbourne.
Segal, L & Johnson, B 1987, Standards-based trade training—a discussion paper, DEET, Canberra. Smith, L 1998, Apprenticeships and traineeships: Queensland trends, DETIR, Brisbane.State Training Board of Victoria 1989, Reform of the apprenticeship system: A discussion paper, State
Training Board, Melbourne.Steering Committee (Steering Committee for the Review of Commonwealth/State Service Provision)
1999, Report on government services 1999, vol.1, Productivity Commission, Melbourne.Sweet, R 1995, ‘The naked emperor: Training reform, initial vocational preparation and youth wages’,
Australian Economic Review, 110, pp.101–108. ——1996, ‘How well do our entry level training models fit the labour market of the 1990s’, in
Rethinking work: Re-inventing education, Tasmanian Education Consortium, Hobart. Wooden, M 1998, ‘The labour market for young Australians’, in Australia’s youth: Reality and risk,
Dusseldorp Skills Forum, Sydney, pp.29–50.

The National Centre for VocationalEducation Research is Australia’sprimary research and developmentorganisation in the field of vocationaleducation and training.
NCVER undertakes and managesresearch programs and monitors theperformance of Australia’s trainingsystem.
NCVER provides a range ofinformation aimed at improving thequality of training at all levels.
ISBN 0 87397 716 5 print editionISBN 0 87397 717 3 web edition
NCVER