india’s corporate bond market: issues in market
TRANSCRIPT
article
RBI Bulletin January 2019 19
India’s Corporate Bond Market: Issues in Market Microstructure
at a meagre 17 per cent in June 2017 as compared to
123 per cent in the US and 19 per cent in the case of
China (Table 1). This reflects a complex interplay of
a host of demand and supply side factors overtime.
First, investors’ base is narrow. The demand for
corporate bond as an investment is mostly confined to
institutional investors with retail investors accounting
for only 3 per cent of the outstanding issuances. Even
among institutional investors including the buy
and hold category, demand for corporate bonds is
constrained by prudential norms for investment for
the insurance companies and mutual funds2. During
2016-17, the Central and State Government securities
constituted almost half of the total investment of
the life insurance companies and 36 per cent of the
investment by the general, health and re-insurance
companies. In contrast, investment in other securities
constituted less than 5 per cent of total investment of
these companies (IRDAI, 2016-17). Foreign investors,
who could have played a critical role in broadening and
deepening the corporate debt market in India were
constrained by investment limits. In recent years,
however, the investment limit for FPIs in the corporate
bond has been enhanced along with a reduction in the
withholding tax though FIIs are not fully utilising the
enhanced limits due to limited liquidity in the market.
Finally, banks prefer loans to bonds, as loans can be
carried to their balance sheets without being marked
to market (CFSR, 2008).
On the supply side, the high cost of borrowing
via debt instruments vis-à-vis other forms of raising
finances and inadequate liquidity in the corporate debt
market deter firms from market issuances. The large
corporates can raise debt from the overseas markets,
the cost of which, even after adjusting for hedging
cost, tends to be lower than the cost of borrowing
through the domestic market-based sources (Singh,
Development of corporate bond market in India remains crucial for meeting the financing requirement of industry and infrastructure sector. Despite various initiatives undertaken in the past, there is little change in the overall market microstructure of the corporate bond market in India. At this backdrop, this article explores the available statistics on corporate bond market in India during recent times (2010-18) to analyse the various demand and supply side factors, which impede the growth of corporate bond market in India. It is found that the gradual increase in proportion of market-based sources in total debt financing by non-financial companies is confined only to the larger-sized firms. Though finance and infrastructure companies dominate the corporate bond market, mutual funds are playing an important role in diversifying the issuance base of the market. Empirical analysis suggests significantly higher risk-premia associated with lower-rated bonds in the private placement market.
Introduction
Development of a vibrant market for long-term
debt is crucial for meeting the financing requirements
of private business, and especially so in the context
of the physical infrastructure needs of a rapidly
modernising economy. However, despite various
initiatives taken in the past1, the growth of the
corporate bond market in India still remains far from
satisfactory. Corporate debt to GDP ratio in India stood * The article is prepared by Shromona Ganguly, Research Officer, Division of Financial Markets, DEPR. The views expressed in this study are personal and do not represent the views of the Bank.1 The various initiatives undertaken by SEBI for expansion of corporate bond market include, inter alia, information repositories developed by exchanges and depositories for providing consolidated statistics, electronic book building mechanism for increasing transparency in the private placement market, tri-party repo trading on exchanges for facilitating liquidity and price discovery in the market, improving liquidity in secondary market trading through consolidation and re-issuances by the same borrower under the minimum number of International Securities Identification Numbers (ISINs) (Patil, 2004; SEBI, 2016, 2017, 2018, 2018a).
2 The prudential norms for investment for the insurance companies and pension funds stipulates a maximum of 25 per cent of the portfolio of these companies to be invested in bonds which are rated less than AA.
India’s Corporate Bond Market:Issues in Market Microstructure*
article
RBI Bulletin January 201920
India’s Corporate Bond Market: Issues in Market Microstructure
2007). Other key operational impediments include
small outstanding stock of individual issuances
inhibiting secondary market trading, non-availability
of functional trading platform with central counter
party (CCP) facility, illiquid market for credit default
swaps (CDS), and non-uniform stamp duties on
corporate bonds across various States.
Against this backdrop, this article attempts to
redress the imbalance in the literature in the form
of relative neglect of the corporate debt market in
an analytically meaningful manner. Notwithstanding
challenges in data, the article attempts to provide a
holistic view of the corporate debt market in India by
examining the financing pattern of non-financial firms
in India and by consolidating the non-standardised
available data on corporate bonds issuance.
The rest of the article is divided into six sections.
Section II presents a cross-country comparative
assessment of corporate debt markets with a view to
draw lessons from country experiences. Section III
analyses various sources of debt of non-financial firms
in India. Section IV provides a brief description of the
nature of issuance of corporate debt in India and also
looks into the role of mutual funds in diversifying
the issuer base in recent years. Section V addresses
the basic features of the private placement market for
corporate debt in India with an attempt to empirically
pin down the factors that determine the risk-premia
and coupons on various categories of corporate bonds
in it. Section VI ends the article with some concluding
observations.
II. The Country Experience
Most emerging market economies (EMEs),
especially in Asia, have bank-dominated financial
system with Government-owned development finance
institutions channelising resources to specific sectors of
the economy in consonance with the overall industrial
policy and developmental agenda. Specific examples
include the Brazilian Development Bank (BNDES) in
Brazil, Japan Development Bank in Japan, and the Korea
Development Bank in South Korea which played crucial
roles in post war reconstruction and development of
state-sponsored industries. Till the 1990s, the bank-
dominated financial system remained the cornerstone
of export-oriented industrialisation in East Asia. It was
the East Asian crisis of 1997-98 that brought forward
the urgent need to develop financial markets to cater
long term financing needs of an ebullient and dynamic
corporate sector. With the banking sector severely hit
by the asset-liability mismatches and high foreign debt,
excessive dependence on the banking sector gave way
to the development of a well-diversified debt market,
specifically for corporate bonds, to supplement the
availability of bank finance. The Asian financial crisis
brought into forefront the fact that bond market and
banks need not compete with each other, rather they
could be supplementing each other in serving the
financing needs of large and small firms (Gyntelberg,
et al., 2006).
In India, development banks were gradually
converted into universal banks, based on the
recommendations of the Report of the Working Group
on the Development Financial Institutions (DFIs)
(RBI 2004). In this milieu, developing the corporate
bond market assumes crucial importance for India,
especially in the context of channeling funding
to long term infrastructure, the requirement of
which has been estimated at around US$ 4.5 trillion
with cumulative infrastructure investment gap of
US $ 526 billion till 2040 (Economic Survey 2017-18).
Currently the corporate debt to GDP ratio in India is
significantly lower than some developing countries
such as Malaysia, South Korea, Brazil and Turkey
(Table 1). Further, the total volume of trade in the
secondary market for corporate debt has increased at
a modest pace, with the monthly total traded value of
corporate bonds standing at `1,210 billion in October
2018.

article
RBI Bulletin January 2019 21
India’s Corporate Bond Market: Issues in Market Microstructure
The relatively less developed market for
corporate debt in India is also reflected in the nature
of financing of India’s non-financial firms relative
to other countries. In India, the proportion of firms
using banks as the primary source of working capital
is higher than most developing countries (Table 2).
Further, the proportion of loans requiring collaterals
as well as the value of collateral (as proportion of
loan) are among the highest in India. This indicates
the prevalence of asset-backed lending in India,
which is essentially a feature of a relatively less
developed financial system with limited expertise to
gauge the credit risk of unsecured lending (Banerji,
et al., 2012).
III. Activity in India’s Corporate Debt Market
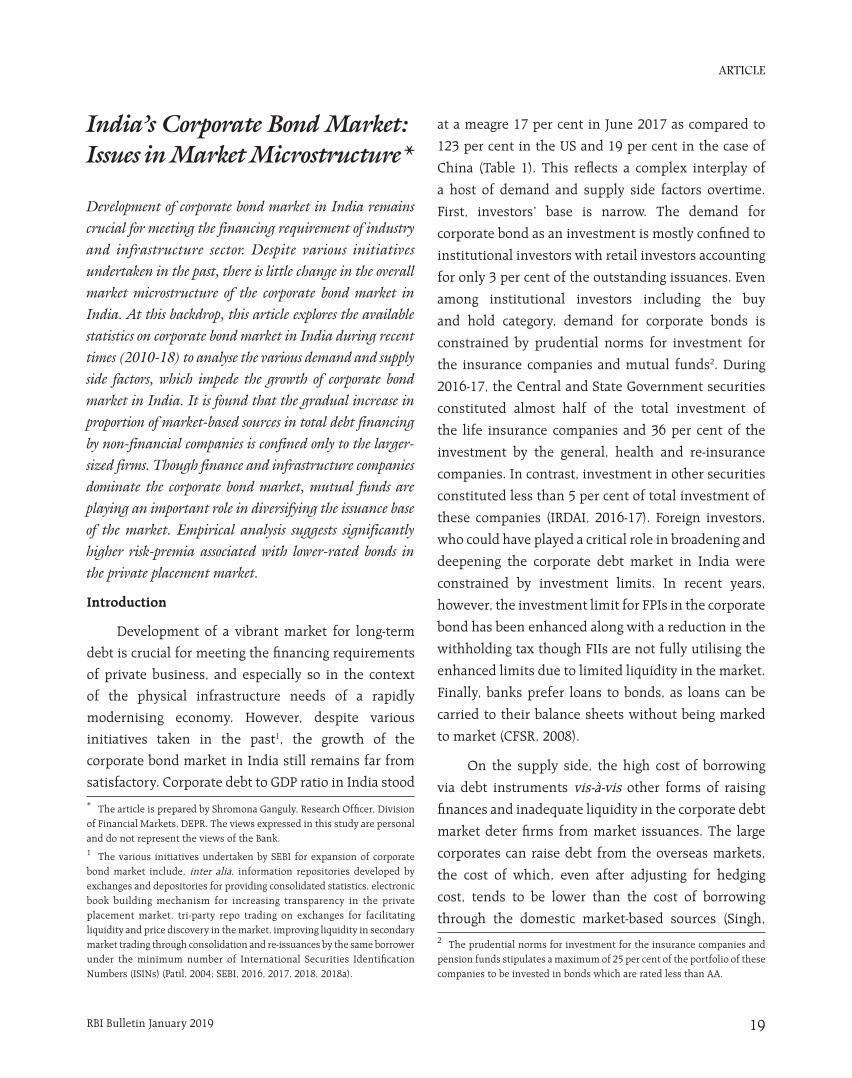
An analysis of the debt portfolios of non-financial
firms in India provides insights into sources of debt
and its composition as it has evolved over time. Over
the last decade, there has been a gradual increase in
the proportion of debt raised through market-based
sources like bonds, debentures and commercial paper
(CPs), though banks accounted for close to 45 per cent
of total debt of these firms (Chart 1). Further, almost 75
per cent of the total bank borrowings in the recent years
was secured. The share of other non-bank non-market
based sources of debt, such as loans from promoters
and inter-corporate loans moved in the range of 2-4
per cent, while foreign currency borrowings accounted
for 14 per cent of total debt.
Preliminary analysis of the sources of debt across
various size-categories among non-financial firms
(represented by deciles where decile 1 consists of the
largest companies and decile 9 comprises the smallest
ones) reveals that the preference for market based debt
is confined to the larger non-financial firms. The share
of market-based sources in total debt was less than 6
per cent for the size categories 3-9 and only for the
largest two size categories, i.e., 1-2, the share of market-
based sources was around 27-28 per cent (Table 3). For
the smaller-sized firms, many of which may lack credit
rating and the economies of scale enjoyed by the larger
Table 2: Bank Debt of Private Business Sector
Country (Year) Proportion of loans requiring
collateral (%)
Value of collateral
needed for a loan (% of the loan amount)
Proportion of firms
using banks to finance
investments (%)
Proportion of investments
financed internally (%)
Proportion of firms using
banks to finance working
capital (%)
Proportion of working capital
financed by banks (%)
China (2012) 77.6 197 14.7 89.6 22.1 6.4
India (2014) 84.7 255.1 30.3 71.8 36.4 17.8
Indonesia (2015) 80.4 241.1 36.6 66.0 32.0 9.9
Philippines (2015) 51.0 156.7 12.4 81.2 12.4 5.1
Russia (2012) 84.2 154.0 11.3 84.3 21.3 8.1
South Africa (2007) 71.2 103.6 34.8 68.5 21.1 7.1
Thailand (2016) 93.4 320.1 15.3 86.4 28.9 15.4
Turkey (2013) 28.9 199.2 44.2 61.0 42.4 16.0
Source: Enterprise Survey, World Bank.
Table 1: Corporate Debt Market Penetration (as per cent of GDP)-June 2018
Countries Corporate Bonds to GDP Ratio
US 123.47
China 18.86
Japan 14.57
South Korea 74.30
Singapore 34.02
Malaysia 44.50
India 17.16
Brazil* 99.05
Turkey** 142.06
*: Data pertains to 2014; **: Data pertains to 2015.Sources: Crisil-Assocham Report (January 2018) and IMF Private Debt Database.
article
RBI Bulletin January 201922
India’s Corporate Bond Market: Issues in Market Microstructure
firms in the private placement market, banks remain
the primary source of debt funding. Data on issuances
of corporate bonds corroborate these observations.
In addition, the composition of debt varied
significantly across entity types and various age
categories. During 2017, the share of market-based
sources in total debt was higher for public companies
(22 per cent) than private (10 per cent). Market-based
sources accounted for a smaller proportion of total debt
of firms that came into operation after 1991 (Table 4).
This indicates that the corporate debt market is mostly
accessed by relatively larger and established firms.
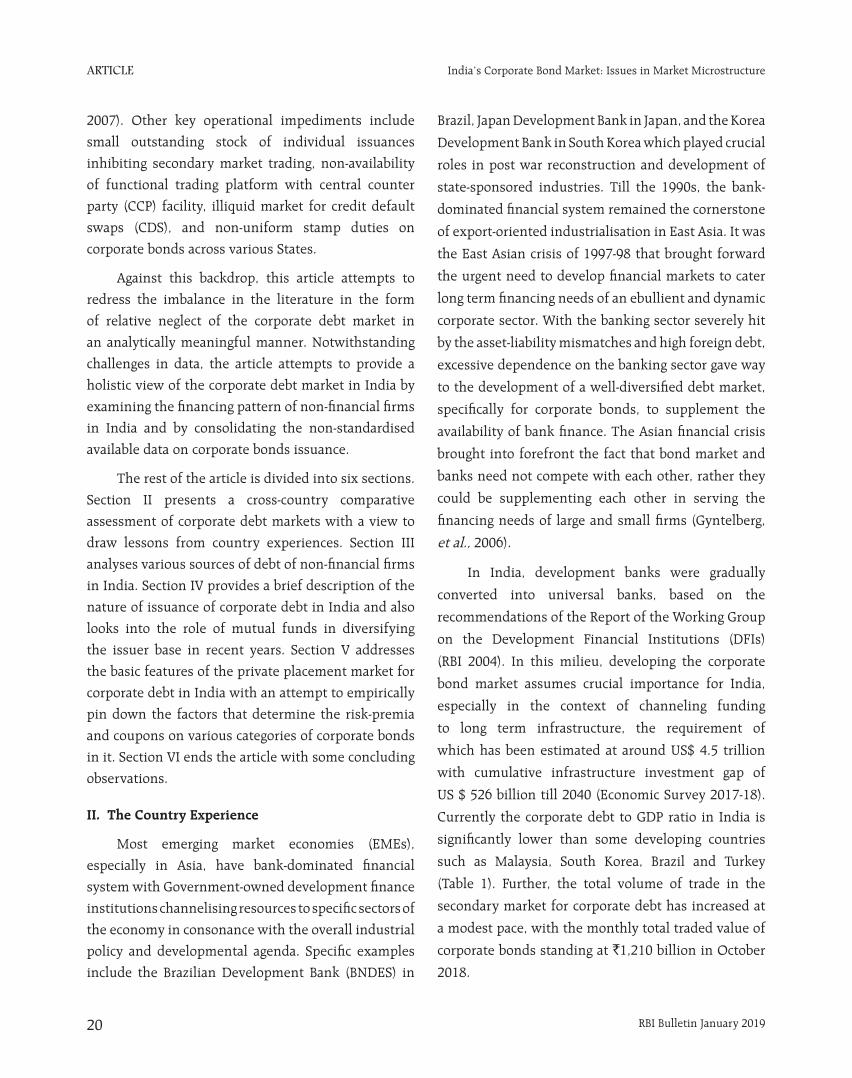
In the case of financial companies, the proportion
of debt raised through debentures and bonds stood at
around 28-30 per cent of their total debt. However,
like non-financial companies, the higher proportion
of debentures and bonds in total debt financing is
confined to larger-sized financial companies (Chart 2).
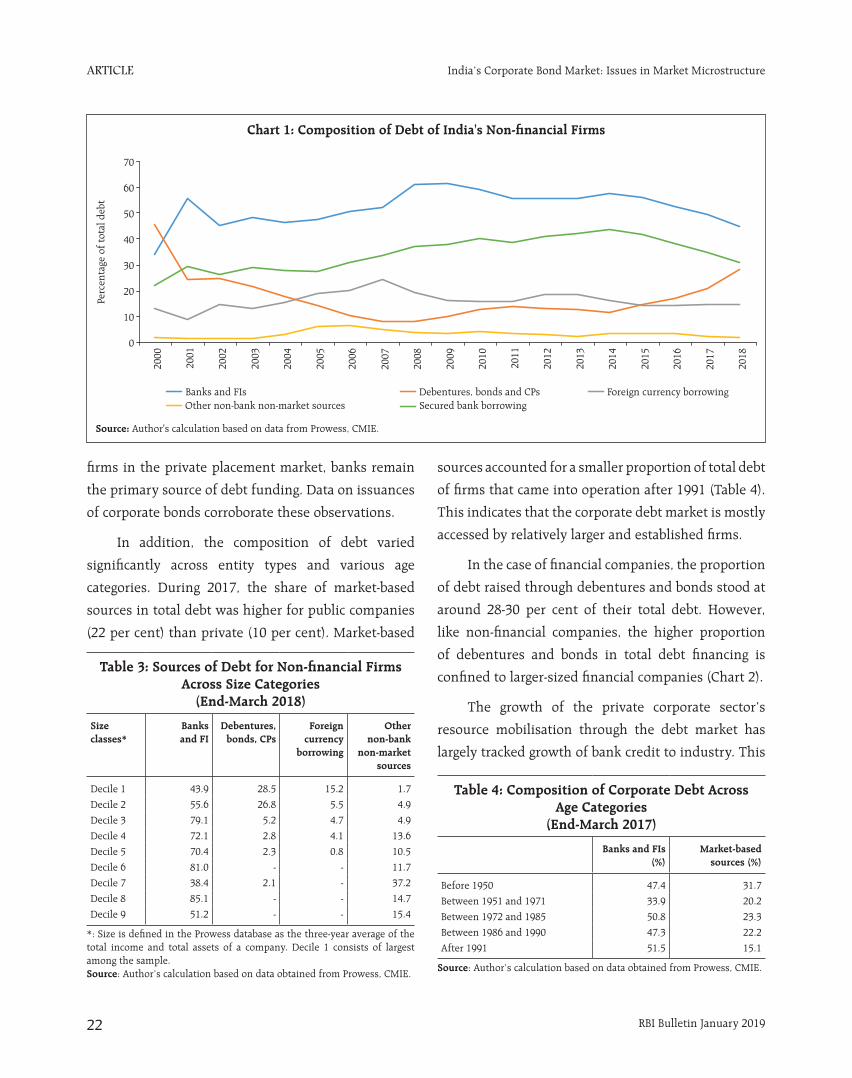
The growth of the private corporate sector’s
resource mobilisation through the debt market has
largely tracked growth of bank credit to industry. This
Table 4: Composition of Corporate Debt Across Age Categories
(End-March 2017)
Banks and FIs (%)
Market-based sources (%)
Before 1950 47.4 31.7
Between 1951 and 1971 33.9 20.2
Between 1972 and 1985 50.8 23.3
Between 1986 and 1990 47.3 22.2
After 1991 51.5 15.1
Source: Author’s calculation based on data obtained from Prowess, CMIE.
Table 3: Sources of Debt for Non-financial Firms Across Size Categories
(End-March 2018)
Size classes*
Banks and FI
Debentures, bonds, CPs
Foreign currency
borrowing
Other non-bank
non-market sources
Decile 1 43.9 28.5 15.2 1.7
Decile 2 55.6 26.8 5.5 4.9
Decile 3 79.1 5.2 4.7 4.9
Decile 4 72.1 2.8 4.1 13.6
Decile 5 70.4 2.3 0.8 10.5
Decile 6 81.0 - - 11.7
Decile 7 38.4 2.1 - 37.2
Decile 8 85.1 - - 14.7
Decile 9 51.2 - - 15.4
*: Size is defined in the Prowess database as the three-year average of the total income and total assets of a company. Decile 1 consists of largest among the sample. Source: Author’s calculation based on data obtained from Prowess, CMIE.
article
RBI Bulletin January 2019 23
India’s Corporate Bond Market: Issues in Market Microstructure
is possibly due to the fact that more than 80 per cent of
the total credit issued by banks to the industrial sector
are to large firms, which also raise resources from the
debt market (Chart 3).
The total resource mobilisation by Indian
corporates through public/private/rights issues is
dominated by debt while equity accounts for close
to 38 per cent. The most notable feature of the debt
market is that bulk of the debt (close to 99 per cent)
is placed privately, which has not changed despite
various measures taken by the regulators in the past.
IV. Activity: Primary and Secondary Market
Sector-wise breakup of issuances in the primary
market for corporate debt shows the dominance
of finance and infrastructure companies, which

article
RBI Bulletin January 201924
India’s Corporate Bond Market: Issues in Market Microstructure
together accounted for 90-92 per of total cumulative
value outstanding during 2017-19. The share of
manufacturing was less than 1 per cent. In the primary
market, the bulk of bonds issued were 2-5 year tenor
range (56 per cent). The highest rated bonds (AAA
rated) accounted for more than half of total amount
outstanding in the primary segment during the last
two years (Table 5).
The secondary market exhibits a similar
sector-wise and rating-wise composition with finance
and infrastructure companies together constituting
around 80 per cent of the total traded value (Chart 4).
Similarly, the highest rated bonds accounted for close
to 80 per cent of the total secondary market trading
(Table 6).
The higher concentration of high-rated bonds in
the corporate debt market could be attributed to low
market bandwidth and limited investors’ appetite for
bonds with high risk-return combinations. It is also
observed that high-rated bonds have significantly
lower spread vis-à-vis non-investment grade bonds
(Chart 5).
In the primary market, the top 5 issuances in terms
of value accounted for 53 per cent of the total value of
issuances in November 2018. The high concentration
Table 5: Rating-wise Composition of Bond Issuance: Primary Market(Per cent to Total)
Year/Rating AAA AA A A1 BBB BB B C NA Total
2017-18 48.2 19.8 3.7 0.0 1.0 0.4 0.1 0.0 26.6 100.0
Apr-18 20.7 21.0 4.6 0.8 1.4 1.1 0.0 0.5 49.9 100.0
May-18 76.4 9.8 0.7 0.0 0.9 0.3 0.0 0.0 11.9 100.0
Jun-18 64.7 9.3 1.6 0.0 6.6 2.5 0.0 0.0 15.4 100.0
Jul-18 17.0 69.1 3.0 0.0 0.1 0.2 0.0 0.0 10.6 100.0
Aug-18 70.1 18.8 0.7 0.2 2.2 0.1 0.0 0.0 8.0 100.0
Sep-18 64.4 6.3 2.0 0.3 1.0 0.0 0.0 0.0 26.0 100.0
2018-19 (Upto November) 56.4 18.3 2.2 0.1 1.8 0.6 0.0 0.1 20.5 100.0
Source: CCIL.

article
RBI Bulletin January 2019 25
India’s Corporate Bond Market: Issues in Market Microstructure
is also reflected in the secondary market with top 25
traded bonds accounting for roughly one-third of total
traded volume (Table 7).
The mutual funds (MF) industry has played
an important role in the development of corporate
bond market in India by catalysing innovation, price
discovery, liquidity and transparent bond valuation.
Further, MFs have also played a crucial role in promoting
secondary market trading of corporate bond since all
other categories of investors generally hold the bonds
till maturity. Assets under management (AUM) of short-
term debt funds, which are the largest investors in the
corporate debt segment, have increased at a rapid pace
with corporate bonds and CPs accounting for close to 77
per cent of total funds deployed (Chart 6). Investment
in government securities (G-secs) accounted for only 6
per cent of their total funds by contrast.
Sector-wise, bonds issued by real estate, NBFCs
and PSUs constitute about 1 per cent, 19 per cent and
23 per cent, respectively, of the total investment in
corporate bonds by the debt MFs. Interestingly, the
“other”3 category accounts for close to 57 per cent,
Table 6: Rating-wise Composition of Traded Volume in the Secondary Market
Year Total Amount (Rs Crore) Proportion
AAA Below BBB Total AAA Below BBB/Non-investment
2008-09 1,07,549 22,282 1,45,828 73.75 15.28
2009-10 2,94,268 59,285 4,02,157 73.17 14.74
2010-11 3,79,542 1,03,081 5,98,604 63.40 17.22
2011-12 4,10,152 1,31,281 5,91,979 69.28 22.18
2012-13 4,10,581 2,30,744 7,36,348 55.76 31.34
2013-14 6,96,917 1,17,902 9,72,156 71.69 12.13
2014-15 7,16,087 1,27,264 10,13,504 70.65 12.56
2015-16 5,76,773 1,39,785 9,05,333 63.71 15.44
2016-17 5,78,952 4,01,231 11,24,988 51.46 35.67
2017-18 8,33,499 2,51,384 13,50,033 61.74 18.62
2018-19 (Upto November) 4,82,637 51,042 6,65,611 72.51 7.67
Source: CCIL
Table 7: Share of Top 25 Traded Bonds
Year Top 25 traded bonds:
volume traded (` crore)
Totalvolume traded
(` crore)
Average yield of top
25 traded bonds
Proportion of top 25 in total traded
volume
2010 23,277 66,276 7.3 35.1
2011 23,583 49,834 9.5 47.3
2012 20,636 51,227 9.6 40.3
2013 20,358 82,044 9.1 24.8
2014 29,257 75,032 9.6 39.0
2015 19,746 80,081 8.7 24.7
2016 23,990 85,557 8.6 28.0
2017 40,582 1,45,994 8.1 27.8
2018 (Nov) 43,145 86,239 8.7 50.0
Note: For all other years, data pertain to March.Source: CCIL.
3 Bonds issued by companies in sectors other than Real estate and NBFCs.
0
200
400
600
800
1000
1200
2011
-12
2012
-13
2013
-14
2014
-15
2015
-16
2016
-17
2017
-18
2018
-19
Highest safety (AAA) Moderate safety (BBB)Non-investment grade
Chart 5: Corporate Bond Spread (Average)across Rating
Basi
s po
ints
Source: CCIL.

article
RBI Bulletin January 201926
India’s Corporate Bond Market: Issues in Market Microstructure
indicating the important role being played by the MFs
in creating demand for bonds with high risk-return
combination (Chart 7).
V. The Private Placement Market
Despite the predominance of private placement
in India’s corporate debt market, there has been
little research on the functioning of this segment,
mainly due to lack of detailed data. Intuitively, the
predominance of private placements implies that all
the characteristics of a well-developed market do not
exist and prevailing conditions reflect an information-
intensive relationship-lending market in which
investors act like banks in collecting information
pertaining to the borrower, which is not publicly
available (James and Smith, 2000). However, the

article
RBI Bulletin January 2019 27
India’s Corporate Bond Market: Issues in Market Microstructure
major difference between bank lending and private
placement of debt is that in private placement
market, insurance companies are the major players
as they find investment in such markets attractive
due to long-term and fixed nature of their liabilities.
As a result, the nature of lending in terms of tenure
and information asymmetry prevailing differs
significantly from the bank loan market (Carey, et al.,
1994).
It is interesting to note that secured lending
accounted for close to half of the total amount raised
even in the private placement market of corporate debt
(Chart 8). The private placement market for corporate
debt is dominated by private financial companies
which account for 47 per cent of the total amount
raised during the period 2015-16 to 2017-18.
The average tenure of bonds is 4.8 years and
is higher for public companies than their private
counterparts. The coupon rates for the private
companies were higher as compared to the public ones,
implying differences in risk perception. The coupon
rate is highest for private non-financial companies
(Table 8).
A comprehensive analysis of how bonds are
priced in the case of private placement is often
hampered by non-availability of detailed and uniform
data on privately placed corporate bonds. However,
based on the available data, an attempt has been made
to understand how the coupon rates in the private
placement market is impacted by terms of the loan,
security-specific factors as well as the general interest
rate environment. More specifically, an attempt has
been made to empirically understand whether the
positive relationship between risk and return holds
Table 8: Private Placement Market Structure: 2015-16 to 2017-18
Ownership/Activity Sum of Amount
Raised (` crore)
Proportion Average Tenure
(in Years)
Average Coupon Rate (%)
1. Private 11,29,876 64.2 4.5 9.3
1.1 Financial 8,33,991 47.4 4.1 9.1
1.2 Non-Financial 2,95,884 16.8 6.2 9.8
2. Public 6,29,985 35.8 8.5 8.1
2.1 Financial 4,65,934 26.5 8.3 8.2
2.2 Non-Financial 1,64,051 9.3 9.1 8.0
Total 17,59,860 100.0 4.8 9.2
Source: Author’s calculation based on data obtained from BSE, NSE, merchant banks.

article
RBI Bulletin January 201928
India’s Corporate Bond Market: Issues in Market Microstructure
in the private placement market for corporate debt as
well.
Based on the available data, empirical analysis
of the determinants of coupon rate in the private
placement market warrants the consideration of two
sets of key variables i) security specific characteristics
such as riskiness of the security, sector (private/
public), nature of operation (financial/non-financial),
tenor, and nature of lending (secured/unsecured);
ii) macro-variables reflecting the general interest rate
environment and spread of AAA rated corporate bonds
over the benchmark 10 year G-sec rate as indicative
of market perception of riskiness of corporate bonds.
Ratings assigned by the rating agencies are taken as an
indicator of the riskiness of the bonds. Often bonds are
rated by more than one rating agency and the existing
literature does not suggest any specific methodology
to compare the ratings by various agencies. In the
absence of a standardised procedure, this article
adopts the following approach: bonds are classified
into three classes according to their riskiness. Bonds
with AAA rating by any agency are considered as the
safest instrument in the market followed by all bonds
which are rated less than AAA but still fall under the
“A” category. The remaining bonds, i.e., bonds rated
BBB or below or unrated are grouped as relatively risky.
In cases a bond has been rated by more than one rating
agency, the lowest of ratings is used.
Over the period 2015-2018, the coupon rates of
privately placed bonds are estimated as a function
of the tenure of the bond, the nature of ownership
(private/public), the area of operation (financial/non-
financial), nature of lending (secured/unsecured), and
the bond’s riskiness measured by the bond’s rating,
as explained earlier. PUBLIC, FINANCIAL, SEC are
three dummy variables intended to capture the nature
of ownership, type of operation and category of
lending. The variables AAA and C are dummy variables
defined for the two classes AAA and the most risky
bonds, respectively, while the remaining category is
taken as the base. Variables used to capture the general
interest rate environment and market perception
about relative riskiness of the private bonds are the
10 year G-sec yield (GIND10) and the spread of the
AAA rated corporate bond (10 years) (CORPAAA),
respectively. Accordingly, the model specified below is
estimated.
COUPONit = ∝ + β1 TENUREit + β2 GIND10it + β3 CORPAAAit + β4 PUBLICi + β5 FINANCIALi +
β6 SECit + β7 AAAit + β8 Cit + β9 (TENUREit) *(PUBLICi) + β10 (TENUREit) *(FINANCIALi) + εit
The estimated coefficients have the expected
signs (Table 9). The coupon rate of the privately placed
bonds was found to be positively related with its
Table 9: Estimation Results
Variables Coefficient
TENURE 0.00532
(0.0075)
GIND10 1.352***
(0.0878)
CORPAAA 0.0130***
(0.00251)
PUBLIC -0.509***
(0.204)
FINANCIAL -0.394***
(0.082)
SEC -0.172**
(0.0982)
AAA -1.039***
(0.0491)
C 3.982***
(0.163)
Interaction dummy 1 -0.00917
(0.0076)
Interaction dummy 2 0.00368
(0.0085)
Constant -0.904
(0.737)
Observation 5,988
R-squareMean VIF
0.2732.93
Note: Heteroscedasticity-consistent robust standard errors in parentheses; The variance inflation factors (VIF) for all variables were less than 10, indicating that multicollinearity problem was not severe. ***: p<0.01, **: p<0.05, *: p<0.1.

article
RBI Bulletin January 2019 29
India’s Corporate Bond Market: Issues in Market Microstructure
tenure, indicating a higher risk-return combination for
longer term-bonds. However, the estimation results
suggest that the tenure of the bond is not a significant
factor determining its coupon, which could be due to
the pooling of data on bonds of various risk profiles.
Similarly, secured lending is associated with a lower
coupon rate, as expected. Further, the coupon rates
largely tracked the 10 year G-sec yield prevailing on
the day of the placement and the spread of the AAA
rated corporate bonds over the 10 year G-sec.
The coefficients of both PUBLIC and FINANCIAL
are negative and significant, implying a lower coupon
rate if a bond is issued by either a public or a financial
company, indicative of an implicit public guarantee in
the case of the former. Both AAA and C dummies are
significant indicating the riskiness of the bond is an
important factor in determining its coupon rate. The
structure of risk premia across various rating classes
indicates significantly higher risk-premia on lower
rated/unrated bonds. On an average, differences in
the coupon rates between the AAA rated bonds and
risky bonds (with rating BBB or below) was found to
be 5.02 per cent in the empirical results. Finally, the
two interaction dummies are found to be insignificant,
which indicates that the relation between coupon
and tenor of privately placed bonds does not vary
significantly across ownership or nature of operation.
To sum up, the results indicate that even in the private
placement market, investors have significantly higher
risk perception about low-rated bonds. This possibly
explains the reason for predominance of AAA rated
bonds in India’s corporate debt market.
VI. Concluding Observations
The overall market microstructure of the
corporate debt market in India is yet to evolve in terms
of enabling vibrancy and depth. Both the primary and
the secondary segments of the market continue to
be dominated by issuance of bonds by infrastructure
and financial services companies while the share of
manufacturing firms is negligible. The placement of
corporate debt remains largely private, accounting for as high as 98 per cent of the total amount raised, on an average. Coupon rates on various categories of bonds in the private placement market are influenced by several factors such as tenor, ratings, type of issuance, movements in the 10 year G-sec yield, and the overall market perception of riskiness.
Several policy measures can be considered to enhance the bandwidth of the market. Apart from rationalising the stamp duty on corporate bonds across States, development of a liquid market for CDS and steps to incentivise public issuance/listing warrant priority. Additionally, the investor base in the corporate bond market remains narrow due to high risk perceptions. In this context, the role of credit rating agencies (CRAs) in disseminating information on the issuers of corporate bonds remains critical. Credit rating agencies also help in identifying the presence of junk bonds in the market.
The enactment of the Insolvency and Bankruptcy Code (IBC), 2016, which replaces all the other resolution frameworks introduced earlier, is expected to strengthen investors’ confidence in the corporate bond market. The 2016-17 Union Budget announcement of setting up of Credit Enhancement Fund could leverage the access of the infrastructure companies into the corporate bond market, complemented by the large exposure framework laid down by the Reserve Bank. Going forward, the development of quasi-bond products and operationalisation of the 2018-19 Budget announcement mandating large corporates to raise 25 per cent of their funding need from the bond market could go a long way towards developing a vibrant and
liquid corporate bond market in India.
References
Banerji, S., Gangopadhyay, K., Patnaik, I., and Shah, A. (2012), “New thinking on corporate bond market in India”, NIPFP Working Paper No 2012-106. Available at https://nipfp.org.in/media/medialibrary/2013/04/WP-2012_106_0.pdf
article
RBI Bulletin January 201930
India’s Corporate Bond Market: Issues in Market Microstructure
Carey, M.; Prowse, S.; Rea, J.; Udell, G. (1994), “The economics of the private placement market”, Federal Reserve Bulletin 80(1), 5-6.
Committee on Financial Sector Reforms (CFSR) (2008), “A hundred small steps: report of the committee on financial sector reforms”, Planning Commission, Government of India,
Ministry of Finance (2008), “Economic Survey”, Government of India. Available at http://mofapp.nic.in:8080/economicsurvey/
Gyntelberg, J., Ma, G., and Remolona, E. (2006), “Developing corporate bond markets in Asia”. BIS Papers, 26, 13-21.
IRDAI (2017), “Annual Report 2016-17”, Available at https://www.irdai.gov.in/ADMINCMS/cms/frmGeneral_NoYearList.aspx?DF=AR&mid=11.1
James, C., & Smith, D. C. (2000), “Are banks still special? New evidence on their role in the corporate capital‐raising process”. Journal of Applied Corporate Finance, 13(1), 52-63.
Patil, R. (2004), “Corporate Debt Market: New Beginnings”. Economic and Political Weekly, 39(12), 1237-1246.
RBI (2004), “Report of the Working Group on Development Financial Institutions”, Available at https://www.rbi.org.in/Scripts/PublicationReport Details.aspx?UrlPage=&ID=387.
SEBI (2016), “Report of the Working Group on
Development of Corporate Bond Market in India”,
Available at https://www.sebi.gov.in/reports/reports/aug-2016/report-of-the-working-group-on-development-of-corporate-bond-market-in-india_33004.html
SEBI (2017), “Consultation Paper on Consolidation and
re-issuance of debt securities issued under the SEBI
(Issue and Listing of Debt Securities) Regulations,
2008”, Available at https://www.sebi.gov.in/reports/reports/feb-2017/consolidation-and-re-issuance-of-debt-securities-issued-under-the-sebi-issue-and-listing-of-debt-securities-regulations-2008_34120.html
SEBI (2018), “Expanding India’s Corporate Bond
Market: Bonds of Growth-Assessing the Supply
Demand Matrix”. Speech by Shri Ajay Tyagi, Chairman,
SEBI at CRISIL’s 5th Annual Seminar on October 24,
2018. SEBI Bulletin, November 2018.
SEBI (2018a), “Consultation Paper Designing a
Framework for Enhanced Market Borrowings by
large Corporates”, Available at https://www.sebi.gov.in/reports/reports/jul-2018/consultation-paper-for-designing-a-framework-for-enhanced-market-borrowings-by-large-corporates_39641.html
Singh, B. (2007), “Corporate choice for overseas
borrowings: The Indian evidence”, RBI Occasional Paper, Volume 28, No 3, Winter 2007.