india’s challenge to modernize agriculture€¦ · · 2011-11-20at a rate of about 2.5%, ... of...
TRANSCRIPT

Click here for Full Issue of EIR Volume 12, Number 24, June 18, 1985
© 1985 EIR News Service Inc. All Rights Reserved. Reproduction in whole or in part without permission strictly prohibited.
�ITillFeature
India's challenge to modernize agriculture by Susan and Ramtanu Maitra
In less than four decades as a sovereign nation, India can meet its basic food requirements. Considering the large population and the devastated condition in which the British left the country's economy in 1947, this is not an insignificant achievement. Moreover, during these 38 years, India has built up a broad industrial base and a scientific capability Which, while in«onsistent, is admirable for a developing nation. But the appalling poverty in which 80 percent of the country's 700 millions still live, attests to the economic challenge the new Gandhi govet:n-ment faces.
.
In spite of the achievements of production self-sufficiency, it is precisely agriculture which needs priority attention today to begin to turn the situation around. With the exception of certain pockets where the basic ingredients- for modem agriculture, including education of the farmers, have been put in place, Indian agriculture is a low-productivity sector where hundreds of millions-fully 70% of the work force-toil with very little incentive. The agricultural Sector as a whole remains the least remunerative and, even in comparison to other developing countries, among the least productive in the world.
The effect on the overall economy is devastating. The huge subsistence agriculture sector sits like a sacred cow, heavy and inert, defying change. Industry, scientific endeavour and high-technology projects bother this immovable object here and there like ticks. The dumb beast eats up large amounts of working capital with no tangible result in terms of profit for reinvestment, for expansion of marketS, and for improvement of living standards.
In addition to generating a surplus, raising agriCUltural productivity will enable (and require) the generation and expansion of agro-industries, creating employment opportunities that are a conveyor belt into the skills and work habits of industry for increasing-numbers of the agriCUltural population. This is the definition of "modernization" for the economy as a whole.
That it can be done has already been demonstrated in the "Green Revolution" push of the late 1960s that created high-productivity agriculture in the PunjabHaryana-Western Uttar Pradesh region and a few smaller areas. But precisely
26 Feature EIR June 18, 1985

because these areas were limited and localized, the effect of the agricultural transformation was lost on the overall economy, and the result instead was economic as well as social distortions. The larger economy and the population has been unable to "cash in" on the breakthroughs.
Today a new push needs to be made to establish agriculture, once and for all, as a productive sector across the length and breadth of the country. To do that, a number of problems will have to be confronted and solved. The only area of agriculture where India has done as much as any other country is in agricultural science, at least for cereals. But water management, fertilizer, pesticides, farm mechanization, and infrastructural backup are all visibly lacking.
The case of edible oil, used for cooking oil, efficiently demonstrates the problem and its implications. Atl the time of Independence, India was self-sufficient in oilseed p�oduction. In 1970, India was importing about $25 million worth of edible oils. As of today this figure has ballooned to eat up $1.4 billion worth of foreign exchange annually-the equivalent of importing a turnkey 1400 MW power plant every year!
It is easy to see what went wrong on the ground. In 1955-56 oilseed production averaged 474 kg/hectare. While the population has doubled since then, productivity rose by only 45%. According to Indian agroscientist and one of the key men in India's Green Revolution Dr. M.S. Swaminathan, the main cause of this is the fact that while oil seeds are energy-rich crops, in India they are cultivated largely under conditions of energy starvation. Oilseeds, consisting mainly of groundnuts, rapeseeds and mustard, are grown mostly in
EIR June 18, 1985
Upgrading agricult,ural technoltJgy.' a priority for the Gandhi government. India's farming is among the least productive in the world. That this can be achieved, is demonstrated by the Green Revolution of the 1960s, which created highproductivity agriculture in several regions of the country.
marginal and sub-marginal lands where the producer's capacity to invest in crop production and to bear risk is limited. One study shows that oilseed production never achieves more than 50 percent of the potential yield, and in such states as Maharashtra, Uttar Pradesh, Andhra Pradesh, Kamataka, and Tamil Nadu, it is 30% or less. Nowhere in the country, including Punjab, does more than 28% of the area planted to oilseeds get fertilizer. Similarly, nowhere, with the exception of Punjab, is more than 10% of the land under oilseeds irrigated.
These problems are not unknown to India's economic planners. One can find any number of studies on the various angles and implications of each and every one. They are mentioned ritually and serially in plan after plan. And the technology and industrial-scientific resources to solve them are by and large there. But a lack of concerted effort, or political will, and the failure to concentrate resources to the task over the years has virtually institutionalized the problems.
Today a new cry has been added to the litany of excuses, . that of "resource constraints." But as the short survey that follows indicates, tht;! greatest "resource constraint" India faces is the systematic waste and squandering of resources which continue in the name of "the way things are here." No fault of the Indian population, this reflects the combination of a feudal mentality, intellectual dishonesty and cynicism. which has come to characterize the Indian elite. The Rajiv Gandhi government's commitment to bring India into the 21st century means tackling this first of all.
It is useful to briefly review the economic history of independent India to focus on the challenge as it confronts
Feature 27
the Indian leadership today. In the first half of the 20th century, under British colonial rule, India remained a strictly agrarian nation with almost no industry at all. What village industries existed were looted and destroyed by the British. The Indian people lived from hand to mouth. The British lived according to the principles of Thomas Malthus: They kept Indian agriculture traditional, backward, and at the mercy of natural vagueries. In the first 40 years of this century, the rate of growth of agriculture was less than 1 %. The famine of 1945, which claimed hundreds of thousands of lives, was the result of British colonial policies.
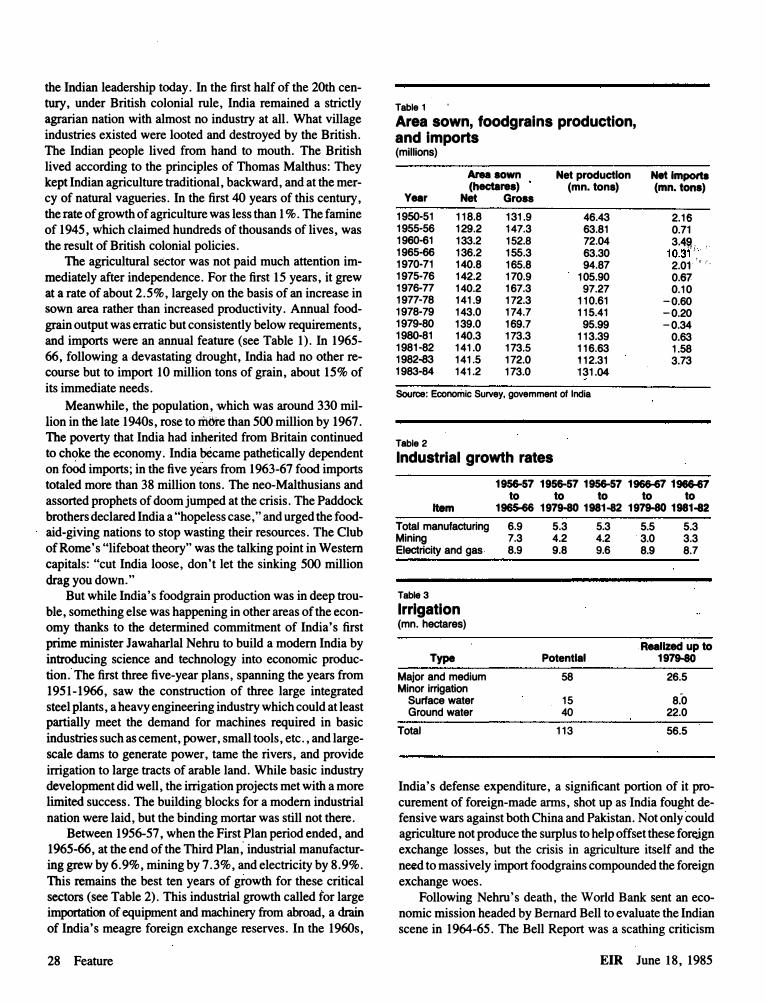
The agricultural sector was not paid much attention immediately after independence. For the first 15 years, it grew at a rate of about 2.5%, largely on the basis of an increase in sown area rather than increased productivity. Annual foodgrain output was erratic but consistently below requirements, and imports were an annual feature (see Table 1). In 1965-66, following a devastating drought, India had no other recourse but to import 10 million tons of grain, about 15% of its immediate needs.
Meanwhile, the population, which was around 330 million in the late 1940s, rose tom&-e than 500 million by 1967. The poverty that India had inherited from Britain continued to choke the economy. India became pathetically dependent on fOOd imports; in the five years from 1963-67 food imports totaled more than 38 million tons. The neo-Malthusians and assorted prophets of doom jumped at the crisis. The Paddock brothers declared India a "hopeless case," and urged the foodaid-giving nations to stop wasting their resources. The Club of Rome's "lifeboat theory" was the talking point in Western capitals: "cut India loose, don't let the sinking 500 million drag you down."
But while India's foodgrain production was in deep trouble, something else was happening in other areas of the economy thanks to the determined commitment of India's first prime minister lawaharlal Nehru to build a modem India by introducing science and technology into economic production. The first three five-year plans, spanning the years from 1951-1966, saw the construction of three large integrated steel plants, a heavy engineering industry which could at least partially meet the demand for machines required in basic industries such as cement, power, small tools, etc., and largescale dams to generate power, tame the rivers, and provide irrigation to large tracts of arable land. While basic industry development did well, the irrigation projects met with a more limited success. The building blocks for a modem industrial nation were laid, but the binding mortar was still not there.
Between 1956-57, when the First Plan period ended, and 1965-66, at the end of the Third Plan : industrial manufacturing grew by 6.9%, mining by 7.3%, and electricity by 8.9%. This remains the best ten years of growth for these critical sectors (see Table 2). This industrial growth called for large importation of equipment and machinery from abroad, a drain of India's meagre foreign exchange reserves. In the 1960s,
28 Feature
Table 1 Area sown, foodgrains production, and Imports (millions)
Area sown Net production Net Imports (hectares) (mn. tons) (mn. tons)
Year Net Gross
1950-51 118.8 131.9 46.43 2.16 1955-56 129.2 147.3 63.81 0.71 1960-61 133.2 152.8 72.04 3.4� , 1965-66 136.2 155.3 63.30 10.31 ' 1970-71 140.8 165.8 94.87 2.01
',;,
1975-76 142.2 170.9 105.90 0.67 1976-77 140.2 167.3 97.27 0.10 1977-78 141.9 172.3 110.61 -0.60 1978-79 143.0 174.7 115.41 -0.20 1979-80 139.0 169.7 95.99 -0.34 1980-81 140.3 173.3 113.39 0.63 1981-82 141.0 173.5 116.63 1.58 1982--83 141.5 172.0 112.31 3.73 1983-84 141.2 173.0 131.04
Source: Economic Survey, govemment of India
Table 2 Industrial growth rates
1956-57 1956-57 1956-57 1966-67 1966-87 � � � � �
Item 1965-66 1979-80 1981-82 1979-80 1981-82 Total manufacturing 6.9 Mining 7.3 Electricity and gas 8.9
TabJe3
Irrigation (mn. hectares)
Type Major and medium Minor irrigation
Surface water Ground water
Total
5.3 4.2 9.8
Potential
58
15 40
113
5.3 4.2 9.6
5.5 3.0 8.9
5.3 3.3 8.7
Realized up to 1979-80
26.5
8:0 22.0
56.5
India's defense expenditure, a significant portion of it procurement of foreign-made arms, shot up as India fought defensive wars against both China and Pakistan. Not only could agriCUlture not produce the surplus to help offset these forci.gn exchange losses, but the crisis in agriculture itself and the need to massively import foodgrains compounded the foreign exchange woes.
Following Nehru's death, the World Bank sent an economic mission headed by Bernard Bell to evaluate the Indian scene in 1964-65. The Bell Report was a scathing criticism
EIR June 18, 1985

of Nehru's policy, particularly the heavy industry development program. Malthusian cheerleaders and self-proclaimed experts from the World Bank-IMF descended on the country in an effort to bury Nehru's policy along with his vision of a modem, industrial India. In 1967, the World Bank-IMP forcq1 a drastic devaluation of the Indian rupee, and by 1968 India was -pllmged into an economic chaos which was unforeseen and, in fact, undreamt of, just a few years earlier.
In the face of this onslaught of busybodies, Indian leadership took a decisive step to solve the crisis: Nehri's policy of applying science and technology to production was applied to th�ftoundering agriCUltural sector. "Every country which has improved its agriCUlture has done so only through the introduction of science and technology into farming," Indian Agriculture Minister C. Subramaniam announced. "India cannotbe an exception." As a first step, agricultural research was reorganized on a mission-oriented basis and the traditional stranglehold of the bureaucracy was loosened. Breeding and introduction of new high-yielding varieties of seeds were the center of the policy, but to work the new seeds had to be combined with adequate water for irrigation and increased input of fertilizers. The package was pushed forward through the provision of credit to farm producers.
By 1970-71, the "Green Revolution" was securely rooted in the northwestern agricultural belt of India, in Punjab, Haryana, and Western Uttar Pradesh. After years of stagnation, agricultural output began to grow. By the early 1970s a few tractors, along with pumpsets, began to be visible in the farnilands. Fertilizer input, although negligible in comparison to actual soil needs, became a part of farming, and largescale extension services to educate the farmers in the fields fanned out from the state agricultural universities. The Paddock brothers and their Malthusian cohorts, it became clear, could be put out of business.
The crux of the task now is to raise prQductivity. This requires a concerted effort to not only extend the supply of
. HYV seeds and modern farming practices across the country, but also to make sure that the necessary energy inputs in the form of fertilizers, irrigation, mechanization, and power are provided to realize the productivity potential of the seeds.
India's total irrigable land is estimated to be 113 million hectares, of which about 50% has been achieved (see Table 3). The target figures are conservative, since in Uttar Prades� alone, another 20 million hectares which can be irrigated by groundwater have not been taken into account. On average, about 30% of the food crops are irrigated, and about 27% of the non-food crops (see Table 4). Still, it is not that India has not invested in irrigation. Over �e years, large sums of money. have been poured into building dams, reservoirs, irrigation channels, command area networks, and so on (see Table 5). But not even 20% of the major irrigation projects taken up since Independence have so far been completed. As many as 58 projects started in 1969 still remain to be put to full use. As many as 84 projects are expected to spill over to
EIR June 18, 1985
. Table 4 Irrigated area under food and non-food crops, 1980-81
Irrigated Land Irrigated '" of total Total area area '" of total
Crop (mn. ha)- (mn. hal crop area
Foodc� 128.0 37.61 29.4 Rice 4M3 16.34 4D.5 Wheat 22.25 15.52 69.8
Non-food- cro� 45.31 11.98 26.4 Groundnuts 6 .92 0.92 13.3 Cotton 7.86 2.13 27.1
TBble5
Public expenditures· on Irrigation (million u.s. dollars)
Irrigated ...
75.8 m 31.3
24.2 1.9 4.3
Malor and medium Minor Irrigation Irrigation
Average A".. Plans Total* annual Total annual
First Plan 300 138.5 76 35.1 Second Plan 380 .1.50.0 161 74.7 Third Plan 581 180.4 443 174.6 Annual plans 434 168.7 561 290.0 Fourth Plan 1,237 227.6 1,174 210.8 Fifth Plan 2,442 348.3 1,411 201.1 1978-79 9n 493.4 1,005 . 237.0 1979-80 1,079 470.4 1,005 237.0 Sixth Plan 8,448 736.6 3,510 306.0
• Current prices. t 1970-71 prices
the Seventh Plan (1985-90). Why? Part of the problem is a lack of understanding of economic
science and thus an inadequate grasp of the national interest. Large projects such as the Rajasthan Canal, the Gandak and Kosi projects in Bihar, the Tawa project in Madhya Pradesh, among many others, have been converted into employment safehouses where large numbers of menial laborers can be kept busy for years. In the meantime, project costs mUltiply; funds are sucked into the project and nothing comes out. A project designed to boost wealth-generation in the economy becomes a net drain on the country's resources instead.
In 1983 a Planning Commission Working Group found that the delay in the formulation,of proposals for the Sixth Plan was caused by the proliferation of projects resulting, in turn, in the spreading of financial, managerial, and technical resources too thin. The group also identified delays in taking decisions, difficulties in land acquisition, insufficient availability of essential inputs like steel, cement and explosives, and changes in the scope of projects as problematic features of project implementation. Some irrigation projects have cost six or seven times more than they should have-a lUXury
Feature 29

Table 6 Groundwater development and rural electrification (1979-80)
Groundwater development Villages Pumpset connection
State ('Yo of potential) electrified (thousands of units)
Northwest Punjab Haryana
Northeast Bihar Qrissa West Bengal
82 80
35 19 19
100 100
31 38 36
262 203
152 13 24
which no developing, or advanced for that matter, country can afford.
There are other problems in the way the irrigation projects are conceived to begin with. There are two principal crop seasons in the Indian subcontinent, the kharif(summer) and rabi (winter). Kharif crol>s, mostly rice, depends primarily on monsoon water and the rabi crops on surface and groundwater irrigation. The kharif crops are affected as much by the monsoon's abundance as by its weakness. Problems of flooding and waterlogging are pervasive and serious. A normal ",on soon brings enough floodwater through India's major rivers to damage crops to the tune of $400 million annually in some years, such as 1978.
Most of this water goes unused, through India's river system, into the sea. But while the challenge lies in improving drainage, and preservation and utilization of monsoon water for the dry season, as well as flood control, the major thrust of water policy has always been toward making the limited dry season water flow available to the rabi crop. R<;tbi production has been boosted considerably by this (see Table 6), but the gains to be realized in harnessing the monsoon waters for productive use are enormous.
This requires taking a broader, more comprehensive view of water management, as opposed to focusing on irrigation, or flood control, per se.
This broader view would have to incorporate domestic water requirements for clean drinking water, sanitation, and sewage treatment, which are now woefully lacking in spite of extensive irrigation works. This requires an integrated program to maximize the country's water resources-the monsoon, the mighty river systems, and the extensive groundwater supplies.
Currently, for example, there is not much consideration given to whether or not a particuiar water project forms an intregral part of a composite scheme involving the entire river basin. As far back as the 1930s, the National Planning Committee of the Indian National Congress had pointed this out. "Our conception must change," Congress planners said. "A
30 Feature
river should be regarded as one natural economic unit for the benefit of the whole community it can serve, in the full development of which political frontiers must not be allowed to influence."
Yet, even now, there does not exist a cqmprehensive plan to develop the Ganges River basin, one of the most fertile regions of the world which is equal to two Germanys, France, and Belgium put togetfier in size. Today more than 300 million people inhabit the Ganges basin, 70% of them eking out a subsistence living on the land; they could be producing enough food to feed most of the world's population. Onthe other 'hand, large irrigation projects are undertaken here. and there apparently largely under the impetus of narrow political considerations.
As far as the development of groundwater irrigation is concerned, the principle obstacle for farmers is a shortage of electric power and diesel fuel (see Table 6). The shortage of
. electric power is so acute, even in areas of the Northwest where electrification is extensive, that farmers have to stay up at night to run their pumps. Although high and broadbased growth in the pumpset industry has provided farm�rs with choices in the make, size, quality, and cost of equipment, the lack of technical information together with wide variation in the standards of equipment due to lack of quality control in the small-scale manufacturing sector where it is produced, act to sabotage the effectiveness of the equipment. ' Studies by the government's Agricultural and Rural Development Corporation indicate that, on average, less than 50% of the theoretically attainable technical efficiency is achieved. Improper maintenance and lack of after-sales service also play a major role in keeping efficiency low.
Many studies have proven that the most economical way to· irrigate land is through controlled irrigation, namely pumping of groundwater wherever available. One &tudy showed that returns to the economy and returns to the farmer from private investment for drawing groundwater in vanous states of India range from 15-50% and from 16-129% respectively. And India has a vast store of sweet underground water in both confined and unconfined aquifers. In Uttar pradesh alone, another 20 million hectares of prime land can be brought under irrigation in this way.
But to exploit this groundwater, measures must be taken to replenish or recharge the aquifers, to educate the farmers on using pumps, to develop compatible pumpsets with motors and other accessories, and to provide electrical power regularly and abundantly.
Not by irrigation alone ... It is evident from the performance of India's agricuiiural
sector that it is unbalanced, not only from the standpoint of o'Utput but also from the standpoint of inputs and infrastructural support. Irrigation is a perfect example of an overbloated sub-sector where a great deal of waste takes place. India as of now has 60 million-plus hectares under irrigation. While
EIR June 18, 1985

Table 7 Yield levels: national demonstration as against national average
NatIonal demonstration National average (I9nslha, 1977-78) (tonaJha, �982-83) Crop
RiCe (Unhusked) Wheat Maize Sorghum Mill_
Table 8
5.07 2.07 3.55 1.80 3.36 1.14 3.94 0.67 2.44 0.47
Per hectare yields and fertUlzer use of Asian nations
Yields (1982-83) (tonaIha)
fertilizer u .. (1982-83) (kg) Country Paddy Wheet (per hectare of arable land)
India 2.07 1.80 37.8 8urma 2.66 N.A. Bangladesh 1.98 1.85 43.6 China 4.24 1.95 150.1 Indonesia 3.61 N.A. RepubliC of
Korea 5.75 351.3
Japan 5.63 3.1 387.2 Pakistan 2.56 1.65 53.1 World
Average 2.86 1.92 78.5
N.A.: Not available
Table 9 Consumption of pesticides
Country
India Japan United States Europe (average)
(Grams per hectare)
400 1,047
1,490
1,870
it is essential that the country bring all possible irrigable land into full use, it must also be understoOd that 60 million hectares is a lot of land.
If those 60 million hectares were fully utilized, producing yields proven achievable in the 1977�78 National Demonstration (see Table 7), India wO\lld be producing upwards of 250 million tons .of grain from those 60 million hectares alone. That is nearly double current total grain production. To achieve this, ideal water conditions must be coupled with other energy inputs in the form of fertilizers and pesticides, farm mechanization, and infrastructure backup.
Fertilizer use in India still remains abysmally low (see
EIR June 18, 1985
Table 8). China, a comparable developing nation because of its size and population, uses four times the amount of fertilizer India uses per hectare of arable land. The Republic of Korea, with a highly developed agricultural sector, uses more than ten times the Indian average. In spite of such low use of fertilizers, India imports as much as 3 million tons-almost 27% of its total demand-annually. Since India does not have any potash, the entire amount is imported.
Indian fertilizer plants, 27 in all, have low capacity utilization-:.in most, less than 70%. The major reasons for the large loss of production are power shortages and equipment breakdowns, two factOrs which reinforce each other in a cycle of waste. While most of India's fertilizer plants use naptha as the feedstock, efforts are being made to use more natural gas and coal, which India has in abundance, for future plants. Though the two coal-based plants that have been installed are not functioning well, it would seem urgent to standardize
. these coal-based plants and make them a success. One of the major weaknesses in fertilizer planning is the
failure to develop the technology, the machinery, and equipment required for these plants. As a result, India is forced to import turnkey plants. This is not a bad idea in itself, but the failure then to utilize the plants to full capacity has converted a profitable investment into a double drain on the economy. Better in the long run-and considering that India needs to triple fertilizer output to reach a fertilizer use target that is only 75% of that in China today-,it is imperative to acquire and master the technology to manufacture fertilizer plants from the bottom up, including the many associated technologies, materials, and control instrumentation involved.
In the meantime, India should upgrade the commitment to the all-India project to develop biofertilizers. These bacteria help in biologically fixing nitrogen for plants. Already
, bacteria have been developed to effect Biological Nitrogen Fixation in legumes and rice. Some studies show· that using blue-green algae in rice cultivation saves about $30 per hectare in India. Similar studies are available for the use of Azospirillium biofertilizer for millet cultivation and Rhizobial biofertiliz�r in legume cultivation. All of these studies show that the use of biotertilizers reduces fertilizer intake, provides a substantial savings to the farmers, and can be successfully used by marginal farmers. This is one of the frontier areas in agricultural science which will help slow down the ever-increasing consumption of chemical fertilizers in the near future.
The scope of improvement in herbicide and pesticide use is even greater (see Table 9). Of about 200 herbicides registered for use in the developed countries, only 25 are registered in India, and of these, only 14 are now being used. Currently only 1 million hectares are under herbicide treatment, a figure which may go up to 2.5 or 3 million hectares during the Seventh Plan (1985-90). Overall use of pesticides is limited, about 30% of that used per hectare in the United
Feature 31
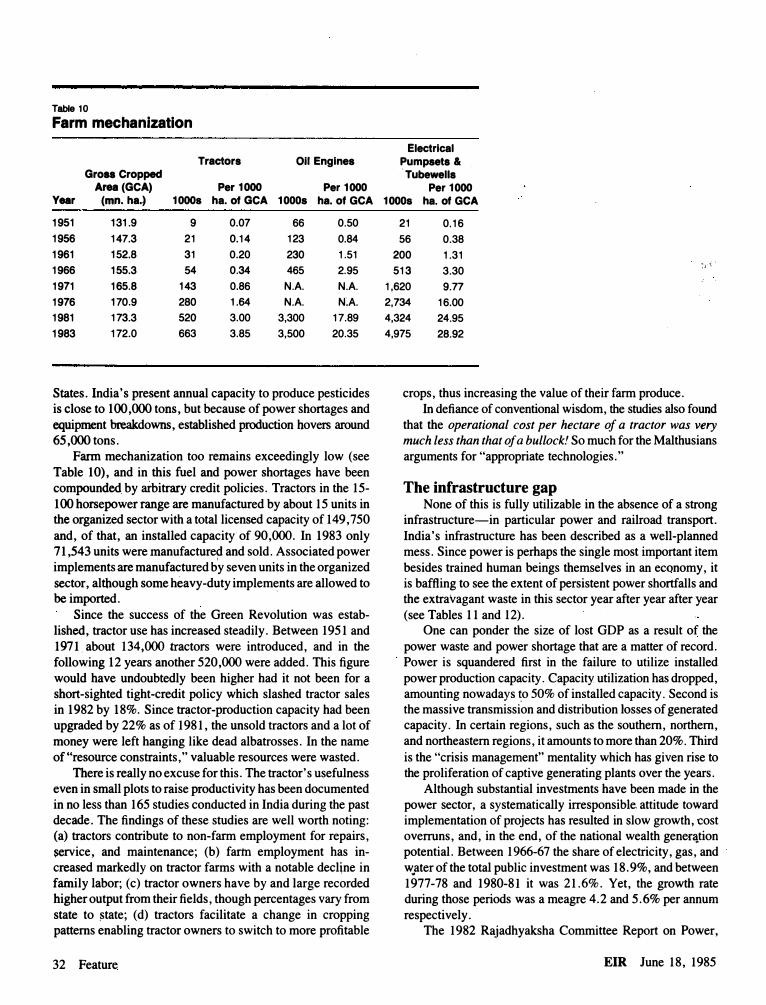
Table 10 Farm mechanization
Tractor. 011 Engine. Gro88 Cropped
Area (GCA) Per 1000 Per 1000 Year (mn. ha.) 1000. ha. of GCA 1000. ha. of GCA
1951 131.9 9 0.07 66 0.50
1956 147.3 21 0.14 123 0.84
1961 152.8 31 0.20 230 1.51
1966 155.3 54 0.34 465 2.95
1971 165.8 143 0.86 N.A. N.A. 1976 170.9 280 1.64 N.A. NA 1981 173.3 520 3.00 3,300 17.89
1983 172.0 663 3.85 3,500 20.35
States. India's present annual capacity to produce pesticides is close to 100,000 tons, but because of power shortages and equipment breakdowns, established production hovers around 65,000 tons.
Farm mechanization too remains exceedingly low (see Table 10), and in this fuel and power shortages have been compounded by arbitrary credit policies. Tractors in the 15-100 horsepower range are manufactured by about 15 units in the organized sector with a total licensed capacity of 149,750 and, of that, an installed capacity of 90,000. In 1983 only 71 ,543 units were manufacture� and sold. Associated power implements are manufactured by seven units in the organized sector, although some heavy-duty implements are allowed to be imported.
'
Since the success of the Green Revolution was established, tractor use has increased steadily. Between 1951 and 1971, about 134,000 tractors were introduced, and in the following 12 years another 520,000 were added. This figure would have undoubtedly been higher had it not been for a short-sighted tight-credit policy which slashed tractor sales in 1982 by 18%. Since tractor-production capacity had been upgraded by 22% as of 1981, the unsold tractors and a lot of money were left hanging like dead albatrosses. In the name of "resource constraints," valuable resources were wasted.
There is really no excuse for this. The tractor's usefulness even in small plots to raise productivity has been documented in no less than 165 studies conducted in India during the past decade. The findings of these studies are well worth noting: (a) tractors contribute to non-farm employment for repairs, �rvice, and maintenance; (b) fann employment has increased markedly on tractor farms with a notable decllne in family labor; (c) tractor owners have by and large recorded higher output from their fields, though percentages vary from state to �tate; (d) tractors facilitate a change in cropping patterns enabling tractor owners to switch to more profitable
32 Feature
Electrical Pumpaet. & Tubewell.
Per 1000 1000. ha. of GCA
21 0.16
56 0.38
200 1.31
513 3.30 -;"i .
1,620 9.77
2,734 16.00
4,324 24.95
4,975 28.92
crops, thus increasing the value of their farm produce. In defiance of conventional wisdom, the studies also found
that the operational cost per hectare of a tractor was very
much less than that of a bullock! So much for the Malthusians arguments for "appropriate technologies."
The infrastructure gap None of this is fully utilizable in the absence of a strong
infrastructure-in particular power and railroad transport. India's infrastructure has been described as a well-planned mess. Since power is perhaps the single most important item besides trained human beings themselves in an eCQnomy, it is baffling to see the extent of persistent power shortfalls and the extravagant waste in this sector year after year after year (see Tables 11 and 12).
One can ponder the size of lost GDP as a result of the power waste and power shortage that are a matter of record. Power is squandered first in the failure to utilize installed power production capacity. Capacity utilization has dropped, amounting nowadays �o 50% of installed capacity. Second is the massive transmission and distribution losses of generated capacity. In certain regions, such as the southern, northern, and northeastern regions, it amounts to more than 20%. Third is the "crisis management" mentality which has given rise to the proliferation of captive generating plants over the years.
Although substantial investments have been made in the power sector, a systematically irresponsible. attitude toward implementation of projects has resulted in slow growth, cost overruns, and, in the end, of the national wealth generl!,tion potential. Between 1966-67 the share of electricity, gas, and w.ater of the total public investment was 18.9%, and between 1977-78 and 1980-81 it was 2 1.6%. Yet, the growth rate during those periods was a meagre 4.2 and 5.6% per annum respectively.
The 1982 Rajadhyaksha Committee Report on Power,
EIR June 18, 1985

Table 11 Power: plan target and shortfalls
Installed Capacity (MW)
Shortfalls Plan perlQd Target Achievement (%)
First Plan (1951-56) 1,300 1,100 15.4
Second Plan (1956-61) 3,500 2,250 35.7
33.0
Third Plan (1961-66) 7,040 4,715
Three annual plans (1966-69) 5,430 4,381 19.3
Fourth Plan (1969-74) 9,260 4,681 50.2
Fifth Plan (1974-79) 12,500 10,200 18.4
Sixtl"! Plan (1980-85) 19,66E! 14,500 26.3
Table 12 Requirements and 'av�ilability of power
.. Requirements Availability Deficit In % Year (mn. KWH) (mn. KWH) of requirements
1975-76 83,508'· 74,909 10.3 1976-77 �8,489 83,365 5.8 1977-78 102,180 86,343 15.5 1978-79 108,538 97,349 10.3 1979-80 118,370 99,302 16.1 1980-81 120,118 104,932 12.6 1981-82 129,245 115,274 10.8 1982-83 9.2 1983-84 155,000 142,500 8.1
commissioned by the government, documented the astonishing cost �d time overruns principally responsible for this poor result. While cost overruns of hydropower projects ran as high as 698% (in the case of the Loktak station with three units of 35 MW each), the report showed, thermal power plant projects were only slightly better, every single one registered cost overruns from 40 to 140%. Time overruns for hydro projects averaged from 2 to 9 years. One project, a 240 MW unit, took fully 16 years to complete; another, the Gumti, which would produce 10 MW of electrical P9wer, took ten years to complete! Thermal power plants, again, have a slightly better record; with average time overruns of from 1-V2 to 2-V2 years.
If one simply adds up the cost overruns of these power projects, one finds that quite apart from the massive indirect resource waste, billions of dollars were drained out as menial wages to keep the projects going, while the farmers, industrial workers and the nation as a whole sat around waiting for power.
Most striking is the fact that this actually scandalous situation is not a political issue. Nobody made a peep over the fact that one section of the Beas-Sutlej Link, which pro-
EIR June J8, 1985
duces 240 MW of electrical power, had a cost overrun of more than $180 million and a time overrun of six years. But when the government introduced some tax exemptions to the corporate sector to stimulate investment into the 1985-86 budget amounting to some $100 million, the hue and cry was deafening!
India's extensive railroad network presents a similar picture. It is decrepit yet functional. The net ton kilometre per . wagon day-a measure of efficient handling of wagons on ttie rail track-in India is comparable and even better than that of Japan, France, Germany, and Italy, all developed nations. But from the point of future needs the high marks are useless. Since the early 1960s, investment in the railways never exceeded 5% of the total public investment. Today about $1 billion is spent annually to maintain the railroads and pay wages to the more than 1.8 million-member work force. Meanwhile, more than 85% of the more than 100,000 km of track remains non-electrified.
Now a new bottleneck; a planned bottleneck is emerging. Although Indian began developing nuclear power technology in the early 1960s, to this day it has not been given a sufficiently serious push; bureaucrats and planners continue to rely on coal for power generation. Naturally, the share of coal in total rail traffic is inCreasing and, along with the increase of average delivery leads, are beginning to paralyse the old railroad system. Furthermore, since Indian coal has a large ash content, its use for power generation is not only doubly taxing on the railroads, but it is inefficient for use in normal furnaces. Still, very little work has been done (0 develop the furnace that can handle such high-ash-content coal.
Land management These are the areas that need special attention in any
mission-oriented program to raise agricultural productivity in India. It should be stressed that along with building up technology, industry, and infrastructure, the proper use of land is a major factor in developing a strong agro-industrial economy. India has a vast amount of land under cultivation, and while the bulk of it must continue to produce foodgrairis and oilseeds, with increased productivity, a significant portion of it can be made available for producing cash crops such as cotton, sugar, tobacco, coffee, etc. These crops will continue to have domestic and international demand, and can be steady foreign exchange earners for the country .
As any other nation, India must be prepared to meet its population's requirements for better housing, new cities, roads, clothing, and schools. In this growth of the country's population and needs, until we master space travel and colonization of other planets there is one thing which will remain a "limited resource": the land area. Proper land management, in terms of optimal land use, is essential. Ensuring maximum agricultural productivity is one of the best ways to accomplish it.
Feature 33