indiana’s life science industries · the share of total workforce engaged in pharmaceutical...
TRANSCRIPT

LIFE SCIENCE INDUSTRIES
Indiana’s
April 2009
TM A report produced by the Indiana Business Research Center for the Indiana Economic Development Corporation

Indiana’s Life Science Industries April 2009
Table of Contents Executive Summary ............................................................................................................................... 1
Key Findings ................................................................................................................................................................................ 2
The Indiana Life Science Industry ........................................................................................................ 3 Life Science Manufacturing .......................................................................................................................................................... 4
Indiana Life Science Manufacturing in Perspective ..................................................................................................................... 7
Life Science Research and Development and Wholesale Trade ............................................................................................... 10
The Indiana Life Science Occupations ................................................................................................ 11 Microbiologists ........................................................................................................................................................................... 13
Biochemists and Biophysicists ................................................................................................................................................... 14
Medical Scientists, Except Epidemiologists ............................................................................................................................... 15
Natural Sciences Managers ....................................................................................................................................................... 16
Biomedical Engineers ................................................................................................................................................................ 16
Biological Technicians ................................................................................................................................................................ 17
Environmental Scientists and Specialists, Including Health ....................................................................................................... 17
Biological Science Teachers, Postsecondary ............................................................................................................................ 17
Life Science Exports ............................................................................................................................. 17
Recent Life Science Investments in Indiana ....................................................................................... 20 Conclusion ........................................................................................................................................... 23
Appendix .............................................................................................................................................. 24 Life Science Investment Commitments in Indiana, 2005-2008 .................................................................................................. 24
Aggregate Industry, Occupation and Trade Definitions ............................................................................................................. 25
Research conducted by the Indiana Business Research Center at Indiana University’s Kelley School of Business
Printing provided by Duke Energy Indiana Economic Development

Index of Figures Figure 1: Life Science Industry Employment by Business Activity, 2007 .......................................................................................... 4
Figure 2: Average Annual Employment and Output Change for Select Industries, 2001-2007 ........................................................ 6
Figure 3: Share of Indiana Total Manufacturing Output (Current Dollar) by Select Industries, 1997-2007 ...................................... 6
Figure 4: Total Output and Productivity of Pharmaceutical and Medicine Manufacturing, Leading States, 2007 ............................ 7
Figure 5: Location Quotient of Pharmaceutical and Medicine Manufacturing Employment, Leading States, 2007 .......................... 8
Figure 6: Total Output and Productivity of Medical Equipment and Supplies Manufacturing, Leading States, 2007 ....................... 9
Figure 7: Location Quotient of Medical Equipment and Supplies Manufacturing Employment, Leading States, 2007 .................... 9
Figure 8: Indiana Location Quotients by Life Science Occupation, 2007 ....................................................................................... 13
Figure 9: Top States in Location Quotient of Microbiologist Employment, 2006 ............................................................................ 14
Figure 10: Top States in Location Quotient of Biochemist and Biophysicist Employment, 2006 .................................................... 15
Figure 11: Average Annual Change in Wages (Current Dollars) by Occupation, 2001-2007 ......................................................... 16
Figure 12: Top States in the Value of Life Science Exports, 2002-2007 ........................................................................................ 18
Figure 13: Ratio of the Value of Life Science Exports to State GDP, 2007 .................................................................................... 19
Figure 14: Value of Indiana Life Science Exports by Product Type, 2002-2007............................................................................. 19
Figure 15: Share of Total Life Science Exports by Product Type, United States and Top Life Science Exporting States, 2007 ... 20
Figure 16: Life Science FDI Project Announcements in the United States by Business Activity, 2007-2008 ................................. 23
Index of Tables Table 1: Life Science Industry Overview, 2007 ................................................................................................................................. 3
Table 2: Life Science Manufacturing Summary by Industry, 2007 .................................................................................................... 5
Table 3: Life Science Research and Development and Wholesale Trade, 2007............................................................................ 10
Table 4: Life Science Manufacturing and Research and Development Jobs by Occupation Type, 2007*...................................... 11
Table 5: Summary of Indiana Life Science Occupations, 2007 ...................................................................................................... 12
Table 6: Out-of-State Life Science Direct Investment Announcements, Indiana, 2007-2008 ......................................................... 21
Table 7: Top Destination States by Job Estimates for Out-of-State Life Science Investment, 2007-2008 ..................................... 22
Table 8: Top Source Countries by Job Estimates for Life Science Foreign Direct Investment, United States, 2007-2008 ............ 22

1
Executive Summary The life sciences play a key role in the U.S. economy. In 2007, 1.4 million Americans were employed with companies engaged in the research and development, production or distribution of life science products. Even more life scientists are employed at universities and public research laboratories around the country. Furthermore, between 2001 and 2007, average annual employment growth in these industries far outpaced that of total employment (1.2 percent compared to 0.7 percent). Strong growth will almost certainly continue in an effort to meet the ever-expanding demand for health care goods and services. As a case in point, the most recent projections from the Bureau of Labor Statistics predict that U.S. employment in pharmaceutical and medicine manufacturing will grow 24 percent between 2006 and 2016.
The importance of the life sciences extends beyond just employment numbers. This field is characterized by innovation, significant public and private investment, highly skilled talent and excellent wages. For these reasons, building or expanding the life sciences is a top priority of state and local economic development efforts across the country.
Indiana is already an acknowledged leader in the life sciences. A June 2008 study by Battelle Technology Partnership Practice noted that Indiana, California and North Carolina were the only states to exhibit specialization in three of their four bioscience sectors (biosciences is a broader industry definition that includes agricultural feedstock and chemicals). Certainly, with Eli Lilly and Company in pharmaceuticals and Cook Group, Biomet and Zimmer in medical devices, the state is fortunate to be home to some of the industry’s most recognizable and successful companies. Indiana life sciences extend beyond these industry giants, however. The state was home to more than 300 life science manufacturing firms, more than 200 biotechnology or physical science research laboratories and nearly 1,100 life science product wholesalers in 2007.
This report aims to provide an overview of Indiana’s position in this field by examining four aspects of the life sciences. The first section presents information on the employment, typical wages and output of Indiana firms engaged in life science industries. The second section offers a different perspective on life science employment by analyzing occupation-level data. Unlike industry figures, these data allow for a focus on the segment of Indiana’s workforce with the scientific or technical skills that are specific to the life sciences. The final two sections observe Indiana’s position in the global marketplace with a look at the state’s life science–related foreign exports and the direct investment of foreign companies in Indiana. As with any study using secondary or survey data—especially sparse survey data such as the Occupational Employment Statistics survey at a state level—care must be taken when making inferences about trends. Secondary data lacks the analytical richness that can be gained from those in direct contact with the companies that make up an industry. An industry expert can provide a more complete and accurate picture of industry dynamics and structure.
2
Key Findings • The life sciences now rival the auto industry as Indiana’s most dynamic manufacturing sector.
Between 1997 and 2007, the life science share of total manufacturing output has increased from 11 percent to 20 percent—a mark that now narrowly exceeds the transportation equipment sector’s contribution. The manufacture of pharmaceuticals and medicine are a particular strength. The total output of Indiana firms engaged in this sector was nearly $9 billion in 2007. Only California, New Jersey and New York can boast a higher figure. Furthermore, Indiana ranked second nationally in the share of total workforce engaged in pharmaceutical manufacturing. Indiana ranks third among the nation’s top producers in output per pharmaceutical worker with a mark of $450,000.
• Indiana’s $3.7 billion in medical equipment and supplies output was second only to California in 2007. Indiana led all states in the share of total workforce engaged in this industry. Among the nation’s top 10 producers, Indiana exhibited the highest output per medical device worker ($199,000).
• Employment in all Indiana life science industries grew at a 2.8 percent average annual rate between 2001 and 2007 compared to a rate of 1.2 percent nationally. Indiana’s 2007 average annual wage for a job in this field was $82,000—more than twice the state’s average wage for all employment.
• Indiana also exhibits employment concentration in several key life science occupations. The state’s share of total employment exceeded the national share for microbiologists, biochemists and biophysicists, medical scientists, natural science managers, and biomedical engineers in 2007. The microbiologist occupation and the biochemist and biophysicist occupation are also noteworthy in that they are the two life science occupation groups in which Indiana’s average wage was greater than the national average.
• Indiana does not rate highly in all life science–related occupations, however. Most notably, Indiana’s concentration of postsecondary biological science teachers was among the lowest in the nation in 2007. In this same year, the state’s average annual wage of $71,200 in this occupation also lagged well behind the national average of $84,130.
• The value of Indiana’s life science exports totaled $5.1 billion in 2007. This value accounted for 6 percent of the U.S. total and was the third highest among all states behind California and Massachusetts. Indiana’s life science exports are heavily dependent on pharmaceuticals which made up 72 percent of the total. By comparison, pharmaceuticals were responsible for 40 percent of total U.S. life science exports.
• Seven life science investments in Indiana by out-of-state firms announced between 2007 and 2008 are expected to generate 1,900 new jobs according to the investment monitoring service FDI Markets. Chief among these deals is the 2007 announcement by New Jersey-based Medco Health Solutions, which expects to create 1,300 jobs with its new automated pharmacy facility in Whitestown. According to FDI Markets, this is the largest out-of-state life science–related job announcement in the United States over this period.

3
The Indiana Life Science Industry The growth of the life sciences is emblematic of the broad restructuring of Indiana's economy. As the automobile industry contracts, the state’s large manufacturing base has shifted toward producing other types of goods, and life science manufacturing is an important part of that shift.
Indiana was home to 1,650 life science–related firms (most are in the wholesale trade sector) that employed 50,000 Hoosiers in 2007. At 1.7 percent of total employment, these industries represent a small yet rapidly growing segment of Indiana’s workforce. Table 1 shows that payroll employment in Indiana life science industries has grown by nearly 3 percent annually. This average annual rate of growth is more than twice as great as the nation.
The important role that the life sciences play in the state is more evident when compared to Indiana’s employment picture overall. Total payroll employment in the state increased by 33,000 between 2001 and 2007—a 0.2 percent average annual growth. Meanwhile, life science employment expanded by 7,600 jobs, representing 23 percent of Indiana’s total growth during this period.
What makes the growth of the state’s life science industries so important are the high wages associated with these jobs. The annual wage of a typical life science job was $82,000 in 2007—a mark that was more than double the average wage for all employment. Furthermore, the average wage of an Indiana life science job more closely resembles the national average than is the case for employment overall.
Table 1: Life Science Industry Overview, 2007
Indiana United States
Number of Life Science Establishments 1,652 62,388
Manufacturing 333 17,485
Wholesale Trade 1,098 28,538
Research and Development 221 16,365
Life Science Employment 50,146 1,637,575
Manufacturing 38,486 704,229
Wholesale Trade 8,227 400,597
Research and Development 3,433 532,749
Life Science as a Share of Total Employment 1.7% 1.2%
Average Annual Change in Life Science Employment, 2001-2007 2.8% 1.2%
Average Annual Change in Total Employment, 2001-2007 0.2% 0.7%
Life Science as a Share of Total Employment Growth, 2001-2007 22.9% 2.0%
Average Annual Life Science Wage $81,974 $84,992
Average Annual Wage (Total Employment) $37,447 $44,450 Source: IBRC, using Bureau of Labor Statistics data
Life science industries, as defined in this study, consist of firms operating in three business activities: manufacturing, wholesale distribution, and research and development. Not surprisingly given Indiana’s industrial heritage, employment in the manufacturing sectors accounts for 77 percent of the industry total

4
compared to 43 percent nationally (see Figure 1). Meanwhile, life science wholesale trade employment is relatively small yet growing rapidly in the state—a trend that is likely to continue given the emphasis on developing Indiana’s logistics sector.
One glaring gap in Indiana’s otherwise strong life science industry is found in the research and development (R&D) sector. At the national level, a far larger share (37 percent) of the life science workforce is employed with firms focused on R&D than is the case in Indiana (7 percent). Furthermore, Indiana life science R&D wages are well below the national average. By contrast, the state’s 2007 average annual life science manufacturing wage was $81,000 compared to $78,000 for the nation. The 2007 wage differential in medical equipment wholesale trade was over $6,000 in Indiana’s favor.
It is important to note that firms are categorized by their “primary business activity” for the purposes of industry classification. Primary business activity is typically defined by the pursuit that accounts for the greatest share of production costs, capital investment or revenue. Therefore, firms with a major manufacturing presence, for instance, may still heavily engage in R&D.
Figure 1: Life Science Industry Employment by Business Activity, 2007
Source: IBRC, using Bureau of Labor Statistics data
Life Science Manufacturing Indiana life science manufacturing is led by pharmaceutical and medicine production. In 2007, this industry accounted for half of life science manufacturing employment and 38 percent of all life science jobs (see Table 2). Furthermore, with an average wage of $102,000, Indiana pharmaceutical firms pay above the national industry average and their wages are nearly three-times greater than Indiana’s average for all jobs.
The manufacturing of medical instruments and surgical appliances is another area of strength. In 2007, each of these industries employed 8,200 people which combined to account for 33 percent of Indiana’s total life science workforce. Additionally, with strong average annual growth since 2001, medical instruments (5.4 percent) and surgical appliances (8.3 percent) are high-growth industries in Indiana, far outpacing U.S. growth rates in these same sectors. Each industry had an average wage well above Indiana’s total manufacturing mark of $51,000. The surgical appliances industry, in particular, provided high wages with an average of $71,500 in 2007—nearly $12,000 above the national average.
The annual wage of a typical life science
manufacturing job in Indiana was
$81,000 in 2007.

5
Table 2: Life Science Manufacturing Summary by Industry, 2007
Manufacturing Industry
Employment Avg. Wage per Job Avg. Annual Employment
Change, 2001-2007
Indiana Indiana United States Indiana United States Pharmaceutical Preparation 19,104 $102,158 $98,587 0.8% 0.7%
Surgical Appliance and Supplies
8,241 $71,481 $59,754 8.3%* 1.2%*
Surgical and Medical Instrument
8,205 $57,574 $66,615 5.4% 0.5%
Dental Laboratories 1,294 $31,150 $36,141 -0.8% 0.7%
Ophthalmic Goods 608 $27,940 $52,023 4.9% -1.9%
In-Vitro Diagnostic Substance 253 $54,352 $90,737 9.3% 5.0%
Analytical Laboratory Instrument
251 $61,813 $83,796 1.8% -0.9%
Dental Equipment and Supplies
221 $41,155 $50,546 0.2% -0.8%
Biological Product (except Diagnostic)**
n/a n/a $84,919 n/a 0.8%
Electromedical Apparatus** n/a n/a $82,534 n/a 1.9%
Irradiation Apparatus** n/a n/a $90,190 n/a 1.4%
Medicinal and Botanical** n/a n/a $91,617 n/a -0.2% *Some North American Industry Classification System (NAICS) sectors were revised in 2007. The surgical appliance and supplies manufacturing industry received a portion of the now eliminated NAICS 339111. Therefore, a portion of this growth can be attributed to this revision. **Indiana data are not available due to Bureau of Labor Statistics non-disclosure requirements. Source: IBRC, using Bureau of Labor Statistics data
Gains in life science manufacturing employment are in sharp contrast to the dominant trend in manufacturing overall. Indiana’s total manufacturing employment declined by nearly 66,000 between 2001 and 2007. Transportation equipment manufacturing, the state’s hallmark industry, contracted by roughly 8,000 jobs during that period.
Despite employment declines, the value of Indiana’s manufacturing output continues to climb. Current dollar output of total manufacturing has grown at an average annual rate of 2.8 percent, while the production of transportation equipment specifically has increased at an annual rate of 2.2 percent (see Figure 2). The bifurcation of employment and output reflect several underlying forces: improvements in technology, increases in productivity and the divestment of lower value-added functions.
The relative strength of the state’s life science manufacturing sector is illustrated not only by employment growth but also by the nearly 8 percent average annual growth in output. This rate of growth was twice as large as the state total for all industries.

6
Figure 2: Average Annual Employment and Output Change for Select Industries, 2001-2007
Source: IBRC, using Bureau of Labor Statistics data and Moody’s Economy.com
This exceptional growth in life sciences relative to total manufacturing signals a potential realignment of the state’s industry mix. The life science share of total manufacturing output has grown to 20 percent which, as Figure 3 illustrates, now narrowly exceeds the transportation equipment sector’s contribution.
Figure 3: Share of Indiana Total Manufacturing Output (Current Dollar) by Select Industries, 1997-2007
Source: IBRC, using data from Moody’s Economy.com
While life science manufacturing output has surpassed that of transportation manufacturing in recent years, it has done so with less than one-third the workforce. The importance of this sector’s tremendous productivity cannot be overstated. Yet it is important to keep in mind that, in terms of employment alone, gains in life science manufacturing will not offset losses in the broader manufacturing sector if recent trends persist.

7
Indiana Life Science Manufacturing in Perspective
Clearly, manufacturing of pharmaceuticals and medical devices is an increasing strength of Indiana’s economy. Perhaps more importantly, Indiana stands as a national leader within these key industries. For instance, Indiana firms generated $8.8 billion in pharmaceutical and medicine output in 2007 (see Figure 4). This level of output was fourth among all states behind California, New Jersey and New York—some of the nation’s largest economies. In fact, Indiana is unique in this list in that it is the only state that is not also among the top 10 nationally in total output.
Sheer output alone does not offer a complete account of a state’s productivity given these variations in relative size of state economies. Output per worker helps to compare states on a level playing field. Indiana ranks third among these top producers in output per pharmaceutical worker with a mark of $450,000, which places the state ahead of California and New Jersey and behind only Texas and New York. Indiana’s output per worker for all industries was $82,500 in 2007.
Figure 4: Total Output and Productivity of Pharmaceutical and Medicine Manufacturing, Leading States, 2007
*Output per worker is a common measure of productivity Source: IBRC, using data from Moody’s Economy.com
Indiana firms generated
$8.8 billion in pharmaceutical and medicine
output in 2007.

8
Another indication of Indiana’s position as a national leader is the relatively large share of total employment this industry holds. Indiana had a pharmaceutical employment location quotient (LQ)1
Figure 5
of 3 in 2007, meaning that the state’s share of total workforce dedicated to this sector was three times greater than that of the nation. This measure was second only to New Jersey, which had a location quotient approaching 5. Not only is Indiana highly concentrated but this concentration has increased since 1997 when its LQ was 2.6. Indiana’s 10-year change in LQ (at an annual average rate) ranked third—behind Rhode Island and Utah—among the states featured in .
Figure 5: Location Quotient of Pharmaceutical and Medicine Manufacturing Employment, Leading States, 2007
Source: IBRC, using data from Moody’s Economy.com
At $3.7 billion in output in 2007, the state’s medical device sector does not match the exceptional output generated by the pharmaceutical industry, yet Indiana’s position nationally is equally significant. The state ranked second in output and exhibited the highest output per medical device worker ($199,000) of these top producers. California led the nation with a total output that was more than twice as large as Indiana’s. The Hoosier State’s strong performance in this sector is especially evident when one considers that each of the states listed in Figure 6 has a larger total economy than Indiana, which ranked 18th in total output in 2007. California’s total output, for instance, was more than seven times larger than Indiana’s.
Indiana led all states in the share of total employment in medical device manufacturing with an LQ of 2.8 in 2007. This mark was up from 2.0 in 1997, which was the largest LQ increase of the states shown in Figure 7.
1 Location quotient is a measure of industry concentration which in this study calculates a ratio of an industry’s share of total employment locally to its share nationally. The national average equals 1 and an LQ above 1 indicates that a state is more specialized than the nation in that industry.

9
Figure 6: Total Output and Productivity of Medical Equipment and Supplies Manufacturing, Leading States, 2007
*Output per worker is a common measure of productivity Source: IBRC, using data from Moody’s Economy.com
Figure 7: Location Quotient of Medical Equipment and Supplies Manufacturing Employment, Leading States, 2007
Source: IBRC, using data from Moody’s Economy.com
10
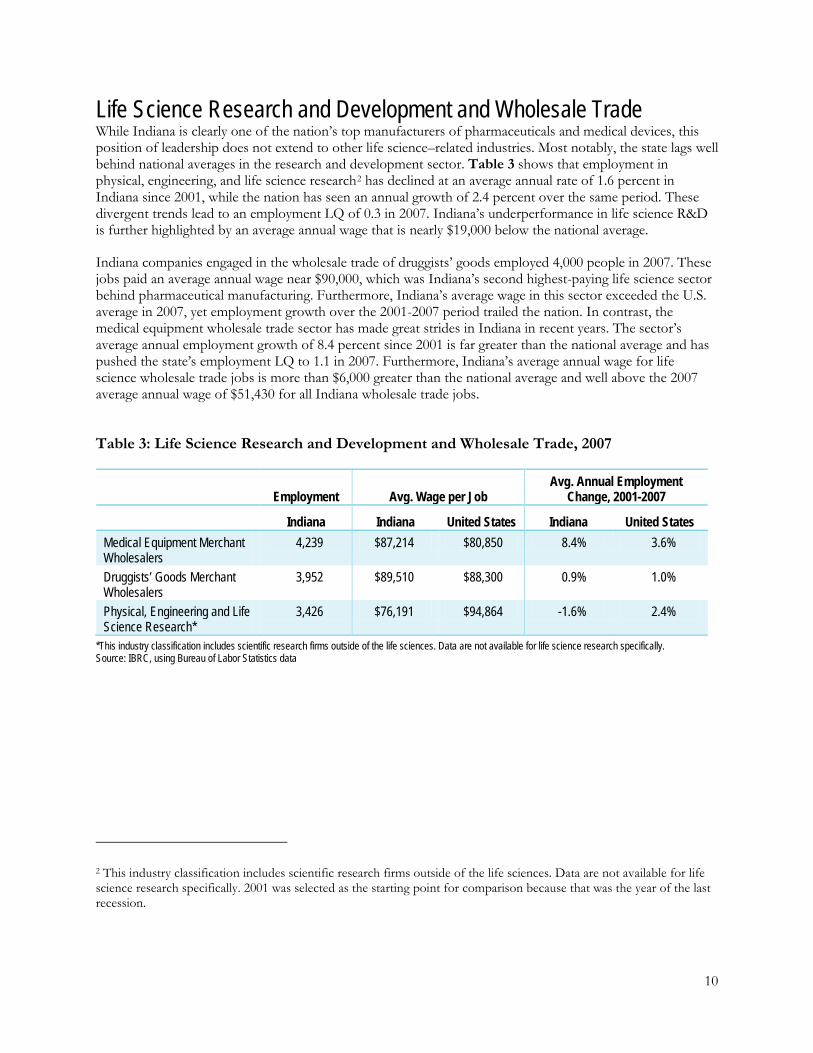
Life Science Research and Development and Wholesale Trade While Indiana is clearly one of the nation’s top manufacturers of pharmaceuticals and medical devices, this position of leadership does not extend to other life science–related industries. Most notably, the state lags well behind national averages in the research and development sector. Table 3 shows that employment in physical, engineering, and life science research2
Table 3: Life Science Research and Development and Wholesale Trade, 2007
has declined at an average annual rate of 1.6 percent in Indiana since 2001, while the nation has seen an annual growth of 2.4 percent over the same period. These divergent trends lead to an employment LQ of 0.3 in 2007. Indiana’s underperformance in life science R&D is further highlighted by an average annual wage that is nearly $19,000 below the national average.
Indiana companies engaged in the wholesale trade of druggists’ goods employed 4,000 people in 2007. These jobs paid an average annual wage near $90,000, which was Indiana’s second highest-paying life science sector behind pharmaceutical manufacturing. Furthermore, Indiana’s average wage in this sector exceeded the U.S. average in 2007, yet employment growth over the 2001-2007 period trailed the nation. In contrast, the medical equipment wholesale trade sector has made great strides in Indiana in recent years. The sector’s average annual employment growth of 8.4 percent since 2001 is far greater than the national average and has pushed the state’s employment LQ to 1.1 in 2007. Furthermore, Indiana’s average annual wage for life science wholesale trade jobs is more than $6,000 greater than the national average and well above the 2007 average annual wage of $51,430 for all Indiana wholesale trade jobs.
Employment Avg. Wage per Job
Avg. Annual Employment Change, 2001-2007
Indiana Indiana United States Indiana United States
Medical Equipment Merchant Wholesalers
4,239 $87,214 $80,850 8.4% 3.6%
Druggists’ Goods Merchant Wholesalers
3,952 $89,510 $88,300 0.9% 1.0%
Physical, Engineering and Life Science Research*
3,426 $76,191 $94,864 -1.6% 2.4%
*This industry classification includes scientific research firms outside of the life sciences. Data are not available for life science research specifically. Source: IBRC, using Bureau of Labor Statistics data
2 This industry classification includes scientific research firms outside of the life sciences. Data are not available for life science research specifically. 2001 was selected as the starting point for comparison because that was the year of the last recession.

11
The Indiana Life Science Occupations There is no mistaking Indiana’s position at the forefront of the nation’s life science industries. With 85 percent of employment in manufacturing-oriented firms, it stands to reason that Indiana’s life science workforce would be more heavily concentrated in production-related occupations (see Table 4). Does this mean that Indiana is simply a production hub? Or does the state support the high-skill, high-wage scientific
and technical jobs commonly associated with this industry? Occupation data provide a useful supplement to industry-level trends and present a different perspective that can help answer this question.
The difference between the two perspectives—industry versus occupation—is that an establishment classified as a pharmaceutical and medicine manufacturer, for instance, employs many different types of occupations. In addition to the production workers on the shop floor, there are administrative employees that take care of payroll and billing. There are managers, quality inspectors, financial analysts and custodians. There are also chemists and biologists. All the above occupations are integral to the operation of a successful firm, but this section focuses on occupations requiring scientific or technical skills specific to the life sciences because they provide the knowledge-based foundation for future growth.
Table 4: Life Science Manufacturing and Research and Development Jobs by Occupation Type, 2007*
Type of Occupation Indiana United States
Production 28.8% 22.1%
Life, Physical, and Social Science** n/a 17.7%
Office and Administrative Support 12.5% 12.8%
Management 10.7% 9.8%
Architecture and Engineering 6.1% 9.8%
Computer and Mathematical 5.5% 7.7%
Business and Financial Operations 8.1% 6.8% *Only the top seven occupation types are displayed. Manufacturing jobs cover only Pharmaceuticals (NAICS 3254) and Medical Devices (NAICS 3391). **Indiana data not available due to Indiana Department of Workforce Development non-disclosure requirements. Source: IBRC, using Indiana Department of Workforce Development and Bureau of Labor Statistics data
Indiana’s employment in nearly all life
science occupations has
grown since 2001.

12
Indiana had 8,950 people employed in life science occupations in 2007 (see Table 5).3
Table 5: Summary of Indiana Life Science Occupations, 2007
While this figure makes up a small share of total employment (0.31 percent), it is slightly larger than the proportion of employment these occupations hold nationally (0.29 percent). The state’s employment in nearly all life science occupations has grown since 2001.
Medical scientists comprise Indiana’s largest life science occupation and, together with biochemists and biophysicists, registered significant growth. Growth in each of these occupations outperforms national averages and stands in sharp contrast to Indiana’s average for all occupations of 0.4 percent annually. Indiana’s employment trend for postsecondary biological science teachers, the only life science occupation to contract over this period, is a point of concern given the growth seen nationally and the increased emphasis that is sure to be placed on science and engineering education in the coming decades.
Employment
Avg. Annual Employment Change, 2001-2007 Avg. Wage
Indiana Indiana United States Indiana United States
All Occupations 2,928,780 0.4% 0.8% $36,410 $40,690
Medical Scientists, Except Epidemiologists
2,740§ 47.3%§ 10.6% $52,710 $74,160
Biological Technicians 1,200 9.5% 7.7% $34,960 $40,240
Environmental Scientists and Specialists, Including Health
1,160 4.2% 5.5% $55,870 $63,870
Natural Sciences Managers 1,130 0.0%*** -1.3% $58,590 $113,170 Microbiologists 780* 11.5%** -1.0% $67,790* $66,430
Biological Science Teachers, Postsecondary
740 -3.3% 5.2% $71,200 $84,130
Biochemists and Biophysicists 660*§ 27.1%**§ 3.2% $90,230 $85,290
Biomedical Engineers 340* 6.1%** 13.2% $62,740 $79,610 Life Scientists, All Other 200 n/a n/a $56,250 $66,930
*2006 data, ** 2001-2006 data, *** 2002-2007 data § The Occupational Employment Statistics survey reports large margins of error in 2007 for these occupations. As a result, the reader is strongly cautioned that actual industry and employment trends may conflict with published government—Bureau of Labor Statistics—data sources. Industry experts may provide a more accurate and complete analysis of regional or state industry structure. Source: IBRC, using Bureau of Labor Statistics
Figure 8 illustrates that Indiana had a location quotient above one in half of the life science occupations, indicating that these occupations’ shares of total employment are larger in the state than nationally. Those with the highest LQs—namely microbiologists, biochemists and biophysicists, medical scientists, and natural science managers—offer some of the top salaries among life science occupations and require the highest levels of education and preparation according to the U.S. Department of Labor’s O*NET framework. These high LQ values help to demonstrate that, although manufacturing as a business activity dominates the state’s
3 Data for some occupations are unavailable for 2007 due to non-disclosure policies. When possible, data for previous years are used and denoted with asterisks in Table 5. As with most studies using survey data, there can be a loss of fidelity between actual company or labor force facts and the published data.

13
life science pursuits, Indiana firms also employ a higher-than-average number of highly skilled scientists and technicians.
Figure 8: Indiana Location Quotients by Life Science Occupation, 2007
*2006 data are the most recent available. Source: IBRC, using Bureau of Labor Statistics
The following section presents employment and wage trends for eight life science occupations.
Microbiologists Indiana ranked fourth nationally in the concentration of microbiologists with a location quotient of 2.3. Not only is the state’s concentration of microbiologists more than twice that of the nation as a whole, this concentration has grown from an LQ of 1.3 in 2001. Maryland, with an employment of nearly 1,600 microbiologists, has the nation’s highest LQ in this occupation followed by Massachusetts, Montana and then Indiana (see Figure 9). Wisconsin is the only other Midwestern state with an LQ among the top 10 in 2006. In terms of actual employment, the number of Hoosiers employed in this occupation has grown from 440 to 780 between 2001 and 2006.
The 2006 average annual wage for a microbiologist in the state was $68,000, ranking eighth nationally and the top figure among Midwestern states. Furthermore, microbiologist was one of only two life science occupations in which Indiana’s wage was greater than the national average.
The Bureau of Labor Statistics does not provide detail on occupational employment by industry at the state level but does so for the United States. Twenty-three percent of the nation’s 14,600 microbiologists were employed in the scientific research and development services industry in 2007 followed by 20 percent in pharmaceutical and medicine manufacturing and 16 percent working in the federal government.

14
Figure 9: Top States in Location Quotient of Microbiologist Employment, 2006
Source: IBRC, using Bureau of Labor Statistics data
Biochemists and Biophysicists Indiana’s 660 workers in biochemistry and biophysics occupations in 2006 constituted the eighth largest workforce among states for these jobs and accounted for 3.5 percent of national employment. The state’s employment location quotient in these occupations placed it 10th relative to all states (see Figure 10). Indiana had the highest annual wage for this set of occupations in 2006 at $106,080; however, data for 2007 indicate a sharp decline in this occupation’s wages to an average of $90,230 per job. The 2007 average wage was fifth highest in the nation and still well above the national average of $85,290.
At the national level, a majority of biochemists and biophysicists work at scientific research and development services establishments (43 percent). An additional 30 percent work in establishments that are primarily pharmaceutical and medicine manufacturers. Colleges and universities account for only 8 percent of those engaged in this occupation.

15
Figure 10: Top States in Location Quotient of Biochemist and Biophysicist Employment, 2006
Source: IBRC, using Bureau of Labor Statistics data
Medical Scientists, Except Epidemiologists In 2007, Indiana registered a location quotient of 1.15 for medical scientists. The state’s specialization in this occupation is relatively new as employment jumped from just 160 in 2001 to over 2,700 in 2007. The state’s strong performance does not extend to earnings, however, as the average wage in 2007 of $53,000 is among the lowest in the nation and is nearly 30 percent lower than the national average of $74,000. Moreover, Indiana’s average wage for medical scientists has declined significantly since 2001, possibly indicating that much of the employment growth in recent years has been in jobs that offer relatively low wages for this occupation. Figure 11 shows that, even without adjusting for inflation, the medical scientists occupation is one of three life science occupations in Indiana that have seen average wages decline.4
4 Occupational earnings data are not adjusted for inflation.
Roughly 30 percent of workers employed in this occupation nationally work for establishments engaged in research and development services. Another 30 percent can be found at colleges and universities, while pharmaceutical and medicine manufacturing takes the next largest share (13 percent).

16
Figure 11: Average Annual Change in Wages (Current Dollars) by Occupation, 2001-2007
*2001-2006 data, ** 2002-2007 data Source: IBRC, using Bureau of Labor Statistics data
Natural Sciences Managers In 2007, Indiana’s concentration of natural sciences managers was above the national average and ranked in the top 20 in the United States. Despite Indiana’s specialization in this occupation, the state’s average annual wage for these 1,100 jobs ($59,000) was among the lowest in the nation and roughly half the U.S. average wage of $113,000.
Nationwide, 26 percent of natural sciences managers work in the research and development services industry. Almost one quarter work for the federal government. An additional 10 percent work in pharmaceutical and medicine manufacturing.
Biomedical Engineers In 2006, 340 Hoosiers worked as biomedical engineers. Although this total is relatively small, the location quotient of 1.1 indicates that this occupation is slightly more concentrated in Indiana than in the nation. The state’s 2007 average annual wage of $63,000 for biomedical engineers was considerably below the U.S. average of $80,000.
That the employment of biomedical engineers is relatively concentrated in Indiana is no surprise when considering that the top industries employing this occupation at the national level are medical equipment and supplies manufacturing and pharmaceutical and medicine manufacturing. Together, these two industries employed 40 percent of the nation’s 15,000 biomedical engineers in 2007. The scientific research and development services industry was the third largest employer of this occupation at 16 percent.

17
Biological Technicians Indiana companies employed 1,200 biological technicians in 2007 and registered a location quotient of 0.8, demonstrating that Indiana’s firms did not, on balance, employ the typical number of biological technicians. These numbers are down from previous years. The three-year average for Indiana’s biological technician employment from 2004 to 2006 was 1,540 and the location quotient was 1.05. The state’s average wage for this occupation also declined in 2007. The 2007 average wage was $35,000 compared to the 2004 to 2006 three-year average of 37,400. These wage figures are not adjusted for inflation. The U.S. average wage for this occupation was $40,200 in 2007.
Nationally, over half of all biological technicians find work at universities or in the research and development services industry. Ten percent work in pharmaceutical and medicine manufacturing.
Environmental Scientists and Specialists, Including Health Indiana’s concentration of environmental scientists and specialists also lags behind that of the rest of the nation. In 2007, the state’s 1,160 workers in this occupation represented a location quotient of 0.66. This mark is typical for this region of the country as no Midwestern states for which data are available (Iowa is not included) had a location quotient above 0.85 in 2007.
Environmental scientists and specialists in Indiana earned $55,870 on average in 2007—$8,000 less than the value for the United States as a whole. The gap in pay between Indiana and the United States has been declining in recent years as the environmental scientists and specialists occupation is one of only three life science occupations in which Indiana’s current-dollar growth in average wage between 2001 and 2007 outpaces the nation (refer again to Figure 11).
Industries with the highest levels of employment for environmental scientists and specialists at the national level are state, federal and local government; management, scientific and technical consulting services; and architectural, engineering and related services.
Biological Science Teachers, Postsecondary Indiana’s concentration of postsecondary biological science teachers was among the lowest in the nation, registering a location quotient of 0.65 in 2007. Among the nine Midwestern states for which data are available (Illinois is not included), Indiana’s location quotient in this occupation exceeded only Michigan’s. However, only two Midwestern states—Iowa and Missouri—had LQs above 1. Indiana’s average annual wage of $71,200 also lagged well behind the national average of $84,130 in 2007.
Life Science Exports Given Indiana’s concentration in life science manufacturing, it comes as no surprise that the export of these products is a significant and expanding segment of the state’s economy. The total dollar value of the state’s life science exports grew at an average annual rate of 15 percent between 2002 and 2007, compared to 12 percent for all Indiana exports. This rate of growth represents a doubling of the dollar value of life science exports from $2.5 billion to $5.1 billion over this period.5
This $5.1 billion in the value of exports was third only to the life science hubs of California and Massachusetts in 2007 (see
Figure 12). California is clearly the nation’s leader in life science exports as its
5 All export values are expressed in current dollars.

18
total value of $14.7 billion in 2007 accounted for 19 percent of the U.S. total. Massachusetts’s $8.3 billion in export sales accounted for 11 percent of the nation’s total while Indiana contributed 7 percent.
Figure 12: Top States in the Value of Life Science Exports, 2002-2007
Source: IBRC, using data from WISER Trade
Among these top five life science exporters, Massachusetts and Indiana exhibit a pronounced concentration in this sector. The value of life science exports in 2007 accounted for 33 percent of total exports in Massachusetts and 20 percent of the total in Indiana. Only Delaware had a higher share at 40 percent, while the U.S. mark was 7 percent. This ratio of life science exports to the total is smaller in other top states like New Jersey (14 percent), California (11 percent) and Illinois (9 percent). The latter states are also three of the top nine exporters overall in 2007 while Indiana and Massachusetts placed 12th and 13th, respectively.
A similar pattern is evident when Indiana’s life science exports are compared with the state’s gross domestic product (GDP). Although the value of exports and GDP are not directly comparable (since export sales reflect the price of intermediate inputs as well as value added), this ratio provides some indication of the role that life science exports plays in Indiana’s total economy.
Indiana’s GDP in 2007 totaled $246 billion which, with the value of life science exports at $5.1 billion, gives a life science export-to-GDP ratio of 2.1 percent. Again, as Figure 13 illustrates, only Delaware and Massachusetts have a ratio above Indiana’s. These states far exceed the U.S. ratio of 0.6 percent. What is particularly noteworthy, however, is that Indiana’s ratio has grown from 1.25 percent since 2002.
The dollar value of Indiana’s life science exports grew from $2.5 billion in 2002 to $5.1 billion in 2007.

19
Figure 13: Ratio of the Value of Life Science Exports to State GDP, 2007
Source: IBRC, using WISER Trade data
For the purposes of this study, life science exports consist of three broad types of goods: pharmaceuticals and medicines, medical equipment and supplies, and laboratory and diagnostic apparatus. The clear strength of Indiana’s life science exports rests with the pharmaceutical and medicine sector. As Figure 14 indicates, the value of Indiana’s pharmaceutical exports has more than doubled between 2002 and 2007 to reach a total of $3.7 billion, accounting for 72 percent of the state’s total life science exports. Indiana’s medical equipment sector contributed $1.1 billion in foreign sales in 2007 and laboratory and diagnostic apparatus exports amounted to $328 million.
Figure 14: Value of Indiana Life Science Exports by Product Type, 2002-2007
Source: IBRC, using WISER Trade data

20
Indiana’s concentration in pharmaceutical exports is unique in comparison to the United States and other top life science exporting states. Figure 15 shows that pharmaceuticals account for 38 percent of all life science exports nationwide compared to 72 percent for Indiana. This concentration highlights that Indiana’s pharmaceutical firms are a tremendous asset yet, from a balanced portfolio perspective, it also indicates that the state’s export base is somewhat more exposed to events in this single industry than other states. Among the leading life science exporting states, New Jersey was second to Indiana in the share of total value claimed by pharmaceuticals at 58 percent.
Figure 15: Share of Total Life Science Exports by Product Type, United States and Top Life Science Exporting States, 2007
Source: IBRC, using WISER Trade data
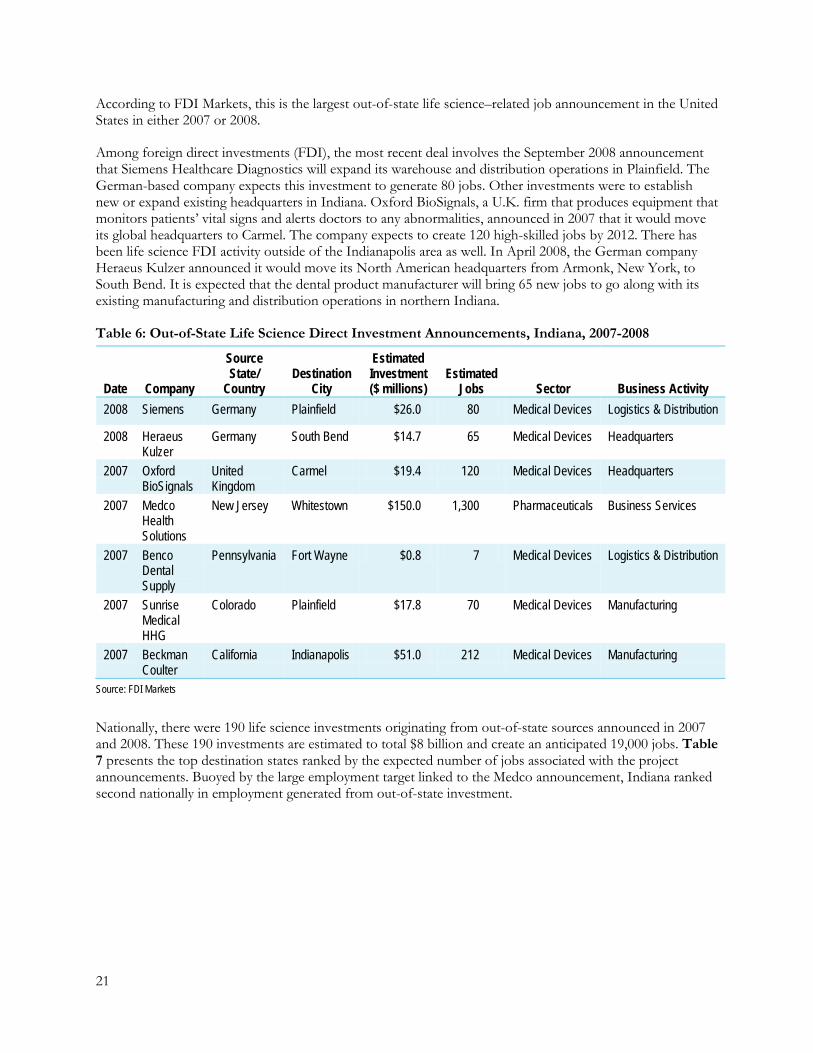
Recent Life Science Investments in Indiana Many successful life science firms have been created and continue to operate in Indiana, yet not all of the state’s recent employment gains in this sector are attributable to these home-grown businesses. The state has also been an attractive location for both domestic and foreign investment in the life sciences. Table 6 highlights the seven new life science investment announcements for Indiana in 2007 and 2008 as compiled by the investment monitoring service FDI Markets.6
Four of these deals involve domestic firms. The largest was the 2007 announcement of New Jersey–based Medco Health Solutions. The new automated pharmacy facility in Whitestown is slated to create 1,300 jobs.
These seven projects are expected to generate roughly $280 million in initial investment and 1,850 jobs once fully implemented. It is important to recognize, however, that these figures are either stated investment and jobs targets when publically announced by the companies, or they are estimated by FDI Markets. It may take years for the listed investment totals and job targets to be fully realized, if they are realized at all.
6 The FDI Markets data do not include investments made by Indiana firms in Indiana. The Indiana Economic Development Corporation (IEDC) provides incentives for Indiana firms to expand and invest. A complete list of all life science–related investments that the IEDC secured in 2008 is presented in the Appendix. The FDI Markets data, however, allow for comparisons between states and countries. FDI Markets is a web-based subscription service of FT Business and the Financial Times Limited.
21
According to FDI Markets, this is the largest out-of-state life science–related job announcement in the United States in either 2007 or 2008.
Among foreign direct investments (FDI), the most recent deal involves the September 2008 announcement that Siemens Healthcare Diagnostics will expand its warehouse and distribution operations in Plainfield. The German-based company expects this investment to generate 80 jobs. Other investments were to establish new or expand existing headquarters in Indiana. Oxford BioSignals, a U.K. firm that produces equipment that monitors patients’ vital signs and alerts doctors to any abnormalities, announced in 2007 that it would move its global headquarters to Carmel. The company expects to create 120 high-skilled jobs by 2012. There has been life science FDI activity outside of the Indianapolis area as well. In April 2008, the German company Heraeus Kulzer announced it would move its North American headquarters from Armonk, New York, to South Bend. It is expected that the dental product manufacturer will bring 65 new jobs to go along with its existing manufacturing and distribution operations in northern Indiana.
Table 6: Out-of-State Life Science Direct Investment Announcements, Indiana, 2007-2008
Date Company
Source State/
Country Destination
City
Estimated Investment ($ millions)
Estimated Jobs Sector Business Activity
2008 Siemens Germany Plainfield $26.0 80 Medical Devices Logistics & Distribution
2008 Heraeus Kulzer
Germany South Bend $14.7 65 Medical Devices Headquarters
2007 Oxford BioSignals
United Kingdom
Carmel $19.4 120 Medical Devices Headquarters
2007 Medco Health Solutions
New Jersey Whitestown $150.0 1,300 Pharmaceuticals Business Services
2007 Benco Dental Supply
Pennsylvania Fort Wayne $0.8 7 Medical Devices Logistics & Distribution
2007 Sunrise Medical HHG
Colorado Plainfield $17.8 70 Medical Devices Manufacturing
2007 Beckman Coulter
California Indianapolis $51.0 212 Medical Devices Manufacturing
Source: FDI Markets
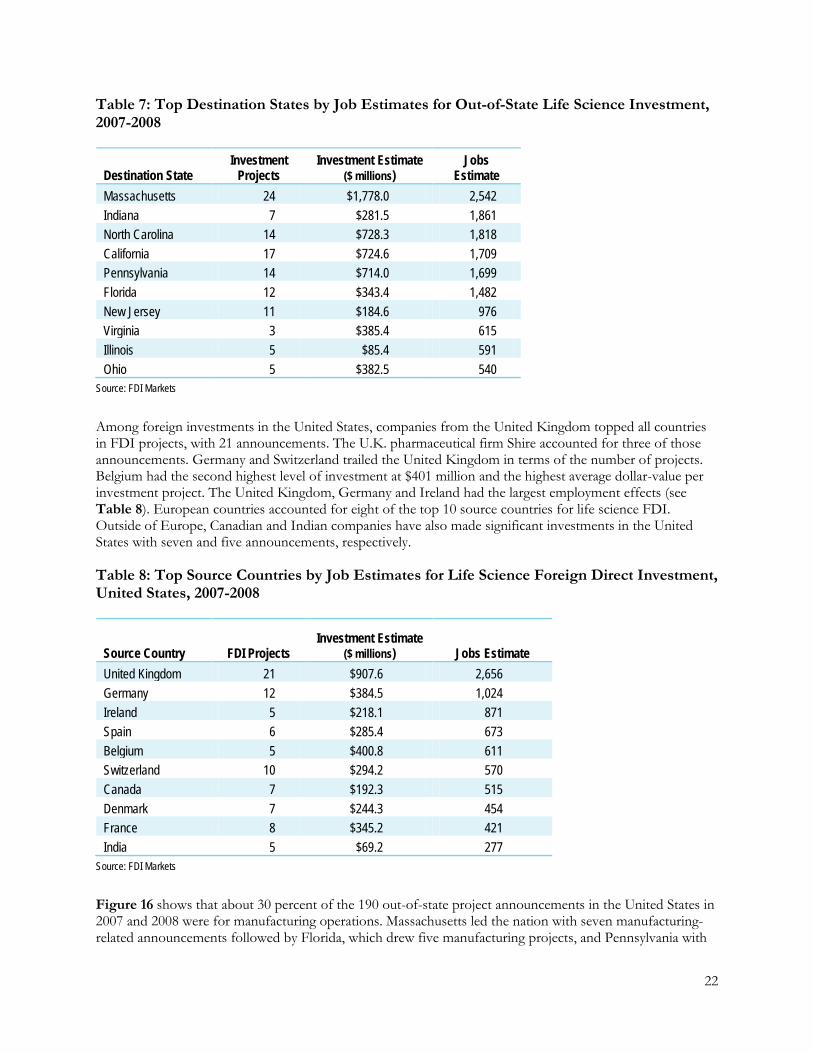
Nationally, there were 190 life science investments originating from out-of-state sources announced in 2007 and 2008. These 190 investments are estimated to total $8 billion and create an anticipated 19,000 jobs. Table 7 presents the top destination states ranked by the expected number of jobs associated with the project announcements. Buoyed by the large employment target linked to the Medco announcement, Indiana ranked second nationally in employment generated from out-of-state investment.
22
Table 7: Top Destination States by Job Estimates for Out-of-State Life Science Investment, 2007-2008
Destination State Investment
Projects Investment Estimate
($ millions) Jobs
Estimate Massachusetts 24 $1,778.0 2,542 Indiana 7 $281.5 1,861 North Carolina 14 $728.3 1,818 California 17 $724.6 1,709 Pennsylvania 14 $714.0 1,699 Florida 12 $343.4 1,482 New Jersey 11 $184.6 976 Virginia 3 $385.4 615 Illinois 5 $85.4 591 Ohio 5 $382.5 540
Source: FDI Markets
Among foreign investments in the United States, companies from the United Kingdom topped all countries in FDI projects, with 21 announcements. The U.K. pharmaceutical firm Shire accounted for three of those announcements. Germany and Switzerland trailed the United Kingdom in terms of the number of projects. Belgium had the second highest level of investment at $401 million and the highest average dollar-value per investment project. The United Kingdom, Germany and Ireland had the largest employment effects (see Table 8). European countries accounted for eight of the top 10 source countries for life science FDI. Outside of Europe, Canadian and Indian companies have also made significant investments in the United States with seven and five announcements, respectively.
Table 8: Top Source Countries by Job Estimates for Life Science Foreign Direct Investment, United States, 2007-2008
Source Country FDI Projects Investment Estimate
($ millions) Jobs Estimate United Kingdom 21 $907.6 2,656 Germany 12 $384.5 1,024 Ireland 5 $218.1 871 Spain 6 $285.4 673 Belgium 5 $400.8 611 Switzerland 10 $294.2 570 Canada 7 $192.3 515 Denmark 7 $244.3 454 France 8 $345.2 421 India 5 $69.2 277
Source: FDI Markets
Figure 16 shows that about 30 percent of the 190 out-of-state project announcements in the United States in 2007 and 2008 were for manufacturing operations. Massachusetts led the nation with seven manufacturing-related announcements followed by Florida, which drew five manufacturing projects, and Pennsylvania with

23
four. Investment projects for research and development activities nearly equaled manufacturing with 26 percent of the total followed by headquarters and sales and marketing each at 16 percent.
Figure 16: Life Science FDI Project Announcements in the United States by Business Activity, 2007-2008
Source: IBRC, using FDI Markets data
Conclusion Indiana’s position as a life science leader is clear. In 2007, the state was specialized in both life science industry and occupational employment, ranked fourth nationally in pharmaceutical manufacturing output and second in medical device output, and was the nation’s third largest exporter of life science goods. Perhaps more important, this key industry is a source of strong growth for the state at a time when other industries, particularly manufacturing, are facing challenges. Indiana’s life science industry employment grew at an average annual rate of 2.9 percent between 2001 and 2007 compared to just 0.2 percent for total employment and -1.9 percent for all manufacturing.
Amid all the positive news surrounding life sciences in Indiana, there are a few shortcomings. Indiana’s employment location quotient for firms engaged primarily in life science R&D is quite low at 0.30. Furthermore, employment in the life science R&D industry is declining at a time when it is expanding nationally. However, Indiana’s strong showing in life science occupational employment suggests that there is significant R&D taking place in the state but that it likely occurs at firms whose primary business activity is manufacturing. Other areas of concern include a location quotient for postsecondary teachers in the biological sciences occupation that is among the lowest in the country and the relatively small number of life science investments by companies outside of Indiana.
Despite these issues, it is easy to be bullish on Indiana’s prospects in the life sciences. With its rich heritage in the industry, strong educational institutions, and public policies and programs geared toward growth, Indiana is in a good position to capitalize on future opportunities in the life sciences.

24
Appendix Life Science Investment Commitments in Indiana, 2005-2008 To supplement the data from FDI Markets presented in the report, this appendix presents details for each life science–related investment deal completed by the Indiana Economic Development Corporation between 2005 and 2008. These companies committed to create a certain number of jobs and to invest an indicated amount in order to be eligible to receive state incentives. These tables do not represent life science investments that were completed without state assistance.
Investment Deals in Indiana by Indiana Life Science Firms, 2005-2008
Company Expected
Investment Expected New Jobs
Destination City
Destination County
Type of Project*
American Institute of Toxicology, Inc. $9,100,000 131 Indianapolis Marion E Predictive Physiology and Medicine $5,400,000 75 Bloomington Monroe N TriMedx, LLC $5,200,000 108 Indianapolis Marion E Pharmakon Long Term Care Pharmacy and Magnolia Healthcare
$1,800,000 52 Carmel Hamilton E
Zimmer Production, Inc. $19,000,000 98 Warsaw Kosciusko E MicroWorks, Inc. $1,600,000 19 Crown Point Lake E AIT Laboratories, Inc. $8,000,000 120 Indianapolis Marion E CSpine, Inc. $3,200,000 49 Plymouth Marshall N Dormir, LLC $2,500,000 161 Carmel Hamilton E AQuMed Manufacturing, LLC $475,000 10 Richmond Wayne N Arcadia Resources, Inc. $3,900,000 315 Indianapolis Marion N Cook Pharmica, LLC $84,000,000 206 Bloomington Monroe E Hill-Rom Services, Inc. $1,600,000 80 Batesville Ripley E Medical Engineering and Development Inst., Inc.
$15,100,000 130 West Lafayette Tippecanoe E
Maaguzi, LLC $556,920 42 Carmel Hamilton E G & S Research, Inc. $1,000,000 48 Carmel Hamilton E Polymer Technology Systems, Inc. $5,500,000 110 Indianapolis Marion E DCL Medical Laboratories $1,400,000 120 Indianapolis Marion E PhySci Pharmaceuticals, Inc. $2,300,000 126 Carmel Hamilton N QuadraSpec, Inc. $1,800,000 47 West Lafayette Tippecanoe E Strand Analytical Labs $3,100,000 45 Indianapolis Marion E Anaclim USA, LLC $2,100,000 120 Indianapolis Marion N Zimmer, Inc. $23,700,000 275 Warsaw Koscuisko E Micropulse, Inc. $5,000,000 43 Columbia City Whitley E Concentrics Research, LLC $860,000 80 Indianapolis Marion E Med Venture Technology Corp. $17,800,000 532 Jeffersonville Clark N OMC Precision Products $14,600,000 71 Indianapolis Marion E Sentry Logistic Solutions, Inc. $7,900,000 30 Indianapolis Marion N BioConvergence, LLC $33,500,000 173 Bloomington Monroe N Paragon Medical, Inc. $15,800,000 113 Pierceton Kosciusko E R2 Diagnostics / Enzyme Solutions $3,600,000 19 South Bend St. Joseph E Summex Corporation $5,500,000 60 Indianapolis Marion E
*N=new investment; E=expansion Source: Indiana Economic Development Corporation
25
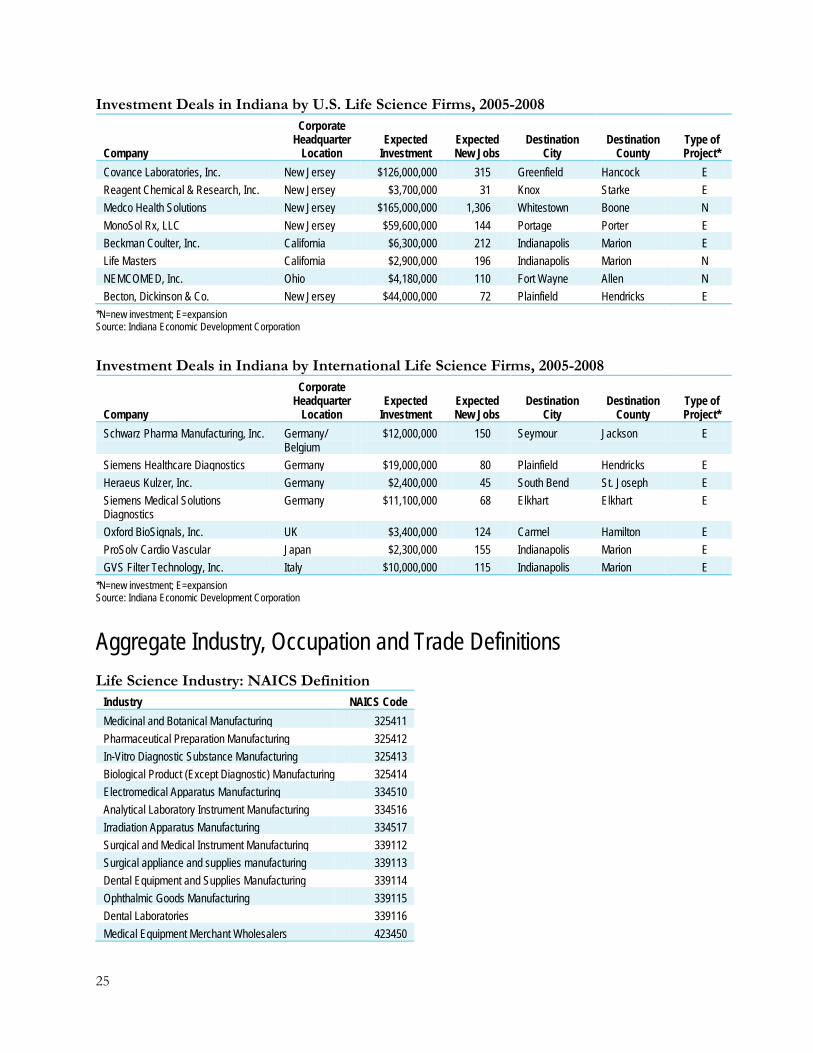
Investment Deals in Indiana by U.S. Life Science Firms, 2005-2008
Company
Corporate Headquarter
Location Expected
Investment Expected New Jobs
Destination City
Destination County
Type of Project*
Covance Laboratories, Inc. New Jersey $126,000,000 315 Greenfield Hancock E Reagent Chemical & Research, Inc. New Jersey $3,700,000 31 Knox Starke E Medco Health Solutions New Jersey $165,000,000 1,306 Whitestown Boone N MonoSol Rx, LLC New Jersey $59,600,000 144 Portage Porter E Beckman Coulter, Inc. California $6,300,000 212 Indianapolis Marion E Life Masters California $2,900,000 196 Indianapolis Marion N NEMCOMED, Inc. Ohio $4,180,000 110 Fort Wayne Allen N Becton, Dickinson & Co. New Jersey $44,000,000 72 Plainfield Hendricks E
*N=new investment; E=expansion Source: Indiana Economic Development Corporation
Investment Deals in Indiana by International Life Science Firms, 2005-2008
Company
Corporate Headquarter
Location Expected
Investment Expected New Jobs
Destination City
Destination County
Type of Project*
Schwarz Pharma Manufacturing, Inc. Germany/ Belgium
$12,000,000 150 Seymour Jackson E
Siemens Healthcare Diagnostics Germany $19,000,000 80 Plainfield Hendricks E Heraeus Kulzer, Inc. Germany $2,400,000 45 South Bend St. Joseph E Siemens Medical Solutions Diagnostics
Germany $11,100,000 68 Elkhart Elkhart E
Oxford BioSignals, Inc. UK $3,400,000 124 Carmel Hamilton E ProSolv Cardio Vascular Japan $2,300,000 155 Indianapolis Marion E GVS Filter Technology, Inc. Italy $10,000,000 115 Indianapolis Marion E
*N=new investment; E=expansion Source: Indiana Economic Development Corporation
Aggregate Industry, Occupation and Trade Definitions
Life Science Industry: NAICS Definition Industry NAICS Code Medicinal and Botanical Manufacturing 325411 Pharmaceutical Preparation Manufacturing 325412 In-Vitro Diagnostic Substance Manufacturing 325413 Biological Product (Except Diagnostic) Manufacturing 325414 Electromedical Apparatus Manufacturing 334510 Analytical Laboratory Instrument Manufacturing 334516 Irradiation Apparatus Manufacturing 334517 Surgical and Medical Instrument Manufacturing 339112 Surgical appliance and supplies manufacturing 339113 Dental Equipment and Supplies Manufacturing 339114 Ophthalmic Goods Manufacturing 339115 Dental Laboratories 339116 Medical Equipment Merchant Wholesalers 423450

26
Industry NAICS Code Druggists' Goods Merchant Wholesalers 424210 Physical, Engineering and Biological Research 541710
Source: IBRC, using U.S. Economic Classification Policy Committee codes
Life Science Occupations: OES Definition Occupation Code Biochemists and Biophysicists 19-1021 Biological Science Teachers, Postsecondary 25-1042 Biological Technicians 19-4021 Biomedical Engineers 17-2031 Environmental Scientists and Specialists, Including Health 19-2041 Life Scientists, All Other 19-1099 Medical Scientists, Except Epidemiologists 19-1042 Microbiologists 19-1022 Natural Sciences Managers 11-9121
Source: IBRC, using Bureau of Labor Statistics codes
Life science exports data were gathered using Harmonized Tariff Schedule (HTS) code to NAICS concordance files from the U.S. Census Bureau, available at www.census.gov/foreign-trade/reference/codes/index.html#concordance. The HTS codes used in each NAICS category are listed in the following table.
Life Science Exports: Harmonized Code Definition Code Description Code Description Pharmaceutical and Medicine Manufacturing (NAICS 325411, 325412, 325414) 130231 Agar-Agar 293731 Epinephrine 293729 Adrenal Cortical Hormones and Deriv, Nesoi 293739 Catecholamine Hormones (Excl Epinephrine), Etc 293919 Alkaloids of Opium and Their Deriv, Salts, Nesoi 293810 Rutoside (Rutin) and Its Derivatives 293391 Alprazolam, Camazepam, Chordiazepoxide (Inn),
Etc. 293911 Concentrate of Poppy Straw, Buprenorphine (Inn)
293740 Amino-Acid Derivatives 293920 Quinine and Its Salts 292249 M-Aminobenzoic Acid, Technical; (Paba), Etc. 293941 Ephedrine and Its Salts 292219 Arom Drugs Amino Alc Cont Only One Oxygen
Function 293942 Pseudoephedrine and Its Salts
294190 Aminoglycoside Antibiotics 293943 Cathine (Inn) and Its Salts 293930 Caffeine and Its Salts 293949 Ephedrines and Their Salts, Nesoi 293359 Pesticides Cont A Pyrimidine Ring or Piperazine Rn 293951 Fenetylline (Inn) and Its Salts 293721 Cortisone, Hydrocortisone, Prednisone, Etc 293959 Theophylline and Aminophylline and Derivs, Salts, Nesoi 293624 D- or Dl-Pantothenic Acid (Vitmin B3 or B5) and Der 293961 Ergometrine and Its Salts 294150 Erythromycin and Its Derivatives; Salts Thereof 293962 Ergotamine and Its Salts 293723 Estrogens and Progestins 293963 Lysergic Acid and Its Salts 293890 Other Glycosides, Natural or Synthetic and Deriv 293969 Alkaloids of Rye Ergot and Their Deriv and Salts, Neso 293722 Halogenated Deriv of Adrenal Cortical Hormones 293991 Cocaine,Ecgonine,Levometamine, Etc; Salts and Deriv 293399 Acridine (10-Azaanthracene) and Indole 294120 Dihydrostreptomycin and Its Deriv.; Salts Thereof 293349 Ethoxyquin (1,2,-Dihydro-6-Ethoxy-2,2,4-Trimet) Etc 294130 Tetracyclines and Their Derivatives; Salts Thereof 293430 Butaperazine Maleate; Chlorpromazine; Etc 294140 Chloramphenicol and Its Derivatives; Salts Thereof 293790 Hormones, Prostaglandins, Etc, Nesoi 300120 Extracts of Glands or Other Orgs or Secretions

27
Code Description Code Description 293712 Insulin and Its Salts 300190 Glands and Other Organs, Dried, Incl Powdered 293229 Aromatic Lactones Used as Pesticides 300210 Human Blood Plasma 292241 Lysine and Its Esters; Salts Thereof 300220 Vaccines For Human Medicine 292800 Methyl Ethyl Ketoxime 300230 Vaccines For Veterinary Medicine 293100 4,4'-Diphenyl-Bis-Phosphonous Acid, Etc. 300290 Ferments 294110 Ampicillin and Its Salts 300310 Medicaments Cont Penicillins or Derivatives Etc 293719 Polypeptide, Protein and Glycoprotein
Hormones,Nesoi 300320 Medicaments Containing Other Antibiotics Etc
293750 Prostaglandins, Thromboxanes and Leukotrienes 300331 Medicaments Containing Insulin but Not Antibiotics 293500 Sulfonamides Used as Drugs 300339 Medicament Cont Hormones or Prod of Hd 2937 Etc 293999 Vegetable Alkaloids, Their Salts and Oth Deriv Nesoi 300340 Medicaments Containing Alkaloids or Derivat Etc 293622 Vitamin B1 (Thiamine) and Its Derivatives 300390 Other Medicaments (Exc Goods of Hds 3002,3005 Etc) 293623 Vitamin B2 (Riboflavin) and Its Derivatives 300410 Medicaments Cont Penicillin G Slts for Vetrin Use 293625 Vitamin B6 (Pyridoxine Etc) and Its Derivatives 300420 Medicaments Cont Antibiotics Nesoi, Vet Use 293627 Vitamin C (Ascorbic Acid) and Its Derivatives 300431 Medicaments Cont Insulin but Not Cont Antibiotics 293628 Vitamin E and Its Derivatives 300432 Medicaments Containing Cortic0Steroid Hormones Etc 293621 Vitamins A and Their Derivatives Unmixed 300439 Medicaments W/ Hormones or of 2937, Veterinary Use 293629 Folic Acid 300440 Medicaments Containing Alkaloids or Derivativ Etc 293690 Provitamins, Unmixed 300450 Medicaments of Heading 2936 Cont Vitamins Etc 291822 Ortho-Acetylsalicylic Acid (Aspirin), Its Salts and
Esters 300490 Medicaments Cont Antigens or Hyaluronic Acid,Etc
292214 Dextropropoxyphene (Inn) and Its Salts 300620 Blood-Grouping Reagents 292244 Tilidine (Inn) and Its Salts 300630 Opacifying Preparations for X-Ray Examinations Etc 293341 Levorphanol (Inn) and Its Salts 300660 Chemical Contraceptive Preps Based on Hormones Etc 293355 Loprazolam (Inn), Mecloqualone (Inn), Etc and Salts 382100 Prepared Cultura Media for Devel of Microorganisms 293626 Vitamin B12 and Its Derivatives 382200 Diagnostic/Lab Reagents, Exc 3002/3006; Cert Ref 293711 Somatotropin, Its Derivs and Struct Analogues Lab and Diagnostic Apparatus (NAICS 334510, 334516, 334517) 854370 Physical Vapor Deposition (Pvd) Apparatus, Nesoi 902213 Apparatus Based on X-Ray; for Dental Uses, Nesoi 902790 Microtomes 902212 Computed Tomography Apparatus 902780 Nuclear Magnetic Resonances Inst Exc Heading
9018 902150 Pacemakers for Stimulating Heart Muscles, Exc Pts
902750 Exposure Meters 902140 Hearing Aids, Excluding Parts and Accessories 902730 Spectrophotometers, Electrical 901890 Optical Instruments and Appliances and Parts, Nesoi 902720 Gas Chromatographs 901820 Ultraviolet or Infrared Ray Apparatus, and Pts and Acc 902710 Gas Or Smoke Analysis Apparatus 901819 Apparatus, Functional Exploratory Examination and Pts 902290 High Tension Generators,Desks,Chair,Etc 901814 Scintigraphic Apparatus 902230 X-Ray Tubes 901813 Magnetic Resonance Imaging Apparatus 902229 Appts, Alpha,Beta,Etc Radiation For Smoke Detector 901812 Ultrasonic Scanning Apparatus 902221 Appts Base On Alpha,Beta,Etc
Radiation,Medical,Etc 901811 Electrocardiographs
902219 Apparatus Base On X-Ray For Oth Use,Ex Medical,Etc
901290 Pts for Microscopes, Exc Optical; Diffraction
902214 Appts Based On X-Ray For Med/Surgical/Vet Use, Nes
901210 Microscopes, Exc Optical; Diffraction Apparatus
Medical Equipment (NAICS 339112, 339113, 339114, 339115) 300510 Adhesive Dressings and Other Artcl Having Adh Lay 902110 Bone Plates, Screws and Nails, and Oth Internal, Fix
Device

28
Code Description Code Description 300590 Wadding, Gauze and Similar Articles Etc Nesoi 902000 Underwater Breathing Devices Carried on Person 300610 Sterile Surgical Catgut, Similar Sterile Mater Etc 901920 Ozone,Oxygen,Etc Therapy, Respiration Apparatus,Pt 300640 Dental Cements and Other Dental Fillings Etc 901910 Mechano-Therapy Appliances and Massage
Apparatus,Pts 300650 First-Aid Boxes and Kits 901850 Other Ophthalmic Instruments and Appliances and Parts 300691 Appliances Identifiable for Ostomy Use 901849 Inst and Appln for Dental Science, and Pts and Acc,
Nesoi 401511 Gloves, Surgical, of Vulcan. Rub. Exc Hard Rubber 901839 Bougies, Catheters, Drains and Sondes and Pts and
Access 841920 Medical, Surgical or Laboratory Sterilizers 901832 Tubular Metal Needles and Needles for Sutures and
Parts 841990 Parts of Mach and Plant for Making
Pulp,Paper,Papbrd 901831 Hypodermic Syringes, With or Without Their Needles
871310 Invalid Carriages, Not Mechanically Propelled 900490 Spectacles, Etc, Corrective, Protective, Nesoi 871390 Invalid Carriages, Nesoi 900410 Sunglasses 871420 Parts and Accessories of Invalid Carriages 900390 Parts for Frames and Mountings, Spectacles, Etc 902519 Pyrometers Not Combined With Other Instruments 900319 Frames and Mountings of Other Materials 902511 Clinical Thermometers Liquid-Filled 900311 Frames and Mountings of Plastics 902190 Appliances Worn/Carried/Implanted and Parts, Nesoi 900150 Spectacle Lenses of Other Materials, Unmounted 902139 Oth Artificial Pts of the Body and Pts and
Accessories 900140 Spectacle Lenses of Glass, Unmounted
902131 Artificial Joints and Parts and Accessories 900130 Contact Lenses 902129 Dental Fittings and Parts and Accessories 900120 Sheets and Plates of Polarizing Material 902121 Artificial Teeth of Plastic and Pts and Accessories
Source: U.S. Census Bureau
