indiana state aviation system plangeneral aviation reliever/ general aviation general aviation...
TRANSCRIPT
INDIANA DEPARTMENT OF TRANSPORTATION Aeronautics Section
Indiana State Aviation System Plan
2003 Update
Prepared by
Aerofinity, Inc. Blalock & Brown
Mid-States Engineering, LLC R. W. Armstrong & Associates, Inc.

Table of Contents
Executive Summary System Plan Findings and Recommendations i Chapter 1 System Inventory Introduction 1-1 The Indiana Aviation System 1-1 Air Traffic Services 1-13 Purpose Grouping of Indiana’s Airports 1-15 Based Aircraft 1-16 Operations 1-18 Pilots 1-19 Passenger Air Service 1-20 Air Cargo 1-21 Economic Impact 1-22 System Inventory Summary 1-23 Chapter 2 Aviation Activity Forecasts Introduction 2-1 Forecasting Methodology 2-1 Statewide Forecasts 2-5 Individual Facility Forecasts 2-11 Chapter 3 Airport Capacity Introduction 3-1 Chapter 4 Market Analysis Introduction 4-1 Pilot Survey 4-1 Business Survey 4-3 Availability of Survey Results 4-6 Chapter 5 Airport Funding Introduction 5-1 Federal Funds 5-1 State Funds 5-7 Local Funds 5-8
Chapter 6 Implementation Plan Introduction 6-1 Ground Access 6-2 Funding 6-4 Airspace Access 6-5 Airport Vicinity Land Use 6-7 Summary 6-8 Bibliography
Appendices
Appendix A System Plan Inclusion Criteria
Appendix B Additional Forecasting Analysis
Appendix C Additional Market Analysis
Appendix D Individual Airport Summaries
Executive Summary
System Plan Findings and Recommendations Aviation System Plan – From Doorstep to Destination
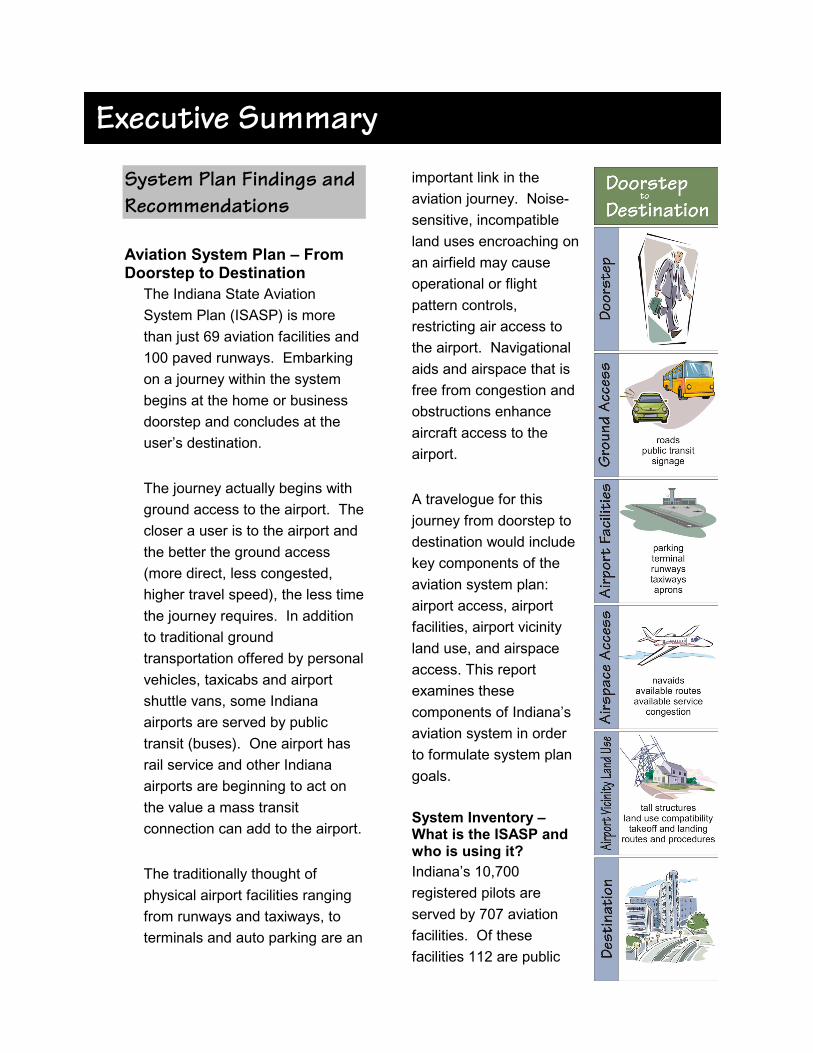
The Indiana State Aviation System Plan (ISASP) is more than just 69 aviation facilities and 100 paved runways. Embarking on a journey within the system begins at the home or business doorstep and concludes at the user’s destination.
The journey actually begins with ground access to the airport. The closer a user is to the airport and the better the ground access (more direct, less congested, higher travel speed), the less time the journey requires. In addition to traditional ground transportation offered by personal vehicles, taxicabs and airport shuttle vans, some Indiana airports are served by public transit (buses). One airport has rail service and other Indiana airports are beginning to act on the value a mass transit connection can add to the airport.
The traditionally thought of physical airport facilities ranging from runways and taxiways, to terminals and auto parking are an
important link in the aviation journey. Noise-sensitive, incompatible land uses encroaching on an airfield may cause operational or flight pattern controls, restricting air access to the airport. Navigational aids and airspace that is free from congestion and obstructions enhance aircraft access to the airport.
A travelogue for this journey from doorstep to destination would include key components of the aviation system plan: airport access, airport facilities, airport vicinity land use, and airspace access. This report examines these components of Indiana’s aviation system in order to formulate system plan goals.
System Inventory – What is the ISASP and who is using it? Indiana’s 10,700 registered pilots are served by 707 aviation facilities. Of these facilities 112 are public
ii
ISASP Airports by Present Classification
Large Corporate
Class Urban
General Aviation Regional
General Aviation Local
General Aviation Air Traffic Control Tower Yes Some No No No Commercial Passenger Service Yes/Recent No No No No Runway Length (feet) 6,500+ 5,000+ 4,000 – 4,999* 4,000 – 4,999 <4,000 Approach Precision Precision/
Nonprecision Nonprecision Nonprecision Nonprecision
Metropolitan Statistical Area MSA) Yes Some Yes No Some NPIAS Class Most
Primary Reliever/
General Aviation Reliever/
General Aviation General Aviation General Aviation
*Indianapolis Metropolitan has a runway length of 3,860 feet, but is a reliever Source: Aerofinity, Inc., 2003
use (106 airports, 4 seaplane bases and 2 heliports). One heliport and 68 of these airports and are recognized as being of “statewide importance” to provide adequate aviation access for the state’s population and are included in the Indiana State Aviation System Plan (ISASP).
In 2003, five of the ISASP airports supported regularly scheduled airline passenger service and four supported regularly scheduled cargo service.
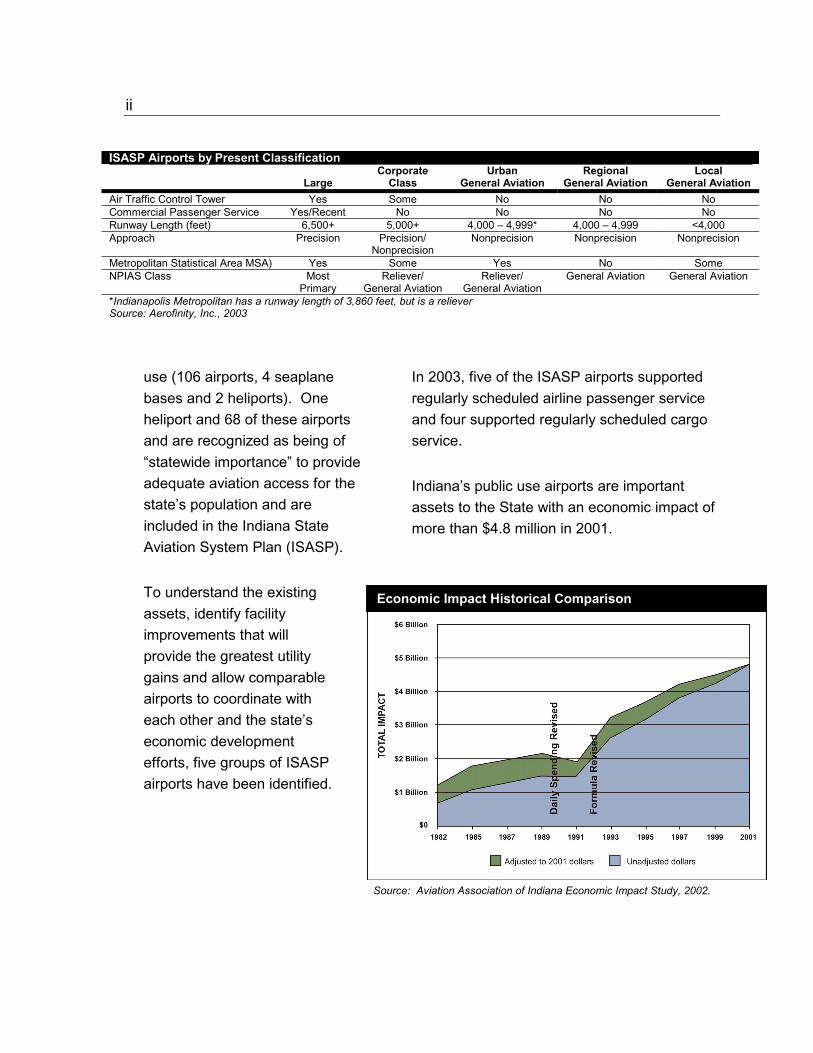
Indiana’s public use airports are important assets to the State with an economic impact of more than $4.8 million in 2001.
To understand the existing assets, identify facility improvements that will provide the greatest utility gains and allow comparable airports to coordinate with each other and the state’s economic development efforts, five groups of ISASP airports have been identified.
Economic Impact Historical Comparison
Source: Aviation Association of Indiana Economic Impact Study, 2002.
iii Aviation Forecasts – what will be the use of the ISASP facilities in the future?
Airport Capacity – Do the ISASP facilities have the capacity to accommodate changes?
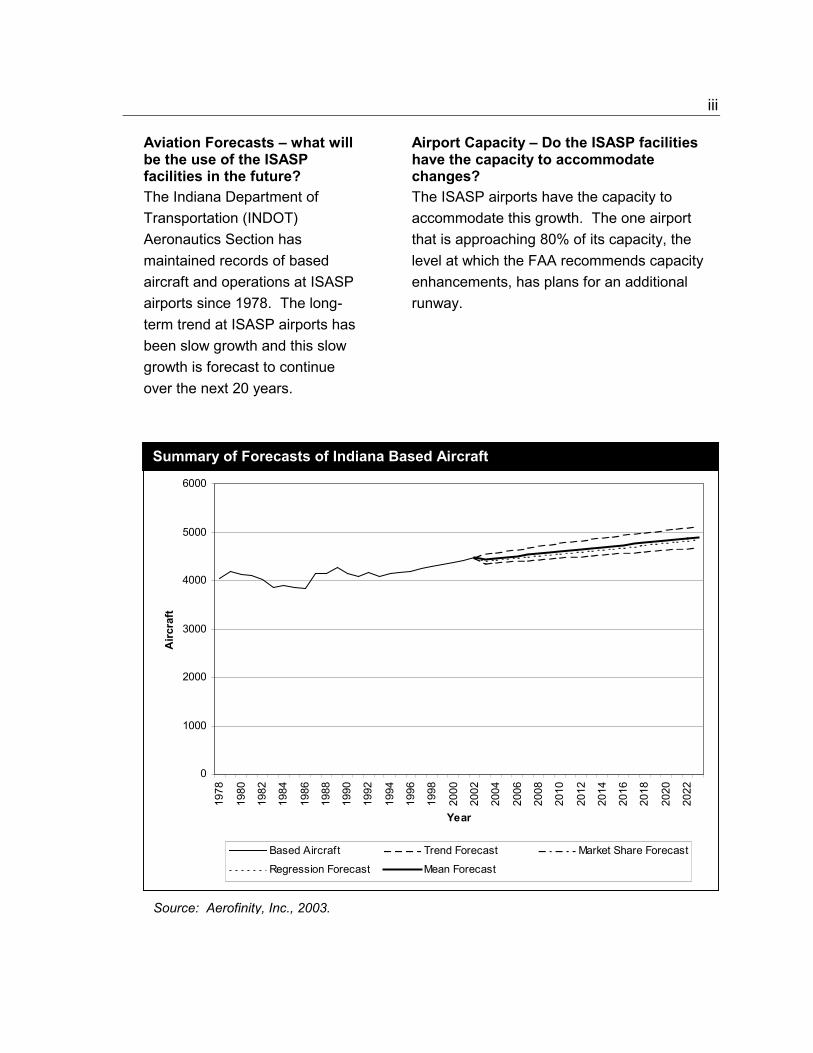
The Indiana Department of Transportation (INDOT) Aeronautics Section has maintained records of based aircraft and operations at ISASP airports since 1978. The long-term trend at ISASP airports has been slow growth and this slow growth is forecast to continue over the next 20 years.
The ISASP airports have the capacity to accommodate this growth. The one airport that is approaching 80% of its capacity, the level at which the FAA recommends capacity enhancements, has plans for an additional runway.
0
1000
2000
3000
4000
5000
6000
1978
1980
1982
1984
1986
1988
1990
1992
1994
1996
1998
2000
2002
2004
2006
2008
2010
2012
2014
2016
2018
2020
2022
Year
Airc
raft
Based Aircraft Trend Forecast Market Share Forecast
Regression Forecast Mean Forecast
Summary of Forecasts of Indiana Based Aircraft
Source: Aerofinity, Inc., 2003.
iv Market Analysis – What do users think of the system?
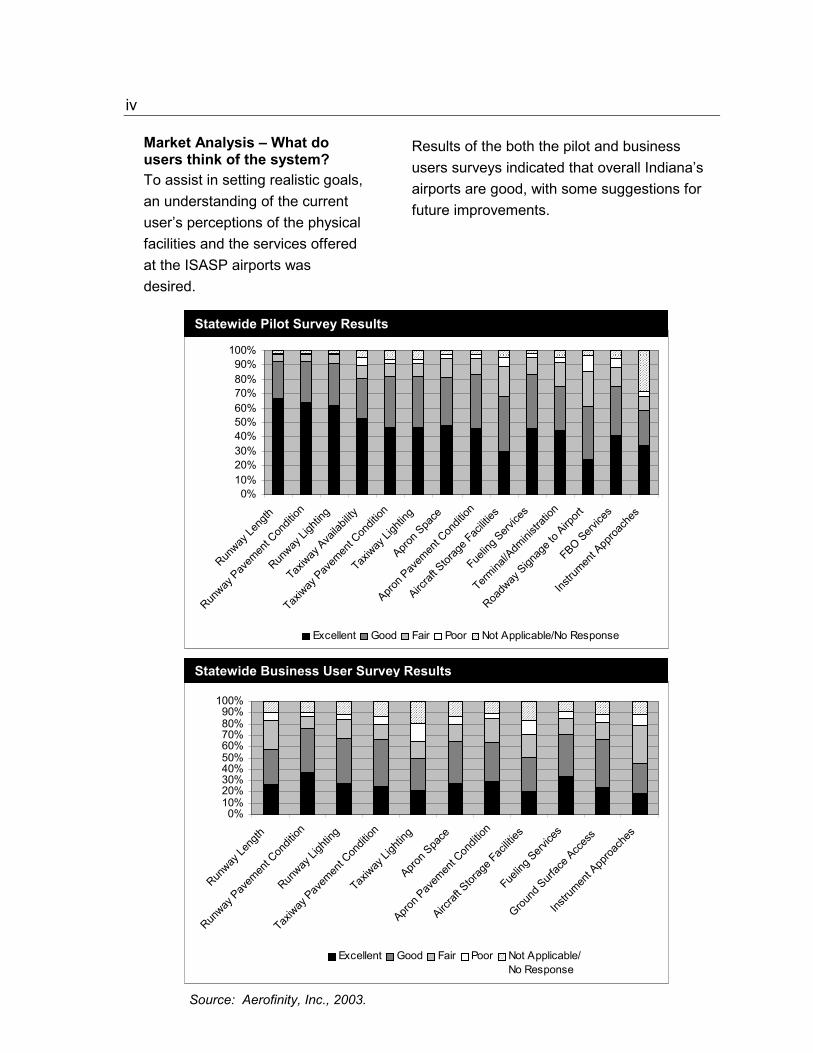
Results of the both the pilot and business users surveys indicated that overall Indiana’s airports are good, with some suggestions for future improvements.
To assist in setting realistic goals, an understanding of the current user’s perceptions of the physical facilities and the services offered at the ISASP airports was desired.
0%10%20%30%40%50%60%70%80%90%
100%
Runway
Leng
th
Runway
Pavem
ent C
ondit
ion
Runway
Ligh
ting
Taxiway
Availa
bility
Taxiway
Pavem
ent C
ondit
ion
Taxiway
Ligh
ting
Apron S
pace
Apron P
avem
ent C
ondit
ion
Aircraf
t Stor
age F
aciliti
es
Fuelin
g Serv
ices
Termina
l/Adm
inistr
ation
Roadw
ay Sign
age t
o Airp
ort
FBO Service
s
Instru
ment A
pproa
ches
Excellent Good Fair Poor
0%10%20%30%40%50%60%70%80%90%
100%
Runway
Leng
th
Runway
Pavem
ent C
ondit
ion
Runway
Ligh
ting
Taxiway
Pavem
ent C
ondit
ion
Taxiway
Ligh
ting
Apron S
pace
Apron P
avem
ent C
ondit
ion
Aircraf
t Stor
age F
aciliti
es
Fuelin
g Serv
ices
Ground
Surfac
e Acc
ess
Instru
ment A
pproa
ches
Excellent Good Fair Poor
Statewide Pilot Survey Results
Not Applicable/No Response
Not Applicable/No Response
Statewide Business User Survey Results
Source: Aerofinity, Inc., 2003.
v Airport Funding - How do you pay for the aviation system?
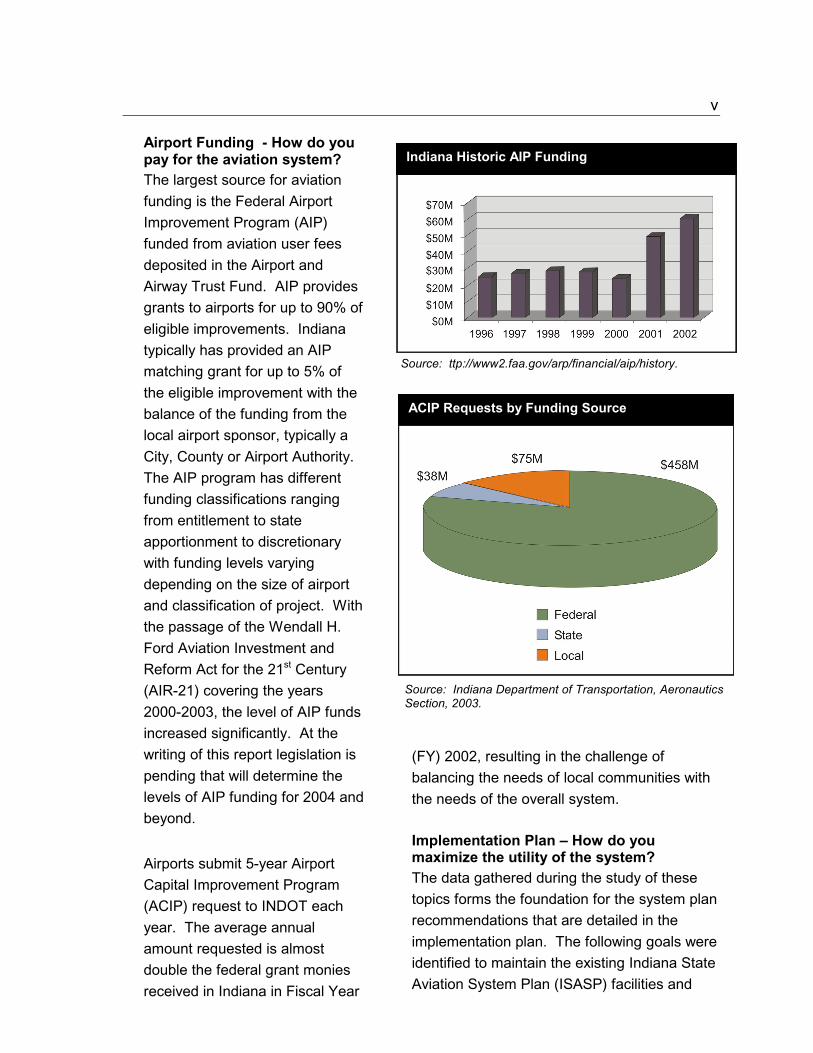
Source: ttp://www2.faa.gov/arp/financial/aip/history.
ACIP Requests by Funding Source
Indiana Historic AIP Funding
The largest source for aviation funding is the Federal Airport Improvement Program (AIP) funded from aviation user fees deposited in the Airport and Airway Trust Fund. AIP provides grants to airports for up to 90% of eligible improvements. Indiana typically has provided an AIP matching grant for up to 5% of the eligible improvement with the balance of the funding from the local airport sponsor, typically a City, County or Airport Authority. The AIP program has different funding classifications ranging from entitlement to state apportionment to discretionary with funding levels varying depending on the size of airport and classification of project. With the passage of the Wendall H. Ford Aviation Investment and Reform Act for the 21st Century (AIR-21) covering the years 2000-2003, the level of AIP funds increased significantly. At the writing of this report legislation is pending that will determine the levels of AIP funding for 2004 and beyond.
Source: Indiana Department of Transportation, Aeronautics Section, 2003.
(FY) 2002, resulting in the challenge of balancing the needs of local communities with the needs of the overall system.
Implementation Plan – How do you maximize the utility of the system? Airports submit 5-year Airport
Capital Improvement Program (ACIP) request to INDOT each year. The average annual amount requested is almost double the federal grant monies received in Indiana in Fiscal Year
The data gathered during the study of these topics forms the foundation for the system plan recommendations that are detailed in the implementation plan. The following goals were identified to maintain the existing Indiana State Aviation System Plan (ISASP) facilities and
vi increase their utility as a business tool for the journey from doorstep to destination.
Ground Access �� Continue close coordination
among the various divisions of the Indiana Department of Transportation to foster the development of highway access to airports within the ISASP and to facilitate planning for future rail access in highway development where appropriate.
Airport Facilities �� As a business tool, continue
to develop the ISASP airports to support corporate class activity by achieving at least 5,000 feet of runway length where feasible and user needs support.
�� Maximize the utility of all ISASP runways, including those less than 5,000 feet.
�� Seek annual legislative support for funding of aviation development.
Airspace Access �� Establish a process for requesting the
installation of new/improved instrument approach procedures with the goal of providing a precision approach for all corporate class and larger airports (5,000+-foot runways) and a nonprecision approach to all other airports.
�� Foster an environment at Indiana’s airports that continues to encourage the support and establishment of passenger and air cargo service to serve the needs of citizens and businesses throughout the state.
Airport Vicinity Land Use �� Strengthen the Indiana Tall Structures Act
and strongly encourage the enactment of local airspace overlay zoning and land use compatibility zoning for all ISASP/public use airports.
ISASP airports are a continuing and growing asset for the State to serve its residents and businesses and to support economic development. The recommendations made in this study have been identified to position Indiana’s airports to successfully meet these needs into the future.
System Inventory CHAPTER 1
Introduction
This report summarizes the findings of an aviation market analysis and update to the Indiana State Aviation System Plan (ISASP) financed by Statewide Planning and Research Funds. The goal of this study process is to provide a basis for aviation planning in the State of Indiana at both the local and statewide levels. The ISASP portion of the analysis is a planning tool that monitors the health of Indiana’s aviation infrastructure and identifies capital needs and eligibility requirements for the development of aviation facilities in the state. The market analysis or airport service evaluation provides input to the statewide ISASP and for individual airports to better serve the aviation users. The ISASP information is also used as input for the Federal Aviation Administration’s (FAA) National Plan of Integrated Airport Systems (NPIAS) and in federal financial decision-making related to the Airport Improvement Program (AIP) grants.
The last ISASP was published in 1995, with validation updates published in 1996 and 1998. This document updates the 1995
report with a focus on providing additional information that allows local airports to assess their facilities and identify steps to make the journey from doorstep to destination user friendly.
The Indiana Department of Transportation (INDOT) Aeronautics Section staff was interested in learning more about what the ISASP airport users like and dislike about the facilities in order to set long-range goals. To gain this information, an extensive market analysis of Indiana’s registered pilots and business community has been completed. This market analysis was accomplished through pilot and business user surveys and is discussed in more detail in the Market Analysis section.
The Indiana Aviation System Indiana State Aviation System Plan (ISASP)
Indiana had 707 public and private use aviation facilities in 2003. Of those facilities: �� 112 are public use facilities (106 airports, 4
seaplane bases, and 2 heliports) – open for public use without restriction
�� 595 are privately owned private use facilities – use of the facility by permission only
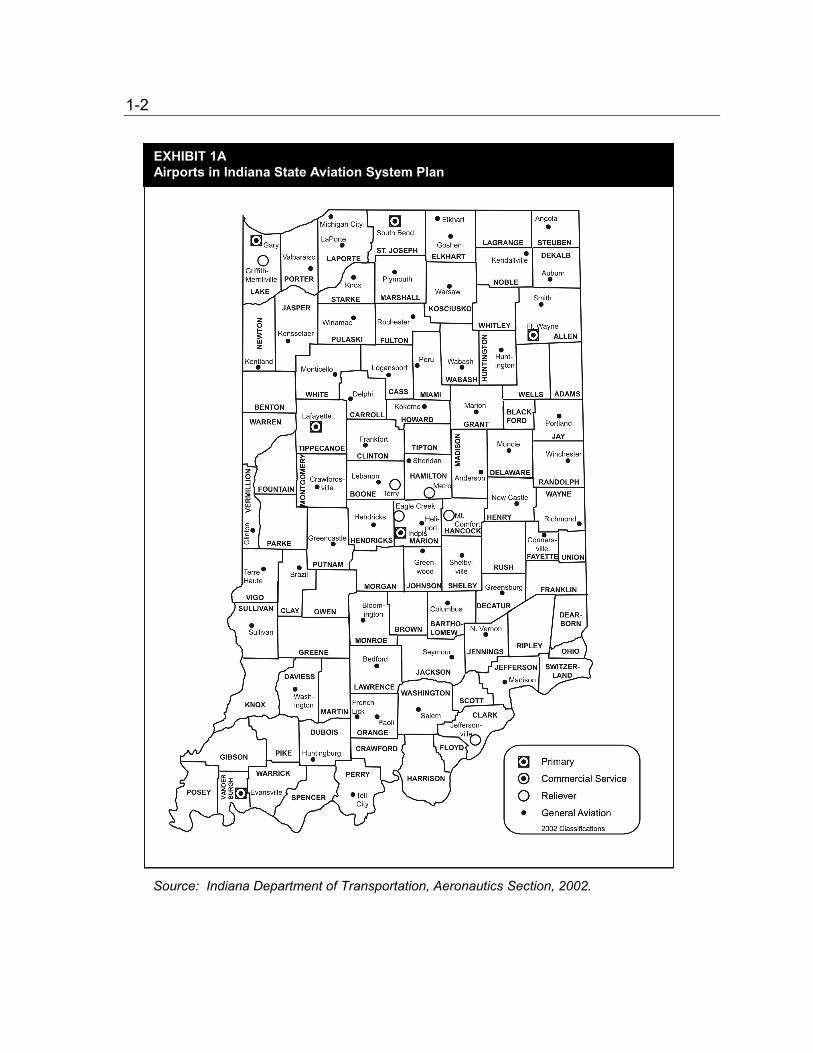
Of the public use facilities, 68 airports and one heliport are recognized by INDOT as being of “statewide importance” to provide adequate aviation access for the state’s population. These 69 facilities are included in the ISASP. The ISASP facilities are shown on Exhibit 1A.
1-2
EXHIBIT 1A Airports in Indiana State Aviation System Plan
Source: Indiana Department of Transportation, Aeronautics Section, 2002.
1-3
National Plan of Integrated Airport Systems (NPIAS)
All but four of the facilities in the ISASP are also included in the NPIAS. The NPIAS recognizes airports that are significant to the national air transportation system. The FAA uses the NPIAS to determine eligibility in administering the AIP grants and to support the FAA’s strategic goals for safety, system efficiency and environmental compatibility by identifying the specific airport improvements that will contribute to these goals.
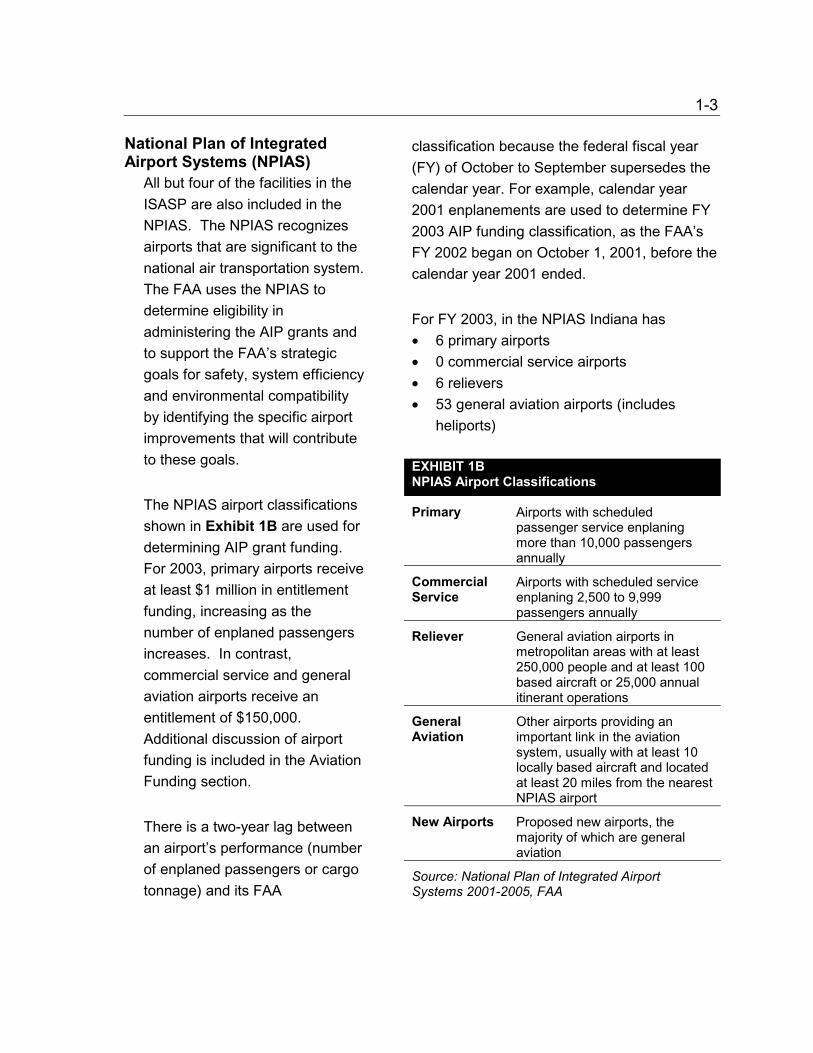
The NPIAS airport classifications shown in Exhibit 1B are used for determining AIP grant funding. For 2003, primary airports receive at least $1 million in entitlement funding, increasing as the number of enplaned passengers increases. In contrast, commercial service and general aviation airports receive an entitlement of $150,000. Additional discussion of airport funding is included in the Aviation Funding section.
There is a two-year lag between an airport’s performance (number of enplaned passengers or cargo tonnage) and its FAA
classification because the federal fiscal year (FY) of October to September supersedes the calendar year. For example, calendar year 2001 enplanements are used to determine FY 2003 AIP funding classification, as the FAA’s FY 2002 began on October 1, 2001, before the calendar year 2001 ended.
For FY 2003, in the NPIAS Indiana has �� 6 primary airports �� 0 commercial service airports �� 6 relievers �� 53 general aviation airports (includes
heliports)
EXHIBIT 1B NPIAS Airport Classifications
Primary Airports with scheduled passenger service enplaning more than 10,000 passengers annually
Commercial Service
Airports with scheduled service enplaning 2,500 to 9,999 passengers annually
Reliever General aviation airports in metropolitan areas with at least 250,000 people and at least 100 based aircraft or 25,000 annual itinerant operations
General Aviation
Other airports providing an important link in the aviation system, usually with at least 10 locally based aircraft and located at least 20 miles from the nearest NPIAS airport
New Airports Proposed new airports, the majority of which are general aviation
Source: National Plan of Integrated Airport Systems 2001-2005, FAA
1-4 Primary Airports The six primary airports are: �� Evansville Regional Airport �� Fort Wayne International
Airport �� Gary/Chicago International
Airport �� Indianapolis International
Airport �� Purdue University Airport
(West Lafayette) �� South Bend Regional Airport
Of these primary airports, Purdue University Airport has been challenged to maintain their scheduled service and primary designation. Also, Gary/Chicago International Airport met the primary criteria in calendar year 2001 for fiscal year 2003 funding, but has been without regularly scheduled service since the carrier suspended service during 2002. Gary/Chicago International Airport’s FY 2004 classification will be based on the final 2002 enplanement figures. Although legislation may result in special provisions to account for post September 11, 2001 loss of service, under the current NPIAS classifications, if the level is at least 10,000 annual enplaned passengers, it will remain a primary airport; if the level is less than 10,000 but more than 2,500 annual enplaned passengers, it will be classified as commercial service, if they have less than 2,500 annual enplaned
passengers, its status would then change back to reliever airport based on the number of itinerant operations. Terre Haute International is currently classified as a general aviation airport, but had been classified as a commercial service airport until 2002 and also supported air cargo activity through 1999.
Reliever Airports At the time of the 1995 ISASP, Indiana had 10 reliever airports with an additional one under construction. In December 2000, a new NPIAS Order was published that changed the reliever criteria. The old reliever criteria was 50 based aircraft or 25,000 annual itinerant operations, or 35,000 annual local operations, or a precision instrument landing system at an airport relieving a primary airport in a metropolitan area with at least 250,000 population or 250,000 annual passengers at 60% capacity if not for the relief. The new criteria changed to 100 based aircraft or 25,000 annual itinerant operations to relieve the same type of airport. With this change a number of the publicly owned reliever airports in Indiana changed to a general aviation airport classification. The privately owned reliever airports that did not meet the new criteria, but that had received federal funds and were federally obligated to maintain the airport for 20 years from the past grant funding, were “grandfathered” to remain as reliever airports.
The six reliever airports, with the airport they relieve identified in parentheses are: �� Griffith-Merrillville – privately owned
(Chicago Midway) �� Indianapolis Metropolitan (Indianapolis
International) �� Indianapolis Terry – privately owned
(Indianapolis International)
1-5 �� Mount Comfort (Indianapolis
International) �� Eagle Creek Airpark
(Indianapolis International) �� Clark County (Louisville
International)
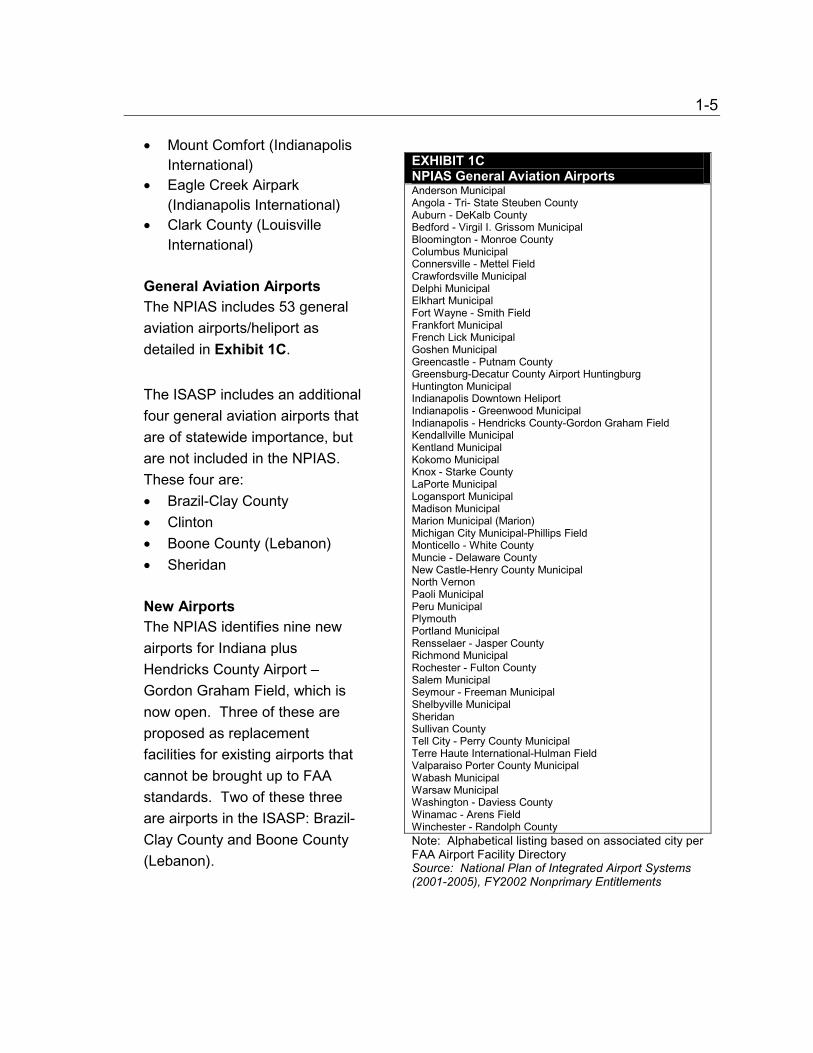
General Aviation Airports The NPIAS includes 53 general aviation airports/heliport as detailed in Exhibit 1C.
The ISASP includes an additional four general aviation airports that are of statewide importance, but are not included in the NPIAS. These four are: �� Brazil-Clay County �� Clinton �� Boone County (Lebanon) �� Sheridan
New Airports The NPIAS identifies nine new airports for Indiana plus Hendricks County Airport – Gordon Graham Field, which is now open. Three of these are proposed as replacement facilities for existing airports that cannot be brought up to FAA standards. Two of these three are airports in the ISASP: Brazil-Clay County and Boone County (Lebanon).
EXHIBIT 1C NPIAS General Aviation Airports Anderson Municipal Angola - Tri- State Steuben County Auburn - DeKalb County Bedford - Virgil I. Grissom Municipal Bloomington - Monroe County Columbus Municipal Connersville - Mettel Field Crawfordsville Municipal Delphi Municipal Elkhart Municipal Fort Wayne - Smith Field Frankfort Municipal French Lick Municipal Goshen Municipal Greencastle - Putnam County Greensburg-Decatur County Airport Huntingburg Huntington Municipal Indianapolis Downtown Heliport Indianapolis - Greenwood Municipal Indianapolis - Hendricks County-Gordon Graham Field Kendallville Municipal Kentland Municipal Kokomo Municipal Knox - Starke County LaPorte Municipal Logansport Municipal Madison Municipal Marion Municipal (Marion) Michigan City Municipal-Phillips Field Monticello - White County Muncie - Delaware County New Castle-Henry County Municipal North Vernon Paoli Municipal Peru Municipal Plymouth Portland Municipal Rensselaer - Jasper County Richmond Municipal Rochester - Fulton County Salem Municipal Seymour - Freeman Municipal Shelbyville Municipal Sheridan Sullivan County Tell City - Perry County Municipal Terre Haute International-Hulman Field Valparaiso Porter County Municipal Wabash Municipal Warsaw Municipal Washington - Daviess County Winamac - Arens Field Winchester - Randolph County Note: Alphabetical listing based on associated city per FAA Airport Facility Directory Source: National Plan of Integrated Airport Systems (2001-2005), FY2002 Nonprimary Entitlements
1-6 Replacement Facilities �� Brazil – replacement for
Brazil-Clay County �� Decatur – replacement �� Lebanon – replacement for
Boone County
New Facilities �� Bluffton/Hartford City �� Lake Village �� Martinsville �� Mt. Vernon �� Perrysville �� Princeton
There are no active new airport construction proposals in process in Indiana.
Adding Airports to the ISASP INDOT has established a process for evaluating airports and their activity levels in order to assess the need for new airport construction in Indiana, and to clarify how additional existing airports might be included in the ISASP. This process establishes objective thresholds as performance measures to evaluate the potential ISASP airports, and is intended to evaluate proposals for construction of new airports, as well as proposals to include existing non-system airports in the ISASP.
The process criteria closely parallels the definitions of the
NPIAS and includes the use of socioeconomic data to ensure that new airport proposals will be based on quantifiable aviation demand that serves an additional market without harming an airport already included in the ISASP.
The definitions used for primary, commercial service and reliever airport are identical to the NPIAS definitions described previously.
The INDOT criteria for proposed new general aviation airports to be included in the ISASP aids in interpreting the broad guidelines of the NPIAS. New general aviation airport construction will only be proposed if the new facility would meet one of five conditions. It should be noted that although the word “relief” is used in the following descriptions, the airports referred to are not intended to be designated as reliever airports. �� New airport construction for airspace relief �� New airport construction for capacity relief
(other than reliever airport) �� New airport construction to resolve social
or environmental problem �� New airport construction to serve a
population, employment or income base �� New airport construction to provide for
emergency services
Adequate demand and community support must still be demonstrated in order to justify construction of a new facility. Adequate demand is defined as meeting the levels required by state and national funding priority systems. Since it is not likely that state-supplied resources would be sufficient to complete the construction of a new airport without additional assistance from federal programs, a new airport is required to serve an
1-7 identifiable demand that meets both state and federal priority systems in operation at the time. At a minimum, however, this must equate to at least 20 based aircraft, since that level is the minimum number to meet federal funding eligibility requirements.
Adequate community support is defined as obtaining a sponsor (either public or private) willing to undertake the development and commit to at least 20 years of operation, as well as substantial support from federal, state and local governments and the local population. In addition, the new airport proposal is required to adequately meet the forecast aviation demand for at least a 20-year period. The only acceptable departure from this requirement would be in the case of a facility needed to provide access for emergency service. Additional details on the inclusion of a new general aviation airport in the system plan are included in Appendix A.
Airport Ownership Only four of the 69 ISASP airports are privately owned. One of these four, Terry Airport, a privately owned reliever, is in the process of a proposed transition to public ownership by the Hamilton County Board of Aviation Commissioners.
Of the other 39 public use airports that are not included in the ISASP, 32 are privately owned. There are publicly owned, public use airports in Boonville, Converse, Flora, Galveston, Nappanee, Orleans, and Waveland-Shades State Park, which have not met the criteria for inclusion in the ISASP.
One other unique publicly owned facility is Grissom Aeroplex. Formerly an Air Force Reserve Base, as a result of the Base Closure and Realignment Act of 1990, the Grissom Air Reserve Base (GARB) was realigned in 1994. The facility is now operated by the Grissom Redevelopment Authority (GRA), which was established to oversee the civilian redevelopment of the base. The Air Force Reserve unit still operates at Grissom and the facility is restricted for military use, except by special permission for a limited number of annual civilian operations allowed under the Joint Use Agreement. The GRA is actively seeing commercial uses with the limits of the Joint Use Agreement.
While all public use airports are protected to a certain extent by Indiana Code 8-21-10, Regulation of Tall Structures, privately owned airports are more vulnerable to encroachment of incompatible development and have fewer financial resources to provide for maintenance, development, and upgrades.
Privately owned facilities lack the ability to acquire land or easements through eminent domain, and are therefore are less able to prevent loss of useful runway length due to encroaching obstructions. Most of the recent airport closures, or conversion of airports from public use to private use, have occurred with
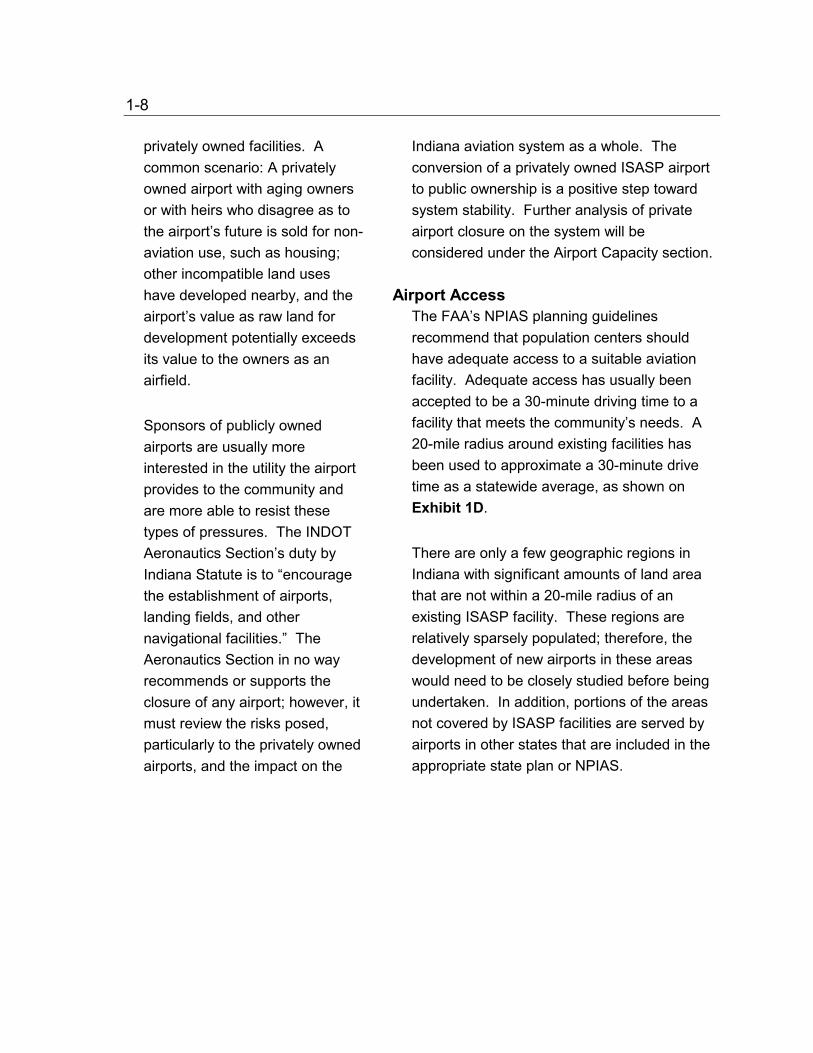
1-8 privately owned facilities. A common scenario: A privately owned airport with aging owners or with heirs who disagree as to the airport’s future is sold for non-aviation use, such as housing; other incompatible land uses have developed nearby, and the airport’s value as raw land for development potentially exceeds its value to the owners as an airfield.
Sponsors of publicly owned airports are usually more interested in the utility the airport provides to the community and are more able to resist these types of pressures. The INDOT Aeronautics Section’s duty by Indiana Statute is to “encourage the establishment of airports, landing fields, and other navigational facilities.” The Aeronautics Section in no way recommends or supports the closure of any airport; however, it must review the risks posed, particularly to the privately owned airports, and the impact on the
Indiana aviation system as a whole. The conversion of a privately owned ISASP airport to public ownership is a positive step toward system stability. Further analysis of private airport closure on the system will be considered under the Airport Capacity section.
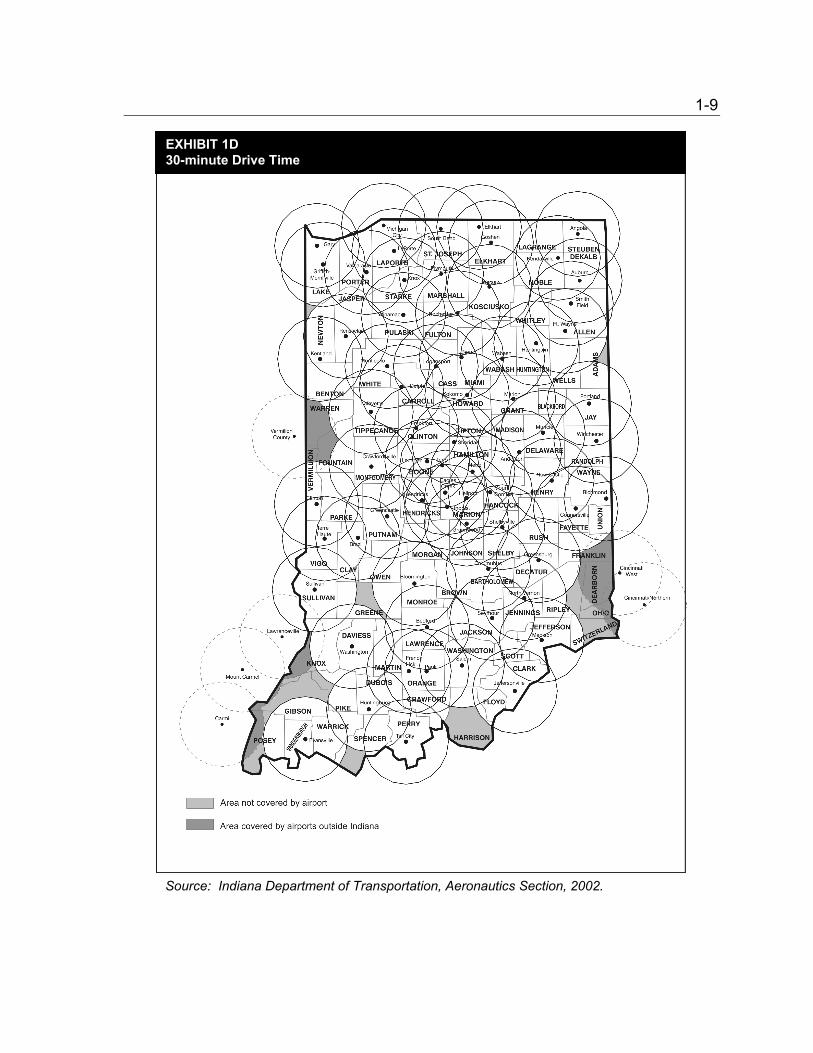
Airport Access The FAA’s NPIAS planning guidelines recommend that population centers should have adequate access to a suitable aviation facility. Adequate access has usually been accepted to be a 30-minute driving time to a facility that meets the community’s needs. A 20-mile radius around existing facilities has been used to approximate a 30-minute drive time as a statewide average, as shown on Exhibit 1D.
There are only a few geographic regions in Indiana with significant amounts of land area that are not within a 20-mile radius of an existing ISASP facility. These regions are relatively sparsely populated; therefore, the development of new airports in these areas would need to be closely studied before being undertaken. In addition, portions of the areas not covered by ISASP facilities are served by airports in other states that are included in the appropriate state plan or NPIAS.
1-9
EXHIBIT 1D 30-minute Drive Time
Source: Indiana Department of Transportation, Aeronautics Section, 2002.
1-10
Runway Length The total population included in the 20-mile radius of an ISASP facility has been conservatively estimated. For the purpose of this analysis, each county’s population density has assumed to be uniform throughout the county. The proportion of the county’s land area not covered by a system plan airport has then been estimated and multiplied by the total population of the affected county, resulting in an estimate of the population not served. Using this analysis process, approximately 180,000 people or 2.9% of Indiana’s population is not serviced by an ISASP airport. Taking into account airports in neighboring states, approximately 87,000 people or 1.4% of Indiana’s population is not serviced by an ISASP airport or neighboring state equivalent within 20-miles.
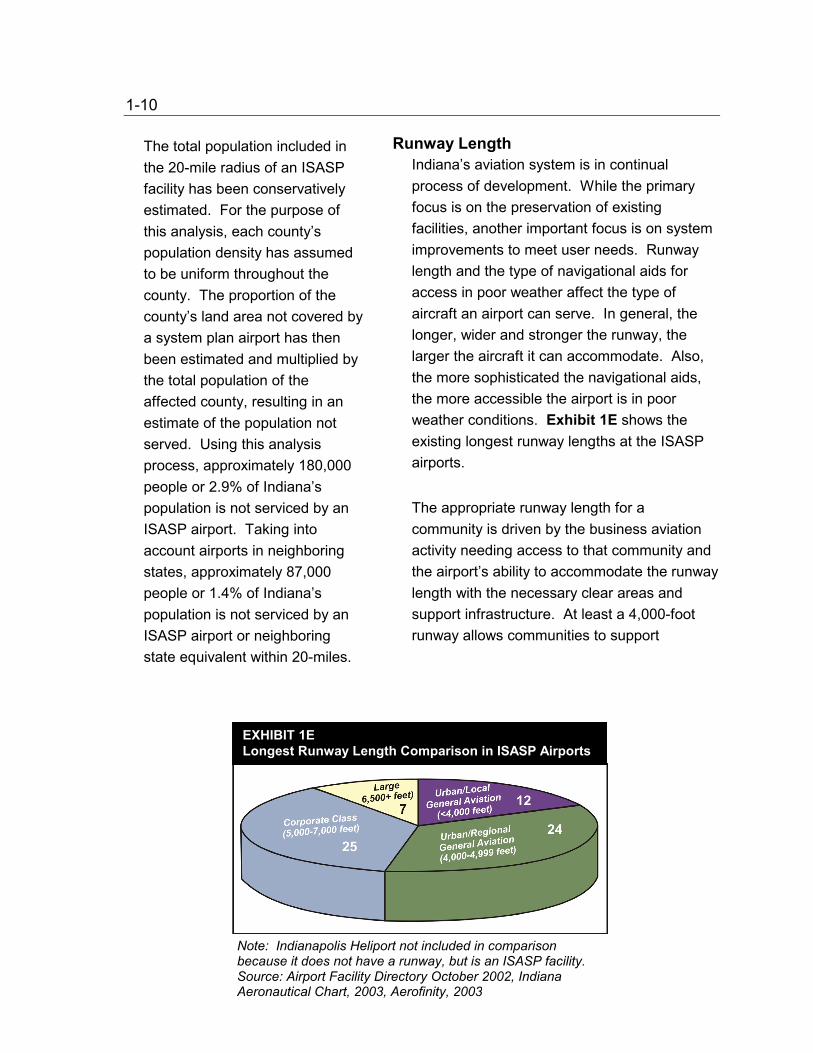
Indiana’s aviation system is in continual process of development. While the primary focus is on the preservation of existing facilities, another important focus is on system improvements to meet user needs. Runway length and the type of navigational aids for access in poor weather affect the type of aircraft an airport can serve. In general, the longer, wider and stronger the runway, the larger the aircraft it can accommodate. Also, the more sophisticated the navigational aids, the more accessible the airport is in poor weather conditions. Exhibit 1E shows the existing longest runway lengths at the ISASP airports.
The appropriate runway length for a community is driven by the business aviation activity needing access to that community and the airport’s ability to accommodate the runway length with the necessary clear areas and support infrastructure. At least a 4,000-foot runway allows communities to support
EXHIBIT 1E Longest Runway Length Comparison in ISASP Airports
Note: Indianapolis Heliport not included in comparison because it does not have a runway, but is an ISASP facility. Source: Airport Facility Directory October 2002, Indiana Aeronautical Chart, 2003, Aerofinity, 2003
1-11 operations by all piston powered aircraft, turbo prop aircraft and entry-level business jets, all of which are used by corporations for air transportation. When a community has at least a 5,000-foot runway, it can also support mid-level business jets. Additional runway length beyond 5,000 feet is used to support operations by larger corporate aircraft, corporate aircraft with longer trip lengths (heavier on departure due to more fuel onboard), and commercial service type aircraft.
A goal of the 1995 ISASP was to upgrade the system plan airports to provide at least 4,000 feet of runway length. Since the 1995 ISASP, 18 airports have increased the length of their primary runway, with five going from less than 4,000 feet to more than 4,000 feet, two of which extended to 5,000 feet.
�� Huntington Municipal – 3,709 feet to 5,000 feet
�� Plymouth Municipal – 3,571 feet to 4,400 feet
�� Shelbyville Municipal – 3,732 feet to 5,000 feet
�� Sullivan County Airport – 3,559 feet to 4,360 feet
�� Tell City - Perry County Municipal – 3,200 feet to 4,400 feet
Three of the increases were to more than 4,000 feet at airports with at least 4,000 feet: �� Angola – Tri-State Steuben County – 4,000
feet to 4,540 feet �� Crawfordsville Municipal – 4,001 feet to
4,500 feet �� Knox- Starke County – 4,002 to 4,500 feet Seven of the increases were to 5,000 feet or more at airport with at least 4,000 feet: �� Frankfort Municipal – 4,000 feet to 5,000
feet �� Greencastle - Putnam County – 4,006 feet
to 5,000 feet �� North Vernon – 4,503 feet to 5,000 feet �� Richmond Municipal – 5,200 feet to 5,500
feet �� Rochester - Fulton County – 4,400 feet to
5,000 feet Five of the increases were for 6,000 feet or more at airports with at least 5,000 feet: �� Connersville - Mettel Field – extend 5,003-
foot primary runway to 6,500 feet �� Indianapolis International – replacement
parallel runway 11,200 feet �� South Bend Regional – extend 7,099-foot
primary runway to 8,400 feet �� Valparaiso - Porter County Airport – extend
6,000-foot primary runway to 7,000 feet �� Warsaw Municipal – extend 5,034-foot
primary runway to 6,000 feet
1-12 Of the 69 ISASP airports, 28 have five-year capital improvement program requests that include increases in their primary runway length. Due to funding constraints and justification of need, not all of the requests will be funded, at least in the immediate future. Airport funding is discussed in more detail in Aviation Funding section.
Most of these increases are to existing runways, but some are the construction of a longer runway to replace an existing constrained runway. �� Six requests would provide a
4,000-foot or longer runway for an airport with less than 4,000 feet of runway.
�� Four requests would increase an existing runway of at least 4,000 feet, but will result in less than a 5,000-foot runway.
�� Nine requests would provide a 5,000- to 5,500-foot runway for an airport with currently 4,000 to 4,500 feet of runway.
�� Five requests would provide a 6,000- to 6,500-foot runway for an airport with currently 5,000 to 6,000 feet of runway.
�� Three requests would provide a 7,000- to 7,500-foot runway for an airport with currently 5,000 to 6,500 feet of runway.
�� One request would provide an 8,900-foot runway for an
airport with currently 7,000 feet of runway. �� One airport has requested the construction
of a parallel runway. If all of the extensions to at least 4,000 feet occur, the ISASP will have only six airports remaining with less than 4,000 feet. The other three airports are located within constrained sites: �� Fort Wayne Smith Field �� Indianapolis Metropolitan �� Paoli Municipal
Of these three, Fort Wayne Smith Field is in the process of an airport layout plan update focusing on maximizing the airport’s potential, including studying the appropriate long-term runway length.
Three of these six airports are privately owned and did not submit capital improvement program requests: �� Clinton �� Boone County �� Sheridan
Parallel Taxiway Systems Parallel taxiway systems increase the margin of safety at an airport by allowing an aircraft to access the runway without backtaxiing on the runway. Some parallel taxiway systems exactly parallel the runway while others are a series of taxiways. A full parallel taxiway system allows aircraft to access both runway ends without any backtaxiing on the runway. A partial parallel taxiway system provides access to at least one runway end; thus lessening, but not eliminating backtaxiing on the runway.
1-13 There are 100 paved runways and nine turf runways at ISASP airports. These runways are served by 55 full parallel taxiway systems and 18 partial parallel taxiway systems. Three airports have more full parallel taxiway systems than runways, due to dual parallel taxiway systems (a full parallel taxiway on each side of the runway). These three airports are: �� Eagle Creek Airpark �� Indianapolis International �� South Bend Regional
Air Traffic Services Air traffic control and navigational aids (navaids) allow for a systematic flow of aircraft throughout the national airspace.
Air Route Traffic Control Centers
Indianapolis is home to one of the FAA’s air route traffic control centers (ARTCC). ARTCCs are the central authority for issuing IFR clearances and provide monitoring of each IFR flight, primarily during the en route phase. The Indianapolis ARTCC controls the southern portions of Indiana and Ohio, the majority of Kentucky, and small portions of Illinois, West Virginia and Virginia.
Airport Traffic Control Towers Indiana is currently served by 12 airport traffic control towers (ATCTs). The type of tower varies from 24-hour FAA ATCTs to non-federal, locally funded ATCTs. �� 24-hour FAA ATCTs – Fort Wayne
International, Indianapolis International and Terre Haute International
�� FAA ATCTs that close at night – Evansville Regional, Purdue University, South Bend Regional
�� FAA contract tower – Gary/Chicago International
�� FAA contract tower cost sharing program – Monroe County Airport, Columbus Municipal Airport, Delaware County Airport
�� Locally funded non federal tower – Anderson Municipal and Elkhart Municipal
In addition to ATCTs, Indiana is served by nine radar-equipped facilities. Three of these are located outside of Indiana’s borders in Chicago, Louisville and Cincinnati. Four serve Class C airspace in Evansville, Fort Wayne, Indianapolis and South Bend. One serves the Class D airspace in Terre Haute. Radar service is also available from Grissom Aeroplex, which is primarily intended for the military operations, but is also available to civilian pilots.
Navigational Aids (Navaids) Navaids vary in sophistication and have two primary functions: en route and local. En route navaids assist in the travel from place to place. Local facilities assist in the accessibility of a specific airport, especially in poor weather conditions. Local navaids are used primarily
1-14 for navigation to and landing at an airport. The better an airport’s navaids, the more accessible it will be to the flying public in all weather conditions.
There are a total of 17 VHF (very high frequency) navaids, including VORs (Very High Frequency Omnirange); VORTACs (VOR co-located with a Tactical Air Navigation (TACAN); a military navigational aid providing distance measuring capability; and VOR/DMEs (VOR co-located with Distance Measuring Equipment), with their associated network designated routes, called Victor Airways. These navaids are used both for en route navigation and instrument approaches to airports and runways. In addition, there are 46 nondirectional beacons (NDBs) in Indiana. While these are also capable of being used for en route navigation, they are more commonly used for instrument approaches, or as part of a precision instrument landing system (ILS).
There are 30 ILS located at 22 airports in Indiana. An ILS is the most precise instrument approach currently available, providing both horizontal and vertical guidance. An ILS will have lower minimums (aircraft can be lower to the ground and
closer to the runway before visual identification of the runway environment is needed) because of its precision. Nonprecision approaches offer only horizontal alignment with the runway, necessitating higher minimums. Three airports also have only the localizer portion of an ILS system, which provides only horizontal guidance and is considered a nonprecision approach.
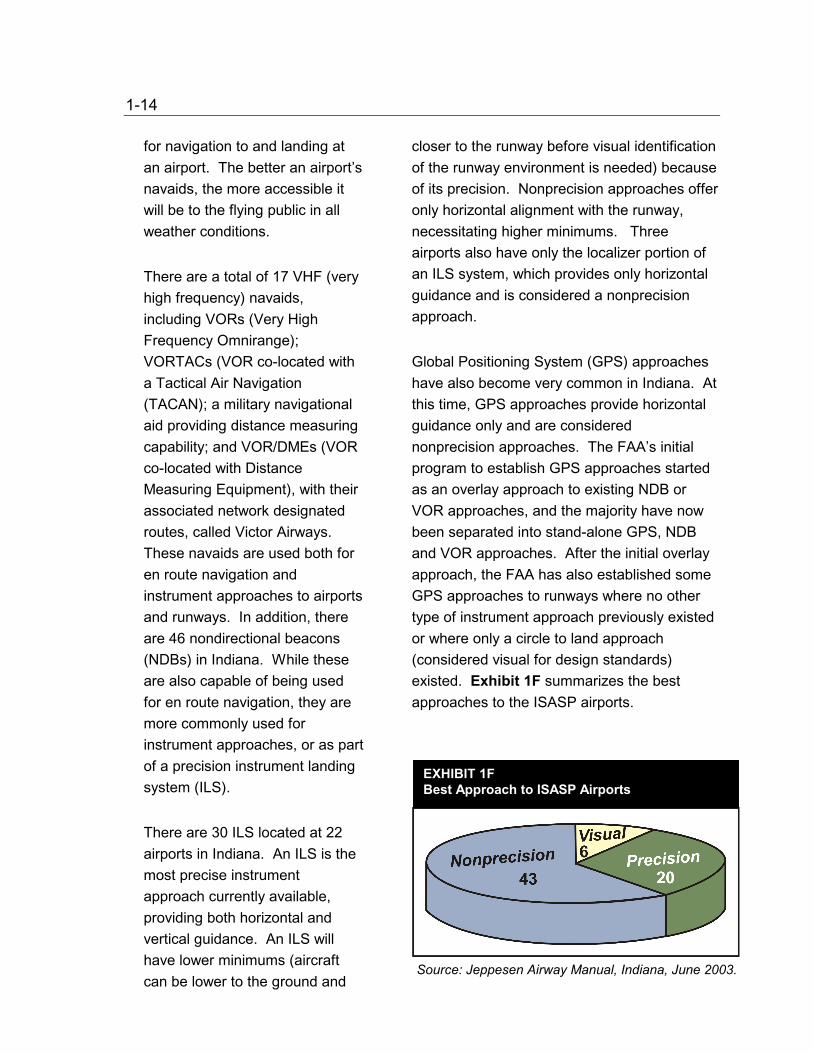
Global Positioning System (GPS) approaches have also become very common in Indiana. At this time, GPS approaches provide horizontal guidance only and are considered nonprecision approaches. The FAA’s initial program to establish GPS approaches started as an overlay approach to existing NDB or VOR approaches, and the majority have now been separated into stand-alone GPS, NDB and VOR approaches. After the initial overlay approach, the FAA has also established some GPS approaches to runways where no other type of instrument approach previously existed or where only a circle to land approach (considered visual for design standards) existed. Exhibit 1F summarizes the best approaches to the ISASP airports.
EXHIBIT 1FBest Approach to ISASP Airports
Source: Jeppesen Airway Manual, Indiana, June 2003.
1-15
Automated Weather Reporting Automated Weather Observation System (AWOS) and Automated Surface Observation System (ASOS) have been increasingly installed at Indiana airports. These systems allow pilots to receive local, up-to-date, weather 24 hours a day. The weather information is typically transmitted over a radio or navaid frequency and via telephone. These systems are a particular benefit to pilots on IFR flight plans, which require knowledge of local weather conditions to determine if the required minimum weather conditions are available for landing. In addition, at many airports, with a local altimeter setting, lower minimums are available than when using an altimeter setting from a distant reporting facility. The ASOS systems are installed and maintained by the National Weather Service. The AWOS systems can be installed with local or AIP funding. There are 12 ASOS and 14 AWOS installed
and commissioned at Indiana airports. In 2002, an additional eight airports received funding for the installation of weather reporting equipment. The construction and certification of these eight systems are in process, which will bring the total ISASP airports served by an ASOS or AWOS system to 34. Also, nine airports have requested the installation of an AWOS as a part of their five-year capital improvement program requests.
Purpose Grouping of Indiana’s Airports
To further address runway length and navigational aids, in addition to the NPIAS classification of airports, Indiana has been working to group airports based on their facilities and function. The goal is to understand the existing assets, identify facility improvements that will provide the greatest utility gains, and allow comparable airports to coordinate with each other and the state’s economic development efforts.
Five groups of ISASP airports have been identified. There is also one heliport, the Indianapolis Downtown Heliport, in the system plan. Exhibit 1G contains a listing of the ISASP airports by present grouping. The
EXHIBIT 1G ISASP Airports by Present Classification
Large Corporate
Class Urban
General Aviation Regional
General Aviation Local
General Aviation Air Traffic Control Tower Yes Some No No No Commercial Passenger Service Yes/Recent No No No No Runway Length (feet) 6,500+ 5,000+ 4,000 – 4,999* 4,000 – 4,999 <4,000 Approach Precision Precision/
Nonprecision Nonprecision Nonprecision Nonprecision
Metropolitan Statistical Area MSA) Yes Some Yes No Some NPIAS Class Most
Primary Reliever/
General Aviation Reliever/
General Aviation General Aviation General Aviation
*Indianapolis Metropolitan has a runway length of 3,860 feet, but is a reliever Source: Aerofinity, Inc., 2003
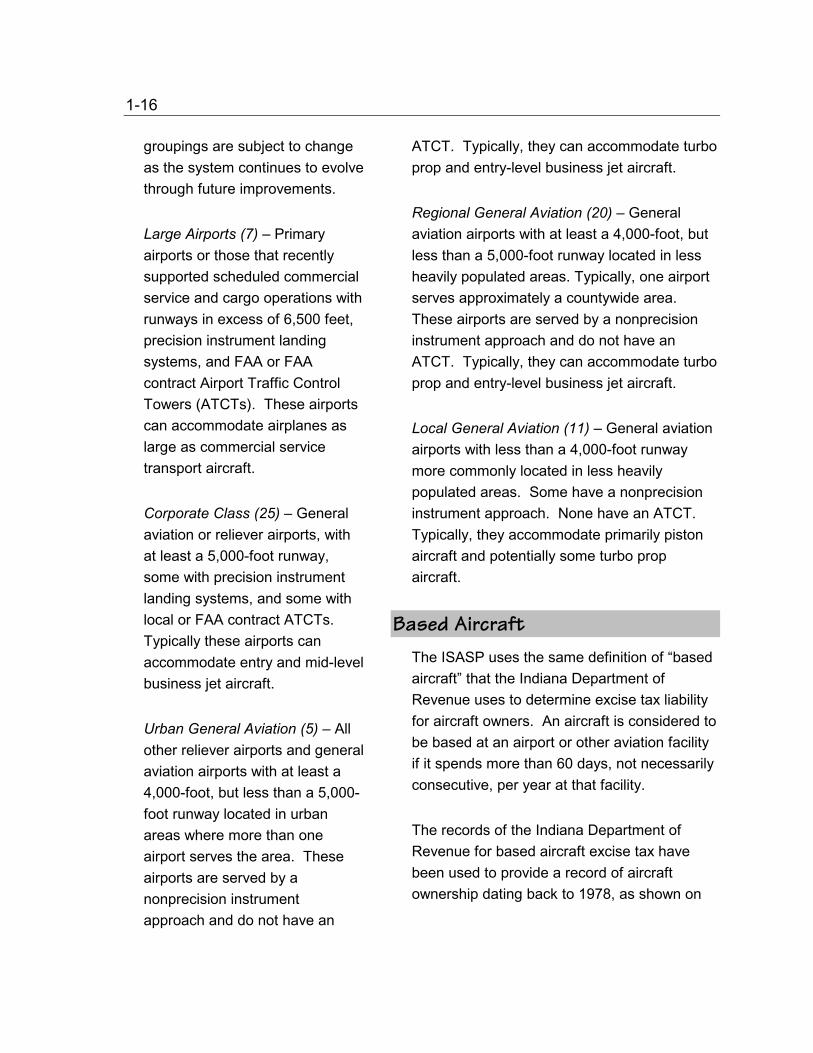
1-16 groupings are subject to change as the system continues to evolve through future improvements.
Large Airports (7) – Primary airports or those that recently supported scheduled commercial service and cargo operations with runways in excess of 6,500 feet, precision instrument landing systems, and FAA or FAA contract Airport Traffic Control Towers (ATCTs). These airports can accommodate airplanes as large as commercial service transport aircraft.
Corporate Class (25) – General aviation or reliever airports, with at least a 5,000-foot runway, some with precision instrument landing systems, and some with local or FAA contract ATCTs. Typically these airports can accommodate entry and mid-level business jet aircraft.
Urban General Aviation (5) – All other reliever airports and general aviation airports with at least a 4,000-foot, but less than a 5,000-foot runway located in urban areas where more than one airport serves the area. These airports are served by a nonprecision instrument approach and do not have an
ATCT. Typically, they can accommodate turbo prop and entry-level business jet aircraft.
Regional General Aviation (20) – General aviation airports with at least a 4,000-foot, but less than a 5,000-foot runway located in less heavily populated areas. Typically, one airport serves approximately a countywide area. These airports are served by a nonprecision instrument approach and do not have an ATCT. Typically, they can accommodate turbo prop and entry-level business jet aircraft.
Local General Aviation (11) – General aviation airports with less than a 4,000-foot runway more commonly located in less heavily populated areas. Some have a nonprecision instrument approach. None have an ATCT. Typically, they accommodate primarily piston aircraft and potentially some turbo prop aircraft.
Based Aircraft The ISASP uses the same definition of “based aircraft” that the Indiana Department of Revenue uses to determine excise tax liability for aircraft owners. An aircraft is considered to be based at an airport or other aviation facility if it spends more than 60 days, not necessarily consecutive, per year at that facility.
The records of the Indiana Department of Revenue for based aircraft excise tax have been used to provide a record of aircraft ownership dating back to 1978, as shown on
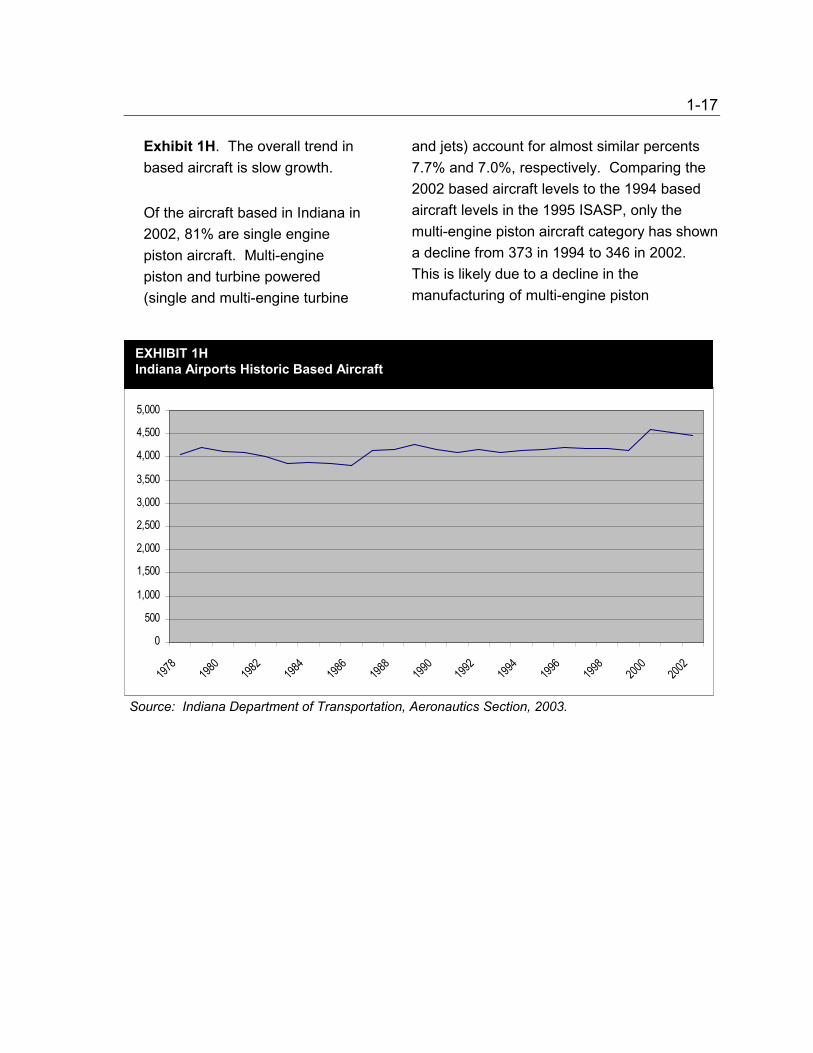
1-17 Exhibit 1H. The overall trend in based aircraft is slow growth.
Of the aircraft based in Indiana in 2002, 81% are single engine piston aircraft. Multi-engine piston and turbine powered (single and multi-engine turbine
and jets) account for almost similar percents 7.7% and 7.0%, respectively. Comparing the 2002 based aircraft levels to the 1994 based aircraft levels in the 1995 ISASP, only the multi-engine piston aircraft category has shown a decline from 373 in 1994 to 346 in 2002. This is likely due to a decline in the manufacturing of multi-engine piston
0
500
1978
1980
1982
1984
1986
1988
1990
1992
1994
1996
1998
2000
2002
EXHIBIT 1H Indiana Airports Historic Based Aircraft
1,000
1,500
2,000
2,500
3,000
3,500
4,000
4,500
5,000
Source: Indiana Department of Transportation, Aeronautics Section, 2003.
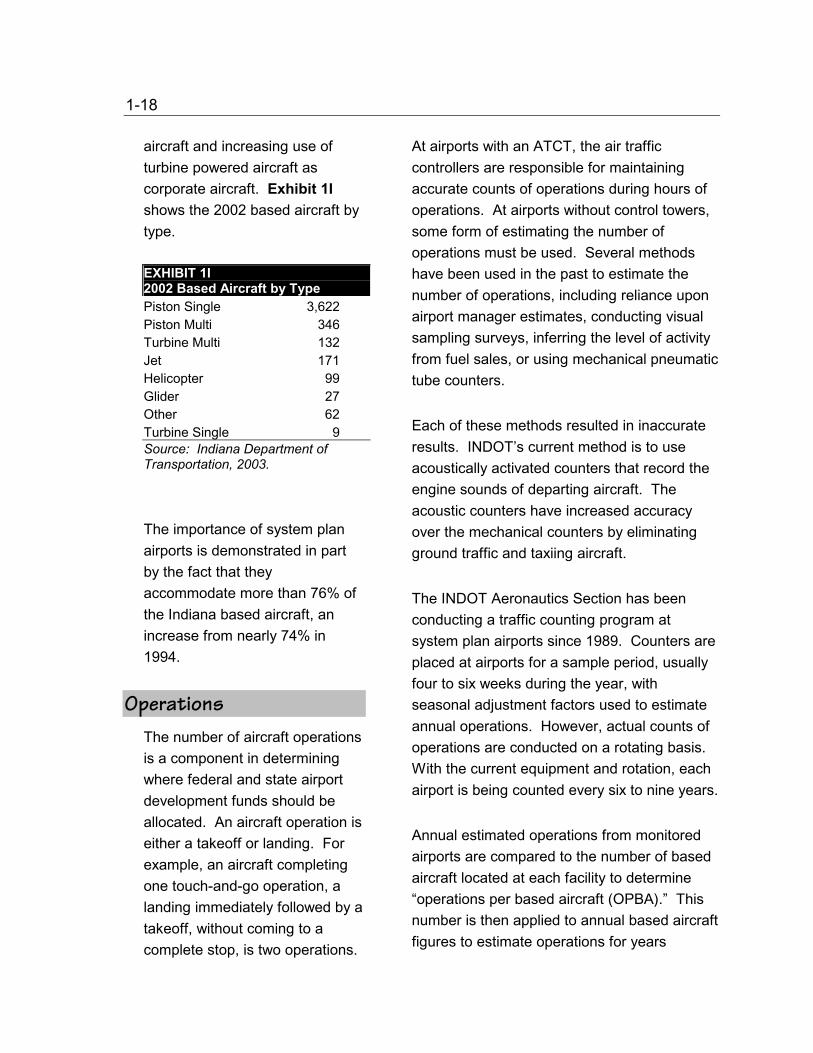
1-18 aircraft and increasing use of turbine powered aircraft as corporate aircraft. Exhibit 1I shows the 2002 based aircraft by type.
EXHIBIT 1I 2002 Based Aircraft by Type Piston Single 3,622 Piston Multi 346 Turbine Multi 132 Jet 171 Helicopter 99 Glider 27 Other 62 Turbine Single 9 Source: Indiana Department of Transportation, 2003.
The importance of system plan airports is demonstrated in part by the fact that they accommodate more than 76% of the Indiana based aircraft, an increase from nearly 74% in 1994.
Operations The number of aircraft operations is a component in determining where federal and state airport development funds should be allocated. An aircraft operation is either a takeoff or landing. For example, an aircraft completing one touch-and-go operation, a landing immediately followed by a takeoff, without coming to a complete stop, is two operations.
At airports with an ATCT, the air traffic controllers are responsible for maintaining accurate counts of operations during hours of operations. At airports without control towers, some form of estimating the number of operations must be used. Several methods have been used in the past to estimate the number of operations, including reliance upon airport manager estimates, conducting visual sampling surveys, inferring the level of activity from fuel sales, or using mechanical pneumatic tube counters.
Each of these methods resulted in inaccurate results. INDOT’s current method is to use acoustically activated counters that record the engine sounds of departing aircraft. The acoustic counters have increased accuracy over the mechanical counters by eliminating ground traffic and taxiing aircraft.
The INDOT Aeronautics Section has been conducting a traffic counting program at system plan airports since 1989. Counters are placed at airports for a sample period, usually four to six weeks during the year, with seasonal adjustment factors used to estimate annual operations. However, actual counts of operations are conducted on a rotating basis. With the current equipment and rotation, each airport is being counted every six to nine years.
Annual estimated operations from monitored airports are compared to the number of based aircraft located at each facility to determine “operations per based aircraft (OPBA).” This number is then applied to annual based aircraft figures to estimate operations for years
1-19 between counts. Estimates of operations prepared before the use of the acoustical counters have been revised via OPBA to reflect this more accurate acoustical counting method.
The OPBA for the ISASP airports ranges from approximately 120 to 1,100 with an average of 423. The OPBA for an airport is influenced by a number of factors. The first is the overall level of activity. Those airports with significant flight training programs, or that are destinations for flight training, have higher levels of operations from many practice takeoffs and landings, when compared to those that primarily accommodate transient operations with just one takeoff and landing per aircraft. Airports with similar levels of activity may have very different OPBAs if one has more based aircraft than another. Thus, a high OPBA may
reflect a busy airport, or may reflect a less busy airport with fewer based aircraft.
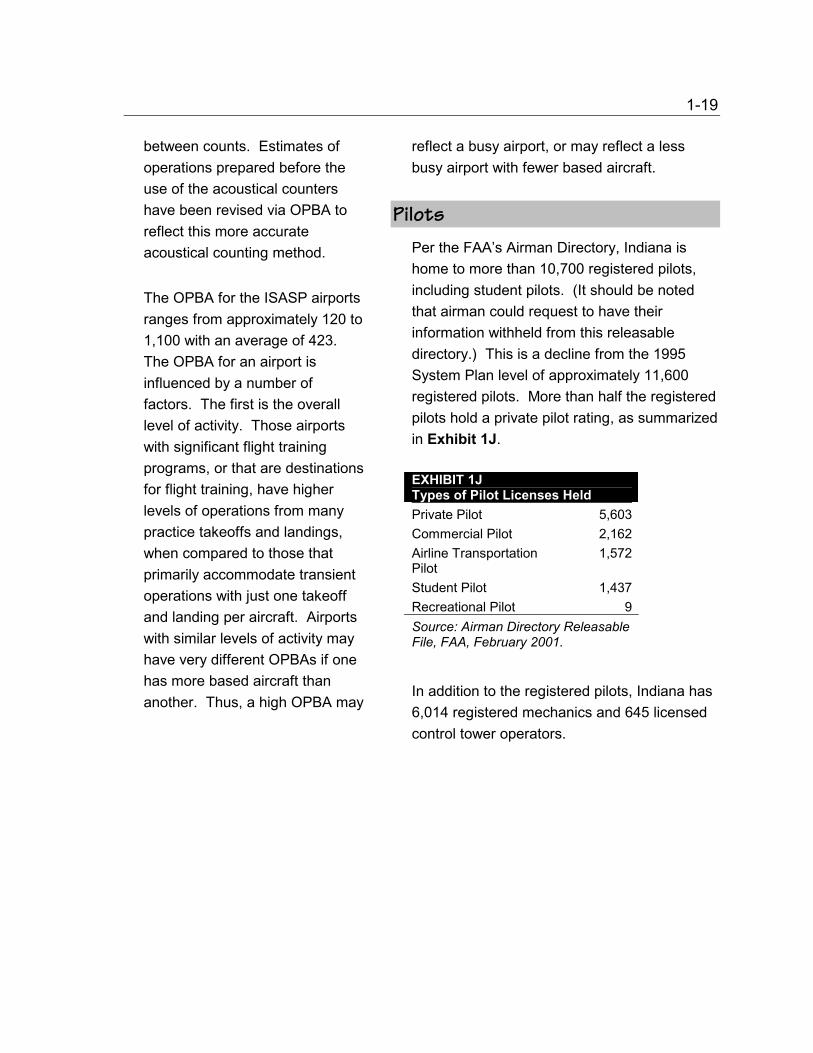
Pilots Per the FAA’s Airman Directory, Indiana is home to more than 10,700 registered pilots, including student pilots. (It should be noted that airman could request to have their information withheld from this releasable directory.) This is a decline from the 1995 System Plan level of approximately 11,600 registered pilots. More than half the registered pilots hold a private pilot rating, as summarized in Exhibit 1J.
EXHIBIT 1J Types of Pilot Licenses Held Private Pilot 5,603 Commercial Pilot 2,162 Airline Transportation Pilot
1,572
Student Pilot 1,437 Recreational Pilot 9 Source: Airman Directory Releasable File, FAA, February 2001.
In addition to the registered pilots, Indiana has 6,014 registered mechanics and 645 licensed control tower operators.
1-20
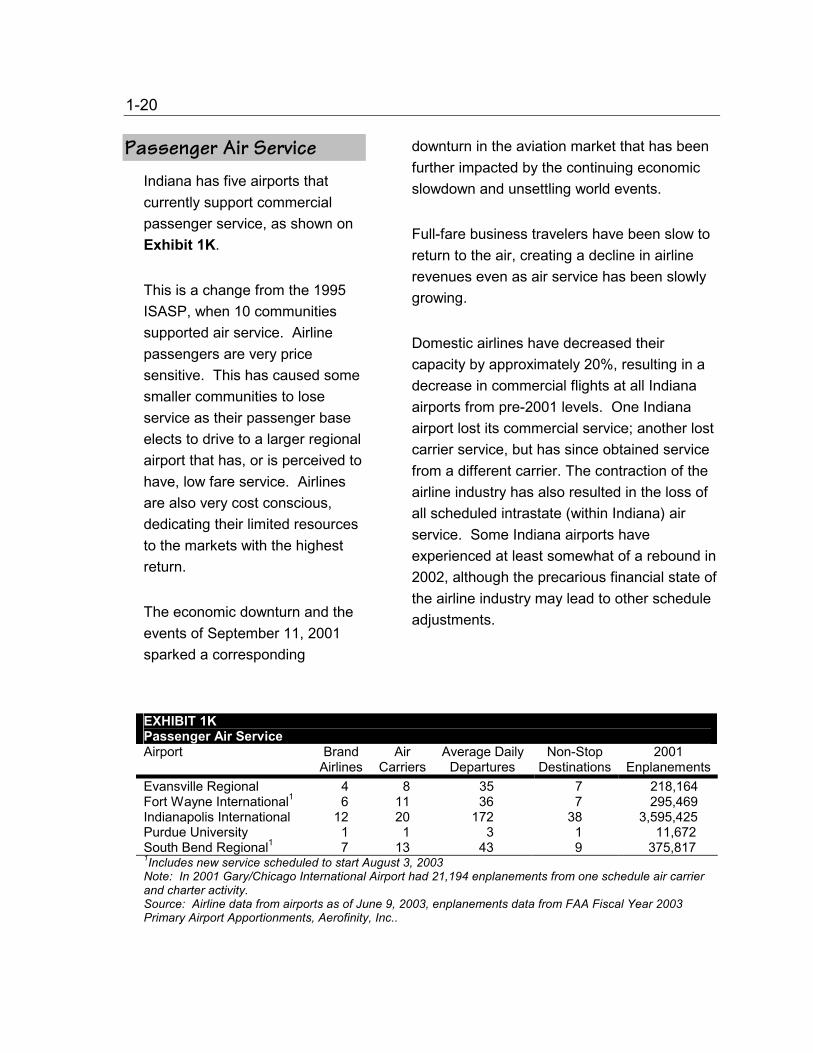
Passenger Air Service Indiana has five airports that currently support commercial passenger service, as shown on Exhibit 1K.
This is a change from the 1995 ISASP, when 10 communities supported air service. Airline passengers are very price sensitive. This has caused some smaller communities to lose service as their passenger base elects to drive to a larger regional airport that has, or is perceived to have, low fare service. Airlines are also very cost conscious, dedicating their limited resources to the markets with the highest return.
The economic downturn and the events of September 11, 2001 sparked a corresponding
downturn in the aviation market that has been further impacted by the continuing economic slowdown and unsettling world events.
Full-fare business travelers have been slow to return to the air, creating a decline in airline revenues even as air service has been slowly growing.
Domestic airlines have decreased their capacity by approximately 20%, resulting in a decrease in commercial flights at all Indiana airports from pre-2001 levels. One Indiana airport lost its commercial service; another lost carrier service, but has since obtained service from a different carrier. The contraction of the airline industry has also resulted in the loss of all scheduled intrastate (within Indiana) air service. Some Indiana airports have experienced at least somewhat of a rebound in 2002, although the precarious financial state of the airline industry may lead to other schedule adjustments.
EXHIBIT 1K Passenger Air Service Airport Brand
Airlines Air
Carriers Average Daily
Departures Non-Stop
Destinations 2001
EnplanementsEvansville Regional 4 8 35 7 218,164 Fort Wayne International1 6 11 36 7 295,469 Indianapolis International 12 20 172 38 3,595,425 Purdue University 1 1 3 1 11,672 South Bend Regional1 7 13 43 9 375,817 1Includes new service scheduled to start August 3, 2003 Note: In 2001 Gary/Chicago International Airport had 21,194 enplanements from one schedule air carrier and charter activity. Source: Airline data from airports as of June 9, 2003, enplanements data from FAA Fiscal Year 2003 Primary Airport Apportionments, Aerofinity, Inc..
1-21 One of the trends in airline travel is the increased usage of regional jet aircraft. This is due to two trends: a replacement of regional turboprop aircraft with regional jets, and the transition of shorter routes traditionally flown by the large air carriers to their smaller code-sharing partners operating regional jets. Particularly where the regional jets are replacing turboprop aircraft, an airline may reduce the frequency of its flights on a route, while still accommodating the same number of passengers on the route.
In addition to commercial air service, some communities support regularly scheduled charter flights, typically for local business or industry.
Air Cargo Indiana’s air cargo industry has also experienced changes since 1995. At Indianapolis
International, the busiest air cargo airport in the state, the U.S. Postal Service closed its hub, opting instead to contract its service through FedEx. FedEx operates its second national hub at Indianapolis International. Kitty Hawk moved its cargo operations from Terre Haute International to Fort Wayne International, citing roadway access and closer proximity to primary clients as their basis for moving. Both Indianapolis International and Fort Wayne International enplane sufficient cargo tonnage to qualify for FAA cargo entitlements, with cargo apportionments totaling $4.9 million for both airports in FY 2003.
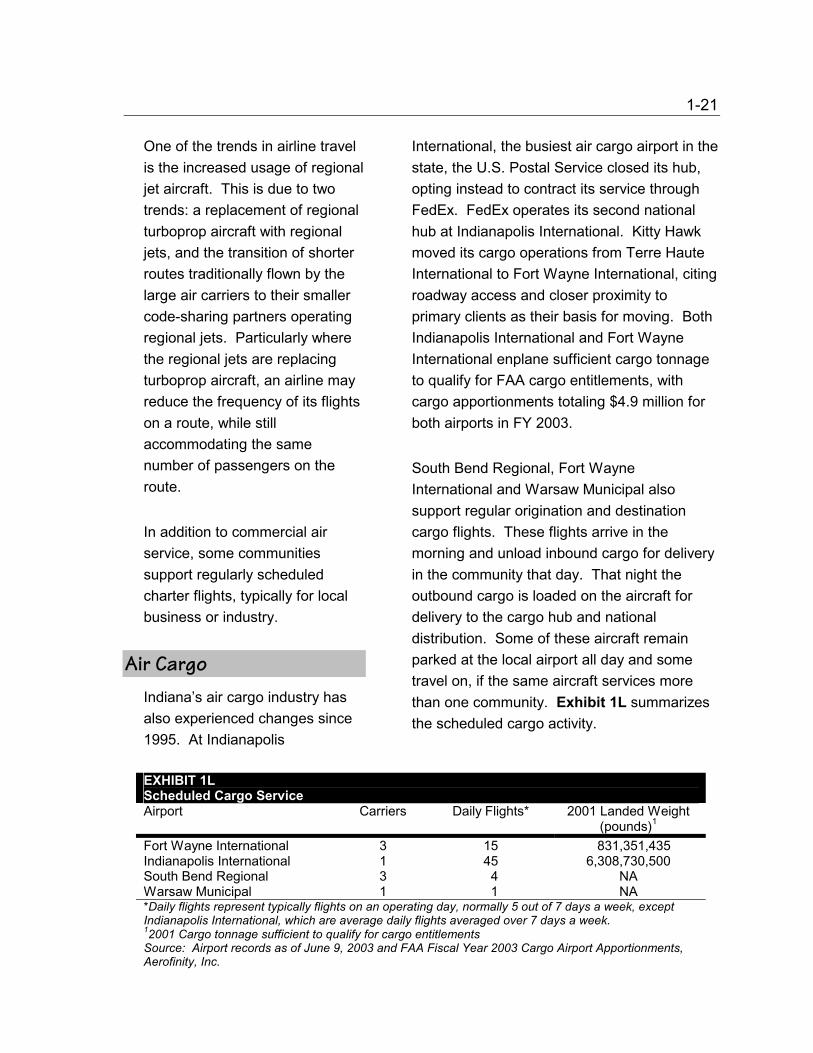
South Bend Regional, Fort Wayne International and Warsaw Municipal also support regular origination and destination cargo flights. These flights arrive in the morning and unload inbound cargo for delivery in the community that day. That night the outbound cargo is loaded on the aircraft for delivery to the cargo hub and national distribution. Some of these aircraft remain parked at the local airport all day and some travel on, if the same aircraft services more than one community. Exhibit 1L summarizes the scheduled cargo activity.
EXHIBIT 1L Scheduled Cargo Service Airport Carriers Daily Flights* 2001 Landed Weight
(pounds)1
Fort Wayne International 3 15 831,351,435 Indianapolis International 1 45 6,308,730,500 South Bend Regional 3 4 NA Warsaw Municipal 1 1 NA *Daily flights represent typically flights on an operating day, normally 5 out of 7 days a week, except Indianapolis International, which are average daily flights averaged over 7 days a week. 12001 Cargo tonnage sufficient to qualify for cargo entitlements Source: Airport records as of June 9, 2003 and FAA Fiscal Year 2003 Cargo Airport Apportionments, Aerofinity, Inc.
1-22 Numerous Indiana airports support charter cargo activity from a variety of different sized aircraft, typically in support of just-in-time delivery or emergency delivery of parts to keep companies operational.
Economic Impact The primary goals of state government involvement in the development and regulation of an aviation system are to promote economic development and aviation safety within Indiana. To help meet these goals, INDOT participates in airport development activities, safety and regulatory programs, and a program to promote the development and understanding of the importance of aviation to Indiana. As a part of these promotion activities, INDOT assists the Aviation Association of Indiana (AAI) in preparing its biennial estimate of the economic impact of aviation on the state. This estimate has been prepared every two years since 1983, with the latest update completed in October 2002.
The 2002 study used 2001 data to estimate the direct, indirect and induced impact of aviation in the state. Direct impacts include spending on the airport by the airport sponsor and airport tenants. These expenditures would not occur in the absence of the airport, and include payroll, operating expenses and capital expenditures.
Indirect impacts include spending occurring off-airport that would not occur in the absence of the airport. These impacts include spending related to air travel, such as ground transportation, lodging, meals, and other activities pursued by the air travelers and crew.
Induced impacts are the “ripple effect” spending that recirculates through the local and regional economies as a result of airport-related activities. In addition, the study estimated transportation cost savings: the time and travel savings of having access to a closer local facility rather than a more distant airport.
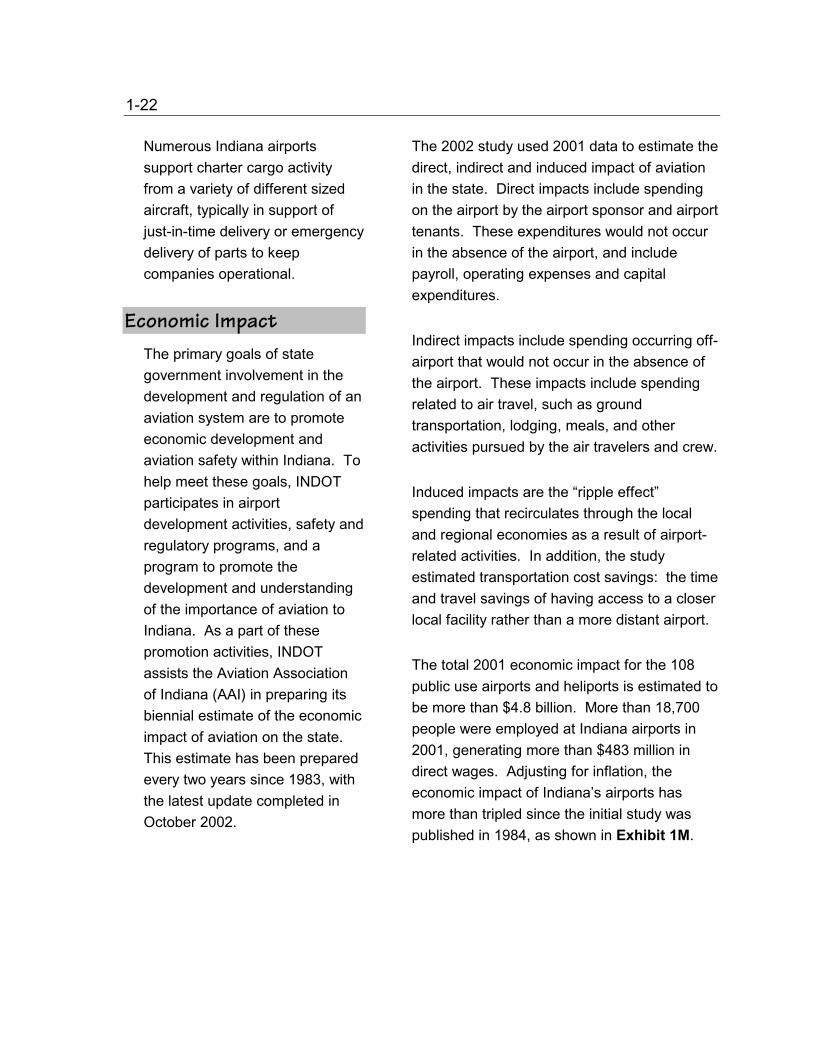
The total 2001 economic impact for the 108 public use airports and heliports is estimated to be more than $4.8 billion. More than 18,700 people were employed at Indiana airports in 2001, generating more than $483 million in direct wages. Adjusting for inflation, the economic impact of Indiana’s airports has more than tripled since the initial study was published in 1984, as shown in Exhibit 1M.
1-23
The aviation industry has been one of those hardest hit by the downturn in the U.S. economy, pre and post September 11, 2001. Many aviation jobs have been lost in Indiana in 2002 and 2003. Even so, aviation continues to be integral to Indiana’s economy. Most aviation experts agree that aviation is cyclical and will rebound or regroup to serve travelers and businesses demands.
EXHIBIT 1M Economic Impact Historical Comparison
Note: Daily spending rate revised in formula and formula updated to reflect industry standards. Source: Aviation Association of Indiana Economic Impact Study, 2002.
System Inventory Summary Assessing ways to leverage the economic impact of Indiana's airports requires a look at what's present today from a federal and state perspective. This system inventory can provide a basis for aviation planning both at the local and at statewide levels helping identify capital needs and eligibility requirements for the development of aviation facilities in the state. The extensive market analysis of Indiana's registered pilots and business community can be used to help set up long-range goals to better serve aviation

1-24 users as local airports assess their facilities and identify steps for growth. Grouping of state airports further facilitates economic development efforts, allowing coordinated
improvements to be undertaken within the system. Taken along with the forecast of reasonable demand, which follows in the next chapter, the system inventory helps identify what is required to move successfully toward the future.
Aviation Activity Forecasts CHAPTER 2
Introduction
Aviation is a constantly changing industry. To identify the future activity and needs of the Indiana State Aviation System Plan (ISASP) airports, forecasts have been prepared. This section summarizes the forecasting methodology, the data sources used, and the overall forecasting results.
Two indicators have been used to forecast the aviation activity. These indicators are: �� based aircraft – an aircraft
normally parked or hangared at an airport or other aviation facility, while not in use, more than 60 days of a year, not necessarily consecutive
�� operations – total number of arrivals (landings) and departures (takeoffs) at an airport
Based aircraft were used as the primary indicator of aviation activity for the forecast preparation and were then translated into operations.
Forecasting Methodology The forecasting process sought to develop projections of aircraft activity by examining the historic data, the relationship of aviation activity to socioeconomic indicators, and the trends in aviation. Two different types of projections have been prepared: statewide and individual.
Statewide, or top-down, forecasting predicts activity for Indiana as a whole, which can then be allocated to the individual facilities. Individual, or bottom-up, airport forecasts have also been prepared. These forecasts examine the trends at each individual airport independent of statewide trends. For large airports that have independently prepared master plan forecasts or Federal Aviation Regulations (FAR) Part 150 noise studies approved by the FAA, the airport’s planning process forecasts have been used. Airports in this category either currently have, or have recently supported regularly scheduled passenger or cargo service. During the preparation of their studies, these airports spent considerable time and effort forecasting every aspect of their aviation activity.
In contrast, many of the general aviation airports have conducted Airport Layout Plan updates that rely on the ISASP forecasts. The use of ISASP forecasts by the general aviation airports is anticipated to continue with the updated forecasts from this analysis.
2-2 Three basic forecasting methodologies are used in this ISASP update:
These sources are: �� Indiana Department of Transportation
(based aircraft and operations) �� Federal Aviation Administration (national
based aircraft and aviation trends) �� Trend forecasting – projecting historical trends �� Woods and Poole Econometrics
(socioeconomic data) �� Market share forecasting – projecting market share
Indiana Department of Transportation �� Regression analysis – using
socioeconomic indicators to forecast aviation activity
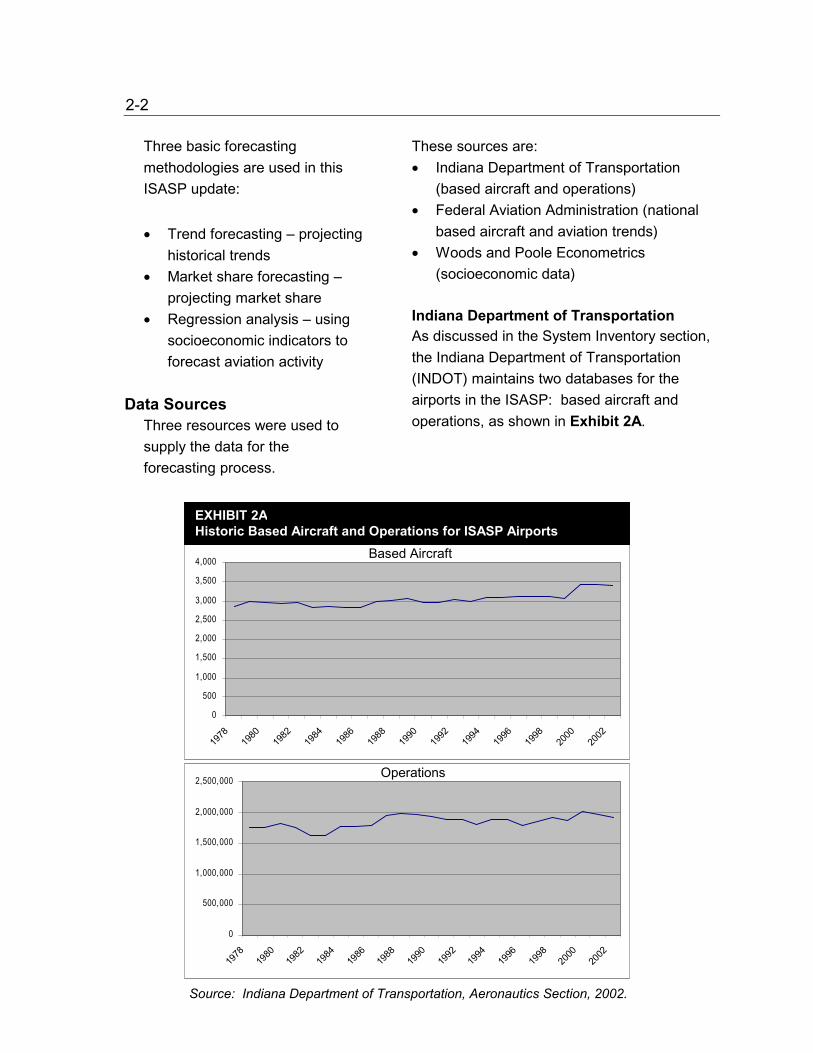
As discussed in the System Inventory section, the Indiana Department of Transportation (INDOT) maintains two databases for the airports in the ISASP: based aircraft and operations, as shown in Exhibit 2A.
Data Sources Three resources were used to supply the data for the forecasting process.
0
500
1,000
1,500
2,000
2,500
3,000
3,500
4,000
1978
1980
1982
1984
1986
1988
1990
1992
1994
1996
1998
2000
2002
0
500,000
1,000,000
1,500,000
2,000,000
2,500,000
1978
1980
1982
1984
1986
1988
1990
1992
1994
1996
1998
2000
2002
Operations
Based Aircraft
EXHIBIT 2A Historic Based Aircraft and Operations for ISASP Airports
Source: Indiana Department of Transportation, Aeronautics Section, 2002.
2-3 Based Aircraft Historical based aircraft data from 1978 to 2002 were available for the aviation forecasting. In reviewing the historical based aircraft data, an anomaly was noted: The overall number of based aircraft decreased while the economy was rapidly growing. Investigation of this anomaly identified three concerns with the based aircraft figures: �� replication of the 1997 and
1998 data with no ability to verify the actual year
�� lack of comparison to the FAA based aircraft database to identify unreported aircraft due to incompatible software beginning in the late 1990s, resulting in an under-reporting of based aircraft
�� comparison to the FAA based aircraft database in resumed in 2001, which resulted in a short-term over-reporting of based aircraft
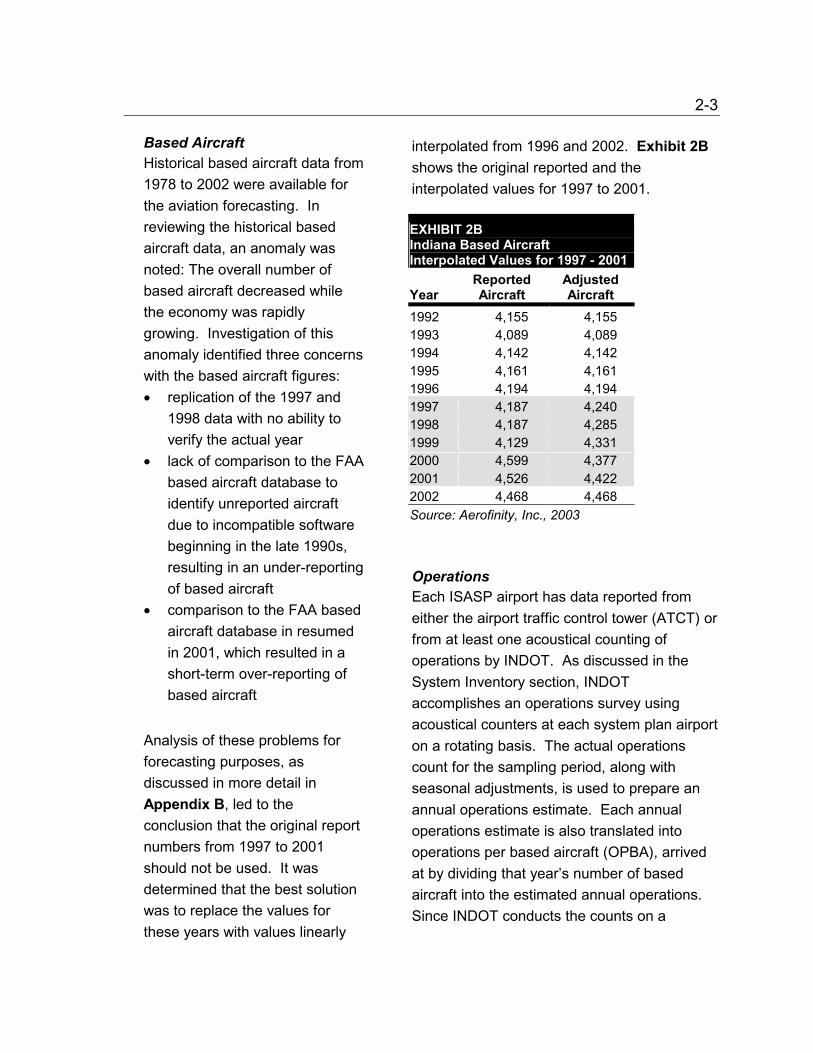
Analysis of these problems for forecasting purposes, as discussed in more detail in Appendix B, led to the conclusion that the original report numbers from 1997 to 2001 should not be used. It was determined that the best solution was to replace the values for these years with values linearly
interpolated from 1996 and 2002. Exhibit 2B shows the original reported and the interpolated values for 1997 to 2001.
EXHIBIT 2B Indiana Based Aircraft Interpolated Values for 1997 - 2001
Year Reported Aircraft
Adjusted Aircraft
1992 4,155 4,155 1993 4,089 4,089 1994 4,142 4,142 1995 4,161 4,161 1996 4,194 4,194 1997 4,187 4,240 1998 4,187 4,285 1999 4,129 4,331 2000 4,599 4,377 2001 4,526 4,422 2002 4,468 4,468 Source: Aerofinity, Inc., 2003
Operations Each ISASP airport has data reported from either the airport traffic control tower (ATCT) or from at least one acoustical counting of operations by INDOT. As discussed in the System Inventory section, INDOT accomplishes an operations survey using acoustical counters at each system plan airport on a rotating basis. The actual operations count for the sampling period, along with seasonal adjustments, is used to prepare an annual operations estimate. Each annual operations estimate is also translated into operations per based aircraft (OPBA), arrived at by dividing that year’s number of based aircraft into the estimated annual operations. Since INDOT conducts the counts on a
2-4 rotating basis, the OPBA number is used to estimate operations in the years between actual counts. For forecasting purposes, only the actual annual operations count and OPBA have been used.
Federal Aviation Administration The Federal Aviation Administration (FAA) compiles historic data on the number of aircraft in the United States. The FAA Aerospace Forecasts Fiscal Years 2002-2013 forecasts the number of aircraft in the United States through 2013, allowing Indiana’s market share of the national based aircraft to be calculated and used in the forecasting.
The forecasts in the ISASP use the FAA forecasts extrapolated to 2023. It was identified that in the final three years of the FAA forecast, the increase in aircraft is 950 per year. Therefore, the FAA forecasts were extended by assuming a continued increase at the rate of 950 aircraft per year. The extrapolation of the FAA forecasts to 20 years is discussed in more detail in Appendix B.
The FAA forecasts also analyze the national trends in aviation.
These are taken into account in the forecasting process to assess the reasonableness of the results. The FAA also produces Terminal Area Forecasts (TAF) for each airport in the National Plan of Integrated Airport Systems (NPIAS). However, for all airports without verifiable records (most general aviation airports) the FAA’s TAF forecast is constant, no growth or decline, which is unrealistic. For some of the larger airports, the TAF may be more realistic if it has been coordinated with the forecasts from a planning process.
Woods & Poole Economics Woods & Poole Economics publishes historic and forecast socioeconomic data for employment, population and per capita income. This data is published as national, state, metropolitan statistical area (MSA), and county figures. The 2002 Woods & Poole data were used in the forecasting analysis. Aviation activity is influenced by the economy; using this data allows the relationship between aviation and the economic conditions to be assessed and forecast.
The Woods & Poole per capita income data is a measure of the average income of an individual. A better measure to use as a predictor of purchasing power is total income. To obtain total income from the Woods & Poole data, the per capita income for an entity (state, county, etc.) was multiplied by the population of that entity.
2-5
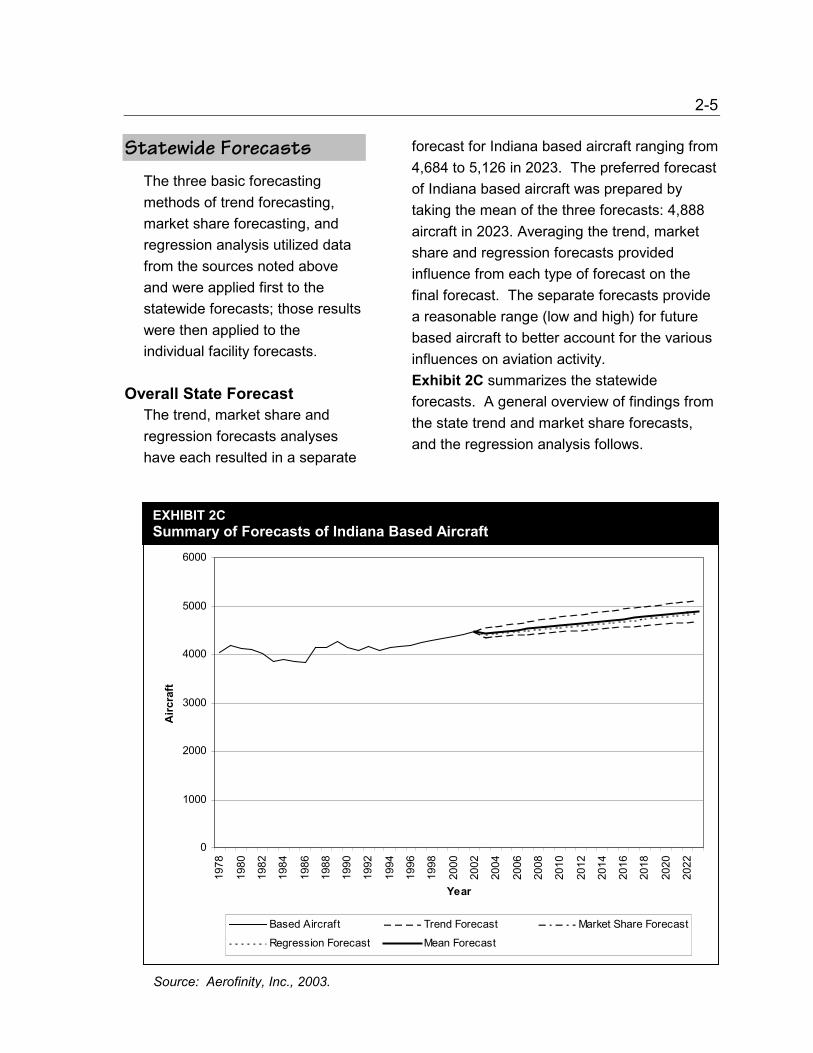
Statewide Forecasts forecast for Indiana based aircraft ranging from 4,684 to 5,126 in 2023. The preferred forecast of Indiana based aircraft was prepared by taking the mean of the three forecasts: 4,888 aircraft in 2023. Averaging the trend, market share and regression forecasts provided influence from each type of forecast on the final forecast. The separate forecasts provide a reasonable range (low and high) for future based aircraft to better account for the various influences on aviation activity. Exhibit 2C summarizes the statewide forecasts. A general overview of findings from the state trend and market share forecasts, and the regression analysis follows.
The three basic forecasting methods of trend forecasting, market share forecasting, and regression analysis utilized data from the sources noted above and were applied first to the statewide forecasts; those results were then applied to the individual facility forecasts.
Overall State Forecast The trend, market share and regression forecasts analyses have each resulted in a separate
0
1000
2000
3000
4000
5000
6000
1978
1980
1982
1984
1986
1988
1990
1992
1994
1996
1998
2000
2002
2004
2006
2008
2010
2012
2014
2016
2018
2020
2022
Year
Airc
raft
Based Aircraft Trend Forecast Market Share Forecast
Regression Forecast Mean Forecast
EXHIBIT 2C Summary of Forecasts of Indiana Based Aircraft
Source: Aerofinity, Inc., 2003.
2-6 Details are included in Appendix B, along with tabular summaries of the various statewide forecasts.
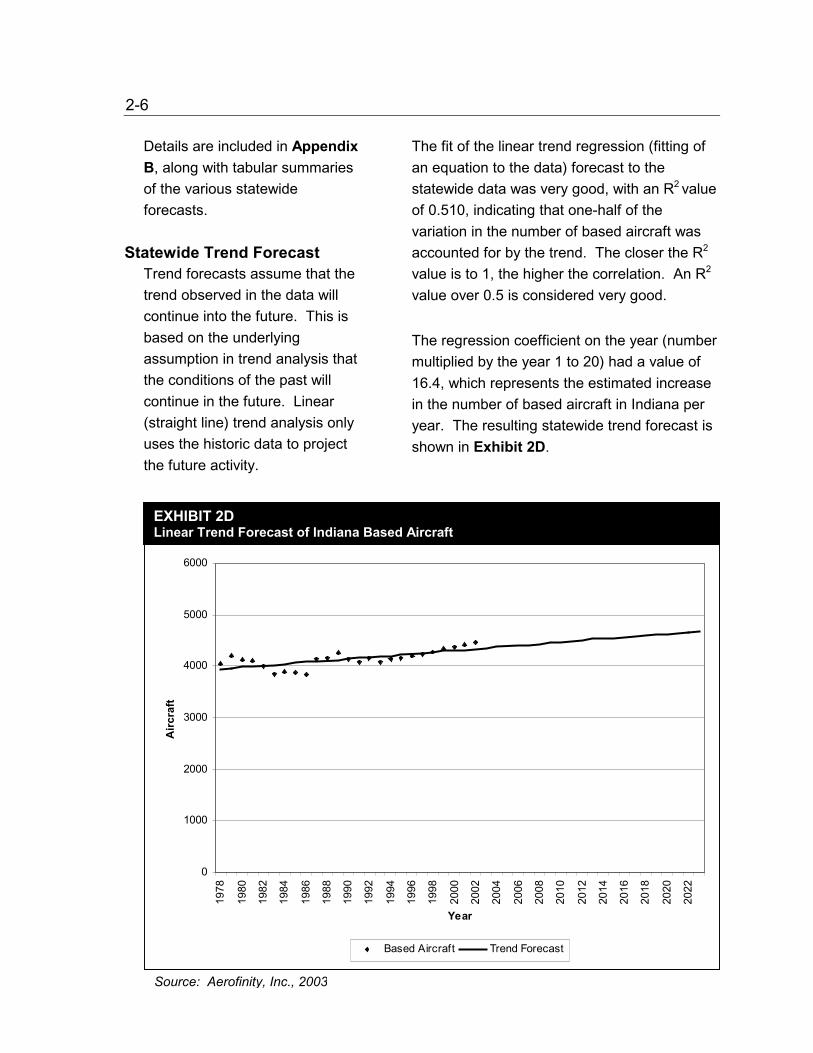
The fit of the linear trend regression (fitting of an equation to the data) forecast to the statewide data was very good, with an R2 value of 0.510, indicating that one-half of the variation in the number of based aircraft was accounted for by the trend. The closer the R2
value is to 1, the higher the correlation. An R2
value over 0.5 is considered very good.
Statewide Trend Forecast Trend forecasts assume that the trend observed in the data will continue into the future. This is based on the underlying assumption in trend analysis that the conditions of the past will continue in the future. Linear (straight line) trend analysis only uses the historic data to project the future activity.
The regression coefficient on the year (number multiplied by the year 1 to 20) had a value of 16.4, which represents the estimated increase in the number of based aircraft in Indiana per year. The resulting statewide trend forecast is shown in Exhibit 2D.
0
1000
2000
3000
4000
5000
6000
1978
1980
1982
1984
1986
1988
1990
1992
1994
1996
1998
2000
2002
2004
2006
2008
2010
2012
2014
2016
2018
2020
2022
Year
Airc
raft
Based Aircraft Trend Forecast
EXHIBIT 2D Linear Trend Forecast of Indiana Based Aircraft
Source: Aerofinity, Inc., 2003

2-7
Statewide Market Share Indiana’s market share has varied over time and exhibits a general growth trend, as shown in Exhibit 2E. To develop a market share forecast, rationale was established for predicting the level of the future market share.
Market share forecasting is a method that forecasts the value of the area of interest (Indiana based aircraft) by determining the ratio or market share of the values for that area to some larger area (U.S. based aircraft). The market share is then used to develop forecasts by multiplying forecast values for the market share by the forecast values for the larger area.
Three methodologies were used for market share forecasts.
�� Constant market share �� Average of recent year market shares �� Linear trend estimate of market share
0
0.005
0.01
0.015
0.02
0.025
0.03
1978
1980
1982
1984
1986
1988
1990
1992
1994
1996
1998
2000
2002
Year
Airc
raft
Market Share Linear Trend
EXHIBIT 2E Indiana Market Share of U.S. Aircraft
Source: Aerofinity, Inc., 2003.
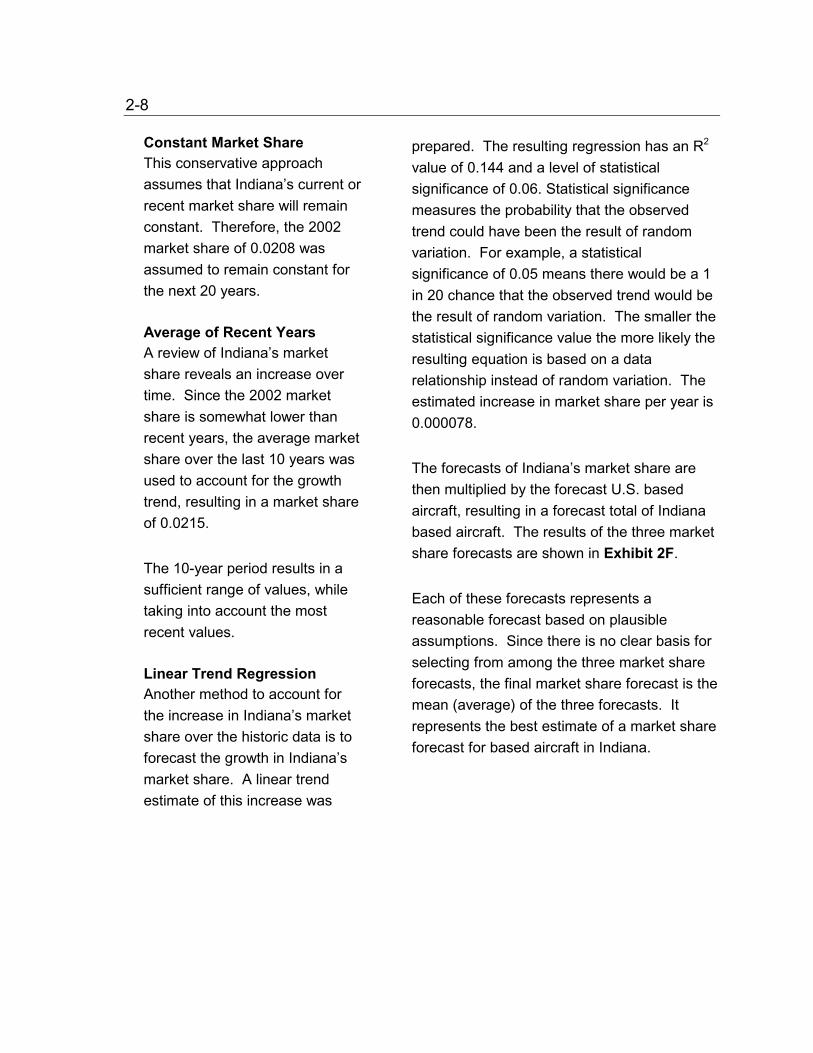
2-8 Constant Market Share This conservative approach assumes that Indiana’s current or recent market share will remain constant. Therefore, the 2002 market share of 0.0208 was assumed to remain constant for the next 20 years.
Average of Recent Years A review of Indiana’s market share reveals an increase over time. Since the 2002 market share is somewhat lower than recent years, the average market share over the last 10 years was used to account for the growth trend, resulting in a market share of 0.0215.
The 10-year period results in a sufficient range of values, while taking into account the most recent values.
Linear Trend Regression Another method to account for the increase in Indiana’s market share over the historic data is to forecast the growth in Indiana’s market share. A linear trend estimate of this increase was
prepared. The resulting regression has an R2
value of 0.144 and a level of statistical significance of 0.06. Statistical significance measures the probability that the observed trend could have been the result of random variation. For example, a statistical significance of 0.05 means there would be a 1 in 20 chance that the observed trend would be the result of random variation. The smaller the statistical significance value the more likely the resulting equation is based on a data relationship instead of random variation. The estimated increase in market share per year is 0.000078.
The forecasts of Indiana’s market share are then multiplied by the forecast U.S. based aircraft, resulting in a forecast total of Indiana based aircraft. The results of the three market share forecasts are shown in Exhibit 2F.
Each of these forecasts represents a reasonable forecast based on plausible assumptions. Since there is no clear basis for selecting from among the three market share forecasts, the final market share forecast is the mean (average) of the three forecasts. It represents the best estimate of a market share forecast for based aircraft in Indiana.
2-9
0
1000
2000
3000
4000
5000
1978
1981
1984
1987
1990
1993
1996
1999
2002
2005
2008
2011
2014
2017
2020
2023
Year
Airc
raft
Based Aircraft 2000 Share 10-Year Share Trend Share Mean Share
EXHIBIT 2F Market Share Forecasts of Indiana Based Aircraft
6000
Source: Aerofinity, Inc., 2003.
Statewide Regression Analysis The regression analysis is used to establish the relationship between the quantity being forecast and other measures potentially associated with and possibly affecting that quantity. Then the estimated regression equation is used to forecast future values of based aircraft from separately forecast values of socioeconomic indicators. For this process, the number of based aircraft in Indiana is being
forecast and the employment, population and total income in the State of Indiana are the predictors considered to be associated with the number of based aircraft. As described in Appendix B, simple regression (one predictor variable per equation) was found to be appropriate for forecasting the future numbers of Indiana based aircraft, but multiple regression (more than one predictor variable per equation) was not. Multiple regression was not appropriate due to very high intercorrelations between the data (employment is related to population, per capita income is related to population, etc.)
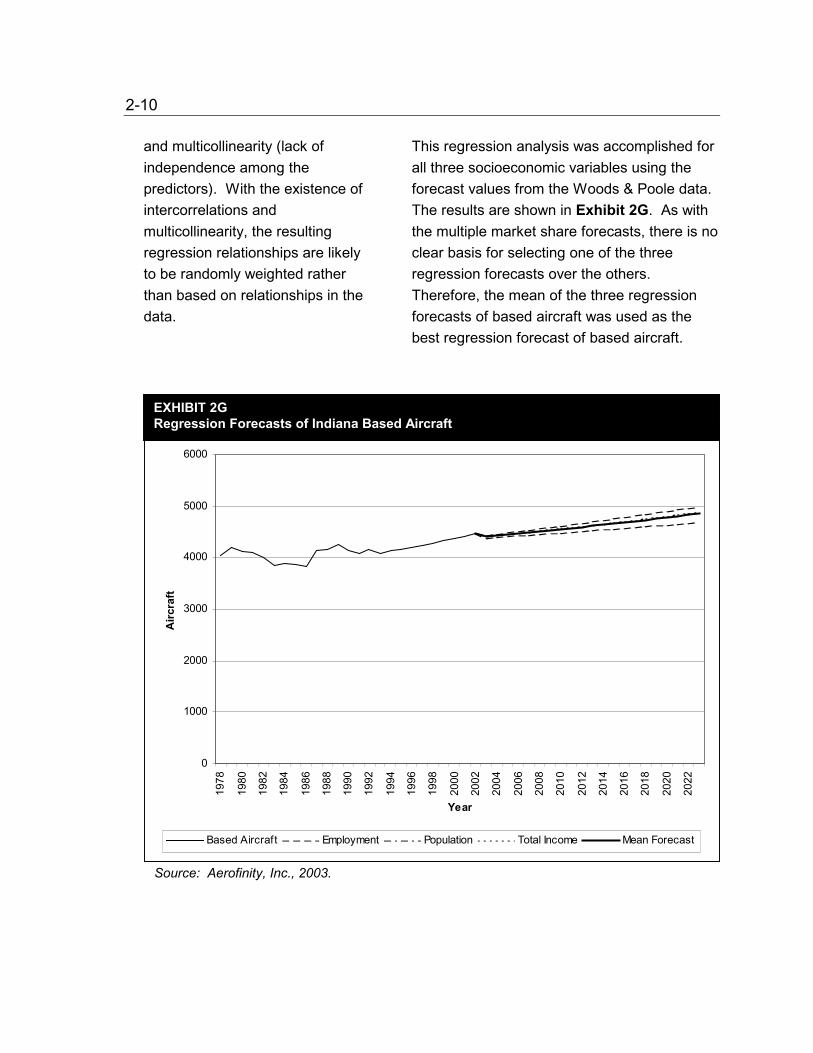
2-10 and multicollinearity (lack of independence among the predictors). With the existence of intercorrelations and multicollinearity, the resulting regression relationships are likely to be randomly weighted rather than based on relationships in the data.
This regression analysis was accomplished for all three socioeconomic variables using the forecast values from the Woods & Poole data. The results are shown in Exhibit 2G. As with the multiple market share forecasts, there is no clear basis for selecting one of the three regression forecasts over the others. Therefore, the mean of the three regression forecasts of based aircraft was used as the best regression forecast of based aircraft.
0
1000
2000
3000
4000
5000
6000
1978
1980
1982
1984
1986
1988
1990
1992
1994
1996
1998
2000
2002
2004
2006
2008
2010
2012
2014
2016
2018
2020
2022
Year
Airc
raft
Based Aircraft Employment Population Total Income Mean Forecast
EXHIBIT 2G Regression Forecasts of Indiana Based Aircraft
Source: Aerofinity, Inc., 2003.
2-11
Individual Facility Forecasts
In addition to the statewide forecasts, bottom-up forecasts were prepared for individual facilities. Because of the large number of airports in the ISASP, it is necessary to develop a relatively uniform forecast methodology that can be applied to each airport. However, the forecast methodology must be sufficiently flexible to accommodate differences in the situations of the various airports. Also, since these airports have relatively small numbers of based aircraft, there is a greater variation from year to year in the numbers of aircraft than what is seen for the entire state of Indiana.
The methodology employed in developing the individual airport forecasts follows a similar process to the statewide forecasts, producing trend, market share and regression forecasts for each facility, and then averaging the applicable forecasts for a final preferred based aircraft forecast.
The individual airport forecasts were examined for statistical relevance. If the forecasts for an
individual facility did not meet the statistics and logic tests, they were discarded and only those meeting the tests were used for the facility. Only those forecasts that were statistically significant were included in the preferred forecast.
The individual airport forecasts used the same data sources and linear interpolation of based aircraft from 1996 and 2002 in order to correct for the data anomaly from 1997 to 2001, as discussed in the statewide forecast section.
Individual Facility Trend Analysis The 1995 ISASP did not include consideration of trends in based aircraft for the individual airports. Some of the individual airports, however, exhibit significant increasing or declining trends in the number of based aircraft over time that should be incorporated into the airport forecasts.
Unlike the straightforward development of the trend forecasts at the state level, the smaller numbers of aircraft at the individual airports provide the opportunity for greater volatility and changes in trends. Since a trend over the entire historical period may not be present or may even reverse, a procedure was used to assure that trend forecasts are prepared only when significant, consistent, meaningful trends are present in recent years. This was accomplished by conducting the trend analysis for two time periods: the entire time period for which data are available (generally 1978 to 2002 unless the airport was added to the ISASP after 1978), and for the last 10 years (1993 to 2002). For a trend forecast to be
2-12 included for an airport, both the entire time period and 10-year trends had to be in the same direction (both positive or both negative), and both trends had to be statistically significant at the 0.05 or less level (less than 1 in 20 chance the observed trend is the result of random variation). No trend forecast was prepared for that airport if both criteria were not met, as it is unlikely that a consistent, long-term trend exists to provide a reasonable basis for projecting future based aircraft.
For those airports that met the trend forecast tests (both same direction and statistically significant) the estimated annual growth was the mean of the full-time period trend and the 10-year trend. This gives more weight to the recent changes, but also incorporates the longer-term trend as well. To prepare the actual trend forecast, the mean estimated annual change is added to last known number of based aircraft to produce the next year’s forecast. This process is repeated for the succeeding years, adding the mean estimated annual change to the last estimated number of based aircraft. This method was used, rather than the common approach of using the complete
estimated regression equation, to avoid a jump in based aircraft that could occur due to the year-to-year variation in the number of based aircraft at individual airports.
Examining the results of the individual facility trend analysis, a few of the airports with significant decline or growth in aircraft showed extreme trends, defined as more than 35% change over the 20-year forecast period. Consideration was given to eliminating the extreme trend forecasts. However, while the extreme trend forecast may be unrealistic on a stand-alone basis, in the final preferred forecast it is moderated by averaging it with the market share and statistically significant regression forecasts. Eliminating the trend forecast for these airports that showed such significant trends would eliminate an important influence in the final preferred forecast. Instead of eliminating the extreme trend forecasts, they were moderated. At airports with an extreme trend forecast, the lesser of either the full time period or 10-year trend was used, rather than the mean of the two trends.
Individual Facility Market-Share The market share forecasts apportion the forecast statewide number of based aircraft to individual airports. For the individual airport’s market share forecasts, the preferred statewide market share forecast (mean of the three statewide market share forecasts) was used. For the individual airports, it was assumed that the market share in 2002 would remain constant over the
2-13 20-year forecast period. This is the same market share methodology as used for the individual airports in the 1995 ISASP update. This allows a market share forecast to be prepared for each of the individual airports. Keeping the market share constant allows the statewide forecast to be divided among the individual airports. Given the wide variation in based aircraft at some facilities, if market share trends were incorporated into the analysis it is possible that the market shares calculated on an individual basis would total more or less than the total forecast statewide number of based aircraft. Also, this could overweight the trends in the final preferred forecast.
Individual Regression Forecasts
The regression forecasts predict the based aircraft at an airport using characteristics of the area in which the airport is located. Practical considerations make it impossible to individually identify the exact market area for every ISASP airport. Thus, for airports located outside a metropolitan statistical area (MSA), the data for the county in which the airport is located was used. For airports within MSAs, analysis found the
MSA socioeconomic factors to be a more reasonable predictor of based aircraft than the county factors alone, as detailed in Appendix B. In the 1995 ISASP update, the county data was used for all airports. As with the statewide regression forecasts, it was found that only simple regressions (one variable) were appropriate. The multiple regression (multiple variable) forecasts for individual facilities had the same problems with multicollinearity among the predictors as the statewide forecasts.
While the overall level of aviation activity and based aircraft are likely to follow demographic and economic trends, it may not be the case for all individual facilities. Individual airports may compete with one another for aircraft; therefore, the based aircraft at any given airport may not necessarily show a relationship to the characteristics of the area. If a regression analysis was not statistically significant at the 0.05 or less threshold, it was discarded from consideration, as it was likely to be the product of random variation.
In order to be included, the regression results also had to have a positive relationship between the regression coefficient factor multiplied by the socioeconomic indicator and socioeconomic factor. The positive relationship results in an increase in the number of based aircraft as population, employment or income increases; or a decrease in the number of based aircraft with decreasing population, employment or income. When a negative relationship occurs, i.e., based aircraft declining with growing
2-14 socioeconomic indicators, or based aircraft growing with declining socioeconomic indicators, the growth or decline of based aircraft is occurring for reasons other than socioeconomic factors. Therefore, any regression equations with a negative relationship between based aircraft and the socioeconomic indicators were considered irrational and discarded from consideration. Thus, for the individual airports, regression forecasts may be made for all, some or none of the three socioeconomic factors depending on whether each of the regression forecasts was statistically significant and had a positive relationship. The final regression forecast for an individual facility is the mean of the reasonable regression forecasts. If none of the forecasts passed the statistical and rationale tests, there is no regression forecast for that facility.
Overall Individual Airport Forecasts
The individual airport forecasts can produce up to three forecasts for each airport: market share (all airports), and trend and mean regression forecasts (if
statistically appropriate). The final step in the individual facility based aircraft forecast process is to produce the preferred forecast. This was accomplished by weighting each of the applicable forecasts prepared for a facility.
The three types of forecasts were weighted to represent the forces influencing the based aircraft at the airport. The market share forecasts represent the influence of factors at the state and national level. The trend forecasts and regression forecast represent the influence of factors at the local facility and service area.
For those airports for which all three forecasts are available, the market share was assigned a weight of 0.5 and the trend and regression were assigned a weight of 0.25 each. This gives equal weight to state and national influences (market share) and local influences (trend and mean regression). For airports where only a trend or regression forecast could be prepared, that trend or regression forecast was given a weight of 0.5, again giving equal weight to state and national influences and local influences. If neither a trend nor regression forecast could be prepared for an airport, the market share forecast is the final preferred forecast.
The resulting forecasts were reviewed. In a few cases, the forecast showed a slight decline over the planning period. The purpose of the ISASP forecasts is to assure sufficient facilities are planned to meet Indiana’s economic and infrastructure needs. Instead of showing a declining forecast, no growth was used for
2-15 planning purposes where the resulting average of market share and trend forecasts could not support an increase.
Individual Operations Forecasts
The final step in the aviation activity forecasting process is to forecast operations levels by using the operations per based aircraft (OPBA) figure from the INDOT operations records. The OPBA figure is multiplied by the forecast based aircraft for an annual operations estimate.
With the traffic counting program occurring at ISASP airports on a rotating basis since 1989, there are a limited number of actual counts and OPBA figures for each facility. These limited data are insufficient to identify trends in OPBA for individual airports. Therefore, a single OPBA figure was determined for each facility.
Analysis was conducted to determine the most appropriate OPBA figure for forecasting future operations. The OPBA considerations are discussed in more detail in Appendix B. In calculating the OPBA, the replacement based aircraft numbers that corrected for the
data anomaly from 1997 to 2001, as discussed previously, were used.
There is significant variation in the OPBA; thus, the most recent value for OPBA may not be the best estimate for future levels, as that value may be higher or lower due to variation in counting or random variation year to year. Using the mean over a number of years, in this case five years, decreases the effect of error or random variation for any given year; however, it disregards the effects of any trend in OPBA over that five-year period. To compensate for both concerns, the method used to determine the future OPBA for a facility was to use the mean of the most recent OPBA (better reflecting trends) and the average of the actual OPBAs within the last five years (reducing the effect of random variation). Some airports had only one, or no counts within the last five years. In those cases, the most recent OPBA was used for forecasting operations.
The one exception to the OPBA calculation is Hendricks County Airport – Gordon Graham Field. This airport opened in December 2001 and has only one OPBA data point from 2002 when operations were still being conducted on the interim runway (future parallel taxiway). The OPBA from this count is one of the lowest for the ISASP airports, probably reflective of the new facility. As the actual runway opens and the airport “matures,” the OPBA is anticipated to increase at Hendricks County Airport. To represent the anticipated growth in activity at the airport over the 20-year forecast, a linear interpolation between the current OPBA and the average OPBA for the reliever
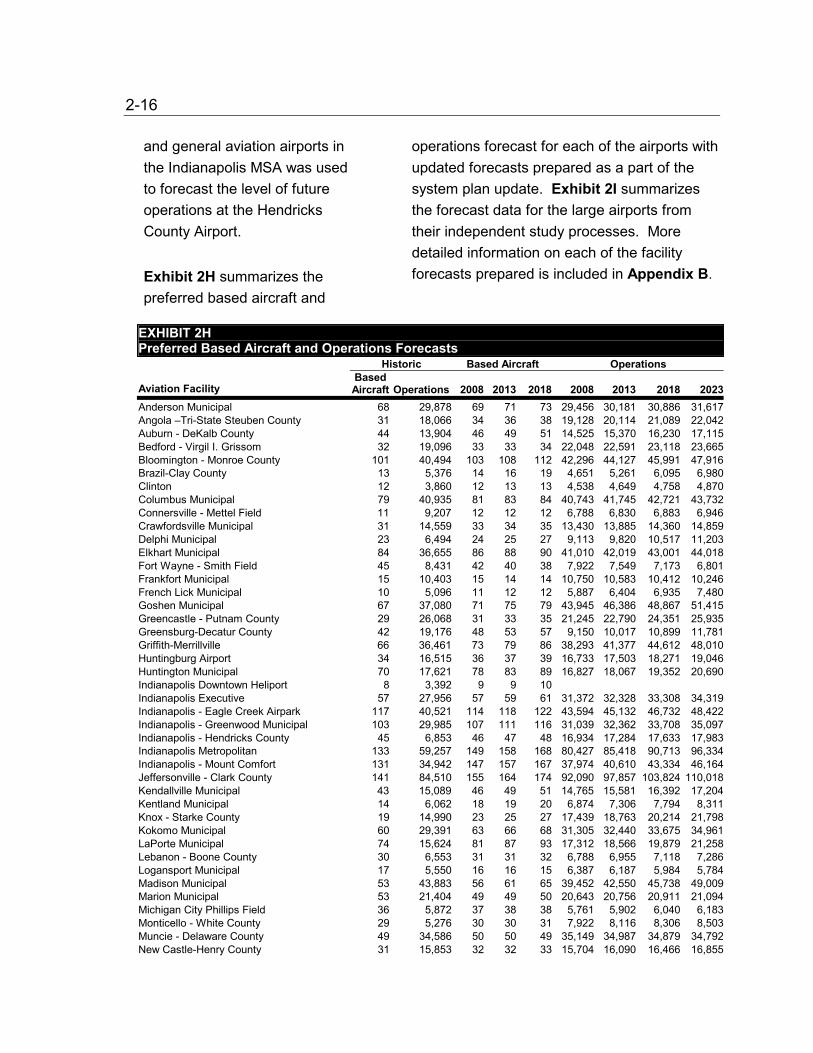
2-16 and general aviation airports in the Indianapolis MSA was used to forecast the level of future operations at the Hendricks County Airport.
Exhibit 2H summarizes the preferred based aircraft and
operations forecast for each of the airports with updated forecasts prepared as a part of the system plan update. Exhibit 2I summarizes the forecast data for the large airports from their independent study processes. More detailed information on each of the facility forecasts prepared is included in Appendix B.
EXHIBIT 2H Preferred Based Aircraft and Operations Forecasts
Historic Based Aircraft Operations
Aviation Facility Based Aircraft Operations 2008 2013 2018 2008 2013 2018 2023
Anderson Municipal 68 29,878 69 71 73 29,456 30,181 30,886 31,617Angola –Tri-State Steuben County 31 18,066 34 36 38 19,128 20,114 21,089 22,042Auburn - DeKalb County 44 13,904 46 49 51 14,525 15,370 16,230 17,115Bedford - Virgil I. Grissom 32 19,096 33 33 34 22,048 22,591 23,118 23,665Bloomington - Monroe County 101 40,494 103 108 112 42,296 44,127 45,991 47,916Brazil-Clay County 13 5,376 14 16 19 4,651 5,261 6,095 6,980Clinton 12 3,860 12 13 13 4,538 4,649 4,758 4,870Columbus Municipal 79 40,935 81 83 84 40,743 41,745 42,721 43,732Connersville - Mettel Field 11 9,207 12 12 12 6,788 6,830 6,883 6,946Crawfordsville Municipal 31 14,559 33 34 35 13,430 13,885 14,360 14,859Delphi Municipal 23 6,494 24 25 27 9,113 9,820 10,517 11,203Elkhart Municipal 84 36,655 86 88 90 41,010 42,019 43,001 44,018Fort Wayne - Smith Field 45 8,431 42 40 38 7,922 7,549 7,173 6,801Frankfort Municipal 15 10,403 15 14 14 10,750 10,583 10,412 10,246French Lick Municipal 10 5,096 11 12 12 5,887 6,404 6,935 7,480Goshen Municipal 67 37,080 71 75 79 43,945 46,386 48,867 51,415Greencastle - Putnam County 29 26,068 31 33 35 21,245 22,790 24,351 25,935Greensburg-Decatur County 42 19,176 48 53 57 9,150 10,017 10,899 11,781Griffith-Merrillville 66 36,461 73 79 86 38,293 41,377 44,612 48,010Huntingburg Airport 34 16,515 36 37 39 16,733 17,503 18,271 19,046Huntington Municipal 70 17,621 78 83 89 16,827 18,067 19,352 20,690Indianapolis Downtown Heliport 8 3,392 9 9 10 Indianapolis Executive 57 27,956 57 59 61 31,372 32,328 33,308 34,319Indianapolis - Eagle Creek Airpark 117 40,521 114 118 122 43,594 45,132 46,732 48,422Indianapolis - Greenwood Municipal 103 29,985 107 111 116 31,039 32,362 33,708 35,097Indianapolis - Hendricks County 45 6,853 46 47 48 16,934 17,284 17,633 17,983Indianapolis Metropolitan 133 59,257 149 158 168 80,427 85,418 90,713 96,334Indianapolis - Mount Comfort 131 34,942 147 157 167 37,974 40,610 43,334 46,164Jeffersonville - Clark County 141 84,510 155 164 174 92,090 97,857 103,824 110,018Kendallville Municipal 43 15,089 46 49 51 14,765 15,581 16,392 17,204Kentland Municipal 14 6,062 18 19 20 6,874 7,306 7,794 8,311Knox - Starke County 19 14,990 23 25 27 17,439 18,763 20,214 21,798Kokomo Municipal 60 29,391 63 66 68 31,305 32,440 33,675 34,961LaPorte Municipal 74 15,624 81 87 93 17,312 18,566 19,879 21,258Lebanon - Boone County 30 6,553 31 31 32 6,788 6,955 7,118 7,286Logansport Municipal 17 5,550 16 16 15 6,387 6,187 5,984 5,784Madison Municipal 53 43,883 56 61 65 39,452 42,550 45,738 49,009Marion Municipal 53 21,404 49 49 50 20,643 20,756 20,911 21,094Michigan City Phillips Field 36 5,872 37 38 38 5,761 5,902 6,040 6,183Monticello - White County 29 5,276 30 30 31 7,922 8,116 8,306 8,503Muncie - Delaware County 49 34,586 50 50 49 35,149 34,987 34,879 34,792New Castle-Henry County 31 15,853 32 32 33 15,704 16,090 16,466 16,855
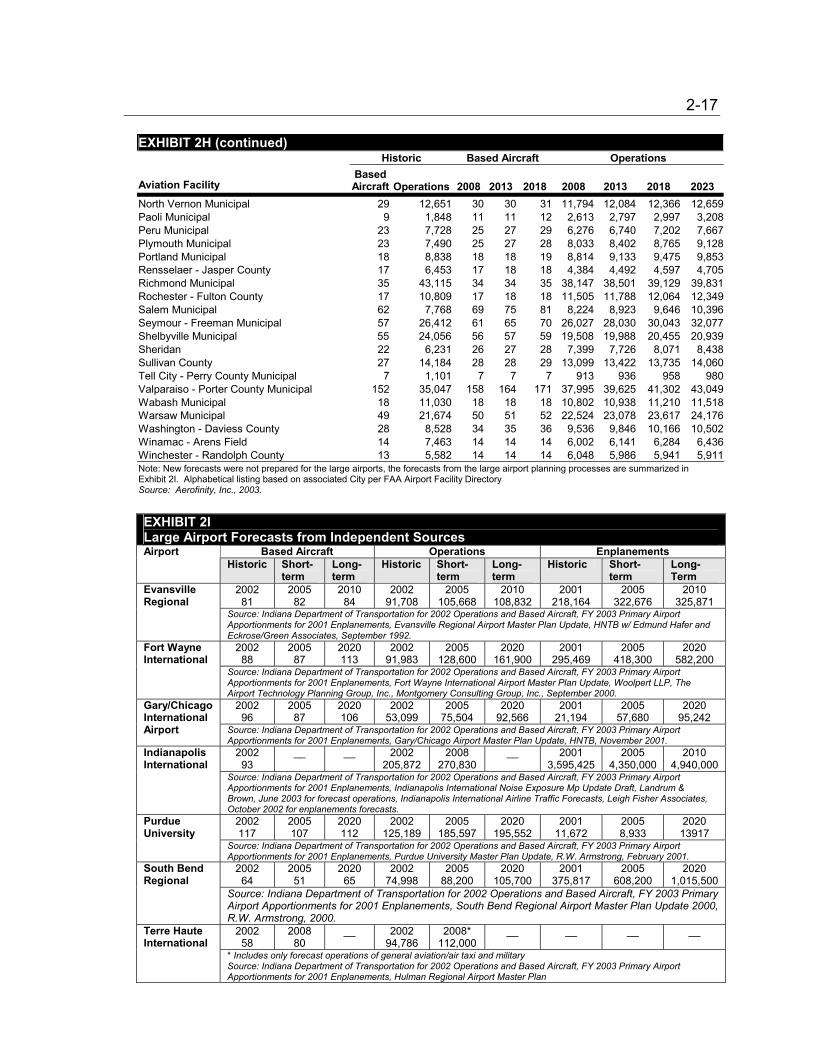
2-17
EXHIBIT 2H (continued) Historic Based Aircraft Operations
Aviation Facility Based Aircraft Operations 2008 2013 2018 2008 2013 2018 2023
North Vernon Municipal 29 12,651 30 30 31 11,794 12,084 12,366 12,659Paoli Municipal 9 1,848 11 11 12 2,613 2,797 2,997 3,208Peru Municipal 23 7,728 25 27 29 6,276 6,740 7,202 7,667Plymouth Municipal 23 7,490 25 27 28 8,033 8,402 8,765 9,128Portland Municipal 18 8,838 18 18 19 8,814 9,133 9,475 9,853Rensselaer - Jasper County 17 6,453 17 18 18 4,384 4,492 4,597 4,705Richmond Municipal 35 43,115 34 34 35 38,147 38,501 39,129 39,831Rochester - Fulton County 17 10,809 17 18 18 11,505 11,788 12,064 12,349Salem Municipal 62 7,768 69 75 81 8,224 8,923 9,646 10,396Seymour - Freeman Municipal 57 26,412 61 65 70 26,027 28,030 30,043 32,077Shelbyville Municipal 55 24,056 56 57 59 19,508 19,988 20,455 20,939Sheridan 22 6,231 26 27 28 7,399 7,726 8,071 8,438Sullivan County 27 14,184 28 28 29 13,099 13,422 13,735 14,060Tell City - Perry County Municipal 7 1,101 7 7 7 913 936 958 980Valparaiso - Porter County Municipal 152 35,047 158 164 171 37,995 39,625 41,302 43,049Wabash Municipal 18 11,030 18 18 18 10,802 10,938 11,210 11,518Warsaw Municipal 49 21,674 50 51 52 22,524 23,078 23,617 24,176Washington - Daviess County 28 8,528 34 35 36 9,536 9,846 10,166 10,502Winamac - Arens Field 14 7,463 14 14 14 6,002 6,141 6,284 6,436Winchester - Randolph County 13 5,582 14 14 14 6,048 5,986 5,941 5,911Note: New forecasts were not prepared for the large airports, the forecasts from the large airport planning processes are summarized in Exhibit 2I. Alphabetical listing based on associated City per FAA Airport Facility Directory Source: Aerofinity, Inc., 2003. EXHIBIT 2I Large Airport Forecasts from Independent Sources
Based Aircraft Operations Enplanements Airport Historic Short-
term Long-term
Historic Short-term
Long-term
Historic Short-term
Long-Term
2002 81
2005 82
2010 84
2002 91,708
2005 105,668
2010 108,832
2001 218,164
2005 322,676
2010 325,871
Evansville Regional
Source: Indiana Department of Transportation for 2002 Operations and Based Aircraft, FY 2003 Primary Airport Apportionments for 2001 Enplanements, Evansville Regional Airport Master Plan Update, HNTB w/ Edmund Hafer and Eckrose/Green Associates, September 1992.
2002 88
2005 87
2020 113
2002 91,983
2005 128,600
2020 161,900
2001 295,469
2005 418,300
2020 582,200
Fort Wayne International
Source: Indiana Department of Transportation for 2002 Operations and Based Aircraft, FY 2003 Primary Airport Apportionments for 2001 Enplanements, Fort Wayne International Airport Master Plan Update, Woolpert LLP, The Airport Technology Planning Group, Inc., Montgomery Consulting Group, Inc., September 2000.
2002 96
2005 87
2020 106
2002 53,099
2005 75,504
2020 92,566
2001 21,194
2005 57,680
2020 95,242
Gary/Chicago International Airport Source: Indiana Department of Transportation for 2002 Operations and Based Aircraft, FY 2003 Primary Airport
Apportionments for 2001 Enplanements, Gary/Chicago Airport Master Plan Update, HNTB, November 2001. 2002 93
__ __ 2002 205,872
2008 270,830
__ 2001 3,595,425
2005 4,350,000
2010 4,940,000
Indianapolis International
Source: Indiana Department of Transportation for 2002 Operations and Based Aircraft, FY 2003 Primary Airport Apportionments for 2001 Enplanements, Indianapolis International Noise Exposure Mp Update Draft, Landrum & Brown, June 2003 for forecast operations, Indianapolis International Airline Traffic Forecasts, Leigh Fisher Associates, October 2002 for enplanements forecasts.
2002 117
2005 107
2020 112
2002 125,189
2005 185,597
2020 195,552
2001 11,672
2005 8,933
2020 13917
Purdue University
Source: Indiana Department of Transportation for 2002 Operations and Based Aircraft, FY 2003 Primary Airport Apportionments for 2001 Enplanements, Purdue University Master Plan Update, R.W. Armstrong, February 2001.
2002 64
2005 51
2020 65
2002 74,998
2005 88,200
2020 105,700
2001 375,817
2005 608,200
2020 1,015,500
South Bend Regional
Source: Indiana Department of Transportation for 2002 Operations and Based Aircraft, FY 2003 Primary Airport Apportionments for 2001 Enplanements, South Bend Regional Airport Master Plan Update 2000, R.W. Armstrong, 2000.
2002 58
2008 80
__ 2002 94,786
2008* 112,000
__ __ __ __ Terre Haute International
* Includes only forecast operations of general aviation/air taxi and military Source: Indiana Department of Transportation for 2002 Operations and Based Aircraft, FY 2003 Primary Airport Apportionments for 2001 Enplanements, Hulman Regional Airport Master Plan

Airport Capacity CHAPTER 3
Introduction
Objective methods of measurement are also needed to translate the information from the forecast of based aircraft and operations into capital development needs. There are two types of capital development needed: facilities to support the critical aircraft (largest aircraft expected to use the airport on a regular basis) and the capacity of a facility to accommodate the total operations.
The operating characteristics of the critical aircraft for each airport determine what facilities are required to support it. This data is supplied by the airport to support requests for improvements via the Airport Capital Improvement Program (ACIP), discussed further in the Aviation Funding section.
Assessing the capacity of a facility is accomplished by using the FAA’s guidance in FAA Advisory Circular 15-/5060-5, Airport Capacity and Delay for planning studies. This method involves calculating the Annual Service Volume (ASV) via
two methods – long-range planning analysis and master planning airport specific analysis – and comparing it to the forecast level of activity.
ASV is made up of two components: a fleet mix index and runway layout configuration. The size of the various aircraft in the fleet mix affects the capacity of a facility, because when a small aircraft is operating following a large aircraft, increased separation (space) is needed between the aircraft. Runway configuration and the availability of taxiways also affect capacity. If aircraft can use more than one runway, the airport has a greater capacity. If a taxiway is available for aircraft to use rather than backtaxiing on the runway, there is greater airport capacity because an aircraft can exit the runway sooner.
Other than for the large airports that supplied the data from their master planning ASV analysis, the long range planning method has been used for this capacity review. Exhibit 3A summarizes the ASV for each system plan airport and compares it to the 20-year preferred and high forecast.
When an airport is approaching 60% usage of its annual capacity, the FAA recommends planning for increased capacity. Implementation of capacity improvement should then occur before the airport usage reaches 80% of its annual capacity.
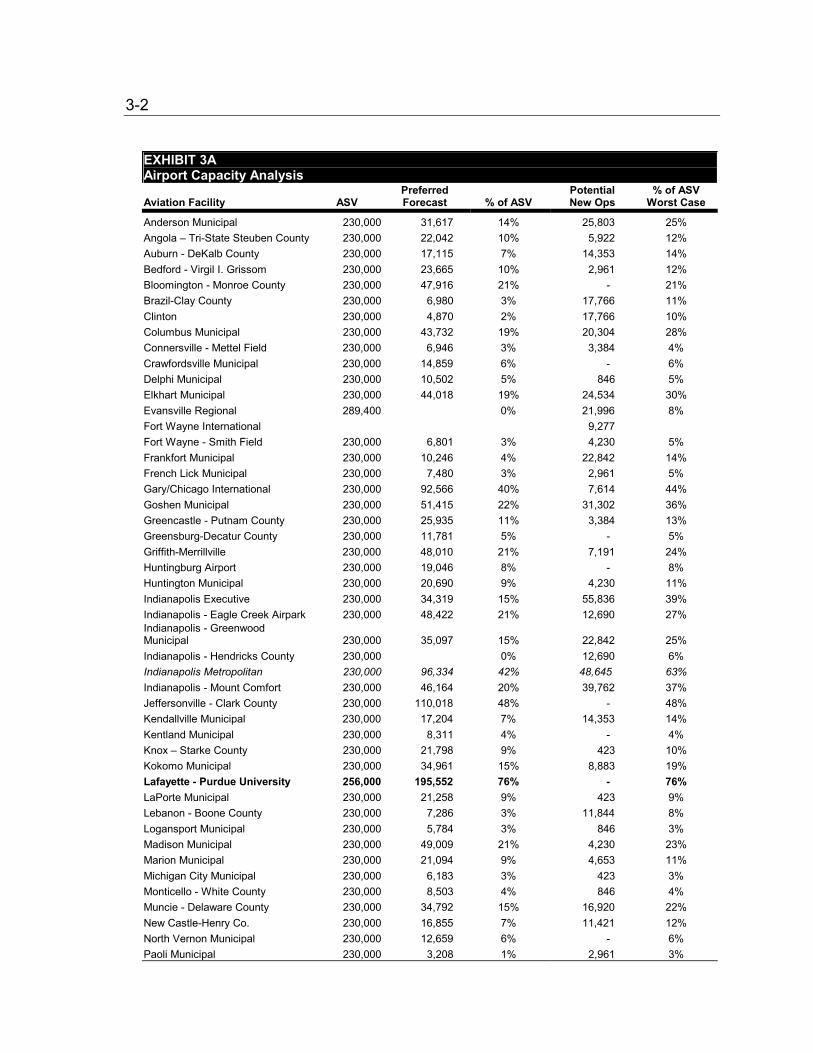
3-2 EXHIBIT 3A Airport Capacity Analysis
Aviation Facility ASV Preferred Forecast % of ASV
Potential New Ops
% of ASV Worst Case
Anderson Municipal 230,000 31,617 14% 25,803 25% Angola – Tri-State Steuben County 230,000 22,042 10% 5,922 12% Auburn - DeKalb County 230,000 17,115 7% 14,353 14% Bedford - Virgil I. Grissom 230,000 23,665 10% 2,961 12% Bloomington - Monroe County 230,000 47,916 21% - 21% Brazil-Clay County 230,000 6,980 3% 17,766 11% Clinton 230,000 4,870 2% 17,766 10% Columbus Municipal 230,000 43,732 19% 20,304 28% Connersville - Mettel Field 230,000 6,946 3% 3,384 4% Crawfordsville Municipal 230,000 14,859 6% - 6% Delphi Municipal 230,000 10,502 5% 846 5% Elkhart Municipal 230,000 44,018 19% 24,534 30% Evansville Regional 289,400 0% 21,996 8% Fort Wayne International 9,277 Fort Wayne - Smith Field 230,000 6,801 3% 4,230 5% Frankfort Municipal 230,000 10,246 4% 22,842 14% French Lick Municipal 230,000 7,480 3% 2,961 5% Gary/Chicago International 230,000 92,566 40% 7,614 44% Goshen Municipal 230,000 51,415 22% 31,302 36% Greencastle - Putnam County 230,000 25,935 11% 3,384 13% Greensburg-Decatur County 230,000 11,781 5% - 5% Griffith-Merrillville 230,000 48,010 21% 7,191 24% Huntingburg Airport 230,000 19,046 8% - 8% Huntington Municipal 230,000 20,690 9% 4,230 11% Indianapolis Executive 230,000 34,319 15% 55,836 39% Indianapolis - Eagle Creek Airpark 230,000 48,422 21% 12,690 27% Indianapolis - Greenwood Municipal 230,000 35,097 15% 22,842 25% Indianapolis - Hendricks County 230,000 0% 12,690 6% Indianapolis Metropolitan 230,000 96,334 42% 48,645 63% Indianapolis - Mount Comfort 230,000 46,164 20% 39,762 37% Jeffersonville - Clark County 230,000 110,018 48% - 48% Kendallville Municipal 230,000 17,204 7% 14,353 14% Kentland Municipal 230,000 8,311 4% - 4% Knox – Starke County 230,000 21,798 9% 423 10% Kokomo Municipal 230,000 34,961 15% 8,883 19% Lafayette - Purdue University 256,000 195,552 76% - 76% LaPorte Municipal 230,000 21,258 9% 423 9% Lebanon - Boone County 230,000 7,286 3% 11,844 8% Logansport Municipal 230,000 5,784 3% 846 3% Madison Municipal 230,000 49,009 21% 4,230 23% Marion Municipal 230,000 21,094 9% 4,653 11% Michigan City Municipal 230,000 6,183 3% 423 3% Monticello - White County 230,000 8,503 4% 846 4% Muncie - Delaware County 230,000 34,792 15% 16,920 22% New Castle-Henry Co. 230,000 16,855 7% 11,421 12% North Vernon Municipal 230,000 12,659 6% - 6% Paoli Municipal 230,000 3,208 1% 2,961 3%
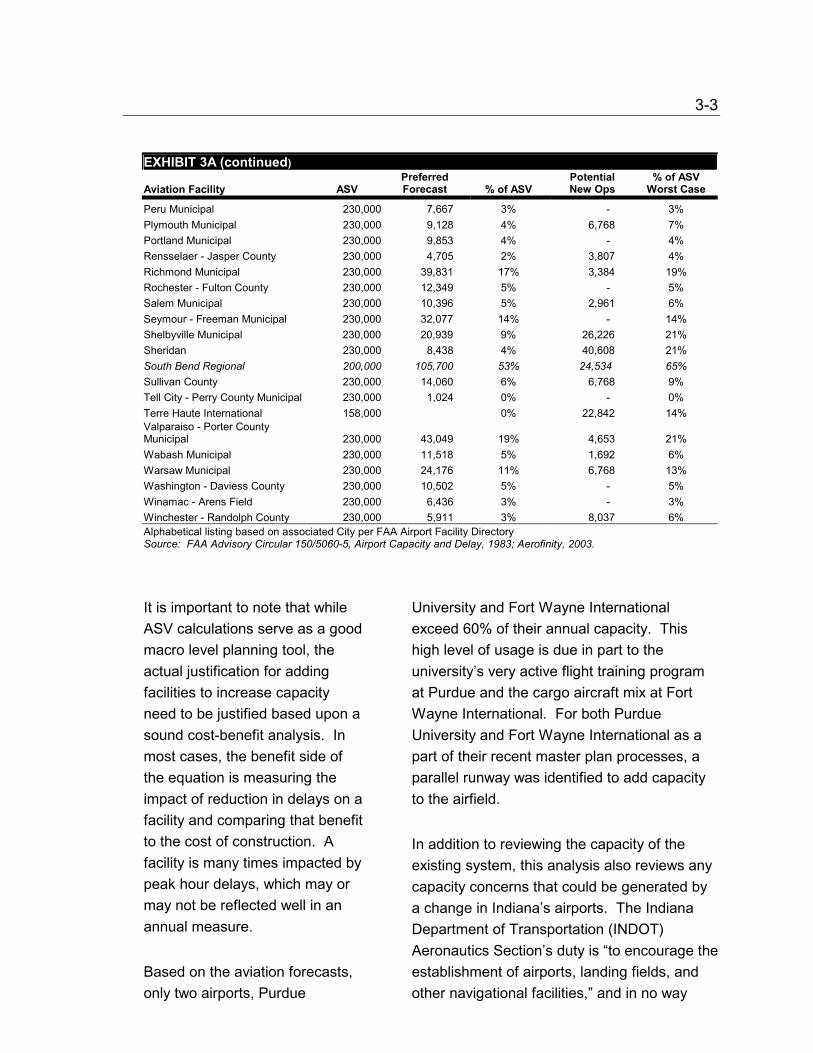
3-3 EXHIBIT 3A (continued)
Aviation Facility ASV Preferred Forecast % of ASV
Potential New Ops
% of ASV Worst Case
Peru Municipal 230,000 7,667 3% - 3% Plymouth Municipal 230,000 9,128 4% 6,768 7% Portland Municipal 230,000 9,853 4% - 4% Rensselaer - Jasper County 230,000 4,705 2% 3,807 4% Richmond Municipal 230,000 39,831 17% 3,384 19% Rochester - Fulton County 230,000 12,349 5% - 5% Salem Municipal 230,000 10,396 5% 2,961 6% Seymour - Freeman Municipal 230,000 32,077 14% - 14% Shelbyville Municipal 230,000 20,939 9% 26,226 21% Sheridan 230,000 8,438 4% 40,608 21% South Bend Regional 200,000 105,700 53% 24,534 65% Sullivan County 230,000 14,060 6% 6,768 9% Tell City - Perry County Municipal 230,000 1,024 0% - 0% Terre Haute International 158,000 0% 22,842 14% Valparaiso - Porter County Municipal 230,000 43,049 19% 4,653 21% Wabash Municipal 230,000 11,518 5% 1,692 6% Warsaw Municipal 230,000 24,176 11% 6,768 13% Washington - Daviess County 230,000 10,502 5% - 5% Winamac - Arens Field 230,000 6,436 3% - 3% Winchester - Randolph County 230,000 5,911 3% 8,037 6% Alphabetical listing based on associated City per FAA Airport Facility Directory Source: FAA Advisory Circular 150/5060-5, Airport Capacity and Delay, 1983; Aerofinity, 2003.
It is important to note that while ASV calculations serve as a good macro level planning tool, the actual justification for adding facilities to increase capacity need to be justified based upon a sound cost-benefit analysis. In most cases, the benefit side of the equation is measuring the impact of reduction in delays on a facility and comparing that benefit to the cost of construction. A facility is many times impacted by peak hour delays, which may or may not be reflected well in an annual measure.
Based on the aviation forecasts, only two airports, Purdue
University and Fort Wayne International exceed 60% of their annual capacity. This high level of usage is due in part to the university’s very active flight training program at Purdue and the cargo aircraft mix at Fort Wayne International. For both Purdue University and Fort Wayne International as a part of their recent master plan processes, a parallel runway was identified to add capacity to the airfield.
In addition to reviewing the capacity of the existing system, this analysis also reviews any capacity concerns that could be generated by a change in Indiana’s airports. The Indiana Department of Transportation (INDOT) Aeronautics Section’s duty is “to encourage the establishment of airports, landing fields, and other navigational facilities,” and in no way
3-4 encourage the closing of airports. However, there is an inherent risk in the system: privately owned, public-use airports, which are more vulnerable to closure, provide a significant portion of Indiana’s aviation infrastructure. If these airports close, their displaced aircraft need to move somewhere else, which could cause a system concern if adequate capacity is not present to accommodate the move.
For this analysis, the study has classified public-use airports according to the risk of closure. The 60 publicly owned airports in the Indiana State Aviation System Plan (ISASP) and National Plan of Integrated Airport Systems (NPIAS) that are eligible for federal and state financial aid are classified as low-risk. Also, with the ongoing process to transition Terry Airport to public ownership, it has been classified as a low-risk airport.
The one exception to the classification is Smith Field, which is publicly owned but had been proposed for closing. Based upon significant level of support from the community, aviation interest groups, and users, the Fort Wayne-Allen County Airport Authority Board reversed its decision to close Smith Field. As a result a study
is now underway to identify the most viable alternative for Smith Field to remain open. For this analysis, Smith Field has still been identified as medium risk.
Five privately owned airports in the ISASP that are eligible for federal or state aid are classified as medium-risk. The 32 privately owned and 10 publicly owned airports that are not eligible for federal or state aid are classified as high-risk. Accepting federal or state monies obligates an airport owner to keep the facility open and operating from the required period, typically 20 years, or they must reimburse the funding authority for the grant monies prior to closing.
The potential effect of the closing of these medium- and high-risk airports on the ISASP airports has been assessed. For this analysis, the statewide average of 423 operations per based aircraft (OPBA) at ISASP airports used in the forecasting was also used to estimate the level of operations at the non-ISASP public-use airports. For each ISASP airport, it was assumed that dislocated aircraft owners would relocate to another facility within the same 20-mile radius service area if their present airport closes. Since the service areas overlap, it is possible for the owner of a dislocated aircraft to have several airports from which to choose. To assess the potential capacity impacts, it has been assumed that all dislocated aircraft within each ISASP airport’s service area will relocate to that airport. This means that many aircraft have been counted as dislocated up to several times. While these aircraft cannot relocate to multiple airports, this assumption provides a worst-case scenario.
3-5 Indianapolis International Airport has been excluded from this analysis since it is relatively unlikely to attract based aircraft from the closure of privately owned public-use airport due to the cost associated with basing there.
Review of potential operations associated with relocation of aircraft among public-use airports due to a high- or medium-risk airport closing reveals that two airports could have capacity concerns, as shown in italics on Exhibit 3A. If all the at-risk airports in their service area closed and all the relocating aircraft moved to South Bend Regional Airport or Indianapolis Metropolitan Airport, both airports would be operating at more than
60% capacity at the end of the planning period. However, in both cases, there are multiple airports in the area from which a relocating aircraft owner can select. It also may not be likely that all at-risk airports in their service area would close within the planning period. In addition, with these facilities operating at a high level of their annual service volume, resulting delays may encourage owners to locate their aircraft to another airport in the area, more evenly distributing the operations and lessening capacity concerns at South Bend Regional and Indianapolis Metropolitan.
While the other ISASP airports would not reach at least 60% of their annual capacity if at-risk public-use airports closed, most system plan airports would still feel an impact particularly in the area of aircraft storage needs. Thus, sponsors of publicly owned airports should monitor activity at the privately owned airports within their service area for the purpose of planning future capital improvements.

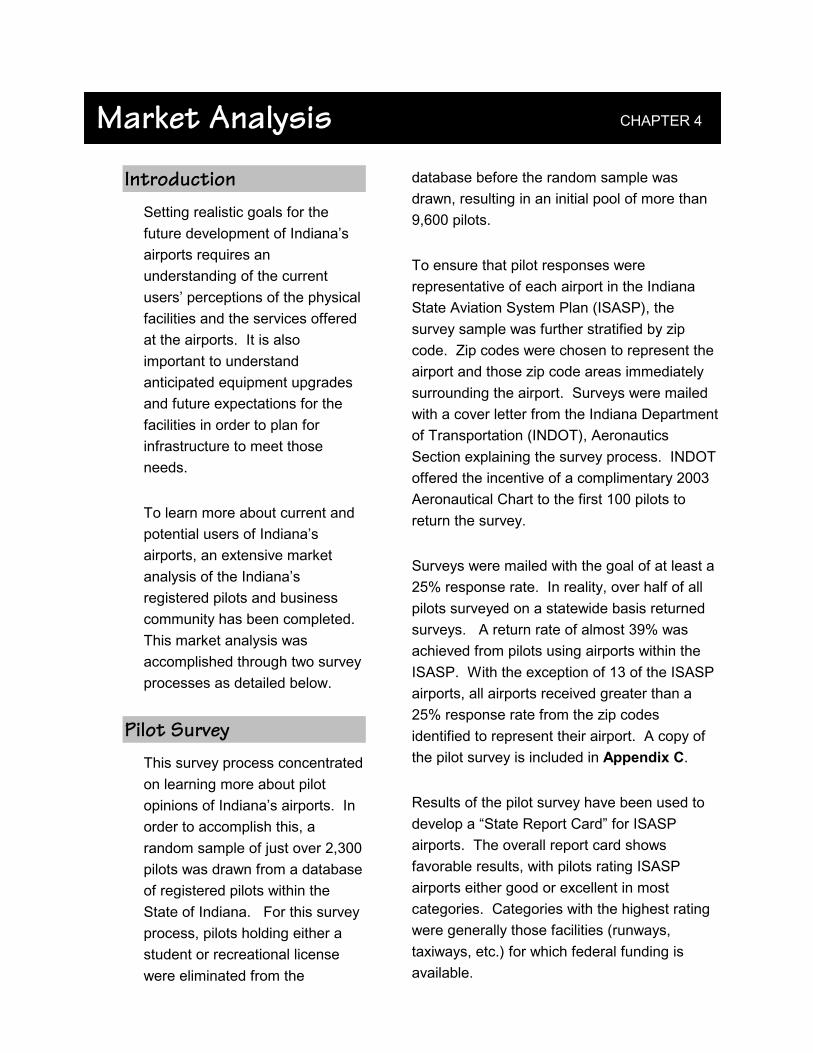
Market Analysis CHAPTER 4
Introduction
Setting realistic goals for the future development of Indiana’s airports requires an understanding of the current users’ perceptions of the physical facilities and the services offered at the airports. It is also important to understand anticipated equipment upgrades and future expectations for the facilities in order to plan for infrastructure to meet those needs.
To learn more about current and potential users of Indiana’s airports, an extensive market analysis of the Indiana’s registered pilots and business community has been completed. This market analysis was accomplished through two survey processes as detailed below.
Pilot Survey This survey process concentrated on learning more about pilot opinions of Indiana’s airports. In order to accomplish this, a random sample of just over 2,300 pilots was drawn from a database of registered pilots within the State of Indiana. For this survey process, pilots holding either a student or recreational license were eliminated from the
database before the random sample was drawn, resulting in an initial pool of more than 9,600 pilots.
To ensure that pilot responses were representative of each airport in the Indiana State Aviation System Plan (ISASP), the survey sample was further stratified by zip code. Zip codes were chosen to represent the airport and those zip code areas immediately surrounding the airport. Surveys were mailed with a cover letter from the Indiana Department of Transportation (INDOT), Aeronautics Section explaining the survey process. INDOT offered the incentive of a complimentary 2003 Aeronautical Chart to the first 100 pilots to return the survey.
Surveys were mailed with the goal of at least a 25% response rate. In reality, over half of all pilots surveyed on a statewide basis returned surveys. A return rate of almost 39% was achieved from pilots using airports within the ISASP. With the exception of 13 of the ISASP airports, all airports received greater than a 25% response rate from the zip codes identified to represent their airport. A copy of the pilot survey is included in Appendix C.
Results of the pilot survey have been used to develop a “State Report Card” for ISASP airports. The overall report card shows favorable results, with pilots rating ISASP airports either good or excellent in most categories. Categories with the highest rating were generally those facilities (runways, taxiways, etc.) for which federal funding is available.
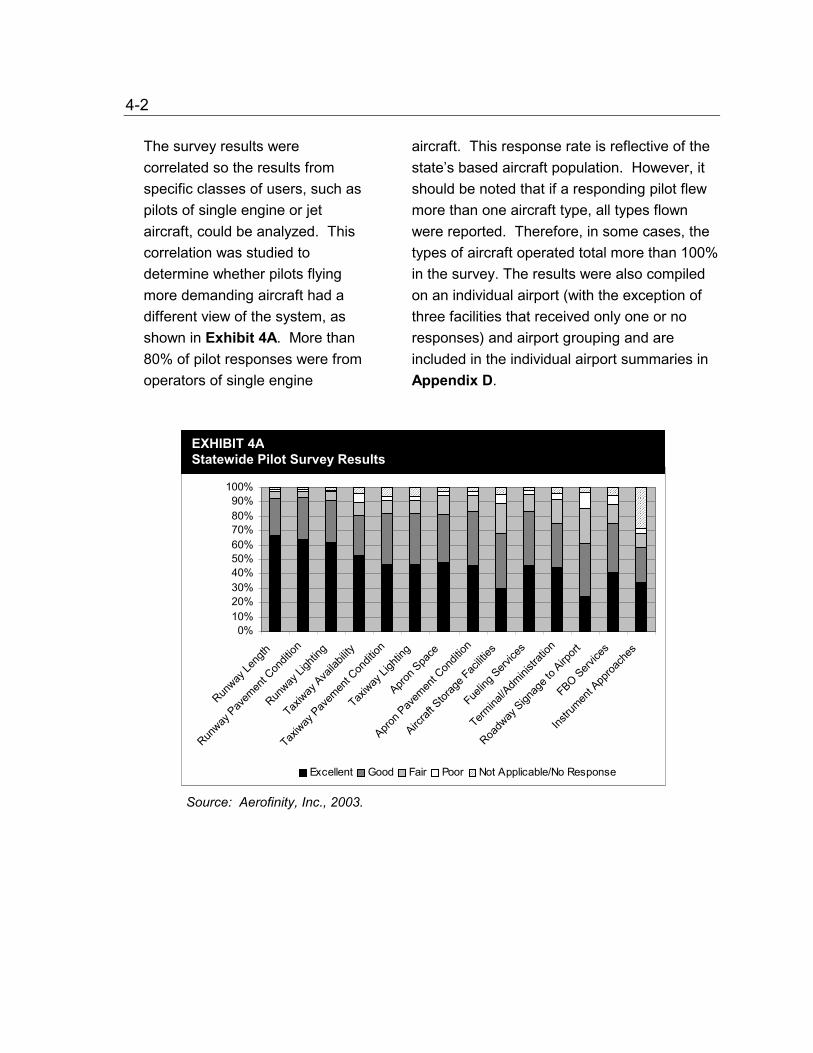
4-2 The survey results were correlated so the results from specific classes of users, such as pilots of single engine or jet aircraft, could be analyzed. This correlation was studied to determine whether pilots flying more demanding aircraft had a different view of the system, as shown in Exhibit 4A. More than 80% of pilot responses were from operators of single engine
aircraft. This response rate is reflective of the state’s based aircraft population. However, it should be noted that if a responding pilot flew more than one aircraft type, all types flown were reported. Therefore, in some cases, the types of aircraft operated total more than 100% in the survey. The results were also compiled on an individual airport (with the exception of three facilities that received only one or no responses) and airport grouping and are included in the individual airport summaries in Appendix D.
0%10%20%30%40%50%60%70%80%90%
100%
Runway
Leng
th
Runway
Pavem
ent C
ondit
ion
Runway
Ligh
ting
Taxiway
Availa
bility
Taxiway
Pavem
ent C
ondit
ion
Taxiway
Ligh
ting
Apron S
pace
Apron P
avem
ent C
ondit
ion
Aircraf
t Stor
age F
aciliti
es
Fuelin
g Serv
ices
Termina
l/Adm
inistr
ation
Roadw
ay Sign
age t
o Airp
ort
FBO Service
s
Instru
ment A
pproa
ches
EXHIBIT 4A Statewide Pilot Survey Results
Excellent Good Fair Poor Not Applicable/No Response
Source: Aerofinity, Inc., 2003.
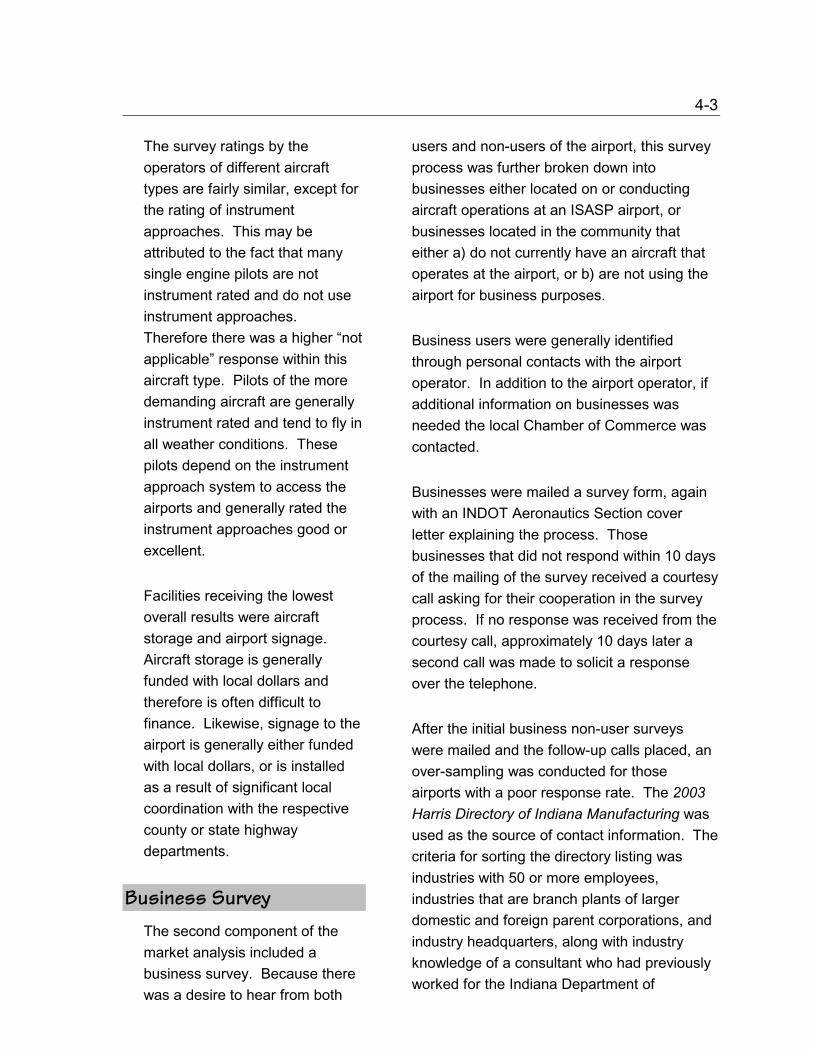
4-3 The survey ratings by the operators of different aircraft types are fairly similar, except for the rating of instrument approaches. This may be attributed to the fact that many single engine pilots are not instrument rated and do not use instrument approaches. Therefore there was a higher “not applicable” response within this aircraft type. Pilots of the more demanding aircraft are generally instrument rated and tend to fly in all weather conditions. These pilots depend on the instrument approach system to access the airports and generally rated the instrument approaches good or excellent.
Facilities receiving the lowest overall results were aircraft storage and airport signage. Aircraft storage is generally funded with local dollars and therefore is often difficult to finance. Likewise, signage to the airport is generally either funded with local dollars, or is installed as a result of significant local coordination with the respective county or state highway departments.
Business Survey The second component of the market analysis included a business survey. Because there was a desire to hear from both
users and non-users of the airport, this survey process was further broken down into businesses either located on or conducting aircraft operations at an ISASP airport, or businesses located in the community that either a) do not currently have an aircraft that operates at the airport, or b) are not using the airport for business purposes.
Business users were generally identified through personal contacts with the airport operator. In addition to the airport operator, if additional information on businesses was needed the local Chamber of Commerce was contacted.
Businesses were mailed a survey form, again with an INDOT Aeronautics Section cover letter explaining the process. Those businesses that did not respond within 10 days of the mailing of the survey received a courtesy call asking for their cooperation in the survey process. If no response was received from the courtesy call, approximately 10 days later a second call was made to solicit a response over the telephone.
After the initial business non-user surveys were mailed and the follow-up calls placed, an over-sampling was conducted for those airports with a poor response rate. The 2003 Harris Directory of Indiana Manufacturing was used as the source of contact information. The criteria for sorting the directory listing was industries with 50 or more employees, industries that are branch plants of larger domestic and foreign parent corporations, and industry headquarters, along with industry knowledge of a consultant who had previously worked for the Indiana Department of
4-4 Commerce. Surveys were then mailed only to those industries that had zip codes matching the airports with a poor return from the initial survey.
Analyzing the results after conducting the survey processes, it was identified that the business user and non-user survey responses were meaningful at a statewide level but not at the individual airport level. The limited number of businesses users and non-users that responded, the process to identify those surveyed, and the response rate particularly of the business non-users all have the potential to greatly influence the results at the individual level. Therefore, the business user and non-user survey results have only been summarized at a statewide level.
Business User Survey Results A complete summary of the statewide business user survey results is included in Appendix C. Results for separate ISASP airports are included on the individual airport summaries in Appendix D. Almost 70% of the respondents are based in Indiana. As with the pilot survey,
if a company flew more than one type of aircraft, all types flown were identified; thus, in some cases the total exceeds 100%. The majority of the business user respondents flew the following types of aircraft:
�� Jets - 45% �� Multi-engine turbo props - 28% �� Single-engine piston aircraft - 24% �� Multi-engine piston aircraft - 20%
The primary business use of the aircraft was (more than one response possible total exceeds 100%):
�� Transportation to meetings - 85% �� Sales/Marketing - 67% �� Transportation of suppliers or clients to
company facility - 53% �� Shipping of parts, supplies or manufactured
goods - 20%
Only about a third of the business users identified that the airport was a factor in deciding to locate, do business, or continue to do business in the respective community. However, almost 70% of the respondents conduct business in other communities because of the availability of an airport.
Runways and navaids were the most commonly identified inadequate facilities, followed by hangar and apron space. However, similar to the pilot survey, the majority of business respondents rated Indiana’s airport facilities good or excellent in most categories, as shown in Exhibit 4B.
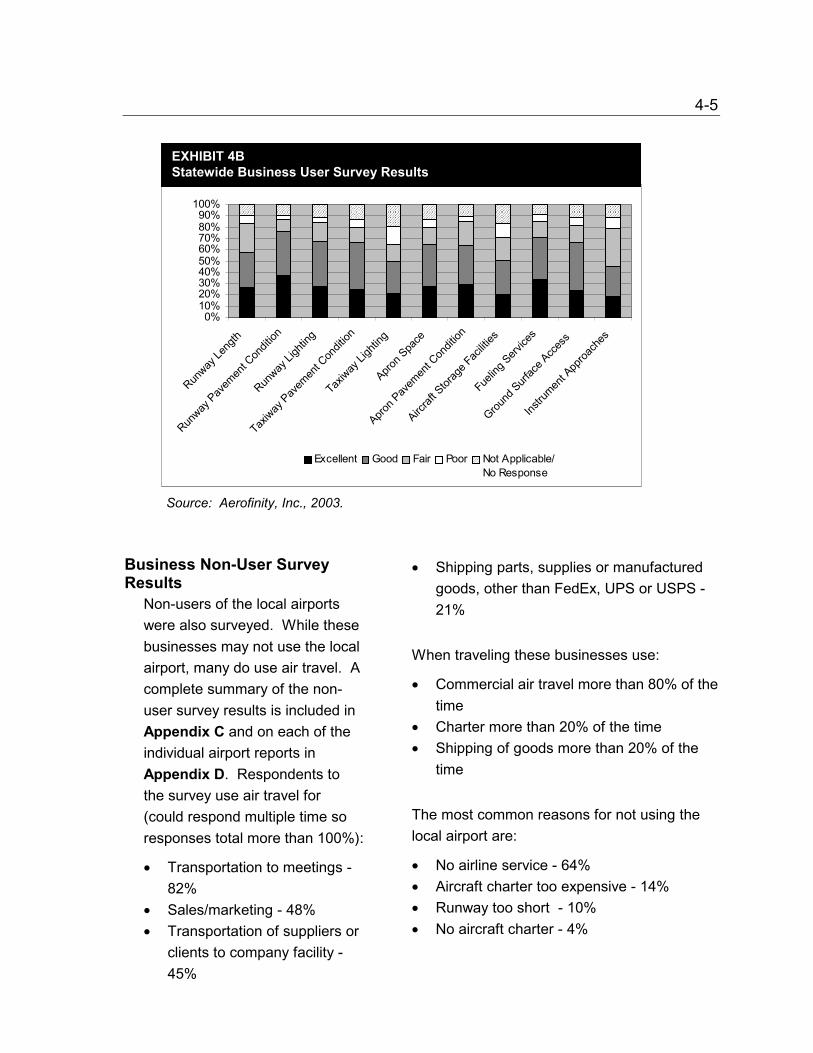
0%10%20%30%40%50%60%70%80%90%
100%
Runway
Leng
th
Runway
Pavem
ent C
ondit
ion
Runway
Ligh
ting
Taxiway
Pavem
ent C
ondit
ion
Taxiway
Ligh
ting
Apron S
pace
Apron P
avem
ent C
ondit
ion
Aircraf
t Stor
age F
aciliti
es
Fuelin
g Serv
ices
Ground
Surfac
e Acc
ess
Instru
ment A
pproa
ches
Excellent Good Fair Poor Not Applicable/No Response
4-5
EXHIBIT 4BStatewide Business User Survey Results
Source: Aerofinity, Inc., 2003.
Business Non-User Survey Results
�� Shipping parts, supplies or manufactured goods, other than FedEx, UPS or USPS - 21% Non-users of the local airports
were also surveyed. While these businesses may not use the local airport, many do use air travel. A complete summary of the non-user survey results is included in Appendix C and on each of the individual airport reports in Appendix D. Respondents to the survey use air travel for (could respond multiple time so responses total more than 100%):
When traveling these businesses use:
�� Commercial air travel more than 80% of the time
�� Charter more than 20% of the time �� Shipping of goods more than 20% of the
time
The most common reasons for not using the local airport are:
�� No airline service - 64% �� Transportation to meetings - 82% �� Aircraft charter too expensive - 14%
�� Runway too short - 10% �� Sales/marketing - 48% �� No aircraft charter - 4% �� Transportation of suppliers or
clients to company facility - 45%
4-6 Results of the pilot and business surveys have been used as one data source in identifying overall recommendations for the State’s airports. They will also be considered by the Indiana Department of Transportation (INDOT) Aeronautics Section staff to assist in validating the need for additional funding for airport development and to review ACIP requests for funding.
Availability of Survey Results
All of the pilot and business user/non-user survey results have been provided to the
INDOT, Aeronautics Section in a website format that totals and correlates results for all Indiana airports, ISASP airports and individual ISASP airports. Individual airport results can be made available to airport operators via the INDOT Aeronautics Section website. They have been password protected by INDOT, with the password available from INDOT only on a limited basis for appropriate parties. In addition to providing comprehensive information about user opinions of Indiana’s airports, these survey results will be helpful to airport operators as they “market” their airport to the local community and prepare Airport Capital Improvement Program (ACIP) requests for funding.
Airport Funding CHAPTER 5
Introduction
Indiana’s State Aviation System provides the infrastructure to support air transportation. Investment is needed to maintain and upgrade the system to meet user needs. Airport improvements are generally funded through a combination of federal and state dollars along with local funds provided either from airport revenues or from the public or private entity that owns the airport. These funding sources are discussed in further detail below.
The process of allocating the limited resources to the individual Indiana State Aviation System Plan (ISASP) airports occurs through the Airport Capital Improvement Program (ACIP) request process. This request process and the current facility needs are detailed at the end of this chapter.
Federal Funds Federal funding generally provides the largest portion of the available funds for airport development, resulting in a significant return on investment for the state and local monies used to match the federal grants. The federal funding is provided
through Airport Improvement Program (AIP) grants for the planning and development of public-use airports that are in the National Plan of Integrated Airport Systems (NPIAS). The NPIAS is used by the Federal Aviation Administration (FAA) in administering the AIP to ensure that its strategic goals for safety, system efficiency and environmental compatibility are met by identifying specific airport improvements that contribute to those goals. AIP funds come from user fees paid by aviation consumers throughout the country. These user fees are deposited into the “Aviation Trust Fund.” Distribution of the Aviation Trust Fund is controlled by Congress and administered by the FAA. Congress establishes the funding authorization levels and the FAA establishes priorities for distributing the funds, which are then appropriated through the budget process.
AIP has its origins in the early Federal Air Airport Program (FAAP) that was authorized by the Federal Airport Act of 1946. This program was enacted following World War II to aid in the development of a national system of airports, with funds drawn from the general fund of the Treasury.
A more comprehensive program was established with the passage of the Airport and Airway Development Act of 1970 that provided grants for airport planning under the Planning Grant Program (PGP), and for airport development under the Airport Development Aid Program (ADAP). These programs were funded from a newly established Airport and Airway Trust Fund, with revenues from several
5-2 aviation user taxes on items such as airline fares, airfreight and aviation fuel.
The Airport and Airway Improvement Act of 1982 established the current AIP, with user fees, fuel taxes and other similar revenue sources supporting funding. The AIP has been amended several times since its original passage, most recently through the passage of the Wendall H. Ford Aviation Investment and Reform Act for the 21st Century (AIR-21). The four-year bill covered the fiscal years (FY) 2000 – 2003. This is one of the largest authorizations ever made for AIP. At the writing of this report legislation is pending that will determine the levels of AIP funding for 2004 and beyond.
AIP funding is divided into two classifications: entitlement and discretionary. Because requests for AIP funds exceed the availability of funding, the FAA awards grants based upon national priorities and objectives. AIP funds are typically first apportioned into the major entitlement categories including primary, cargo, state, and non-primary. The remaining funds are then distributed on a discretionary basis. Some projects, including those for airport noise
compatibility, the Military Airport Program (MAP), Capacity/Safety Security/Noise (CSSN), and Relievers are categorized as “set-aside projects” and are funded through the discretionary awards that are distributed based on a national prioritization formula.
AIP Entitlement Funds The NPIAS airports in Indiana eligible to receive AIP funds are either publicly owned or may be privately owned but designated by the FAA as a reliever airport. Nationally, those airports that are privately owned and have scheduled service with at least 2,500 annual enplanements are also AIP eligible.
Of the 69 Indiana State Aviation System Plan (ISASP) airports, 65 are in the NPIAS and eligible for AIP funds. For funding purposes, AIR-21 divides airports into primary and non-primary categories, with non-primary airports receiving an entitlement for the first time in FY 2001-2003.
Under AIR-21, primary airports receive an annual AIP apportionment of at least $1 million (when AIP funding levels meet or exceed $3.2 billion), with the actual amount based upon the number of passengers enplaned at the airport. Primary airports are divided in to large, medium, small or non-hub airports based upon the percentage of total U.S. enplanements accommodated at that airport.
Large hub primary airports enplane more than 1% of the total U.S. passengers. There are no large hub primary airports located in Indiana. The closest large hub airports are Cincinnati-Northern Kentucky International and O’Hare International.
5-3 Medium hub primary airports enplane 0.25 to 0.99% of the total U.S. passengers. Indianapolis International is the only medium hub airport in Indiana, enplaning 0.55% of the total U.S. passengers in 2001 (used to set FY 2003 funding).
Small hub primary airports enplane 0.05 to 0.249% of the total U.S. passengers. For FY 2003, South Bend Regional is the only small hub airport in Indiana, having enplaned 0.057% of the total U.S. passengers in 2001.
Non-hub primary airports enplane 10,000 passengers up to 0.049% of the total U.S. passengers. Indiana had four non-hub primary airports qualifying for funding in FY 2003.
�� Fort Wayne International (0.045% of total U.S. passengers in 2001)
�� Evansville Regional (0.033% of total U.S. passengers in 2001)
�� Gary/Chicago International (21,194 passengers in 2001)
�� Purdue University (11,672 passengers in 2001)
Under the AIR-21 authorization, the other NPIAS classifications of commercial service (2,500 to 9,999 enplaned passengers), reliever airports (designated
airports to relieve general aviation traffic from a primary airport in a metropolitan area with at least 250,000 population or 250,000 annual passengers at 60% capacity if not for the relief) and general aviation airports (all other NPIAS facilities) are grouped together under the non-primary category. These airports receive an annual apportionment of up to $150,000 (lesser of 1/5 of airport capital improvement request or $150,000) in AIP funds (when AIP funding levels meet or exceed $3.2 billion).
Cargo entitlement funds are available to airports supporting air cargo activity with a total annual landed weight of more than 100 million pounds. Two airports in Indiana were eligible and received cargo entitlements in FY 2003:
�� Fort Wayne International (831 million pounds landed weight in 2001)
�� Indianapolis International (6.3 billion pounds landed weight in 2001)
State entitlement funds are available for use within a state to fund planning and development at non-primary airports. The state fund distribution is based on the area and population of each state. The set aside is 20% of the AIP (when AIP funding levels meet or exceed $3.2 billion).
AIP Discretionary Funds Discretionary funds are those established in various set-asides, plus any remaining monies after all apportionment (entitlement) funds have been allocated. These funds are assigned at the discretion of the FAA Administrator to support noise mitigation and highest-priority development that will benefit the National Airspace System. Airports
5-4 compete on a national basis for discretionary funds.
AIP Funding Eligibility and Requirements
At large and medium primary hub airports, 75% of the costs of development costs of eligible projects are funded by AIP dollars. The exception to this is noise program implementation, which is eligible at 80%. Two airports in Indiana are eligible for noise monies, having completed the required Federal Aviation Regulations Part 150 Noise Study:
�� Indianapolis International
�� Terre Haute International
Small and non-hub primary and non-primary airports are eligible for federal participation in qualified development projects at 90%.
Projects eligible for AIP funding include those improvements related to airport safety, capacity, security and environmental concerns, as well as runway,
taxiway and apron pavement maintenance. Terminal improvements, aircraft hangars and projects related to airport operations or that otherwise generate revenue are typically not AIP eligible. Professional services necessary for eligible projects, including planning, surveying, design, construction inspection and testing are AIP eligible. Projects considered for AIP eligibility must be justified by aviation demand at the airport and must meet federal environmental, airspace and procurement requirements.
Airport sponsors who accept AIP grants agree to meet certain grant requirements. These include obligations to operate and maintain the airport in a serviceable condition, to not grant exclusive use rights, to mitigate hazards to airspace, and to use revenue properly.
Indiana is part of the Great Lakes Region of the Federal Aviation Administration (FAA), which includes the states of:
�� Illinois �� Indiana �� Michigan �� Minnesota �� North Dakota �� Ohio �� South Dakota �� Wisconsin
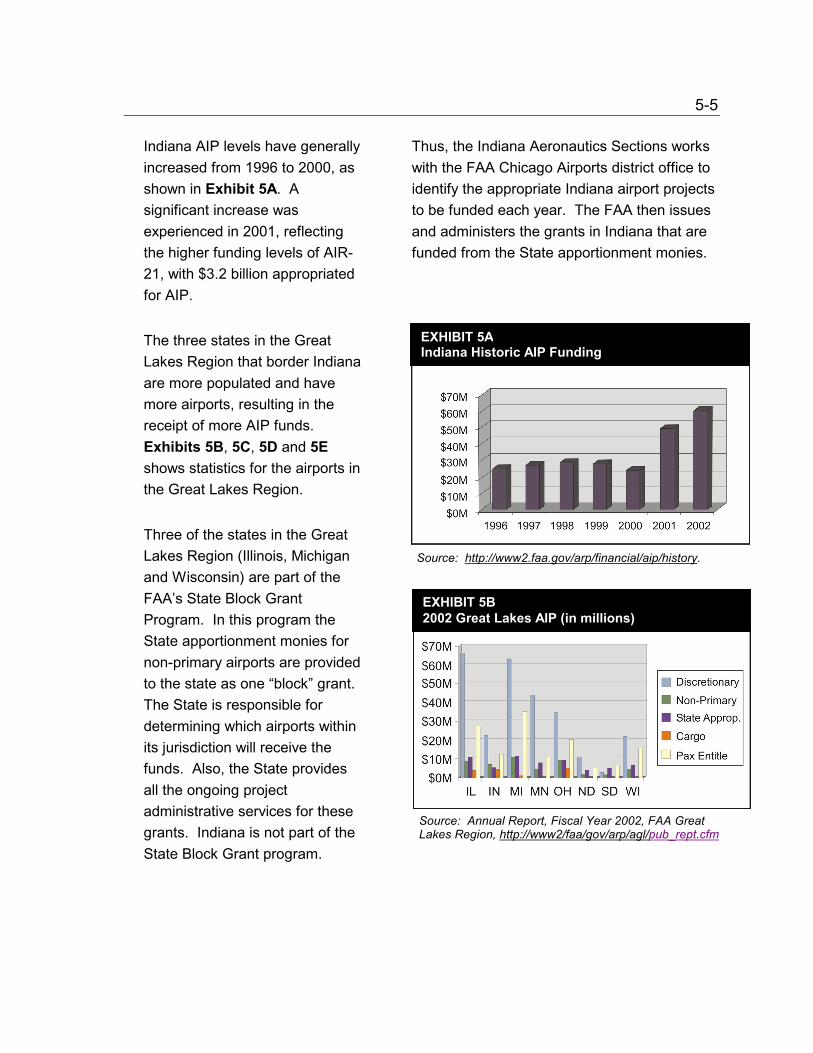
5-5 Indiana AIP levels have generally increased from 1996 to 2000, as shown in Exhibit 5A. A significant increase was experienced in 2001, reflecting the higher funding levels of AIR-21, with $3.2 billion appropriated for AIP.
Thus, the Indiana Aeronautics Sections works with the FAA Chicago Airports district office to identify the appropriate Indiana airport projects to be funded each year. The FAA then issues and administers the grants in Indiana that are funded from the State apportionment monies.
Source: http://www2.faa.gov/arp/financial/aip/history.
EXHIBIT 5B2002 Great Lakes AIP (in millions)
Source: Annual Report, Fiscal Year 2002, FAA Great Lakes Region, http://www2/faa/gov/arp/agl/pub_rept.cfm
EXHIBIT 5AIndiana Historic AIP Funding
The three states in the Great Lakes Region that border Indiana are more populated and have more airports, resulting in the receipt of more AIP funds. Exhibits 5B, 5C, 5D and 5E shows statistics for the airports in the Great Lakes Region.
Three of the states in the Great Lakes Region (Illinois, Michigan and Wisconsin) are part of the FAA’s State Block Grant Program. In this program the State apportionment monies for non-primary airports are provided to the state as one “block” grant. The State is responsible for determining which airports within its jurisdiction will receive the funds. Also, the State provides all the ongoing project administrative services for these grants. Indiana is not part of the State Block Grant program.
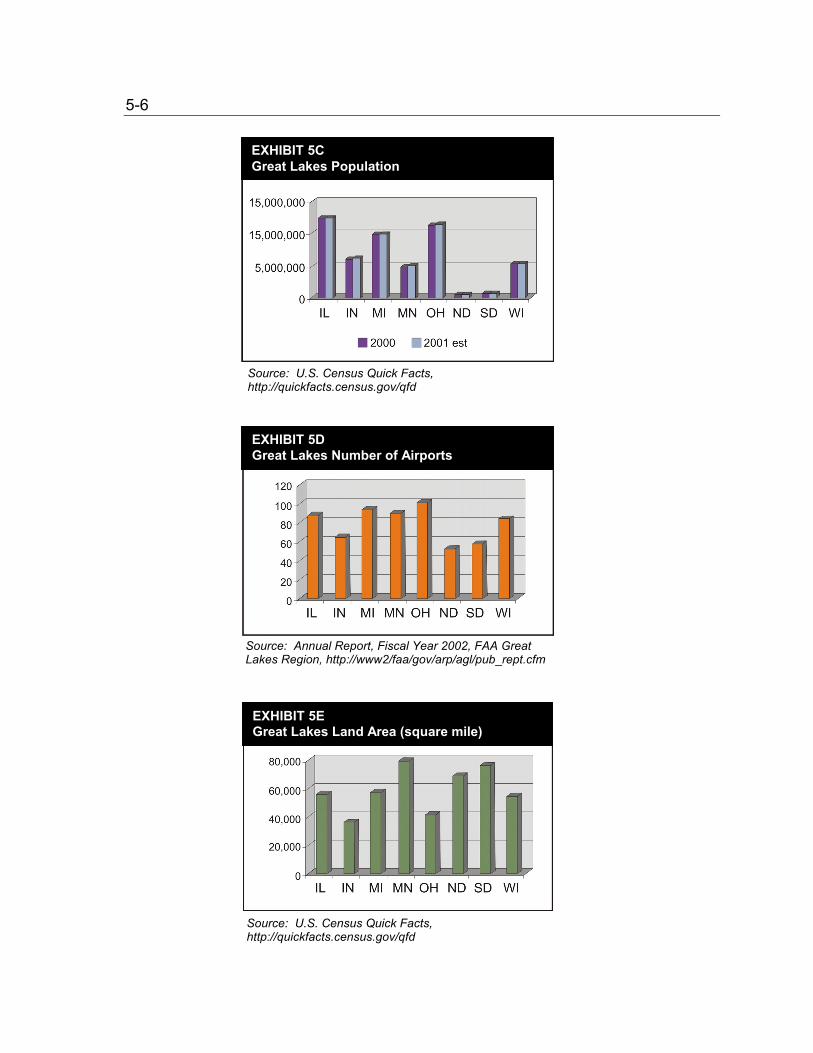
5-6
EXHIBIT 5C Great Lakes Population
Source: U.S. Census Quick Facts, http://quickfacts.census.gov/qfd
EXHIBIT 5D Great Lakes Number of Airports
Source: Annual Report, Fiscal Year 2002, FAA Great Lakes Region, http://www2/faa/gov/arp/agl/pub_rept.cfm
EXHIBIT 5E Great Lakes Land Area (square mile)
Source: U.S. Census Quick Facts, http://quickfacts.census.gov/qfd
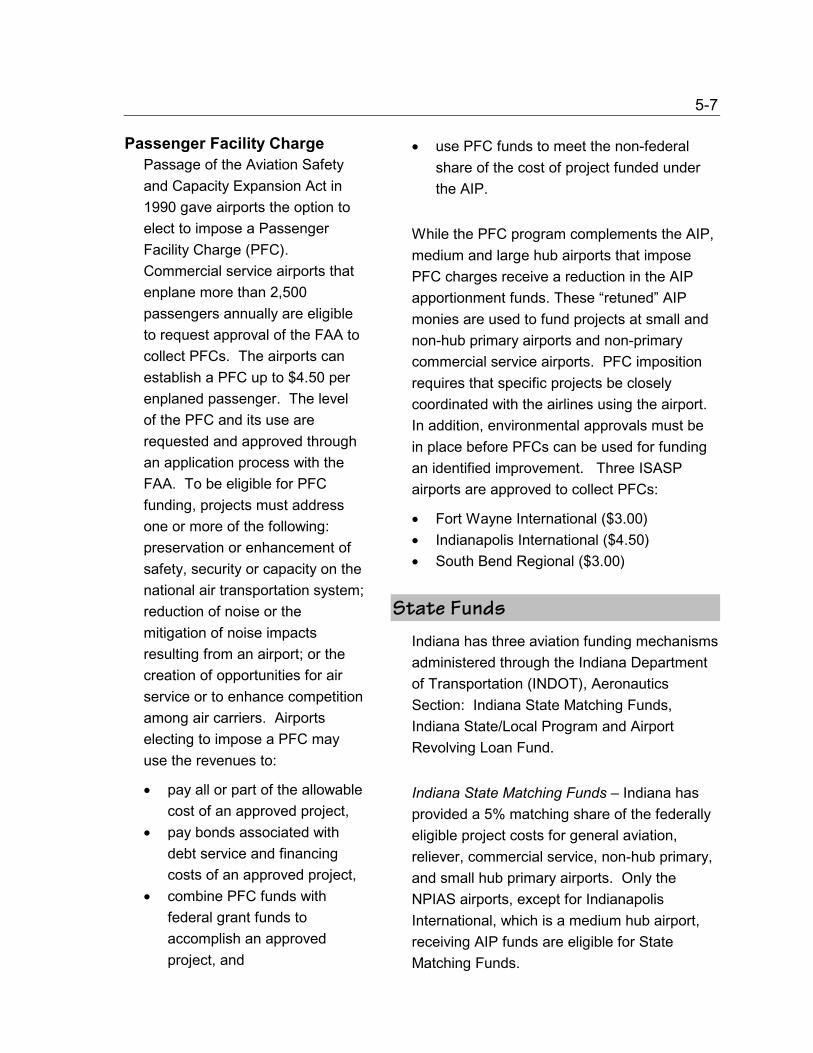
5-7
Passenger Facility Charge Passage of the Aviation Safety and Capacity Expansion Act in 1990 gave airports the option to elect to impose a Passenger Facility Charge (PFC). Commercial service airports that enplane more than 2,500 passengers annually are eligible to request approval of the FAA to collect PFCs. The airports can establish a PFC up to $4.50 per enplaned passenger. The level of the PFC and its use are requested and approved through an application process with the FAA. To be eligible for PFC funding, projects must address one or more of the following: preservation or enhancement of safety, security or capacity on the national air transportation system; reduction of noise or the mitigation of noise impacts resulting from an airport; or the creation of opportunities for air service or to enhance competition among air carriers. Airports electing to impose a PFC may use the revenues to:
�� pay all or part of the allowable cost of an approved project,
�� pay bonds associated with debt service and financing costs of an approved project,
�� combine PFC funds with federal grant funds to accomplish an approved project, and
�� use PFC funds to meet the non-federal share of the cost of project funded under the AIP.
While the PFC program complements the AIP, medium and large hub airports that impose PFC charges receive a reduction in the AIP apportionment funds. These “retuned” AIP monies are used to fund projects at small and non-hub primary airports and non-primary commercial service airports. PFC imposition requires that specific projects be closely coordinated with the airlines using the airport. In addition, environmental approvals must be in place before PFCs can be used for funding an identified improvement. Three ISASP airports are approved to collect PFCs:
�� Fort Wayne International ($3.00) �� Indianapolis International ($4.50) �� South Bend Regional ($3.00)
State Funds Indiana has three aviation funding mechanisms administered through the Indiana Department of Transportation (INDOT), Aeronautics Section: Indiana State Matching Funds, Indiana State/Local Program and Airport Revolving Loan Fund.
Indiana State Matching Funds – Indiana has provided a 5% matching share of the federally eligible project costs for general aviation, reliever, commercial service, non-hub primary, and small hub primary airports. Only the NPIAS airports, except for Indianapolis International, which is a medium hub airport, receiving AIP funds are eligible for State Matching Funds.
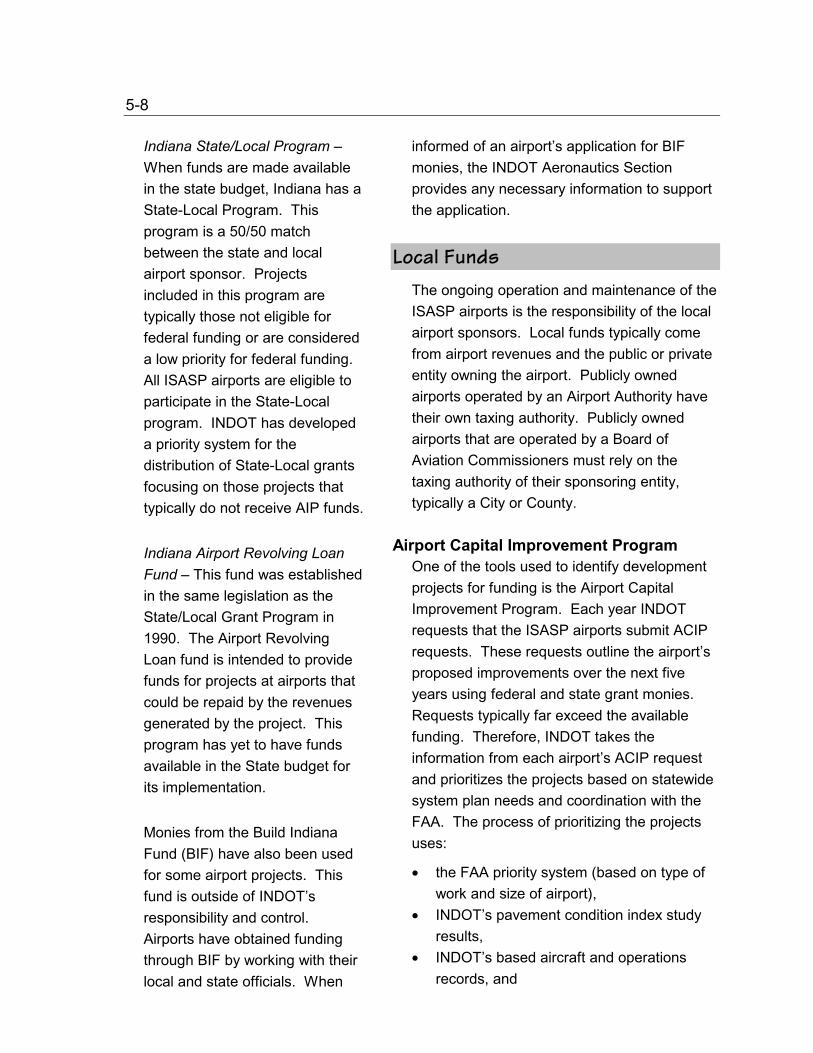
5-8 Indiana State/Local Program – When funds are made available in the state budget, Indiana has a State-Local Program. This program is a 50/50 match between the state and local airport sponsor. Projects included in this program are typically those not eligible for federal funding or are considered a low priority for federal funding. All ISASP airports are eligible to participate in the State-Local program. INDOT has developed a priority system for the distribution of State-Local grants focusing on those projects that typically do not receive AIP funds.
Indiana Airport Revolving Loan Fund – This fund was established in the same legislation as the State/Local Grant Program in 1990. The Airport Revolving Loan fund is intended to provide funds for projects at airports that could be repaid by the revenues generated by the project. This program has yet to have funds available in the State budget for its implementation.
Monies from the Build Indiana Fund (BIF) have also been used for some airport projects. This fund is outside of INDOT’s responsibility and control. Airports have obtained funding through BIF by working with their local and state officials. When
informed of an airport’s application for BIF monies, the INDOT Aeronautics Section provides any necessary information to support the application.
Local Funds The ongoing operation and maintenance of the ISASP airports is the responsibility of the local airport sponsors. Local funds typically come from airport revenues and the public or private entity owning the airport. Publicly owned airports operated by an Airport Authority have their own taxing authority. Publicly owned airports that are operated by a Board of Aviation Commissioners must rely on the taxing authority of their sponsoring entity, typically a City or County.
Airport Capital Improvement Program One of the tools used to identify development projects for funding is the Airport Capital Improvement Program. Each year INDOT requests that the ISASP airports submit ACIP requests. These requests outline the airport’s proposed improvements over the next five years using federal and state grant monies. Requests typically far exceed the available funding. Therefore, INDOT takes the information from each airport’s ACIP request and prioritizes the projects based on statewide system plan needs and coordination with the FAA. The process of prioritizing the projects uses:
�� the FAA priority system (based on type of work and size of airport),
�� INDOT’s pavement condition index study results,
�� INDOT’s based aircraft and operations records, and
5-9 �� supporting data provided by
the airports.
The funding requests submitted by the airports fall into six general categories:
Airport Preservation Preventive maintenance and rehabilitation projects are needed to preserve existing aviation system facilities. Projects in this category are generally pavement rehabilitation overlays and reconstruction. These projects are programmed based on the pavement condition index rating study results, with pavements in the poorest condition receiving highest consideration. Rehabilitation of other airport facilities such as electrical systems and navaids are also included in this category.
Runway and Taxiway Capacity New runway and taxiway construction is requested by many airports to meet aviation operational needs. Projects in this category are generally programmed based on specific airport user data supporting the need for additional runway and taxiway capacity.
Navigational Aids and Electrical Navigational aids (navaids) and electrical systems (lighting systems) enhance the utility of airports. Airports request navaids and electrical improvements to increase the accessibility of the airport. This category encompasses new navaids and electrical improvements that are not directly associated with another improvement. For example, new taxiway lighting for an existing taxiway has been classified as navigational aids and electrical improvement, whereas new taxiway lighting in conjunction with construction of a new taxiway is considered part of the overall runway and taxiway capacity project.
Terminal Area Facilities The type of terminal area facilities needed at an airport varies by the types of users, either airline passengers and/or general aviation passengers. Airports with commercial service need terminal facilities to support airline operations including aircraft loading and unloading, passenger check-in, baggage claim, passenger waiting areas, food service, restrooms, passenger drop-off and pick-up, auto parking, and airport management office space and support facilities.
Airports supporting general aviation operations need aircraft parking, passenger waiting areas, pilot waiting and preflight briefing areas, food service/vending, restrooms, auto parking, and airport management or business office space and support facilities. Typical projects in this category include terminal/administration
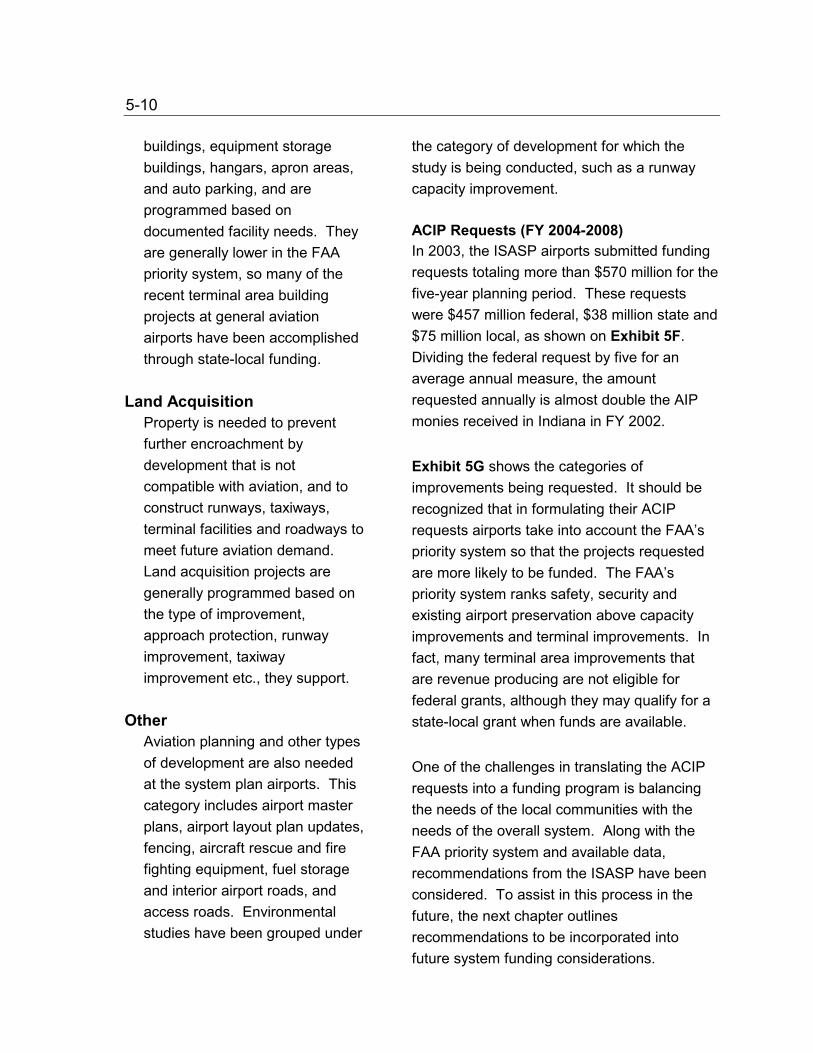
5-10 buildings, equipment storage buildings, hangars, apron areas, and auto parking, and are programmed based on documented facility needs. They are generally lower in the FAA priority system, so many of the recent terminal area building projects at general aviation airports have been accomplished through state-local funding.
Land Acquisition Property is needed to prevent further encroachment by development that is not compatible with aviation, and to construct runways, taxiways, terminal facilities and roadways to meet future aviation demand. Land acquisition projects are generally programmed based on the type of improvement, approach protection, runway improvement, taxiway improvement etc., they support.
Other Aviation planning and other types of development are also needed at the system plan airports. This category includes airport master plans, airport layout plan updates, fencing, aircraft rescue and fire fighting equipment, fuel storage and interior airport roads, and access roads. Environmental studies have been grouped under
the category of development for which the study is being conducted, such as a runway capacity improvement.
ACIP Requests (FY 2004-2008) In 2003, the ISASP airports submitted funding requests totaling more than $570 million for the five-year planning period. These requests were $457 million federal, $38 million state and $75 million local, as shown on Exhibit 5F. Dividing the federal request by five for an average annual measure, the amount requested annually is almost double the AIP monies received in Indiana in FY 2002.
Exhibit 5G shows the categories of improvements being requested. It should be recognized that in formulating their ACIP requests airports take into account the FAA’s priority system so that the projects requested are more likely to be funded. The FAA’s priority system ranks safety, security and existing airport preservation above capacity improvements and terminal improvements. In fact, many terminal area improvements that are revenue producing are not eligible for federal grants, although they may qualify for a state-local grant when funds are available.
One of the challenges in translating the ACIP requests into a funding program is balancing the needs of the local communities with the needs of the overall system. Along with the FAA priority system and available data, recommendations from the ISASP have been considered. To assist in this process in the future, the next chapter outlines recommendations to be incorporated into future system funding considerations.
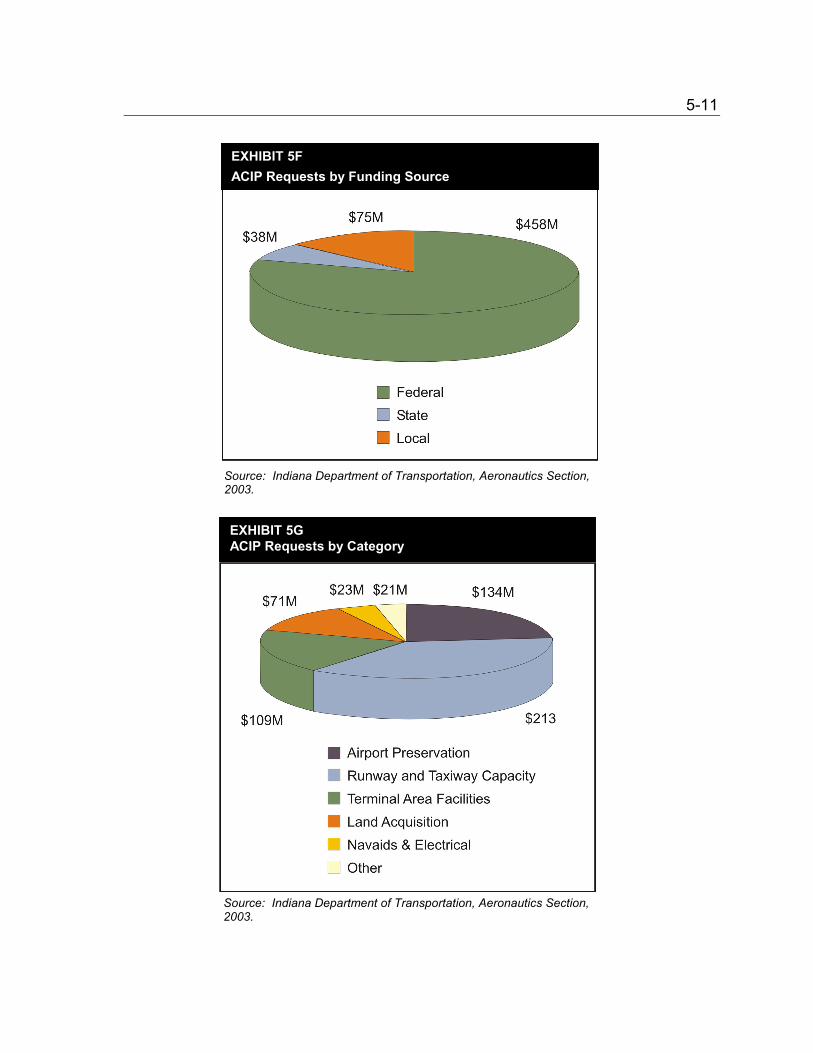
5-11
EXHIBIT 5F ACIP Requests by Funding Source
Source: Indiana Department of Transportation, Aeronautics Section, 2003.
EXHIBIT 5G ACIP Requests by Category
Source: Indiana Department of Transportation, Aeronautics Section, 2003.

Implementation Plan CHAPTER 6
Introduction
The Indiana State Aviation System is one of the State’s infrastructure tools that supports its residents and businesses, and fosters new economic development. Continual maintenance and adaptation to new technology assures the utility of this aviation tool. But the aviation tool is more than just a group of 69 airports with 100 paved runways; it is all aspects of the aviation journey from doorstep to destination.
To address the challenge of enhancing Indiana’s aviation system, this Indiana State Aviation System Plan (ISASP) update conducted a careful study of the existing system to answer the following questions:
�� System Inventory - What is the ISASP and who is using it?
�� Aviation Forecasts - What will be the use of the ISASP facilities in the future?
�� Airport Capacity - Do the ISASP facilities have the capacity to accommodate changes in Indiana’s public use airports in or outside the ISASP?
�� Market Analysis - What do the users think of the system?
�� Airport Funding - How do you pay for the aviation system?
The majority of the ISASP airports are also part of the National Plan of Integrated Airport Systems (NPIAS). The FAA Report to Congress, National Plan of Integrated Airport Systems (2001-2005), August 28, 2002, outlines nine guiding principals for the national airport system, which was envisioned almost 60 years ago, when civilian aviation was in its infancy, and has been developed and nurtured by close cooperation among Federal state and local agencies. To meet the demand for air transportation:
�� Airports should be safe, efficient, located at optimum sites and developed and maintained to appropriate standards.
�� Airports should be affordable to both users and Government, relying primarily on user fees and placing minimal burden on the general revenues of local, state and Federal government.
�� Airports should be flexible and expandable, able to meet increased demand and to accommodate new aircraft types.
�� Airports should be permanent, with assurance that they will remain open for aeronautical use over the long-term.
�� Airports should be compatible with surrounding communities, maintaining a balance between the needs of aviation and the requirements of residents of neighboring areas.
6-2 �� Airports should be developed
in concert with improvements to the air traffic control system.
�� The airport system should support national objectives for defense, emergency readiness, and postal delivery.
�� The airport system should be extensive, providing as many people as possible with convenient assess to air transportation, typically not more than 20-mile travel to the nearest NPIAS airport.
�� The airport system should help air transportation contribute to a productive national economy and international competitiveness.
Reflecting the guiding principals of the national airport system, and based on the Indiana-specific information from this study process, this chapter identifies the goals for the ISASP, provides the rationale for the recommendations and identifies actions for implementing the recommendations.
Ground Access The first step in the aviation journey is access to the airport. One of the lowest rated categories in the pilot survey was
roadway signage. Ground access congestion and planning for multi-modal access were identified as concerns in the large airports’ forum held by the Indiana Department of Commerce. Additionally, the aviation forecasts identify a continued growth trend in the use of Indiana’s airports, increasing the demand on the ground access system.
Recommendation:
Continue close coordination among the various divisions of the Indiana Department of Transportation to foster the development of highway access to airports within the State Airport System Plan and to facilitate planning for future mass transit access where appropriate.
Actions �� Develop minimum standards on airport
signage and seek adoption into the Indiana Manual of Uniform Traffic Control – An airport should be as easy to find from the ground as it is from the air. However, roadway signage was one of the lowest rated aspects of the aviation system. While roadway improvements may require a significant lead-time, improved signage can be implemented fairly quickly. An improved recognition that all airports, whether or not they accommodate passenger service, are important to Indiana. The size of the airport’s market area may provide the basis of development of minimum standards on airport signage that could be adopted into the Indiana Manual of Uniform Traffic Control to allow implementation statewide.
6-3 �� Consider the impact of the
development of I-69 on State System Plan Airports – The proposed I-69 offers potential benefits and challenges to Indiana’s airports. The planning for I-69 needs to recognize the location of existing aviation facilities to avoid encroachment on the airports, and to optimize opportunities for enhancing ground access.
�� Continue work toward limiting
roadway development in Runway Protection Zones – The runway protection zones are clear areas beyond the runway ends to enhance the safety of persons and property on the ground. Limiting and reducing roadway development within these areas increases the margin of safety of the aviation system.
Airport Facilities Airports are a very effective business tool for many companies. As newer, faster and more efficient business aircraft are developed, Indiana’s airports need to keep pace to provide access to our communities. The business user survey identified that business jets are the most common business aircraft, and that runway length was one of the
largest areas of concern. To support regular usage by small and medium business jets, at least 5,000 feet of runway length is needed. The Indiana Department of Commerce has the goal providing access to business class aircraft throughout the state.
Recommendation:
As a business tool, continue to develop Indiana’s airports to support corporate class activity by achieving at least 5,000 feet of runway length where feasible and user needs support.
Maximize the utility of all ISASP runways, including these less than 5,000 feet.
Actions �� Provide runways to support corporate class
aircraft, with adequate length to enhance runway safety and utility – While at least 4,000 feet or runway length was the goal in the 1995 ISASP, the evolution of business aircraft now makes at least 5,000 feet the more appropriate length to regularly serve the common corporate class aircraft. Thus, at least 5,000 feet of runway length should be provided where surrounding constraints allow and user needs support.
�� Where the runway length already meets the local community’s needs or is constrained, it is still critical to improve the runway through grooving and/or strengthening of pavements and providing adequate clear areas. Each ISASP airport serves an important role in the system and the runway environment should be maximized within the constraints. As the general aviation business aircraft have
6-4
grown larger, they have also become heavier. Runway pavements serving business jet aircraft should be able to support up to 30,000 pounds single wheel or 45,000 pounds dual wheel load. Grooving the runway pavement provides better operating conditions in wet weather. Even runways shorter than 5,000 feet that support business jet aircraft can have their utility enhanced through grooving. Appropriate clear areas further enhance the safety and utility of the runway environment.
�� Provide parallel taxiway
system with adequate separation to maximize margins of safety – A parallel taxiway system increases the margin of safety at an airport by eliminating the need for aircraft to backtaxi on the runway. It also improves the capacity of an airport by keeping movements to and from the terminal area off the runway so that it is available for arriving and departing aircraft. FAA Advisory Circular 150/5300-13, Airport Design, identifies a parallel taxiway as required for all new instrument approaches with less than
1-mile visibility, typically a precision approach, and recommended for all other instrument approaches. A parallel taxiway should be located at least 300 feet from the runway centerline (and preferably 400 feet) in order to allow for the installation of instrument approaches with lower minimums.
Funding
To maintain and enhance Indiana’s aviation system takes money, and there are more requests that dollars. While the majority of airport funding comes via the Federal Airport Improvement Program, State funding for aviation development is also essential. Every five State dollars invested in the AIP program leverages an additional $95 in Federal and local investment. Every State dollar invested in the State-Local program leverages an additional dollar.
Recommendation:
Seek annual legislative support for funding of aviation development.
Actions �� Encourage airport sponsors to maintain
ongoing communication with legislators to emphasize the need for aviation funding – Support for aviation funding starts by educating the State and Federal representatives about the importance of aviation. The best source of this education comes from airport sponsors within the district. Based on the State Report Cards from both the pilot and business surveys, funding support for both the AIP program and the State-Local program is needed,
6-5
since many of the lowest rated items, such as hangar facilities, are only eligible for funding assistance through the State-Local program.
�� Educate airport sponsors on other sources of airport funding and encourage their solicitation to enhance State and Federal funding mechanisms – Some airport sponsors in Indiana have been successful in seeking funding sources outside the traditional AIP and State-Local program. INDOT and aviation trade groups can assist airports seeking funding to consult with those that have been successful in securing less traditional aviation funding.
Airspace Access Navigational Aids: Instrument approaches with lower minimums to improve access to airports in poor weather conditions was also identified in the business user survey as an area in need of improvement. Installation of improved instrument approaches requires action from both the airport and the FAA. The airport needs to be able to provide the necessary clear areas to support the improved approach and the FAA needs to establish the approach. When Global
Positioning System (GPS) approaches were first being established there was a clear process via the Indiana Department of Transportation to request an approach. In more recent years, this process has been less well defined and needs to be updated.
Recommendation:
Establish a process for requesting the installation of new/improved instrument approach procedures with the goal of providing a precision approach to all corporate class and larger airports (5,000+ foot runways) and at least a nonprecision approach to all other airports.
Actions
�� Work in cooperation with the FAA to identify a clear process for requesting a new/improved instrument approaches – Many airports are striving to increase the utility of their airside facilities through improved instrument approaches. INDOT, in cooperation with the FAA, should identify the most appropriate process for these airports to make a formal request to the FAA for the new approach that would allow it to be processed efficiently.
�� Where feasible, establish precision approaches to support corporate class activity – This ISASP update has grouped airports with at least 5,000 feet of runway under the heading of corporate class or large airports since their runway length can readily support business jet activity. Business operating aircraft need all-weather access. A precision approach provides
6-6
both horizontal and vertical guidance to the runway end, as well as the lowest minimums. All large airports are already served by at least one precision approach. At all corporate class airports where clear areas allow and a precision approach is not already in place, the airport should have as a goal the installation of a precision approach to best accommodate its business users.
�� Where clear areas pose a challenge to a precision approach and at all other general aviation airports, establish the best approach possible using GPS or other available technology – The appropriate goal should be to establish the best, most user-friendly approach possible using GPS or other available technology. Evolving technology may one day allow approach procedures with vertical guidance even where a precision approach is not feasible, but with higher minimums than a precision approach due to surrounding obstructions.
�� Provide approaches with higher minimums as necessary to provide access by more demanding aircraft – Where an airport may occasionally support operations by aircraft larger than its design aircraft, seek approach procedures for these aircraft with the recognition that they may be required to have higher minimums until the airport fully meets the design standards for the more demanding aircraft.
Air Service: A number of Indiana’s airports can or do support passenger and cargo service. Since deregulation of the airline industry in 1978, change is a constant occurrence and airports work hard to keep and improve the service for their communities.
Recommendation:
Foster an environment at Indiana’s airports that continues to encourage the support and establishment of passenger and air cargo service to serve the needs of citizens and businesses throughout the state.
Actions �� Utilize resources from the Indiana
Department of Commerce (IDOC) to assist communities in pursuing passenger and air cargo activity – The IDOC maintains data that could be useful for airports in working with their existing air service providers and in seeking new service. Fostering the relationship between the airport and the regional IDOC office will allow airports to be more knowledgeable of potential resources to assist their community.
6-7 �� Maximize the economic
benefits of Indiana’s aviation system through continued coordination with the IDOC – Airports of all sizes can benefit from a relationship with the regional IDOC office. Educating each other about the benefits of the airport and the region provides opportunities for cross marketing.
Airport Vicinity Land Use What goes on just outside the airport fence has a large impact on what can occur on the airport. Efforts to extend runways and minimize obstructions on the airport can be negated by incompatible land use around the airport and obstructions in the surrounding airspace. Indiana has a Tall Structures Act in Indiana Code (IC) 8-21-10 to help protect public use airports, but the best protection comes from the local level.
Recommendation:
Strengthen the Indiana Tall Structures Act and strongly encourage the enactment of local airspace overlay zoning and land use compatibility zoning for all State System Plan/Public Use Airports
Actions �� Provide airports a sample airspace overlay
zoning ordinance and land use compatibility recommendations that can be used by airports to seek enactment of local zoning. FAA Advisory Circular 150/5190-4A, A Model Zoning Ordinance to Limit Height of Objects Around Airports, provides a sample airspace overlay zoning ordinance and FAR Part 150 Airport Noise Compatibility Planning, Table 1 identifies the compatibility of various types of land use.
�� Develop a strong program to educate the public and local officials on the long-term benefits of protecting compatible land use in the vicinity of airports – Education is the first step in protecting the investment in Indiana’s airports. The more informed the public and local officials are regarding the economic value of the airport and the long-term plans for the airport, the easier it is to have them be part of the team to protect the airport.
�� Encourage airports to establish open communication with local zoning officials – Even with airport-favorable zoning in place, the airport needs to maintain an open line of communication with local zoning officials so that when new development near the airport is being considered the zoning officials consult with the airport. This assures that, as personnel changes in the zoning office, the education and communication process continues.
6-8
Summary The State Aviation System is one of the State’s assets in pursuing continued economic development to support its residents and businesses. Pilots and businesses using the airports rated them well, although there is room for improvement. Recommendations in this implementation plan provide some guidance for the INDOT Aeronautics Section in weighing local needs versus system needs,
as funding priorities are determined. Many of the recommendations will be challenging to implement and require action on the part of airport sponsors and local communities, but “do-nothing” is not a viable option. Some of the recommendations, particularly the facility recommendations, will require funding to implement. Other recommendations involve assisting airports by their tapping the resources available in the leadership at other ISASP airports and through coordination with the IDOC. While these recommendations are challenging, they are worth pursuing to allow Indiana’s airport to continue flying forward.
Bibliography 2002 State Profile of Indiana, State and County Projections to 2025, Woods & Poole Economics, January 2002. 2003 Harris Directory of Indiana Manufacturing, Harris InfoSource, 2003. Airport Capacity and Delay, Federal Aviation Administration Advisory Circular, 150/5060-5, Federal Aviation Administration, September 23, 1983. Airport Facility Directory East Central U.S., Federal Aviation Administration, October 3, 2002. Airport Improvement Grant Awards, Fiscal Year 1996, 1997, 1998, 1999, 2000, 2001, 2002, Federal Aviation Administration, http://www2.faa.gov/arp/financial/aip/history.cfm?ARPnav=aip. Airport Financial Assistance, Overview of the Airport Improvement Program, Federal Aviation Administration, http://www1.faa.gov/arp/financial/aip/overview.cfm?ARPnav=aip. Aviation Association of Indiana (AAI) Economic Impact Summary Report, Aviation Association of Indiana, October 2002. Aviation Summary Report, Indiana Department of Transportation (INDOT) Aeronautics Section, September 2002. Evansville Regional Airport Master Plan Update, HNTB with Edmund Hafer and Eckrose/Green Associates, September 1992. Federal Aviation Administration (FAA) Aerospace Forecasts Fiscal Years 2002-2013, Federal Aviation Administration, March 2002. Federal Aviation Administration Airman Directory, Aerodata, Inc., August 2002 Federal Aviation Administration Great Lakes Division Annual Report Fiscal Year 2002, Federal Aviation Administration Great Lakes Division. Federal Aviation Administration (FAA) Report to Congress National Plan of Integrated Airport Systems (NPIAS) (2001-2005) including Appendix A and B, Federal Aviation Administration, August 28, 2002. Field Formulation of the National Plan of Integrated Airport Systems (NPIAS), FAA Order 5090.3C, Federal Aviation Administration, December 4, 2000. Fiscal Year 2002 Airports by State and Type, Federal Aviation Administration Great Lakes Region.
Forecasts of Indiana Based Aircraft for Indiana System Plan Update, Dr. John R. Ottensmann, November 18, 2002. Forecasts of Operations per Based Aircraft, Dr. John R. Ottensmann, March 31, 2003. Fort Wayne International Airport Master Plan Update, Woolpert LLP, The Airport Technology and Planning Group, Inc., Montgomery Consulting Group, Inc., September 2000. Fourteenth Annual Report of Accomplishments Under the Airport Improvement Program, Fiscal Year 1995, State Block Grant Program, Federal Aviation Administration, http://www1.faa.gov/arp/app500/annrep95/contents/sbgp.htm. Gary/Chicago Airport Master Plan Update, HNTB, November 2001. Grissom Aeroplex: On the Winds of Change Comes Opportunity, Grissom Redevelopment Authority, http://www.grissom-aeroplex.com/welcome.htm Indiana Aeronautical Chart, Indiana Department of Transportation, 2003. Indiana Aviation/Economic Development Partnership 2003, Indiana Economic Development Council and Indiana Department of Commerce, prepared by Aerofinity, Inc. Indiana Public Use Airports, Indiana Department of Transportation (INDOT) Aeronautics Section Website, http://www.in.gov/dot/modetrans/airports/aerials.html. Indiana State Aviation System Plan, Indiana Department of Transportation, Aeronautics Section, 1995. Indiana State Aviation System Plan, Indiana Department of Transportation, Aeronautics Section, 1996. Indiana State Aviation System Plan, Indiana Department of Transportation, Aeronautics Section, 1998. Indianapolis International Airport Airline Traffic Forecasts, Leigh Fisher Associates, October 2002. Indianapolis International Airport Noise Exposure Map Update Draft, Landrum & Brown, June 2003. Individual Airport Based Aircraft Forecasts for Indiana System Plan Update, Dr. John R. Ottensmann, January 15, 2003. Northwest Mountain Regional Airport Plan, FAA Northwest Mountain Region, 2003, http://www1.faa.gov/arp/anm/publications/rap. Notes on Extreme Trend Forecasts, Dr. John R. Ottensmann, April 1, 2003.
Passenger Facility Charge (PFC), Federal Aviation Administration, http://www1.faa.gov/arp/ace/pfc.htm. Passenger Facility Charge (PFC) Approved Locations, Federal Aviation Administration, August 31, 2003, http://www.2.faa.gov/arp/financial/pfc/reports/airports.pdf. Primary Airports Based on 2001 Passenger Enplanements, 2001 Enplanement and All-Cargo Reports, Federal Aviation Administration, Calendar Year 2001 ACAIS, December 11, 2002, http://www1.faa.gov/arp/planning/stats/2001/prim01.pdf. Programming Control and Report Procedures Grant-In-Aid Program, FAA Order 5100.20C, Federal Aviation Administration, December 7, 1999, http://www1.faa.gov/arp/publications/orders/510020c.pdf. Purdue University Airport Master Plan Update, R.W. Armstrong, February 2001. Re-evaluation of Grissom Air Reserve Base 1995 Feasibility Study for Grissom Redevelopment Authority, Aerofinity, R.W. Armstrong, and Black & Veatch Corp., October 2001. South Bend Regional Airport Master Plan Update, R.W. Armstrong, 2000. U.S. Census Quick Facts, State Population and Land Area, http://quickfacts.cencus.gov/qfd U.S. Contract Tower Association Newsletter, March-April 2003, U.S. Contract Tower Association, March 2003.