indian society d - download ncert text books and...
TRANSCRIPT


Indian Society
10
emography is the systematic study of population. The term is of Greekorigin and is composed of the two words, demos (people) and graphein (describe),implying the description of people. Demography studies the trends and processesassociated with population including – changes in population size; patterns ofbirths, deaths, and migration; and the structure and composition of thepopulation, such as the relative proportions of women, men and different agegroups. There are different varieties of demography, including formaldemography which is a largely quantitative field, and social demography whichfocuses on the social, economic or political aspects of populations. Alldemographic studies are based on processes of counting or enumeration – suchas the census or the survey – which involve the systematic collection of data onthe people residing within a specified territory.
Demography is a field that is of special importance to sociology – in fact, theemergence of sociology and its successful establishment as an academicdiscipline owed a lot to demography. Two different processes happened to takeplace at roughly the same time in Europe during the latter half of the eighteenthcentury – the formation of nation-states as the principal form of politicalorganisation, and the beginnings of the modern science of statistics. The modernstate had begun to expand its role and functions. It had, for instance, begun totake an active interest in the development of early forms of public healthmanagement, policing and maintenance of law and order, economic policiesrelating to agriculture and industry, taxation and revenue generation and thegovernance of cities.
This new and constantly expanding sphere of state activity required thesystematic and regular collection of social statistics – or quantitative data onvarious aspects of the population and economy. The practice of the collectionof social statistics by the state is in itself much older, but it acquired its modernform towards the end of the eighteenth century. The American census of 1790was probably the first modern census, and the practice was soon taken up inEurope as well in the early 1800s. In India, censuses began to be conducted bythe British Indian government between 1867-72, and regular ten yearly (ordecennial) censuses have been conducted since 1881. Independent Indiacontinued the practice, and six decennial censuses have been conducted since1951, the most recent being in 2001. The Indian census is the largest suchexercise in the world (since China, which has a slightly larger population, doesnot conduct regular censuses).
Demographic data are important for the planning and implementation ofstate policies, specially those for economic development and general publicwelfare. But when they first emerged, social statistics also provided a strongjustification for the new discipline of sociology. Aggregate statistics – or thenumerical characteristics that refer to a large collectivity consisting of millionsof people – offer a concrete and strong argument for the existence of socialphenomena. Even though country-level or state-level statistics like the number
D

The Demographic Structure of the Indian Society
1111
Indian Society
12
of deaths per 1,000 population – or the death rate – are made up by aggregating(or adding up) individual deaths, the death rate itself is a social phenomenonand must be explained at the social level. Emile Durkheim’s famous studyexplaining the variation in suicide rates across different countries was a goodexample of this. Durkheim argued that the rate of suicide (i.e., number of suicidesper 100,000 population) had to be explained by social causes even though eachparticular instance of suicide may have involved reasons specific to thatindividual or her/his circumstances.
Sometimes a distinction is made between formal demography and a broaderfield of population studies. Formal demography is primarily concerned with themeasurement and analysis of the components of population change. Its focusis on quantitative analysis for which it has a highly developed mathematicalmethodology suitable for forecasting population growth and changes in thecomposition of population. Population studies or social demography, on theother hand, enquires into the wider causes and consequences of populationstructures and change. Social demographers believe that social processes andstructures regulate demographic processes; like sociologists, they seek to tracethe social reasons that account for population trends.
2.1 SOME THEORIES AND CONCEPTS IN DEMOGRAPHY
THE MALTHUSIAN THEORY OF POPULATION GROWTH
Among the most famous theories of demography is the one associated with theEnglish political economist Thomas Robert Malthus (1766-1834). Malthus’stheory of population growth – outlined in his Essay on Population (1798) – wasa rather pessimistic one. He argued that human populations tend to grow at amuch faster rate than the rate at which the means of human subsistence(specially food, but also clothing and other agriculture-based products) cangrow. Therefore humanity is condemned to live in poverty forever because thegrowth of agricultural production will always be overtaken by population growth.While population rises in geometric progression (i.e., like 2, 4, 8, 16, 32 etc.),agricultural production can only grow in arithmetic progression (i.e., like 2,4, 6, 8, 10 etc.). Because population growth always outstrips growth inproduction of subsistence resources, the only way to increase prosperity is bycontrolling the growth of population. Unfortunately, humanity has only a limitedability to voluntarily reduce the growth of its population (through ‘preventivechecks’ such as postponing marriage or practicing sexual abstinence or celibacy).Malthus believed therefore that ‘positive checks’ to population growth – in theform of famines and diseases – were inevitable because they were nature’s wayof dealing with the imbalance between food supply and increasing population.
Malthus’s theory was influential for a long time. But it was also challengedby theorists who claimed that economic growth could outstrip population growth.
12

The Demographic Structure of the Indian Society
13
However, the most effective refutation of his theory wasprovided by the historical experience of European countries.The pattern of population growth began to change in thelatter half of nineteenth century, and by the end of the firstquarter of the twentieth century these changes were quitedramatic. Birth rates had declined, and outbreaks ofepidemic diseases were being controlled. Malthus’spredictions were proved false because both food productionand standards of living continued to rise despite the rapidgrowth of population.
Malthus was also criticised by liberal and Marxistscholars for asserting that poverty was caused by population growth. Thecritics argued that problems like poverty and starvation were caused by theunequal distribution of economic resources rather than by population growth.An unjust social system allowed a wealthy and privileged minority to live inluxury while the vast majority of the people were forced to live in poverty.
THE THEORY OF DEMOGRAPHIC TRANSITION
Another significant theory in demography is the theory of demographic transition.This suggests that population growth is linked to overall levels of economicdevelopment and that every society follows a typical pattern of development-related population growth. There are three basic phases of population growth.The first stage is that of low population growth in a society that is underdevelopedand technologically backward. Growth rates are low because both the deathrate and the birth rate are very high, so that the difference between the two (orthe net growth rate) is low. The third (and last) stage is also one of low growthin a developed society where both death rate and birth rate have been reduced
BOX 2.1“The power of population is so superior tothe power of the earth to producesubsistence for man, that premature deathmust in some shape or other visit the human race.The vices of mankind are active and able ministers ofdepopulation. They are the precursors in the greatarmy of destruction, and often finish the dreadful workthemselves. But should they fail in this war ofextermination, sickly seasons, epidemics, pestilence,and plague advance in terrific array, and sweep offtheir thousands and tens of thousands. Should successbe still incomplete, gigantic inevitable famine stalksin the rear, and with one mighty blow levels thepopulation with the food of the world.”
– Thomas Robert Malthus, An essay on theprinciple of population, 1798.
Malthus studied at Cambridgeand trained to become aChristian priest. Later he wasappointed Professor of Historyand Political Economy at theEast India Company Collegeat Haileybury near London,which was a training centrefor the officers recruited to theIndian Civil Service.
Thomas Robert Malthus(1766-1834)

Indian Society
14
considerably and the difference between them is again small.Between these two stages is a transitional stage of movementfrom a backward to an advanced stage, and this stage ischaracterised by very high rates of growth of population.
This ‘population explosion’ happens because death ratesare brought down relatively quickly through advancedmethods of disease control, public health, and betternutrition. However, it takes longer for society to adjust tochange and alter its reproductive behaviour (which wasevolved during the period of poverty and high death rates)to suit the new situation of relative prosperity and longerlife spans. This kind of transition was effected in WesternEurope during the late nineteenth and early twentiethcentury. More or less similar patterns are followed in theless developed countries that are struggling to reduce thebirth rate in keeping with the falling mortality rate. In Indiatoo, the demographic transition is not yet complete as themortality rate has been reduced but the birth rate has notbeen brought down to the same extent.
COMMON CONCEPTS AND INDICATORS
Most demographic concepts are expressed as rates orratios – they involve two numbers. One of these numbers isthe particular statistic that has been calculated for a specific
geographical-administrative unit; the other number provides a standard forcomparison. For example, the birth rate is the total number of live births in aparticular area (an entire country, a state, a district or other territorial unit)during a specified period (usually a year) divided by the total population of thatarea in thousands. In other words, the birth rate is the number of live birthsper 1000 population. The death rate is a similar statistic, expressed as thenumber of deaths in a given area during a given time per 1000 population.These statistics depend on the reporting of births and deaths by the families inwhich they occur. In fact, in most countries including India, people are requiredby law to report births and deaths to the appropriate authorities – the localpolice station or primary health centre in the case of villages, and the relevantmunicipal office in the case of towns and cities.
The rate of natural increase or the growth rate of population refers to thedifference between the birth rate and the death rate. When this difference iszero (or, in practice, very small) then we say that the population has ‘stabilised’,or has reached the ‘replacement level’, which is the rate of growth required fornew generations to replace the older ones that are dying out. Sometimes,societies can experience a negative growth rate – that is, their fertility levels arebelow the replacement rate. This is true of many countries and regions in theworld today, such as Japan, Russia, Italy and Eastern Europe. On the other
ACTIVITY 2.1
Read the section on theprevious page and thequotation from Malthus inBox 2.1. One reason whyMalthus was proved wrongis the substantial increasesin the productivity ofagriculture. Can you findout how these productivityincreases occurred – i.e.,what were the factors thatmade agriculture moreproductive? What couldbe some of the otherreasons why Malthus waswrong? Discuss with yourclassmates and make a listwith the help of yourteacher.

The Demographic Structure of the Indian Society
15
hand, some societies experience very high growth rates, particularly when theyare going through the demographic transition described on the previous page.
The fertility rate refers to the number of live births per1000 women in the child-bearing age group, usually taken tobe 15 to 49 years. But like the other rates discussed on theprevious page (the birth and death rates) this is a ‘crude’ rate– it is a rough average for an entire population and does nottake account of the differences across age-groups. Differencesacross age groups can sometimes be very significant inaffecting the meaning of indicators. That is why demographersalso calculate age-specific rates. The total fertility rate refersto the total number of live births that a hypothetical womanwould have if she lived through the reproductive age groupand had the average number of babies in each segment ofthis age group as determined by the age-specific fertility ratesfor that area. Another way of expressing this is that the totalfertility rate is the ‘the average number of births to a cohort ofwomen up to the end of the reproductive age period (estimatedon the basis of the age-specific rates observed during a givenperiod)’ (Visaria and Visaria 2003).
The infant mortality rate is the number of deaths of babies before the age ofone year per 1000 live births. Likewise, the maternal mortality rate is the numberof women who die in childbirth per 1000 live births. High rates of infant andmaternal mortality are an unambiguous indicator of backwardness and poverty;development is accompanied by sharp falls in these rates as medical facilities andlevels of education, awareness and prosperity increase. One concept which issomewhat complicated is that of life expectancy. This refers to the estimatednumber of years that an average person is expected to survive. It is calculated onthe basis of data on age-specific death rates in a given area over a period of time.
The sex ratio refers to the number of females per 1000 males in a given areaat a specified time period. Historically, all over the world it has been found thatthere are slightly more females than males in most countries. This is despitethe fact that slightly more male babies are born than female ones; nature seemsto produce roughly 943 to 952 female babies for every 1000 males. If despitethis fact the sex ratio is somewhat in favour of females, this seems to be due totwo reasons. First, girl babies appear to have an advantage over boy babies interms of resistance to disease in infancy. At the other end of the life cycle,women have tended to outlive men in most societies, so that there are moreolder women than men. The combination of these two factors leads to a sexratio of roughly 1050 females per 1000 males in most contexts. However, it hasbeen found that the sex ratio has been declining in some countries like China,South Korea and specially India. This phenomenon has been linked to prevailingsocial norms that tend to value males much more than females, which leads to‘son preference’ and the relative neglect of girl babies.
Try to find out why the birthrate is slow to decline butthe death rate can fallrelatively fast. What aresome of the factors thatmight influence a family orcouple’s decision abouthow many children tohave? Ask older people inyour family or neighbour-hood about the possiblereasons why people in thepast tended to have manymore children.
ACTIVITY 2.2

Indian Society
16
The age structure of the population refers to the proportion of persons indifferent age groups relative to the total population. The age structure changesin response to changes in levels of development and the average life expectancy.Initially, poor medical facilities, prevalence of disease and other factors makefor a relatively short life span. Moreover, high infant and maternal mortalityrates also have an impact on the age structure. With development, quality oflife improves and with it the life expectancy also improves. This changes theage structure: relatively smaller proportions of the population are found in theyounger age groups and larger proportions in the older age groups. This is alsorefered to as the aging of the population.
The dependency ratio is a measure comparing the portion of a populationwhich is composed of dependents (i.e., elderly people who are too old to work,and children who are too young to work) with the portion that is in the workingage group, generally defined as 15 to 64 years. The dependency ratio is equal tothe population below 15 or above 64, divided by population in the 15-64 agegroup; the ratio is usually expressed as a percentage. A rising dependency ratiois a cause for worry in countries that are facing an aging population, since itbecomes difficult for a relatively smaller proportion of working-age people tocarry the burden of providing for a relatively larger proportion of dependents. Onthe other hand, a falling dependency ratio can be a source of economic growthand prosperity due to the larger proportion of workers relative to non-workers.This is sometimes refered to as the ‘demographic dividend’, or benefit flowingfrom the changing age structure. However, this benefit is temporary because thelarger pool of working age people will eventually turn into non-working old people.
2.2 SIZE AND GROWTH OF INDIA’S POPULATION
India is the second most populous country in the world after China, with a totalpopulation of 103 crores (or 1.03 billion) according to the Census of 2001. Ascan be seen from Table 1, the growth rate of India’s population has not alwaysbeen very high. Between 1901-1951 the average annual growth rate did notexceed 1.33%, a modest rate of growth. In fact between 1911 and 1921 therewas a negative rate of growth of – 0.03%. This was because of the influenzaepidemic during 1918 -19 which killed about 12.5 million persons or 5% of thetotal population of the country (Visaria and Visaria 2003: 191). The growthrate of population substantially increased after independence from British rulegoing up to 2.2% during 1961-1981. Since then although the annual growthrate has decreased it remains one of the highest in the developing world.Chart 1 shows the comparative movement of the crude birth and death rates.The impact of the demographic transition phase is clearly seen in the graphwhere they begin to diverge from each other after the decade of 1921 to 1931.
Before 1931, both death rates and birth rates are high, whereas, after thistransitional moment the death rates fall sharply but the birth rate only falls slightly.

The Demographic Structure of the Indian Society
17
CHART 1: BIRTH AND DEATH RATE IN INDIA 1901-2001
Source: National Commission on Population, Government of India.website: http://populationcommission.nic.in/facts1.htm#
TABLE 1: THE POPULATION OF INDIA AND ITS GROWTH DURING THE 20TH CENTURY
Year Total Population Average Annual Decadal (in millions) Growth Rate (%) Growth Rate (%)
1901 238 – -
1911 252 0.56 5.8
1921 251 -0.03 -0.3
1931 279 1.04 11.0
1941 319 1.33 14.2
1951 361 1.25 13.3
1961 439 1.96 21.5
1971 548 2.22 24.8
1981 683 2.20 24.7
1991 846 2.14 23.9
2001 1028 1.93 21.3
Source: Registrar General of India, compiled from various webpages of the Census of India.See References for details.

Indian Society
18
The principal reasons for the decline in the death rate after 1921 wereincreased levels of control over famines and epidemic diseases. The latter causewas perhaps the most important. The major epidemic diseases in the past werefevers of various sorts, plague, smallpox and cholera. But the single biggestepidemic was the influenza epidemic of 1918-19, which killed as many as 125lakh people, or about 5% of the total population of India at that time. (Estimatesof deaths vary, and some are much higher. Also known as ‘Spanish Flu’, theinfluenza pandemic was a global phenomenon – see the box below. A pandemicis an epidemic that affects a very wide geographical area – see the glossary).
BOX 2.2The Global Influenza Pandemic of 1918-19Influenza is caused by a virus that attacks mainly the upper respiratorytract – the nose, throat and bronchi and rarely also the lungs. Thegenetic makeup of influenza viruses allows for both major and minor geneticchanges, making them immune to existing vaccines. Three times in the lastcentury, the influenza viruses have undergone major genetic changes,resulting in global pandemics and large tolls in terms of both disease anddeaths. The most infamous pandemic was “Spanish Flu” which affected largeparts of the world population and is thought to have killed at least 40 millionpeople in 1918-1919. More recently, two other influenza pandemics occurredin 1957 (“Asian influenza”) and 1968 (“Hong Kong influenza”) and causedsignificant morbidity and mortality globally.The global mortality rate from the 1918/1919 Spanish flu pandemic is not known,but is estimated at 2.5 – 5% of the human population, with 20% of the worldpopulation suffering from the disease to some extent. Influenza may havekilled as many as 25 million in its first 25 weeks; in contrast, AIDS killed 25 millionin its first 25 years. Influenza spread across the world, killing more than 25 millionin six months; some estimates put the total killed at over twice that number,possibly even 100 million.In the United States, about 28% of the population suffered, and 500,000 to675,000 died. In Britain 200,000 died; in France more than 400,000. Entire villagesperished in Alaska and southern Africa. In Australia an estimated 10,000 peopledied and in the Fiji Islands, 14% of the population died during only two weeks,and in Western Samoa 22%. An estimated 17 million died in India, about 5% ofIndia’s population at the time. In the British Indian Army, almost 22% of troopswho caught the disease died of it.While World War 1 did not cause the flu, the close quarters and mass movementof troops quickened its spread. It has been speculated that the soldiers’immune systems were weakened by the stresses of combat and chemicalattacks, increasing their susceptibility to the disease.
Source: Compiled from Wikipedia, and World Health Organisation; Webpages:http://en.wikipedia.org/wiki/Spanish_fluhttp://www.who.int/mediacentre/factsheets/fs211/en/
18

The Demographic Structure of the Indian Society
19
Improvements in medical cures for these diseases, programmes for massvaccination, and efforts to improve sanitation helped to control epidemics.However, diseases like malaria, tuberculosis and diarrhoea and dysenteryscontinue to kill people even today, although the numbers are nowhere as highas they used to be in the epidemics of the past. Surat witnessed a small epidemicof plague in September 1994, while dengue and chikungunya epidemics havebeen reported in various parts of the country in 2006.
Famines were also a major and recurring source of increased mortality.Famines were caused by high levels of continuing poverty and malnutrition inan agroclimatic environment that was very vulnerable to variations in rainfall.Lack of adequate means of transportation and communication as well asinadequate efforts on the part of the state were some of the factors responsiblefor famines. However, as scholars like Amartya Sen and others have shown,famines were not necessarily due to fall in foodgrains production; they werealso caused by a ‘failure of entitlements’, or the inability of people to buy orotherwise obtain food. Substantial improvements in the productivity of Indianagriculture (specially through the expansion of irrigation); improved means ofcommunication; and more vigorous relief and preventive measures by the statehave all helped to drastically reduce deaths from famine. Nevertheless, starvationdeaths are still reported from some backward regions of the country. TheNational Rural Employment Guarantee Act is the latest state initiative to tacklethe problem of hunger and starvation in rural areas.
Unlike the death rate, the birth rate has not registered a sharp fall. This isbecause the birth rate is a socio-cultural phenomenon that is relatively slow tochange. By and large, increased levels of prosperity exert a strong downwardpull on the birthrate. Once infant mortality rates decline, and there is an overallincrease in levels of education and awareness, family size begins to fall. Thereare very wide variations in the fertility rates across the states of India, as can beseen in Chart 2. Some states like Kerala and Tamil Nadu have managed tobring down their total fertility rates (TFR) to 2.1 and 1.8 respectively. Thismeans that the average woman in Tamil Nadu produces only 2.1 children,which is the ‘replacement level’ (required to replace herself and her spouse).Kerala’s TFR is actually below the replacement level, which means that thepopulation is going to decline in the future. Many other states (like HimachalPradesh, West Bengal, Karnataka, Maharashtra) have fairly low TFRs. Butthere are some states, notably Bihar, Madhya Pradesh, Rajasthan and UttarPradesh, which still have very high TFRs of 4 or more. These few states alreadyaccounted for almost 45% of the total population as of 2001, and they will alsoaccount for about half (50%) of the additions to the Indian population upto theyear 2026. Uttar Pradesh alone is expected to account for a little less than one-quarter (22%) of this increase. Chart 3 shows the relative contribution topopulation growth from different regional groupings of states.

Indian Society
20
CHART 2: STATE-WISE BIRTH RATES IN INDIA, 2004
20
Source: Sample Registration System 2004

The Demographic Structure of the Indian Society
21
CHART 3: REGIONAL SHARES OF PROJECTED POPULATION
GROWTH UPTO 2026
Source: Computed from 2001 Census figures and the Report of the Technical Groupon Population Projections of the National Commission on Population, 2006.
Andhra Pradesh, Tamil Nadu, Kerala, Karnataka (13%)
West Bengal, Orissa, Jharkhand (11%)
Punjab, Haryana, Delhi (9%)
Madhya Pradesh, Rajasthan, Chattisgarh (16%)
Uttar Pradesh, Bihar (30%) Maharashtra, Gujarat (15%)
Remaining States (6%)
Maharashtra, Gujarat (15%)
Indian Society
22
2.3 AGE STRUCTURE OF THE INDIAN POPULATION
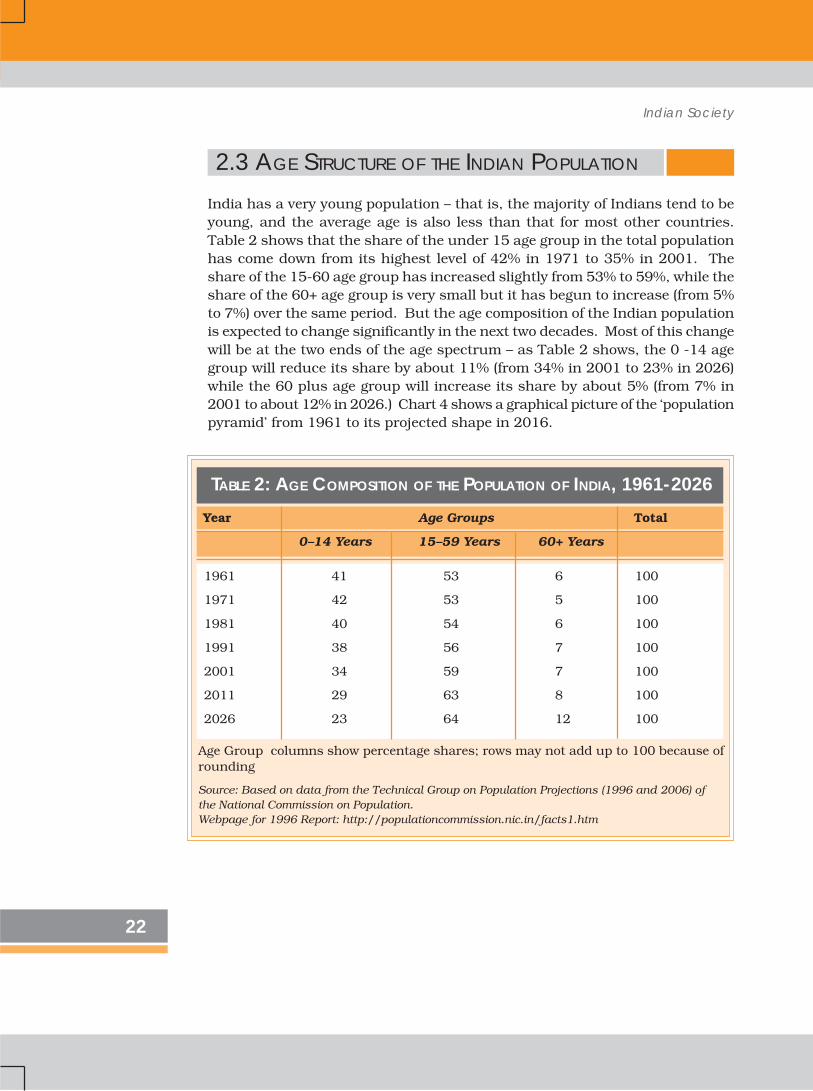
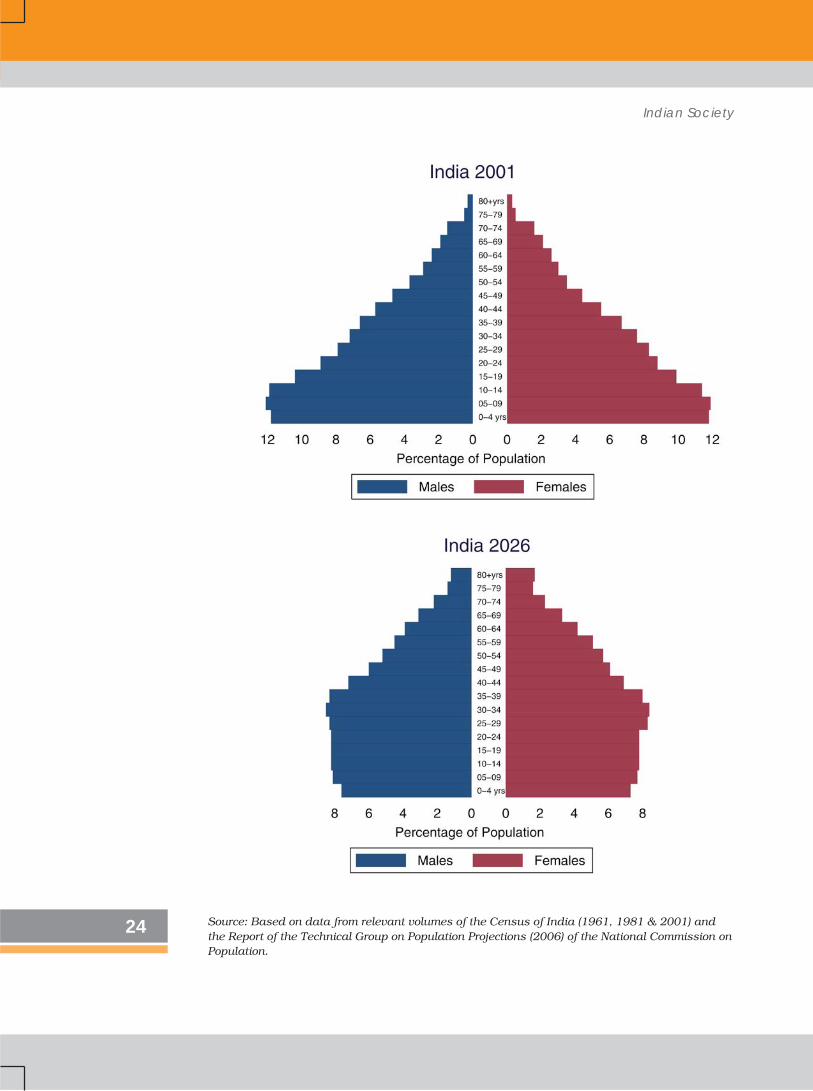
India has a very young population – that is, the majority of Indians tend to beyoung, and the average age is also less than that for most other countries.Table 2 shows that the share of the under 15 age group in the total populationhas come down from its highest level of 42% in 1971 to 35% in 2001. Theshare of the 15-60 age group has increased slightly from 53% to 59%, while theshare of the 60+ age group is very small but it has begun to increase (from 5%to 7%) over the same period. But the age composition of the Indian populationis expected to change significantly in the next two decades. Most of this changewill be at the two ends of the age spectrum – as Table 2 shows, the 0 -14 agegroup will reduce its share by about 11% (from 34% in 2001 to 23% in 2026)while the 60 plus age group will increase its share by about 5% (from 7% in2001 to about 12% in 2026.) Chart 4 shows a graphical picture of the ‘populationpyramid’ from 1961 to its projected shape in 2016.
1961 41 53 6 100
1971 42 53 5 100
1981 40 54 6 100
1991 38 56 7 100
2001 34 59 7 100
2011 29 63 8 100
2026 23 64 12 100
Age Group columns show percentage shares; rows may not add up to 100 because ofrounding
Source: Based on data from the Technical Group on Population Projections (1996 and 2006) ofthe National Commission on Population.Webpage for 1996 Report: http://populationcommission.nic.in/facts1.htm
TABLE 2: AGE COMPOSITION OF THE POPULATION OF INDIA, 1961-2026Year Age Groups Total
0–14 Years 15–59 Years 60+ Years

The Demographic Structure of the Indian Society
23
CHART 4: AGE GROUP PYRAMIDS, 1961, 1981, 2001 AND 2026
Indian Society
24 Source: Based on data from relevant volumes of the Census of India (1961, 1981 & 2001) andthe Report of the Technical Group on Population Projections (2006) of the National Commission onPopulation.

The Demographic Structure of the Indian Society
25
As with fertility rates, there are wide regional variations in the age structureas well. While a state like Kerala is beginning to acquire an age structure likethat of the developed countries, Uttar Pradesh presents a very different picturewith high proportions in the younger age groups and relatively low proportionsamong the aged. India as a whole is somewhere in the middle, because itincludes states like Uttar Pradesh as well as states that are more like Kerala.Chart 5 shows the estimated population pyramids for Uttar Pradesh and Keralain the year 2026. Note the difference in the location of the widest parts of thepyramid for Kerala and Uttar Pradesh.
EXERCISE FOR CHART 4The Age Group ‘pyramid’ shown in Chart 4 provides a much moredetailed version of the kind of age grouped data presented in Table 2.Here, data are shown separately for males (on the left side) and females(on the right side) with the relevant five-year age group in the middle.Looking at the horizontal bars (including both males and females in aparticular age group) gives you a visual sense of the age structure ofthe population. The age groups begin from the 0-4 years group at thebottom of the pyramid and go on to the 80 years and above age groupat the top. There are four different pyramids for the decennial censusyears of 1961, 1981, 2001 and the estimates for 2026. The pyramid for2026 shows the estimated future size of the relevant age groups basedon data on the past rates of growth of each age group. Such estimatesare also called ‘projections’.These pyramids show you the effect of a gradual fall in the birth rateand rise in the life expectancy. As more and more people begin to liveto an older age, the top of the pyramid grows wider. As relatively fewernew births take place, the bottom of the pyramid grows narrower. Butthe birth rate is slow to fall, so the bottom doesn’t change muchbetween 1961 and 1981. The middle of the pyramid grows wider andwider as its share of the total population increases. This creates a ‘bulge’in the middle age groups that is clearly visible in the pyramid for 2026.This is what is refered to as the ‘demographic dividend’ which will bediscussed later in this chapter.Study this chart carefully. With the help of your teacher, try to tracewhat happens to the new-born generation of 1961 (the 0-4 age group)as it moves up the pyramid in succesive years.
Where will the 0-4 age group of 1961 be located in the pyramids forthe later years?Where – in which age group – is the widest part of the pyramid asyou move from 1961 to 2026?What do you think the shape of the pyramid might be in the year2051 and 3001?

Indian Society
26
CHART 5: AGE STRUCTURE PYRAMIDS,KERALA AND UTTAR PRADESH, 2026
Source: Report of the Technical Group on Population Projections (2006) of the NationalCommission on Population.

The Demographic Structure of the Indian Society
27
The bias towards younger age groups in the age structure is believed to bean advantage for India. Like the East Asian economies in the past decade andlike Ireland today, India is supposed to be benefitting from a ‘demographicdividend’. This dividend arises from the fact that the current generation ofworking-age people is a relatively large one, and it has only a relatively smallpreceding generation of old people to support. But there is nothing automaticabout this advantage – it needs to be consciously exploited through appropriatepolicies as is explained in Box 2.3 below.
Does the changing age structure offer a ‘demographicdividend’ for India?The demographic advantage or ‘dividend’ to be derived from the age structureof the population is due to the fact that India is (and will remain for some time)one of the youngest countries in the world. A third of India’s population wasbelow 15 years of age in 2000. In 2020, the average Indian will be only 29 yearsold, compared with an average age of 37 in China and the United States, 45 inWestern Europe, and 48 in Japan. This implies a large and growing labour force,which can deliver unexpected benefits in terms of growth and prosperity.The ‘demographic dividend’ results from an increase in the proportion of workersrelative to non-workers in the population. In terms of age, the working populationis roughly that between 15 and 64 years of age. This working age group mustsupport itself as well as those outside this age group (i.e., children and elderlypeople) who are unable to work and are therefore dependents. Changes in theage structure due to the demographic transition lower the ‘dependency ratio’,or the ratio of non-working age to working-age population, thus creating thepotential for generating growth.But this potential can be converted into actual growth only if the rise in the workingage group is accompanied by increasing levels of education and employment.If the new entrants to the labour force are not educated then their productivityremains low. If they remain unemployed, then they are unable to earn at all andbecome dependents rather than earners. Thus, changing age structure by itselfcannot guarantee any benefits unless it is properly utilised through planneddevelopment. The real problem is in defining the dependency ratio as the ratioof the non-working age to working-age population, rather than the ratio of non-workers to workers. The difference between the two is determined by the extentof unemployment and underemployment, which keep a part of the labour forceout of productive work. This difference explains why some countries are able toexploit the demographic advantage while others are not.India is indeed facing a window of opportunity created by the demographicdividend. The effect of demographic trends on the dependency ratio defined interms of age groups is quite visible. The total dependency ratio fell from 79 in 1970to 64 in 2005. But the process is likely to extend well into this century with theage-based dependency ratio projected to fall to 48 in 2025 because of continuedfall in the propotion of children and then rise to 50 by 2050 because of an increasein the proportion of the aged.
BOX 2.3

Indian Society
28
2.4 THE DECLINING SEX-RATIO IN INDIA
The sex ratio is an important indicator of gender balance in the population. Asmentioned in the section on concepts earlier, historically, the sex ratio has beenslightly in favour of females, that is, the number of females per 1000 males hasgenerally been somewhat higher than 1000. However, India has had a decliningsex-ratio for more than a century, as is clear from Table 3. From 972 females per1000 males at the turn of the twentieth century, the sex ratio has declined to 933at the turn of the twenty-first century. The trends of the last four decades havebeen particularly worrying – from 941 in 1961 the sex ratio had fallen to an all-time low of 927 in 1991 before posting a modest increase in 2001.
But what has really alarmed demographers, policy makers, social activistsand concerned citizens is the drastic fall in the child sex ratio. Age specific sexratios began to be computed in 1961. As is shown in Table 3, the sex ratio forthe 0 - 6 years age group (known as the juvenile or child sex ratio) has generallybeen substantially higher than the overall sex ratio for all age groups, but it hasbeen falling very sharply. In fact the decade 1991-2001 represents an anomalyin that the overall sex ratio has posted its highest ever increase of 6 points fromthe all time low of 927 to 933, but the child sex ratio has dropped from 945 to927, a plunge of 18 points taking it below the overall sex ratio for the first time.
The problem, however, is employment. Data from theNational Sample Survey studies of 1999-2000 and from the2001 Census of India reveal a sharp fall in the rate ofemployment generation (creation of new jobs) across bothrural and urban areas. This is true for the young as well. Therate of growth of employment in the 15-30 age group, whichstood at around 2.4 per cent a year between 1987 and1994 for both rural and urban men, fell to 0.7 for rural menand 0.3 per cent for urban men during 1994 to 2004. Thissuggests that the advantage offered by a young labourforce is not being exploited.Strategies exist to exploit the demographic window ofopportunity that India has today. But India’s recentexperience suggests that market forces by themselves donot ensure that such strategies would be implemented.Unless a way forward is found, we may miss out on thepotential benefits that the country’s changing agestructure temporarily offers.
[Source: Adapted from an article by C.P. Chandrasekhar in FrontlineVolume 23 - Issue 01, January 14-27, 2006]
What impact do you thinkthe age structure hason inter - generationalrelationships? For instance,could a high dependencyratio create conditions forgreater tension betweenolder and youngergenerations? Or would itmake for closerrelationships and strongerbonds between youngand old? Discuss this inclass and try to come upwith a list of possibleoutcomes and the reasonswhy they happen.
ACTIVITY 2.3

The Demographic Structure of the Indian Society
29
Note: The sex-ratio is defined as the number of females per 1000 males
The state-level child sex ratios offer even greater cause for worry. As manyas six states and union territories have a child sex ratio of under 900 femalesper 1000 males. Punjab is the worst off with an incredibly low child sex ratioof 793 (the only state below 800), followed by Haryana, Chandigarh, Delhi,Gujarat and Himachal Pradesh. As Chart 6 shows, Uttaranchal, Rajasthan,Uttar Pradesh and Maharashtra are all under 925, while Madhya Pradesh,Goa, Jammu and Kashmir, Bihar, Tamil Nadu, Karnataka and Orissa are abovethe national average of 927 but below the 950 mark. Even Kerala, the statewith the best overall sex ratio does not do too well at 963, while the highestchild sex ratio of 986 is found in Sikkim.
Demographers and sociologists have offered several reasons for the decline inthe sex ratio in India. The main health factor that affects women differently frommen is childbearing. It is relevant to ask if the fall in the sex ratio may be partlydue to the increased risk of death in childbirth that only women face. However,maternal mortality is supposed to decline with development, as levels of nutrition,general education and awareness as well as the availability of medical andcommunication facilities improves. Indeed, maternal mortality rates have beencoming down in India even though they remain high by international standards.So it is difficult to see how maternal mortality could have been responsible for theworsening of the sex ratio over time. Combined with the fact that the decline inthe child sex ratios has been much steeper than the overall figure, social scientistsbelieve that the cause has to be sought in the differential treatment of girl babies.
TABLE 3: THE DECLINING SEX-RATIO IN INDIA, 1901-2001Year Sex-ratio Variation over Child Sex-ratio Variation over
(all age groups) previous decade (0–6 years) previous decade
1901 972 – – –
1911 964 –8 – –
1921 955 –9 – –
1931 950 –5 – –
1941 945 –5 – –
1951 946 +1 – –
1961 941 –5 976 –
1971 930 –11 964 –12
1981 934 +4 962 –2
1991 927 –7 945 –17
2001 933 +6 927 –18
Source: Census of India. Note: Data on age specific sex ratios is not available before 1961.

Indian Society
30
CHART 6: MAP OF CHILD SEX RATIOS ACROSS STATES
30

The Demographic Structure of the Indian Society
31
Several factors may be held responsible for the decline in the child sex ratioincluding – severe neglect of girl babies in infancy, leading to higher deathrates; sex specific abortions that prevent girl babies from being born; and femaleinfanticide (or the killing of girl babies due to religious or cultural beliefs). Eachof these reasons point to a serious social problem, and there is some evidencethat all of these have been at work in India. Practices of female infanticide havebeen known to exist in many regions, while increasing importance is beingattached to modern medical techniques by which the sex of the baby can bedetermined in the very early stages of pregnancy. The availability of the sonogram(an x-ray like diagnostic device based on ultra-sound technology), originallydeveloped to identify genetic or other disorders in the foetus, may be used toidentify and selectively abort female foetuses.
The regional pattern of low child sex ratiosseems to support this argument. It is strikingthat the lowest child sex ratios are found inthe most prosperous regions of India.Punjab, Haryana, Chandigarh, Delhi, Gujaratand Maharashtra are among the richeststates of India in terms of per capita incomes,and they are also the states with the lowestchild sex ratios. So the problem of selectiveabortions is not due to poverty or ignoranceor lack of resources. For example, if practiceslike dowry mean that parents have to makelarge dowry payments to marry off theirdaughters, then prosperous parents wouldbe the ones most able to afford this. However,we find the sex ratio is lowest in the mostprosperous regions.
It is also possible (though this issue isstill being researched) that as economicallyprosperous families decide to have fewerchildren – often only one or two now – theymay also wish to choose the sex of theirchild. This becomes possible with theavailablity of ultra-sound technology,although the government has passed strictlaws banning this practice and imposingheavy fines and imprisonment as punishment. Known as the Pre-NatalDiagnostic Techniques (Regulation and Prevention of Misuse) Act, this law hasbeen in force since 1996, and has been further strengthened in 2003. However,in the long run the solution to problems like the bias against girl childrendepends more on how social attitudes evolve, even though laws and rules canalso help.

Indian Society
32
2.5 LITERACY
Literacy as a prerequisite to education is an instrument of empowerment. Themore literate the population the greater the consciousness of career options, aswell as participation in the knowledge economy. Further, literacy can lead tohealth awareness and fuller participation in the cultural and economic wellbeing of the community. Literacy levels have improved considerably afterindependence, and almost two-thirds of our population is now literate. Butimprovements in the literacy rate have to struggle to keep up with the rate ofgrowth of the Indian population, which is still quite high. Enormous effort isneeded to ensure the literacy of the new generations – which are only justbeginning to be smaller in numbers than in the past (remember the discussionon age structure and the population pyramids earlier in this chapter).
Literacy varies considerably across gender, across regions, and across socialgroups. As can be seen from Table 4, the literacy rate for women is almost 22%less than the literacy rate for men. However, female literacy has been risingfaster than male literacy, partly because it started from relatively low levels.Thus, female literacy rose by almost 15% between 1991 and 2001 compared tothe rise in male literacy of a little less than 12% in the same period. Literacyrates also vary by social group – historically disadvantaged communities likethe Scheduled Castes and Scheduled Tribes have lower rates of literacy, andrates of female literacy within these groups are even lower. Regional variationsare still very wide, with states like Kerala approaching universal literacy, whilestates like Bihar are lagging far behind. The inequalities in the literacy rate arespecially important because they tend to reproduce inequality across generations.Illiterate parents are at a severe disadvantage in ensuring that their childrenare well educated, thus perpetuating existing inequalities.
TABLE 4: LITERACY RATE IN INDIA
(Percentage of population 7 years of age and above)
Year Persons Males Females Male-Female gap in literacy rate
1951 18.3 27.2 8.9 18.3
1961 28.3 40.4 15.4 25.1
1971 34.5 46.0 22.0 24.0
1981 43.6 56.4 29.8 26.6
1991 52.2 64.1 39.3 24.8
2001 65.4 75.9 54.2 21.7
Source: Bose (2001: 22)
The Demographic Structure of the Indian Society
33
2.6 RURAL-URBAN DIFFERENCES
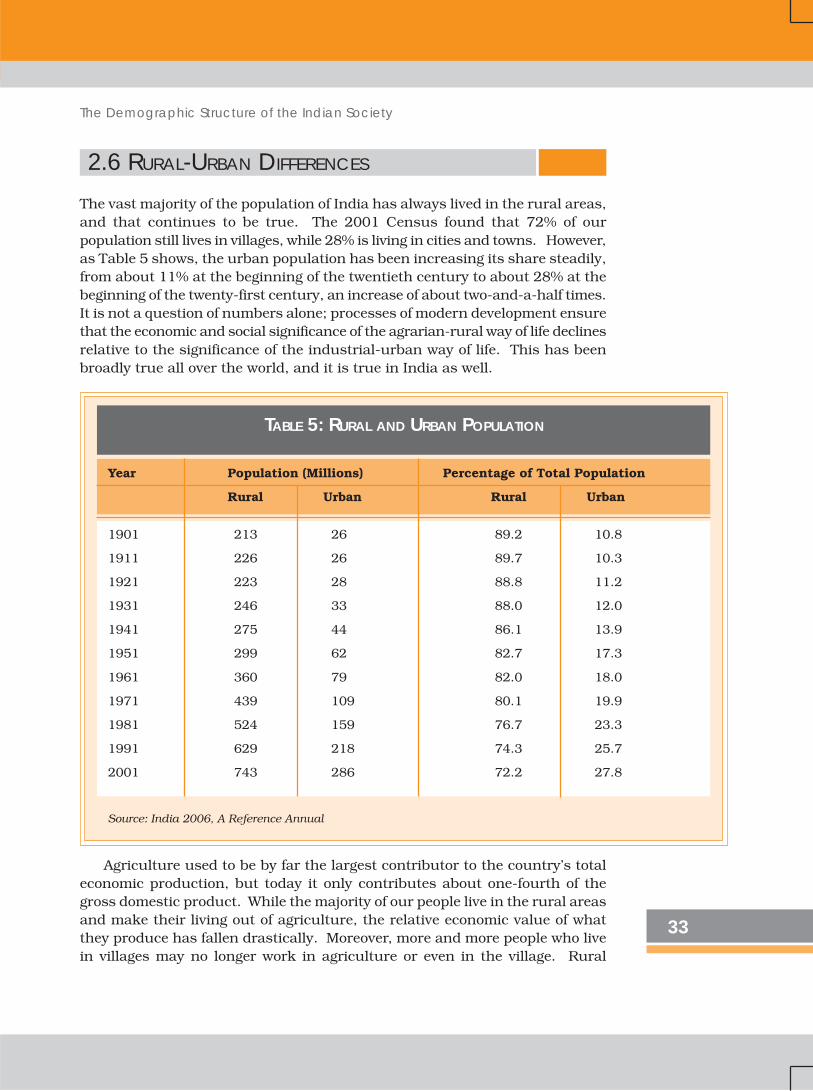
The vast majority of the population of India has always lived in the rural areas,and that continues to be true. The 2001 Census found that 72% of ourpopulation still lives in villages, while 28% is living in cities and towns. However,as Table 5 shows, the urban population has been increasing its share steadily,from about 11% at the beginning of the twentieth century to about 28% at thebeginning of the twenty-first century, an increase of about two-and-a-half times.It is not a question of numbers alone; processes of modern development ensurethat the economic and social significance of the agrarian-rural way of life declinesrelative to the significance of the industrial-urban way of life. This has beenbroadly true all over the world, and it is true in India as well.
Agriculture used to be by far the largest contributor to the country’s totaleconomic production, but today it only contributes about one-fourth of thegross domestic product. While the majority of our people live in the rural areasand make their living out of agriculture, the relative economic value of whatthey produce has fallen drastically. Moreover, more and more people who livein villages may no longer work in agriculture or even in the village. Rural
TABLE 5: RURAL AND URBAN POPULATION
Year Population (Millions) Percentage of Total Population
Rural Urban Rural Urban
1901 213 26 89.2 10.8
1911 226 26 89.7 10.3
1921 223 28 88.8 11.2
1931 246 33 88.0 12.0
1941 275 44 86.1 13.9
1951 299 62 82.7 17.3
1961 360 79 82.0 18.0
1971 439 109 80.1 19.9
1981 524 159 76.7 23.3
1991 629 218 74.3 25.7
2001 743 286 72.2 27.8
Source: India 2006, A Reference Annual
Indian Society
3434

The Demographic Structure of the Indian Society
35
people are increasingly engaged in non-farm ruraloccupations like transport services, business enterprises orcraft manufacturing. If they are close enough, then theymay travel daily to the nearest urban centre to work whilecontinuing to live in the village.
Mass media and communication channels are nowbringing images of urban life styles and patterns ofconsumption into the rural areas. Consequently, urbannorms and standards are becoming well known even in theremote villages, creating new desires and aspirations forconsumption. Mass transit and mass communication arebridging the gap between the rural and urban areas. Evenin the past, the rural areas were never really beyond thereach of market forces and today they are being more closelyintegrated into the consumer market. (The social role ofmarkets will be discussed in Chapter 4).
Considered from an urban point of view, the rapid growth in urbanisationshows that the town or city has been acting as a magnet for the rural population.Those who cannot find work (or sufficient work) in the rural areas go to the cityin search of work. This flow of rural-to-urban migration has also been acceleratedby the continuous decline of common property resources like ponds, forestsand grazing lands. These common resources enabled poor people to survive inthe villages although they owned little or no land. Now, these resources havebeen turned into private property, or they are exhausted. (Ponds may run dryor no longer provide enough fish; forests may have been cut down and havevanished…) If people no longer have access to these resources, but on theother hand have to buy many things in the market that they used to get free(like fuel, fodder or supplementary food items), then their hardship increases.This hardship is worsened by the fact that opportunities for earning cash incomeare limited in the villages.
Sometimes the city may also be preferred for social reasons, specially therelative anonymity it offers. The fact that urban life involves interaction withstrangers can be an advantage for different reasons. For the socially oppressedgroups like the Scheduled Castes and Scheduled Tribes, this may offer somepartial protection from the daily humiliation they may suffer in the village whereeveryone knows their caste identity. The anonymity of the city also allows thepoorer sections of the socially dominant rural groups to engage in low statuswork that they would not be able to do in the village. All these reasons makethe city an attractive destination for the villagers. The swelling cities beartestimony to this flow of population. This is evident from the rapid rate ofurbanisation in the post-Independence period.
While urbanisation has been occurring at a rapid pace, it is the biggestcities – the metropolises – that have been growing the fastest. These metros
Do a small survey inyour school to find outwhen (i.e., how manygenerations ago) thefamilies of your fellowstudents came to live in acity. Tabulate the resultsand discuss them in class.What does your survey tellyou about rural-urbanmigrations?
ACTIVITY 2.4

Indian Society
36
attract migrants from the rural areas as well as from small towns. There arenow 5,161 towns and cities in India, where 286 million people live. What isstriking, however, is that more than two-thirds of the urban population lives in27 big cities with million-plus populations. Clearly the larger cities in India aregrowing at such a rapid rate that the urban infrastructure can hardly keeppace. With the mass media’s primary focus on these cities, the public face ofIndia is becoming more and more urban rather than rural. Yet in terms of thepolitical power dynamics in the country, the rural areas remain a decisive force.
2.7 POPULATION POLICY IN INDIA
It will be clear from thediscussion in this chapter thatpopulation dynamics is animportant matter and that itcrucially affects thedevelopmental prospects of anation as well as the healthand well being of its people.This is particularly true ofdeveloping countries whohave to face special challengesin this regard. It is hardlysurprising therefore that Indiahas had an official populationpolicy for more than a halfcentury. In fact, India wasperhaps the first country toexplicitly announce such apolicy in 1952.
The population policy took the concrete form of the National Family PlanningProgramme. The broad objectives of this programme have remained the same –to try to influence the rate and pattern of population growth in socially desirabledirections. In the early days, the most important objective was to slow down therate of population growth through the promotion of various birth control methods,improve public health standards, and increase public awareness about populationand health issues. Over the past half-century or so, India has many significantachievements to her credit in the field of population, as summarised in Box 2.4.
The Family Planning Programme suffered a setback during the years of theNational Emergency (1975-76). Normal parliamentary and legal procedureswere suspended during this time and special laws and ordinances issued directlyby the government (without being passed by Parliament) were in force. Duringthis time the government tried to intensify the effort to bring down the growth

The Demographic Structure of the Indian Society
37
India’s Demographic AchievementHalf a century after formulating the national family welfare programme, India has:
reduced crude birth rate from 40.8 (1951) to 24.1 (2004, SRS);reduced the infant mortality rate from 146 per 1000 live births (1951) to 58 per 1000 live births(2004, SRS);quadrupled the couple protection rate from 10.4 percent (1971) to 44 percent (1999);reduced crude death rate from 25 (1951) to 7.5 (2004, SRS);added 25 years to life expectancy from 37 years to 62 years;achieved nearly universal awareness of the need for and methods of family planning, andhalved the total fertility rate from 6.0 (1951) to 3.0 (2004, SRS).
Source: National Commission on Population.
BOX 2.4
BOX 5
National Socio-Demographic Goals for 2010Address the unmet needs for basic reproductive and childhealth services, supplies and infrastructure.Make school education up to age 14 free and compulsory, and reducedrop outs at primary and secondary school levels to below 20 per cent forboth boys and girls.Reduce infant mortality rate to below 30 per 1000 live births.Reduce maternal mortality ratio to below 100 per 100,000 live births.Achieve universal immunisation of children against all vaccine preventablediseases.Promote delayed marriage for girls, not earlier than age 18 and preferablyafter 20 years of age.Achieve 80 percent institutional deliveries and 100 per cent deliveries bytrained persons.Achieve universal access to information/counselling, and services for fertilityregulation and contraception with a wide basket of choices.Achieve 100 per cent registration of births, deaths, marriage andpregnancy.Contain the spread of Acquired Immunodeficiency Syndrome (AIDS), andpromote greater integration between the management of reproductivetract infections (RTI) and sexually transmitted infections (STI) and the NationalAIDS Control Organisation.Prevent and control communicable diseases.Integrate Indian Systems of Medicine (ISM) in the provision of reproductiveand child health services, and in reaching out to households.Promote vigorously the small family norm to achieve replacement levels ofTFR.Bring about convergence in implementation of related social sectorprogrammes so that family welfare becomes a people centred programme.
Source: National Commission on Population.
BOX 2.5
Indian Society
38
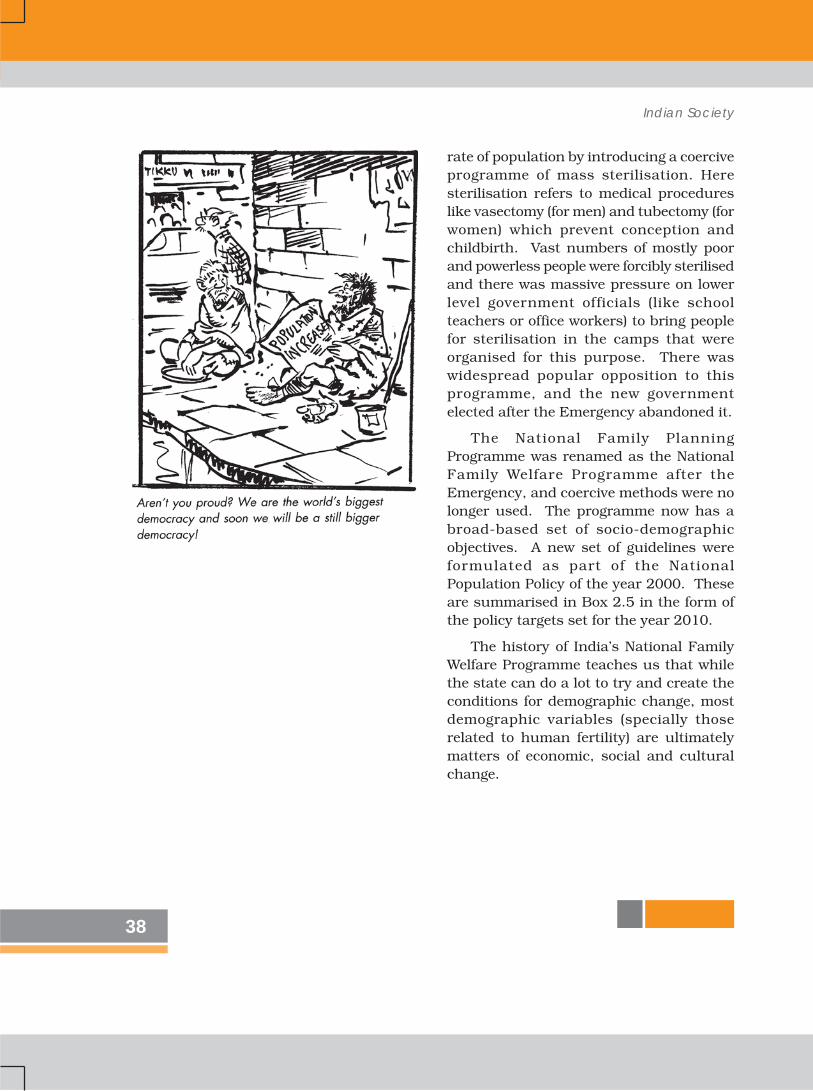
rate of population by introducing a coerciveprogramme of mass sterilisation. Heresterilisation refers to medical procedureslike vasectomy (for men) and tubectomy (forwomen) which prevent conception andchildbirth. Vast numbers of mostly poorand powerless people were forcibly sterilisedand there was massive pressure on lowerlevel government officials (like schoolteachers or office workers) to bring peoplefor sterilisation in the camps that wereorganised for this purpose. There waswidespread popular opposition to thisprogramme, and the new governmentelected after the Emergency abandoned it.
The National Family PlanningProgramme was renamed as the NationalFamily Welfare Programme after theEmergency, and coercive methods were nolonger used. The programme now has abroad-based set of socio-demographicobjectives. A new set of guidelines wereformulated as part of the NationalPopulation Policy of the year 2000. Theseare summarised in Box 2.5 in the form ofthe policy targets set for the year 2010.
The history of India’s National FamilyWelfare Programme teaches us that whilethe state can do a lot to try and create theconditions for demographic change, mostdemographic variables (specially thoserelated to human fertility) are ultimatelymatters of economic, social and culturalchange.

The Demographic Structure of the Indian Society
39
1. Explain the basic argument of the theory of demographic transition. Whyis the transition period associated with a ‘population explosion’?
2. Why did Malthus believe that catastrophic events like famines andepidemics that cause mass deaths were inevitable?
3. What is meant by ‘birth rate’ and ‘death rate’? Explain why the birth rateis relatively slow to fall while the death rate declines much faster.
4. Which states in India have reached or are very near the ‘replacementlevels’ of population growth? Which ones still have very high rates ofpopulation growth? In your opinion, what could be some of the reasonsfor these regional differences?
5. What is meant by the ‘age structure’ of the population? Why is it relevantfor economic development and growth?
6. What is meant by the ‘sex ratio’? What are some of the implications of adeclining sex ratio? Do you feel that parents still prefer to have sons ratherthan daughters? What, in your opinion, could be some of the reasons forthis preference?
Questions
REFERENCESBose, Ashish. 2001. Population of India, 2001 Census Results and Methodology. B.R.Publishing Corporation. Delhi.
Davis, Kingsley. 1951. The Population of India and Pakistan. Russel and Russel. NewYork.
India, 2006. A Reference Annual. Publications Division, Government of India. NewDelhi.
Kirk, Dudley. 1968. ‘The Field of Demography’ in Sills, David. ed. InternationalEncyclopedia of the Social Sciences. The Free Press and Macmillan. New York.
Visaria, Pravin and Leela Visaria. 2003. ‘India’s Population: Its Growth and KeyCharacteristics’, in Das, V. ed. The Oxford India Companion to Sociology and SocialAnthropology. Oxford University Press. Delhi
Websites
http://populationcommission.nic.in/facts1.htm
http://en.wikipedia.org/wiki/spanish_flu
http://www.who.int/mediacenter/factsheets/fs211/en/

Indian Society
40
Notes