indian microdata scoping study final report to the esrc
TRANSCRIPT

1
Indian Microdata Scoping Study Final Report to the ESRC
George Smith, Sony Pellissery, Sweta Rajan and Sylvie Dubuc
Department of Social Policy and Social Work Barnett House Wellington Square Oxford OX1 2ER January 2007

2
Contents
Section Abbreviations 3 Acknowledgements 5 Overall Summary 5 1. Introduction: Background to the Study 7 2. Methods 7 3. Shape of the report 8 4 Indian Data Organization 9 5 Key Data Sets by Data Type
5.1 Indian Censuses 10
5.2 Survey Data 11 5.3 Administrative Data 12
5.4 Boundary Data, Geocoding and Remote Sensing Data
13
6. Key Data Sets by Functional Area 6.1 Demographic data
15
6.2 Economic Data 16 6.3 Housing and Access to Services 20 6.4 Health and Family Welfare 21 6.5 Education 24 6.6 Infrastructure and Transport 26 6.7 Crime 27 6.8 Election Data 28 6.9 Consumption and Expenditure Data 28 6.10 Gender Statistics 29 7. Data Quality and Access
7.1 Quality 7.2 Access
30
8. Conclusions and Recommendations 33 References
3
Abbreviations AICTE All Indian Council for Technical Education AIDIS All India Debt and Investment Survey AIITS All India Income Tax Statistics AIU Association of Indian Universities ASI Annual Survey of India BCS British Crime Survey BoP Balance of Payment CAG Comptroller and Auditor General of India CBDT Central Board of Direct Taxes CMIE Centre for Monitoring the Indian Economy CSDS Centre for the Study of Developing Societies CPI Consumer Price Index CSO Central Statistical Organization DCRB District Crime Records Bureau DDP District Domestic Product DFID Department for International Development DG Director General DGET Directorate General of Energy and Trade DIR Direct Trade Return DISE District Information System for Education DLHS-RCH District Level Household Survey- Reproductive and Child Health
Survey DWCD Department of Women and Child Development EC Economic Census EC European Commission EPWF Economic Political Weekly Foundation ESRC Economic and Social Research Council (UK) FIR First Information Report GDP Gross Domestic Product GFCE Government Fiscal Consumption Expenditure GIS Geographical Information System GNP Gross National Product HII Health Information of India ICRISAT International Crops Research Institute for Semi-Arid Tropics IDBI International Development Bank of India IFCI Industrial Finance Corporation of India IHDR Indian Human Development Report IIP Index of Industrial Production IIPS Indian Institute of Population Sciences IPC Indian Penal Code ISS Indian Statistical System LIMS Living Standard Measurement Survey (WB) MDG Millennium Development Goals

4
MHFW Ministry of Health and Family Welfare MHRD Ministry of Human Development MICS Multiple Indicator Cluster Survey MoF Ministry of Finance MoL Ministry of Labour MoSPI Ministry of Statistics and Planning Implementation MoSW Ministry of Social Welfare MoU Memorandum of Understanding MoUA Ministry of Urban Affairs NABARD National Bank of Agriculture and Rural Development NACO National Aids Control Organization NAS National Account Statistics NAS National Aids Survey NCAER National Council of Applied Economic Research NCERT National Council of Educational Research and Training NCRB National Crime Records Bureau NCTE National Council of Tertiary Education NFHS National Family and Health Survey NIEPA National Institute of Educational Planning and Administration NIMS National Institute of Medical Statistics NIUA National Institute of Urban Affairs NNP Net National Product NSC National Statistics Commission NSS National Sample Survey NSSO National Sample Survey Organization ORG-MARG Popular economic-political poll survey PFCE Private Fiscal Consumption Expenditure PWD Public Works Department RBI Reserve Bank of India RCH-DLHS Reproductive and Child Health Survey - District Level Household
Survey RGI Registrar General of India RHS Rural Health Statistics RSP &PR Research and Statistics Wing of Directorate of Indirect Taxes SARC South Asian Association for Regional Co-operation SCRB State Crime Records Bureau SEBI Securities and Exchange Bank of India SFTIC Statistics of Foreign Trade in India by Countries SLL Special Local Laws SRS Sample Registration Survey SSIS Small Scale Industry Survey UGC University Grants Commission UNICEF United Nations International Children’s Education Fund UNIFEM United Nations Development Fund for Women WCA World Census of Agriculture

5
Acknowledgements We are very grateful to the large number of people who have responded to emails, telephone enquiries and face to face requests for information about Indian microdata and its uses, and particularly to those in India who agreed to meet with members of the team to discuss Indian microdata in their field and who gave us a large volume of material including some key datasets.. A list of those contacted in this way is included at Appendix 1.3 to this report. We are very grateful for their help, without which this study would not have been possible. This scoping study covers a very wide range of material across the social sciences and much detailed information about specific datasets and institutions in India. If there are any errors, omissions or updates, we would be most grateful for this information. Please email the lead author ([email protected]) or by post to George Smith, Department of Social Policy and Social Work, University of Oxford, Barnett House, 32 Wellington Square, Oxford, OX1 2ER, UK.
Indian Microdata Scoping Study
Overall Summary India has a long and distinguished history in the collection of social and economic statistics - the first full Indian national census took place in 1881 - and more recently in the conduct of very large scale social surveys on a systematic basis at national and state level. In recent years there has been a powerful move from the highest level in India to make this data and its analysis more easily available, including in microdata form wherever possible. Most of these microdata sets are single, cross-sectional surveys. Some are regularly repeated series. There are as yet relatively few panel studies in India. One characteristic of much of this major survey data and its analysis, pointed out by users both in India and in the UK, is that it has tended to be relatively conservative (that is unchanging in format, despite the context of India’s now rapidly growing economy) and despite the scale of this data and the relatively easy access, there has been relatively limited, more complex analyses of these datasets, though there are now several groups analysing the data in this way. There are also issues about the ease of using some of the national surveys, raised both by those inside the system and outside users, with the need to check back to the source e.g. on the labelling of variables, links to questionnaires etc. However there are many excellent surveys, which have been conducted to a very high standard, though the scale of the operation with sample sizes typically well into six figures, made it very difficult to assess directly the overall quality of the datasets in a short scoping study which ranged across a very wide range of data areas. India also has a growing volume of administrative data that forms the basis of many national and local statistics. These are most often typically put together in a ‘pyramid’ format (in a series of aggregations), and there are issues on the quality and accuracy of some of this information (for example significant variability in the recorded crime data both between states and possibly within states). However there are some key studies
6
underway in the administrative data field, to enhance the quality of this type of data, working to improve quality and accuracy from the local through to the national level (for example in education at school and district level). While there are some key central nodal points where particular sets of data are held in archived format (e.g. by the Computer Centre/NSSO, the Reserve Bank of India, NCERT/NIEPA for education, the NCAER for economic development data, CSDS Data Unit for national and state election results and survey data etc), there is as yet no overall social and economic data archive or central resource through which researchers can easily access the full range of Indian data. The feasibility of developing a national archive of this type to hold such massive datasets remains a live question among administrators and policy makers. Overall Indian microdata offers enormous potential for UK researchers, which a relatively small number appear to make use of to any extent at present. In general the official policy at Indian government level is to make this data available, sometimes for a relatively modest charge, though there may be some ‘gate-keeping’, in terms of checking purposes and use. There are some commercial sources (e.g. on financial and company data) that charge commercial rates to users and some non-governmental organisations that are (for good reason) more restrictive of their own specially collected datasets. But in general everybody contacted was exceptionally positive about the possibility of developing increased access by UK and other researchers; and virtually all documentation is already in English. There would therefore appear to be no inherent problems to access and use, though in this scoping study no attempt was made to negotiate access to particular datasets for UK wide use (e.g. via the ESRC Data Archive). However a number of datasets were accessed on a test basis and actual datasets were received for evaluation for two major surveys. A short list of recommended datasets in the key areas highlighted for this study is put forward as candidates for follow up enquiry by the ESRC.

7
Indian Microdata Scoping Study
1. Background to the Study A research team at the Department of Social Policy and Social Work was commissioned by the UK Economic and Social Research Council (ESRC) to conduct a brief ‘scoping study’ on Indian microdata in August, 2006. The team had previous experience of undertaking a similar study in Bangladesh on a scoping project on measuring the Millennium Development Goals (MDG) at a local level, and experience of working with Indian census and survey data of different types. The ESRC brief for the scoping study was to ‘establish the availability …of social and economic microdata resources for research purposes’ and to report ‘on the availability of statistical microdata (data pertaining to individuals or organisations for analysis at the level of individuals or organisations) which are not currently accessible to researchers from outside’. Additionally to this initial brief was added a requirement to report on macro level data that might be of particular interest to UK social researchers. While the brief was to extend across all major social and economic fields, priority was to be given to: demographic data, labour market data, education, health and crime data1. As our colleagues have done in their report on South African microdata, we have interpreted ‘accessibility’ pretty flexibly, as much Indian data may be accessible if you know where to look and whom to approach. However we have not attempted to put together a general ‘vade mecum’ or guide to Indian social and economic data, as there are whole swathes of possible data sources we have not been able to review (e.g. state or district level studies, or data collected in ad hoc research studies at local level).
2. Methods The method for the scoping study adopted had three phases:- Phase I: the aim was first to uncover what Indian microdata was actually already in use by the UK academic and social research community. Working through contacts, internet searches and scanning journals and research reports that have included the use of Indian microdata, generated some 40+ researchers from across the UK who had recently used such data.2 We also identified a number of Indian specialists, based in India and elsewhere, who also regularly use such data sets. We sent out about 60 email queries to these scholars seeking their advice and experience. About a third responded. Important datasets used by these scholars included NSS surveys, Census of India, NFHS and the ICRISAT longitudinal dataset. Some concerns were registered on problems of data accessibility and other possible datasets which were not easily available. Several of the respondents also expressed concern about data quality, and hence tended to rely on data collected through their own field visits rather than existing surveys.
1 In the final stages of the project the priorities were redefined as ‘health, ageing and retirement; fertility, population change and migration flows; child development and education; inequality; economic development, transport and globalisation’. While this marks a shift in emphasis, the overall coverage of the study includes all these areas. 2 A list of these researchers is attached at Appendix 1.2.

8
Phase II: two members of the research team undertook a series of brief visits to potential microdata sources and major data users in India.3 The plan for these visits in Delhi and Mumbai drew on information gathered in phase 1; meetings were held with national government departments and agencies, and with a small number of other groups including NGOs, commercial and academic groups. In addition visits were made in Mumbai, the capital of Maharashtra state. In total about 30 such meetings took place in the two areas. Person contacted typically included senior administrators (e.g. director generals and heads of research) and key academics who may have used such microdata sets, and ‘data users’ (e.g. in the Indian Planning Commission, central government ministries and independent agencies). The interviews focused on the key datasets in their field, the formats in which data were held, data quality and accessibility, and the ways such data were used. These visits generated a considerable volume of additional reports and other material (including actual datasets). They also provided some degree of cross-checking on issues of quality and accessibility e.g. from other government departments analysing national survey data. As a brief follow-up, further visits were conducted in Delhi and Chennai, by a third member of the team to pick up issues or areas that had not been fully covered or on issues that had come up in the first set of visits. On-going contact by email with people visited, proved very helpful in clarifying key issues. Phase III: in the final phase the interviews, documentary and other material were drawn on to generate the final report. This included follow-up contacts with some of those contacted during fieldwork to clarify issues that had emerged. We should underline that there are many areas that we have not been able to cover in this brief scoping study. These would include states other than Maharashtra, where there may well be important state level studies or developments. Where state level developments came up as exemplars in discussions nationally we refer to them in the text. We also made only limited contact with commercial research organizations, or with research centres other than those with a national focus. We cannot therefore be sure how far we have covered India overall and it would be more than arrogant to claim that we have. However we are more confident that we have picked up the major developments at an all-India level.
3. Shape of this report We begin with a brief background on the history and organisation of major Indian data collection. We then review the key datasets. As these potentially fall under different types of data (censuses, sample surveys, administrative data, geocoded (GIS) data and boundary data), different levels of data (microdata and macro data) and different functional data areas (e.g. health, education, etc), to avoid too much repetition in the main report we have focused on different types of data (Section 5 below) and then covered both
3 A detailed list of organisations/persons with whom interviews/discussions were held is attached as Appendix 1.3.

9
macro and microdata in Section 6 under the different functional areas. We then cover issues of access and quality before turning to our conclusions and recommendations.
4. Indian Data Organisation India has a federal structure, with three main tiers of administration. In addition to the central union government, there are 29 state governments and six union territories, and 603 local districts across India (See Appendix 1.4 for tabulated information these administrative tiers). Under the constitution, powers are devolved; thus, for example, education, health and social welfare are the responsibility of state governments, and data on these services is collected and held at state level, particularly where there are different programmes in a particular state. Much administrative data is aggregated at an even lower level, for example data on schools and welfare payments. In these cases the state level figures are themselves based on more local aggregations. Thus in Maharashtra welfare payment returns are made by each district to the state level in aggregate form, in a way that makes even gender disaggregation of this data set not possible at the state level. Such devolution is in line with the emphasis on local devolution and control over many social and other programmes. Also the technology for collecting, storing and transmitting individual level data (i.e. networked computing) is not consistently available at this local level. The foundation of the Indian data system was laid down during the British administration. Provincial governments were required to publish statistics on wide range of administrative matters in their annual reports. These provincial data systems were themselves based on the information provided by district offices. Based on these administrative data returns from the provincial governments, the first Statistical Abstract of British India was published in 1868. The first full national census of India took place in 1881 (with a partial census from 1867-1872). While this background is of historical interest, some of the long run medical and disease records are proving to be of value in assessing the long term effects of climate change on disease patterns, for example for malaria and cholera (see Bouma & van der Kaay, 1996. Bouma and Pascual, 2001). After independence, the emphasis on development planning to build a ‘modern India’ was heavily dependent on good national statistics. Thus the union cabinet’s central statistical unit formed in 1949 became the Central Statistical Organisation (CSO) by 1951. The National Sample Survey came into existence in 1950. These two agencies continue to be important data generators. The National Sample Survey Organisation (NSSO) was formed in 1970. A further development was the growth of data collection and survey work by many of the central and state government departments with particular functional responsibilities. This implied coordination to avoid duplication of effort.4 Data quality and access to these different levels varies significantly across these administrative structures. The National Statistical Commission (NSC), set up in 2000 and made permanent in 2005 is designed ‘to serve as a nodal and empowered body for all core statistical activities of the country, evolve, monitor and enforce statistical priorities and standards and to ensure statistical co-ordination among the different agencies involved.’ Its recommendations for reforms of national statistics across the Indian statistical system 4 Appendix 1.5 charts the systems and organizations for data collection, storage and dissemination in India.

10
in terms of data collection, organisation, methods and training, alone ran to 69 pages (NSC, 2001).
5. Key Datasets by Data Type
i) Indian Censuses
a) The Decennial Population census The most comprehensive source of information on Indian demography is the decennial population census conducted since 1871, with the first full census in 1881. The information is collected at household level; but the results are only published with the village as the lowest available unit for which data is available. The census is conducted by the Office of the Registrar General and Census Commissioner, India. 14 series have been completed so far. A full list of information collected at each decennial census is included at Appendix 3.1. Though very rich information is collected in the census, much of this is not made available to the public except at a fairly high level of aggregation. For example, most of the tables that relate to fertility are presented at state level only. In similar way, the data on religion, caste and language, cross-classified by literacy, work and workers’ categories and migration is not usually published. Thus, a large volume of socially relevant information is missing from census publications.
There are two further drawbacks to the Indian census. First, local enumeration is typically conducted by untrained enumerators (for example the local school teacher). And second, there are long delays in processing and publishing the data.5
While census data is intended to be 100% population wide, for the first time in 2001 a 1% sample of raw data (in aggregated form) was made available for the whole country and 5% sample for each state. See Appendix 3.2 for these datasets. While there have apparently been discussions about making available an anonymous sample of census records to social researchers along the lines of the UK’s Sample of Anonymised Records (SAR), as far as we are aware this is not currently in the pipeline.
b) Economic Census (see Appendix 3.3) The Economic Censuses carried out by the Ministry of Statistics and Programme Implementation is the most important data source on the number of enterprises and their employment details by the main sectors of the economy. The first Economic Survey was launched in 1977. It has been conducted periodically since then, the fourth census being that of 1998 and the fifth in 2005/6, with provisional results beginning to emerge in 2006. While the first EC covered only non agricultural enterprises employing at least one worker, the coverage has gradually been extended. The two most recent ECs cover both the agricultural and non agricultural sectors (but exclude ‘crop production and plantation’). The Economic Census provides information on the broad parameters, such 5 “The data on literacy for the age 15 years and above, which is the internationally accepted minimum age for data on literacy were available only after a gap of 4 to 5 years after the conduct of census in the past” (NSC, 2001: 9.2.8).
11
as the number of units, employment, type of activity, location, etc. However more detailed information is collected through the Follow-up Enterprise Surveys (FuS). The EC provides the sampling frame for these follow up surveys. The purpose of these follow up surveys is to collect detailed information about employment, fixed assets, working capital, receipts, expenditure, gross value added, etc from the enterprises. In the past the EC was linked to the decennial population census ‘house-listing’ enumeration, but more recently has been (employment) site based. The NSC report (2001) recommended that the EC should be again be linked to the population census, presumably to ensure more comprehensive coverage of economic activity that may be unregistered or may not use any premises for its operation. The NSC report (2001) also raised a number of questions about varying definitions used in the different economic surveys and therefore the difficulty of matching the findings of the EC, for example, with that of the Annual Survey of Industries, discussed below. c) Agricultural and Livestock Census Agricultural censuses in India have been carried out as a part of the World Census of Agriculture (WCA) every five years since 1970-71. This survey is based on a 20 per cent sample of households in each village. Along with the population census, an evaluation of the amenities and main land use is made for each census village (using village boundaries). The village directory provides information on the land use pattern for each village (area under forest, irrigated and un-irrigated land, cultivatable wasteland and areas not available for cultivation). Village directories: are updated only every 10 years and therefore may be unreliable. Since 1919-20 a quinquennial Livestock Census has been conducted with sixteen rounds completed so far. This census collects information on livestock numbers, poultry, agricultural machinery and fishing craft. This is conducted by the field staff of the State Animal Husbandry Department. Both these censuses publish information aggregated to district level.
ii) Survey Data a) The National Sample Survey Organisation (NSSO) is the major national survey organisation based in Kolkata, with senior staff also based in Delhi. It has a tiered structure with offices at national, state and district level. Its main product is the regular NSS survey of which there have been 60 ‘rounds’ since these national surveys began in 1950. It is worth underlining that the driving force behind the creation of the national survey system was to plug holes in the national information held to be needed for the central planning of economic growth. Thus the intention is to generate data and data series that fill these gaps (that might in other systems be filled by more routine administrative statistics). This feature may in part explain the relative lack of any very complex analyses, as these are not the prime purpose of NSS surveys. The ‘NSS is the largest repetitive survey operation in the world’ (NSC, 2001). The NSS is a nationally representative household sample with a sample size typically of several

12
hundred thousand households and several million data records at each round. Its running focus is on consumer expenditure but this is extended to cover a range of other major topics which may be repeated at varying intervals. Appendices 4.1 and 4.2 give more details of NSS surveys and a list of subjects covered in the different rounds. Microdata since the early 1980s can be obtained on CD (see pricelist at Appendix 4.2) - or freely for example where an (Indian) institution has signed a Memorandum of Agreement. Further details of specific NSS surveys are included in Section 6 (below) Criticisms of the NSS by the NSC (2001) included issues to do with the sampling methods used (not now reflecting up to date methods), continuing outmoded data labelling methods, its timeliness (delay in producing results) and failure to examine the reasons for major anomalies with estimates from other sources (see NSC 2001, Chapter 14 passim). b) Other Research Organisations Conducting Surveys While the NSSO dominates the national sample survey field, there are a number of research organisations conducting their own surveys. Some major centres include:- The NCAER (see Appendix 4.4) in Delhi, has been established for over fifty years to conduct research on economic development, physical and economic infrastructure, agricultural and rural development and household level income, poverty and human development. Its research activities are sponsored by government, development agencies and the private sector. It has undertaken a large number of major surveys e.g. of household income to complement the household expenditure surveys by the NSSO. Its research includes panel and longitudinal studies. Many UK academics reported that they used NCAER data. However, access to these datasets may not always be straightforward. First, most of the field surveys are conducted as part of commissioned work e.g. by the World Bank, UNDP etc. Such commissioned studies do not normally provide additional resources to make these datasets available in some standardized retrievable format. In addition clearance from the sponsors of commissioned work may also be required.6 Some of the datasets widely used and generated by NCAER are: 1) Rural Economic Development (Demography) Survey, a panel survey since 1970-71 having completed four waves so far (see Appendix 4.5), 2) The socio-economic impact of HIV/AIDS (2068 HIV affected households and 6224 non-affected households), 3) Market Information Household Survey (with two stage sampling process; in the first stage 300,000 households were included and in the second stage survey of purchase of durable and non-durable goods 40,000 households were included), 4) Rural Finance Access Survey (World Bank supported survey not currently available for dissemination), 5) India Human Development Report survey (Appendix 4.4) and 6) Micro Impact of Macro Adjustment Survey (sample size c 7000).
6 NCAER’s datasets are widely regarded to be of high quality. Until 1990s for each specific commissioned work, NCAER recruited interviewers and trained them. Since then, they have changed their strategy to employ local organizations (NGOs) for data collection. Though the identification of field workers is the duty of local NGOs, NCAER prepares the survey schedules, trains the field personnel involved in data collection and supervises them. Though the data entry into soft form from the paper-based surveys is done in ‘out-sourced’ style, data quality is checked directly by the NCAER.
13
The Indian Institute of Population Studies (IIPS), in Mumbai, also celebrating its 50 year jubilee, and based in Mumbai is another national research organization with a strong record of managing major national surveys related to population and health. These are chiefly the National Family Health Surveys (NFHS 1, 2 & 3) and the Reproductive and Child Health District Level Survey (see Appendices 4.8 & 4.9). These major studies are run through the IIPS, which sets up the research with additional technical help form other groups and trains the local agencies undertaking the surveys in each state. These are high quality and well conducted studies generating carefully labeled datasets. The Centre for the Study of Developing Societies (CSDS) in Delhi, which was set up in the 1960s and particularly the Lokniti – Institute for Comparative Democracy programme, with its focus on election studies at national and state level. These include the National Election Study of 1996-2004 which has involved a major panel survey of 15,000 Indian electors across the parliamentary elections in this period, and other national and state level sample surveys of the electorate. The National Election Surveys have been analyzed by a limited number of researchers form outside India, who describe the design of the study and its operation as being excellent.
iii) Administrative data Administrative data is information collected for administrative rather than research purposes. There is a growing volume of this data in the Indian context. However almost all of it is collected on the ‘pyramid’ principle (that is, sequential aggregation). There are thus issues of accuracy and error at every level, quite apart from issues to do with the reliability and variability of the recording in the first place, whether this is recording school attendance, crime etc. It is clear that at the very lowest level of compilation such data is often not computerised (e.g. at school level). Some of the impressive schemes to raise the quality of this information have worked to remove anomalies at this first level of aggregation (e.g. the District Information System for Education - DISE - system of school census data that works to generate more reliable school data at the lowest level of aggregation and ways of identifying and correcting anomalies at this point). At another level there are legendary figures such as S L Shetty, based in Mumbai, with literally a lifetime of work dedicated to pointing out errors and omissions in published government economic statistics and issuing their own corrected versions and consistent time series through the Economic and Political Weekly (EPW) Foundation in Mumbai. While the administrative data thus has to be treated with a great deal of caution, there are areas where there is no other information available (e.g. school data, crime data, hospital statistics, trade and banking data etc). There will however inevitably be variations in the quality of this data from district to district and state to state that will take time and massive effort to reduce.

14
iv) Boundary Data, Geocoding and Remote Sensing Data Physical maps to investigate the spatial organisation of demographic, social, economic and other data from the census have been available from the Registrar General of India for many years. India’s National Atlas and Thematic Mapping Organisation provides various maps of administrative divisions, soils, forest, cities and towns, at various scales (district, state, India) in paper and digital formats. Administrative boundaries are available from the Survey of India. Digitized boundaries for Indian administrative divisions are now widely used and can be obtained from various commercial providers. Also, the states, districts and sub-district maps have been digitized in several layers (known as ‘coverage’) including boundary, rivers/water and rail/road network and locations of towns (see Appendix 5). The NSC report (2001) recommended creating a uniform area code system which would allow the identification of every village and block with appropriate geo-codes. Such geo-coded system has been developed at the Office of the Registrar General and Census Commissioner to link administrative boundaries at various levels with census data7. In principle GIS techniques provide an increasingly powerful tool to link data to geographical locations. However, to do so the geographical information must be in a suitable format, that is accessible for GIS modeling. Also data features with known geographic coordinate (latitude, longitude) can be mapped and superimposed on a geo-referenced dataset. To link geo-referenced datasets to other data, a common geographic identifier has to be used. While progress is being made in producing geo-referenced datasets and standard identifiers, one view strongly put was that this had not yet reached the level of a standard uniform system. As a result many researchers have created their own geo-referenced datasets using existing physical maps (hard copy, scanned maps) or their own GPS measurements. Remote sensing data is becoming increasingly important in India and the NSC report (2001) argued for much more use of this technique. Satellite imagery can be obtained from the National Remote Sensing Agency of India. The Indian satellite (IRS) produces multi-spectral images like LISS-III at 23.5-meter resolution, which is especially useful for land-use/vegetation analysis. Panchromatic (black-and-white) images at 5.8 meter resolution are also available and especially useful in identifying urban structures. CARTOSAT-1, the India's latest remote-sensing satellite (launched in 2005), also provides black-and-white stereoscopic images in the visible light spectrum at a resolution of 2.5 meters, useful for large-scale mapping and to capture topographic details. The availability of unified location codes across India is a development that should allow a standard way of integrating existing microdata (and macro data) into a uniform spatial framework. Our understanding is that this point has not yet been reached, as most
6. In the 2001 Indian census, location codes (ID codes) exist for the states (2 digits within the country), the districts (2 digits within the state), sub-districts (4 digits within the district), villages (8 digits within the state), towns (8 digits within the district) and wards (4 digits within the town). The same ID codes need to be present in the geo-referenced dataset.

15
datasets do not yet include the ID codes developed in the census. Also, it should be noted, the census village boundaries comprise an area which is typically much larger than e.g. the UK full post-code.
6. Key Datasets by Functional Area Key Datasets The key Census, Survey and Administrative datasets have been included in Tables 1-8 below. Data sources described include the main surveys across a range of demographic and social variables. Time frames for each survey refer to the years the surveys were begun or the different ‘rounds’ when survey data have been collected. ‘Principal investigators’ in most cases are the different departments or government ministries, but could also include private research councils and commercial organizations or other groups involved in the study.
i) Demographic data
Table 1: Demography: Possible Data Sources Data Source Year Principal Investigator Census of India 1871-2001 Registrar General, Census
Commissioner of India Civil Registration in India 1850’s-2006 Registrar General, Census
Commissioner of India Sample Registration Scheme (SRS)
1964-65 (pilot) 1970-2006
Registrar General, Census Commissioner of India
SRS (in brief) on mortality and fertility
1972, 1979 Registrar General, Census Commissioner of India
National Family Health Survey (NFHS)
NFHS(1): 1992-93, NFHS(2):1998-99, NFHS(3): in the field: first results
Indian Institute of Population Sciences (IIPS), Mumbai
Reproductive and Child Health Project- Rapid Household Survey (RCH-RHS)
RHS (I): 1998-99, RHS (II): 2002-03
Indian Institute of Population Sciences (IIPS), Mumbai
Multiple Indicator Cluster Survey (MICS)
2000-2001 UNICEF and Department of Women and Child Development, Ministry of Human Resource Development
Survey of Living Conditions (based on World Bank Living Standards Measurement Survey (LIMS)
1997-98 (in Bihar and UP only)
World Bank

16
After the decennial census a key dataset for demographic information is the Sample Registration System (SRS).8 Because of the substantial and variable under-recording of key demographic events, the sample registration of vital events (births, deaths) provides better annual estimates of birth and death rates at the state and national levels for rural and urban areas separately. The SRS also provides various other measures of fertility and mortality.
SRS bulletins are published annually by the Indian Registrar General but the data is released at the state level only. The SRS bulletins are also widely used as a more robust and accurate alternative to Census data, in the creation of other major topical surveys (e.g. the NFHS).
Other datasets widely used by Indian demographers include the National Family Health Survey, and the NSS surveys which also collect information on gender, age and other health related issues.
The following four key data sets stand out on demography:
1) Census 2) Sample Registration System (SRS) 3) NFHS (microdata) 4) NSS (microdata)
ii) Economic Data
a) Finance Data and National Accounts
The National Accounts Statistics (NSA) are published by the CSO on an annual basis (some estimates are published on a quarterly basis as well). These provide information on the Gross National Product (GNP), Net National Product (NNP), Gross Domestic Product (GDP), Public sector transactions, consumption, saving and capital formation, indirect taxes less subsidies, Consumption of Fixed Capital, Net National Disposable Income, Personal Disposable Income, Private Final Consumption Expenditure (PFCE) in the domestic market, Government Final Consumption Expenditure (GFCE), exports and imports, Gross Domestic Capital Formation, Net Domestic Capital Formation and Savings) and their inter-relationships, growth rates, implicit price deflators, Net Domestic Product (NDP), and Per Capita Income (Per Capita Net National Product at factor cost) by industry. These figures may be disaggregated according to the nature of the economic activity. Some research organisations (e.g. the EPW Foundation, in Mumbai) have made use of this government data to produce consistent national accounts over time. A disaggregated account at state level is also available. Each state also publishes the consumer price indices (CPI) for the state. There is also data on the District Domestic Product. However these datasets are currently only available in hard copy. The Economic 8 The SRS has evolved due to the failure of the Civil Registration System (CRS) which should ideally record every birth and death in India. There are more than 200,000 reporting units in the country and more than 100,000 local registrars doing the actual work of registration.
17
Census intends to publish some national income data in a more disaggregated format in due course. There is a large volume of finance data in India. These data include information on monetary aggregates and data relating to the functioning of various financial markets and financial institutions, the Balance of Payments (BoP) statistics, External Sector Statistics covering both current and capital account transactions (by separately identifying the goods, services, income, and current transfers as principal components), external debt, foreign investor’s funds and foreign exchange reserves. Most of this data is published by Reserve Bank of India (RBI) through its Annual Report, Report on Currency and Finance, Report on Trend and Progress of Banking in India, Handbook of Statistics on Indian Economy, Monthly Bulletin and the Weekly Statistical Supplement to the Bulletin, and high frequency data and information on financial markets on a daily basis. Many of these datasets are available through the RBI website (secure login at https://cdbmsi.reservebank.org.in) or available in soft form from the statistical division of RBI. Alternative sources for many of these datasets are the Securities and Exchange Board of India (SEBI) and the National Stock Exchange. The Combined Finance and Revenue Accounts published by the Comptroller and Auditor General of Accounts (CAG) is the only source where the fiscal statistics for both central government and individual states are recorded. Data on the corporate sector is available from the Industrial Development Bank of India (IDBI) and the Industrial Financial Corporation of India (IFCI). A large volume of financial and economic data mentioned in this section can be accessed through websites of commercial organisations such as CMIE’s PROWESS system, Capital Line or Indiastat, which provide services on a subscription basis (some UK HEIs may be subscribers to one or other of these services). CMIE basically takes company and state level information into its system and then provides a regular update for its subscribers or provides data and analysis on request for particular companies or sectors. The Central Board of Direct Taxes (CBDT) has a Research and Statistics Wing in the Directorate of Income Tax (RSP&PR) engaged in the collection and compilation of direct tax statistics from 300 field units located throughout the country. The Directorate prepares statistical statements and reports on a monthly, quarterly and annual basis from the information received from the field offices. These reports and statements, essentially meant for departmental use, cater for the needs of the CBDT and Ministry of Finance. The All India Income Tax Statistics (AIITS), an annual publication of the Income Tax Department, is based on a very small sample size and published with a considerable time lag.
The Reserve Bank of India (RBI) monitors all the established bank transactions (outside the cooperative sector) and this monitoring activity generates a very large database. However, this invaluable dataset is not published. In discussion senior officials at the RBI indicated that such banking statistics might be released for the purpose of research at a local level, provided key confidentiality was preserved. The annual accounts of private financial companies are released by RBI; co-operative and credit organisations’ data are

18
held by National Bank for Agriculture and Rural Development (NABARD), and insurance data by the Life Insurance Corporation of India. The All-India Debt and Investment Survey (AIDIS) is perhaps the only truly micro database available in this sector. This survey has been carried out by the NSSO every ten years in close collaboration with RBI. Procedures for obtaining NSSO data in microdata format are set out in Appendix 4.3.
b) Trade There are three central agencies from which trade statistics for India can be obtained. The Director General of Foreign Trade (DGFT) is responsible for licensing statistics; the Director General of Commercial Intelligence and Statistics (DGCI&S) for the balance of trade statistics and the Reserve Bank of India (RBI) for the balance of payment statistics. Among these, DGCI&S captures the movement of goods through surface, air and rivers/sea through Daily Trade Return (DTR) generated at the various custom houses. This data is available from 1889 to the present day. The data sets on foreign trade are published through the Monthly Statistics of Foreign Trade of India (MSFTI) which contains data on commodity by country details and Statistics of Foreign Trade of India by Countries (SFTIC). However, these data sets exist only in hard copy. DGCI&S publishes the inter-state movement of goods annually in the Statistics of Inland & Coasting Trade Consignment of India and Inter-State Movements/Flows of Goods by Rail, River and Air.
Table 2: Economic and Financial Data Data Source Year Principal Investigator Annual Survey of Industries
1960-2006 Ministry of Labour, Government of India
Small Scale Industry Surveys
Annual Ministry of Labour, Government of India
Economic Surveys Annual Central Statistical Organization (CSO) and Ministry of Finance
Index of Industrial Production
Annual Central Statistical Organization (CSO)
Market Information and Household Survey (MIHS)
2002 National Council for Applied Economic Research (NCAER)
Market Information Survey
2005 Centre for the Monitoring of the Indian Economy (CMIE)
Family Living Standards Survey
Since 1958 Labour Bureau
Longitudinal Panel Survey ICRISAT

19
c) Labour Market Data
Table 3: Labour Market Data Data Source Year Principal Investigator Employment and Unemployment Situation in India (NSS)
Since 1965 National Sample Survey Organization
Quarterly Employment Review
Quarterly Directorate General of Employment and Training, Ministry of Labour
Quick Estimates of Employment in the Organized Sector
Annually Directorate General of Employment and Training, Ministry of Labour
Employment in the Organized Sector
Quarterly Directorate General of Employment and Training, Ministry of Labour
Employment Review Annually Directorate General of Employment and Training, Ministry of Labour
Occupational-Educational Patterns of Employees in India
Annually Directorate General of Employment and Training, Ministry of Labour
Employment Exchange Statistics
Annually Directorate General of Employment and Training, Ministry of Labour
Apprentice Training in India
Annually Directorate General of Employment and Training, Ministry of Labour
Census of Central Government Employees
Annually Directorate General of Employment and Training, Ministry of Labour
Bulletin of Job Opportunities in India
Annually Directorate General of Employment and Training, Ministry of Labour
The Indian labour market cannot be fully captured by studying only those in the industrial or organised employment sectors. There is a huge informal economy (accounting for perhaps 90 per cent of the Indian work force), especially in the agricultural sector. There is detailed data on the formal employment sector collected by various ministries and co-ordinated by the Ministry of Labour. The Directorate General of Employment and Training (DGE&T) of the Ministry of Labour produces the following datasets: Quarterly Employment Review, Quick Estimates of Employment in the Organised Sector (Quarterly), Employment Review (Annual), Occupational-Educational Pattern of Employees in India (for public sector and private sector in alternate years), Employment Exchange Statistics (Annual), Apprenticeship Training in India (Annual), Census of Central Government Employees (Annual) and Bulletin of Job Opportunities in India (Annual). These data sources are largely based on data provided by the state labour bureaux in the process of administering various labour laws. These are based on returns from industrial units and the poor quality of such returns has been widely reported. They are only available in aggregate form. Some disaggregated data is available through the Annual Survey of Industry (ASI), conducted annually since 1960 (for more details see Appendix 4.6). The ASI collects data on registered manufacturing and repairing units.
20
The Follow-up Enterprise surveys in the ASI collects data from unregistered units. While the ASI is a record based study, the Enterprise survey is based on interviews. The Small Scale Industry survey is another important information source. These surveys were conducted in 1973-74, 1990-91 and 2001-02. In the latest round the sample size is based on 25,000 small scale industries. However, the definition of what constitutes ‘small scale’ has undergone changes and this may have affected the consistency of sampling.
The CSO publishes information on the Index of Industrial Production for the country as a whole. Though there are state level indices, they are often not comparable due to different methods adopted to generate each state index.
Though the service sector in India is increasingly important, contributing about 49 % of GDP, there is apparently no systematic database to cover this sector. However the Enterprise survey in the ASI may cover some aspects of this sector. The CSO also collects information on employment through the Economic Census. The decennial population census collects data on some aspects of employment. This includes information on the main worker, marginal workers (by industrial classification of work, occupation, age and education level), non-worker (by main activity, age and education level and those seeking work (by education level, age and whether they have worked before) under various demographic, social and economic characteristics. In summary key datasets for the labour market and employment sector include:
1) Administrative data from the Ministry of Labour (various publications). 2) The Annual Survey of Industry (ASI) 3) Follow-up survey of industry 3) Small Scale Industry survey 4) Relevant NSS rounds (microdata)
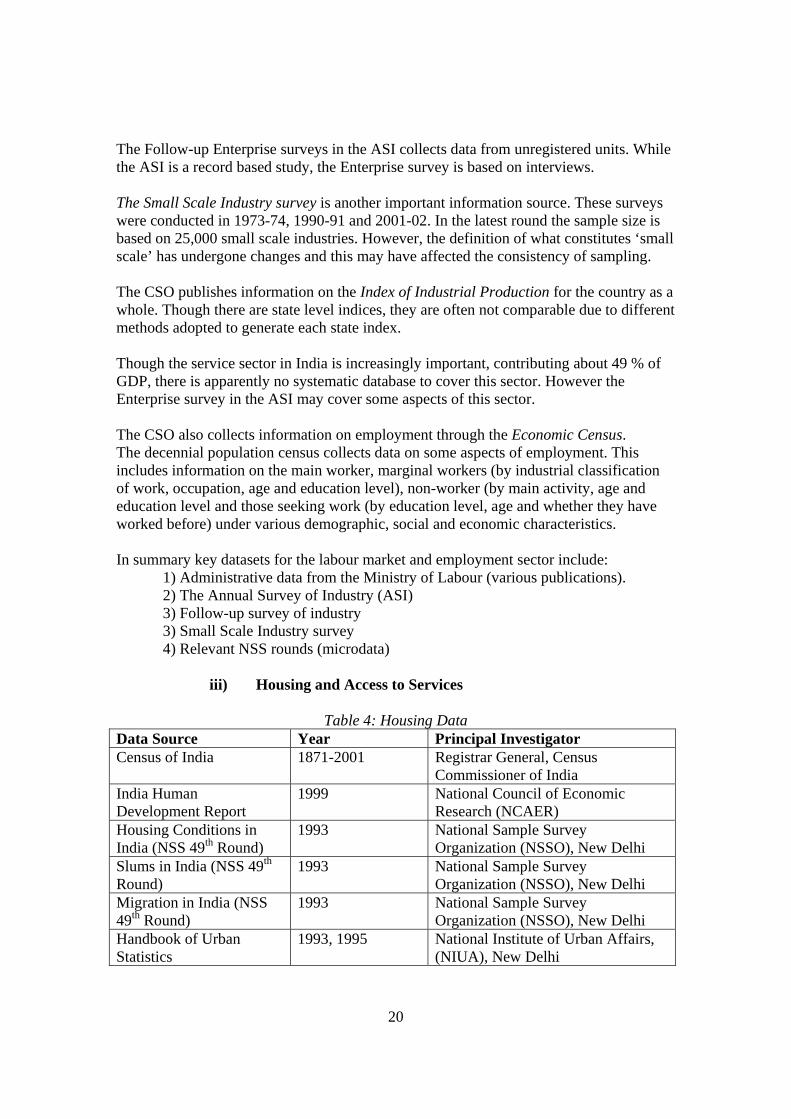
iii) Housing and Access to Services
Table 4: Housing Data Data Source Year Principal Investigator Census of India 1871-2001 Registrar General, Census
Commissioner of India India Human Development Report
1999 National Council of Economic Research (NCAER)
Housing Conditions in India (NSS 49th Round)
1993 National Sample Survey Organization (NSSO), New Delhi
Slums in India (NSS 49th Round)
1993 National Sample Survey Organization (NSSO), New Delhi
Migration in India (NSS 49th Round)
1993 National Sample Survey Organization (NSSO), New Delhi
Handbook of Urban Statistics
1993, 1995 National Institute of Urban Affairs, (NIUA), New Delhi

21
Basic information on housing conditions is collected in the decennial census. The census also reports information on access to basic services (e.g. post offices) for the village as an aggregate. The NSS surveys collect information on housing condition and other amenities such as domestic fuel use (used by TERI for estimating India’s future power needs n the medium term). However micro level data for access to services is best derived from surveys such as those by the National Council for Applied Economics and Research (NCAER). Though the Ministry of Social Welfare and Ministry of Labour publishes various statistics on welfare programmes conducted by the states, information on the take-up and expenditure on these programmes is only published as an aggregate figure at the state level. Key datasets on housing include:
1) Census 2) NSS (microdata) 3) India Human Development Report Panel survey, by NCAER (microdata)
iv) Health and family welfare (including social welfare)
Table 5.1: Social Welfare (Census/Survey Data) Data Source Year Principal Investigator NSS Household Consumption Expenditure Survey
1993-94, 1995-96, 1998-99, 2002-03
National Sample Survey Organization (NSSO), New Delhi
Human Development Profile Survey
1994 National Council of Economic Research (NCAER) New Delhi
National Family Health Survey
NFHS (2)1998-99 Indian Institute of Population Sciences (IIPS), Mumbai
Men and Women in India 2001 Department of Women and Child Development

22
Table 5.2: Social Welfare (Administrative Data) Data Source Year Principal Investigator Annual Report of Social Welfare Development
Yearly Department of Social Welfare, Ministry of Social Justice and Empowerment
Annual Report of Women and Child Development
Yearly Department of Women and Child Development
Annual Report of the National Commission for Women (NCW)
Yearly National Commission for Women
Annual Report on Disabled Welfare
Yearly Disabled Welfare Department, Ministry of Social Justice and Empowerment
Annual Report on Old Age Welfare
Yearly Old Aged Welfare, Ministry of Social Justice and Empowerment
Time Use Survey 1996 National Sample Survey Organization, Department of Women and Child Development
Table 5.3: Health
Data Source Year(s) Principal Investigator National Family Health Survey
NFHS (1): 1992-93 NFHS (2):1998-99 NFHS (3): preliminary results, 2006
Indian Institute of Population Sciences (IIPS)
Reproductive and Child Health- District Level Household Survey (RCH-DCL)
1998 Indian Institute of Population Sciences (IIPS)
DLHS-RCH District Level Reproductive and Child Health
2002-4 600K household sample generates district level estimates
Indian Institute of Population Sciences (IIPS).
Health Information of India
Since 1963 Central Bureau of Health Intelligence, Ministry of Health and Family Welfare
Rural Health Statistics Since 1963 Central Bureau of Health Intelligence, Ministry of Health and Family Welfare
National Aids Survey Annually National Aids Control Organization (NACO) and National Institute of Medical Statistics

23
Since 1961 the Central Bureau of Health Intelligence (CBHI) in the Ministry of Health & Family Welfare (MHFW) has been the body dealing with the collection, compilation, analysis and dissemination of health data at national level. Based on administrative data on the implementation of various health programmes, CBHI publishes the annual Health Information of India. Apart from this, the rural division of the Ministry of the Health publishes Rural Health Statistics (every six months) providing information on the health infrastructure and manpower in rural areas. Both these reports are not age or gender specific. They provide aggregate data at the state level. These administrative data sets do not provide information on morbidity and mortality. The National Family Health Surveys (NFHS) conducted by the International Institute for Population Sciences (IIPS) is crucial for this purpose. However, NFHS data sets are not powerful enough for planning at district and lower levels. See Appendices 4.8 and 4.9 for more details on the three rounds of the NFHS survey to date. Apart from the NFHS survey, much more disaggregated health data can be gathered from the Reproductive and Child Health District Level Household Survey (RCH-DLHS), which was conducted in 1998-99 and 2002-03 in 596 districts in India. The latest round has a sample of 600K households with health data on each household member (total population c3m). These surveys are sampled in ways that permit district level results to be generated. However a major gap in these surveys is the lack of information on expenditure and consumption on health. NSSO surveys are the only source to capture this information at least in part.
The contribution of the private health care sector is an indispensable aspect of the Indian health system. However, this may not be captured by many official statistics. The National Institute of Medical Statistics (NIMS), by becoming a nodal agency for 26 independent research centres on specific diseases (e.g. for AIDS National Aids Control Organisation – NACO), fills this gap by collecting data at dispensary and hospital level. Such autonomous organisations may conduct separate surveys, e.g. NACO conducts surveys of AIDS prevalence among high risk and population groups at various levels. NIMS also act as an agency co-coordinating various government departments that deal with health issues, in addition to the MHFW9.
Social welfare comes under state control under the constitution and information is held at the state level. There is information on how much money is spent on social welfare payments, which is used by budgeting purpose. But this is aggregated information, based on district returns. The Multiple Indicator Cluster Survey (MICS) is a survey supported by UNICEF (in collaboration with WCD) in several developing countries, thus providing a framework of international comparison. It is designed to generate robust results at a local level by
9 NIMS is also involved in a study on National Child Health Report to be published later this year. In 2003 a major study (Usage and acceptability of Indian systems of medicine and homeopathy) spread through 19 states involving two districts in each state. In each district 12 hospitals, 24 dispensaries, 72 practitioners, 240 patients, and 1000 households were studied. Numbers of health workers in post, number of beds, facilities, OPD attendance, major ailments etc were collected.

24
cluster sampling. There have been three rounds of this survey (the latest in 2000) so far. The latest sample size is 119,305 households, stratified by state for urban and rural areas. Topics covered in MICS are household characteristics, school attendance, health status, nutrition, education, family planning, morbidity, and registration of births. Key datasets in the health and welfare sector include :
1. Health Information for All 2. Rural Health Statistics 3. National Family Health Surveys 1, 2 and 3 (microdata) 4. Multiple-indicator cluster survey (microdata) 5. NSS surveys (microdata) 6. Surveys by agencies under the aegis of NIMS. 7. Reproductive and Child Health (District Level Household Survey) (microdata)
v) Education
Table 6: Education Data
Data Source Year(s) Principal Investigator All India Education Survey
Since 1977 (every 5-7 years)
National Council of Education, Research and Training (NCERT)
District Information System of Education
Since 1990s National Council of Education, Research and Training (NCERT)
Public Report on Basic Education
1996 Ministry of Human Resources and Development
Higher Education and Technical Training Statistics
Annually University Grants Commission (UGC), Association of Indian Universities (AIU), National Council of Teacher Education (NCTE), Institute of Applied Manpower Research (IAMR), and All-India Council for Technical Education (AICTE).
Census of India 1871-2001 Registrar General, Census Commissioner of India
Attending Educational Institutions in India: Level, Nature and Cost (NSS 52nd Round)
1996 National Sample Survey Organization (NSSO)
Educational Achievement Surveys at Class IV, V, VII /VIII
2000- NCERT
Educational data can be compiled from institutions (schools, colleges and educational administrations), households and users (pupils and students). Educational institutions provide data on student enrolment, attendance, teacher-student ratios etc and these are
25
compiled by the statistics division of the department of secondary and higher education of the Ministry of Human Resource Development (MHRD). However the aggregated basis of much of this information has been questioned due to lack of proper checking and validation (e.g. inflated enrolment data or incorrect records of teacher absenteeism). More detailed information on the aspects covered in the educational statistics by the MHRD and other aspects such as disabled students, facilities in schools etc have been collected every 5-7 years by the National Council for Educational Research and Training (NCERT) through the All India Educational Survey since 1957. So far seven rounds have been completed. The District Information System of Education (DISE) is another important dataset collected from schools. This is one of the few sources which collect data on the age of the students. For more details on these two datasets see Appendices 4.11 & 4.12. Some independent surveys (Public Report on Basic Education, 1996) have covered certain areas such as achievement levels of the students, which are often not covered by other datasets. Data quality and management systems vary significantly between the states. For example, Andhra Pradesh has introduced a system of unique pupil numbering to track students. And a study in the Punjab (Mehta, 2005) set out to estimate the number of pupils in unrecognized private schools, which are not normally included in any state or national educational statistics. There have been achievement tests conducted in various subjects at school level at intervals in recent years. There are now moves to put this on a more systematic basis. The NCERT conducted assessments in language and mathematics in 22 states in 1990, using standardized tests given to samples of children at Class IV. In the moves to achieve universal elementary education (under the national Sarva Shiksha Abhiyan or SSA programme) the NCERT set out to conduct baseline achievement surveys in Class III, V, and VII/VIII in mathematics, language and environmental studies. In the results for Class V published in 2006, students from 31 states or union territories were assessed, using a multi-stage sampling process to select district within states, rural and urban areas, schools, teachers and finally pupils, with a minimum of four districts per state. This resulted in data on some 88,000 pupils with sample numbers in each state ranging from 1000-5000 children. Results from these studies are being published by the MHRD, e.g. NCERT Learning Achievements of Students at the End of Class V, 2006 Datasets on higher education and technical education are collected by agencies such as University Grants Commission (UGC), the Association of Indian Universities (AIU), National Council of Teacher Education (NCTE), Institute of Applied Manpower Research (IAMR), and the All-India Council for Technical Education (AICTE). There are some important inconsistencies on data collected by these organisations and that of data collected by the Department of Education in MHRD, which collects data from the states independently. Most of the datasets described so far are collected via institutions. Other data can be derived directly from households e.g. in terms of their access to education, terminal education age, and qualifications obtained etc. This data can be drawn from the NSS and other surveys that collect qualification, and also from the Census. These survey based
26
data sources provide important information such as expenditure by guardians on education, socio-economic background of students etc. Key data sets in the field of education include:-
1) All India Education Survey 2) District Information System of Education (DISE) 3) Achievement surveys conducted by the NCERT (potentially microdata) 4) Education statistics by the Ministry of Human Resources 5) Population census 6) NSSO and other survey data (with educational data) 7) Data on higher education and technical education.
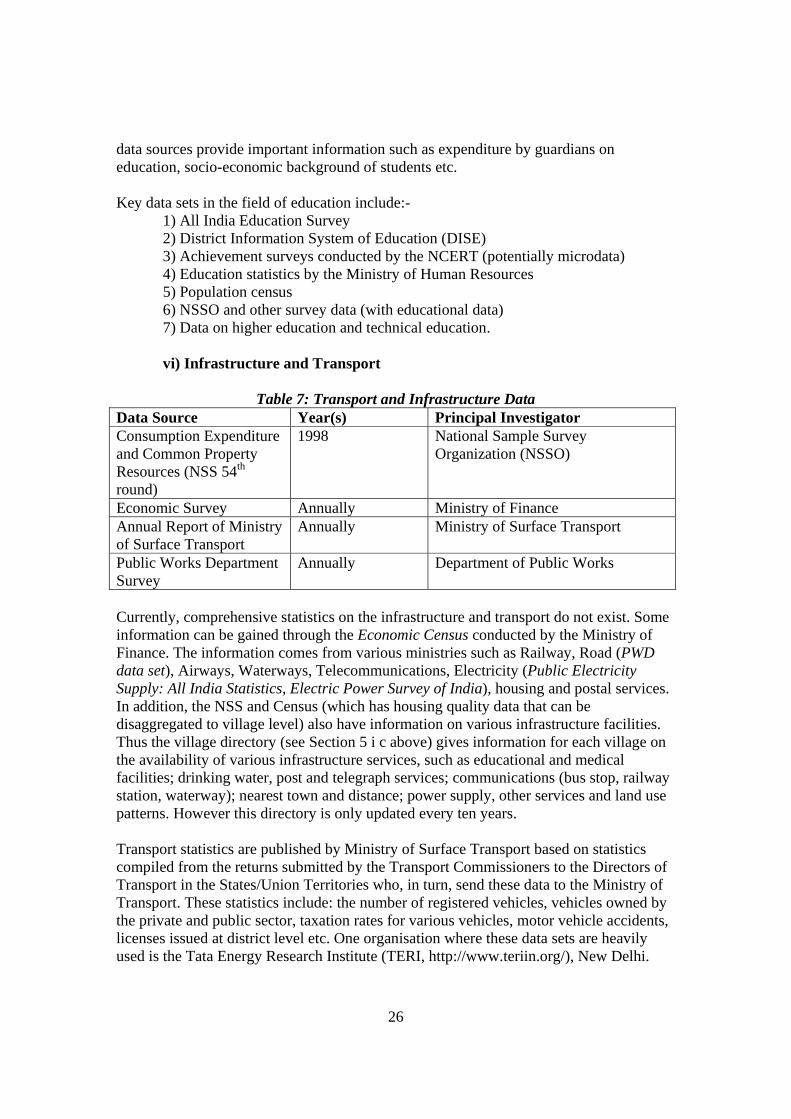
vi) Infrastructure and Transport
Table 7: Transport and Infrastructure Data
Data Source Year(s) Principal Investigator Consumption Expenditure and Common Property Resources (NSS 54th round)
1998 National Sample Survey Organization (NSSO)
Economic Survey Annually Ministry of Finance Annual Report of Ministry of Surface Transport
Annually Ministry of Surface Transport
Public Works Department Survey
Annually Department of Public Works
Currently, comprehensive statistics on the infrastructure and transport do not exist. Some information can be gained through the Economic Census conducted by the Ministry of Finance. The information comes from various ministries such as Railway, Road (PWD data set), Airways, Waterways, Telecommunications, Electricity (Public Electricity Supply: All India Statistics, Electric Power Survey of India), housing and postal services. In addition, the NSS and Census (which has housing quality data that can be disaggregated to village level) also have information on various infrastructure facilities. Thus the village directory (see Section 5 i c above) gives information for each village on the availability of various infrastructure services, such as educational and medical facilities; drinking water, post and telegraph services; communications (bus stop, railway station, waterway); nearest town and distance; power supply, other services and land use patterns. However this directory is only updated every ten years. Transport statistics are published by Ministry of Surface Transport based on statistics compiled from the returns submitted by the Transport Commissioners to the Directors of Transport in the States/Union Territories who, in turn, send these data to the Ministry of Transport. These statistics include: the number of registered vehicles, vehicles owned by the private and public sector, taxation rates for various vehicles, motor vehicle accidents, licenses issued at district level etc. One organisation where these data sets are heavily used is the Tata Energy Research Institute (TERI, http://www.teriin.org/), New Delhi.

27
The National Statistics Commission (2001) has recommended the creation of an infrastructure index and infrastructure utilisation index. This may generate a better system of recording in due course.
vii) Crime Data
Table 8: Crime Data Data Source Year(s) Principal Investigator Crime in India Annually since
1953 National Crime Records Bureau (NCRB)
State level Crime in India Annually State Crime Records Bureau (SCRB) District level Crime in India
Annually District Crime Records Bureau (DCRB)
Crime data typically falls into administrative data, usually data on recorded crimes, and survey data based principally on victim report. In India the National Crime Records Bureau has assembled data on recorded crimes since 1953 and publishes an annual statistical report Crime in India (also available on CD). This is an aggregation of the returns from the crime records bureaux at state and other levels (with a few non-returns each year). Crimes are listed under both the Indian Penal Code (IPC) and under Special and Local Laws (SLL), with the IPC series showing rather more consistency than the SLL totals which fluctuate from year to year. The report covers the main categories of recorded crime, broken down by state or other area level (e.g. for the very large cities). Data is presented by crime type e.g. violence against the person, economic crimes and also by some of the categories of victim (crimes against women or children, or scheduled castes and tribes (SCC)). There is also data on police actions (Numbers, Police Firings, Casualties and Formal Complaints against the police). Underlying these crime statistics there is the CCR data base of reported crime through so-called ‘First Information Reports’. Despite India’s size the total number of recorded crimes under the IPC was only 1.8m in 2005 with another 3.2m under the SLL (total 5m). However it has not been possible to ascertain whether this data is held in a single standardised format and if so whether it would be accessible by researchers. One clear point that emerged was that crimes were not geocoded to a local area. Comments by researchers who made use of this crime data in aggregated format was that crime recording was very variable across different states. Thus Indicus Analytics weight the recorded crime statistics by the murder rate in each state (on the grounds that this is most likely to be well recorded). This results in Kerala state, where the recording of crime may be very high, dropping down the overall ranking. There is nothing directly comparable at an all India level to the British Crime Survey (BCS), which is a representative adult population survey of the experience of crime (primarily as a victim). We drew the NCRB’s attention to this series, and they may well explore this option further (though were concerned to hear that it would almost certainly

28
result in a much higher number of crimes in some categories than those recorded by the police). There may be such surveys at state level (we have no information on this). There are relevant surveys that relate to this area, e.g. a survey conducted in 2005 on experience of corruption that was carried out by Transparency India with international collaboration, published under the title Corruption in India, 2005 with CMS, Delhi (see http://www.transparency.org/regional_pages/asia_pacific/newsroom/current_in_focus/india_study_2005). There may also be questions in national surveys (e.g. by NSSO) that pick up criminal actions. At this point given the uncertainty about the reliability and consistency of crime recording across India it would seem inappropriate to put energy into getting access to the individual crime records.
viii) Election Data Elections are held every five years at both the Centre and state levels. This electoral process generates huge amounts of administrative data in terms of the proportions of people voting, expenditure incurred by each candidate etc. Such information is held by the Election Commission of India. A publication India Decides includes these datasets. Importantly the Centre of Studies on Developing Societies in Delhi and particularly its Lokniti programme for comparative democracy has a Data Unit that holds both the aggregate datasets on election results at state and national level since 1952 and also data from the Election Surveys carried out at both state level and national parliamentary elections since 1967. These latter are based on stratified random samples of the electorate which includes both voting intentions and behaviour and related issues, but also ‘social background data such as caste/community, education, occupation, income and assets’. The Election Surveys covering the national elections from 1996-2004 also form a major panel study of about 15,000 electors (the largest we came across in India). The Data Unit makes available aggregate level data from these election surveys at fixed charges (see http://www.lokniti.org/dataunit.htm). A number of academics from other countries have entered bilateral agreements to be able to analyse these data in microdata format. The quality of the data is stated to be excellent. As it includes a range of socio-economic data in addition to that directly connected to election interests then it may be very useful in addressing a number of other topics. Key datasets under Election data include: National Election Surveys (NES) – (potentially microdata and panel study) State Assembly Election Surveys (up to 60 different state surveys since 1965).
ix) Consumption surveys The most widely used datasets for consumer expenditure data are the NSS surveys which collect information every year (see details in Appendix 4.1). Though the survey has a different focus in different years, the information on consumption-expenditure is collected every year. The Family Living Surveys have been conducted by the Labour

29
Bureau since 1958. It has included four such surveys. But, in the latest round (1999-2000) data was collected only from 78 selected locations. The NFHS surveys also collect some information on consumption and expenditure patterns. The NCAER’s Market Information Survey of Households (MISH) is another source on consumption-expenditure patterns and income related questions, collected from a sample of 300,000 households in 400 districts across India. This has been conducted more or less annually since 1986, and is now published as the Great Indian Market. The only longitudinal dataset in this field appears to be the ICRISAT’s study of a comparatively small sample size of 400 households. This dataset was initiated in 1975 and continued until 1984 to assess income and consumption pattern with 3-4 weekly visits throughout the entire year. The method of data collection and the content has had some problems (Bediani et al, 2006). Since 2001 new data has been collected, covering the same households interviewed in 1984/85, based on a broadly consistent questionnaire and a sampling strategy that takes into account units that split off from the original households. Income from the various sources can be separated into six categories: crop, livestock, trade, transfer and labour, the same categories used between 1975 and 1984, and an additional category – income from migration sources. In 2005 4796 of the 4907 individuals linked to the VLS were traced, and detailed individual level surveys were conducted for all individuals. Important household expenditure/consumption surveys include:
1) NSS survey annual rounds 2) Market Information Survey of Households 3) Family Living Survey 4) NFHS 5) ICRISAT village level panel survey
x) Gender statistics
Several of the demographic datasets outlined already, are used to undertake gender analysis. However many of the administrative datasets do not provide gender breakdowns. Institutions such as the national Department of Women and Child Development (WCD) commissions the NSSO to conduct specific surveys (e.g. Men and Women in India, 2004 Survey).
The WCD works with other ministries to provide disaggregated data such as gender budgeting (together with the Ministry of Finance), information on women’s informal employment and time-use data through the CSO/NSSO and crime against women from the NCRB. Gender statistics is still a new area and various ministries are working to provide gender specific data. So far progress has been made to provide better availability of gender disaggregated data on indicators such as land ownership, availability of credit facilities from bank, maternal mortality rate, etc. The WCD is also working with UNIFEM and the South Asian Association of Regional Cooperation (SAARC) to establish a gender database on violence against women, employment discrimination,

30
reproductive health issues and composite indices like the Gender Development Index (GDI) for comparative analysis with other developing countries in the region (see http://www.unifem.org.in).
7. Data Quality and Access
i) Access
Since 1999 there has been a general undertaking, stemming from a union cabinet decision, by the national government of India to make its data available, including where appropriate in microdata format. This has, if anything, been strengthened by the Indian Right to Information Act that came into force in October 2005, subject to data protection requirements and confidentiality. Thus the website for the NSSO acts to provide information on all major surveys and the resulting reports, that can be freely downloaded. Microdata can also be ordered, and is provided free to Indian academic institutions completing the necessary documentation (through a Memorandum of Understanding - MOU), including an indication of the utility of the project (i.e. what will be the benefit of the analysis). For other groups and individuals there is a standard charge, varying slightly by the size of the dataset (see Appendices 4.1 and 4.2). Here, too, any potential user has to provide a rationale for the microdata (we are not clear whether this has a ‘gate-keeping function’ i.e. whether access is ever refused on the grounds of proposed use). Other datasets generated by government or other agencies may in some cases be freely available on request (e.g. the NFHS-2, DLHS-RCH etc), though this might not apply if the proposed location was to an overseas data archive as opposed to an individual user. In other cases data may be available from funders e.g. UNICEF or contributing academic institutions in India or overseas (e.g. IIPS, ORC-Macro, Demographic and Health Surveys (DHS) and is often free or at a standard charge). Access can be straightforward with private agencies. A good number of them provide a web based service. Their charges are often designed for institutions (e.g. Indiastat’s membership fee is $1300 to $1600 US dollars for a year’s membership for an institution). Some private agencies (e.g. Indicus Analytica) also collect data from government and semi-government sources, clean the data and carry out basic analysis for research institutions and multilateral agencies. As these research agencies are familiar with the way data is held as well as with local terms and conditions, they may be better able to interpret locally collected data. However most of these agencies do not actually collect additional data but rather process existing data into a more user friendly form, sometimes as a relative routine servicing operation for the private sector e.g. economics data and data on companies or sectors which would be useful both to investors and to investment analysts. The charging structure for many datasets often tends to be higher for external users. However this does not seem to extend to different levels of access – it is simply a premium charge.

31
Finally there is microdata that is potentially available from the originating data source or organization, which is not normally made available to other users in microdata format, though it may be released in aggregate format. The reasons for this could be legal – e.g. in the case of the decennial census, where individual level data cannot be released (though we believe there are discussion about a possible anonymised sample of census records). In other cases the data has been collected under specific projects or funded by particular groups, and there are therefore restrictions on making this data routinely available to others, though there may be bilateral agreements between these agencies and particular academics or users in other countries. This category would include datasets developed by NCAERT and the Election Survey data. As was noted above these organisations may not be funded to provide an archive and data support service and this purpose might cut across their principal focus of analyzing the data themselves and reporting the results. This may be particularly important for groups funded largely on the basis of individual surveys and projects with no core funding. .
ii) Quality
In a study of this type it has not been possible to check the data quality in any very detailed way. The best surveys appear to follow excellent practice in terms of sampling, survey and questionnaire design. Despite the large scale nature of the enterprise, with samples often spread across 29 states and samples sizes well into six figures, a pyramid structure of training is often used with a centralized point (e.g. IIPS in Mumbai in the case of the NFHS surveys) acting to provide the training for each state based data collection team. Documentation in the best surveys appears to be very thorough and complete, and the resulting technical reports and details widely available and well disseminated. The best datasets we were able to examine in detail (e.g. NFHS and DLHS-RCH) were carefully labelled with question numbers related to variable labels, descriptors and coding values all properly filled out on the microdata set. However there were a number of critical points raised by data users and academics we talked to over the quality of some of the datasets we have mentioned. Many of these are amplified in the very substantial report prepared by the National Statistics Commission (2001) which has 69 pages of recommendations.
• Several pointed to the contrast between the decennial census, carried out at local level by largely untrained personnel and temporary staff (e.g. school teachers) to assemble data on local villages. However the NSS has an organized system for survey data collection down to district level, with a team of trained (and permanent) staff to carry out its surveys. Similar training is also provided to NFHS survey organisations ensuring consistent data quality.
• One major resulting issue raised was the anomalies between results collected by censuses and surveys (not unknown in the UK, too), and which was the correct result to follow. As an example, the NSC (2001: 5.2.17) pointed out this problem of divergence in estimating the number of workers in industry by two key data sources i) the follow-up surveys of the ASI and ii) the Economic Census: ‘Ideally speaking, the number of enterprises as per the follow up surveys of ASI and the

32
EC should be in close agreement as the definition of an enterprise is the same in both the operations… For ascertaining the number of workers, both the FuS [follow up enterprises survey] and the EC consider the number of workers usually working in the enterprise in a day. But the reference period for determining the number of workers is generally the last month (average month of the last working season for seasonal enterprises in some surveys) in the follow up surveys and the last year for perennial and casual enterprises or the last working season for seasonal enterprises in case of the EC… The total number of manufacturing enterprises in the country as estimated by the follow up surveys 1989-90 and the EC 1990 are about 144 lakhs and 54 lakhs, respectively. Thus follow up surveys estimate is about 2.7 times the EC count.’
• The NSS appears to be fairly conservative in its approach to survey design and data collection, and for example tends to repeat procedures which are no longer appropriate to current conditions e.g. the classification of IT work does not reflect its current importance as a major sector in the Indian economy.
• Also the labelling and guidance on the NSS microdata sets appears not to be up to contemporary standards (this was reported by several people, but we could not check except in one sample case). That is variable names are confusing and not easily related to questions in the original survey, and descriptors and codes are not always completed. The standard recourse is to email NSS in Kolkata, which is apparently very helpful and responsive. However it would appear to be a case where in-house procedures and conventions have not been redesigned to go with the general dissemination of this microdata to a much wider group of users, as these data are widely used within the Indian government and outside.
• Several macro data sets, based on administrative data, are more problematic since various states may use various recording systems or different conventions (e.g. high variability in the recording of crime data).
• Time delays in the availability of administrative data have also been pointed out as one of the main problems.
As already noted, many of these issues have been raised in the hard hitting and comprehensive NSC report in 2001. It is as yet not clear how far this has yet had an effect on these statistical series as the Indian Statistical System (which has to be one of the biggest in terms of person power in the world) must take some time to reshape its efforts in line with the Commission’s numerous and far reaching recommendations. But there is no doubt that the Indian Statistical System can at its best achieve very high quality results in line with the best in the world, and this despite the very difficult conditions under which some parts of it operate.
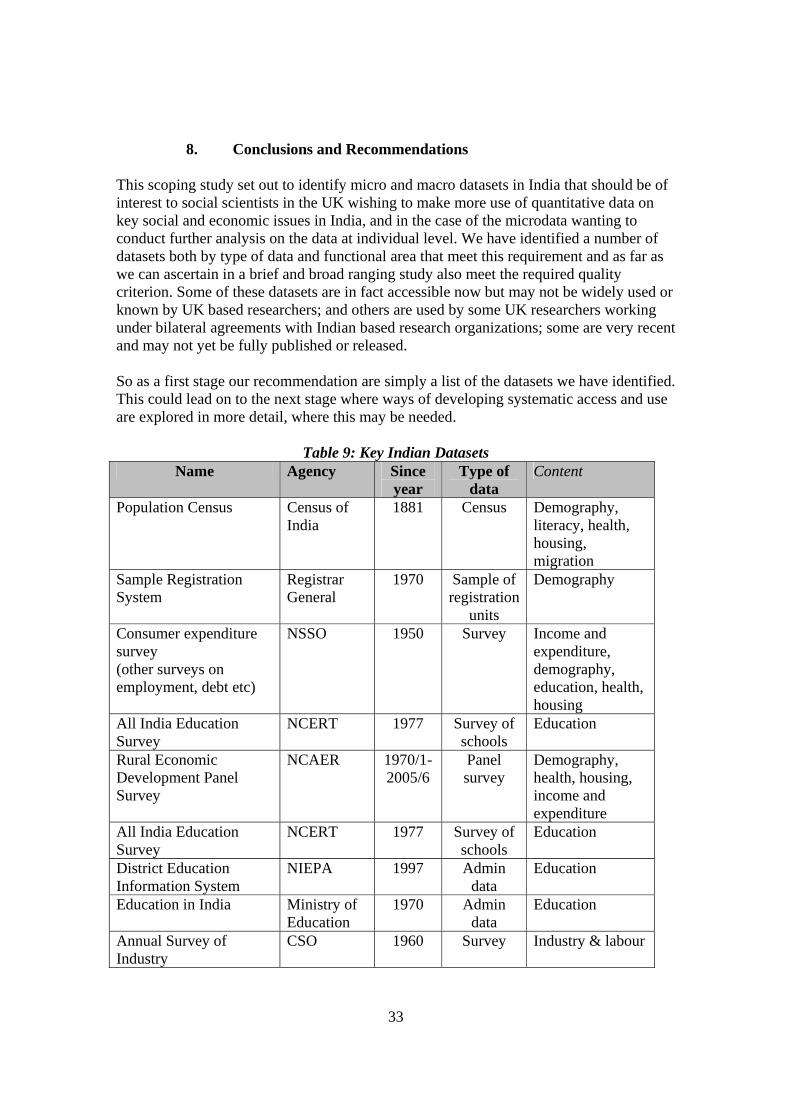
33
8. Conclusions and Recommendations This scoping study set out to identify micro and macro datasets in India that should be of interest to social scientists in the UK wishing to make more use of quantitative data on key social and economic issues in India, and in the case of the microdata wanting to conduct further analysis on the data at individual level. We have identified a number of datasets both by type of data and functional area that meet this requirement and as far as we can ascertain in a brief and broad ranging study also meet the required quality criterion. Some of these datasets are in fact accessible now but may not be widely used or known by UK based researchers; and others are used by some UK researchers working under bilateral agreements with Indian based research organizations; some are very recent and may not yet be fully published or released. So as a first stage our recommendation are simply a list of the datasets we have identified. This could lead on to the next stage where ways of developing systematic access and use are explored in more detail, where this may be needed.
Table 9: Key Indian Datasets Name Agency Since
year Type of
data Content
Population Census Census of India
1881 Census Demography, literacy, health, housing, migration
Sample Registration System
Registrar General
1970 Sample of registration
units
Demography
Consumer expenditure survey (other surveys on employment, debt etc)
NSSO 1950 Survey Income and expenditure, demography, education, health, housing
All India Education Survey
NCERT 1977 Survey of schools
Education
Rural Economic Development Panel Survey
NCAER 1970/1-2005/6
Panel survey
Demography, health, housing, income and expenditure
All India Education Survey
NCERT 1977 Survey of schools
Education
District Education Information System
NIEPA 1997 Admin data
Education
Education in India Ministry of Education
1970 Admin data
Education
Annual Survey of Industry
CSO 1960 Survey Industry & labour

34
Educational Achievement Surveys, Class IV, V, VII/VIII
NCERT 2000- Testing of samples of
pupils
Education
Economic Census CSO Survey Industry & labour Rural Economic Development Survey
NCAER 2001 Survey Income & expenditure
Market Information Survey of Households
NCAER 1986 annually
Survey Household expenditure and ownership of consumer durables etc
Rural Finance Access Survey
NCAER Rural Livelihood
National Family Health Survey 1, 2 and 3
IIPS 1992-93 -2005/6
Survey Health
Reproductive and Child Health Survey
IIPS 1998-99 Survey Health
Multiple Indicator Cluster Survey (MICS)
WCH, MHRD, UNICEF
2000 Cluster Survey
Women and child health and facilities
National Election Surveys
CSDS –Lokniti
1967- 1996- panel
Surveys and Panel
Study
Election survey data with socio-economic background data.
More systematic information on each of these datasets is covered in the series of Appendices to this report.