indian kill biological assessment 2000 survey · subsample. water quality assessments were based on...
TRANSCRIPT

~ New York State.. Department of Environmental Conservation
Division of Water .
Indian Kill
Biological Assessment
2000 Survey
GEORGE E. PATAKI, Governor JOHN P. CAHILL, Commissioner

BIOLOGICAL STREAM ASSESSMENT
Indian KillSchenectady County, New York
Survey date: August 29, 2000Report date: March 9, 2001
Robert W. BodeMargaret A. NovakLawrence E. AbeleDiana L. HeitzlTIan
StrearTI BiOlTIonitoring UnitBureau of Watershed Assessment and Research
Division of WaterNYS Department of Environmental Conservation
Albany, New York

iii
CONTENTS
Background………………………………………………………………………… 1
Results and Conclusions…………………………………………………………… 1
Discussion………………………………………………………………………….. 2
Literature Cited…………………………………………………………………….. 3
Overview of field data……………………………………………………………… 4
Figure 1. Biological Assessment Profile…………………………………………… 5
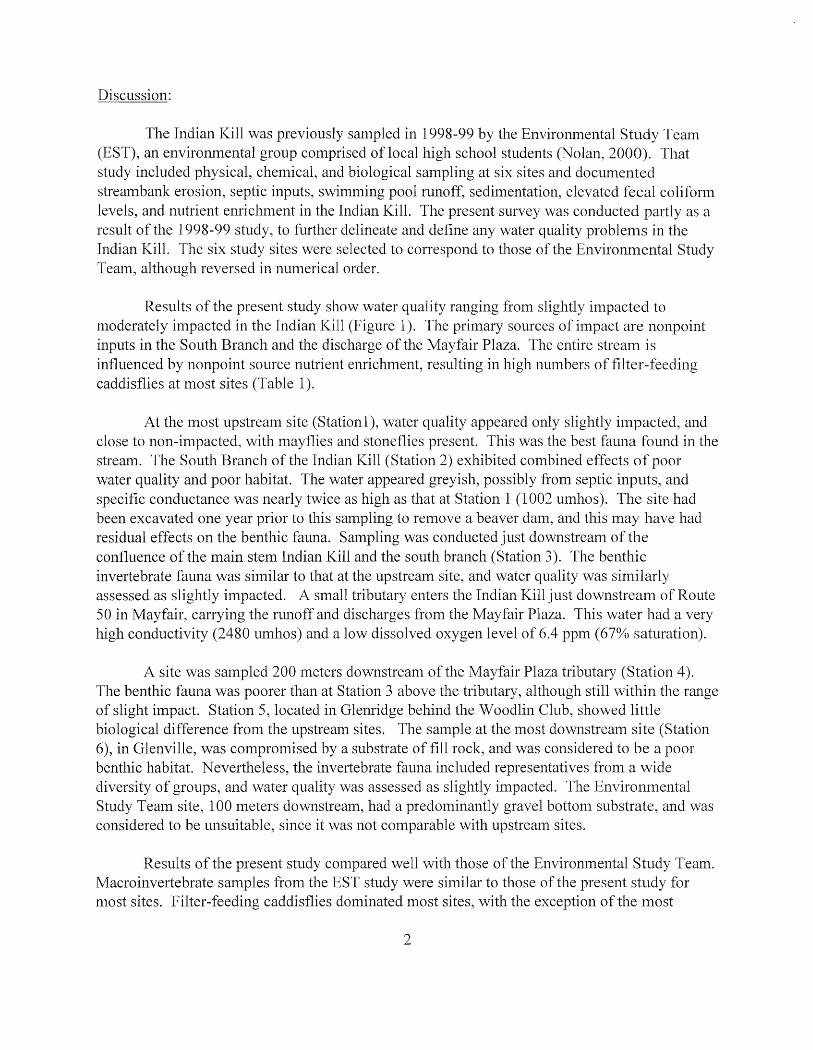
Table 1. Impact Source Determination……………………………………….…….. 6
Figure 2. Site Location Map….……………………………………………………. 7
Table 3. Macroinvertebrate Species Collected…………………………………….. 9
Macroinvertebrate data reports: raw data and site descriptions…….……………… 10
Laboratory data summary…………..………..…………………………………….. 16
Field data summary…………..…………………………………………………….. 18
Appendices (Click each for a link to an external document)……………………… 20
I. Biological methods for kick sampling
II. Macroinvertebrate community parameters
III. Levels of water quality impact in streams
IV. Biological Assessment Profile derivation
V. Water quality assessment criteria
VI. Traveling kick sample illustration
VII. Macroinvertebrate illustrations
VIII. Rationale for biological monitoring
IX. Glossary
X. Methods for Impact Source Determination
XI. Family level macroinvertebrate indices

Stream:
Reach:
Background:
Indian Kill, Schenectady County, New York
Mayfair to Glenville, New York
The Stream Biomonitoring Unit conducted biological sampling on the Indian Kill onAugust 29, 2000. The purpose of the sampling was to assess general water quality, determine thecause and extent of any water quality problems, and compare results to those of a previous studyby the Environmental Study Team. Traveling kick samples were taken in riffle areas at six sites,using methods described in the Quality Assurance document (Bode et al., 1996) and sumnlarizedin Appendix 1. The contents of each sample \vere field-inspected to deternline major groups oforganislns present, and then preserved in alcohol for laboratory inspection of a 100-specimensubsample. Water quality assessments were based on resident macroinvertebrates (aquaticinsects, worms, mollusks, crustaceans). Community paranleters used in the detennination ofwater quality included species richness, biotic index, EPT value, and percent Inodel affinity (seeAppendices II and III). Table 2 provides a listing of sampling sites, and Table 3 provides alisting of all nlacroinvertebrate species collected in the present survey. This is followed bymacroinvertebrate data reports, including individual site descriptions and raw invertebrate datafrom each site.
Appreciation is expressed to J. Kelly Nolan (Hudson Basin River Watch) and I(enKosinski (NYS DEC, Region 4) for their assistance in this survey.
Results and Conclusions:
1. Water quality in the Indian Kill ranged from slightly impacted to moderately impacted, and isconsidered good to poor. All sites on the Inain stem were assessed as having good water quality.
2. The South Branch of the Indian I(ill exhibited combined effects afpoor water quality andpoor habitat. Nonpoint source runoff and septic inputs are likely stressors in this tributary.
3. The discharge fronl the Mayfair Plaza had a negative ilnpact on the streanl, althoughdownstream water quality was still within the range of slightly iInpacted.
4. Macroinvertebrate sanlples were similar to those obtained by the Environmental Study Teanl.That study documented several examples of nonpoint source stressors in the basin that maynegatively affect water quality in the Indian I(ill.
1
Discussion:
The Indian Kill was previously sampled in 1998-99 by the Environmental Study Team(EST), an environmental group comprised of local high school students (Nolan, 2000). Thatstudy included physical, chemical, and biological sampling at six sites and documentedstreambank erosion, septic inputs, swimming pool runoff, sedimentation, elevated fecal coliformlevels, and nutrient enrichinent in the Indian Kill. The present survey was conducted partly as aresult of the 1998-99 study, to further delineate and define any water quality problems in theIndian Kill. The six study sites were selected to correspond to those of the Environmental StudyTeam, although reversed in numerical order.
Results of the present study show water quality ranging from slightly impacted tomoderately ilnpacted in the Indian Kill (Figure l). The priinary sources of impact are nonpointinputs in the South Branch and the discharge of the Mayfair Plaza. The entire stream isinfluenced by nonpoint source nutrient enrichment, resulting in high numbers of filter-feedingcaddisflies at most sites (Table l).
At the most upstream site (Stationl), water quality appeared only slightly impacted, andclose to non-ilnpacted, with mayflies and stoneflies present. This was the best fauna found in thestream. The South Branch of the Indian Kill (Station 2) exhibited combined effects of poorwater quality and poor habitat. The water appeared greyish, possibly froin septic inputs, andspecific conductance was nearly twice as high as that at Station 1 (1002 umhos). The site hadbeen excavated one year prior to this sampling to remove a beaver dam, and this may have hadresidual effects on the benthic fauna. Sampling was conducted just downstream of theconfluence of the main steIn Indian Kill and the south branch (Station 3). The benthicinvertebrate fauna was silnilar to that at the upstream site, and water quality was similarlyassessed as slightly inlpacted. A small tributary enters the Indian Kill just downstremn of Route50 in Mayfair, carrying the runoff and discharges froin the Mayfair Plaza. This water had a veryhigh conductivity (2480 lunhos) and a low dissolved oxygen level of 6.4 ppm (67% saturation).
A site was smnpled 200 Ineters downstremn of the Mayfair Plaza tributary (Station 4).The benthic fauna was poorer than at Station 3 above the tributary, although still within the rangeof slight impact. Station 5, located in Glenridge behind the Woodlin Club, showed littlebiological difference froin the upstream sites. The sample at the most downstream site (Station6), in Glenville, was cOlnpromised by a substrate of fill rock, and was considered to be a poorbenthic habitat. Nevertheless, the invertebrate fauna included representatives fronl a widediversity of groups, and water quality was assessed as slightly impacted. The EnvironinentalStudy Team site, laO Ineters downstremn, had a predominantly gravel bottOln substrate, and wasconsidered to be unsuitable, since it was not comparable with upstreanl sites.
Results of the present study cOlnpared well with those of the Environmental Study Team.Macroinvertebrate smnples froin the EST study were similar to those of the present study formost sites. Filter-feeding caddisflies dominated nl0st sites, with the exception of the 1110St
2

upstremn site, Station 1 (EST Station 5). Mayflies were Inost numerous at the upstream site inboth studies, and both studies identified this site as having the best water quality. Station 3 in thepresent study was upstream of the Mayfair Plaza discharge, while the EST site for this location(Station 4) was immediately downstrean1 of the discharge, in the plUlne, and showed greaterimpact. Using assessments of water quality derived frOln the 3 indices provided in the ESTstudy. water quality ranged from slightly impacted to moderately in1pacted, as in the presentstudy. Due to a lower level of taxonon1ic resolution, the EST study assessed n10st sites asmoderately impacted, while the present study assessed most sites as slightly iInpacted. Bothstudies identified nonpoint source inputs and the Mayfair Plaza discharge as the most importantstressors affecting the stream.
Recently developed index levels for family-level macroinvertebrate data are presented inAppendix XI. The four indices recommended are: fmnily richness, EPT fm11ily richness, familybiotic index, and percent model affinity. Applying these indices and the recon1mended levels tothe 1999 EST macroinvertebrate data, the Inost upstream site (EST-5) would be assessed as nonimpacted, the site immediately below the plaza discharge (EST-4) and the South Branch site(EST-6) would be assessed as moderately impacted, and all other sites would be assessed asslightly impacted. These index levels are recommended for future family-levelInacroinvertebrate studies.
The EST study, through a stream habitat walk, documented several features thatpotentially affect the water quality of the Indian Kill. These include: a stonnwater catchmentpond along Droms Road, a farn1 dUl11P near Droms Road, streambank erosion downstream ofIndian Meadows, recreational field runoff at Cypress Drive, discharge froln the Mayfair Plaza,erosion in the Indian I(ill Preserve, pool drainage frol11 the Woodlin Club pool, and an oilydrainage from the Woodlin Club (now ren1ediated). The fecal colifonn smnpling revealedelevated fecal coliform levels at all sites, and pointed to apparent septic problel11s in the upstrean1residential areas. Chelnical analysis of stonnwater showed elevated levels of nitrates andorthophosphates, pointing to runoff of pesticides and fertilizers. The EST study den10nstratedthe value of volunteer Inonitoring in conducting canvassing stream walks to provide the type ofcomprehensive coverage that is not furnished by a rapid bioassessment survey.
Literature Cited:
Bode, R. W., M. A. Novak, and L. E. Abele. 1996. Quality assurance work plan for biologicalstream monitoring in New York State. New York State Department of EnvironmentalConservation, Technical Report, 89 pages.
Nolan, 1. K. 2000. The Indian I(ill study. Environlnental Study Team report, Niskayuna, NY.30 pages. Report on website: http://indiankill.hon1e.att.net
3

6
Overview of field data
On the date of sampling, August 29, 2000, the Indian Kill at the sites sampled was 2-7 meters wide, 0.05-0.1 meters deep, and had current speeds of 66-100 cm/sec in riffles. Dissolved oxygen was 8.2-9.1 mg/l, specific conductance was 557-1025 /-μmhos, pH was 7.5-8.2, and the temperature was 16.0-18.5 °C (61-65 °F). Measurements for each site are found on the field data summary sheets.

Figure 1. Biological Assessment Profile of index values, Indian Kill, 2000. Values are plotted ona normalized scale of water quality. The line connects the mean of the four values for each site,representing species richness, EPT richness, HilsenhoffBiotic Index, and Percent Model Affinity.See Appendix IV for more complete explanation.
Inlian Kill 2000
o3
Miles from2 1 0 moah
1 2 3 4 5 6 ~ation
0 spp 0 hbi /). ept o pma -+- avg I
10
(1)--< 7.5rou
VJ.
.£..-.ro;:$ 5CJl-I(1)
"E$~
2.5
Q 0 nro
~ EjLJ
~-a Q r.:..-60 0 ¢.
•g 6 6
::l0::l
I
~VJ la...... (1)
ciCi' >-t::T D.....
~e.:3
......
.-+
0 '<:0.- ~
(l) S""l
~ "'0(l)
~v.>(l)
-<(l)""l(l)
4
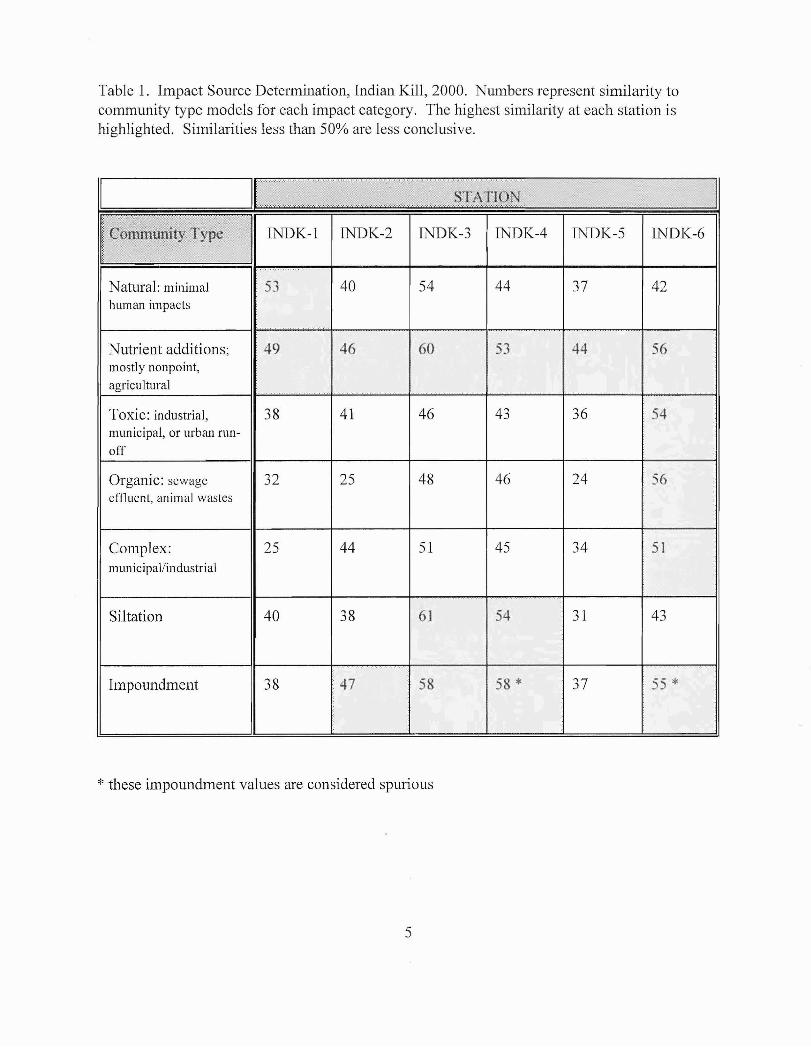
Table 1. Impact Source Determination, Indian Kill, 2000. Numbers represent similarity tocommunity type models for each impact category. The highest similarity at each station ishighlighted. Similarities less than 50% are less conclusive.
--------- ·.w··.······
...;i".,.,L.:..: &/:.,.: .....• ~..,:.:·: ..:~~;i1:r.,.C;+;:··.§ftA}:;~Q~L <
i,~T.
... "' ...; .......:.
Natural: minimalhuman impacts
Nutrient additions;mostly nonpoint,
agricultural
Toxic: industrial,municipal, or urban run
off
Organic: sewageeffluent, animal wastes
Complex:municipal/industrial
Siltation
Impoundment
INDK-l
53
49
38
32
25
40
38
INDK-2
40
46
41
25
44
38
47
INDK-3
54
60
46
48
51
6J
58
INDK-4
44
53
43
46
45
54
58 *
INDK-5
37
44
36
24
34
31
37
INDK-6
42
56
-4
56
51
43
55 '*
* these impoundment values are considered spurious
5

Figure 2
Source: Schenectadyand Burnt Hills quadsNYS DOT planimetric map
0.5
Site Location Map
1
7
Indian Kill

TABLE 2. STATION LOCATIONS FOR THE INDIAN KILL, SCHENECTADYCOUNTY, NEW YORK (see map).
STATION
01
02
03
04
05
06
8
LOCATION
Mayfair100 meters below footbridge at Hickory La.2.4 miles above the n10uthlatitude/longitude: 42°52'39"; 73°56'03"
Mayfair5 meters above Bigwood Rd bridge2.3 miles above the n10uthlatitudellongitude: 42°52'25"; 73°56'00"
Mayfair5 meters below Rte 50 bridge2.1 miles above the n10uthlatitude/longitude: 42°52'31"; 73°55'48"
Glenville200 meters below Mayfair Plaza trib,off Mayfair Rd2.0 luiles above the luouthlatitude/longitude: 42°52'32"; 73°55'41"
Glenridgebehind Woodlin Club1.2 miles above the mouthlatitude/longitude: 42°52'32"; 73°55'03"
Glenvilleabove culvert at Maple Ave0.3 miles above the mouthlatitude/longitude: 42°52' 13"; 73°54'23"

TABLE 3. MACROINVERTEBRATE SPECIES COLLECTED IN INDIAN KILL,SCHENECTADY COUNTY, NEW YORK, 2000.
ANNELIDAOLIGOCHAETA
TubificidaeUndet. Tubificidae w/o cap. setae
ARTHROPODACRUSTACEA
ISOPODAAsellidae
Caecidotea racovitzaiAMPHIPODAGammaridae
Gammarus sp.DIPLOPODA
POLYDESMIDAUndetermined Polydesmida
INSECTAEPHEMEROPTERA
BaetidaeAcentrella sp.Baetis brunneicolorBaetis flavistriga
HeptageniidaeLeucrocuta sp.
ODONATAGomphidae
Undetermined GomphidaePLECOPTERA
PerlidaeAcroneuria carolinensis
COLEOPTERAPsephenidae
Ectopria nervosaPsephenus herricki
ElmidaeOptioservus fastiditusOptioservus sp.Stenelmis crenata
MEGALOPTERACorydalidae
Nigronia serricornisTRICHOPTERA
PhilopotamidaeChimarra aterrima?Dolophilodes sp.
HydropsychidaeCheumatopsyche sp.Hydropsyche betteniHydropsyche slossonae
9
DIPTERATipulidae
Dicranota sp.Hexatoma sp.Tipula sp.
CeratopogonidaeUndetermined Ceratopogonidae
SimuliidaeSimulium venustumSimulium sp.
AthericidaeAtherix sp.
EmpididaeHemerodromia sp.
ChironomidaeTanypodinae
Thienemannimyia gr. spp.Diamesinae
Diamesa sp.Pagastia sp. A
OrthocladiinaeBrillia f1avifronsCardiocladius obscurusCricotopus bicinctusEukiefferiella claripennis gr.Eukiefferiella devonica gr.Parachaetocladius sp.Parametriocnemus lundbeckiRheocricotopus robackiTvetenia bavarica gr.Tvetenia vitracies
Chironom inaeChironomini
Phaenopsectra flavipesPolypedilum avicepsPolypedilum convictumPolypedilum illinoense
TanytarsiniMicropsectra dives gr.Micropsectra sp.Rheotanytarsus distinctissimus gr.Rheotanytarsus exiguus gr.Tanytarsus glabrescens gr.

STREAM SITE:LOCATION:DATE:SAMPLE TYPE:SUBSAMPLE:
ARTHROPODAINSECTAEPHEMEROPTERA
ODONATACOLEOPTERA
MEGALOPTERATRICHOPTERA
DIPTERA
SPECIES RICHNESSBIOTIC INDEXEPT RICHNESSMODEL AFFINITYASSESSlVIENT
DESCRIPTION
Indian Kill, Station IMayfair, Hickory Lane29 August 2000Kick sample100 individuals
Baetidae Acentrella sp. IBaetis brunneicolor 5Baetis flavistriga 9
Heptageniidae Leucrocuta sp. 2Gomphidae Undetermined Gomphidae 1Psephenidae Ectopria nervosa 2
Psephenus herricki 6Elmidae Stenelmis crenata 8Corydalidae Nigronia serricornis 1Philopotamidae Chimarra aterrima? 3
Dolophilodes sp. 1Hydropsychidae Cheumatopsyche sp. 4
Hydropsyche betteni 1Tipulidae Dicranota sp. 2
Hexatoma sp. 3Tipula sp. 2
Chironomidae Thienemannimyia gr. spp. 8Cricotopus bicinctus 1Eukiefferiella devonica gr. 2Parachaetocladius sp. 12Parametriocnemus lundbecki 9Rheocricotopus robacki 1Polypedilum aviceps 12Micropsectra dives gr. 2Rheotanytarsus exiguus gr . 1Tanytarsus glabrescens gr. ]
26 (good)4.13 (very good)8 (good)65 (very good)slightly impacted
This site was accessed through the residence yard of 11 Hickory Lane in Mayfair. Three shortrifne sections were sampled 100 meters downstream of a footbridge. A diverse fauna wasfound, including mayflies, stoneflies, caddisflies, and hellgrammites. Index values placed theassessment as slightly impacted, although near the high end of that category, near nonimpacted.
10

STREAM SITE:LOCATION:DATE:SAMPLE TYPE:SUBSAMPLE:
ARTHROPODACRUSTACEA
ISOPODAAMPHIPODA
DIPLOPODAPOLYDESMIDA
INSECTAEPHEMEROPTERACOLEOPTERATRICHOPTERA
OIPTERA
Indian Kill, South Branch, Station 2Mayfair, Bigwood Rd.29 August 2000Kick sample100 individuals
AsellidaeGammaridae
BaetidaeElmidaePhilopotamidaeHydropsychidae
SimuliidaeEmpididaeChironomidae
Caecidotea racovitzai 3Gammarus sp. 28
Undetermined Polydesmida
Baetis brunneicolor 3Optioservus sp. 1Dolophilodes sp.. IICheumatopsyche sp. 14Hydropsyche betteni 8Simulium venustum 6Hemerodromia sp. 2Diamesa sp. 10Eukiefferiella claripennis gr. 1Parametriocnemus lundbecki 2Polypedilum aviceps 10
SPECIES RICHNESS 14 (poor)BIOTIC INDEX 4.82 (good)EPT RICHNESS 4 (poor)MODEL AFFINITY 44 (poor)ASSESSMENT moderately impacted
DESCRIPTION This site was on the South Branch of the Indian Kill. The site had been excavated by backhoe 11months prior to sampling, and this may have affected the fauna somewhat. Additionally, thesubstrate included a large percentage of sand and gravel. The fauna was poorer than that at Station1, dominated by scuds. The water appeared slightly gray, pointing to possible sewage inputs.Based on the invertebrate indices, water quality was assessed as moderately impacted.
11

STREAM SITE:LOCATION:DATE:SAMPLE TYPE:SUBSAMPLE:
Indian Kill, Station 3Mayfair, Route 5029 August 2000Kick sample100 individuals
ARTHROPODACRUSTACEA
AMPHIPODAINSECTA
EPHEMEROPTERA
Gammaridae
Baetidae
Gammarus sp.
Baetis brunneicolor 9ODONATAPLECOPTERACOLEOPTERA
TRICHOPTERA
DIPTERA
SPECIES RICHNESSBIOTIC INDEXEPT RICHNESSMODEL AFFINITYASSESSMENT
GomphidaePerlidaeElmidae
PhilopotamidaeHydropsychidae
TipulidaeCeratopogonidaeSimuliidaeChironomidae
25 (good)4.70 (good)6 (good)62 (good)slightly impacted
Baetis flavistriga 1Undetermined Gomphidae 1Acroneuria carolinensis 2Optioservus sp. 2Stene1mis crenata 14Chimarra aterrima? 1Cheumatopsyche sp.. 16Hydropsyche betteni 12Dicranota sp. 2Undetermined Ceratopogonidae 1Simulium sp. 6Thienemannimyia gr. spp. 1Diamesa sp. 2Pagastia sp. ACricotopus bicinctusParachaetocladius sp. 3Parametriocnemus lundbecki 5Tvetenia bavarica gr. 4PolypediIum aviceps 9Polypedilum convictum 1Polypedilum illinoense ]Micropsectra dives gr. 1Rheotanytarsus exiguus gr. 3
DESCRIPTION This site was just downstream of the Route 50 bridge. It was downstream of a pondedarea, and of the confluence of the South Branch and main stem. All indices were withinthe range of slightly impacted water quality. While the upstream pond may have exertedsome influence on the invertebrate fauna at this site, the community also reflectsinfluences of both main stem and South Branch water quality.
12
STREAM SITE:LOCATION:DATE:SAMPLE TYPE:SUBSAMPLE:
ARTHROPODACRUSTACEA
ISOPODAAMPHIPODAPLECOPTERACOLEOPTERA
TRICHOPTERA
DIPTERA
SPECIES RICHNESSBIOTIC INDEXEPT RICHNESSMODEL AFFINITYASSESSMENT
Indian Kill, Station 4Glenville, off Maybrook Rd29 August 2000Kick sample100 individuals
AsellidaeGammaridaePerlidaePsephenidaeElmidae
PhilopotamidaeHydropsychidae
Tipulidae
SimuliidaeEmpididaeChironomidae
23 (good)4.54 (good)4 (poor)51 (good)slightly impacted
Caecidotea racovitzaiGammarus sp.Acroneuria carolinensisPsephenus herrickiOptioservus sp.Stenelmis crenataDolophilodes sp.Cheumatopsyche sp.Hydropsyche betteniDicranota sp.Hexatoma sp.Tipula sp.Simulium sp.Hemerodromia sp.Thienemannimyia gr. spp.Diamesa sp.Bri Ilia tlavifronsParachaetocladius sp.Parametriocnemus lundbeckiTvetenia bavarica gr.Polypedilum avicepsPolypedilum illinoenseMicropsectra sp.
I]
111
116
1614813711115
]2
1322
DESCRIPTION The sampling site was approximately 200 meters downstream of the input of thedischarge from the Mayfair shopping plaza. The fauna was dominated by filter-feedingcaddistlies, although maytlies and stoneflies were also present. Based on the invertebrateindices, water quality was assessed as slightly impacted.
13

STREAM SITE:LOCATION:DATE:SAMPLE TYPE:SUBSAMPLE:
ARTHROPODACRUSTACEA
ISOPODAAMPHIPODA
INSECTAPLECOPTERACOLEOPTERA
MEGALOPTERATRICHOPTERA
DIPTERA
SPECIES RICHNESSBIOTIC INDEXEPT RICHNESSMODEL AFFINITYASSESSlVIENT
Indian Kill, Station 5Glenville, Woodlin Club29 August 2000Kick sample100 individuals
AsellidaeGammaridae
PerlidaePsephenidaeElmidae
CorydalidaePhilopotamidaeHydropsychidae
TipulidaeAthericidaeEmpididaeChironomidae
23 (good)3.98 (very good)4 (poor)52 (good)slightly impacted
Caecidotea racovitzai 1Gammarus sp. 9
Acroneuria carolinensis 2Psephenus herricki 2Optioservus sp.. 5Stenelmis crenata 3Nigronia serricornis 1Dolophilodes sp.. 10Cheumatopsyche sp. 2Hydropsyche s]ossonae 13Dicranota sp. 15Atherix sp. 2Hemerodromia sp. 1Thienemannimyia gr. spp. 2Diamesa sp. 5Cardiocladius obscurLls 1Eukiefferiella devonica gr. 1Parametriocnemus lundbecki 17Tvetenia bavarica gr. 3Tvetenia vitracies 1Micropsectra sp. 1Rheotanytarsus distinctissimus gr. 1Rheotanytarsus exiguus gr. 2
DESCRIPTION The site was accessed downstream of the Woodlin Swim Club in Glenridge. Bedrockdominated the stream bottom, but an area of adequate substrate was found. The faunawas diverse, with mayflies, stoneflies, caddisflies, and hellgrammites. Based on theindices, water quality was assessed as slightly impacted.
14

STREAM SITE:LOCATION:DATE:SAMPLE TYPE:SUBSAMPLE:
ARTHROPODACRUSTACEA
ISOPODAAMPHIPODA
INSECTAPLECOPTERACOLEOPTERA
MEGALOPTERATRICHOPTERA
DIPTERA
SPECIES RICHNESSBIOTIC INDEXEPT RICHNESSMODEL AFFINITYASSESSMENT
DESCRIPTION
Indian Kill, Station 6Glenville, Maple Ave29 August 2000Kick sample100 individuals
Asellidae Caecidotea racovitzai 1Gammaridae Gammarus sp. 9
Perlidae Acroneuria carolinensis 2Psephenidae Psephenus herricki 2Elmidae Optioservus sp. 5
Stenelmis crenata,..,j
Corydalidae Nigronia serricornis 1Philopotamidae Dolophilodes sp. 10Hydropsychidae Cheumatopsyche sp. 2
Hydropsyche slossonae 13Tipulidae Dicranota sp. 15Athericidae Atherix sp. 2Empididae Hemerodromia sp. 1Chironomidae Thienemannimyia gr. spp. 2
Diamesa sp. 5Cardioc1adius obscurus ]
Eukiefferiella devonica gr. 1Parametriocnemus lundbecki 17Tvetenia bavarica gr. 3Tvetenia vitracies 1Micropsectra sp. 1Rheotanytarsus distinctissimus gr. 1Rheotanytarsus exiguus gr. 2
22 (good)4.38 (very good)6 (good)51 (good)slightly impacted
The kick sample was taken immediately upstream of the culvert at Maple Avenue. Thesubstrate was composed of angular fill rock, with very little sand or gravel.Nevertheless, the invertebrate fauna contained mayflies, stoneflies, caddisflies, andhellgrammites, similar to the upstream site. Water quality was similarly assessed asslightly impacted.
15
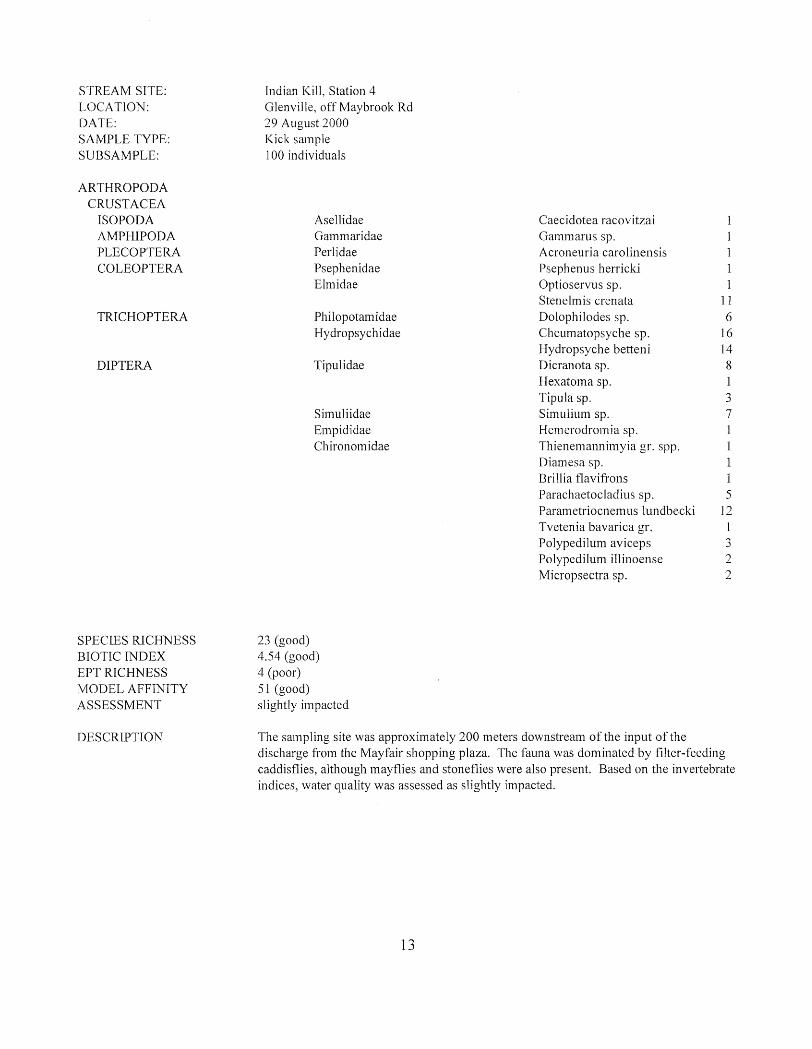
LABORATORY DATA SUMMARY
~IKI!.AIVJ l~A1VII!.: 1n00an KIll UKAll~ALJI!;: I~
DATE SAMPLED: 08/29/00 COUNTY: SchenectadySAMPLING METHOD: Traveling Kick
~l A IIU1~ Vl VL u-' Vq
LOCATION Hickory Lane (South Branch) Route 50 Maybrook Rd.n' Road
DOMINANT SPEClES/°Ic,CONTRTBUTION/TOLERANCE/COMMON NAMEI. Parachaetoclad ius Gammarus sp. Cheumatopsyche Cheumatopsyche
sp. sp. sp.12% 28% 16% 16%intolerant facultative facultative facultativemidge scud caddisfly caddistly
2. Polypedilum Cheumatopsyche Stenelm is crenata Hydropsycheaviceps sp. betteni
Intolerant = not tolerant of poor 12% 14% 14% 14 %water quality facultative facultative facultative facultative
midge caddisfly beetle caddistly
" Baetis flavistriga Dolophilodes sp. Hyciropsyche Paramctriocnclllus-'.betteni lundbccki
Facultative = occurring over a 9% II % 12% 12%wide range of water quality intolerant intolerant facultative facultative
mayfly cacldisfly caddisfly 111 idge4. Paramctriocncmus Diamesa sp. Baetis Stenelmis crenata
lundbccki brunneicolor
Tolerant = tolerant of poor 9% 10% 9% 11%water quality facultative facultative intolerant facu ltative
midge midge mayfly beetle5. Stenelmis crenata Polypedilum PoJypedilum Dicranota sp.
aviceps aviceps8% 10% 9% 8%facu Itative facultative facultative intoJerantbeetle 111 idge midge crane fly
V/o LUI~ I. KltlU I lUl~ ut' -'"' ~l~~ ut' I. AAf\. Il~ t' l' K"'l~ ~ '"')
Chironomidae (midges) 49(10) 23 (4) 32 (12) 28 (9)Trichoptera (caddisflies) 9 (4) 33 (3) 29 (3) 36 (3)Ephemeroptera (mayflies) 17(4) 3 (1) 10(2) 0(0)Plecoptera (stoneflies) 0(0) 0(0) 2 (1) 1 (I)Coleoptera (beetles) 16 (3) 1 (1) 16 (2) J3 (3)
Oligochaeta (worms) 0(0) 0(0) 0(0) 0(0)Other 9 (5) 40 (5) 11 (5) 22(7)
SPECIES RICHNESS 26 14 25 23BIOTIC INDEX 4.13 4.82 4.70 4.54EPT RICHNESS 8 4 6 4PERCENT MODEL AFFINITY 65 44 62 51
t'lJ!,LU "" 1 very gooa gooa very gooa very gooa
OVERALL ASSESSMENT slightly impacted moderately imp. slightly impacted slightly impacted
16

LABORATORY DATA SUl\1MARYSTREAM NAME: Indian Kill DRAINAGE: 12DATE SAMPLED: 08/29/00 COUNTY: SchenectadySAMPLING METHOD: Traveling Kick
STATION 05 06
LOCATION Woodlin Club Maple Avenue
DOMINANT SPECIES/%CONTRIBUTION/TOLERANCE/COl\1MON NAME1. Parametriocnemus Cheumatopsyche
lundbecki sp.17% 24%facultative facultativemidge caddisfly
2. Dicranota sp. Stenelmis crenataIntolerant = not tolerant of poor 15 % 15 %
water quality intolerant facultativecrane fly beetle
3. Hydropsyche Nigroniaslossonae serricornis
Facultative = occurring over a 13 % 9%
wide range of water quality intolerant intolerantcaddisfly dobsonfly
4. Dolophilodes sp. Hydropsycheslossonae
Tolerant = tolerant of poor water 10% 9%
quality intolerant intolerantcaddisfly caddisfly
5. Gammarus sp. Simulium sp.
9% 8%
facultative facultativescud black fly
0A, CONTRIBUTION OF MAJOR GROUPS NUMBER OF TAXA IN PARENTHESES)Chironomidae (midges) 34 (10) 15 (8)
Trichoptera (caddisflies) 25 (3) 37 (4)
Ephemeroptera (mayflies) 0(0) 3 (1)
Plecoptera (stoneflies) 2 (1) 2 (1)
Coleoptera (beetles) 10 (3) 19 (3)
Oligochaeta (worms) 0(0) 1 (1)
Other 29 (6) 23 (4)
SPECIES RICHNESS 23 22BIOTIC INDEX 3.98 4.38EPT RICHNESS 4 6PERCENT MODEL AFFINITY 52 51FIELD ASSESSMENT very good very goodOVERALL ASSESSMENT slightly impacted slightly impacted
17

FIELD DATA SUMMARY
STKEA1Vil~A1ViE:indian Kill DATE SAMPLED: 08/29/00
REACH: Mayfair to GlenvilleFIELD PERSONNEL INVOLVED:Abele, Bode, NovakSTATiUN 01 02 U3 U4
ARRIVAL TIME AT STATION 10:10 10:50 11:30 11 :55
LOCATION Hickory Lane Bigwood Rd. Rt. 50 off Maybrook Rd.
rut' ~ILAL LUAKAL 1 J!.,lH~ llL~
Width (meters) 2 2 4 7Depth (meters) 0.1 0.1 0.1 0.1Current speed (cm per sec.) 80 90 77 77Substrate (%)
Rock (>25.4 cm, or bedrock) 10 10 10Rubble (6.35 - 25.4 cm) 30 20 40 40Gravel (0.2 - 6.35 cm) 30 40 20 20Sand (0.06 - 2.0 mm) 20 30 10 10Silt (0.004 - 0.06 mm) 10 10 20 20
Clay « 0.004 mm)
Embeddedness (%) 40 30 20 -CHEMICAL MEASUREMENTS
Temperature eC) 17.8 16.0 18.2 18.0Specific Conductance (umhos) 557 1002 917 1025
Dissolved Oxygen (mg/l) 8.7 8.4 8.9 8.2
pH 7.5 7.9 7.9 7.9
BIOLOGICAL ATTRIBUTES
Canopy (%) 80 90 80 90Aquatic Vegetation
algae - suspended
algae - attached, filamentous
algae - diatoms present
macrophytes or moss
Occurrence of Macroinvertebrates
Ephemeroptera (mayflies) X X X X
Plecoptera (stoneflies) X X X
Trichoptera (caddisflies) X X X
Coleoptera (beetles) X X X
Megaloptera(dobsonflies,alderflies)
Odonata (dragonflies, damselflies) X XChironomidae (midges) X X X XSimuliidae (black flies) X
Decapoda (crayfish) X X
Gammaridae (scuds) X X XMollusca (snails, clams)
Oligochaeta (worms)
Other X
FIELD ASSESSMENT very good good very good very good
18

FIELD DATA SUMMARY
~ 1 KEA1Vl1"lANlE: lll<lIan KIlt UAIE ISA1VIPLEU: UO/",,:';lfUU
REACH: Mayfair to GlenvilleFIELD PERSONNEL INVOLVED:Abele, Bode, Novak
~TATIUN U5 U6
ARRIVAL TIME AT STATION 12:30 1:10
LUCATION Woodlin Club Maple Ave.
X
X
X
X
X
X
X
X
X
xX
X
X
7 5
0.1 0.1
100 66
10 20
40 50
20
10 10
20 20
30 30
18.2 18.5
959 956
9.6 9.1
8.2 8.1
90 50
CHEMICAL MEASUREMENTS
Temperature eC)
Specific Conductance (umhos)
Dissolved Oxygen (mg/I)
pH
BIOLOGICAL ATTRIBUTES
Canopy (%)
Aquatic Vegetation
algae - suspended
algae - attached, filamentous
algae - diatoms
macrophytes or moss
Occurrence of Macroinvertebrates
Ephemeroptera (mayflies)
Plecoptera (stoneflies)
Trichoptera (caddisflies)
Coleoptera (beetles)
Megaloptera(dobsonflies,alderflies)
Odonata (dragonflies, damselflies)
Chironomidae (midges)
Simuliidae (black flies)
Decapoda (crayfish)
Gammaridae (scuds)
Mollusca (snails, clams)
Oligochaeta (worms)
Other
ytl I 1SlLAL LtlAKAL 1 ~Kl1S llL1S
Width (meters)
Depth (meters)
Current speed (em per sec.)
Substrate (%)
Rock (>25.4 em, or bedrock)
Rubble (6.35 - 25.4 em)
Gravel (0.2 - 6.35 em)
Sand (0.06 - 2.0 mm)
Silt (0.004 - 0.06 mm)
Clay « 0.004 mm)
Embeddedness (%)
FIELD ASSESSMENT very good very good
19

BIOLOGICAL METHODS FOR KICK SAMPLING A. Rationale. The use of the standardized kick sampling method provides a biological assessment technique that lends itself to rapid assessments of stream water quality. B. Site Selection. Sampling sites are selected based on these criteria: (1) The sampling location should be a riffle with a substrate of rubble, gravel, and sand. Depth should be one meter or less, and current speed should be at least 0.4 meters per second. (2) The site should have comparable current speed, substrate type, embeddedness, and canopy cover to both upstream and downstream sites to the degree possible. (3) Sites are chosen to have a safe and convenient access. C. Sampling. Macroinvertebrates are sampled using the standardized traveling kick method. An aquatic net is positioned in the water at arms' length downstream and the stream bottom is disturbed by foot, so that the dislodged organisms are carried into the net. Sampling is continued for a specified time and for a specified distance in the stream. Rapid assessment sampling specifies sampling five minutes for a distance of five meters. The net contents are emptied into a pan of stream water. The contents are then examined, and the major groups of organisms are recorded, usually on the ordinal level (e.g., stoneflies, mayflies, caddisflies). Larger rocks, sticks, and plants may be removed from the sample if organisms are first removed from them. The contents of the pan are poured into a U.S. No. 30 sieve and transferred to a quart jar. The sample is then preserved by adding 95% ethyl alcohol. D. Sample Sorting and Subsampling. In the laboratory the sample is rinsed with tap water in a U.S. No. 40 standard sieve to remove any fine particles left in the residues from field sieving. The sample is transferred to an enamel pan and distributed homogeneously over the bottom of the pan. A small amount of the sample is randomly removed with a spatula, rinsed with water, and placed in a petri dish. This portion is examined under a dissecting stereo microscope and 100 organisms are randomly removed from the debris. As they are removed, they are sorted into major groups, placed in vials containing 70 percent alcohol, and counted. The total number of organisms in the sample is estimated by weighing the residue from the picked subsample and determining its proportion of the total sample weight. E. Organism Identification. All organisms are identified to the species level whenever possible. Chironomids and oligochaetes are slide-mounted and viewed through a compound microscope; most other organisms are identified as whole specimens using a dissecting stereomicroscope. The number of individuals in each species, and the total number of individuals in the subsample is recorded on a data sheet. All organisms from the subsample are archived (either slide-mounted or preserved in alcohol). If the results of the identification process are ambiguous, suspected of being spurious, or do not yield a clear water quality assessment, additional subsampling may be required.

MACROINVERTEBRATE COMMUNITY PARAMETERS
1. Species richness is the total number of species or taxa found in the sample. For subsamples of 100-organisms each that are taken from kick samples, expected ranges in most New York State streams are: greater than 26, non-impacted; 19-26, slightly impacted; 11 - 18, moderately impacted; less than 11, severely impacted. 2. EPT Richness denotes the total number of species of mayflies (Ephemeroptera), stoneflies (Plecoptera), and caddisflies (Trichoptera) found in an average 100-organism subsample. These are considered to be mostly clean-water organisms, and their presence generally is correlated with good water quality (Lenat, 1987). Expected ranges from most streams in New York State are: greater than 10, non-impacted; 6- 10 slightly impacted; 2-5, moderately impacted; and 0- 1, severely impacted. 3. Hilsnhoff Biotic index is a measure of the tolerance of the organisms in the sample to organic pollution (sewage effluent, animal wastes) and low dissolved oxygen levels. It is calculated by multiplying the number of individuals of each species by its assigned tolerance value, summing these products, and dividing by the total number of individuals. On a 0-10 scale, tolerance values range from intolerant (0) to tolerant (10). For purposes of characterizing species' tolerance, intolerant = 0-4, facultative = 5-7, and tolerant = 8-10. Values are listed in Hilsenhoff (1987); additional values are assigned by the NYS Stream Biomonitoring Unit. The most recent values for each species are listed in the Quality Assurance document (Bode et al., 1996). Ranges for the levels of impact are: 0-4.50, non-impacted; 4.5 1-6.50, slightly impacted; 6.5 1-8.50, moderately impacted; and 8.51 - 10.00, severely impacted. 4. Percent Model Affinity is a measure of similarity to a model non-impacted community based on percent abundance in seven major macroinvertebrate groups (Novak and Bode, 1992). Percent abundances in the model community are 40% Ephemeroptera, 5% Plecoptera, 10% Trichoptera, 10% Coleoptera, 20% Chironomidae, 5% Oligochaeta, and 10% Other. Impact ranges are: greater than 64, non-impacted; 50-64, slightly impacted; 35-49, moderately impacted; and less than 35, severely impacted. ______________________________________________________________________________ Bode, R.W., M.A. Novak, and L.E. Abele. 1996. Quality assurance work plan for biological
stream monitoring in New York State. NY S DEC technical report, 89 pp. Hilsenhoff, W. L. 1987. An improved biotic index of organic stream pollution. The Great Lakes
Entomologist 20(1): 31-39. Lenat, D. R. 1987. Water quality assessment using a new qualitative collection method for
freshwater benthic macroinvertebrates. North Carolina DEM Tech. Report. 12 pp. Novak, M.A., and R. W. Bode. 1992. Percent model affinity: a new measure of macroinvertebrate
community composition. J. N. Am. Benthol. Soc. 11(1):80-85.

LEVELS OF WATER QUALITY IMPACT IN STREAMS
The description of overall stream water quality based on biological parameters uses a four-tiered
system of classification. Level of impact is assessed for each individual parameter, and then combined for all parameters to form a consensus determination. Four parameters are used: species richness, EPT richness, biotic index, and percent model affinity (see Macroinvertebrate Community Parameters Appendix). The consensus is based on the determination of the majority of the parameters. Since parameters measure different aspects of the macroinvertebrate community, they cannot be expected to always form unanimous assessments. The assessment ranges given for each parameter are based on subsamples of 100-organism each that are taken from macroinvertebrate riffle kick samples. These assessments also apply to most multiplate samples, with the exception of percent model affinity. 1. Non-impacted Indices reflect very good water quality. The macroinvertebrate community is diverse, usually with at least 27 species in riffle habitats. Mayflies, stoneflies, and caddisflies are well-represented; EPT richness is greater than 10. The biotic index value is 4.50 or less. Percent model affinity is greater than 64. Water quality should not be limiting to fish survival or propagation. This level of water quality includes both pristine habitats and those receiving discharges which minimally alter the biota. 2. Slightly impacted Indices reflect good water quality. The macroinvertebrate community is slightly but significantly altered from the pristine state. Species richness usually is 19-26. Mayflies and stoneflies may be restricted, with EPT richness values of 6-10. The biotic index value is 4.51-6.50. Percent model affinity is 50-64. Water quality is usually not limiting to fish survival, but may be limiting to fish propagation. 3. Moderately impacted Indices reflect poor water quality. The macroinvertebrate community is altered to a large degree from the pristine state. Species richness usually is 11-18 species. Mayflies and stoneflies are rare or absent, and caddisflies are often restricted; the EPT richness is 2-5. The biotic index value is 6.51- 8.50. The percent model affinity value is 35-49. Water quality often is limiting to fish propagation, but usually not to fish survival. 4. Severely impacted Indices reflect very poor water quality. The macroinvertebrate community is limited to a few tolerant species. Species richness is 10 or less. Mayflies, stoneflies, and caddisflies are rare or absent; EPT richness is 0-1. The biotic index value is greater than 8.50. Percent model affinity is less than 35. The dominant species are almost all tolerant, and are usually midges and worms. Often 1-2 species are very abundant. Water quality is often limiting to both fish propagation and fish survival.

Biological Assessment Profile: Conversion of Index values to Common 10-Scale
The Biological Assessment Profile of index values, developed by Phil O'Brien, Division of Water,NYSDEC, is a method of plotting biological index values on a common scale of water-quality impact.Values from the four indices, defined in the Macroinvertebrate Community Parameter Appendix, areconverted to a common 0-10 scale using the formulae in the Quality Assurance document (Bode, etal., 2002) and as shown in the figure below.
spp HBI EFT PMA
10 1'\ '"' IOn,,, on
..... vv
2.50 14 85
3.00 13 80
30(j)
3.50 75 ~
12 0~
4.00 11 70
65 ~
~ 7.5 450 10 U--<~ 25 5.00 60 ~<C 9~U ......
[/). 5.50 8 ...c: ~
~ 553 ~
t-< v:J~
~ 20 6.00 7~
~. ~<C 6 50 --<::J
5 6.50 ~a 0~ 7.00
5~ 45 (j) ~t-< 4 ~ ~<C 7.50
l-<~15 (j)
~""d --<3 0
40 S ~8.00 2
2.5 8~O35
10
9.00 30(j)l-<(j)
>-(j)C/)
9.50 25
0 1n nnv LV

Biological Assessment Profile: Plotting Values
To plot survey data:1. Position each site on the x-axis according to miles or tenths of a mile upstream of the mouth.2. Plot the values of the four indices for each site as indicated by the common scale.3. Calculate the mean of the four values and plot the result. This represents the assessed impact for
each site.
Example data:
""''', , :'
',r_ ; Station I "c,i,,' ~' Station 2
; '" ,
metric value 1O-scale value metric value 10-scale value
.Species richness 20 5.59 33 9.44
. HiIsenhoff biotic index 5.00 7.40 4.00 8.00
EPT richness 9 6.80 13 9.00/'..,: ';/,
Percent model affinity 55 5.97 65 7.60,ct ,..~. f: ,,' , c'
\ .,>< .".,' " ",' .i'.;·".,.; , ,
.Average"'" . ' 6.44 (slight) 8.51 (non-)
Table IV-B. Sample Plot of Biological Assessment Profile values
Sample Plot of Biological Assessment Profile Values
10
so0-~
f---------------.-----.--------- ~
oA
1--- • -~---t------~
~ 7.5u
if)
C......-g 5CIl-<
~ro~ 2.5
o4 3 2
00(1)<:@
Miles from
o mouth
II _ 2 Station
I 0 spp • hbi A ept • pma --- avg I_~==~-------.J

Appendix V. Water Quality Assessment Criteria
Water Quality Assessment Criteria for Non-Navigable Flowing Waters
Species Hilsenhoff EPT Percent SpeciesRichness Biotic Index Richness Model Diversity'"
AffinitV#
Non- >26 0.00-4.50 >10 >64 >4Impacted
Slightly 19-26 4.51-6.50 6-10 50-64 3.01-4.00Impacted
Moderately 11-18 6.51-8.50 2-5 35-49 2.01-3.00Impacted
Severely 0-10 8.51-10.00 0-1 <35 0.00-2.00Impacted
# Percent model affinity criteria are used for traveling kick samples but not for multiplate samples.* Diversity criteria are used for multiplate samples but not for traveling kick samples.
Water Quality Assessment Criteria for Navigable Flowing Waters
Species Hilsenhoff EPT SpeciesRichness Biotic Richness Diversity
Index
Non- >21 0.00-7.00 >5 >3.00Impacted
Slightly 17-21 7.01-8.00 4-5 2.51-3.00Impacted
Moderately 12-16 8.01-9.00 2-3 2.01-2.50Impacted
Severely 0-11 9.01-10.00 0-1 0.00-2.00Impacted
31

Appendix VI.
THE TRAVELING KICK SAMPLE
,I"~"~-..-r.',-' ~- .,,~
I
.. CURRENT ---
Rocks and sediment in the stream riffle are dislodged by footupstream of a net; dislodged organisms are carried by thecurrent In the net. Sampling Is continued for a specified lime,gradually moving downstream to cover a specified distance.
H TR
ppe d'- VI.
PlE
...- CURRE T ._-~
Rocks and sedimen. in he stream rrme are disrodged by foo,ups .earn of a net; dislodged: organisms are carried by thecurrent in the net Sampling Is continued for a specified time.graduaUy moving downstream to cover a specified dlstance.
22

APPE DIX VIT. A.
AQUATTCMACROWVER BRA' 'S 'HA ,US A YINDICAT,'GOODWATER QUALITY
'Tllylly nymph, are nften the most Ol.lmerou organi m:e:oundin clean streams. They are sensitive to mmH types of pollution,including tow dissolved oxygen (less than 5 ppm), chlorine,ammonia metals, pesticides. and acidity. Most mayflies i.tre
fOUIld clinging w lhe undersille.s uf ruck '.
,':11 L 'I lI.'ny nymphs are 1ll0'SUy limited to cool, well-oxygemnedstreams. They are ~n. itive to mn~t of the S.D.me pollutant!> all
mayflies, except acidity. They are usually much less numerousthan mayllie~. The presence or ev,en a few slunel1ieB in a streamsuggcst8 that good water quality has bccn malntainedfor several months.
(" \I Jd l Ilv larvae otten build 3 portable case of , and. ~I\r.one.~,
sticks l or mher debris. Many caddisfly larvae are sensitive topollution. aHhough a few are to]eranL. One famU spins nets (0
cal<.;h drifling plankLon and is often nUIUcmm, in nutrientenriched sHearn segments.
The mo 'l comIIlon 11 ·Llll".. InSlrcams arc rlme beetles andwater pennies. 0, t of the erequire a swi f'[ current nnd anadequate supply of oxygen, andare generally considered cleanwiiter lmIi<.:ator '.
2

.RT p
I bele N wok 'p'1.l1m nrvtiOD S[f am Diom nirul nil.

THE RATIONALE OF BIOLOGICAL MONITORING
Biological monitoring refers to the use of resident benthic macroinvertebrate communities as indicators of water quality. Macroinvertebrates are larger than-microscopic invertebrate animals that inhabit aquatic habitats; freshwater forms are primarily aquatic insects, worms, clams, snails, and crustaceans. Concept
Nearly all streams are inhabited by a community of benthic macroinvertebrates. The species comprising the community each occupy a distinct niche defined and limited by a set of environmental requirements. The composition of the macroinvertebrate community is thus determined by many factors, including habitat, food source, flow regime, temperature, and water quality. The community is presumed to be controlled primarily by water quality if the other factors are determined to be constant or optimal. Community components which can change with water quality include species richness, diversity, balance, abundance, and presence/absence of tolerant or intolerant species. Various indices or metrics are used to measure these community changes. Assessments of water quality are based on metric values of the community, compared to expected metric values. Advantages
The primary advantages to using macroinvertebrates as water quality indicators are: 1) they are sensitive to environmental impacts 2) they are less mobile than fish, and thus cannot avoid discharges 3) they can indicate effects of spills, intermittent discharges, and lapses in treatment 4) they are indicators of overall, integrated water quality, including synergistic effects and
substances lower than detectable limits 5) they are abundant in most streams and are relatively easy and inexpensive to sample 6) they are able to detect non-chemical impacts to the habitat, e.g. siltation or thermal changes 7) they are vital components of the aquatic ecosystem and important as a food source for fish 8) they are more readily perceived by the public as tangible indicators of water quality 9) they can often provide ail on-site estimate of water quality 10) they can often be used to identify specific stresses or sources of impairment 11) they can be preserved and archived for decades, allowing for direct comparison of specimens 12) they bioaccumulate many contaminants, so that analysis of their tissues is a good monitor of
toxic substances in the aquatic food chain Limitations
Biological monitoring is not intended to replace chemical sampling, toxicity testing, or fish surveys. Each of these measurements provides information not contained in the others. Similarly, assessments based on biological sampling should not be taken as being representative of chemical sampling. Some substances may be present in levels exceeding ambient water quality criteria, yet have no apparent adverse community impact.

Anthropogenic: caused by human actions
Assessment: a diagnosis or evaluation of water quality
Benthos: organisms occurring on or in the bottom substrate of a waterbody
Bioaccumulate: accumulate contaminants in the tissues of an organism
Biomonitoring: the use of biological indicators to measure water quality
Community: a group of populations of organisms interacting in a habitat
Drainage basin: an area in which all water drains to a particular waterbody; watershed
EPT richness: the number of species of mayflies (Ephemeroptera), stoneflies (Plecoptera), and caddisflies (Trichoptera) in a sample or subsample
Facultative: occurring over a wide range of water quality; neither tolerant nor intolerant of poor water quality
Fauna: the animal life of a particular habitat
Impact: a change in the physical, chemical, or biological condition of a waterbody
Impairment: a detrimental effect caused by an impact
Index: a number, metric, or parameter derived from sample data used as a measure of water quality
Intolerant: unable to survive poor water quality
Longitudinal trends: upstream-downstream changes in water quality in a river or stream
Macroinvertebrate: a larger-than-microscopic invertebrate animal that lives at least part of its life in aquatic habitats
Multiplate: multiple-plate sampler, a type of artificial substrate sampler of aquatic macroinvertebrates
Organism: a living individual
PAHs: Polycyclic Aromatic Hydrocarbons, a class of organic compounds that are often toxic or carcinogenic
Rapid bioassessment: a biological diagnosis of water quality using field and laboratory analysis designed to allow assessment of water quality in a short time; usually involves kick sampling and laboratory subsampling of the sample
Riffle: wadeable stretch of stream usually having a rubble bottom and sufficient current to break the water surface; rapids
Species richness: the number of macroinvertebrate species in a sample or subsample
Station: a sampling site on a waterbody
Survey: a set of samplings conducted in succession along a stretch of stream
Synergistic effect: an effect produced by the combination of two factors that is greater than the sum of the two factors
Tolerant: able to survive poor water quality

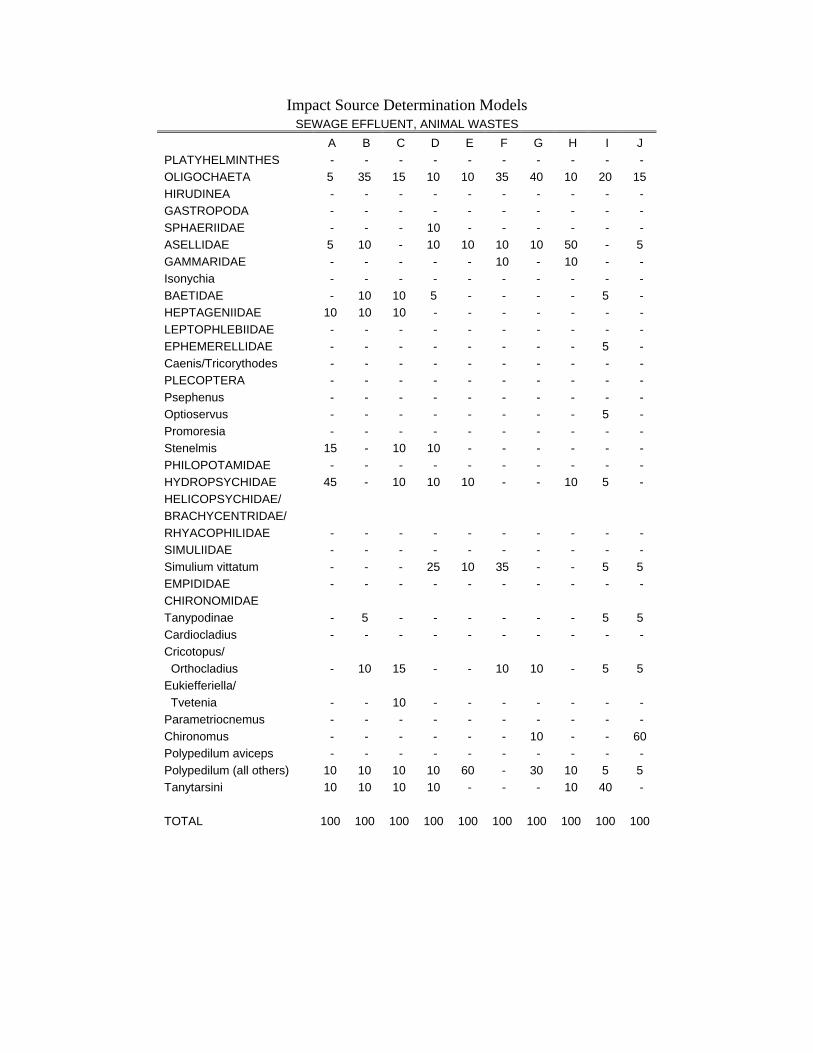
Impact Source Determination Methods and Community Models Definition: Impact Source Determination (ISD) is the procedure for identifying types of impacts that exert deleterious effects on a waterbody. While the analysis of benthic macroinvertebrate communities has been shown to be an effective means of determining severity of water quality impacts, it has been less effective in determining what kind of pollution is causing the impact. ISD uses community types or models to ascertain the primary factor influencing the fauna. Development of methods: The method found to be most useful in differentiating impacts in New York State streams was the use of community types based on composition by family and genus. It may be seen as an elaboration of Percent Model Affinity (Novak and Bode, 1992), which is based on class and order. A large database of macroinvertebrate data was required to develop ISD methods. The database included several sites known or presumed to be impacted by specific impact types. The impact types were mostly known by chemical data or land use. These sites were grouped into the following general categories: agricultural nonpoint, toxic-stressed, sewage (domestic municipal), sewage/toxic, siltation, impoundment, and natural. Each group initially contained 20 sites. Cluster analysis was then performed within each group, using percent similarity at the family or genus level. Within each group, four clusters were identified. Each cluster was usually composed of 4-5 sites with high biological similarity. From each cluster, a hypothetical model was then formed to represent a model cluster community type; sites within the cluster had at least 50 percent similarity to this model. These community type models formed the basis for ISD (see tables following). The method was tested by calculating percent similarity to all the models and determining which model was the most similar to the test site. Some models were initially adjusted to achieve maximum representation of the impact type. New models are developed when similar communities are recognized from several streams. Use of the ISD methods: Impact Source Determination is based on similarity to existing models of community types (see tables following). The model that exhibits the highest similarity to the test data denotes the likely impact source type, or may indicate "natural," lacking an impact. In the graphic representation of ISD, only the highest similarity of each source type is identified. If no model exhibits a similarity to the test data of greater than 50 percent, the determination is inconclusive. The determination of impact source type is used in conjunction with assessment of severity of water quality impact to provide an overall assessment of water quality. Limitations: These methods were developed for data derived from subsamples of 100-organisms each that are taken from traveling kick samples of New York State streams. Application of these methods for data derived from other sampling methods, habitats, or geographical areas would likely require modification of the models.
Impact Source Determination Models

NATURAL A B C D E F G H I J K L M PLATYHELMINTHES - - - - - - - - - - - - - OLIGOCHAETA - - 5 - 5 - 5 5 - - - 5 5 HIRUDINEA - - - - - - - - - - - - - GASTROPODA - - - - - - - - - - - - - SPHAERIIDAE - - - - - - - - - - - - - ASELLIDAE - - - - - - - - - - - - - GAMMARIDAE - - - - - - - - - - - - - Isonychia 5 5 - 5 20 - - - - - - - - BAETIDAE 20 10 10 10 10 5 10 10 10 10 5 15 40 HEPTAGENIIDAE 5 10 5 20 10 5 5 5 5 10 10 5 5 LEPTOPHLEBIIDAE 5 5 - - - - - - 5 - - 25 5 EPHEMERELLIDAE 5 5 5 10 - 10 10 30 - 5 - 10 5 Caenis/Tricorythodes - - - - - - - - - - - - - PLECOPTERA - - - 5 5 - 5 5 15 5 5 5 5 Psephenus 5 - - - - - - - - - - - - Optioservus 5 - 20 5 5 - 5 5 5 5 - - - Promoresia 5 - - - - - 25 - - - - - - Stenelmis 10 5 10 10 5 - - - 10 - - - 5 PHILOPOTAMIDAE 5 20 5 5 5 5 5 - 5 5 5 5 5 HYDROPSYCHIDAE 10 5 15 15 10 10 5 5 10 15 5 5 10 HELICOPSYCHIDAE/ BRACHYCENTRIDAE/ RHYACOPHILIDAE 5 5 - - - 20 - 5 5 5 5 5 - SIMULIIDAE - - - 5 5 - - - - 5 - - - Simulium vittatum - - - - - - - - - - - - - EMPIDIDAE - - - - - - - - - - - - - TIPULIDAE - - - - - - - - 5 - - - - CHIRONOMIDAE Tanypodinae - 5 - - - - - - 5 - - - - Diamesinae - - - - - - 5 - - - - - - Cardiocladius - 5 - - - - - - - - - - - Cricotopus/ Orthocladius 5 5 - - 10 - - 5 - - 5 5 5 Eukiefferiella/ Tvetenia 5 5 10 - - 5 5 5 - 5 - 5 5 Parametriocnemus - - - - - - - 5 - - - - - Chironomus - - - - - - - - - - - - - Polypedilum aviceps - - - - - 20 - - 10 20 20 5 - Polypedilum (all others) 5 5 5 5 5 - 5 5 - - - - - Tanytarsini - 5 10 5 5 20 10 10 10 10 40 5 5 TOTAL 100 100 100 100 100 100 100 100 100 100 100 100 100

Impact Source Determination Models NONPOINT NUTRIENTS, PESTICIDES
A B C D E F G H I J PLATYHELMINTHES - - - - - - - - - - OLIGOCHAETA - - - 5 - - - - - 15 HIRUDINEA - - - - - - - - - - GASTROPODA - - - - - - - - - - SPHAERIIDAE - - - 5 - - - - - - ASELLIDAE - - - - - - - - - - GAMMARIDAE - - - 5 - - - - - - Isonychia - - - - - - - 5 - - BAETIDAE 5 15 20 5 20 10 10 5 10 5 HEPTAGENIIDAE - - - - 5 5 5 5 - 5 LEPTOPHLEBIIDAE - - - - - - - - - - EPHEMERELLIDAE - - - - - - - 5 - - Caenis/Tricorythodes - - - - 5 - - 5 - 5 PLECOPTERA - - - - - - - - - - Psephenus 5 - - 5 - 5 5 - - - Optioservus 10 - - 5 - - 15 5 - 5 Promoresia - - - - - - - - - - Stenelmis 15 15 - 10 15 5 25 5 10 5 PHILOPOTAMIDAE 15 5 10 5 - 25 5 - - - HYDROPSYCHIDAE 15 15 15 25 10 35 20 45 20 10 HELICOPSYCHIDAE/ BRACHYCENTRIDAE/ RHYACOPHILIDAE - - - - - - - - - - SIMULIIDAE 5 - 15 5 5 - - - 40 - Simulium vittatum - - - - - - - - 5 - EMPIDIDAE - - - - - - - - - - TIPULIDAE - - - - - - - - - 5 CHIRONOMIDAE Tanypodinae - - - - - - 5 - - 5 Cardiocladius - - - - - - - - - - Cricotopus/ Orthocladius 10 15 10 5 - - - - 5 5 Eukiefferiella/ Tvetenia - 15 10 5 - - - - 5 - Parametriocnemus - - - - - - - - - - Microtendipes - - - - - - - - - 20 Polypedilum aviceps - - - - - - - - - - Polypedilum (all others) 10 10 10 10 20 10 5 10 5 5 Tanytarsini 10 10 10 5 20 5 5 10 - 10 TOTAL 100 100 100 100 100 100 100 100 100 100

Impact Source Determination Models MUNICIPAL/INDUSTRIAL TOXIC
A B C D E F G H A B C D E F PLATYHELMINTHES - 40 - - - 5 - - - - - - 5 - OLIGOCHAETA 20 20 70 10 - 20 - - - 10 20 5 5 15 HIRUDINEA - 5 - - - - - - - - - - - - GASTROPODA - - - - - 5 - - - 5 - - - 5 SPHAERIIDAE - 5 - - - - - - - - - - - - ASELLIDAE 10 5 10 10 15 5 - - 10 10 - 20 10 5 GAMMARIDAE 40 - - - 15 - 5 5 5 - - - 5 5 Isonychia - - - - - - - - - - - - - - BAETIDAE 5 - - - 5 - 10 10 15 10 20 - - 5 HEPTAGENIIDAE 5 - - - - - - - - - - - - - LEPTOPHLEBIIDAE - - - - - - - - - - - - - - EPHEMERELLIDAE - - - - - - - - - - - - - - Caenis/Tricorythodes - - - - - - - - - - - - - - PLECOPTERA - - - - - - - - - - - - - - Psephenus - - - - - - - - - - - - - - Optioservus - - - - - - - - - - - - - - Promoresia - - - - - - - - - - - - - - Stenelmis 5 - - 10 5 - 5 5 10 15 - 40 35 5 PHILOPOTAMIDAE - - - - - - - 40 10 - - - - - HYDROPSYCHIDAE 10 - - 50 20 - 40 20 20 10 15 10 35 10 HELICOPSYCHIDAE/ BRACHYCENTRIDAE/ RHYACOPHILIDAE - - - - - - - - - - - - - - SIMULIIDAE - - - - - - - - - - - - - - Simulium vittatum - - - - - - 20 10 - 20 - - - 5 EMPIDIDAE - 5 - - - - - - - - - - - - CHIRONOMIDAE Tanypodinae - 10 - - 5 15 - - 5 10 - - - 25 Cardiocladius - - - - - - - - - - - - - - Cricotopus/ Orthocladius 5 10 20 - 5 10 5 5 15 10 25 10 5 10 Eukiefferiella/ Tvetenia - - - - - - - - - - 20 10 - - Parametriocnemus - - - - - - - - - - - 5 - - Chironomus - - - - - - - - - - - - - - Polypedilum aviceps - - - - - - - - - - - - - - Polypedilum (all others) - - - 10 20 40 10 5 10 - - - - 5 Tanytarsini - - - 10 10 - 5 - - - - - - 5 TOTAL 100 100 100 100 100 100 100 100 100 100 100 100 100 100
Impact Source Determination Models SEWAGE EFFLUENT, ANIMAL WASTES
A B C D E F G H I J PLATYHELMINTHES - - - - - - - - - - OLIGOCHAETA 5 35 15 10 10 35 40 10 20 15 HIRUDINEA - - - - - - - - - - GASTROPODA - - - - - - - - - - SPHAERIIDAE - - - 10 - - - - - - ASELLIDAE 5 10 - 10 10 10 10 50 - 5 GAMMARIDAE - - - - - 10 - 10 - - Isonychia - - - - - - - - - - BAETIDAE - 10 10 5 - - - - 5 - HEPTAGENIIDAE 10 10 10 - - - - - - - LEPTOPHLEBIIDAE - - - - - - - - - - EPHEMERELLIDAE - - - - - - - - 5 - Caenis/Tricorythodes - - - - - - - - - - PLECOPTERA - - - - - - - - - - Psephenus - - - - - - - - - - Optioservus - - - - - - - - 5 - Promoresia - - - - - - - - - - Stenelmis 15 - 10 10 - - - - - - PHILOPOTAMIDAE - - - - - - - - - - HYDROPSYCHIDAE 45 - 10 10 10 - - 10 5 - HELICOPSYCHIDAE/ BRACHYCENTRIDAE/ RHYACOPHILIDAE - - - - - - - - - - SIMULIIDAE - - - - - - - - - - Simulium vittatum - - - 25 10 35 - - 5 5 EMPIDIDAE - - - - - - - - - - CHIRONOMIDAE Tanypodinae - 5 - - - - - - 5 5 Cardiocladius - - - - - - - - - - Cricotopus/ Orthocladius - 10 15 - - 10 10 - 5 5 Eukiefferiella/ Tvetenia - - 10 - - - - - - - Parametriocnemus - - - - - - - - - - Chironomus - - - - - - 10 - - 60 Polypedilum aviceps - - - - - - - - - - Polypedilum (all others) 10 10 10 10 60 - 30 10 5 5 Tanytarsini 10 10 10 10 - - - 10 40 - TOTAL 100 100 100 100 100 100 100 100 100 100

Impact Source Determination Models SILTATION IMPOUNDMENT A B C D E A B C D E F G H I J PLATYHELMINTHES - - - - - - 10 - 10 - 5 - 50 10 - OLIGOCHAETA 5 - 20 10 5 5 - 40 5 10 5 10 5 5 - HIRUDINEA - - - - - - - - - 5 - - - - - GASTROPODA - - - - - - - 10 - 5 5 - - - - SPHAERIIDAE - - - 5 - - - - - - - - 5 25 - ASELLIDAE - - - - - - 5 5 - 10 5 5 5 - - GAMMARIDAE - - - 10 - - - 10 - 10 50 - 5 10 - Isonychia - - - - - - - - - - - - - - - BAETIDAE - 10 20 5 - - 5 - 5 - - 5 - - 5 HEPTAGENIIDAE 5 10 - 20 5 5 5 - 5 5 5 5 - 5 5 LEPTOPHLEBIIDAE - - - - - - - - - - - - - - - EPHEMERELLIDAE - - - - - - - - - - - - - - - Caenis/Tricorythodes 5 20 10 5 15 - - - - - - - - - - PLECOPTERA - - - - - - - - - - - - - - - Psephenus - - - - - - - - - - - - - - 5 Optioservus 5 10 - - - - - - - - - - - 5 - Promoresia - - - - - - - - - - - - - - - Stenelmis 5 10 10 5 20 5 5 10 10 - 5 35 - 5 10 PHILOPOTAMIDAE - - - - - 5 - - 5 - - - - - 30 HYDROPSYCHIDAE 25 10 - 20 30 50 15 10 10 10 10 20 5 15 20 HELICOPSYCHIDAE/ BRACHYCENTRIDAE/ RHYACOPHILIDAE - - - - - - - - - - - - - 5 - SIMULIIDAE 5 10 - - 5 5 - 5 - 35 10 5 - - 15 EMPIDIDAE - - - - - - - - - - - - - - - CHIRONOMIDAE Tanypodinae - - - - - - 5 - - - - - - - - Cardiocladius - - - - - - - - - - - - - - - Cricotopus/ Orthocladius 25 - 10 5 5 5 25 5 - 10 - 5 10 - - Eukiefferiella/ Tvetenia - - 10 - 5 5 15 - - - - - - - - Parametriocnemus - - - - - 5 - - - - - - - - - Chironomus - - - - - - - - - - - - - - - Polypedilum aviceps - - - - - - - - - - - - - - - Polypedilum (all others) 10 10 10 5 5 5 - - 20 - - 5 5 5 5 Tanytarsini 10 10 10 10 5 5 10 5 30 - - 5 10 10 5 TOTAL 100 100 100 100 100 100 100 100 100 100 100 100 100 100 100

FAMILY-LEVEL MACROINVERTEBRATE INDICES 1. Family richness. This is the total number of macroinvertebrate families found in a riffle kick sample. Expected ranges for 100-organism subsamples of kick samples in most streams in New York State are: greater than 12, non-impacted; 9-12, slightly impacted; 6-8, moderately impacted; less than 6, severely impacted. 2. Family EPT richness. EPT denotes the orders of mayflies (Ephemeroptera), stoneflies (Plecoptera), and caddisflies (Trichoptera). These are considered to be mostly clean-water organisms, and their presence generally is correlated with good water quality (Lenat, 1987). The number of EPT families found in a 100-organis subsample is used for this index. Expected ranges from most streams in New York State are: greater than 7, non-impacted; 4-7, slightly impacted; 1-3, moderately impacted; and 0, severely impacted. 3. Family Biotic Index. The family-level Hilsenhoff Biotic Index is a measure of the tolerance of the organisms in the sample to organic pollution (sewage inputs, animal wastes) and low dissolved oxygen levels. It is calculated by multiplying the number of individuals of each family by its assigned tolerance value, summing these products, and dividing by the total number of individuals. On a 0-10 scale, tolerance values range from intolerant (0) to tolerant (10). Values are listed in Hilsenhoff (1988); additional values for non-arthropods are assigned by the NYS Stream Biomonitoring Unit. The most recent values are listed in the Quality Assurance document (Bode et al., 1996). Ranges for the levels of impact are: 0-4.50, non-impacted; 4.51-6.50, slightly impacted; 6.51-8.50, moderately impacted; and 8.51-10.00, severely impacted. 4. Percent Model Affinity is a measure of similarity to a model non-impacted community based on percent abundance in 7 major groups (Novak and Bode, 1992). Percentage similarity is used to measure similarity to a community of 40% Ephemeroptera, 5% Plecoptera, 100/0 Trichoptera, 10% Coleoptera, 20% Chironomidae, 5% Oligochaeta, and 10% Other. Ranges for the levels of impact are: >64, non-impacted; 50-64, slightly impacted; 35-49, moderately impacted; and <35, severely impacted. ____________________________________________________________________________________ Bode, R.W., M.A. Novak, and L.E. Abele. 1996. Quality assurance work plan for biological stream
monitoring in New York State. NYS DEC technical report, 89 pp. Hilsenhoff, W. L. 1988. Rapid field assessment of organic pollution with a family-level biotic index.
Journal of the North American Benthological Society 7(1):65-68. Lenat, D. R. 1987. Water quality assessment using a new qualitative collection method for freshwater
benthic macroinvertebrates. North Carolina DEM Tech. Report. 12 pp. Novak, M.A., and R.W. Bode. 1992. Percent model affinity: a new measure of macroinvertebrate
community composition. J. N. Am. Benthol. Soc. 11(1):80-85.