indian journal of engineering evaluation of solar panel for
TRANSCRIPT

INDIAN JOURNAL OF ENGINEERING l RESEARCH ARTICLE
© 2021 Discovery Scientific Society. All Rights Reserved. ISSN 2319–7757 EISSN 2319–7765 l OPEN ACCESS
Pag
e22
2
Evaluation of solar panel for
improved performances
Wimberly Andy Nsasak, Roland Uhunmwangho, Eseosa
Omorogiuwa, Ameze Big Alabo
ABSTRACT
Solar energy is an energy source that uses the sun energy to produce
electricity. Solar panel are technologies used to harness the sun’s energy for
electricity production. Mono-crystalline and poly-crystalline are the most
commercially used technology. The objective of this paper is to perform solar
panel operation assessment for improved performance. Simulation was done
on a solar panel simulation software called PSIM to observe the behavior of
voltage, current and power. Outdoor experiment was also done to observe the
behavior of voltage, current and power in real time. The outdoor experiment
was conducted for three months. Tilt angle and panel orientation were
investigated. Solar panel was placed facing North, South, East, West cardinal
point. The tilt angle was varied between 0° to 90° with an increment of 5°. Tilt
angle of 15° was observed to produce the highest average power output for
the cardinal positions. It produced 40.80W facing north, 54.45W facing south,
47.13W facing east and 48.43W facing west cardinal position.
Keywords: Solar Panel, PV, Monocrystalline, Polycrystalline, Tilt Angle,
Orientation, cardinal point
1. INTRODUCTION
The availability of solar energy is influenced by location, latitude, elevation,
seasons and time of the day. However, the largest factors affecting the
availability of solar energy are cloud cover, and other industrial and
meteorological parameters and conditions which vary with location and time.
Solar panels that absorbs energy from the sun to yield direct current electricity
are known as photovoltaics. A photovoltaic (PV) module is a wired, packaged
assembly of photovoltaic solar cells that come with various voltages and
wattages. To get the adequate working voltage, PV cells are normally linked
in series to form a module in majority of commercial PV products. PV
modules are then connected in a series-parallel configuration to obtain the
desired power output [1]. A solar panel is made up of 6x10 solar cells in most
cases. Depending on the form and quality of solar cells employed, the
efficiency and wattage production can vary. A solar module's energy output
can vary from 100 to 365W of Direct Current electricity. The higher the
wattage output, the more energy per solar module is generated [1].
The effectiveness of an outdoor PV module's is resolute by a variation of
factors. Some of these issues are caused by the module itself, while others are
INDIAN JOURNAL OF
ENGINEERING
18(49), 2021
To Cite:
Nsasak WA, Uhunmwangho R, Omorogiuwa E, Alabo
AB. Evaluation of solar panel for improved
performances. Indian Journal of Engineering, 2021,
18(49), 222-231
Author Affiliation:
Department of Electrical / Electronic Engineering,
University of Port Harcourt, Nigeria
Peer-Review History
Received: 20 May 2021
Reviewed & Revised: 22/May/2021 to 14/June/2021
Accepted: 15 June 2021
Published: June 2021
Peer-Review Model
External peer-review was done through double-blind
method.
© 2021 Discovery Scientific Society. This work is licensed
under a Creative Commons Attribution 4.0 International
License.
DISCOVERY SCIENTIFIC SOCIETY

INDIAN JOURNAL OF ENGINEERING l RESEARCH ARTICLE
© 2021 Discovery Scientific Society. All Rights Reserved. ISSN 2319–7757 EISSN 2319–7765 l OPEN ACCESS
Pag
e22
3
caused by the place and surroundings. Solar irradiance, tilt-angle, shading, module temperature, fill-factor, material degradation,
soiling, PID, parasitic resistances, and other major factors are just a few of them. Solar PV systems producers usually guarantee the
modules efficiency for about 25 years. The initial years of the panel life, solar PV panels normally degrade at a faster rate. Solar
panels' rated power output degrades at a rate of about 0.5% per year. Materials of low quality or production defects. Module
failures and output losses are most often the result of gradual accumulated damages caused by long-term outdoor exposure in
harsh environments [2]. PV module output can vary greatly depending on light conditions, which has a large outcome on PV device
yield. Many of the parameters of a PV module are affected by changes in the strength of solar radiation falling on it including ,
, power, Fill Factor and efficiency. The PV cell temperature, just as other semiconductor device, is tremendously sensitive. A PV
cell's efficiency and power output decrease as its temperature rises. This is because of increased internal carrier recombination rates
as a result of higher carrier concentrations. PV module temperature rises as temperature of air and solar radiation rises, but falls as
wind speed rises. The temperature of a PV module can reach 60°C to 65°C about noontime during summer when the irradiance is
very high.
The performance of solar panel is affected by variations in output performance due to the effect of tilt angle and cardinal
positioning. This study will serve as a guide to solar panel installers taking into consideration the tilt angle and cardinal positioning
when installing solar.
2. REVIEW OF RELATED RESEARCHES
Incident angle is the angle between the radiation falling on the surface directly and the normal of that surface. Tilt angle is the angle
between the panels and the horizontal plane [3].
Fig 1.Tilt Angle
The best angle for any photovoltaic array, according to Mondoc and Pop [4], is the one that generates the highest annual energy
production for that specific location. This is the angle between the horizontal plane and the solar panel that can be set or modified
to maximize seasonal or annual energy collection. The angle of incident of sunrays to the panel cannot be calculated since the sun
path is east to west, As a result, the angle of tilt of the panel to the horizontal plane must be changed to achieve the best incident
angle of the sun on the panel, resulting in the panel's best results.
Dauta et al [5] aimed at determining the electrical characteristics of solar irradiance and solar energy, as well as their
relationships to PV module performance. They analyzed the solar radiation and solar energy in Perlis, Malaysia's northernmost
state. According to their findings, the power output of a PV array is shaped by a diversity of environmental agents, including solar
irradiance. In order to calculate the amount of energy absorb by the PV cell, the value of solar irradiation G(t) must be known.
Applying the open circuit condition, I = 0, to the I (V) equation is given in
Tilt Angle
sun
Incident Angle
Solar Panel

INDIAN JOURNAL OF ENGINEERING l RESEARCH ARTICLE
© 2021 Discovery Scientific Society. All Rights Reserved. ISSN 2319–7757 EISSN 2319–7765 l OPEN ACCESS
Pag
e22
4
The open circuit voltage is given by:
The total energy, Ec, of PV cell is thus
The solar cell will transform the insolation it absorbs into electrical energy, and the equations is given below;
Where;
G(t) is the monthly average value of solar irradiance.
is the cell packing factor.
is a fraction transmitted through the front glass.
is cell efficiency.
A daily data set was obtained and analyzed from a weather station, and it shows that solar irradiance and solar energy have a
direct proportional relationship.
Ajao et al [6] conducted an outdoor experiment to determine the best tilt angle for solar pv panel in Ilorin, Nigeria. The
experiment was done for 10 days and the solar panel was tilted between 0° to 30° at an increment of 2°. The tilt angle the solar panel
produced maximum average power output of 38.02W was 22°, according to the results of the experiment. As a result, the power
produced by a solar panel is determined by the angle at which it is inclined, the weather conditions, and the solar panel's
orientation. Improper solar panel orientation will ultimately result in power loss and a poor gain on investment. Solar panels
should be kept at the best tilt angle for highest energy gain, and seasonal alteration of the panel can result in a significant increase in
solar energy power.
Mohammad H. [7] gave a simple numerical model for optimizing solar panel tilt angle for a given panel azimuth angle, which is
based on a spreadsheet. His method is based on the ASHRAE solar irradiation model, which is a systematic model for measuring
solar irradiation based on direct, reflected, diffuse, and dispersed components. The tilt angle to generate optimal annual solar
irradiation per square area of panel is then calculated. The result shows that at tilt angle 45° the maximum annual solar radiation is
observed.
Hussein et al [8] conducted an experiment to assess the competence of photovoltaic modules at several tilt angles and directions.
A computer Fortran program based on the study and linked to the TRNSYS simulation program was used to forecast annual
results. From their work, the best tilt angle and orientation for PV modules in Cairo (Egypt) are 20° to 30° and south facing.
Furthermore, with a constant change from the south, the annual extreme output energy of PV modules at a constant surface tilt
angle shifted westward is more than that of PV modules shifted eastward.
By analyzing solar radiation data assessed from hours of sunshine and ambient temperature to foresee PV energy production at
the site, Udoakah [9] hope to determine the optimal tilt angle for maximum solar insolation for pv systems in Enugu. The greatest
tilt angle for PV energy output is 6° if the module is set, but if changed monthly, the best tilt angles for each month are 30°, 24°, and
6° for (January to March), 0° for (April to September), 18°, 30°, and 36° for (October to December). The energy gotten was found to
be 192.70 W/m2 when the tilt angle of the module is changed monthly to its finest tilt. As compared to the 186.86 W/m2 gotten when
the tilt angle was set, this value represents a 3% rise.
3. MATERIAL AND METHOD
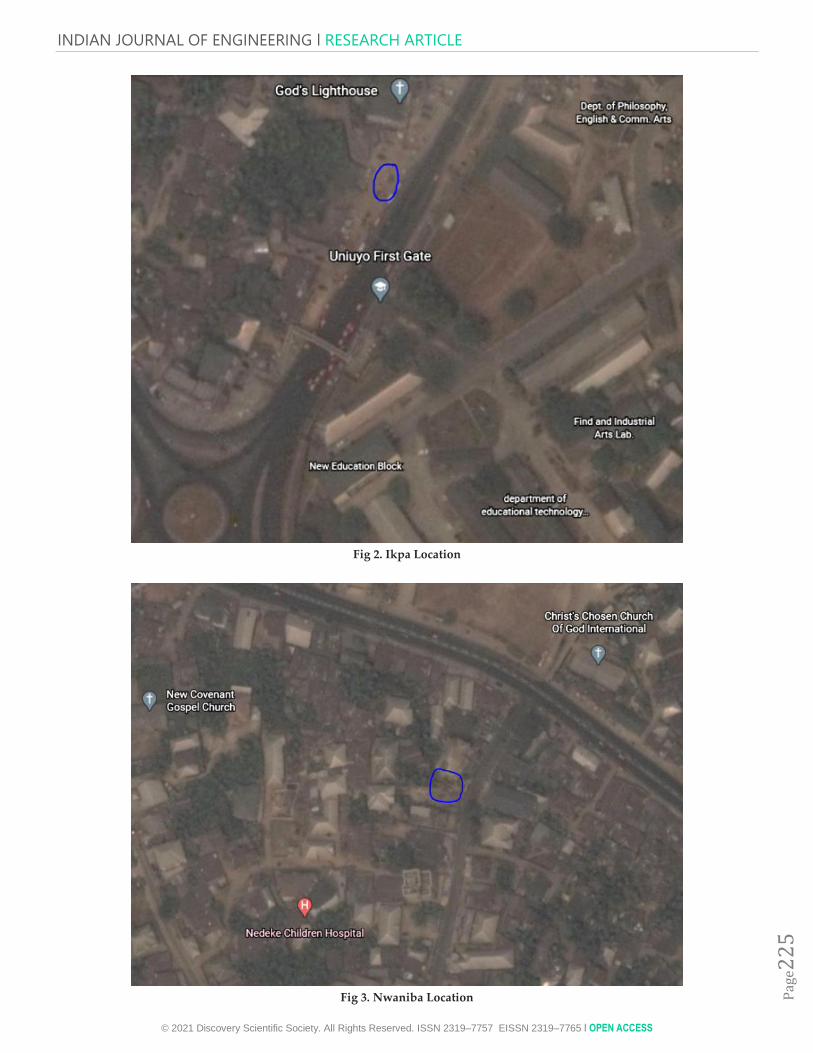
The outdoor experiment was conducted between October to December 2019. Two regions were covered in Uyo city are Ikpa
(latitude 5.04°N & longitude 7.92°E) and Nwaniba (latitude 5.02°N & longitude 7.93°E) in Uyo city. The ravine in the north-eastern
is the most prominent characteristic of the city's physical landscape. Small perennial streams run through the ravine. These are
outlets of the river ikpa, the largest watercourse in the city's vicinity. Since Uyo is sited in the Niger Delta, it has a damp climate
with plenty of rain, hot temperatures, and relatively high humidity. [10].
INDIAN JOURNAL OF ENGINEERING l RESEARCH ARTICLE
© 2021 Discovery Scientific Society. All Rights Reserved. ISSN 2319–7757 EISSN 2319–7765 l OPEN ACCESS
Pag
e22
5
Fig 2. Ikpa Location
Fig 3. Nwaniba Location

INDIAN JOURNAL OF ENGINEERING l RESEARCH ARTICLE
© 2021 Discovery Scientific Society. All Rights Reserved. ISSN 2319–7757 EISSN 2319–7765 l OPEN ACCESS
Pag
e22
6
3.1. Experimental Setup
The setup for the experiment consisted of monocrystalline solar panel, compass, DT-830D digital multimeter.
Fig 4. DT-830D Digital Multimeter and Compass Reader
Table 1. Solar Panel Specifications
PRIME SOLAR: PS-SP-160
Rated Max Power 160W Open Circuit Voltage 21.8V
Rated Voltage 18.4V Short Circuit Current 9.35A
Rated Current 8.70A Max System Voltage 1000V
Max Series Fuse 15A STC Am 1.5, 1000W/m2
Fig 5. Experimental Setup
COMPASS
DIGITAL
MULTIMETER
SOLAR
PANEL

INDIAN JOURNAL OF ENGINEERING l RESEARCH ARTICLE
© 2021 Discovery Scientific Society. All Rights Reserved. ISSN 2319–7757 EISSN 2319–7765 l OPEN ACCESS
Pag
e22
7
It was setup using a 160W rated solar panel, a digital multimeter to measure voltage and current outputs from the panel,
compass used to show the direction to the geographical cardinal points. The solar panel was mounted in an open space and in such
a way that it can be tilted from 0° to 90° to the horizontal. A digital multimeter was connected to the outputs wires from the panel
which measures the output voltage (Voc) and current (Isc), digital clock was used for timing the measurements (hourly). The solar
panel was first mounted at 0° to the horizontal facing North and the readings were taken for voltage and current and then adjusted
in an increment of 5° till it gets to 90° and all readings for the different tilt angles were recorded. The same procedure was repeated
for South, East and West geographical cardinal positions. The measurements for each geographical cardinal position and tilt angles
was done at an hourly interval (from 7:00AM to 6:00PM). Data measured was analyzed and used to establish the most efficient tilt
angle and geographical cardinal position of solar panel in Uyo city for efficient performance.
Fig 7. Solar Panel At 0°, 45°, 90° Tilt Angle
Simulation of the solar panel was done on PSIM software to observe the current, voltage and power characteristics of the panel.
3.2. Solar Panel Parameters
Standard Testing Condition (STC)
This is a lab setting in which solar PV panels are checked to evaluate module performance, or the quantity of the available solar
energy that can be transmuted into electricity. STC is an industry standard that specifies the performance of PV modules using a
cell temperature of 25°C and an irradiance of 1000 W/m2 with an air mass 1.5 (AM 1.5) set.
Fill Factor
The fill-factor of a PV cell is the ratio of the maximum power to the product of and .
Open Circuit Voltage ( )
The open circuit voltage for a solar panel is the voltage it generates when no load is connected to it. You can read Voc by simply
measuring with a voltmeter. There is no load on the solar panel because it is not attached to anything, and it produces no current.
Where Vt = thermal voltage
Short Circuit Current ( )
Short circuit current of panels is when the panels are not attached to a load but the plus and minus wires of the panels are
connected, current is the number of amps (i.e. current) they produce. You can measure Isc by simply using an ammeter. Under
normal test conditions, this is the maximum current that the solar panels can generate.
INDIAN JOURNAL OF ENGINEERING l RESEARCH ARTICLE
© 2021 Discovery Scientific Society. All Rights Reserved. ISSN 2319–7757 EISSN 2319–7765 l OPEN ACCESS
Pag
e22
8
Maximum Power Point Voltage ( )
The is the voltage at which the optimum power output is reached when connected to MPPT solar equipment under normal
test conditions.
Maximum Power Point Current ( )
When the power output is at its peak, the is the current (amps) when connected to MPPT solar equipment under normal test
conditions.
3.3. Performance Parameter
Vishakha B. [14] highlights the following performance parameters;
Total Energy Generated: is the total energy (Wh) generated by the module in a day while charging and is represented by:
Where Et is energy generated in each hour t= time (1 to 7).
Efficiency: is the ratio of output energy to the input power.
Solar Operational Efficiency: Is the ratio of practical output to the rated output of the module.
4. RESULT AND DISCUSSION
4.1. Tilt Angle Determination
From the data gotten from the experiments, the average power from 7:00am to 6:00pm tilt angles with corresponding time for
south cardinal point which has been established to be the best cardinal position for optimum performance based on the outdoor
experiment is given below.
Table 2. Average Power and Tilt Angle
TILT ANGLE
(°) 0 5 10 15 20 25 30 35 40 45 50
AVERAGE
POWER(W) 49.86 50.70 51.99 54.45 53.77 53.50 53.17 51.64 50.28 49.39 47.37
TILT ANGLE (°) 55 60 65 70 75 80 85 90
AVERAGE
POWER(W) 44.50 42.45 39.63 35.09 32.61 29.48 26.65 24.09
From table 2, the lowest average power was 24.09W at tilt angle of 90° and the highest was obtained and the highest average
power was obtained at 15° with 54.45W.

INDIAN JOURNAL OF ENGINEERING l RESEARCH ARTICLE
© 2021 Discovery Scientific Society. All Rights Reserved. ISSN 2319–7757 EISSN 2319–7765 l OPEN ACCESS
Pag
e22
9
Fig 8. A Graph of Average Power Against Tilt Angles
Figure 9, there is a rise in average power from 0° to 15° and then it drops till it gets to 90° tilt angle. The maximum power of
54.45W is observed at an angle of 15° while the lowest was 90° which produced 24.09W. It can therefore be concluded that 15° is the
tilt angle with the most efficient performance.
4.2. Cardinal Positioning/ Direction
From result obtained, the tilt angle of 15° been established as the best tilt angle, it is thus used to determine the cardinal position
with the most efficient performance of the solar panel.
Table 3. Cardinal Direction Average Power Values with Time
TIME
(AM/PM)
NORTH
(W)
SOUTH
(W)
EAST
(W)
WEST
(W)
7:00 0.91 1.72 1.75 0.75
8:00 7.48 10.20 10.36 6.58
9:00 26.18 36.10 41.81 29.14
10:00 50.80 72.62 74.62 43.20
11:00 66.58 94.80 91.84 72.47
12:00 93.63 115.91 104.43 95.54
1:00 97.60 115.50 101.20 108.07
2:00 82.78 102.31 78.60 101.97
3:00 36.83 68.47 34.32 71.15
4:00 20.26 26.32 16.04 40.59
5:00 4.62 5.61 3.65 7.32
6:00 0.17 4.20 0.08 4.41
AVERAGE (W) 40.80 54.48 47.13 48.43
From table 3, from 7:00am to 1:00pm there is an observable rise in average power and from 2:00pm to 6:00pm there is a drop in
average power for all cardinal positions. For north position, the lowest power reading of 0.17W at 6:00pm and highest power
reading of 97.60 at 1:00pm, for south position, the lowest power reading of 1.72W at 7:00am and highest power reading of 115.91W
at 12:00pm, for east position, the lowest power reading of 0.08W at 6:00pm and highest power reading of 104.43W at 12:00pm, for
west position, the lowest power reading of 0.75W at 7:00am and highest power reading of 108.07W at 1:00pm. The north position
has an average power of 40.80W, 54.48W for south position, 47.13W for east cardinal position and 48.43W for west cardinal position.
Since the solar panel is to be fixed in a particular direction and not moved with change in the sun direction as the sun travels from
0
10
20
30
40
50
60
0° 5° 10° 15° 20° 25° 30° 35° 40° 45° 50° 55° 60° 65° 70° 75° 80° 85° 90°
Po
wer
(W
)
Tilt Angle (°)
INDIAN JOURNAL OF ENGINEERING l RESEARCH ARTICLE
© 2021 Discovery Scientific Society. All Rights Reserved. ISSN 2319–7757 EISSN 2319–7765 l OPEN ACCESS
Pag
e23
0
the east to west path, the south cardinal position is the best cardinal position/direction for the solar panel to be placed for the
efficient performance.
4.3. Simulation Result
Simulation Of Panel on PSIMT Software
The simulation of the ‚prime solar‛ solar panel was done on PSIM software.
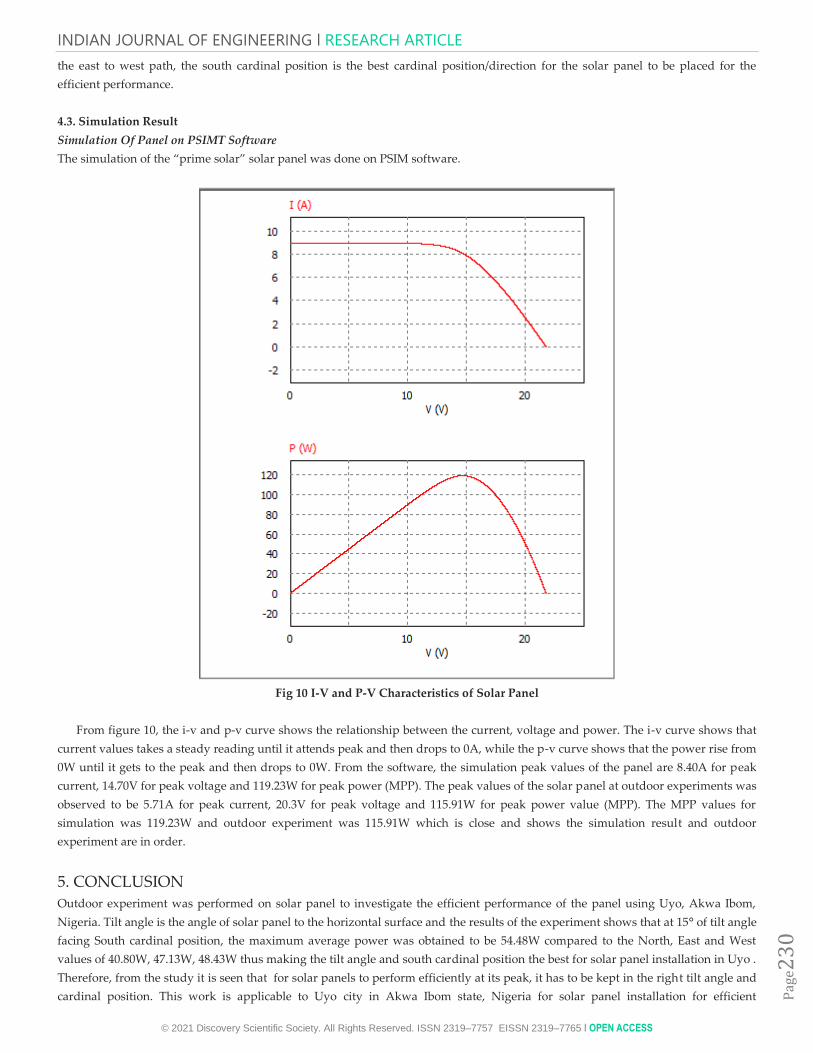
Fig 10 I-V and P-V Characteristics of Solar Panel
From figure 10, the i-v and p-v curve shows the relationship between the current, voltage and power. The i-v curve shows that
current values takes a steady reading until it attends peak and then drops to 0A, while the p-v curve shows that the power rise from
0W until it gets to the peak and then drops to 0W. From the software, the simulation peak values of the panel are 8.40A for peak
current, 14.70V for peak voltage and 119.23W for peak power (MPP). The peak values of the solar panel at outdoor experiments was
observed to be 5.71A for peak current, 20.3V for peak voltage and 115.91W for peak power value (MPP). The MPP values for
simulation was 119.23W and outdoor experiment was 115.91W which is close and shows the simulation result and outdoor
experiment are in order.
5. CONCLUSION
Outdoor experiment was performed on solar panel to investigate the efficient performance of the panel using Uyo, Akwa Ibom,
Nigeria. Tilt angle is the angle of solar panel to the horizontal surface and the results of the experiment shows that at 15° of tilt angle
facing South cardinal position, the maximum average power was obtained to be 54.48W compared to the North, East and West
values of 40.80W, 47.13W, 48.43W thus making the tilt angle and south cardinal position the best for solar panel installation in Uyo .
Therefore, from the study it is seen that for solar panels to perform efficiently at its peak, it has to be kept in the right tilt angle and
cardinal position. This work is applicable to Uyo city in Akwa Ibom state, Nigeria for solar panel installation for efficient
INDIAN JOURNAL OF ENGINEERING l RESEARCH ARTICLE
© 2021 Discovery Scientific Society. All Rights Reserved. ISSN 2319–7757 EISSN 2319–7765 l OPEN ACCESS
Pag
e23
1
performance. However, further studies can be conducted for other regions as the result of this outdoor experiment may be
applicable to Uyo and may differ for other region in Nigeria, as well as the world at large.
Funding
This study has not received any external funding.
Conflict of Interest
The author declares that there are no conflicts of interests.
Data and materials availability
All data associated with this study are present in the paper.
REFERENCES AND NOTES
1. Mustapha I., Dikwa M. K., Musa B. U. and Abbagana M.
(2013). ‚Performance Evaluation of Polycrystalline Solar
Photovoltaic Module in Weather Conditions Of Maiduguri,
Nigeria‛ Arid Zone Journal of Engineering, Technology and
Environment. Vol. 9, pp 69-81.
2. Vidyanandan K.V., (2017) ‚An Overview of Factors
Affecting the Performance of Solar PV Systems‛. A house
journal of cooperate planning. Issue 27, pp 2-8.
3. Akif Karafil, Harun Ozabay, Mehn Kesler & Huseyin
Parmaksiz, ‚Calculation of optimal fixed tilt angle of pv
panels depending on the solar angles and the comparison of
the results with experimental study conducted in summer in
Bilecik, Turkey‛.
4. Mondoc B. and Pop F., (2010) ‚Factors Influencing the
Performance of a Photovoltaic Power Plant.‛ 3rd
International Conference on Modern Power System, Cluj-
Napoca, Romania. pp 3.
5. Dauta I., Farhana Zainuddin, Y.M. Irwan, A.R.N. Razliana
(2012) ‚Analysis of Solar Irradiance and Solar Energy in
Perlis,Northern of Peninsular Malaysia‛. Energy Procedia
18, pp 1421 – 1427.
6. Ajao K.R., R.M. Ambali and M.O. Mahmoud (2013)
‚Determination of the Optimal Tilt Angle for Solar
Photovoltaic Panel in Ilorin, Nigeria‛. Journal of
Engineering Science and Technology Review 6 (1) pp 87 -90.
7. Mohammad H. Naraghi (2009). ‘‘Optimum Solar Panel Tilt
Angle for Maximum Annual Irradiation’’. Asme
International Mechanical Engineering Congress and
Exposition. pp 1-9.
8. Hussein H.M.S., G.E. Ahmad, H.H. El-Ghetany (2004).
‚Performance evaluation of photovoltaic modules at
different tilt angles and orientations‛. Energy Conversion
and Management. Vol 45, pp 2441–2452.
9. Udoakah Y. N., and Okpura N. I. (2015). Analysis of Solar
Potential and Energy Production of Photovoltaic Modules at
Optimum Tilt Angles in Nigeria. Nigerian Journal of Solar
Energy, Vol. 26: 92-97.
10. Akpabio, L. E. Etuk, S.E, George, G.S. (2005) ‚Urban Effect
on Surface Air Temperature in Uyo (Nigeria)‛ Nigerian
Journal of Space Research, Vol. 1, pp 73.