indian agriculture: recent performance and prospects in the wake of globalization indian...
TRANSCRIPT

Indian Agriculture: Indian Agriculture:
Recent Performance and Prospects in Recent Performance and Prospects in
the Wake of Globalizationthe Wake of Globalization
R.P.S.Malik
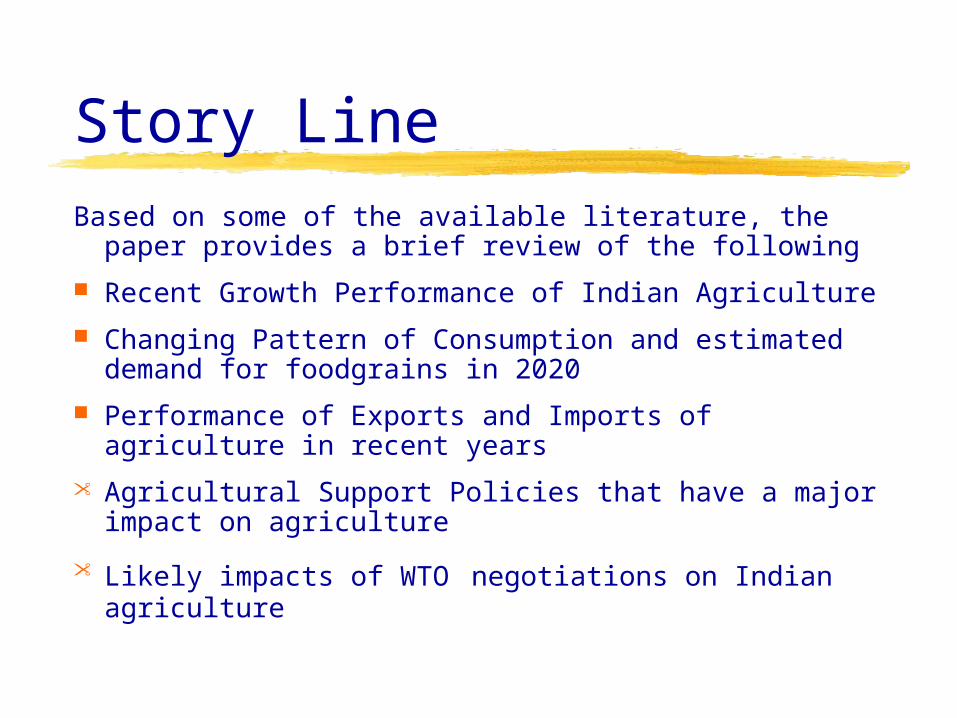
Story LineBased on some of the available literature, the paper provides
a brief review of the following
Recent Growth Performance of Indian Agriculture
Changing Pattern of Consumption and estimated demand for foodgrains in 2020
Performance of Exports and Imports of agriculture in recent years
Agricultural Support Policies that have a major impact on agriculture
Likely impacts of WTO negotiations on Indian agriculture

Annual Production of Important Crops during Selected
Periods (Million Tonnes)
TE Ending
Foodgrains Rice Wheat
Coarse Cereals
Total Pulses
Oilseeds Cotton
Sugarcane
1980-81 123.73 49.91 34.55 31.24 10.46 7.95 7.95 144.91
1990-91 172.45 72.78 53.03 53.03 13.66 8.42 8.42 223.22
2000-01 203.41 86.91 72.45 72.45 13.14 6.88 6.88 294.67
2003-04 199.70 84.33 69.98 69.98 13.25 6.57 6.57 271.65

Compound Growth Rates of Production and Yield of Important Crops (Base TE 1981-82=100) (% Per annum)
Production Yield
Crop 1980-81 to 1989-90
1990-91 to 1999-00
2000-01 to 2003-04
1980-81 to 1989-90
1990-91 to1999-00
2000-01 to 2003-04
Rice 3.62 2.02 -1.47 3.19 1.34 0.88
Wheat 3.57 3.57 -0.12 3.10 1.83 -0.53
Coarse Cereals 0.40 -0.02 3.48 1.62 1.82 3.54
Total Cereals 3.03 -0.02 -0.53 2.90 1.59 0.85
Total Pulses 1.52 0.59 8.01 1.61 0.93 3.22
Foodgrains 2.85 2.02 0.27 2.74 1.52 0.94
Sugarcane 2.70 2.73 -6.79 1.24 1.05 -5.01
Oilseeds 5.20 1.63 5.17 2.43 1.15 5.02
Cotton 2.80 2.29 10.22 4.10 -0.41 15.97
Non Foodgrains 3.77 2.69 1.35 2.31 1.09 2.40
All Principal Crops
3.19 2.29 0.70 2.56 1.33 1.53

The long term trend of agricultural production in India can largely be attributed to a variety of factors such as: •Declining public investment•Failure to carry out essential reforms to conserve water and soil•Unabated degradation of natural resources•A weakened support systems due to financial problems of state governments.

•While reversing the trend of declining investment in agriculture, which has often been cited as the most important factor for deceleration in growth especially during the 1990s, could contribute significantly to reversing the observed deceleration in the growth of agriculture, it will not however be wise to expect that investment alone will reverse this trend.
•In order to make investment in agricultural infrastructure yield the desired results in terms of higher productivity and production, it would be imperative to pursue reforms vigorously in many areas such as agricultural research, extension, credit, marketing, etc.,
•These reforms collectively would determine the reduction in cost of production and profitability of agriculture. It is the profitability that would ultimately drive the engine of innovation, entrepreneurship and growth.

From the point of agricultural production, however, the single most effective supply side constraint is that irrigation coverage still extends to only about 40 per cent of net sown area.
Need for new Investments in Major irrigation and multipurpose projects Almost 90 million ha or 60 % of net sown area dependent on rainfall
Net irrigated area is required to increase by at least 35 million ha (to 92 million ha by 2025) for meeting the demand for foodgrains and commercial crops. Most of this additional irrigation will have to come from new surface irrigation projects since the past trends in increasing tubewell irrigation can not be sustained due to declining groundwater tables in arid and semi-arid regions.

Changes in Food Consumption Pattern in Rural and Urban India 1977-99(Quantity in Kg/Person per annum)
Item/Year
Rural1977 1987 1993 1999
Urban1977 1987 1993 1999
Rice 86.5 88.1 85.4 81.0 67.6 68.1 64.2 62.5
Wheat 49.4 61.6 53.5 53.9 64.6 60.4 57.4 55.4
Coarse Cereals
56.7 29.8 24.1 17.7 14.8 10.6 7.7 7.1
Total Cereals
192.6 179.5 163.0 152.6 147.0 139.1 129.3 125.0
Pulses 8.7 11.5 9.2 10.1 11.7 12.2 10.5 12.0
Milk and Products
24.6 58.0 51.4 50.5 39.7 64.9 68.3 72.4
Edible Oils
2.7 4.3 4.6 6.0 4.8 6.8 6.3 8.6
Vegetables
24.7 50.8 53.2 66.0 39.7 66.4 63.1 70.0
Fruits 2.6 10.3 9.8 17.0 5.9 18.8 20.1 19.0
Meat, Eggs and Fish
2.7 3.3 4.1 5.0 4.8 4.9 6.8 6.8
Sugar and Gur
13.5 11.0 9.2 10.1 17.1 12.3 11.8 12.0

Changing demand for Foodgrains
•There has been a slow down in the growth rate of direct demand for foodgrains consumption on account of several factors- deceleration in growth rate of population, changing per capita income, changing tastes and preferences, declining income elasticity of demand for foodgrains, changing patterns of consumption in both rural and urban areas etc
•In between the period from 1977-1999, the cereal consumption per capita in rural areas declined from 192.6 Kg per annum to 152.6 Kg per annum ( a decline of about 21 percent) while in urban areas the corresponding decline was from 147 Kg to 125 Kg ( a decline of about 15 percent).
•An important feature of decline in consumption has been that the decline has occurred in all cereals- rice, wheat, and coarse cereals.
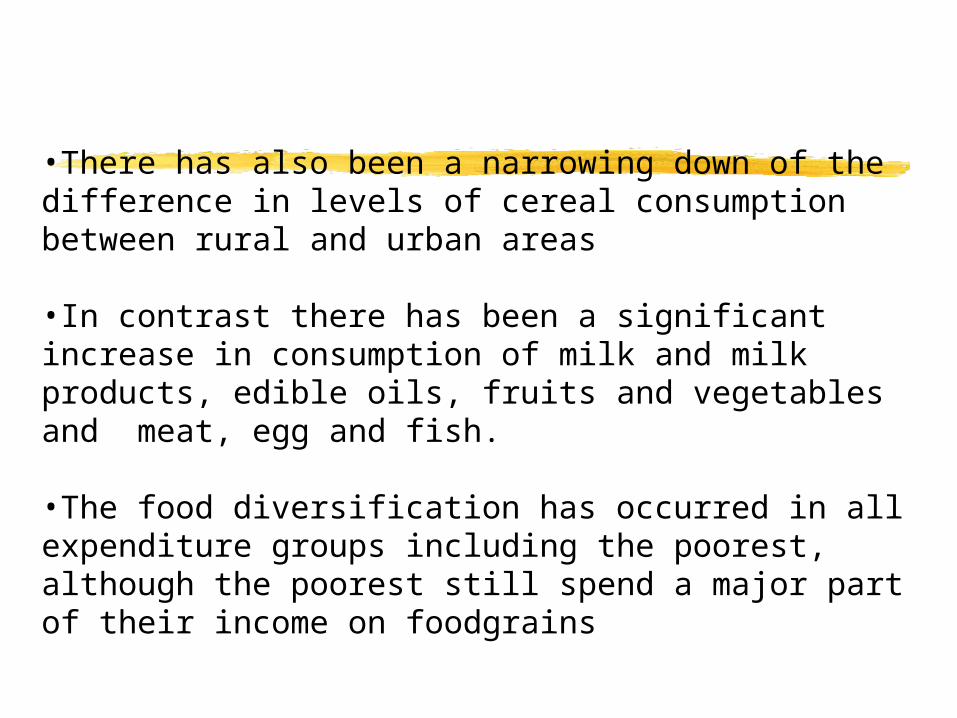
•There has also been a narrowing down of the difference in levels of cereal consumption between rural and urban areas
•In contrast there has been a significant increase in consumption of milk and milk products, edible oils, fruits and vegetables and meat, egg and fish.
•The food diversification has occurred in all expenditure groups including the poorest, although the poorest still spend a major part of their income on foodgrains

Estimated Demand for Cereals in India: 2020
Based on Estimated demand (Million Tonnes)
Bhalla et al 257 to 375
IMPACT 237
Kumar and Mittal 269
Radhakrishna and Reddy 253
Bansil 241

Exports of Agricultural Commodities
from India ( Value in Million US$) Year Total Exports Agricultural Exports Agr Exports as % Total
Exports1960-61 1348 596 44.21
1970.-71 2031 644 31.71
1980-81 8484.7 2600 30.64
1990-91 18145 3354 18.49
1991-92 17865 3203 17.93
1992-93 1537 3136 16.92
1993-94 22238 4028 18.11
1994-95 26331 4226 16.05
1995-96 31795 6082 19.13
1996-97 33470 6863 20.50
1997-98 35006 6626 18.93
1998-99 33219 6035 18.17
1999-00 36822 5773 15.68
2000-01 44560 6256 14.04
2001-02 43827 6146 14.03
2002-03 52719 6962 13.21
2003-04 63843 7888 12.36

Performance of Agricultural Exports from India
•During 1961-71, India’s agricultural exports grew at a rate of only 0.78 percent per annum
•Between 1971 -81 exports grew at an annual average growth rate of 18.36 percent. During the decade of 1980s the growth rate of exports again plummeted to 2.24 percent per annum.
•The economic liberalization and trade reforms introduced in 1991, helped India accelerate the growth rate of exports to 7.42 percent per annum. While during the first half of the 1990s agricultural exports performed extremely well, however since 1995-96 these have shown extreme fluctuations.
•Although the WTO Agreement on Agriculture in 1995 was expected to improve India’s agricultural exports, this does not seem to have happened. •There have recently been some signs of a turnaround during 2002-03 and it is
expected that this trend will continue.

Examined from another angle
•The share of agricultural exports, which constituted more than 30 percent of the total exports from the country during 1970-71 and 1980-81, have of late been declining consistently, more so in recent years.
•The declining trend is more noticeable in the post liberalization and post WTO periods.
•In 1990-91 agricultural exports constituted about 18 percent of the total exports which in 2000-01 went down to 14 percent. In 2003-04 agricultural exports constituted only
12.4 percent of all exports. •Not only the share of agricultural exports in the total merchandise exports has come down steadily over the years but the share of agricultural exports (including processed food) in agricultural GDP has also declined from 7.6 percent in 1995-96 to 6.3 percent in 2001-02 and recovered to 6.9 percent in 2003-04

Recent Export Trends
•Trends in exports of various commodities during recent years suggest that many commodities like rice, meat products, processed foods, fish, fruits and vegetables registered very high growth rates during the nineties.
•On the other hand some traditional exports like tea, cotton were not able to sustain their growth rates after the liberalization.
•Recently oilmeal exports have suffered and cotton exports have collapsed
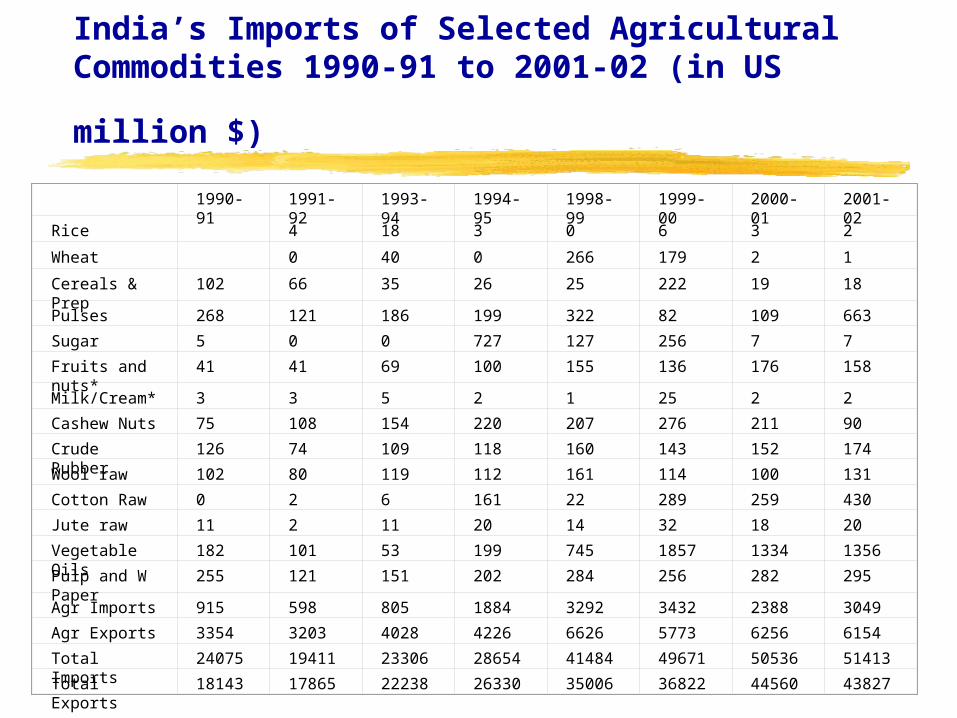
India’s Imports of Selected Agricultural Commodities 1990-91 to 2001-02 (in US
million $) 1990-91 1991-92 1993-94 1994-95 1998-99 1999-00 2000-01 2001-02
Rice 4 18 3 0 6 3 2
Wheat 0 40 0 266 179 2 1
Cereals & Prep 102 66 35 26 25 222 19 18
Pulses 268 121 186 199 322 82 109 663
Sugar 5 0 0 727 127 256 7 7
Fruits and nuts* 41 41 69 100 155 136 176 158
Milk/Cream* 3 3 5 2 1 25 2 2
Cashew Nuts 75 108 154 220 207 276 211 90
Crude Rubber 126 74 109 118 160 143 152 174
Wool raw 102 80 119 112 161 114 100 131
Cotton Raw 0 2 6 161 22 289 259 430
Jute raw 11 2 11 20 14 32 18 20
Vegetable Oils 182 101 53 199 745 1857 1334 1356
Pulp and W Paper
255 121 151 202 284 256 282 295
Agr Imports 915 598 805 1884 3292 3432 2388 3049
Agr Exports 3354 3203 4028 4226 6626 5773 6256 6154
Total Imports 24075 19411 23306 28654 41484 49671 50536 51413
Total Exports 18143 17865 22238 26330 35006 36822 44560 43827

Agricultural Imports
•India’s agricultural imports have displayed extreme fluctuations, with sudden surge in imports during the mid 90s.
•The percentage share of agricultural imports in total imports also has shown very high volatility, having moved in the range of 28 per cent to less than 2 per cent during the same period.
•In recent years agricultural imports have grown at a relatively high rate of about 23, 22 and 27 per cent in 2001-02, 2002-03 and 2003-04 respectively. •In recent years, imports of only two items, namely, pulses and edible oils have recorded consistently high volumes. There has also been a sharp increase in imports of cotton, raw wool and rubber.

On Import-Export Balance
•While after 1996 there was a deceleration in export growth, the agricultural imports have shown an increase. In fact the gap between agricultural exports and imports have been narrowing down in recent years.
•Although India abolished its QR’s in 2001, this has not resulted in any surge of agricultural imports. There is an increase in growth but this is mainly because of large imports of edible oils

Agricultural Support Policies:
Protecting and Supporting Agriculture
Broadly can be clubbed in to three categories
•Domestic policies
•Import policies and
•Export policies

The domestic policies comprise
Input subsidies on fertilizers, power, irrigation water Public investment in development of water resources –surface and groundwater Government intervention in markets Direct payment to farmers (such as those in the form of deficiency payments, insurance and disaster payments, stabilization payments, as also some compensatory payments) Price support for major crops General services (such as government transfers to agricultural research and development, extension services, training and agricultural infrastructure etc) Other support (comprising such measures like certain tax concession specific to agriculture or local or substantial level funding for agriculture etc).

Import policies
Refer essentially to border protection through trade barriers such as quantitative restrictions, quotas and tariffs on imports which in the process create a wedge between domestic and world market prices.

Export policies
Include those that either promote exports (through instruments like subsidies and marketing arrangements that make exportables of a country more competitive) or those policies that constrain exports (often through canalization and restriction of exports and export taxes etc). Usually however import policies etc are discussed in the context of trade policies rather than support to agriculture per se

Input Subsidies in Indian Agriculture- All India
Years Billion Rs Input Subsidies in Indian Agriculture Per Ha of GCAYear Power Fertiliser Irrigati
onAt current prices (Bn Rs)
At 1981-82 prices (Bn Rs)
As % of GDP in Agriculture
As % of GDP
Current Prices
Constant Prices
1981-82=1001980-81 3.68 - 4.12 7.8 8.7 1.8 0.64 45.2 50.31981-82 4.47 2.33 4.58 11.4 11.4 2.4 0.80 64.3 64.31982-83 5.83 0.82 5.42 12.1 11.5 2.4 0.76 69.9 66.61983-84 7.67 2.15 6.32 16.1 14.3 2.6 0.86 89.5 79.41984-85 9.97 12.12 7.25 29.3 24.4 4.5 1.41 166.8 138.91985-86 13.04 14.22 7.44 34.7 27.7 5.0 1.48 195.7 156.01986-87 17.06 -0.72 10.78 27.1 20.4 3.6 1.04 153.3 115.51987-88 25.35 5.27 19.72 50.3 35.1 6.0 1.71 294.8 205.31988-89 30.07 18.97 23.54 72.6 47.0 7.0 2.06 398.2 258.11989-90 35.94 28.58 23.09 87.6 52.9 7.6 2.14 480.7 290.11990-91 46.21 45.58 25.71 117.5 64.3 8.7 2.46 632.7 346.31991-92 58.84 35.07 28.68 122.6 59.0 7.7 2.22 672.7 323.71992-93 73.44 32.61 32.88 138.9 60.7 7.8 2.20 749.0 327.51993-94 89.57 33.52 34.41 157.5 63.6 7.1 2.02 844.9 341.01994-95 112.0 78.89 39.54 230.4 83.9 9.0 2.52 1225.3 446.11995-96 138.38 96.94 44.12 279.4 94.5 10.1 2.62 1490.5 503.91996-97 155.85 96.32 44.39 296.6 94.3 8.9 2.40 1564.7 497.31997-98 190.21 81.59 46.56 318.4 96.5 9.0 2.30 1676.6 508.41998-99 224.96 83.14 49.37 357.5 101.4 8.3 2.22 1872.7 531.41999-00 262.71 62.07 52.18 377.0 104.0 8.8 2.13 1964.3 542.22000-01 288.14 81.27* 2001-02 62.12* 2002-03 62.19*
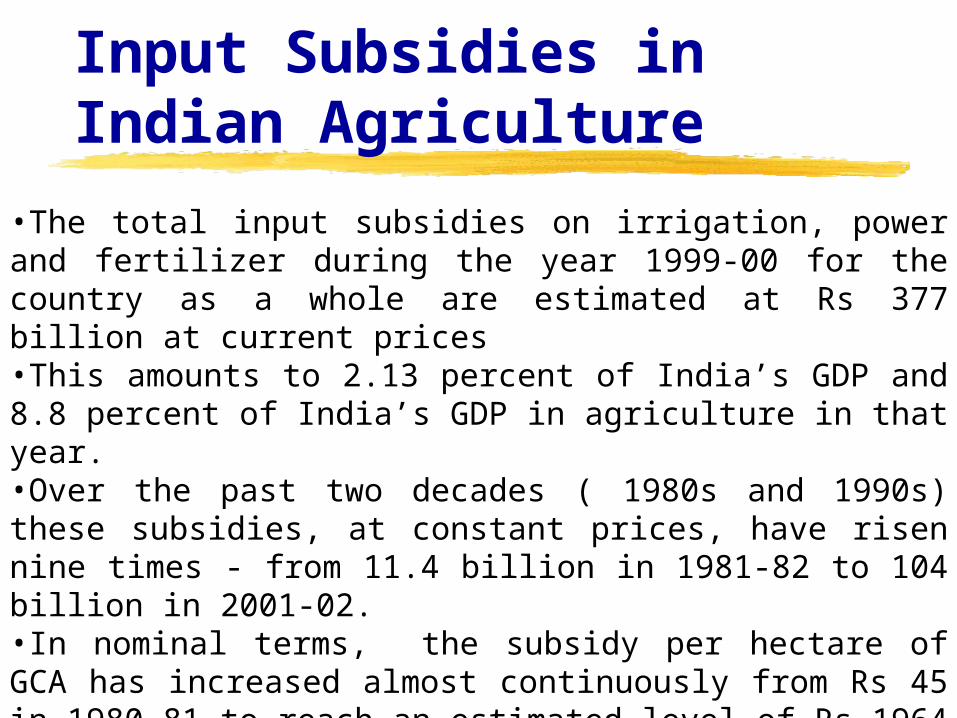
Input Subsidies in Indian Agriculture
•The total input subsidies on irrigation, power and fertilizer during the year 1999-00 for the country as a whole are estimated at Rs 377 billion at current prices•This amounts to 2.13 percent of India’s GDP and 8.8 percent of India’s GDP in agriculture in that year. •Over the past two decades ( 1980s and 1990s) these subsidies, at constant prices, have risen nine times - from 11.4 billion in 1981-82 to 104 billion in 2001-02. •In nominal terms, the subsidy per hectare of GCA has increased almost continuously from Rs 45 in 1980-81 to reach an estimated level of Rs 1964 in 1999-2000. •Measured in terms of constant prices, the subsidy per hectare of GCA has increased more than ten times during the two-decade period
Input Subsidies and Public Investment in Agriculture
•During 1999-00 the level of input subsidies (measured at 1993-94 prices) at more than Rs 250 billion was much higher than the public sector GCFA of Rs 50 billion. It is argued that even a modest reduction of subsidies, say, to the extent of 20 percent could enable the government to double its investment in agriculture.
•While subsidy reduction is one way to find resources for increasing public investment in agriculture, it may be more beneficial to focus on those aspects of all subsidies, current and capital, that lead to distortions and deleterious effects on natural resources and cropping pattern. In fact, there is scope for significant reduction in the cost of subsidy through better designing of the programmes and delivery mechanism.
•The input subsidies have often been accused of causing most harmful effect in terms of reduced public investment in agriculture on account of the erosion of investible resources, and wasteful use of scarce resources like water and power.
•Merely rolling back subsidies and diverting these to agricultural investment cannot solve all the problems of agriculture

Export Subsidy Provided by India (US $ Million)
Year Commodities Amount (US $ Million)
1996 Fresh fruits, fresh vegetables, plants and flowers, cardamom 1.99
1997 Fresh fruits, fresh vegetables, plants and flowers, 3.92
1998 Fresh fruits, fresh vegetables, plants and flowers, poultry products
2.51
1999 Fresh fruits, fresh vegetables, plants and flowers, poultry products
2.33
2000 Fresh fruits, fresh vegetables, plants and flowers, cardamom 1.10

Globalization and Domestic Policies Reforms
•The importance of domestic reforms in an environment of increased global integration has been widely acknowledged.
•Policy constraints such as restrictions on movement of agricultural commodities and ad hocism in export policy have been cited as a major source of regulatory problems.
•The Government of India removed several statutory restrictions in its 2002 National Agricultural Policy.•In early 2004 the Government liberalized procurement of food grains for the export market; exporters are now permitted to procure rice and wheat from farmers at market-determined rates.
•The incentives and climate for private investment have improved

•As a result of commitments under the Uruguay Round, India has bound all the tariff lines in agriculture. The applied rates have been much lower than even the bound rates.
•The product-specific support is negative, while the non-product specific support i.e., subsidies on agricultural inputs, such as, power, irrigation, fertilizers etc., is well below the permissible level of 10% of the value of agricultural output. •India is under no obligation to reduce domestic support currently extended to the agricultural sector.
•Export subsidies of the kind listed in the Agreement on Agriculture, which attract reduction commitments, are not extended in India.
Potential impacts of liberalization
•Estimating the potential impacts of liberalization of trade in agricultural and non- agricultural commodities in the wake of WTO negotiations on the agriculture is complicated and would depend on the outcome of the negotiations currently underway
•More specifically it would in large part depend upon the extent to which the developed countries are willing to scale down their domestic support , export subsidies, tariffs, and non tariff barriers and let increase their market access for the developing and least developed countries .
•While several proposals are currently on the table in respect of each of these components, agreements have alluded all of them

•Several researchers have nevertheless attempted to evaluate, using the scenario analysis approach, the likely impacts of some of the alternative proposals under discussion in one or more of these areas on one or more of the affected variables viz international prices, production, trade and welfare at the global and /or at the level of a region/country.
•The results from most of the studies on liberalization of agricultural trade point towards an increase in international prices of a majority of the agricultural commodities, increase in volume of international trade and an increased welfare consequent upon liberalization. The impacts on production of different crops, principally the cereals, however appear to be marginal

•A comparison of the relative impacts of alternative scenarios analyzed in a partial equilibrium framework indicate that cuts in tariffs would yield higher gains overall for India, rather than domestic support and export subsidy cuts. Moreover, the deeper the tariff cuts the higher are the gains. However, if the number of tariff bands are increased, even with deeper tariff cuts, India’s gains would decrease. •Asymmetric across the board cuts of the Uruguay Round would yield the most significant gains for India in terms of several parameters, but export gains are modest, and the losses would also be lower than in the three or four band formula. •The effects of reduction in domestic subsidy are much lower than the effects of reduction in export subsidy. Thus India should target a negotiating strategy preferably with Uruguay Round cuts. However, if that were not to be possible, then fewer bands with deeper progressive cuts would be better for India. However, the welfare gains of tariff liberalization along with domestic subsidy and export subsidy reductions are very significant

Change In Key Agricultural Trade, Production And Welfare Indices For India
UR Formula 3 Band Soft 3 Band Hard 4 Brand Hard
Production(% Change)
1.266 1.180 1.333 2.082
Imports(% Change)
7.76 6.44 13.90 8.87
Exports(% Change)
67.92 62.20 90.14 103.17
Consumer Surplus (USD Million)
-948 -909 -766 -1,642
Producer Surplus (SUD Million)
970 920 825 1,696
TotalWelfare(USD Million)
73 55 139 112


Export Subsidy Cut Simulation Results: Impact on Production of Select Commodities (Percent Changes
Commodity % Change in Production
Wheat 0.18
Rice -0.003
Barley 0.88
Maize -0.27
Pulses 0.0006
Cotton 0
Sugar, Raw 0.18
Total (All commodities including those not listed above)
0.12

Domestic Subsidy Cut Simulation Results: Impact on Production of Select Commodities (Percent Changes)
Commodity % Change in Production
Wheat 0
Rice 0.01
Barley -.01
Maize 0.003
Pulses 0
Cotton 0
Sugar, Raw 0
Total (All commodities including those not listed above)
0.001

In general thus if the prices of agricultural commodities like rice, cotton, wheat, sugar etc were to rise, India could generally improve its exports. Developing countries and the agricultural market in general stands to gain major benefits of reducing and eliminating subsidies and domestic support. It is however necessary to emphasize that this is only a general equilibrium picture and might be slightly more optimistic than reality, as certain products of particular interest to India are likely to be liberalized least and there are other competitors who will because of high trade logistic costs in India rush to fill the breach.

Thank you!