india skills report 2015
TRANSCRIPT

KNOWLEDGE PARTNER INDIA PARTNER NETWORK PARTNER
INDIA SKILLS
2015POWERED BY
REPORT
17th Floor, Tower – C, DLF Cyber CityBuilding # 5 ( Cyber Terraces )
Gurgaon, Haryana 122 002
A-10, Infocity, 1st Floor, Sector 34,Gurgaon, Haryana 122001
A-10, Infocity, 2nd Floor, Sector 34,Gurgaon, Haryana 122001
249-F, Sector 18, Udyog Vihar, Phase IV,Gurgaon, Haryana 122015

Reaching over 3,00,000 students across 29 states, 7 union territories and more than 125 corporate players from the demand side of Talent Supply Chain

ABOUT THETEAM
PeopleStrong
Wheebox
CII – India Partner LinkedIn - Network Partner
PeopleStrong is a leading platform-based mpHRO
(Multi-process HR Outsourcing) and technology
company, headquartered at Gurgaon, India. It specialises
in HR shared services, recruitment process outsourcing
(RPO), payroll & compliance management, and cloud-
based HR technology solutions. Since its establishment
in 2005, the company has built a unique combination of
domain expertise, operational excellence and innovative
technology to deliver optimum level of services to its
customers. Through its platform-based HR solutions,
PeopleStrong facilitates the customers to achieve higher
gain margins, efficient business functions, increased
productivity levels, better return on investment (ROI)
and ‘happier employees’. PeopleStrong has clients across
diverse industry sectors. The company is one of the first
India’s Leading Online Talent Assessment Company,
Wheebox designs and delivers online tests for nearly
500 thousand users annually in the pre-hiring and
learning business. Wheebox provides examination
process and assessment solutions to mid to large
enterprise customers, educational institutions and the
government. Headquartered in Gurgaon, Wheebox
has presence through its partners in South Africa and
Middle East and 21 cities in India, including a network of
partner owned testing centers. Wheebox partners with
LinkedIn and the Confederation of Indian Industries for
India Skills Report. The test research & development
teams have created a battery of over 100 validated tests,
spanning areas like English, Cognitive Skills, Personality,
Information Technology, general abilities and domain
skills like Finance, BFSI, Retail, Sales, Automobile etc.
Wheebox is the only Indian Assessment Company
certified by International Test Commission and IBM Labs
on Scalable Platform.
CII is a nongovernment, notforprofit, industry-led and
industry-managed organization, playing a proactive role
in India’s development process. Founded over 113 years
ago, it is India’s premier business association, with a direct
membership of over 7500 organisations from the private
as well as public sectors, including SMEs and MNCs, and
an indirect membership of over 83,000 companies from
around 380 national and regional sectoral associations.
CII catalyses change by working closely with government
on policy issues, enhancing efficiency, competitiveness
and expanding business opportunities for industry
through a range of specialized services and global
linkages.
It also provides a platform for sectoral consensus
building and networking. Major emphasis is laid on
projecting a positive image of business, assisting
industry to identify and execute corporate citizenship
programmes. Partnerships with over 120 NGOs across
the country carry forward the initiatives in integrated
and inclusive development, which include health,
education, livelihood, diversity management, skill
development and water, to name a few.
Founded in 2003, LinkedIn connects the world’s
professionals to make them more productive and
successful. With more than 313 million members
worldwide, including executives from every Fortune 500
company, LinkedIn is the world’s largest professional
network on the internet. The company has a
diversified business model with revenue coming from
Talent Solutions, Marketing Solutions and Premium
Subscriptions products. Headquartered in Silicon Valley,
LinkedIn has offices across the globe.
5
platform-based integrated HRO/RPO companies in India
to be successfully assessed on Statement on Standards
for Attestation Engagements (SSAE) No. 16 for reporting
on controls by Auditing Standards Board of the American
Institute of Certified Public Accountants.
FOREWORDIndia sits on an opportune moment in history, with a
demographic dividend of 65% of her human resource
pool under the age of 35 with about 12 million individuals
expected to join the workforce every year. With the
demographic dividend, comes the responsibility of
equipping the youth with employable training and in-
turn, employment.
With India metamorphosing into one of the fastest
growing economies, job creation and skilling seem to be
natural tools to ensure sustainable growth. The system
has, however, been plagued with theories of demand
supply mismatch and the absence of credible data.
Realising the urgent need to provide accurate analysis,
CII partnered with Wheebox, PeopleStrong and LinkedIn
to bring out the India Skills Report which is a conscious,
one-of-a-kind effort to provide an insight into the hiring
trends of the market while understanding the needs of
the job seeker and organisations.
The second edition of the report has reached out to
about 3,00,000 students across 29 states and 7 union
territories from the supply side and corporate players
from 10 diverse industry sectors on the demand side.
I congratulate the India Skill Report Team for the second
successful edition of this report and for bringing the
government, industry and academia, all on one platform.
I convey my best wishes to the team and I am confident
that this initiative will give a clear understanding and
enable bridging of the talent demand and supply in the
country.
7
ACKNOWLEDGEMENTS
It is with great pleasure that we present to you the
second edition of the India Skills Report. Like the first
edition that was launched last year in November, this
report is a joint effort of a lot of people and we would
like to recognize and express our gratitude.
First and foremost we would like to thank all the 3,00,000
students from 29 states and 7 union Territories of India
who appeared for WEST and helped in preparing the
first skill database of the country. It was inspiring to
meet India’s future workforce that is going to be driving
force for India’s move towards development.
We would like to thank the corporates spread across
10 Industry sectors, who participated in our corporate
job survey and provided meaningful insights about
the hiring trends. Thanks are also due to the heads of
all participating educational institutes, who helped us
in ensuring our reach to the talent pool of India. This
initiative would not have been possible without their
guidance and support.
We express our sincere gratitude to the experts from
business, government and civil society who took out
time and shared their views on the skill levels and talent
supply chain. Their inputs brought in a reality dimension
to the report and helped us in making the report truly
powerful and practical.
Last but not the least, we wish to thank all the members
of the CII National Committee on Skills Development,
and CII office bearers across states, who have lent
invaluable support in administering WEST and India’s
Job Prediction Survey. Their support helped us in
making students and corporate across the nation, part
of this initiative in large numbers.
Thanks for being part of this initiative with us. We hope
that with your support, we will be able to create India’s
first and unique platform for skill development and
deployment.
Chandrajit BanerjeeDirector General, Confederation of Indian Industry

9
TESTIMONIALS
This India Skills Report is an essential element to highlight both the scale of the challenge and the opportunity
it represents, and this tripartite collaboration is essential for solving the challenges of skills development.
The India Skills Report is an extremely important benchmark to help us measure and evaluate progress
against this challenge because if we can’t measure it, we can’t fix it! As it shows, with an employability index
of only 37.2%, these problems left unsolved will only get worse and pose a great threat to India’s future.
With the newly found focus and initiative on skill development we are confident that the quality of talent/
skill supply will surely tum around. The plan is ready, the academia, Government and corporates just need to
act on it for results.
Pramod BhasinNon-Executive Vice Chairman, Genpact
Nishant K. RaoCountry Manager, LinkedIn India
Mr. Y. K.GuptaPro-Chancellor Sharda University and Vice Chairman, SGI
With a population of 1.3 billion, of which about 0.8 billion in the working age - India in 2020 is surely something
the world can look forward to. This report is an effort towards this goal. Initiatives like ISR (India Skills Report)
will benefit the stakeholders in the information technology domain in recognizing the skill levels of the supply
side and needs of the demand side of Talent Supply Chain.Akash Agarwal
Country Manager, EC Council India
With the economy looking up, we are confident of a lot more new jobs being created; skilling is thus the need
of the hour as rightly acknowledged by the Corporate Sector as well as the Government. If there was ever a
time for the demographic dividend that India is banking on to start paying off, it is now. Congratulations, a
fabulous report.Sandeep Sinha
Co-Founder & Managing Partner, Lumis Partner
I congratulate Wheebox and Team for launching the Second Edition of The India Skills Report which
will certainly help the Government, industry association to foster sector wise initiatives in the skill
development space. Dr. Rajendra Kumar Pandey
President, NIIT University Neemrana
Creating a skill pool that can be employed readily by the corporate is a mammoth task. The detailed
insights captured in India Skills Report would help in taking steps for matchmaking the skill demand
and supply.A K Shrivastava
AIM Board of Directors
There is a fundamental shift in the work we do, the workplaces we do it in and the workers who perform
it. The India Skills Report by PeopleStrong and Wheebox, in collaboration with CII can be a catalyst
towards initiating dialogue on initiatives needed to buy, build, borrow or boost talent.
Prithvi ShergillChief Human Resources Officer, HCL Technologies
We are happy to see the launch of the 2nd edition of the India Skills Report prepared by CII. The first edition
that was released last year, was well received by all our stakeholders as it had interesting insights and research.
The report is very well researched and it is good to see that it matches the requirement of both the demand
and the supply side. This will help us channelize our efforts and choose our partners accordingly. We will be
able to focus even better on respective industry sectors and ensure that we impart the right skills required
in those sectors.Dilip Chenoy
MD & CEO, NSDC
The India Skills Report, with comprehensive insights into India’s Skill Reservoir parallel to the industry
outlook can be used as strong base for transforming the education and recruitment cycle.
Arun Kumar JhaDirector General, Niesbud

CONTENTS
Executive Summary
Making of the New India-2014 & Beyond
Testing the Reservoir
WEST - An Analysis
12
13
16
17
EXECUTIVESUMMARY
Year 2014 has been a landmark year for India. While in
the political arena, we celebrated the biggest festival of
democracy as the first full majority government came
into power in many years, the Indian economy also
started its journey on the road of development. With this
newly found (Government-led) focus towards both job
generation and skill development, the country’s move
to reap the “Demographic Dividend” by 2020 has begun
with confident steps.
Whether it’s is the Skill India initiative, the transformation
of employment exchanges to career centers, or the extra
focus that is being placed on job generation by “Make
in India” and encouraging entrepreneurial ventures,
the ground work for being a developed nation is being
done. In parallel, there is the need of a joint effort from
various stakeholders in the skill landscape to implement
these plans.
India Skills Report 2015, the second edition of the
initiative is an effort towards this direction. It captures
the skill levels of the supply side and needs of the
demand side of the Talent Supply chain. With separate
studies conducted to understand each side, this report
tries to bring in a more realistic, holistic view of the skill
and talent landscape in India. In its second year, the
reach of the report has increased manifold with more
participation from both the skill supply and demand
side.
WEST, the Employability skill assessment test launched
on Wheebox.com reached all 34 States and Union
Territories and 1,800 educational campuses across India.
This year, the test assessed the talent pool entering the
job market on various parameters like –Cognitive Ability,
Numerical & Logical Ability, Communication Skills and
Behavioural traits. About 3,00,000 students spread
across these campuses were assessed on 244 domain
areas and skill gaps that are scientific in nature and were
validated using reliable Talent assessment tools. The
result was an overall picture depicting how the students
rank in terms of skills that would be imperative to judge
the employability in the coming times. Compared to last
year, when 33% of the candidates assessed were found
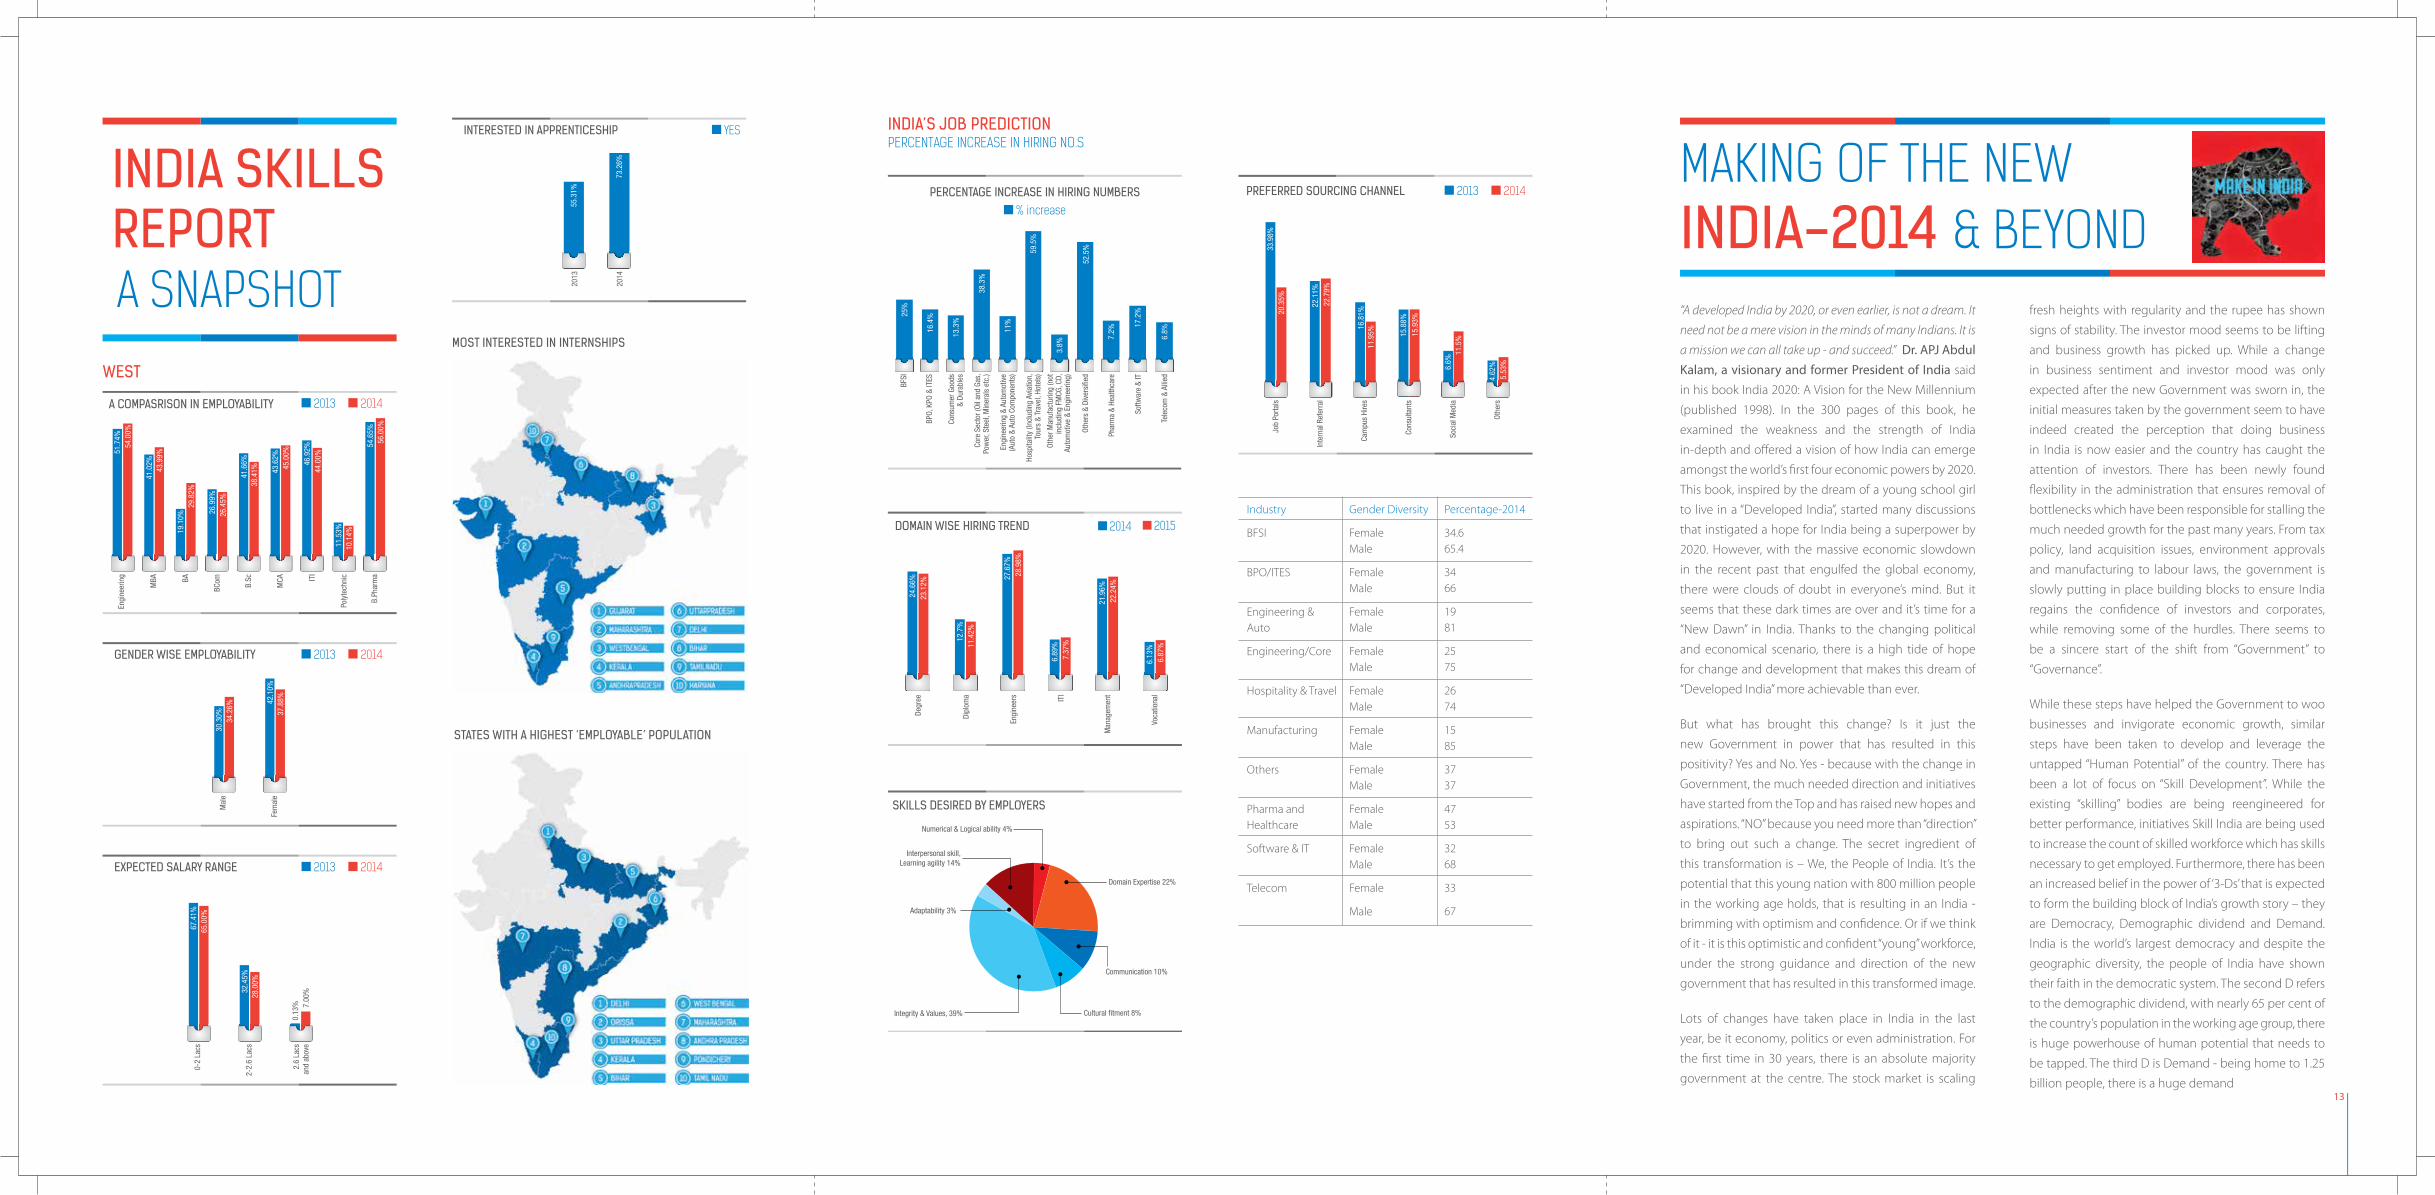
employable, this year the number increased to 37.22 %.
Though the increase is not much, it is encouraging to
see even this much improvement. As we also have to
consider that for something that requires more efforts
at the ground zero level, the results will take some more
time.
Through India’s Job Prediction Survey about 125
Employers, spread across 10 major sectors like
Manufacturing, Core, ITES, IT, BFSI etc. were approached
to get an idea of job demand and potential hiring
forecasts for the coming year. The result was an industry
wise hiring estimate for the coming year for different
profiles, and they look very encouraging. Compared
to last year, when the employers expected hardly any
change in their hiring numbers, this year across industry
sectors there is an increase of 20%. This is very good
news and confirms the positivity that is spread in the
market.
Combining this data collected from the supply and
demand side, the report aims to form the basis of
effective collaboration between the two ends of the
Talent Supply chain. On one hand, it aims to equip the
talent pool with information to access the jobs in the
market, on the other, to provide the employers an access
to the skill reservoir of the country.
This year’s report, like last year, consists of four major
sections. While section 1 sets up the context of the report
focusing on what changes have undergone in the past
one year, Section 2 and 3 are dedicated to the detailed
analysis of the Supply and Demand side of talent.
Section 4 matches the information from both the ends
to provide a consolidated view of the skill landscape
and make suggestions that can help in improving the
current situation to meet the challenging demands of
the bright future. In totality, there is a holistic view of the
talent market.
Considering the enormity of the impact the skill-job gap
is going to have in the socio-economic environment of
the country, platforms such as India Skills Report have a
vital role to play. With the kind of response and interest
that greeted the first edition of the report, we are sure
that with each coming year, the contribution would
increase.
13
MAKING OF THE NEWINDIA-2014 & BEYOND“A developed India by 2020, or even earlier, is not a dream. It
need not be a mere vision in the minds of many Indians. It is
a mission we can all take up - and succeed.” Dr. APJ Abdul Kalam, a visionary and former President of India said
in his book India 2020: A Vision for the New Millennium
(published 1998). In the 300 pages of this book, he
examined the weakness and the strength of India
in-depth and offered a vision of how India can emerge
amongst the world’s first four economic powers by 2020.
This book, inspired by the dream of a young school girl
to live in a “Developed India”, started many discussions
that instigated a hope for India being a superpower by
2020. However, with the massive economic slowdown
in the recent past that engulfed the global economy,
there were clouds of doubt in everyone’s mind. But it
seems that these dark times are over and it’s time for a
“New Dawn” in India. Thanks to the changing political
and economical scenario, there is a high tide of hope
for change and development that makes this dream of
“Developed India” more achievable than ever.
But what has brought this change? Is it just the
new Government in power that has resulted in this
positivity? Yes and No. Yes - because with the change in
Government, the much needed direction and initiatives
have started from the Top and has raised new hopes and
aspirations. “NO” because you need more than “direction”
to bring out such a change. The secret ingredient of
this transformation is – We, the People of India. It’s the
potential that this young nation with 800 million people
in the working age holds, that is resulting in an India -
brimming with optimism and confidence. Or if we think
of it - it is this optimistic and confident “young” workforce,
under the strong guidance and direction of the new
government that has resulted in this transformed image.
Lots of changes have taken place in India in the last
year, be it economy, politics or even administration. For
the first time in 30 years, there is an absolute majority
government at the centre. The stock market is scaling
fresh heights with regularity and the rupee has shown
signs of stability. The investor mood seems to be lifting
and business growth has picked up. While a change
in business sentiment and investor mood was only
expected after the new Government was sworn in, the
initial measures taken by the government seem to have
indeed created the perception that doing business
in India is now easier and the country has caught the
attention of investors. There has been newly found
flexibility in the administration that ensures removal of
bottlenecks which have been responsible for stalling the
much needed growth for the past many years. From tax
policy, land acquisition issues, environment approvals
and manufacturing to labour laws, the government is
slowly putting in place building blocks to ensure India
regains the confidence of investors and corporates,
while removing some of the hurdles. There seems to
be a sincere start of the shift from “Government” to
“Governance”.
While these steps have helped the Government to woo
businesses and invigorate economic growth, similar
steps have been taken to develop and leverage the
untapped “Human Potential” of the country. There has
been a lot of focus on “Skill Development”. While the
existing “skilling” bodies are being reengineered for
better performance, initiatives Skill India are being used
to increase the count of skilled workforce which has skills
necessary to get employed. Furthermore, there has been
an increased belief in the power of ‘3-Ds’ that is expected
to form the building block of India’s growth story – they
are Democracy, Demographic dividend and Demand.
India is the world’s largest democracy and despite the
geographic diversity, the people of India have shown
their faith in the democratic system. The second D refers
to the demographic dividend, with nearly 65 per cent of
the country’s population in the working age group, there
is huge powerhouse of human potential that needs to
be tapped. The third D is Demand - being home to 1.25
billion people, there is a huge demand
INDIA SKILLSREPORT A SNAPSHOT
2013
51.7
4%
41.0
2%43
.99%
26.9
9%26
.45%
41.6
6%
43.6
2%45
.00%
46.9
2%44
.00%
11.5
3%10
.14%
54.6
5%56
.00%
38.4
1%
54.0
0%
2014
19.1
0%29
.82%
Engi
neer
ing
MBA BA
BCom B.Sc
MCA IT
I
Poly
tech
nic
B.Ph
arm
a
A COMPASRISON IN EMPLOYABILITY
YESINTERESTED IN APPRENTICESHIP
55.3
1%20
13
73.2
6%20
14
MOST INTERESTED IN INTERNSHIPS
2013GENDER WISE EMPLOYABILITY 2014
30.3
0%34
.26%
Mal
e
42.1
0%37
.88%
Fem
ale
2013EXPECTED SALARY RANGE 2014
67.4
1%65
.00%
0-2
Lacs
32.4
5%28
.00%
2-2.
6 La
cs
0.13
% 7.00
%2.
6 La
csan
d ab
ove
STATES WITH A HIGHEST ‘EMPLOYABLE’ POPULATION
WEST
INDIA’S JOB PREDICTIONPERCENTAGE INCREASE IN HIRING NO.S
% increasePERCENTAGE INCREASE IN HIRING NUMBERS
25%
16.4
%
38.3
%
11%
59.5
%
3.8%
52.5
%
10.1
4%
7.2%13
.3%
BFSI
Othe
r Man
ufac
turin
g (n
otin
clud
ing
FMCG
, CD,
Aut
omot
ive
& En
gine
erin
g)
BPO,
KPO
& IT
ES
Cons
umer
Goo
ds&
Dura
bles
Core
Sec
tor (
Oil a
nd G
as,
Pow
er, S
teel
, Min
eral
s et
c.)
Engi
neer
ing
& Au
tom
otiv
e(A
uto
& Au
to C
ompo
nent
s)
Hosp
italit
y (In
clud
ing
Avia
tion,
Tour
s &
Trav
el, H
otel
s)
Othe
rs &
Div
ersi
fied
Phar
ma
& He
alth
care
Softw
are
& IT
Tele
com
& A
llied
17.2
%
6.8%
DOMAIN WISE HIRING TREND 2014 2015
24.6
6%23
.12%
12.7
%11
.42%
6.89
%7.
37%
21.9
6%22
.24%
6.13
%6.
87%
27.6
7%28
.98%
Degr
ee
Dipl
oma
Engi
neer
s ITI
Man
agem
ent
Voca
tiona
l
Integrity & Values, 39%
Adaptability 3%
Interpersonal skill,Learning agility 14%
Domain Expertise 22%
Communication 10%
Cultural fitment 8%
Numerical & Logical ability 4%
SKILLS DESIRED BY EMPLOYERS
2013 2014
Soci
al M
edia
6.6%
11.5
%
Cam
pus
Hire
s11
.95%
16.8
1%
Inte
rnal
Ref
erra
l22
.11%
22.7
9%
Job
Porta
ls20
.35%
33.9
8%
Othe
rs4.
62%
5.53
%
Cons
ulta
nts
15.8
8%
15.9
3%
PREFERRED SOURCING CHANNEL
Industry
BFSI
BPO/ITES
Engineering & Auto
Engineering/Core
Hospitality & Travel
Manufacturing
Others
Pharma and Healthcare
Software & IT
Telecom
Gender Diversity
Female Male
Female Male
Female Male
Female Male
Female Male
Female Male
Female Male
Female Male
Female Male
Female
Male
Percentage-2014
34.6 65.4
34 66
19 81
25 75
26 74
15 85
37 37
47 53
32 68
33
67

for all sorts of goods and services that makes the Indian
market an attractive prospect to everyone. The 3D’s in
short, capture the immense potential and opportunities
that we have. When there is such a golden opportunity
knocking at the door, why should we not take adequate
initiatives to make the most of it?
Campaigns like “Make in India” that aim at turning
the country into a global manufacturing hub and
increase the per capita income by creating jobs for
over 10 million people are such initiatives. These kinds
of steps are what will encourage the move of Indian
economy from a services-driven growth model to a
labour-intensive manufacturing-driven growth, which
is much more sustainable. By focusing on export-
oriented manufacturing, heavy infrastructure building
and urbanization in parallel, the Government aims to
emulate China and the East Asian economic model,
paving the way for sustained rapid economic expansion.
India will soon be entering the stage of reaping the demographic dividend. During this phase, most of
the population contributes to the country’s Gross
Domestic Product. It’s a phase of lower dependency
ratio – that refers to the number of children or elderly
dependent on each earning person. The lower the
dependency ratio - the higher economic growth will
be, all else being equal. This extra boost to growth is the
demographic dividend, and it is one of the best phases
in the life cycle of a nation. Focused steps need to be
taken to reap maximum benefits in this phase. While
replicating the remarkable economic development
model in both savings and GDP growth (known as the
‘East Asian economic miracle’) is a good approach, it is
equally important to understand and find a solution
to the unique problems of the country to make the
most of this opportunity. For a country to collect its full
demographic dividend, it has to put enough money
into education to turn a large number of those new
workers into moderately productive ones. The country’s
economy has to be organized so that the available
profits from a growing workforce get reinvested in the
economy. For nation like India, where the literacy rate
has huge variation from one end of the country to
another; and more than 90% of the workforce is part
of un-organized sector, this is the most daunting task
ever, and the sub optimal quality of the workforce is
something that increases the challenge associated with
it by multiple levels.
Another important thing to keep in mind is that this
growth phase would not stay for long. Research has
shown that it is a nation’s success or failure in realizing
the economic potential of young people during this
“low dependency ratio” period that can make the
difference between sustained and faltering long-term
development. (Dhillon and Yousef, Inclusion: Meeting
the 100 Million Youth Challenge, 2007). So, we have to
act fast.
Year 2020 is just round the corner, so there is hardly any
time to waste. It is essential to move on war footing and
take necessary action. We need to work both on improving
the supply of talent and at the same time, increasing the
demand of talent. Then only can the holistic growth
engine be developed. Some steps have already been
taken in this direction. The National Skill Development
Policy of 2009 has been revised, so that schemes of
different ministries and portions of the Rs. 10,000 crore
earmarked to encourage entrepreneurship are routed
through the newly formed skills ministry. Consolidation
of about 18 different government departments, who
are part of the skills mission are being worked upon to
bring more focus. Some already running campaigns like
“Rural Livelihood Mission” are being revamped to align
with the overall skills strategy of the Government. The
formulation of the National Skills Development Policy,
delivery of Modular Employable Schemes, upgradation
of existing institutions through World Bank and
Government of India funding, upgradation of training
institutes under Public Private Partnership mode, setting
up of the National Skill Development Corporation and
the plan to establish 50,000 Skill Development Centres
are all under progress all these steps are being taken.
On the demand side, the Government is placing special
focus to encourage entrepreneurship. In this year’s
budget, a separate fund was allocated to encourage
entrepreneurs and hence, job creation. The recently
launched “Make in India” campaign and relaxation of few
more FDI norms are being implemented to encourage
more corporates to operate out of India.
However, this might not be enough to make the move
towards a “Developed India”. Extensive steps to increase
the use of technology in the skill landscape are important.
We are talking about a 800 million strong workforce
and nothing but technology can help in handling such
wide scale. While on one hand training and skilling of
candidates should be digitized, so that even a student
sitting in the remotest village of the country can access
the sea of knowledge available online; the government
should also to revamp the existing matchmaking
machinery. The best way would be to utilize the existing
network of Employment Exchanges by transforming
them to much needed career centres. These institutes
should work as the meeting point of candidates and jobs.
A solid combination of People, Process and Technology
is what is needed to make this transformation.
In parallel, the government should try to work
more aggressively for attracting job creation by big
companies. Few steps that are needed without delay
include - getting rid of the age old regulations which
discourage people from establishing their businesses
in India, development of infrastructure, revamping of
the labour laws etc. Once these things are taken care
of, an ecosystem that encourages both the supply and
demand side of talent would have be created.
Having said that, the true success of the above mentioned
initiative is possible only if a partnership between the
source or reservoir of talent and the destination or
refinery of talent is ensured. The Government should
try to implement the model of PPP that has been doing
wonders in other sectors of the skill landscape as well.
It would require joint efforts from Government, Talent
Suppliers (Institutes/Academia), and Talent Absorbers
(Corporates/Employers) to make this possible.
It is a combination of all these actions that will help in
setting the strong foundations for a Developed India
by the year 2020. Though the way ahead looks difficult,
when we have a huge human potential of 0.8 billion
Indians with us, along with the support of Government,
Academia and Corporates, nothing can stop us from
reaching our goal and achieving the Vision 2020.
15

17
TESTING THE RESERVOIR
Skilling in India and the kind of strength that it can bring in to the Nation’s economy has been one of most deliberated topics of the recent times. Why shouldn’t it be, as per the reports by World Bank, India is one of the few countries in the world where the working age population will be far in excess of those dependent on them and, that this will continue for at least three decades till 2040 and this huge potential is the propellant for India’s move from being a developing nation to a “Developed nation” if we are able to equip and continuously upgrade the skills of the population in the working age group.
If we look at the current stock of the Skill landscape in India, the situation is not very good. As per India Skills Report 2014, we found out that of all the students entering the job market across the country, hardly 1/3rd meet the criteria of the employment set by the employers. The severity of the situation is accentuated by many levels when the economy is looking up, new jobs are getting generated; but there are not enough “skilled” people available. It is this gravity of the situation that has started various initiatives to combat this problem. In fact, Government of India has adopted skill development as a national priority over the next 10 years. The Eleventh Five-Year Plan has a detailed road-map for skill development in India and favours the formation of Skill Development Missions, both at the State and National levels, to create such an institutional base for skill development in India at the national level, a “Coordinated Action on Skill Development” with three-tier institutional structure consisting of the PM’s National Council on Skill Development, the National Skill Development Coordination Board (NSDCB) and the National Skill Development Corporation (NSDC) has been created. Though these initiatives are yet to show results, they certainly are in the right direction.
Though it is one thing to start any initiative, its equally important to measure how effective is it? Especially when it has something as crucial “talent” or “skills” at stake, that holds the future of the country. It is important to have framework to measure if our efforts are resulting in “skilled” workforce. Online assessment is one such tool that has been adapted by corporates to gauge talent or skills in their prospective employees. As the
aim of India Skills Report is to bring supply and demand side of the skill landscape together, it made sense to deploy the same tool to evaluate the talent pool (that is used by corporates to judge their employees). With this thought in mind was introduced the Wheebox Employability Skill Test. Launched in 29 States and 7 Union Territories across India the test was conducted to identify the skill gap that exists in the industry today by deploying a scientific approach across 260 domain areas. Compared to last year, when we were able to reach about 1 lakh students across locations and domains, this year we reached 3 lakh students. In addition to this, based on our interaction with the corporates across industry sectors few more behavioural parameters were included (namely: learning agility, interpersonal skills and adaptability) along with the parameters of last year’s assessment (namely: communication skills, logical ability, problem solving skills and domain knowledge). The basic objective of WEST was to bring reliable and authentic assessment to various aspects of education, training and employment. Every effort was made to provide a statistically valid multi-dimensional skill assessment to judge the employment suitability of a large pool of students. Parallely, feedback was also provided to students on development areas they need to work on to improve their employability.
The test went live on 4th August and was open till 22nd
October 2014. The kind of reception we received from students and the campuses was phenomenal. Across domains students took this test to know their skill level vis-à-vis the available skill pool and at the same time connect with the employers for their dream jobs.
Like last year, this year’s report showcases the demographic and geographic coverage of skill levels in India. Though the results do not appear to be promising, we are confident that with such efforts being put by stakeholders like Government, Corporates and academia, we will see more of the talent being employable. The preceding sections provide the detailed analysis of the supply side of skill landscape of India. We hope that this information helps in providing a more effective solution of the Skilling Challenges of the country; where all the players can collaborate and contribute to create a developed nation.
WEST - AN ANALYSIS
Online assessments are one of the most popular
instruments used by corporates to select the best suited
candidates for their organisation. Considering that they
are able to deliver better results in much less cost and
time, this has resulted in their wide acceptance across
industry sectors. Another important benefit of online
assessments is reach; since they can be accessed from
anywhere they are the best instruments cover a larger
area in a limited amount of time. It was all of the above
reasons that, when 29 states and 7 union territories of
the country were to be covered and 3 lakh students to
be assessed, Wheebox Employability Skill Test – a cloud
based online assessment platform was used. Based
on researches that say knowledge, skill, aptitude and
behavioural components make the recipe of success
in a job, the test assessed students across states and
courses on various parameters- numerical & logical
ability, communication skills and domain knowledge
etc. In addition to the parameters used last year, there
were four behavioural parameters introduced: Learning
Agility, Adaptability, Interpersonal Skills as now days they
form an important assessing parameter for corporates.
All the candidates were evaluated on all these sections
and a combined score of the three sections was used
to come up with the final score. All those who scored
more than 60% in the overall score were considered
employable. About 3,00,000 students from across
states took this test to know their “Employability Status”.
The states with maximum participation are: Tamil Nadu,
Uttar Pradesh, Andhra Pradesh, Maharashtra, Gujarat, Kerala, West Bengal, Haryana and Delhi.
The scores of these 3,00,000 students were then
dissected, based on the demographic and geographic
data captured along with the scores. Some really
interesting trends came up through this analysis which
will be covered in the coming pages. These insights
would, on one hand provide the students and colleges a
glimpse into their current skill levels; on the other hand
it would provide relevant information to the employers
for making effective Talent Acquisition strategies.
Out of about 3,00,000 candidates who appeared for
the Wheebox Employability Skill Test across domains,
37.22% were found employable. It shows an increase of
3.27 % in comparison to last year when the employability
percentage was just 33.95%. This improvement, though
minimal, is good news and does show that the initiatives
taken up by government towards skill development are
moving in the right direction. However, these initiatives
India has to achieve the target of skilling/upskilling 150
million people by 2022. The phrase skill gap refers to
redefining the relationship between education, industry
and business.
Dr. Rajendra Kumar PandeyPresident, NIIT University Neemrana
19
have a long way to go, if the gap between the supply &
the demand side is to be diminished. So the speed and
frequency of these efforts should be intensified.
Similar to last year, the spread of this “employable”
population is across the length and breadth of India.
When the scores of 3 lakh assessed students were
analysed geographically, few states appeared to have
more density of employable candidates than others.
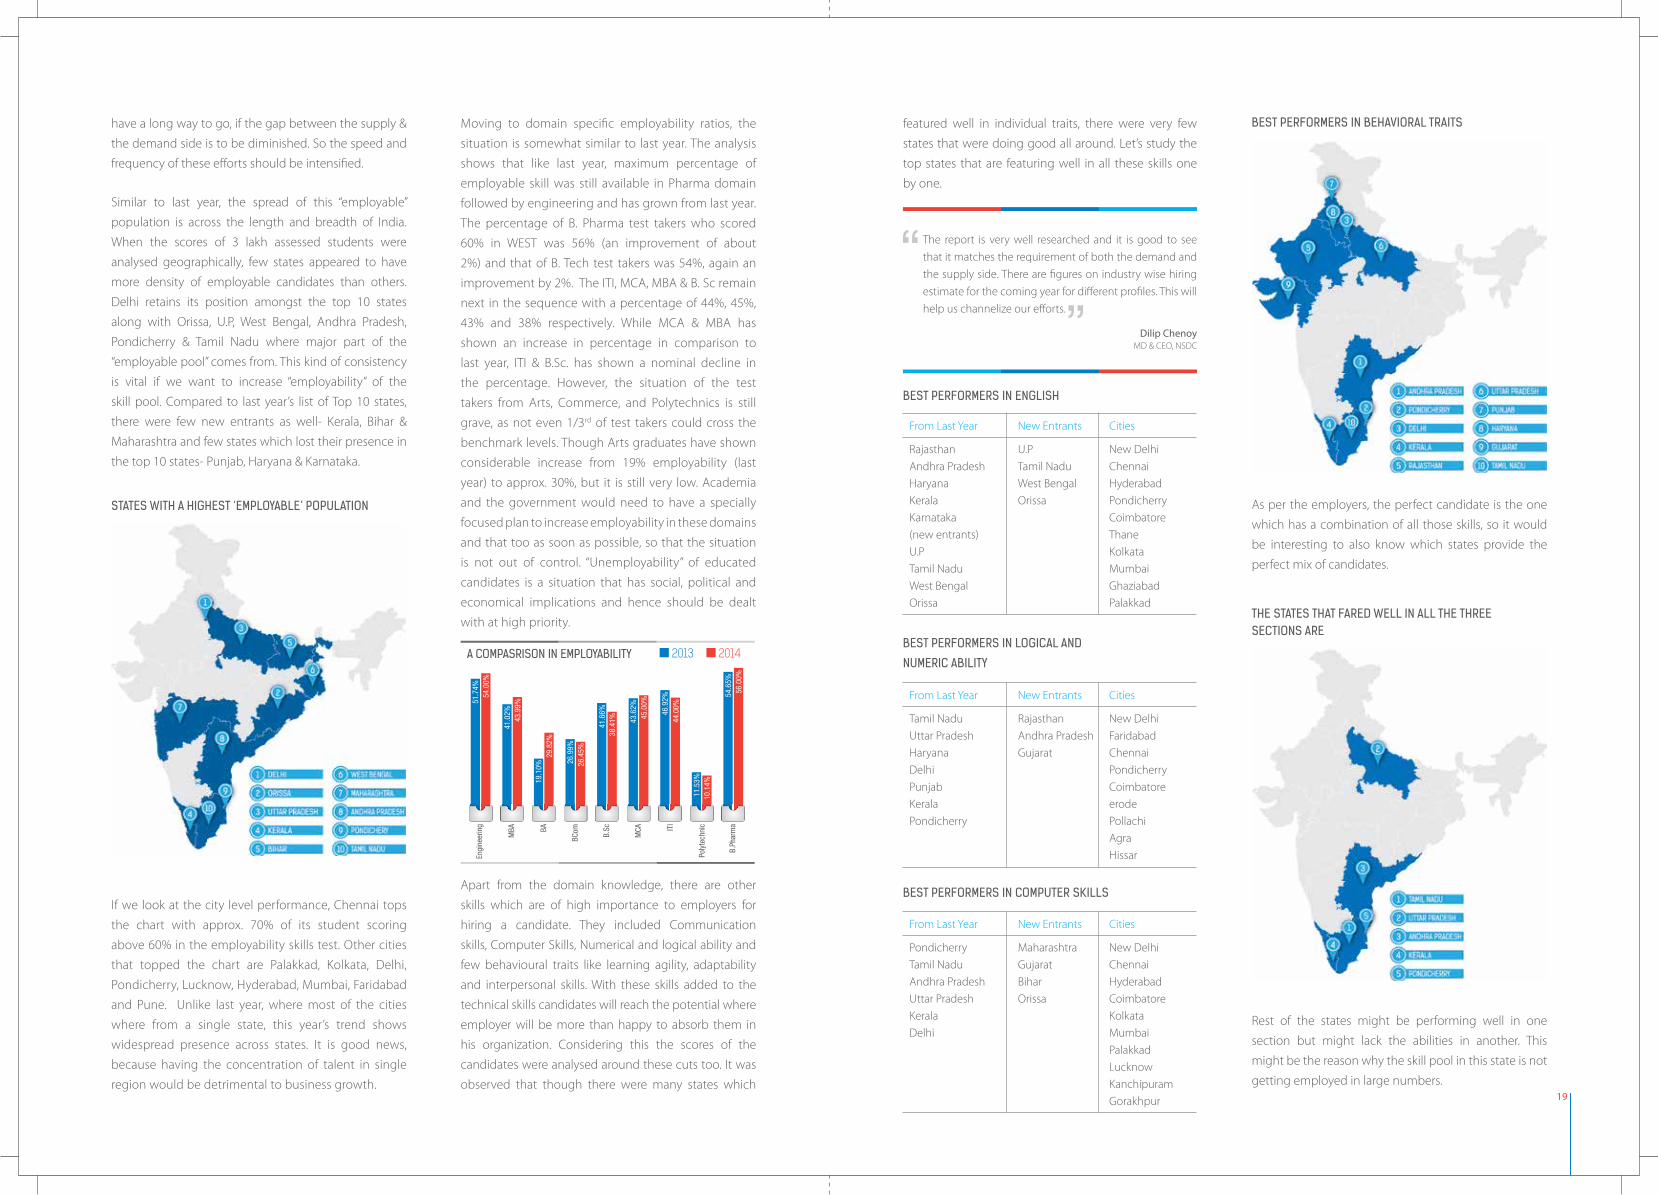
Delhi retains its position amongst the top 10 states
along with Orissa, U.P, West Bengal, Andhra Pradesh,
Pondicherry & Tamil Nadu where major part of the
“employable pool” comes from. This kind of consistency
is vital if we want to increase “employability” of the
skill pool. Compared to last year’s list of Top 10 states,
there were few new entrants as well- Kerala, Bihar &
Maharashtra and few states which lost their presence in
the top 10 states- Punjab, Haryana & Karnataka.
If we look at the city level performance, Chennai tops
the chart with approx. 70% of its student scoring
above 60% in the employability skills test. Other cities
that topped the chart are Palakkad, Kolkata, Delhi,
Pondicherry, Lucknow, Hyderabad, Mumbai, Faridabad
and Pune. Unlike last year, where most of the cities
where from a single state, this year’s trend shows
widespread presence across states. It is good news,
because having the concentration of talent in single
region would be detrimental to business growth.
Apart from the domain knowledge, there are other
skills which are of high importance to employers for
hiring a candidate. They included Communication
skills, Computer Skills, Numerical and logical ability and
few behavioural traits like learning agility, adaptability
and interpersonal skills. With these skills added to the
technical skills candidates will reach the potential where
employer will be more than happy to absorb them in
his organization. Considering this the scores of the
candidates were analysed around these cuts too. It was
observed that though there were many states which
As per the employers, the perfect candidate is the one
which has a combination of all those skills, so it would
be interesting to also know which states provide the
perfect mix of candidates.
Rest of the states might be performing well in one
section but might lack the abilities in another. This
might be the reason why the skill pool in this state is not
getting employed in large numbers.
Moving to domain specific employability ratios, the
situation is somewhat similar to last year. The analysis
shows that like last year, maximum percentage of
employable skill was still available in Pharma domain
followed by engineering and has grown from last year.
The percentage of B. Pharma test takers who scored
60% in WEST was 56% (an improvement of about
2%) and that of B. Tech test takers was 54%, again an
improvement by 2%. The ITI, MCA, MBA & B. Sc remain
next in the sequence with a percentage of 44%, 45%,
43% and 38% respectively. While MCA & MBA has
shown an increase in percentage in comparison to
last year, ITI & B.Sc. has shown a nominal decline in
the percentage. However, the situation of the test
takers from Arts, Commerce, and Polytechnics is still
grave, as not even 1/3rd of test takers could cross the
benchmark levels. Though Arts graduates have shown
considerable increase from 19% employability (last
year) to approx. 30%, but it is still very low. Academia
and the government would need to have a specially
focused plan to increase employability in these domains
and that too as soon as possible, so that the situation
is not out of control. “Unemployability” of educated
candidates is a situation that has social, political and
economical implications and hence should be dealt
with at high priority.
2013
51.7
4%
41.0
2%43
.99%
26.9
9%26
.45%
41.6
6%
43.6
2%45
.00%
46.9
2%44
.00%
11.5
3%10
.14%
54.6
5%56
.00%
38.4
1%
54.0
0%
2014
19.1
0%29
.82%
Engi
neer
ing
MBA BA
BCom B.Sc
MCA IT
I
Poly
tech
nic
B.Ph
arm
a
A COMPASRISON IN EMPLOYABILITY
featured well in individual traits, there were very few
states that were doing good all around. Let’s study the
top states that are featuring well in all these skills one
by one.
BEST PERFORMERS IN ENGLISH
BEST PERFORMERS IN COMPUTER SKILLS
BEST PERFORMERS IN BEHAVIORAL TRAITS
BEST PERFORMERS IN LOGICAL AND
NUMERIC ABILITY
STATES WITH A HIGHEST ‘EMPLOYABLE’ POPULATION
Rajasthan
Andhra Pradesh
Haryana
Kerala
Karnataka
(new entrants)
U.P
Tamil Nadu
West Bengal
Orissa
Pondicherry
Tamil Nadu
Andhra Pradesh
Uttar Pradesh
Kerala
Delhi
Tamil Nadu
Uttar Pradesh
Haryana
Delhi
Punjab
Kerala
Pondicherry
U.P
Tamil Nadu
West Bengal
Orissa
Maharashtra
Gujarat
Bihar
Orissa
Rajasthan
Andhra Pradesh
Gujarat
New Delhi
Chennai
Hyderabad
Pondicherry
Coimbatore
Thane
Kolkata
Mumbai
Ghaziabad
Palakkad
New Delhi
Chennai
Hyderabad
Coimbatore
Kolkata
Mumbai
Palakkad
Lucknow
Kanchipuram
Gorakhpur
New Delhi
Faridabad
Chennai
Pondicherry
Coimbatore
erode
Pollachi
Agra
Hissar
From Last Year
From Last Year
From Last Year
New Entrants
New Entrants
New Entrants
Cities
Cities
Cities
The report is very well researched and it is good to see
that it matches the requirement of both the demand and
the supply side. There are figures on industry wise hiring
estimate for the coming year for different profiles. This will
help us channelize our efforts.
Dilip ChenoyMD & CEO, NSDC
THE STATES THAT FARED WELL IN ALL THE THREE SECTIONS ARE

21
Creating a skill pool that can be employed readily by
the corporate is a mammoth task. The detailed insights
captured in India Skills Report would help in taking steps
for matchmaking the skill demand and supply.
A K ShrivastavaAIM Board of Directors
The idea is to understand if there is a correlation between
age and employability. Talking about the employability
at different age level, like last year maximum numbers
of employable resources are present in the age group
of 18-21 years.
This data of age-wise employable candidates was also
analysed based on their geographic presence. The states
where the most employable candidates for the age
group 18-21 years belong are:
Similarly for the age group 26-29 years the states and
cities are:
A look at the states across age groups shows; that states
like Maharashtra, Kerala & Bihar have shown marked
improvement since last year and their contribution in
the skill pool across different age groups has increased.
This is encouraging and we hope more states join the
league soon.
The scores of the WEST takers were also studied on the
basis of gender. The corporates are increasingly trying
to maintain the gender diversity in their organisations
by hiring more female candidates. So it is important
to understand how the supply of female candidates
looks like. Though the quality of female candidates still
remains better than the males this year as well but there
employability percentage has decreased from 42% last
year to 37.88% this year. This shift in the employability of
women is not good news, the stakeholders should work
on increasing employability amongst women as the
coming years would see special focus on female hiring
and it would not work if enough “employable” females
are not available. When we consider the gender wise
employability geographically, as in, we try to understand
which are the states where “employable” males and
females are found in large numbers, we find that Delhi
tops the chart for males whereas Kerala leads the race
for females. The Top 10 states that have the maximum
number of male and female employable candidates are:
It is interesting to find that the states like Haryana and
Rajasthan have featured in the list of “high sex ratio” in the
list of states where more employable female candidates
are available. The Government should use this kind on
information to encourage female child welfare in their
states. This is another step that is needed to ensure high
and consistent participation of women in corporates
(though this is not only benefit that encouraging female
child welfare would provide these states).
Moving out of the geographic and demographic analysis
of WEST taker scores, let’s focus on few miscellaneous
aspects that were covered by WEST. Considering that on
the job training is one of the major solutions to reduce
the talent supply and demand gap, the WEST takers
were asked if they would be interested in Internship. The
responses were very encouraging. Of the 3 lakh students
who participated in the survey, 73% were interested in
apprenticeship. This is a huge increase from last year’s
data and a golden opportunity for employers to create
a talent pool that they can use to meet their talent
demands.
Compared to the last year’s report the states which have
lost their presence in the Top 10 states are: Karnataka,
Orissa & West Bengal.
Coming to the age group 22-25 years, the top states
where most people in this age group are employable are:
The same has been captured in the graph above and
it seems that the employability in younger age is a bit
higher than the age group 26-29 Years. A deeper dive in
the candidates belonging to this age group revealed that
most of the candidates belonging to this age group are
those studying part time (open schools, weekend classes
etc.). So it becomes pretty clear that merely working on
the mainstream candidates (who are attending regular
classes) might not be enough. The stakeholders should
try to increase the employability of the open school, and
part time candidates too. This might be one of the steps
that can help in bringing more “employable” candidates
to organised job sector (as most of the part time students
are working in unorganized sector. Getting a proper job
will encourage them to make this move.)
(Those who scored more than 60%)
Age group of 18-21 years
Age group 22-25 years
Age group 26-29
Males
Delhi
Kerala
Pondicherry
Maharashtra
Uttar Pradesh
Bihar
Andhra Pradesh
Haryana
Gujarat
Tamil Nadu
Females
Kerala
Gujarat
West Bengal
Maharashtra
Uttar Pradesh
Bihar
Andhra Pradesh
Haryana
Rajasthan
Tamil Nadu
39%
Moving from 29% last year to 34% this year
20% last year to 30% this year
2013AGE WISE EMPLOYABILITY 2014
38%
39.3
6%18
-21
Year
s
29.1
1% 34.1
3%22
-25
Year
s
20.3
8%30
.48%
26-2
9 Ye
ars
2013GENDER WISE EMPLOYABILITY 2014
30.3
0%34
.26%
Mal
e
42.1
0%37
.88%
Fem
ale
MOST EMPLOYABLE CANDIDATES AGED 18-21
MOST EMPLOYABLE CANDIDATES AGED 25-29
MOST EMPLOYABLE CANDIDATES AGED 22-25
23
This also provides graduating students with a platform
where they can get necessary training & ready
themselves to enter the real corporate world. Thus,
the benefits of this initiative are for both the supply
and demand side and they should work to make this
happen. To facilitate this initiative, the responses of the
WEST takers were analysed “geographically” to identify
where the employers can find these “apprentices”. The
states where most of these candidates, interested in
being part of internships could be found are:
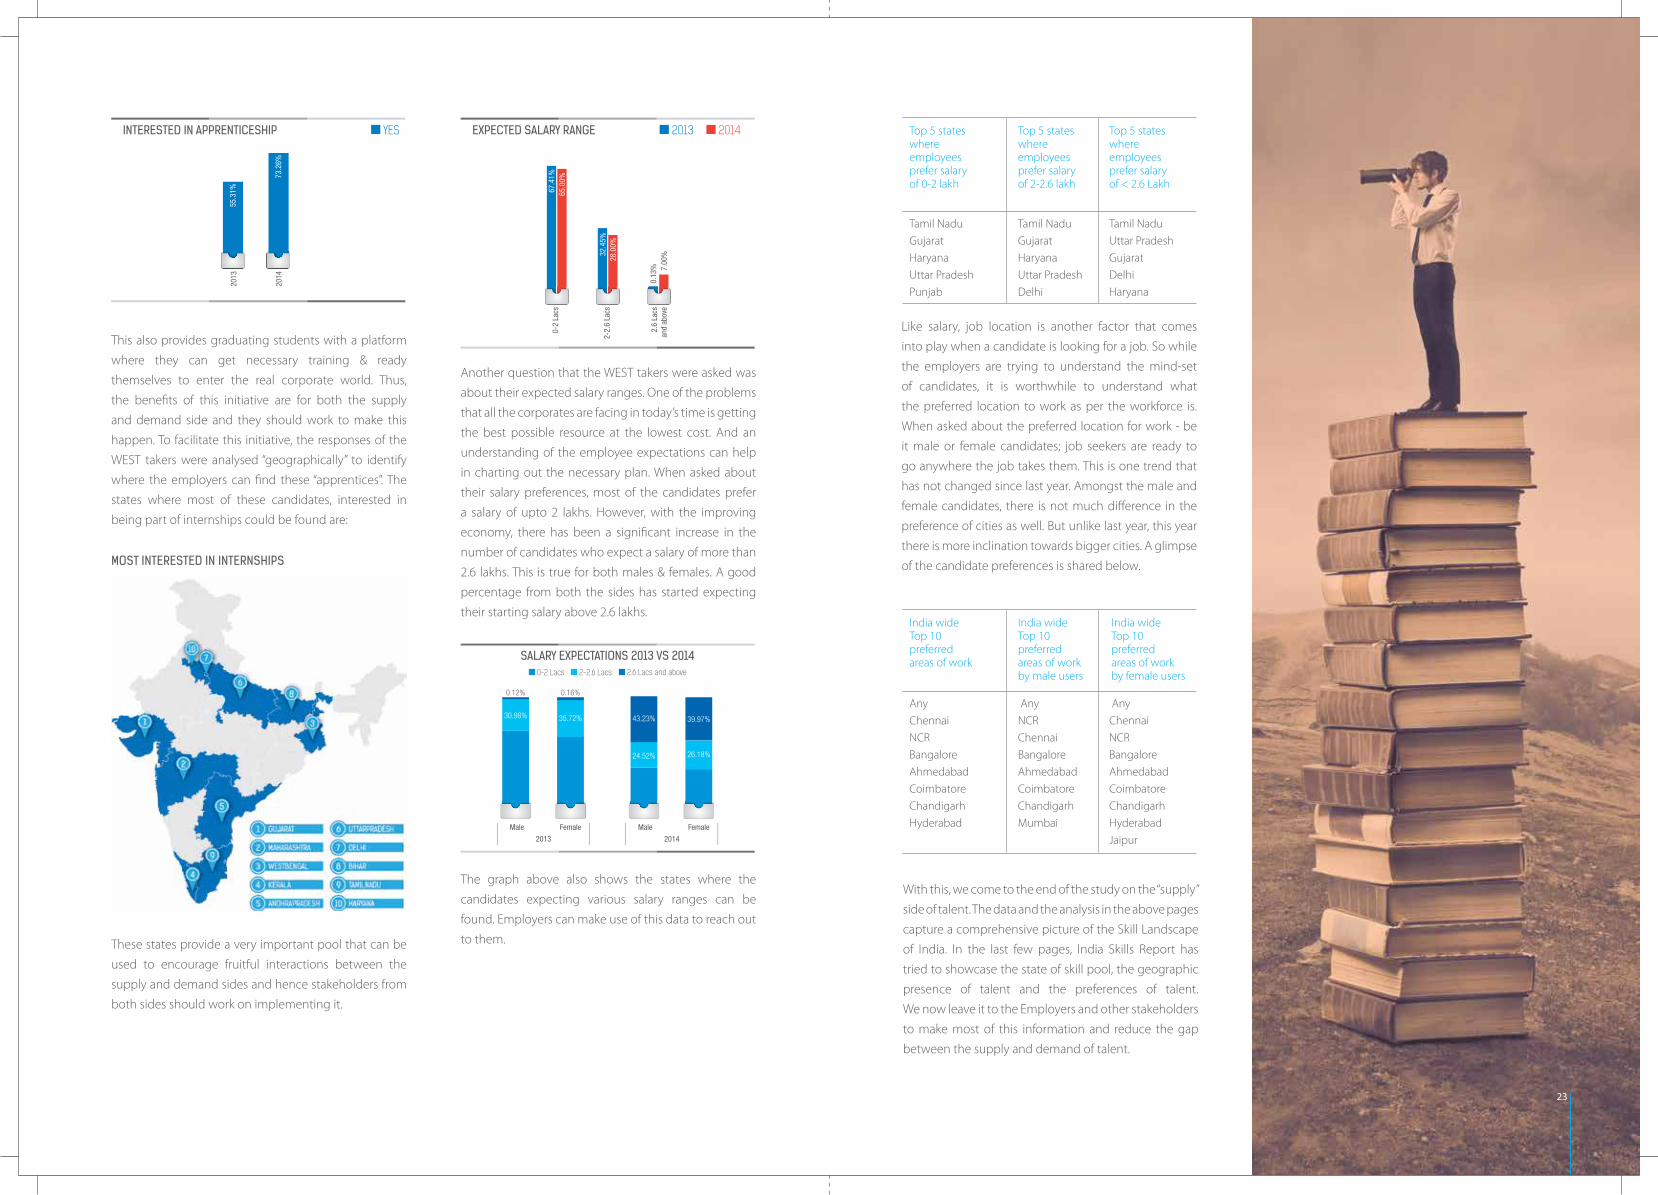
Another question that the WEST takers were asked was
about their expected salary ranges. One of the problems
that all the corporates are facing in today’s time is getting
the best possible resource at the lowest cost. And an
understanding of the employee expectations can help
in charting out the necessary plan. When asked about
their salary preferences, most of the candidates prefer
a salary of upto 2 lakhs. However, with the improving
economy, there has been a significant increase in the
number of candidates who expect a salary of more than
2.6 lakhs. This is true for both males & females. A good
percentage from both the sides has started expecting
their starting salary above 2.6 lakhs.
Like salary, job location is another factor that comes
into play when a candidate is looking for a job. So while
the employers are trying to understand the mind-set
of candidates, it is worthwhile to understand what
the preferred location to work as per the workforce is.
When asked about the preferred location for work - be
it male or female candidates; job seekers are ready to
go anywhere the job takes them. This is one trend that
has not changed since last year. Amongst the male and
female candidates, there is not much difference in the
preference of cities as well. But unlike last year, this year
there is more inclination towards bigger cities. A glimpse
of the candidate preferences is shared below.
With this, we come to the end of the study on the “supply”
side of talent. The data and the analysis in the above pages
capture a comprehensive picture of the Skill Landscape
of India. In the last few pages, India Skills Report has
tried to showcase the state of skill pool, the geographic
presence of talent and the preferences of talent.
We now leave it to the Employers and other stakeholders
to make most of this information and reduce the gap
between the supply and demand of talent.
The graph above also shows the states where the
candidates expecting various salary ranges can be
found. Employers can make use of this data to reach out
to them.These states provide a very important pool that can be
used to encourage fruitful interactions between the
supply and demand sides and hence stakeholders from
both sides should work on implementing it.
YESINTERESTED IN APPRENTICESHIP
55.3
1%20
13
73.2
6%20
14
2013EXPECTED SALARY RANGE 2014
67.4
1%65
.00%
0-2
Lacs
32.4
5%28
.00%
2-2.
6 La
cs
0.13
% 7.00
%2.
6 La
csan
d ab
ove
0-2 Lacs 2-2.6 Lacs 2.6 Lacs and above
Male
2013
Female
55.3
1%
30.98%
0.12%
35.72%
0.16%
Male
2014
Female
55.3
1%
24.52%
43.23%
26.18%
39.97%
SALARY EXPECTATIONS 2013 VS 2014
Tamil Nadu
Gujarat
Haryana
Uttar Pradesh
Punjab
Any
Chennai
NCR
Bangalore
Ahmedabad
Coimbatore
Chandigarh
Hyderabad
Tamil Nadu
Gujarat
Haryana
Uttar Pradesh
Delhi
Any
NCR
Chennai
Bangalore
Ahmedabad
Coimbatore
Chandigarh
Mumbai
Tamil Nadu
Uttar Pradesh
Gujarat
Delhi
Haryana
Any
Chennai
NCR
Bangalore
Ahmedabad
Coimbatore
Chandigarh
Hyderabad
Jaipur
Top 5 states where employees prefer salary of 0-2 lakh
India wide Top 10 preferred areas of work
Top 5 states where employees prefer salary of 2-2.6 lakh
India wide Top 10 preferred areas of work by male users
Top 5 states where employees prefer salary of < 2.6 Lakh
India wide Top 10 preferred areas of work by female users
MOST INTERESTED IN INTERNSHIPS
A 7 POINT PROPOSED ROAD MAP FOR GETTING SKILLED ENGINEERING & MANAGEMENT WORKFORCE READY.
Industry & Academics-have both realized that the gap
in the supply of employable manpower can not be
bridged without their close co operation & continued
engagement. However the effective interface has
not emerged inspite of all well meant discussions; is
only partially effective at the implementation level
& the output of mid segment colleges continues to
bewoefully out of sync with industry expectations. This
leaves industries with no option but to keep chasing a
few good institutes in Ill& NIT category, seriously limiting
the supply options of quality manpower at sustainable
costs. The Sharda Group of Institutions have been in
continuous dialogue with various industries to work
out a plan which enhances mutual interaction between
academic institutions (like us) and reputed industries
across various sectors and verticals (like your esteemed
organizations) with a view to bridging this much debated
gap between industry expectations (from the entry level
engineers and executives) and their preparedness as an
outcome of academic processes they have undergone
in colleges or academic institutions. The Cll-wherbox
•India Skill report also clearly pointsoutthusfact.
Therefore, this interface between the Institute and the
industry should act as a platform for sharing projects.
conducting research (including market research and
action research), MOPs, FOPs, R&D and generation of
new knowledge.A white paper was worked out with
the participation of and in association with 70 (+) of top
industry executives across sectors,through the good
offices of Times of India, & similar efforts through Cll’(a
copy of this report can be forwarded upon request.)
The action plan that emerges after due deliberations is
briefly stated below:
1. Signing of MOU’s between institutes and Industries
& Trade Organization, having the were withal of
25
infrastructure, Technology, resources &the desire to walk
this extra miIe.
SHARDA GROUP will approach industries across sectors
and sign MOUs with the willing industrial organizations
ready to be associated for developing vibrant institute
industry interface so that the under mentioned plan
could be implemented for mutually gainful outcomes.
Such industry partners will be designated as •valued
Industry Partner• (VIPs of Sharda). Such partnership will
bevalued attwo levels:
A) Platinum level B) Gold Level
The Levels depend on the tenms of association and
value contribution. The MOU will express the intent of
both, the academic partners viz. SHARDA GROUP and
the industrial organization to come together for the
purposeofthetenms laiddown in theM0U.
2. For each industry segment SHARDA GROUP will
depute two young faculty members designated as
Training & Industry Mentors (TIM)- who will bethe Point
of Contact and Process Owner (POC/PO). Similarly, from
the side ofVIP a single Point of ContacUSPOC will have
to bedesignated. Faculty (TIM) will beprovided extensive
training and industry exposure & access to facilities just
as new entry level fresher’s are trained by the Industry
for its own requirements and given all support to study
all the technologies, processes, equipment, designs etc.
to be able to fully grasp the same. There is no financial
contribution envisaged from the industry partner other
than providing good training opportunities. The faculty
members (TIM) will in turn monitor the training of the
students on the campus in their particular industry
segment. They will als develop relevant course content
ranging from 100 to 400 hours depending upon the
needs of the industry segment they have received
training in and the same will be delivered bythem as
Industry Mentor to interested students who want to
make a career in that industry sector. This can be offered
as part of a regular curriculum to the Pre final and Final
year students in Sharda University and as Value Added
Courses to students of SHARDA GROUP at Agra-Mathura
Campuses or for that matter such other institutes which
are interested butnotyet autonomous.
3. The Industry partner will provide training slots of 4-6
weeks to SHARDA students as Initial Learning Exposure
(ILE). There is no financia I obligation on the part of
the industry partners other than providing training
opportunity. If, however, accommodation for trainees
is available at concessional rates, it would help the
students. If using CSR funds support can be provided;
it will be extremely useful & welcome as itreducesthe
students obligation to afford such costs.
The whole training will be monitored and evaluated by
the Faculty (TIM) already trained in the industry segment
as stated above in point no.2 above.
4. The faculty (TIM) will then deliver, the designed
Industry Learning Program (ILP) of 100 to 400 hour
duration which sha II have been developed as stated in
point no.2 above.
5. Post the ILP training the students will take up relevant
projects related to that industry segment with the help
of faculty (TIM) and the representatives of industry
partners (through SPOC). Complete the Projects.
6. Upon completion a project copy will be submitted
to Industry Partner also. The evaluation may be
conducted jointly by faculty TIM and the industry
partner representatives at the end of the programme.
7. The Valued Industry Partner (VIP) shall have the first
right to make the first selections from the students
trained at their facility, the remaining students shaII be
free to opt for other placement opportunities;
The aim of the Program is primarily to produce industry
ready professionals at the base level (B.TechJMBA).
However in time it can be upgraded as faculty (TIM)
become more experienced and they can gradually
progress to the level of joint projects. joint research,
MOPs, FOPs, setting centres of excellence etc. to take up
the interactions to higher level of engagements. Support
in advance learning and research including M.Tech.,
Ph. D. can be worked out for professionals of both
sides for meaningful outcomes. Industry Professionals
of VIP desirous of enhancing their qualifications can
beoffered specially designed executive courses tailored
for industry professionals involving more of on site
experience & only supporting theory through video
conferencing, skype or use of other tech nology tools.
New faculty (TIM) every year will also be continuously
trained to replenish the base level needs,as previous
TIMs progress to upper levels.
Noida.Though they are the under same management
but SU as an autonomous university shall sign a separate
MOU whereas the Agra Mathura campuses, INSTITUTE INDUSTRY INTERFACE PROGRAMME (I3P)DREAM TO REALITY
BUILDING INDIA THROUGH MANAGEMENT EDUCATION AND VOCATIONAL EMPLOYABLE SKILLS
ALL INDIA ASIAN EDUCATIONAL FOUNDATION (AIAEF)
was established in 1995 as a “Not for Profit” Organization
under the Indian Societies Registration Act of 1860.
The idea of establishing a non profitable educational
body was the result of the vision of a highly motivated
educationist Mr. A.K. Shrivastava, who conceived the said
Institution with a view to provide quality ‘Management
Education and Vocational Employable Skills’ to a vast
number of youth of the country.
All India Asian Educational Foundation (AIAEF)
then established an Institute at New Delhi named
as Asia-Pacific Institute of Management in the year
1996 under its aegis. The growth of this Institute has
been spectacular in a short span of time. Asia-Pacific
Institute of Management is an accredited and approved
Management School by the All India Council of Technical
Education, Ministry of HRD, Govt. of India approved
since 1996 for imparting management education for
PGDM courses. The Institute is ranked amongst the
top Business Schools of the country. The Institute has
achieved the status of distinction by following the path
envisioned by its founders. The secret of its spectacular
growth lies in its commitment to providing world-class
education, with the curriculum designed with the help
of industry experts. With a team of highly qualified
faculty of academic excellence and industry exposure
and the state-of-the-art infrastructure of the Institute
provides the environment for nurturing talent and for
empowering the students with knowledge, skills and
mindset which together the shape future business
leaders. A symbiotic relationship is encouraged
between the industry and the academia through a
mutual exchange of practical and theoretical aspects of
management knowledge.
Over the years, the Institute has been continuously
evolving by pursuing and inculcating several
innovative ways of learning and experience sharing by
demonstrating time-bound mission-oriented goals.
The education at Asia Pacific Institute of Management
also emphasizes on holistic development and interactive
practical learning through strong linkages with leading
companies to groom students as future corporate
leaders for sustainable global development. In this
context, a monumental effort of the management,
faculty and staff provides a conductive environment for
enabling the students to become decision makers in
global corporate affairs. A closely networked Industry –
Institute – Interfaced is ensured through guest lectures,
industrial visits, workshops, seminars and a variety of
specific corporate trainings. A symbolic relationship is
encouraged between industry and academia, through
a mutual exchange of practical and theoretical aspects
of management knowledge and supplementation of
professional expertise.
As per a recent best Business Schools Survey-2014, Asia-
Paciafic Institure of Management, New Delhi has been
ranked at number 7th amongst all Business Schools of
north India and at number 36 in the all India ranking.
The ranking is based on an “objective survey” that ranks
B-Schools based on the data that they submit, combined
with a “perception survey” which ranks B-Schools based
on opinions of key stakeholders such as teachers,
students, recruiters and others. This year survey has
introduced the “experimental survey’ that brings in the
views and experiences of alumni also – showing that the
ranking of B-Schools have been carried out in the most
comprehensive and complete manner.
The AIAEF is also operating a full fledged Skill
Development Deptt. This Deptt. Provides services for
Skilling and livelihood for the under privileged youth
of the country. The Institute has been awarded various
projects by Central and State govt. like Employment
Linked Skill Training Program (ELSTP) program by
Rajasthan Govt. (Rajasthan Skill and Livelihoods
Development Corporation – RSLDC), Seekho aur Kamao
(Learn & Earn Scheme) by Ministry of Minority Affairs,
Swarna Jayanti Shahari Rozgar Yojana (SJSRY) by Samajik
Suvidha Sangam Govt. of Delhi.
Education has always been the strongest way to counter
poverty and its tremendous impact towards Nation
building. Our Prime Minister Shri Narendra Modi, a
visionary, whose great success stories have transformed
lives and made them independent. Skill Development is
the need of the hour and will be the defining element in
India’s growth story.
Yuva Shakti, a term used by many educationists as a
vision for the nation by skilling and up-skilling the youth
who form half the country’s population of 1.25 billion
people are under 25 years of age. The gap between
the organized and unorganized sector where the latter
forms a greater percentage can only be done by pushing
hard by enhancing skills of labour in various sectors to
suit the changing needs of the economy. Hence Skill
Development forms a core agenda for the next level
of transition of the economy. There is a need to re-
27
define the relationship of education, employment and
skills development. AIAEF has turned the limelight on
skills development across the country to align industry
manpower needs with the skilling initiatives underway
and improve employability of the working population
including school drop-outs, semi-skilled and un-skilled
workers.
AIAEF’s vision is to be a world class organization for
providing Management education and employable
vocational skills in the demand oriented manufacturing
and services sectors so as to transform the lives of
millions of youth of the country.
THE RULES OF TALENT REFINERY
2014 can very correctly be termed as the year of
Transformation. Until last year there were lots of
speculations on what the future of India would be like
both politically and economically. There were both
positive and negative predictions, and fortunately it’s
the former that got realized than the later. For the first
time three decades there is a clear majority government
at the centre and the economy is growing at over 5%
(which is the fastest in the past two and a half years).
There have been a series of new initiatives introduced
to encourage exports and investment in India. With
initiatives like “Make in India”, there has been special
focus on increasing the Manufacturing activity in India
whose contribution to GDP had remained stagnant
at 15% for several years. Exclusive funds to support
entrepreneurial initiatives have been declared. All these
are the much needed steps for taking us out of the “Job-
less growth” that our country had been going through
for the past many years and would result in true growth.
A beginning on this path of reforms and initiatives
has instilled a new wave of confidence in the Indian
economy that was absent some time ago and is even
reflected in change of assessment of Indian economy
by various international rating agencies.
If the new predictions are to be believed, this growth
phase will continue for the next few years and as the Job
demand outlook is the reflection of economy outlook,
coming few years should see an increase in the number
of jobs across sectors. Considering that we have about
12 million job seekers, if our talent supply can match up
the skills needed to perform these newly created jobs
the overall result would be phenomenal. To perform
this match making, it is essential to understand what
kind of jobs would be created, what kind of skills would
they require and where would these jobs be available.
Parallely, it is also essential to have a dedicated system
that can understand the need of both ends and perform
the task of matchmaking. There are various ways this can
be achieved. One of models that can solve the problem
of talent match making in India is pincode level hiring.
This would mean that the power of People, Process and
Technology are used to reach out to the last pincode of
the country for meeting the talent needs. This would
work like magic particularly for the companies in sectors
like Insurance and FMCG which need people for wider
geographic spread. Though few of the employers are
already using this model and deriving benefits out
of it, use of Government machinery is a must if this
model is to be implemented to the entire country.
This should be complemented with the Revamp of
“Employment Exchanges” to Talent Stock exchanges or
“career centres” which become a meeting point for the
talent and employers. The kind of scale and timelines 29
for implementation we are looking at, it is important
undergo the fastest possible process reengineering and
use technology to ensure rapid implementation. Only
when we dedicate ourselves to extraordinary measures,
can the extraordinary result of a powerful and strong
nation be achieved.
India Skills Report is an initiative to support in this
journey. The main aim of India Skills Report is to support
match making between the skill supply and job demand
side by equipping both ends of the talent supply
chain with necessary details about each other. While
the snapshot of Supply side was captured through in-
depth analysis of WEST scores of about 3 Lac students,
the outcomes of the Corporate Job Survey, an online
survey conducted on about 125 employers across India,
shares the insights about the demand side. Compared
to last year, this year the number of participants
increased by almost 25%. Employers surveyed were
questioned on the following major points: The Hiring
potential and outlook for the coming year, profile wise
hiring mix, sourcing channels, and experience level
wise hiring mix etc. This information was collected to
understand what are the kinds of profiles and people,
companies in different sectors hire for and what is the
kind of education required to be eligible for the same.
The information about the profile mix was collected
to identify the skills for which major hiring is done in
each industry sector. To understand the geographic
focus of the companies representing different sectors,
information about their “Talent sourcing” states was
collected. We tried to demystify what was the most
important skill companies look for. In totality the effort
was made to provide as much insights as possible to the
supply side about the thought process of Corporates, so
that they can take wiser decisions in future and are ready
to face the market with better preparation.
In this second season of India Skills Report initiative, it
was heartening to receive the support of corporates
across major sectors. A unanimous support was
provided by them in conducting the survey. Though this
is just the second year of the report, such encouraging
response and participation by corporates is a positive
indicator that the corporates are ready to play their part
in solving the talent woes of the country. We hope that
the insights provided in the coming pages, based on
the data provided by surveyed employers, would help in
taking better decisions and creating a balanced skill-job
landscape in the country.

“Even the darkest of nights will end and sun will rise”, said
French poet Victor Hugo, in one of his creations Les Misérables. With a “night” that extended for almost three
years, the sun has definitely started rising for India Inc.
The recovery of the economy from a turbulent phase
that stated last year is in full swing now. As a country
we have moved out of the policy paralysis that was
haunting our Government for quite some time, there is
a positive sentiment about the nation all around. Infact
it is not an exaggeration when we say that it is one of
the best phases that we are experiencing as a nation. We
have the wisdom from our past mistakes, and have great
aspirations of the future!
This hope and positivity is clearly reflected in the
corporate hiring sentiments shared with the India Skills
Report team. About 125+ corporates across 11 major
industry sectors, were reached out to understand the
“Job Providers”, and capture the trends of Job market in
detail. The results obtained were very positive.
Indian Employers across the Major sectors forecast an
overall increase of 23% when it comes to the hiring
outlook for the next year. This forecast comes as a great
relief for the country that is on the verge of a major
demographic event, i.e. by 2020, more than 60% of
India’s population will be in working age. Compared to
last year’s report where the change in hiring numbers
was very nominal (less than 2%), it seems that the
political and economical stability seems to have had a
positive impact.
This increase in hiring numbers is prevalent across
industry sectors, where the Hospitality and Travel sector
leads the way with an increase of over 50% in the hiring
INDIA’S JOB PREDICTIONnumbers in the coming year. It is closely followed by
the sectors – Banking, Financial services and Insurance;
Core Sectors, whose hiring numbers are expected
to have an increase of more than 25%. The lowest
growth is expected in other sectors like Manufacturing,
Telecom and Pharma. This appears to be in direct
correlation with the growth that companies in these
sectors are targeting. (Few Insights: India is projected
to be number one for growth globally in the wellness
tourism sector in the next five years, clocking over 20
per cent gains annually through 2017, according to a
study conducted by SRI International. The hospitality
sector in India expects 52,000 new hotel rooms to be
added in five years (2013-17), according to a survey by
Cushman & Wakefield. This will lead to a rise of over 65
per cent in total hotel inventory in India. Banking sector
credit is anticipated to grow at a CAGR of 18.1 per cent
(in terms of INR) to reach US$ 2.4 trillion by 2017. With
investors gaining more confidence in India’s economy,
the country’s manufacturing sector could grow by up to
14 per cent, according to the government).
% increasePERCENTAGE INCREASE IN HIRING NUMBERS
25%
16.4
%
38.3
%
11%
59.5
%
3.8%
52.5
%
10.1
4%
7.2%13
.3%
BFSI
Othe
r Man
ufac
turin
g (n
otin
clud
ing
FMCG
, CD,
Aut
omot
ive
& En
gine
erin
g)
BPO,
KPO
& IT
ES
Cons
umer
Goo
ds&
Dura
bles
Core
Sec
tor (
Oil a
nd G
as,
Pow
er, S
teel
, Min
eral
s et
c.)
Engi
neer
ing
& Au
tom
otiv
e(A
uto
& Au
to C
ompo
nent
s)
Hosp
italit
y (In
clud
ing
Avia
tion,
Tour
s &
Trav
el, H
otel
s)
Othe
rs &
Div
ersi
fied
Phar
ma
& He
alth
care
Softw
are
& IT
Tele
com
& A
llied
17.2
%
6.8%
Though, there is a significant increase in hiring numbers
across industry sectors, but if we consider the hiring mix
then the employers do not foresee any major changes.
There is an increase or decrease of less than 1% across
domain. So if we consider the graph below of the total
hiring being done in the year 2015-16, 23% will be
graduates, 11.4% will be diploma, 29% engineers, 7.37%
ITI, 22% Management graduates and 6.87% vocational
candidates. Thus engineering hires will continue to
dominate the hiring space. With the kind of growth
expected in sectors like automobile, core and IT industry,
this is hardly surprising.
However, there are some interesting trends that came
out when the domain wise hiring mix of individual
industry sectors were considered. The BFSI sector
forecasts a minor decrease in hiring of degree,
vocational, management graduates and a nominal
CHANGE IN AVERAGE HIRING PER MONTH
DOMAIN WISE HIRING MIX -TRENDS
DOMAIN WISE HIRING TREND 2014 2015
24.6
6%23
.12%
12.7
%11
.42%
6.89
%7.
37%
21.9
6%22
.24%
6.13
%6.
87%
27.6
7%28
.98%
Degr
ee
Dipl
oma
Engi
neer
s ITI
Man
agem
ent
Voca
tiona
l
increase in the hiring of diploma graduates. Parallely,
there will be a small increase in the hiring of engineers
and ITI candidates but having said that, the sector also
expects to hire maximum of general graduates which
will form about 60% of overall hiring numbers. BPO
sector continues in its strategy of reducing the number
of engineering hires further by 50% (forecasting that
only 6% of overall hires will be engineering grads). There
seems to be a clear focus on hiring candidates from
General degree and undergraduate courses, who can be
trained to meet the business needs. For sectors like core
and consumer durable sectors, there does not seem to
be any major change in the overall hiring mix, except that
the core sector is planning to hire more management
graduates. Considering that the sector is expecting a
significant growth in the coming year, it makes absolute
sense to have management graduates onboard who
can help in managing this change. However the major
hiring for this sector will continue to be that of engineers.
Another sector that will have engineering graduates
as majority of hires is engineering & automotives. This
sector also plans to hire diploma candidates which will
form a dominated one-fourth of hiring mix. Telecom and
Software, and IT are the other two such sectors which
have a major pie of their hiring mix as engineering
graduates and they are going to continue with this
composition for the next year as well. All this shows the
readiness of the businesses to grow, which is the reason
why companies like Telecom, Software & IT and Core
that require lot of expertise to innovate and grow are
looking for specialists in large numbers unlike last year
where the focus was on making maximum utilization
of existing specialists. Considering that every year 1.5
million engineers get trained every year, this looks like
a good news. However, the “employability” of these
engineers still remains a challenge and this increase in
the need of engineers means that the time for making
the engineer’s job ready is less, and rapid steps need to
be taken.
Building a skilled workforce is essential for India’s
development and growth. This is a huge challenge
that needs to be solved jointly by the Government
and Industry, to help create jobs and build a vibrant
economy.
Pramod Bhasin
With close to 5.5 million graduates passing out every year,
and only about 0.7 million being considered employable by
in the IT/BPM industry, over-supply and low employability
is significantly diluting the demographic dividend. It is
critical to understand the talent demand and supply
landscape and engage, enable and empower a tripartite
network of the government, academia and industry to
grow the skill sets required for India to be future ready.
Prithvi ShergillChief Human Resources Officer, HCL Technologies
31

There is a gap between the productivity needs of
employers and the skills available in the market today,
which is causing a mismatch between talent and
opportunity. A joint LinkedIn study with PwC on talent
adaptability suggests that such poor talent alignment is
costing Indian companies as much as INR 508bn in lost
productivity.
Nishant K Rao
Talent is one of the most critical resources deployed by us.
I feel we need to understand challenges of skill reservoirs &
take focused steps to get constant skill supply.
Rajeshwar Tripathi
PERCENTAGE OF DEGREE GRADUATES IN OVERALL HIRINGBF
SI
Othe
r Man
ufac
turin
g (n
otin
clud
ing
FMCG
, CD,
Aut
omot
ive
& En
gine
erin
g)
BPO,
KPO
& IT
ES
Cons
umer
Goo
ds&
Dura
bles
Core
Sec
tor (
Oil a
nd G
as,
Pow
er, S
teel
, Min
eral
s et
c.)
Engi
neer
ing
& Au
tom
otiv
e(A
uto
& Au
to C
ompo
nent
s)
Hosp
italit
y (In
clud
ing
Avia
tion,
Tour
s &
Trav
el, H
otel
s)
Othe
rs &
Div
ersi
fied
Phar
ma
& He
alth
care
Softw
are
& IT
Tele
com
& A
llied
37% 41
%
27%
24%27%
21%
53%
52%
16%
15%
12%
11%
o% o% 2% 1%
4% 5%
47%
48%
61%
60%
2014 2015
PERCENTAGE OF DIPLOMA CANDIDATES IN OVERALL HIRING
BFSI
Othe
r Man
ufac
turin
g (n
otin
clud
ing
FMCG
, CD,
Aut
omot
ive
& En
gine
erin
g)
BPO,
KPO
& IT
ES
Cons
umer
Goo
ds&
Dura
bles
Core
Sec
tor (
Oil a
nd G
as,
Pow
er, S
teel
, Min
eral
s et
c.)
Engi
neer
ing
& Au
tom
otiv
e(A
uto
& Au
to C
ompo
nent
s)
Hosp
italit
y (In
c lud
ing
Avia
tion,
Tour
s &
Trav
el, H
otel
s)
Othe
rs &
Div
ersi
fied
Phar
ma
& He
alth
care
Softw
are
& IT
Tele
com
& A
llied
43.8
4%39
.72%
25.2
%25
.8%
26.5
3%26
.79%
1.81
%1.
17%
o% 1.04
%7.63
%4.
37%
3%2.16
%
4.17
%4.
4%
2.38
%5.
45%
5.26
%5%
2014 2015
o%2.86
%
PERCENTAGE OF ENGINEERS IN OVERALL HIRING
BFSI
Othe
r Man
ufac
turin
g (n
otin
clud
ing
FMCG
, CD,
Aut
omot
ive
& En
gine
erin
g)
BPO,
KPO
& IT
ES
Cons
umer
Goo
ds&
Dura
bles
Core
Sec
tor (
Oil a
nd G
as,
Pow
er, S
teel
, Min
eral
s et
c.)
Engi
neer
ing
& Au
tom
otiv
e(A
uto
& Au
to C
ompo
nent
s)
Hosp
italit
y (In
clud
ing
Avia
tion,
Tour
s &
Trav
el, H
otel
s)
Othe
rs &
Div
ersi
fied
Phar
ma
& He
alth
care
Softw
are
& IT
Tele
com
& A
llied
56.8
8%54
.03%
46.9
4%46
.43%
47.3
7% 50%
2.08
%1.
19%11
.02%
8.01
%
3.43
%2.
16%
3.03
%3.
27% 18
.18%
20.2
4%
2.91
%4.
07%
2014 2015
65.3
4%59
.64%
o%
83.5
2%88
.7%
PERCENTAGE OF ITI CANDIDATES IN OVERALL HIRING
Softw
are
& IT
0%0%
Othe
r Man
ufac
turin
g (n
otin
clud
ing
FMCG
, CD,
Aut
omot
ive
& En
gine
erin
g)0%0%
Cons
umer
Goo
ds&
Dura
bles
1.19
%1.
04%
BPO,
KPO
& IT
ES26
.84% 31
.55%
BFSI
0.86
%0.
54%
Hosp
italit
y (In
clud
ing
Avia
tion,
Tour
s &
Trav
el, H
otel
s)5.
3%3.
74%
Engi
neer
ing
& Au
tom
otiv
e(A
uto
& Au
to C
ompo
nent
s)10
.71%
10.2
%
Othe
rs &
Div
ersi
fied
9.09
%10
.71%
Phar
ma
& He
alth
care
3.49
%3.
25%
2014 2015
Core
Sec
tor (
Oil a
nd G
as,
Pow
er, S
teel
, Min
eral
s et
c.)
0%0%
Tele
com
& A
llied
0.22
%0.
62%
PERCENTAGE OF MANAGEMENT GRADUATES IN OVERALL HIRING
Softw
are
& IT
13.9
6%13
.69%
Engi
neer
ing
& Au
tom
otiv
e(A
uto
& Au
to C
ompo
nent
s)10
.2%
8.93
%
Othe
r Man
ufac
turin
g (n
otin
clud
ing
FMCG
, CD,
Aut
omot
ive
& En
gine
erin
g)
31.5
8%30
%
Cons
umer
Goo
ds&
Dura
bles
11.4
6%13
.1%
BPO,
KPO
& IT
ES6.
21%
7.77
%
BFSI
32.6
2%34
.05%
Hosp
italit
y (In
clud
ing
Avia
tion,
Tour
s &
Trav
el, H
otel
s)4.
55%
4.21
%
Othe
rs &
Div
ersi
fied
32.7
3% 40.4
8%
Phar
ma
& He
alth
care
5.52
%7.
32%
2014 2015
Core
Sec
tor (
Oil a
nd G
as,
Pow
er, S
teel
, Min
eral
s et
c.)
32.6
7% 39.1
9%
o%Te
leco
m &
Alli
ed11
.87%
10.2
9%
PERCENTAGE OF VOCATIONAL GRADUATES IN OVERALL HIRING
0%0%Ot
her M
anuf
actu
ring
(not
incl
udin
g FM
CG, C
D, A
utom
otiv
e &
Engi
neer
ing)
Softw
are
& IT
1.22
%1.
46%
Engi
neer
ing
& Au
tom
otiv
e(A
uto
& Au
to C
ompo
nent
s)2.
04%
1.79
%
Cons
umer
Goo
ds&
Dura
bles
72.9
2%72
.6%
BPO,
KPO
& IT
ES0.
85%
0.24
%
BFSI
0.54
%0.
43%
Hosp
italit
y (In
clud
ing
Avia
tion,
Tour
s &
Trav
el, H
otel
s)6.
06%
7.94
%
Phar
ma
& He
alth
care
9.01
%8.
13%
Othe
rs &
Div
ersi
fied
7.27
%4.
76%
2014 2015
0%0%Co
re S
ecto
r (Oi
l and
Gas
,Po
wer
, Ste
el, M
iner
als
etc.
)
0%0%Te
leco
m &
Alli
ed
While it is important to understand the domain wise
hiring trends, it is equally interesting to analyse how
the hiring activity is distributed across the country. With
this in mind, the employers across 11 industry sectors
were asked about their hiring preference with respect
to states. This was done to identify the top states where
the hiring activity was maximum. When asked about the
preferred states where companies across the 10 sectors
hired from, the Top 10 States in the employers list were:
When compared to last year, the top 10 states more or
less remained the same. The only change being that in
the place of Jharkhand, Punjab entered in the Top 10 list.
When we look at the geographic spread of industries
in India few states have more prominent presence of
certain industries compared to others. Do the same
preferences exist when these companies look out for
talent? If the corporate responses are any indication,
To explore this point further, the job survey also tried to
capture the geographic presence of different industries.
Another purpose of this activity was to understand if
there were some industry wise location preferences
to establish operations. When asked about their states
of presence, companies across sectors chose varied
options, some had presence in 2 states, and others from
sectors like BFSI were present in as high as 25 states.
Maharashtra seemed to be a state where companies
of most industry sectors had a presence. It was closely
followed by Delhi and Tamil Nadu, which were preferred
by 6 and 5 out of 10 industry sectors respectively.
The table below shows the top 3 state preferences of
various industries.
Industry
BFSI
BPO, KPO & ITES
Consumer Goods & Durables
Core Sector (Oil & Gas, Power, Steel, Minerals, etc.)
Engineering & Automotive(Auto & Auto Components)
Hospitality (including Aviation,Tours & Travels, Hotels)
Other Manufacturing (not including FMCG, CD, Automotive & Engineering)
Others & Diversified
Pharma & Healthcare
Software & IT
Telecom & Allied
2013
Maharshtra
Andhra Pradesh
Tamil Nadu
Gujarat
Maharshtra
Delhi
Tamil Nadu
Karnataka
Karnataka
Maharshtra
Madhya Pradesh
2014
Maharshtra
West Bengal, Delhi
Uttar Pradesh
Maharshtra
Tamil Nadu
Maharshtra
Maharshtra
Delhi
Kerala, Tamil Nadu
Karnataka
Karnataka
Delhi
�
�
�
�
�
Haryana
�
�
Maharashtra
�
�
�
�
�
�
�
�
U.P.
�
�
Tamil Nadu
�
�
Karnataka
�
�
�
Kerala
�
Bihar
�
M.P.
�
�
West Bengal
�
�
Gujarat
�
�
�
Andhra Pradesh
�
AndamanNicobar
�
Industry
BFSI
BPO, KPO & ITES
Consumer Goods & Durables
Core Sector (Oil and Gas, Power, Steel, Minerals etc.)
Engineering & Automotive (Auto & Auto Components)
Hospitality (Including Aviation,Tours & Travel, Hotels)
Other Manufacturing (not including FMCG, CD,Automotive,& Engineering)
Others & Diversified
Pharma & Healthcare
Software & IT
Telecom & Allied
then yes there are few states which are preferred and
in most of these cases the preferences matches with
those of prominent presence of that sector. For e.g.,
BFSI chose Maharashtra while software and IT industry
preferred Karnataka. However, this data does indicate
that proximity of talent to the business location does
play a role in hiring decisions.
SECTOR WISE MOST PREFERRED STATES
33
PREFERRED FOR HIRING
TOP STATES OF PRESENCE FOR EACH INDUSTRY SECTOR
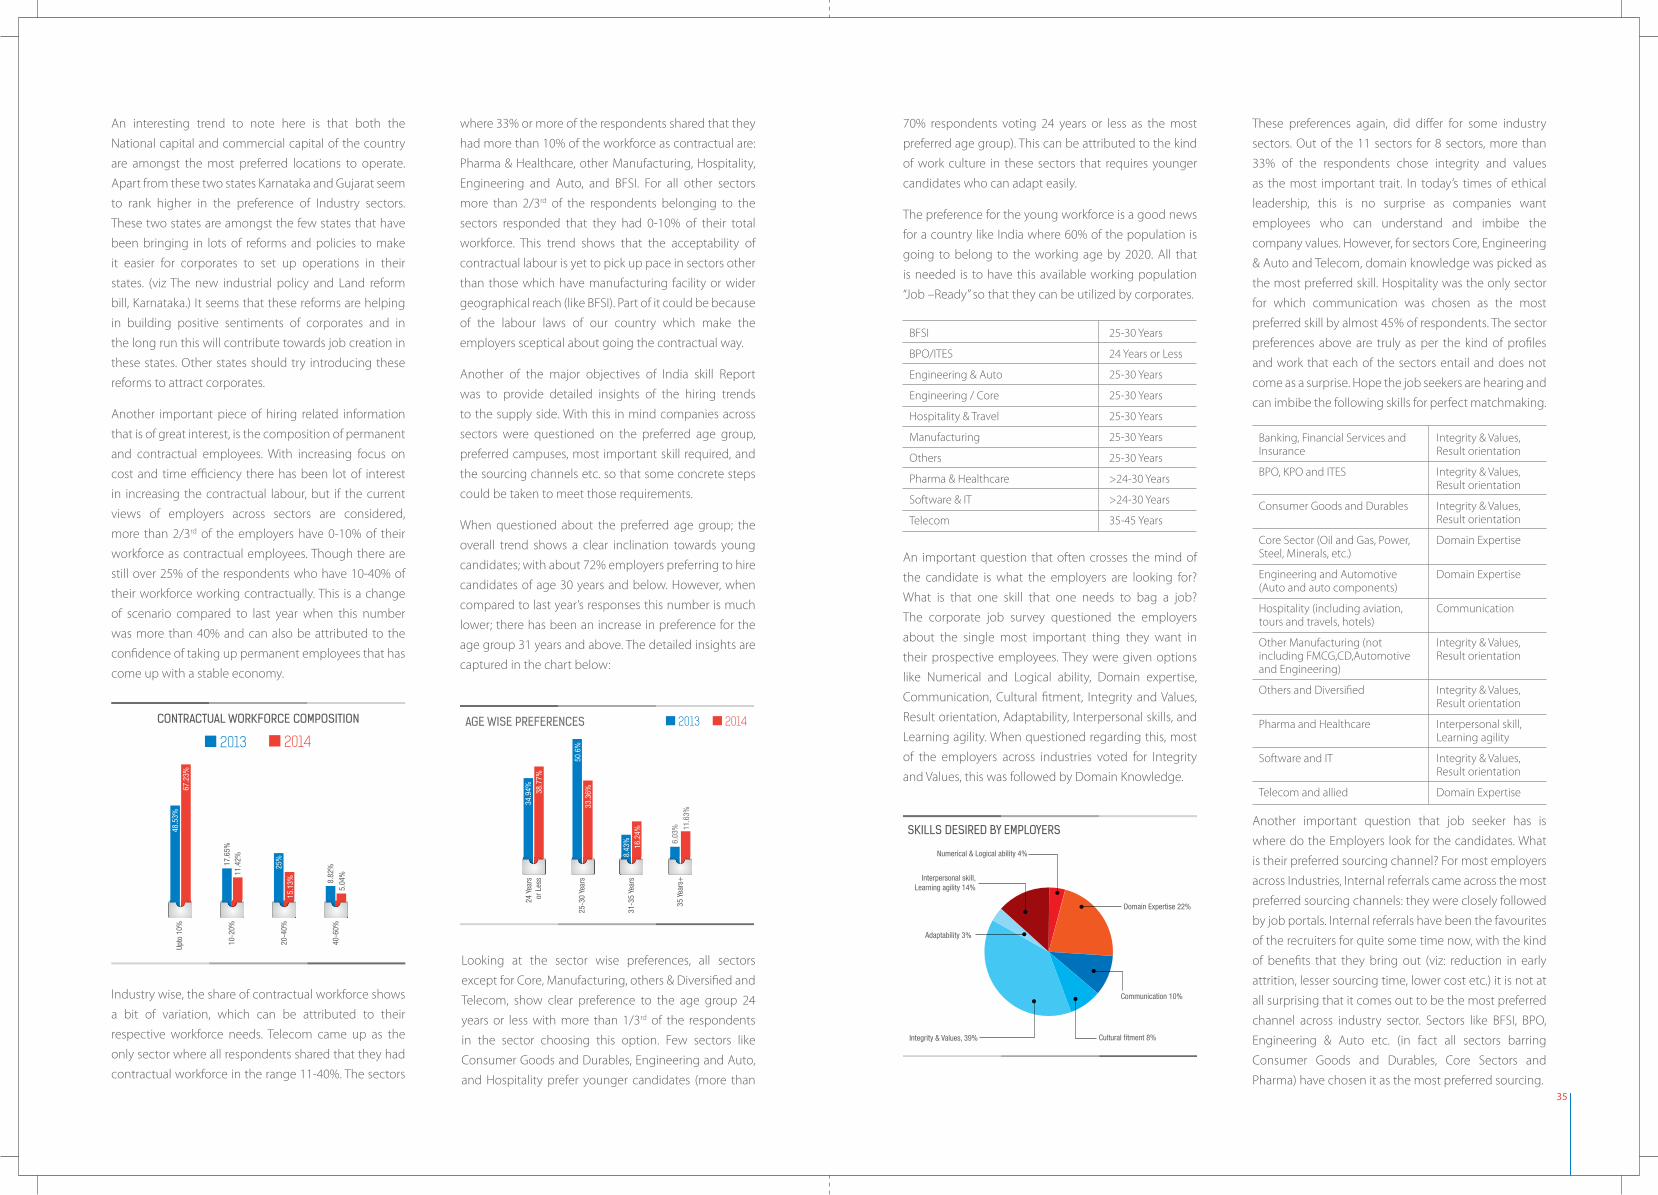
An interesting trend to note here is that both the
National capital and commercial capital of the country
are amongst the most preferred locations to operate.
Apart from these two states Karnataka and Gujarat seem
to rank higher in the preference of Industry sectors.
These two states are amongst the few states that have
been bringing in lots of reforms and policies to make
it easier for corporates to set up operations in their
states. (viz The new industrial policy and Land reform
bill, Karnataka.) It seems that these reforms are helping
in building positive sentiments of corporates and in
the long run this will contribute towards job creation in
these states. Other states should try introducing these
reforms to attract corporates.
Another important piece of hiring related information
that is of great interest, is the composition of permanent
and contractual employees. With increasing focus on
cost and time efficiency there has been lot of interest
in increasing the contractual labour, but if the current
views of employers across sectors are considered,
more than 2/3rd of the employers have 0-10% of their
workforce as contractual employees. Though there are
still over 25% of the respondents who have 10-40% of
their workforce working contractually. This is a change
of scenario compared to last year when this number
was more than 40% and can also be attributed to the
confidence of taking up permanent employees that has
come up with a stable economy.
Industry wise, the share of contractual workforce shows
a bit of variation, which can be attributed to their
respective workforce needs. Telecom came up as the
only sector where all respondents shared that they had
contractual workforce in the range 11-40%. The sectors
Looking at the sector wise preferences, all sectors
except for Core, Manufacturing, others & Diversified and
Telecom, show clear preference to the age group 24
years or less with more than 1/3rd of the respondents
in the sector choosing this option. Few sectors like
Consumer Goods and Durables, Engineering and Auto,
and Hospitality prefer younger candidates (more than
CONTRACTUAL WORKFORCE COMPOSITION
2013 2014
48.5
3%67
.23%
Upto
10%
17.6
5%12
.61%
11.4
2%10
-20%
15.1
3%
25%
20-4
0%
8.82
%
5.04
%40
-60%
where 33% or more of the respondents shared that they
had more than 10% of the workforce as contractual are:
Pharma & Healthcare, other Manufacturing, Hospitality,
Engineering and Auto, and BFSI. For all other sectors
more than 2/3rd of the respondents belonging to the
sectors responded that they had 0-10% of their total
workforce. This trend shows that the acceptability of
contractual labour is yet to pick up pace in sectors other
than those which have manufacturing facility or wider
geographical reach (like BFSI). Part of it could be because
of the labour laws of our country which make the
employers sceptical about going the contractual way.
Another of the major objectives of India skill Report
was to provide detailed insights of the hiring trends
to the supply side. With this in mind companies across
sectors were questioned on the preferred age group,
preferred campuses, most important skill required, and
the sourcing channels etc. so that some concrete steps
could be taken to meet those requirements.
When questioned about the preferred age group; the
overall trend shows a clear inclination towards young
candidates; with about 72% employers preferring to hire
candidates of age 30 years and below. However, when
compared to last year’s responses this number is much
lower; there has been an increase in preference for the
age group 31 years and above. The detailed insights are
captured in the chart below:
AGE WISE PREFERENCES
34.9
4% 38.7
7%24
Yea
rsor
Les
s
33.3
6%50
.6%
25-3
0 Ye
ars
16.2
4%8.
43%
31-3
5 Ye
ars
6.03
% 11.6
3%35
Yea
rs+
2013 2014
70% respondents voting 24 years or less as the most
preferred age group). This can be attributed to the kind
of work culture in these sectors that requires younger
candidates who can adapt easily.
The preference for the young workforce is a good news
for a country like India where 60% of the population is
going to belong to the working age by 2020. All that
is needed is to have this available working population
“Job –Ready” so that they can be utilized by corporates.
An important question that often crosses the mind of
the candidate is what the employers are looking for?
What is that one skill that one needs to bag a job?
The corporate job survey questioned the employers
about the single most important thing they want in
their prospective employees. They were given options
like Numerical and Logical ability, Domain expertise,
Communication, Cultural fitment, Integrity and Values,
Result orientation, Adaptability, Interpersonal skills, and
Learning agility. When questioned regarding this, most
of the employers across industries voted for Integrity
and Values, this was followed by Domain Knowledge.
Another important question that job seeker has is
where do the Employers look for the candidates. What
is their preferred sourcing channel? For most employers
across Industries, Internal referrals came across the most
preferred sourcing channels: they were closely followed
by job portals. Internal referrals have been the favourites
of the recruiters for quite some time now, with the kind
of benefits that they bring out (viz: reduction in early
attrition, lesser sourcing time, lower cost etc.) it is not at
all surprising that it comes out to be the most preferred
channel across industry sector. Sectors like BFSI, BPO,
Engineering & Auto etc. (in fact all sectors barring
Consumer Goods and Durables, Core Sectors and
Pharma) have chosen it as the most preferred sourcing.
These preferences again, did differ for some industry
sectors. Out of the 11 sectors for 8 sectors, more than
33% of the respondents chose integrity and values
as the most important trait. In today’s times of ethical
leadership, this is no surprise as companies want
employees who can understand and imbibe the
company values. However, for sectors Core, Engineering
& Auto and Telecom, domain knowledge was picked as
the most preferred skill. Hospitality was the only sector
for which communication was chosen as the most
preferred skill by almost 45% of respondents. The sector
preferences above are truly as per the kind of profiles
and work that each of the sectors entail and does not
come as a surprise. Hope the job seekers are hearing and
can imbibe the following skills for perfect matchmaking.
BFSI
BPO/ITES
Engineering & Auto
Engineering / Core
Hospitality & Travel
Manufacturing
Others
Pharma & Healthcare
Software & IT
Telecom
Banking, Financial Services and Insurance
BPO, KPO and ITES
Consumer Goods and Durables
Core Sector (Oil and Gas, Power, Steel, Minerals, etc.)
Engineering and Automotive (Auto and auto components)
Hospitality (including aviation, tours and travels, hotels)
Other Manufacturing (not including FMCG,CD,Automotive and Engineering)
Others and Diversified
Pharma and Healthcare
Software and IT
Telecom and allied
25-30 Years
24 Years or Less
25-30 Years
25-30 Years
25-30 Years
25-30 Years
25-30 Years
>24-30 Years
>24-30 Years
35-45 Years
Integrity & Values, Result orientation
Integrity & Values, Result orientation
Integrity & Values, Result orientation
Domain Expertise
Domain Expertise
Communication
Integrity & Values, Result orientation
Integrity & Values, Result orientation
Interpersonal skill, Learning agility
Integrity & Values, Result orientation
Domain Expertise
Integrity & Values, 39%
Adaptability 3%
Interpersonal skill,Learning agility 14%
Domain Expertise 22%
Communication 10%
Cultural fitment 8%
Numerical & Logical ability 4%
SKILLS DESIRED BY EMPLOYERS
35
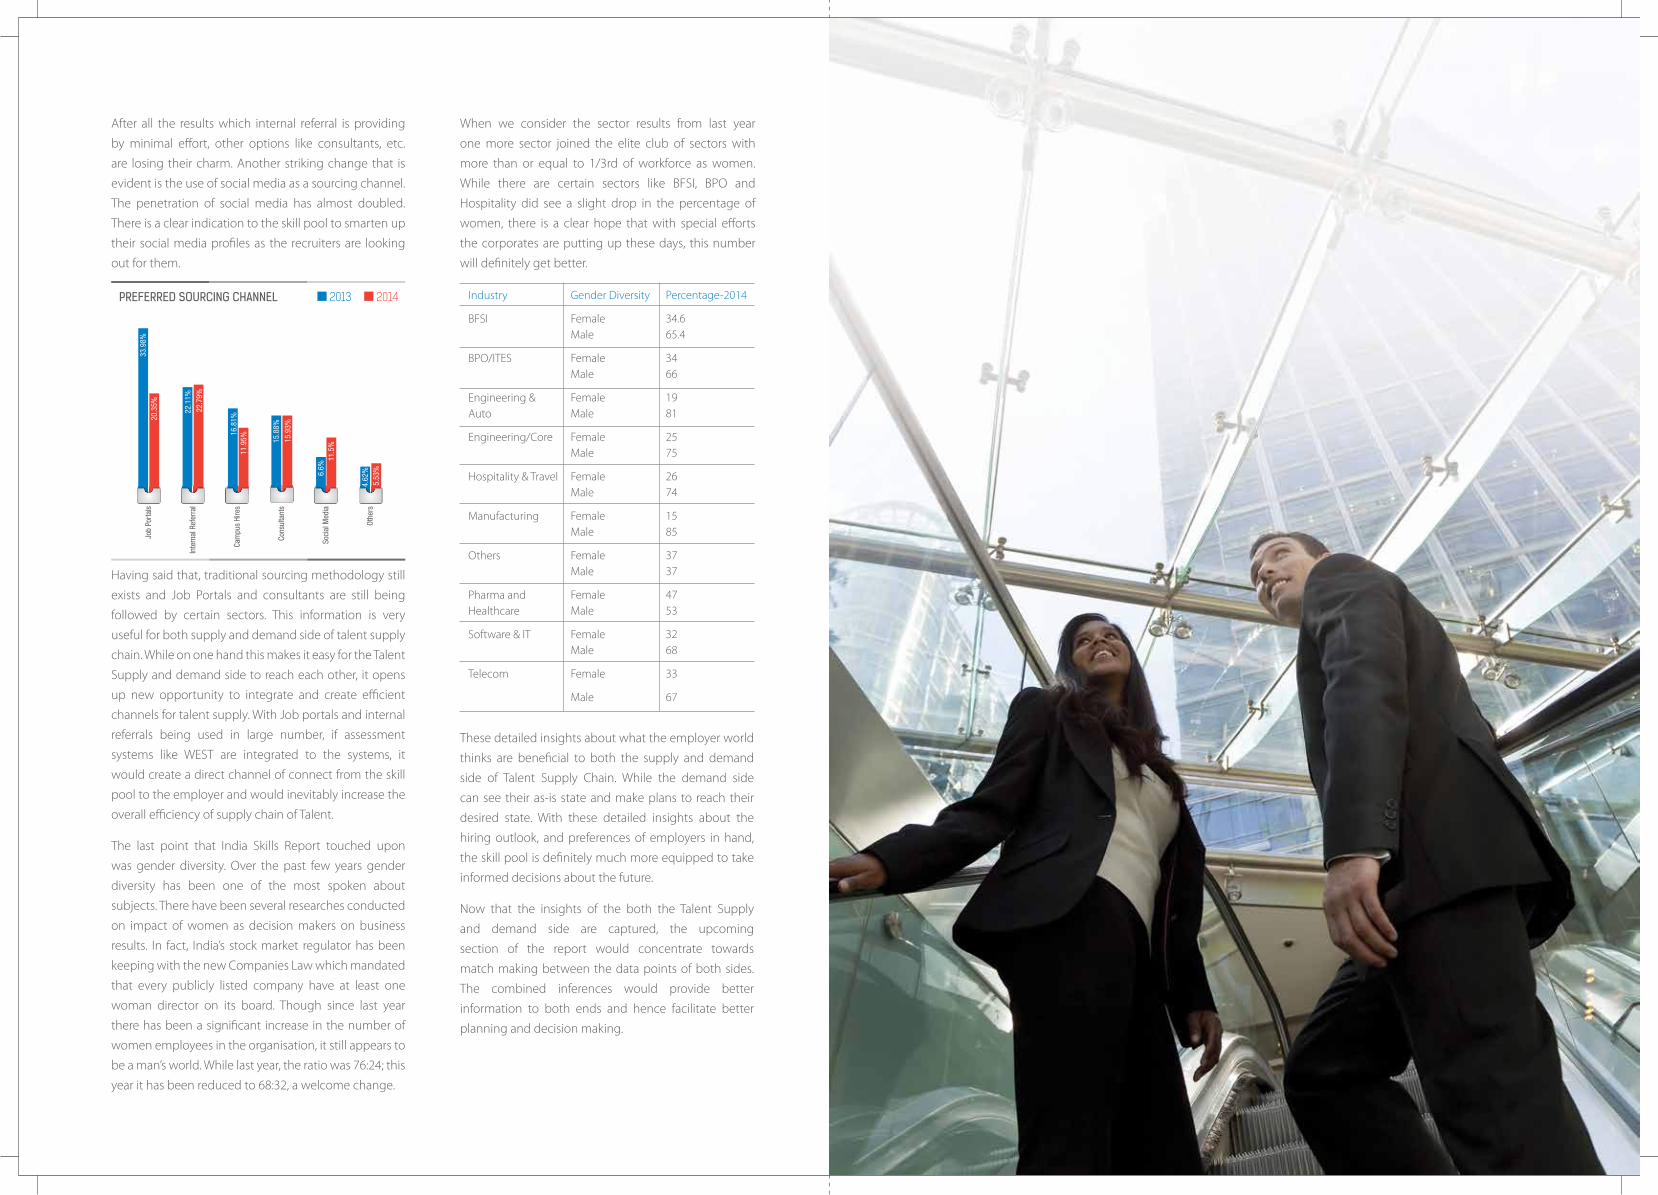
Industry
BFSI
BPO/ITES
Engineering & Auto
Engineering/Core
Hospitality & Travel
Manufacturing
Others
Pharma and Healthcare
Software & IT
Telecom
Gender Diversity
Female Male
Female Male
Female Male
Female Male
Female Male
Female Male
Female Male
Female Male
Female Male
Female
Male
Percentage-2014
34.6 65.4
34 66
19 81
25 75
26 74
15 85
37 37
47 53
32 68
33
67
After all the results which internal referral is providing
by minimal effort, other options like consultants, etc.
are losing their charm. Another striking change that is
evident is the use of social media as a sourcing channel.
The penetration of social media has almost doubled.
There is a clear indication to the skill pool to smarten up
their social media profiles as the recruiters are looking
out for them.
Having said that, traditional sourcing methodology still
exists and Job Portals and consultants are still being
followed by certain sectors. This information is very
useful for both supply and demand side of talent supply
chain. While on one hand this makes it easy for the Talent
Supply and demand side to reach each other, it opens
up new opportunity to integrate and create efficient
channels for talent supply. With Job portals and internal
referrals being used in large number, if assessment
systems like WEST are integrated to the systems, it
would create a direct channel of connect from the skill
pool to the employer and would inevitably increase the
overall efficiency of supply chain of Talent.
The last point that India Skills Report touched upon
was gender diversity. Over the past few years gender
diversity has been one of the most spoken about
subjects. There have been several researches conducted
on impact of women as decision makers on business
results. In fact, India’s stock market regulator has been
keeping with the new Companies Law which mandated
that every publicly listed company have at least one
woman director on its board. Though since last year
there has been a significant increase in the number of
women employees in the organisation, it still appears to
be a man’s world. While last year, the ratio was 76:24; this
year it has been reduced to 68:32, a welcome change.
These detailed insights about what the employer world
thinks are beneficial to both the supply and demand
side of Talent Supply Chain. While the demand side
can see their as-is state and make plans to reach their
desired state. With these detailed insights about the
hiring outlook, and preferences of employers in hand,
the skill pool is definitely much more equipped to take
informed decisions about the future.
Now that the insights of the both the Talent Supply
and demand side are captured, the upcoming
section of the report would concentrate towards
match making between the data points of both sides.
The combined inferences would provide better
information to both ends and hence facilitate better
planning and decision making.
2013 2014
Soci
al M
edia
6.6%
11.5
%
Cam
pus
Hire
s11
.95%
16.8
1%
Inte
rnal
Ref
erra
l22
.11%
22.7
9%
Job
Porta
ls20
.35%
33.9
8%
Othe
rs4.
62%
5.53
%
Cons
ulta
nts
15.8
8%
15.9
3%
PREFERRED SOURCING CHANNEL
When we consider the sector results from last year
one more sector joined the elite club of sectors with
more than or equal to 1/3rd of workforce as women.
While there are certain sectors like BFSI, BPO and
Hospitality did see a slight drop in the percentage of
women, there is a clear hope that with special efforts
the corporates are putting up these days, this number
will definitely get better.

CONCLUSION

41
Growth is the future - India Skills Report 2015 conveys.
In short this second edition of India Skills Report has
been the true reflection of the economic and business
sentiments prevailing in India. There is an increase
in the employability of the skill pool and parallely,
the corporates are expecting a rise of about 23% in
number of jobs. Reflecting growth in both supply
and demand sides the report projects a very positive
picture of the future. However, having said that it also
highlights the fact that if we truly want to reap the
benefits of demographic dividend, both the supply and
demand side would need to make sincere efforts and
matchmaking between both the ends would be vital to
get the best results.
Considering the importance of “Matchmaking” to
resolve the Great Indian Talent Conundrum; this final
section of India Skills Report tries to match the data
from the supply side and demand side to come up with
a holistic picture of the skill landscape of the country.
For doing the same the analysis of WEST scores of about
3 lakh test takers across states; age groups; domain
areas and gender were studied parallel to the Analysis
of responses of over 125+ employers to the Corporate
Job Survey on the hiring trends and results were quite
interesting!
One of the major finding of the WEST score of test
takers across states was the employability status of
the available skill pool. So the Top states which had
most “employable” skill pool were easily identified. The
When compared to the last year’s data, Maharashtra is a
new entrant to this list of states where the talent supply
and demand both seems to be high. The data supports
that these are the states that are doing an exemplary
job at one end of creating an encouraging environment
for employers to establish their centres and create
employment opportunities in state, on the other end
they are training the skill pool to be best in class and
ready to be employed by these employers. A cursory look
at the practices shows the various skill development and
industrial development initiatives that the Government
is taking in these states. There are Investor meets, Fares,
& Business parks being created which help in market
development and various training and skill development
initiatives to convert the “qualified” graduates to “skilled”
prospects for employers. However, the overall number
of candidates who are “employable” is not even 40% so
the steps might be a good start but still there is a long
way to go ahead. In direct contrast of the above states,
there were few states which did feature amongst the
Top states in one of lists but failed to feature in other. For
e.g. states like Orissa, Kerala, and Bihar had quite higher
number of employable candidates, but were not in the
priority list of Employers. Similarly states like Karnataka,
Punjab, Gujarat and Madhya Pradesh were part of the
Employer’s priority list (Top 10) but the WEST scores of
the assessed candidates in these states were lower than
the TOP 10 rankers. The employers as well as the skill
development bodies must try to work on the supply
demand mismatch that is prevalent in these states. Such
steps would definitely help in solving the talent issues of
our nation.
India is a country full of geographic diversities, which
quite often creates sub-groups amongst the states
based on common needs and makes it important that
any data is studied with reference to the geographic
distribution for meaningful insights. However this is
not enough to solve the problems. Merely knowing
where the employable talent resides is not enough.
The 11 major industry sectors which are considered
in India Skill Report are different, not only in their area
of work, services and products offered, but also in the
kind of people they hire the most. As their needs for a
particular domain of candidates are different, their focus
areas for hiring would logically be different. Hence,
it makes much more sense for the employers across
states to understand where the employable candidates
are, for the domain that they require is available. A
combined study of data from the supply and demand
Corporate Job Survey on the other hand shared the state
wise hiring preferences of employers across industry
sectors. So parallel to the knowledge of where the best
skill pool resides, we had the states where employers
chose to hire. This data when combined carved out a
clear picture of states where the talent and job have the
best opportunity to meet each other. The states which
have the most employable talent and at the same time
are the “preferred” hiring destinations of employers were:
side brought out the following insights. The Analysis of
WEST data provided the various states where most of
the “employable” candidates of different domains could
be found. And parallely, India’s Job Prediction Survey
analysis shared industry wise domain preferences of
each Industry sectors. Taking into account the top two
domains that dominate the hiring pie for each sector
from the demand side, and the Top states where the best talent for each domain areas is available, following states were identified as lucrative hiring regions for each of industry sectors:
BANKING, FINANCIAL SERVICES AND INSURANCE
BPO, KPO AND ITES
MOST PREFERRED HIRING DESTINATIONS

43
CONSUMER GOODS AND DURABLES ENGINEERING AND AUTOMOTIVE (AUTO AND AUTO COMPONENTS)
OTHER MANUFACTURING (NOT INCLUDING FMCG, CD, AUTOMOTIVE AND ENGINEERING)
SOFTWARE AND IT
TELECOM AND ALLIEDPHARMA AND HEALTHCARECORE SECTOR (OIL AND GAS, POWER, STEEL, MINERALS, ETC.)
HOSPITALITY (INCLUDING AVIATION, TOURS AND TRAVELS, HOTELS)
MATCHMAKING SUPPLY ANDDEMAND OF TALENT

These states contain the best of talent in particular
domain areas, hence it would makes business sense for
employers from these sure shot sources of their much
needed talent.
The coming year is the one of immense growth for
companies across industry sectors, and getting the
best talent becomes much more of challenge. To win
this “War of Talent” companies try to understand the
preferences of their candidate pools and try to meet
those needs and create an effective employer value
proposition that makes sense and has immense value
for the future employees.Job location is one such area,
which often results in loss of a good talent.Hence it is
important to understand the candidate preferences in
this regards as well. The india skills report also provides
meaningful insights in this regards as well With this in
mind the WEST test takers were also asked about their
preferred destinations to work. This information when
combined with the top states where companies of
various sectors have a presence (as captured from India’s
Job Prediction Survey) provided the list of states where
the thought process of the talent supply and demand
sides meet. The states that made to this list are:
It could be attributed to the support provided to the
employers by the government in these states, or to the
infrastructure and facilities that attract the job seekers
towards the cities in these states; but other states
surely need to take steps so that the population of job
seekers is not concentrated towards particular cities and
states. Accordingly, the employers should also try to
expand their operations in the states where candidates
would prefer to work. Few examples of such states are:
Chandigarh, Andhra Pradesh and Tamil Nadu. It is only
when a joint effort is made by both ends that a mutually
beneficial solution can be reached.
The work culture and work environment of companies in
different sectors varies quite significantly. This variation
is one of the major factors which govern the workforce
demographics. For e.g. an industry that requires too
much physical prowess, tends to have more male
employees, an industry like BPO where the work timings
are odd hires young population who can adjust to
these time swings. To understand the overlaps between
the Supply and Demand side over these factors the
WEST scores of the supply side and survey responses
of the demand side were also analysed through the
demographic lens.
For this purpose, when data captured through
Employability Skill Test and India’s Job Prediction Survey
was brought in together a striking match between
the supply and demand side came up. As per the data
captured from most preferred age group for hiring as
per the employers across industry sectors is from below
24 years till 30 years. More than 70% of the employers
preferred to hire from the age group less than 30 years.
When it comes to the supply side, about 35% of the test
takers in the age group less than 30 years were found
employable and most of this lot belonged to the age
group of 18-21 years (about 40%) significantly higher
than the other age groups.
The combination of these data points brought out good
news for sectors like BPO/ITES, Consumer Durables
Engineering & Auto, Hospitality, Pharma and Healthcare,
Software and IT etc. where most employers (more than
1/3rd prefer to hire from the age group 18-21 years as the
maximum number of quality talent belong to this age
group. Situation looks a bit difficult for sectors like BFSI,
Core Sector, other Manufacturing and Telecom sectors
where the preferred age for hiring is higher and there
seems to be a dearth of employable talent. This gives
a clear indication to all the parties, that special steps
to develop required skills in these sectors are required.
Things like hiring candidates from lower age group and
then training them to do the work might be beneficial,
on the job training or apprenticeship can also be
provided to the required candidates. Joint efforts from
all stakeholders are needed to match these demands.
One of the major areas of interest in the corporates
for the past few years has been “Gender Diversity” and
with mandates like compulsory inclusion of Women on
company boards etc. coming from the Government, this
focus has increased further. When both the Government
and Corporates are trying to encourage the participation
of women in Job market and economy as a whole, it made
sense to understand how the females fared in terms of
skill levels, also in terms of presence in the corporate well.
It was also to understand that while there is demand of
including more and more women in the workforce, are
they ready to be “employed”. These data points captured
respectively from WEST score and corporate responses
when clubbed together brought up an encouraging
picture for the future. As per the India’s Job Prediction
Survey the current gender diversity status across
industry sectors is 68:32. Though this is an improvement
from last year’s numbers its still disappointing to note
that even today, the number of females has not even
reached one-third of the total workforce. In fact, out of
the 11 Industry sectors that were studied, only 5 could
report gender ratio of 2:1. The supply side on the other
hand showed that women test takers significantly more
employable than the male test takers. Thus, though
the efforts of Government are showing results with
such encouraging levels of employability in women,
the corporate from different Industry need to do their
part and provide them the opportunity to put their
knowledge and skills to work. The states from where 45
these “employable” female candidates can be hired are
Kerala, Gujarat, West Bengal, Maharashtra, Uttar Pradesh,
Bihar, Andhra Pradesh, Haryana, Rajasthan and Tamil
Nadu. If we compare this data with the current preferred
hiring locations of employers across sectors, almost all
sectors have equal opportunity of improving the gender
ratio of the organisations, as they already hire from the
states where the “employable” females are found in
large numbers. A little bit more conscious effort might
be needed to make sure that the right kind of talent is
found at the right time.
With this we come to the end of India Skills Report 2015
Analysis. Through the insights shared in the last 30 pages
the complete skill landscape of India has been captured.
This comprehensive understanding of the supply
and the demand side shows various areas where the
employers, academia, as well as the Government need
to work. The steps needed have already started both
from the employer as well as the skills side (Academia,
Government). All that is needed is to keep up this
momentum and take all these initiatives to their planned
culmination. The focus that is seen in the past one year,
prevalent both in the political and economic scenarios,
creates a hope in the minds of over 1.2 billion Indians,
that demographic dividend will be earned to the fullest.
Hope this hope stays!
STATES PREFERRED SUPPLY AND DEMAND

THE WAYFORWARD
The India Skills Report is an initiative that was started last
year with a vision to bring the Talent supply and demand
side on the same table and facilitate matchmaking
between these two ends. In the second year of this
journey, the reach of the report was increased by
manifolds. On the supply side the participation in the
WEST survey increased by 200%, with almost 3,00,000
students across domains taking the test. Reach for
corporate survey also increased by 25% & over 125
employers spread across 11 industry sectors were
surveyed. This helped is drawing insightful inferences
that can help the stakeholders of the skill landscape
to come up with new ways to fill in the talent supply
demand gap.
The first steps for which have already started. The
government has started initiatives to improve the skill
levels, and encourages industrial growth for generating
jobs. Both the employers and academia are also
making efforts to reach out to each other, apart from
participating in the Government-led initiatives. We just
hope that these initiatives will be completed without
any challenges and deliver the much needed results to
the supply and demand side of supply chain.
India Skills Report will continue to provide the much
needed insights that can help in making it possible.
In the first two editions of the India Skills Report, the
focus was to increase the reach of both supply and
demand side data, so that a sharper picture of the
talent landscape can be drawn. Its subsequent editions
would continue to do so and try ways of implementing
the recommendations for improving the Talent Supply
Demand scenario.
We hope that with each coming year, this Report will
provide much deeper insights from the supply and
demand side and will help in find solution to the talent
conundrum of India.

APPENDIX

To create standard reporting guidelines on potential
skill supply-demand gap, that can provides insights into
the hiring trends of the market while understanding the
needs of the job seeker and organisations.
India’s Job Prediction Survey, a close ended
questionnaire was the instrument used to capture the
outlook of the Employers or Job Demand side. In this
15 question survey, employers were asked about their
hiring mix, their preferences for hires based on domain,
age group etc. Information about their preferred states
The detailed analysis of the responses received has already been covered in Report. These insights provide a glimpse of the
corporate world to the skill supply side, can be used as guidelines for matchmaking the talent supply and demand sides.
The Analysis process for India Skill Report was a two
step process. As the first step, a first cut analysis of the
scores of test takers of the employability skill test, and
the employers’ response to the corporate survey was
done separately. Normalization was done to remove any
kind of skewness in the data. Inferences derived from
these Individual analyses were used to provide detailed
insights of the “Supply” and “Demand” world which are
covered in the section II and section III of India Skills
Report. As would be evident from the analysis in these
two sections, the data collected from the two sides was
analysed primarily from three angles: Demographic,
Geographic and Sectoral. Demographic angle covered
the insights of the WEST scores and India’s Job Prediction
Survey from the perspectives, like age group, Gender etc.
The Geographic stance provided the state wise status
of employability in the skill pool and available jobs. And
finally Industry wise focus (primarily for the India’s Job
Prediction Survey) helped understand the industry wise
WEST was conducted, to check the “employability”
of the skill pool using reliable talent assessment tool
across domain areas. WEST assessed the test takers on
five areas, Domain Knowledge, Communication Skills,
Computer Skills, Numerical and Logical Ability and
Behavioural traits. This test was taken by about 3,00,000
students across states and domain areas. The detailed
respondent profile of the test takers is shared below.
With the help of the scores of these respondents a
comprehensive analysis of the skill pool was done,
the details of which have already been shared in the
report. The insights shared would hopefully help the
academia, government and the employers to take steps
for improving the quality of skill pool.
OBJECTIVE OF THE REPORT INDIA’S JOB PREDICTION SURVEY
WHEEBOX EMPLOYABILITY SKILL TEST
ANALYSIS – THE METHODOLOGY
51
18-21 years 49.30%
Below 17 years 4.60%
22-25 years 46.04%
AGE WISE DATA
26-29 years 0.04%
B.Tech/B.E. 50.39%
Polytechnic 8.25%
BBA 1.8%
B. Pharma 0.49%
ITI 9.23%
MCA 7.42%
B.Sc. 4.62%
MBA 9.2%
BCom 3.1%
BA 4.5%
MSc 1%
DOMAIN WISE
GENDER WISE DATA
Male 60.41%
Female 39.58%
BPO, KPO & ITES 10%
Hospitality (including Aviation,Tours & Travels, Hotels) 8%
Other Manufacturing(not including FMCG, CD,
Automotive & Engineering) 9%
Others25%
Software & IT 14%Pharma & Healthcare 3%
Engineering & Automotive(Auto & Auto Components) 12%
Core Sector (Oil & Gas, Power, Steel, Minerals, etc.) 3%
Consumer Goods & Durables 3% BFSI 9%
Telecom & Allied 3%
Education & Training 8%
Consulting 8%
Non Profit 2%
Logistics 3%
Retail 3%
Packaging Solution 2%
RESPONDENT PROFILE
for hiring preferred skills in a candidate etc. were also
captured to provide meaningful insights to the talent
supply side. About 125 employers across 11 Industry
sectors participated in the survey and shared their
thought process. The sector wise respondent profile is
shared below.
preferences. Domain specific supply and demand status
was also captured by analysing the scores of Individual
domains, and also analysing the employer responses on
their domain wise preferences. All this formed part of
the first cut analysis of data collected.
This first cut information from both ends was then used
for matchmaking and drawing combined inferences that
would help both the supply and demand sides of skills
to take future decisions. These combined inferences are
covered in detail in the Section IV of the Report.
These individual and combined inferences drawn from
Demand and Supply side data, paint a comprehensive
picture of the skill landscape of India. This information
can be used to create guidelines for consolidated action
by academia, employers, students as well as Government
against the Talent Supply-Demand mismatch challenge
that stands in front of the nation.
NSDCAN OVERVIEW
The India Skills Landscape was nascent and small with
very few players of scale and credibility 5 years back.
The National Skill Development Corporation India
(NSDC) was setup as a one of its kind, Public Private
Partnership with the primary mandate of catalysing the
skills landscape in India. It aims to skill 150 million people
through active engagement of private sector.
NSDC is a unique model created with a well thought
through underlying philosophy based on the following
pillars:
Create: Proactively catalyze creation of large, quality
vocational training institutions
Fund: Reduce risk by providing patient capital
Enable: Create an enabling ecosystem for entities to
operate efficiently
The NSDC Board has approved 156 skilling proposals
and 31 Sector Skill Councils with total financial
commitment of INR 2,362 crore. As of September 2014,
the NSDC Training Partners, SSCs and affiliated training
agencies have trained 33, 74,817 students and placed
12, 25,428 students (excluding Star placements). 89
training partners were operating 1408 training centers
across 356 Indian districts of India and running about
875 courses.
In addition, NSDC is working to develop an enabling
ecosystem to foster the growth of sustainable skill
development entities. To that end NSDC is setting up
Sector Skill Councils that are industry bodies responsible
for defining the requirements of the industry on
manpower - both quality and quantity will play a critical
role in creating an enabling environment for vocational
training in India. Till date, 2014, 22 SSCs are operational.
As of September 2014, 22 SSC’s have designed 2,247
CREATE AND FUND
STATEWISE SPLIT OF PEOPLE TRAINED BY NSDC
ENABLE
unique NOS and 455 QP’s (Qualification Packs) out of
the total 879 QP’s designed by the SSC’s have been
registered as National Standards.
In an attempt to develop the research base for skills in
India NSDC has and is committed to conduct extensive
research across the country. These studies are useful
first-round reference documents for policy makers at the
national and state levels, Chambers of Commerce, SSCs,
and industry associations. NSDC has commissioned
reports across a wide gamut of subjects in skills including
assessment of manpower requirements for sectors, all
districts of India, training of trainers, etc.
In an endeavor to make skills aspirational, NSDC
launched an advocacy campaign, “Hunar Hai to Kadar
Hai” to motivate youth to enroll for skilling programs
across the country. A pan-India based Call Centre has
been set up to address the concerns and questions
of the youth. NSDC also spearheads the World Skills
Competition which is like a mini Olympics for skills.
NSDC, through its Innovation Practice looks at
supporting innovative ventures that create a disruption
in the skills landscape across different parts of the skills
value chain such as sourcing, financing, placement,
assessments, etc.
NSDC works with multiple multi-lateral agencies with
a purpose of capacity building and promoting large
scale sustainable training projects. NSDC has tie ups
with several bilateral and multi-lateral organizations
such as European Union, Asian Development bank, and
Department for International Development.
NSDC is working on special projects like Udaan for
Jammu and Kashmir which is targeted at helping the
ambitious and progressive youth of J&K, seeking global
and local opportunities. It aims to make employable
40,000 youth of J&K over a 5 year period, in high growth
sectors.
NSDC was also mandated to implement the STAR
scheme approved by the Cabinet Committee on Skills
Development. It promotes voluntary skill acquisition
among the youth by incentivizing it through monetary
reward at an average of INR. 10,000/- to cover 10
Lakh youth over 1 year. Since the launch of the STAR
Scheme in August 2013, there have been over 14 lakhs
enrolments and 8.55 lakh candidates have passed their
assessments out of 12.75 lakh assessed, achieving an
overall pass percentage of 67%.
Sectors Covered Andaman and Nicobar IslandsAndhra PradeshArunachal PradeshAssamBiharChandhigarhChhattisgarhDadra and Nagar HaveliDaman and DiuDelhiGoaGujaratHaryanaHimachal PradeshJ&KJharkhandKarnatakaKeralaLakshadweepMadhya PradeshMaharashtraManipurMeghalayaMizoramNagalandOdishaOthersPondicherryPunjabRajasthanSikkimTamil NaduTelanganaTripuraUttar PradeshUttarakhandWest BengalTotal
Total Trainings
42
3,27,300163
25,0421,53,776
4,2811,07,504
350465
1,76,4201,088
1,13,1321,52,36743,7718,337
42,1952,62,37859,376
3632,40,9313,14,537
6157,719264
1,69387,06922,5626,252
90,1651,88,215
3,8802,81,63914,54011,173
1,78,78424,338
2,35,84431,88,570
Star
10
1,41,96696
7,44920,7592,616
17,34445
45864,295
64963,16391,65629,6163,451
22,07387,00240,915
3531,16,3011,09,269
176140
070
30,1400
5,55054,801
1,41,385209
1,20,25511,0728,089
94,7179,016
95,27713,90,383
Total
32
1,85,33467
17,5931,33,017
1,66590,160
3057
1,12,125439
49,96960,71114,1554,886
20,1221,75,37618,461
101,24,6302,05,268
4397,579264
1,62356,92917,012
35135,36446,8303,671
1,61,3843,4683,084
84,06715,322
1,40,56717,92,286
2014-15
3
10,9920
1,91111,948
50224,915
360
4,058204
11,04123,9657,441328
1,95928,3261,086
015,96256,394
6493992
1156,320
046
1,2373,135186
27,9783,468
4810,628
92921,641
2,77,897
2013-14
29
1,15,5940
8,8121,01,703
1,15632,586
2510
79,090127
14,46123,9842,8802,203
11,59667,32411,822
062,57493,413
1673,458
89969
31,9250
18311,53519,5081,200
98,7700
2,14339,2796,233
85,1289,30,192
2012-13
0
45,64862
3,08110,852
723,969
157
20,505101
12,73910,0241,6471,8224,281
66,8684,367
036,95631,379
901,919
77274
11,32812,338
5914,87213,6541,909
22,8160
77019,8114,130
24,1294,02,506
2011-12
0
13,1005
3,7898,514
08,690
30
8,4727
11,7282,7382,187533
2,28612,8581,186
109,138
24,082118
1,2636
2657,3564,674
637,720
10,533376
11,8200
12314,3494,0309,669
1,81,691
2010-11
NANA
Non-Star
53

REFERENCES
CONTRIBUTORS
NDTV Profit. PM Modi’s ‘Make in India’ Push Gets Thumbs Up from Moody’s Analytics Retrieved September 2014 from,
http://profit.ndtv.com/news/economy/article-pm-modis-make-in-india-push-gets-thumbs-up-from-moodys-analytics-662044
The Wall Street Journal. An Invitation to ‘Make in India’ Retrieved September 2014 from, http://online.wsj.com/articles/
narendra-modi-an-invitation-to-make-in-india-1411687511
Economic Times. Make-in-India: Manufacturing can no longer accommodate unskilled ex-farmhands . Retrieved
October 2014 from, http://economictimes.indiatimes.com/articleshow/44658249.cms?utm_source=contentofinterest&utm_
medium=text&utm_campaign=cppst
Economic Times. PM Modi’s US Visit: Rock show in New York over, it’s time to roll action in India Retrieved September 2014
from, http://articles.economictimes.indiatimes.com/2014-09-30/news/54475123_1_pm-modi-mars-mission-space-missions
Financial Express. India to launch new skill development programme, Retrieved October 2014 from,
http://www.financialexpress.com/news/india-to-launch-new-skill-development-programme/1296651
NDTV Profit. PM Modi’s ‘Make in India’ Push to Drive Investments, Create Jobs. Retrieved September 2014 from,
http://profit.ndtv.com/news/economy/article-pm-modis-make-in-india-push-to-drive-investments-create-jobs-669641
Economic Times. Make-in-India: Manufacturing can no longer accommodate unskilled ex-farmhands. Retrieved October
2014 from, http://economictimes.indiatimes.com/opinion/comments-analysis/make-in-india-manufacturing-can-no-longer-
accommodate-unskilled-ex-farmhands/articleshow/44658249.cms?utm_source=contentofinterest&utm_medium=text&utm_
campaign=cppst
Economic Times. Make in India’ will remain just a mantra unless India gets cracking with vocational training
Retrieved October 2014 from, http://articles.economictimes.indiatimes.com/2014-10-07/news/54735514_1_training-china-
senior-secondary-level
DNA India. Narendra Modi gives 3-D formula for India to become a global leader Retrieved September 2014 from http://
www.dnaindia.com/world/report-narendra-modi-gives-3-d-formula-for-india-to-become-a-global-leader-2022237
Notes:
1. Star trainings commenced from FY2013-14, hence the yearwise split is unavailable
2. Data for FY2014-15 is till September 30, 2014
Source: NSDC Partner Submission
SECTOR WISE SPLIT OF PEOPLE TRAINED BY NSDC
TOTAL NUMBER OF PEOPLE TRAINED BY NSDC
Sectors Covered
Agriculture/Rural Farm
Automobile / autocomponents
Aviation
Banking/Insurance and finance
Building & Construction
Capital Goods
Chemicals and Pharmaceuticals
Education/ skill development
Electrical Hardware
Electronics & IT Hardware
Engineering
Entrepreneurial Skills
FMCG
Food Processing/Cold Chain/Refrigeration
Gems & Jewellery
General
Government
Handloom and Handicrafts
Health Care
Infra
IT or software
ITES-BPO
IT-ITES
Leather and leather goods
Manufacturing
Media, entertainment, broadcasting, content creation, animation
Organised Retail
Others
Plumbing
Rural non farm
Security
Select Informal Sectors (domestic help, beauticians, facility management)
Service Sector
Soft-skills and English Communication
Telecom
Textiles and Garments
Tourism, hospitality and travel
Rubber
Mining
Transport and logistics
Total
Total Trained
FY 2010-11
FY 2011-12
FY 2012-13
FY 2013-14
FY 2014-15
Sub-total
Total Trainings Provided
Non-Star
20,484
1,81,691
4,02,506
10,05,074
3,57,986
19,67,741
Star
14,00,416
14,00,416
33,68,157
2010-11
0
190
0
206
119
0
0
14,316
5
0
0
0
0
0
0
16
0
0
0
0
359
958
0
0
34
0
95
264
0
0
0
0
0
16
3,518
346
42
0
0
0
20,484
2011-12
448
1,776
0
8,512
5,703
0
0
51,507
0
1,034
733
0
0
404
366
0
0
0
1,542
0
9,829
16,751
0
0
1,044
33
10,665
0
0
2,765
53
3,940
0
0
60,018
3,512
1,056
0
0
0
1,81,691
2012-13
14,137
16,747
0
25,097
19,465
0
1,181
15,048
588
6,369
1,342
333
0
35
407
0
0
0
7,363
1,512
84,487
9,234
0
9
1,574
172
49,849
5,160
0
5,903
8,400
5,245
13,444
651
96,335
5,512
5,623
0
0
1,284
4,02,506
2013-14
22,861
47,497
1,422
48,621
53,921
0
2,228
16,609
3,420
21,213
9,246
5,877
407
694
128
788
0
2,584
51,438
0
87,524
77,519
67,466
146
8,900
11,685
1,10,902
52,496
0
0
14,150
12,718
61,848
13,837
1,43,255
17,177
26,773
0
0
0
9,95,350
2014-15
9,527
15,983
0
23,898
16,460
3,547
106
0
0
17,493
0
0
0
1,675
0
0
919
1,363
11,286
0
0
0
57,777
0
0
0
10,556
25,663
257
0
3,470
1,017
0
0
58,506
3,375
8,597
0
0
6,155
2,77,630
Total
46,973
82,193
1,422
1,06,334
95,668
3,547
3,515
97,480
4,013
46,109
11,321
6,210
407
2,808
901
804
919
3,947
71,629
1,512
1,82,199
1,04,462
1,25,243
155
11,552
11,890
1,82,067
83,583
257
8,668
26,073
22,920
75,292
14,504
3,61,632
29,922
42,091
0
0
7,439
18,77,661
Star
99,992
1,21,257
0
1,22,089
9,856
1,186
0
0
0
15,827
0
0
0
0
53,320
0
0
0
29,620
0
0
0
3,19,368
19,996
0
1,751
2,64,004
0
10,002
1,09,757
5,006
0
0
2,12,248
0
0
4,325
0
0
13,99,604
Total Trainings
1,46,965
2,03,450
1,422
2,28,423
1,05,524
4,733
3,515
97,480
4,013
61,936
11,321
6,210
407
2,808
54,221
804
919
3,947
1,01,249
1,512
1,82,199
1,04,462
4,44,611
20,151
11,552
13,641
4,46,071
83,583
10,259
8,668
1,35,830
27,926
75,292
14,504
5,73,880
29,922
42,091
4,325
0
7,439
32,77,265
Non-Star
55