india: selected issues - imf · india selected issues ... the remainder of this chapter assesses...
TRANSCRIPT

© 2005 International Monetary Fund March 2005
IMF Country Report No. 05/87
India: Selected Issues
This Selected Issues paper for India was prepared by a staff team of the International Monetary Fund as background documentation for the periodic consultation with the member country. It is based on the information available at the time it was completed on January 7, 2005. The views expressed in this document are those of the staff team and do not necessarily reflect the views of the government of India or the Executive Board of the IMF. The policy of publication of staff reports and other documents by the IMF allows for the deletion of market-sensitive information.
To assist the IMF in evaluating the publication policy, reader comments are invited and may be sent by e-mail to [email protected].
Copies of this report are available to the public from
International Monetary Fund ● Publication Services 700 19th Street, N.W. ● Washington, D.C. 20431
Telephone: (202) 623 7430 ● Telefax: (202) 623 7201 E-mail: [email protected] ● Internet: http://www.imf.org
Price: $15.00 a copy
International Monetary Fund
Washington, D.C.

INTERNATIONAL MONETARY FUND
INDIA
Selected Issues
Prepared by a staff team consisting of Jerald Schiff, Hélène Poirson, Catriona Purfield, Sonali Jain-Chandra (all APD), Amadou Sy (MFD), and Poonam Gupta (RES)
Approved by the Asia and Pacific Department
January 7, 2005
Contents Page Overview ...........................................................................................................................2 I. Has India Entered a New Phase of Higher Trend Growth? .......................................3 II. Understanding the Growth Momentum in India’s Services ....................................11 III. Foreign Direct Investment in India: How Can It Be Increased?..............................20 IV. The Tax System in India: Could Reform Spur Growth? .........................................33 V. The Interest Rate Risk Management of Banks’ Government Securities Holdings in India............................................................................65
- 2 -
OVERVIEW 1. The five papers presented here paint a picture of an Indian economy that has made great strides, but has more to do to accelerate growth and reduce poverty. The papers focus on a number of the reforms required to ensure that needed high growth can be achieved on a sustained basis. To a large extent, these reforms are a priority of the new Indian government, and implementation is now the key.
2. Growth has been solid for a number of years, but a move to a permanently higher growth path—as envisaged by the Indian authorities—is not yet assured. Chapter I establishes that there is little evidence of a rise in trend growth in recent years. The analysis points to declines in investment in manufacturing and agriculture as key reasons, suggesting that the government’s focus on enhancing infrastructure and improving the investment climate is the right one. Developments during 2004–05 give grounds for optimism: the corporate sector appears to be embarking on a new investment cycle; and India is integrating rapidly into global production chains. An expanding labor force can provide further impetus for growth over the medium term, if sufficient job opportunities can be created.
3. The service sector has led India’s growth, and its success provides valuable lessons for economic policy more generally. Chapter II examines the long-term growth in services, and concludes that policies—in particular, the opening of services to FDI, trade and private ownership—have played a key role. Most recently, the phenomenal success of the IT sector highlights the potential of an Indian economy freed of heavy regulatory burden and high marginal tax rates.
4. India is poised to become a major destination for foreign direct investment, but broad reforms are needed. While recent surveys point to India as a future “hot spot” for FDI, it still lags well behind most emerging markets in actual performance. Chapter III provides evidence that this seeming paradox reflects the need for broad improvements in the business climate—and not simply more favorable policies toward FDI in particular—to unleash India’s full potential.
5. Tax reform can help generate needed fiscal adjustment, while contributing to higher growth. Chapter IV examines India’s current tax system, and finds that revenue intake is low, and the combination of high marginal effective tax rates and numerous tax exemptions may be constraining and distorting investment. The government’s planned tax reform would, by broadening the tax base and lowering statutory rates, move the tax system in the right direction.
6. Finally, for the recent recovery in private investment to take hold, the financial sector will need to play more fully its key intermediation role. One factor inhibiting the full development of the financial sector has been the large financing need of the government, which has crowded out private sector credit and investment. Chapter V looks at one aspect of this problem—the sizable interest rate risk for banks with large holdings of government securities. While the authorities’ are addressing this risk in a broadly appropriate manner, the response could be strengthened by a more rapid convergence to best international practices.

- 3 -
I. HAS INDIA ENTERED A NEW PHASE OF HIGHER TREND GROWTH?1
A. Introduction
1. Real GDP growth accelerated in 2003/04 to its highest level in over a decade leading many to speculate that India had scaled new heights in terms of its trend growth. At 8.2 percent, real GDP growth2 in 2003/04 was double that recorded in 2002/03 when India suffered from its most severe drought in over 15 years. The rebound in activity was led by agriculture where growth reached 9.1 percent, the highest level recorded since 1996. Non-agricultural growth was also robust with industry growing by 6.7 percent, and services growing by 8.7 percent.
2. The remainder of this chapter assesses empirically whether India entered has entered a new phase of higher trend growth. Two alternative methodologies are used to disentangle underlying structural growth trends from shorter-term cyclical fluctuations around this trend. The first recognizes the large role monsoons still play in the Indian economy (via their impact on agriculture and consumption) by correcting growth trends for deviations in rainfall from their normal level. The second utilizes the more traditional methods of estimating underlying trend growth using well known statistical filters. Both approaches indicate that, while trend growth accelerated in the 1980s and early 1990s, there is little evidence to suggest that underlying growth accelerated in recent years. The final section puts forward some explanations for this and concludes by reviewing more recent indicators that suggest grounds for optimism regarding India’s growth prospects.
B. When it Rains it Pours: Rainfall Adjusted Estimates of Underlying Growth
3. Agricultural growth remains vital to overall economic performance in India. Although the share of agriculture in the economy has fallen from over half of GDP in 1950 to less than one quarter today, the share of the population dependent on agricultural income has fallen by far less, from 77 percent in the early 1950s to about 62 percent today. As a result, fluctuations in rainfall are magnified through their impact on rural incomes and consumption, and the correlation between agricultural growth and overall GDP growth while decreasing, remains high (Table I.1). 1 Prepared by Catriona Purfield.
2 At factor costs. Expenditure-based GDP data are not yet available.
1950/51- 1970/71- 1990/91-2003/04 2003/04 2003/04
GDP growth (at market prices) 0.83 0.80 0.52Private consumption growth 0.51 0.38 0.54Private fixed investment growth 0.14 0.29 -0.08
GDP growth (at factor cost) 0.88 0.85 0.66Industrial sector growth 0.27 0.31 0.06Service sector growth 1/ 0.16 0.18 -0.14Government services growth -0.12 -0.20 -0.27
Source: Staff estimates.
1/ Excluding construction and government services.
Table I.1. Correlations with Agriculture Sector Growth

- 4 -
4. Agriculture in India remains largely rain fed. Only 40 percent of the net sown area in India is under irrigation (Planning Commission, 2000) which leaves the main agricultural season (June-September) highly dependent both on the timely arrival and widespread dispersion of the summer monsoons. Moreover, the lack of irrigation restricts the share of the country that can take advantage of the second agricultural season (October-December). The high correlation between agricultural growth and rainfall in India (about 0.65), illustrates dependence of growth on rainfall (Figure I.1). Salgado (2002) found rainfall to be a significant explanatory variable driving agricultural growth.
5. Growth in 2003/04 benefited from two weather-related factors. In the preceding year India experienced its most severe drought in 15 years which caused agricultural growth to contract by 5.2 percent, while overall growth fell to twelve year low of 4 percent. The recovery in agricultural production from the drought contributed to a large base effect in 2003/04. In addition, rainfall in 2003/04 was about 2 percent above normal. These two factors helped boost agricultural growth to an eight-year high.
6. Adjusting GDP for the impact of rainfall helps disentangle the role of cyclical and structural factors in the 2003/04 pickup in growth. The relationship between GDP growth and rainfall is modeled using annual data from 1970/71–2003/04. The general-to-specific methodology of Hendry and Doornik (HD) is used to determine the lag with which rainfall impacts growth.3 A rain-adjusted GDP growth series is then calculated by taking the coefficients from the model and substituting the normalized rainfall series for actual rainfall.4
3 The procedure begins with a general unrestricted model containing three lagged values of rainfall and GDP. It uses both a top-down and bottom-up approach to recursively eliminate insignificant variables. At each stage mis-specification tests are re-computed, and if any test fails that particular reduction it is disregarded as invalid until a parsimonious model is identified where all the remaining variables are significant. The dependent variable, GDP, is non-stationary and so is specified in growth rates. The final model specification, with all variables significant at the 1 percent level, is:
tt uLNRAINtLNGDP +++−= 17.0008.07.1 ,
(continued…)
Figure I.1. Agricultural Growth and Rainfall
-10
-5
0
5
10
15
20
1980 1982 1984 1986 1988 1990 1992 1994 1996 1998 2000 2002
-25
-20
-15
-10
-5
0
5
10
15Agricultural growthRainfall (Dev from Normal)

- 5 -
7. The uptick in 2003/04 growth was cyclical as underlying growth appears to have slowed after the fluctuation in rainfall levels is taken into account. Rain-adjusted GDP growth averaged 4.3 percent in 2003/04, well below the headline growth rate of 8.2 percent and its recent five-year average of 5 percent.5 However, the rainfall-adjusted series suggests that underlying growth in 2002/03 was in fact quite robust, despite the drought.
C. Estimates of Trend Growth
8. Various studies find that India transitioned to higher level of trend growth in the early 1980s but has since made little progress in improving its growth performance. Virmani (2004), and Rodrick and Subramanian (2004) find that trend GDP growth in India rose from a rate of 3½ percent (the so-called Hindu rate of growth) that prevailed during the 1960s and 1970s, to 5–6 percent in the 1980s. Surprisingly, these papers find no evidence of trend growth increasing in the 1990s when India liberalized its economy.
9. We also examine the acceleration in growth in 2003/04 using an alternative methodology. Trend GDP growth is estimated by smoothing the underlying rain-adjusted GDP series for the 1970–2003 period using the Hodrick-Prescott Filter.6 Correcting for deviations in rainfall from its period average by using the rain-adjusted series should also help control for years in which India was impacted by severe weather conditions, particularly at the end of the sample when India experienced various natural disasters including earthquakes and droughts.
where t is time, tLNRGDP is real GDP growth (all variables in logarithms), and tLNRAIN is rainfall. The R-squared is 0.46.
4 The normalized rainfall series is calculated by the Indian Metrological Department as a long-run moving average of actual rainfall.
5 It may also be optimal to include a measure of the dispersion of rainfall across Indian states in the model to capture the fact the distribution of rainfall can have differential impact on growth depending on the importance of agriculture and irrigation in each state. However, preliminary investigations found the measure of dispersion across India’s metrological districts (calculated using the standard deviation or the coefficient of variation) turned out to be insignificant and was rejected in the general-to-specific modeling process. Future work will examine the potential of this, and the possibility of an interaction rainfall-time variable that captures the structural decline of the importance of agriculture in the Indian economy in recent years.
6 A difficulty with this approach is that the trends tend to become poorly defined at the sample end-points. To cross-check the robustness of the results, trend real GDP growth, in levels and adjusted for rainfall, is also estimated by extending the sample period using staff forecasts of GDP for 2004/05–2009/10 period. The results are broadly similar.

- 6 -
-6
-4
-2
0
2
4
6
8
10
12
14
1971
/72
1973
/74
1975
/76
1977
/78
1979
/80
1981
/82
1983
/84
1985
/86
1987
/88
1989
/90
1991
/92
1993
/94
1995
/96
1997
/98
1999
/00
200
1/02
200
3/04
Real GDP growth (FC)Potential Rain Adjusted GDP growth (FC)Rain adjusted GDP growthPeriod average potential rain-adjusted growth
Figure I.2. Actual and Potential Real GDP Growth
10. Underlying trend growth does not appear to have accelerated in recent years. The plot of trend GDP growth confirms that growth in India has undergone several distinct phases, accelerating sharply in the early 1980s to between 5 percent and 6 percent (Figure I.2). While conclusions drawn for the period since the late 1990s are more circumspect owing to problems with end-points under the HP filter approach, the data suggest that trend growth has been on a decelerating path since the late 1990s.7 More formally, Chow tests applied to an ARIMA (2,1,2) model of trend rain-adjusted GDP growth identified two periods of increased trend growth. These tests confirm the acceleration in trend growth starting in 1980s.8 Trend growth rose to 5 percent, an increase of one percentage point over the 1971–79 period. In contrast to the earlier findings, the tests identify two additional breaks in the series, in 1989 and in 1992. While the statistical evidence of a break in 1989 is somewhat weaker,9 the evidence that trend growth accelerated in 1992 is quite robust to whether growth is measured using real GDP or rain-adjusted real GDP. While trend growth averaged 5.8 percent between 1992-2000, trend growth in more recent years has fallen to an average level of five percent.
7 The deceleration in trend growth from the late 1990s onwards was also found when the sample for the HP filter was extended outwards by including staff forecasts of GDP growth for the 2004/05–2009/10 period.
8 Applying Chow tests to a Hodrick-Prescott real (non-rain adjusted) GDP series yielded similar results, with the exception that it identified an additional structural break in 1995/96 when underlying trend growth accelerated to its highest level (just over 6 percent).
9 F-tests on the rain-adjusted HP filtered real growth series and on the HP filtered real GDP series are significant at the 5 and 10 percent confidence levels. The corresponding log-likelihoods tests are each significant at the 5 percent level of significance.

- 7 -
11. The leveling-off in trend growth most likely reflects a decline in investment. Since the mid-1990s, total investment in India has declined from 26 percent of GDP to under 22 percent of GDP, reflecting in part fiscal crowding out. The rate of public investment almost halved over the 1990s, as rising interest and recurrent outlays took an increasing share of government revenues. Private investment has also declined by about 1.6 percentage points of GDP from its mid-1990s peak. Earlier work found that about 70 percent of the decline in private investment reflected the shift in public spending away from investment and infrastructure spending (Salgado, 2002).
12. The decline in trend growth is primarily concentrated in the industrial and agricultural sectors, where investment was sharply curtailed. Until recently, growth in private fixed investment and capital per worker in the manufacturing sector was negative (Figure I.3). Agricultural trend growth fell from about 3¾ percent in the early 1980s to about 2½ percent in recent years reflecting falling public and private investment in the sector (Figure I.4). The potential of both these sectors is also hampered by restrictions on the size of investments in certain sectors (small-scale industrial reservations), labor regulations, and continuing constraints on internal and external trade, especially for agricultural produce.
Figure I.3. Capital Investment and Growth in the Industrial Sector
0
200,000
400,000
600,000
800,000
1,000,000
1,200,000
1,400,000
1,600,000
1993
/94
1994
/95
1995
/96
1996
/97
1997
/98
1998
/99
1999
/00
2000
/01
2001
/02
2002
/03
0
2
4
6
8
10
12
14
Perc
ent
Real gross fixed capital formation in industryReal industrial sector growth (right scale)
Rs.
mill
ions
(199
3/94
pric
es)
Figure I.4. Gross Fixed Capital Formation in Agriculture(In percent of GDP)
Total
Public
Private
0.00.20.40.60.81.01.21.41.61.82.0
1990
/91
1992
/93
1994
/95
1996
/97
1998
/99
2000
/01
2002
/03

- 8 -
Figure I.5. Realizing India's Growth PotentialGrowth in Output During Asia's Growth Take-Offs
0.0
0.5
1.0
1.5
2.0
2.5
3.0
tt+3 t+6 t+9
t+12 t+15 t+18 t+21 t+24 t+27 t+30 t+33 t+36 t+39 t+42 t+45
Years from Take-Off
Log,
Inde
x at
per
iod
0
Japan 1955-2002China 1979-2002NIE 1967-2002ASEAN-4 1973-2002India 1995-2003
D. Outlook
13. Nevertheless, recent indicators suggest there are reasons for optimism regarding India’s ability to move to higher trend growth in the near future.
• The corporate sector appears to be embarking on a new investment cycle. High frequency expenditure-based GDP data are not available. However, various business surveys show capacity utilization at record levels, while monthly data show both the import and domestic production of capital goods sustaining double digit annual growth rates for over one year. FDI flows have also perked up, rising by over 70 percent in the first quarter of 2003 after years of lackluster performance.
• India is rapidly integrating into global and regional production chains. Growth in Indian merchandise exports has exceeded 20 percent per annum in three of the last four years. Software service exports have expanded by almost 30 percent per annum over the past two years. Comparing India’s nascent integration with that of China, Japan, the NIEs and the ASEAN-4, when their output and growth first started exhibiting sustained growth highlights a number of similarities as well as challenges.10 India’s growth rate is just below that experienced by other Asian economies in the initial phases of take-off (Figure I.5). However, India’s share of world trade, at 0.8 percent, is still well below that of the other Asian economies at corresponding phases of their integration process when their share of world trade ranged from 1 percent (China) to an about 2 percent (Japan, NIEs, ASEAN-4).11
10 For China integration is defined as starting in 1979 when major economic reforms began. For India and all other regions, integration is defined as starting when the three-year moving average of constant price export growth first exceeded 10 percent: 1955 for Japan, 1967 for the NIEs, 1973 for the ASEAN-4 and 1995 for India. The NIEs consist of Hong Kong SAR, Korea, Singapore and Taiwan Province of China. ASEAN-4 consists of Indonesia, Malaysia, the Philippines, and Thailand.
11 IMF, 2004.

- 9 -
55
60
65
70
75
2000 2005 2010 2015 2020 2025 2030 2035 2040 2045 205055
60
65
70
75
India BrazilChina IndonesiaThailand
Figure I.6. Forecasts of Working Age Population(In percent of total)
Source: United Nations, Population Database .
• The labor force is forecast to expand rapidly. Estimates point to between 75-110 million entrants to the labor force over the next decade, and India is one of the few countries forecast to sustain a growing population over the next 40 years (Figure I.6). Because the working age population has a relatively high propensity to save, India should benefit from highly favorable saving trends that will help fuel rapid growth. This large pool of skilled and unskilled workers should also help underpin India’s competitiveness. However, it also implies that India will have to generate upwards of 145 million jobs to keep the unemployment rate from rising. The employment elasticity of growth is currently only about 0.2 percent and would need to be raised substantially if India is to realize its potential.
14. The challenge ahead will be to capitalize on this promising start and to create the conditions to make this take-off self-sustaining. Fiscal adjustment will help keep interest rates low and limit crowding out of private investment. Maximizing the return on new investments, expanding exports and generating job intensive growth will require advancing the structural reform agenda, including through trade tariff liberalization, improving business regulations, increasing labor market flexibility, unshackling manufacturing, and creating fiscal space for much needed infrastructure investment.
E. Conclusion
15. India’s economic performance in 2003/04 placed it amongst the fastest growing countries in the world. Growth accelerated to a decade high and was broad-based across all sectors. However, conventional measures of trend growth and estimates of rain- adjusted GDP suggest that the acceleration in growth was mainly cyclical, led by the rebound in agriculture from drought, and good rainfall, and there is little evidence to suggest that India has yet moved into a new phase of higher trend growth. Nevertheless, more recent indicators provide ground for optimism, and suggest that more rapid sustainable growth is within reach, especially with progress on advancing structural reforms.
16. There are reasons for optimism that India could be poised for sustained take off in growth. For the first time in many years, there are signs of a recovery in domestic and external investment in India, and exports of goods and services are growing rapidly as it becomes more integrated into the global economy. India is also set to benefit from a rapid expansion in its labor force. The challenge ahead will be to capitalize on these promising beginnings by accelerating the structural reform process.

- 10 -
References International Monetary Fund, 2004, World Economic Outlook, April 2004: Advancing
Structural Reforms, World Economic and Financial Surveys (Washington). Planning Commission, 2000, The Tenth-Five Year Plan (New Delhi: Planning Commission). Rodrick, Dani and Arvind Subramanian, 2004 “From Hindu Growth to Productivity Surge:
The Mystery of the Indian Growth Transition,” IMF Working Paper No. 04/77 (Washington: International Monetary Fund).
Salgado, Ranil, 2002, “Recent Trends in Growth and Investment,” India: Selected Issues
(Washington: International Monetary Fund). Virmani, Arvind, 2004, “India’s Economic Growth: From Socialist Rate of Growth to
Bharatiya Rate of Growth,” Working Paper No. 122 (New Delhi: India Council for Research on International Economic Relations).

- 11 -
II. UNDERSTANDING THE GROWTH MOMENTUM IN INDIA’S SERVICES1
A. Introduction
1. A striking feature of India’s growth performance over the past decade has been the strength of the services sector. The most visible and well-known dimension of the take off in services has been in software and IT-enabled services. However, growth in services in India has been much more broad-based than IT. The pickup in growth in the 1990s was the strongest in business services (which includes the IT sector), communication, and financial services, followed by community services (such as education and health services) and hotels and restaurants.
2. This chapter shows that important roles have been played by economic reforms, and growing external demand for services exports in explaining the growth momentum of the services sector. The chapter also discusses the growth potential in the IT sector, and the challenges India faces in realizing this potential.
B. Sectoral Growth Rates
3. The growth of services picked up sharply in the 1980s, and accelerated further in the 1990s when, at an average rate of 7.5 percent per annum, it grew faster than industry (Table II.1). Growth in the services sector has also been less cyclical than the growth of industry and agriculture, as it has the smallest coefficient of variation.
4. Rapid growth of the services sector is not unique to India. The literature shows that as an economy matures, its sectoral growth pattern typically evolves in two stages. In the first stage, both industry and services grow faster than agriculture, and consequently the share of industry and services in output increases. In the second stage, services grow faster than the rest of the economy, and its share in GDP continues to increase, accompanied by a stagnant or declining share of the industrial sector. Though the Indian experience fits in this pattern well, the sectoral transformation in the last decade was more rapid, and occurred at a lower level of income, than in other countries. Consequently, India’s services share of GDP is now higher than the average for other low-income countries. Among the reasons cited for relatively better performance of the services sector as compared to industry are that the labor
1 Prepared by Poonam Gupta.
1951-1980 1981-1990 1991-2000
Agriculture 2.1 4.4 3.1Industry 5.3 6.8 5.8Services 4.5 6.6 7.5GDP 3.5 5.8 5.8
Source: Staff calculations using the Central Statistical Organisation (CSO) data.
Table II.1. Sectoral Growth Rates
Average Growth(In percent per annum)
- 12 -
Employment
1965-66 18.1 46.11970-71 20.0 43.71980-81 18.9 44.01990-91 24.4 41.21999-2000 23.5 39.6
Source: Hansda (2002).
Table II.2. Share of Service Sector in Employment and Capital Formation
(In percent of total)
Gross Capital Formation
restrictions and small-scale reservations have disadvantaged industry more than services; and that the service sector has received more generous tax incentives.
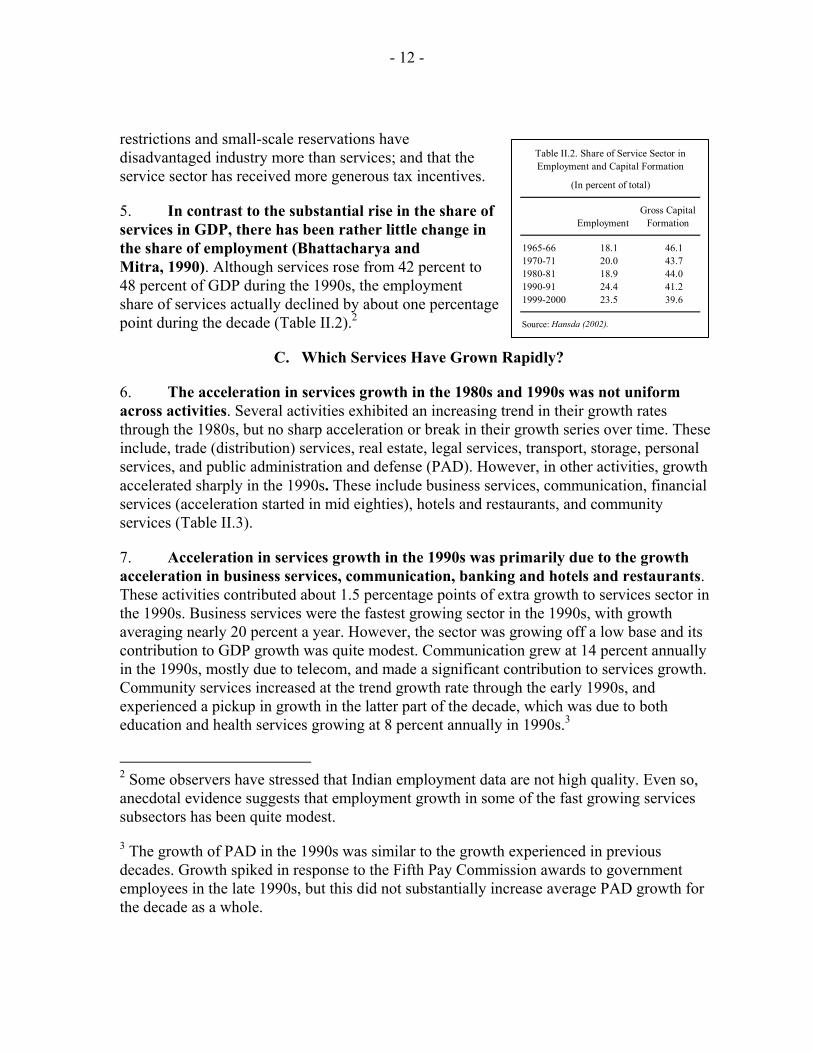
5. In contrast to the substantial rise in the share of services in GDP, there has been rather little change in the share of employment (Bhattacharya and Mitra, 1990). Although services rose from 42 percent to 48 percent of GDP during the 1990s, the employment share of services actually declined by about one percentage point during the decade (Table II.2).2
C. Which Services Have Grown Rapidly?
6. The acceleration in services growth in the 1980s and 1990s was not uniform across activities. Several activities exhibited an increasing trend in their growth rates through the 1980s, but no sharp acceleration or break in their growth series over time. These include, trade (distribution) services, real estate, legal services, transport, storage, personal services, and public administration and defense (PAD). However, in other activities, growth accelerated sharply in the 1990s. These include business services, communication, financial services (acceleration started in mid eighties), hotels and restaurants, and community services (Table II.3).
7. Acceleration in services growth in the 1990s was primarily due to the growth acceleration in business services, communication, banking and hotels and restaurants. These activities contributed about 1.5 percentage points of extra growth to services sector in the 1990s. Business services were the fastest growing sector in the 1990s, with growth averaging nearly 20 percent a year. However, the sector was growing off a low base and its contribution to GDP growth was quite modest. Communication grew at 14 percent annually in the 1990s, mostly due to telecom, and made a significant contribution to services growth. Community services increased at the trend growth rate through the early 1990s, and experienced a pickup in growth in the latter part of the decade, which was due to both education and health services growing at 8 percent annually in 1990s.3
2 Some observers have stressed that Indian employment data are not high quality. Even so, anecdotal evidence suggests that employment growth in some of the fast growing services subsectors has been quite modest.
3 The growth of PAD in the 1990s was similar to the growth experienced in previous decades. Growth spiked in response to the Fifth Pay Commission awards to government employees in the late 1990s, but this did not substantially increase average PAD growth for the decade as a whole.

- 13 -
Sector Activities Included
Trade (distribution services) 4.8 5.9 7.3(11.7) (11.9) (13.7)
Hotels and restaurants 4.8 6.5 9.3(0.7) (0.7) (1.0)
Railways 4.2 4.5 3.6(1.5) (1.4) (1.1)
Transport by other means 6.3 6.3 6.9(3.6) (3.8) (4.3)
Communication 6.7 6.1 13.6(1.0) (1.0) (2.0)
Banking 7.2 11.9 12.7(1.9) (3.4) (6.3)
Insurance Life, postal life, nonlife. 7.1 10.9 6.7(0.5) (0.8) (0.7)
Business services 4.2 13.5 19.8(0.2) (0.3) (1.1)
Public administration, defence 6.1 7.0 6.0(5.3) (6.0) (6.1)
Personal services 1.7 2.4 5.0(1.6) (1.1) (1.1)
Community services 4.8 6.5 8.4(4.0) (4.3) (5.5)
Other services 3.4 5.3 7.1(1.1) (1.0) (0.7)
Source: Staff calculation from CSO data.
Average Growth in 1980s
(Share in GDP in 1990)
Domestic, laundry, barber, beauty shops, tailoring, and others.
Education, research, scientific, medical, health, religious and other community.
Banks, banking department of RBI, post office saving bank, nonbank financial institution, cooperative credit societies, and employees provident fund.
(Share in GDP in 1980)
Recreation, entertainment, radio, TV broadcast, and sanitary services.
Services rendered by hotels and other lodging places, restaurants, cafes, and other eating and drinking places.
Road, water, air transport, services incidental to transport.
Postal, money orders, telegrams, telephones, overseas communication services, and miscellaneous.
Table II.3. Growth Rates and Sectoral Shares
Wholesale and retail trade in commodities both produced at home (including exports) and imported, purchase and selling agents, brokers and auctioneers.
Average Growth in 1950s-1970s
Averge Growth in 1990s
(Share in GDP in 2000)
D. Explaining Services Sector Growth
8. The growth of services sector in recent years reflects a number of factors. Those include a switch to a more service-input intensive method of organizing production, i.e., splintering (see Bhagwati, 1984); rapid growth in the final demand for services from domestic and foreign consumers; and technological advances, whereby new activities or products emerge. Important policy reforms were also made in the 1990s, such as

- 14 -
deregulation, privatization and opening up to FDI, which were also conducive to the growth of services sector.
9. Using the input-output coefficients and sectoral shares in output, it is possible to illustrate that splintering has had only a modest impact on services growth in India. The matrices for different years show that the use of service sector inputs in industry increased by about 40 percent between 1979–80 and 1993–94 (the latest available). The use of services inputs into agriculture almost doubled during this period, but still remained low (at 5 percent of the gross output). The input-output coefficients for services input in agriculture and industry increased by 0.03 and 0.04, respectively, during the 1980s. These coefficient changes would have increased demand for services (as a first round effect) by:
∆YS = 0.03YA + 0.04YI (1)
Dividing through by total output Y and evaluating at the average sectoral shares during the 1980s (0.35, 0.25 and 0.40 for agriculture, industry and services, respectively), yields:
∆YS/YS = ((0.03*0.35) + (0.04*0.25)) /0.4 = 0.051 (2)
i.e., 5.1 percent over the decade. This would suggest that splintering may have added about ½ percentage point to annual services growth during the 1980s. A similar calculation for the period 1989/90–1993/94 yields a splintering effect on growth of about ¼ percentage point per annum. 10. A rise in domestic demand for services may have played some role in the structural shift of the economy, but likely not a dominant one. While the available data do not permit a precise split of private final consumption expenditure into a goods and a services component, it seems likely there was rise in the growth of final demand for services in the 1990s. However, for increases in final demand to explain the rapid growth in the 1990s would imply a huge increase in the elasticity of final demand for these activities, and there is no a priori reason to expect this kind of behavioral change. In addition, as shown in Gordon and Gupta (2004), the relative price of services declined, implying that the growth in services output was not merely a demand side phenomenon.
11. Technological advances appear to have played an important role. Due to the revolution in IT and telecommunication sectors it has become possible to deliver services over long distances at a reasonable cost, increasing trade in services. India has been a particular beneficiary of this trend. In India, the exports in services (in U.S. dollars) grew on average at 15 percent a year in the 1990s (21 percent a year in the second half of the 1990s), compared with 9 percent in the 1980s. Cumulatively, services exports increased four-fold in the 1990s and reached US$25 billion in 2002—35 percent of total exports—about one third of which was software exports. The increase in exports has been most dramatic in software

- 15 -
and other business services and services exports have continued to grow rapidly into the 2000s (Figure II.1).
12. Finally, policy changes appear to have been a significant factor behind the growth in services sector activity in India. We empirically test for the significance of different factors in explaining services growth by utilizing a panel of various service activities. The time period used is 1970–2000, and the observations are averaged over 1970s, 1981–1985, 1986–1990, 1991–1995, and 1996–2000. Thus there are five observations for each service activity. The following regression equation is estimated:
(3) ε RSer GTS GAgr GInd C GSER itititiit ++++++= δγηβα ititit GTG
The dependent variable is average growth in activity i in period t. The right hand side variables are average growth in industry (GInd), average growth in agriculture (GAgr), average growth in external volume of trade in goods (GTG), average growth in the export of services (GTS), in period t. A dummy variable accounts for the fact whether reforms were carried out in each segment of services (RSer).4 13. The reform dummy has a positive, and the most significant, coefficient in the regressions (Table II.4). Services growth is also significantly correlated with the growth in the industrial sector. As a robustness test, we check whether a dummy for the 1990s yields a 4 The dummy variable for reform measures is based on information provided in other studies and is assigned a value 1 if the activity was opened up for FDI, external trade, or private ownership. The following observations were assigned a value of 1: hotels 1991–1995, 1996-2000, transport other means 1996–2000, Communication 1991–1995, 1996–2000, banking 1986–1990, 1991–1995, 1996–2000, insurance 1996–2000, business services 1991-1995, 1996–2000, community services 1996–2000. The dummy was created using information in Mattoo et al and information provided by Arpita Mukherjee of ICRIER.
Figure II.1. India: Services Exports
0
0.5
1
1.5
1980 1983 1986 1989 1992 1995 1998 2001
Services Exports as a Percentage of Global Services Exports
0
1
2
3
4
5
1980 1983 1986 1989 1992 1995 1998 2001
Services Exports as a Percentage of GDPServices Exports as a Percentage of GDP

- 16 -
significant coefficient after controlling for the reform-specific dummy. The coefficient for dummy for the 1990s is not significant, suggesting that it is liberalization per se that is contributing to growth.
I II
.99 .071.1 .20
1.33 ** .82 *2.12 1.88
.451.1
.15 * .131.7 1.5
5.7 *** 5.7 ***3.6 3.6
Dummy for the 1990s -1.1-1.0
R2, adj. R2 .65, .53 .65, .53
F test for equality of intercept across units 2.8 (F-Stat) 2.8 (F-Stat).00 (p value) .00 (p value)
Table II.4. Explaining Services Growth Using Panel Data, 1970–2000 1/
1/ Number of observations is 65 in each regression. ***, **, * indicate significance at 1 percent, 5 percent, and 10 percent levels respectively. T values are given below the coefficients in each cell.
Average growth of exports of services in period t
Average growth rate of industrial sector in period t
Average growth rate of agriculture in period t
Average growth of external trade (exports + imports) of merchandise in period t
Reform dummy variable
E. Growth Experience and Key Challenges in the IT Sector
14. The IT sector grew rapidly, at an annual rate of about 28 percent between 1998 and 2003, and its turnover was estimated to be about US$17 billion in 2003.5 The exports market grew much more rapidly than the domestic market, with average respective growth rates of 42 percent and 16 percent, respectively, during 1998–2003. Growth was most rapid in the exports of ITES, which grew at an average annual rate of 62 percent in 2001–2003. Consequently, the share of ITS and ITES exports in the IT sector increased from 35 percent in 1998 to more than 60 percent in 2003; and the share of domestic market for ITS and ITES
5 The IT sector broadly encompasses software and services (ITS—systems integration, packaged software support and installation, application outsourcing, custom application development etc), IT enabled services (ITES—human resources, customer care, payment services, finance, etc.), and hardware.

- 17 -
came down to 20 percent in 2003. The hardware segment grew at a slower pace, and its share in IT halved to 20 percent over the same period.
15. The composition and mode of delivery of IT exports has changed overtime. In 1997–98, nearly 96 percent of all software exports from India were in the form of ITS; and the rest were BPO services (Figure II.2). In 2001–02, BPO activities increased to about 24 percent of total IT exports. There has been a commensurate shift in the mode of delivery of IT exports. In 1993–94, nearly 62 percent of all IT exports from India were carried out at the clients’ location, i.e., “onsite.” By 2002–03, offshoring became the dominant mode of delivery of software exports, accounting for almost 58 percent of total exports.
16. The National Association of Software and Service Companies (NASSCOM) has set ambitious targets for the industry. Turnover is projected to reach about US$75 billion, and export earnings to reach about US$60 billion by 2008 (Figure II.3). These targets imply that the ITS and ITES exports would have to grow at an annual rate of about 45 percent and the domestic market would have to grow at 17 percent during 2005–2008. Based on the past growth rates, these targets, though ambitious, do not look unattainable. In line with these medium term targets, for FY 2005, overall exports are expected to grow by about 30 percent, reflecting growth of about 26 percent in exports of IT services and 40 percent in ITES BPO. The domestic market is expected to grow by 24 percent. Despite the rapid growth in IT exports in recent years, India accounts for a miniscule percentage of the total ITES-BPO spending worldwide—NASSCOM reports that India’s contribution to Global IT is
Figure II.2. Composition of the IT Sector in India
(In millions of U.S. dollars, and in percentage)
2096, 42%
1759, 35%
1152, 23%
ITS and ITES exportsIT domesticHardware (domestic)
1998 ITS and ITES exportsIT domesticHardware (domestic)
2004
12,200, 63%
3780, 20%
3370, 17%
IT Services Exports
ITES Exports
Product and Technology Services
Domestic Market
Export Market57-65
Total Sector 70-80
28-30
21-24
8-11
13-15
Figure II.3. Projected Size of the Indian IT Sector in 2008 1/(In billions of U.S. dollars)
1/ Nasscom estimates.

- 18 -
less than 2 percent. Based on estimated growth in the total size of the market, various estimates signal bright prospects for Indian ITES sector.6
17. The rise in ITES services in total exports and the increasing share of these services provided offshore has led to some increased employment opportunities in India, but its contribution to total employment remains modest. NASSCOM estimates that the ITES segment provided additional employment to 74,400 people in 2003–04, taking the total number of employed people in the ITES/BPO segment to 245,500 by March 2004. NASSCOM, McKinsey (2002) have estimated that by 2008, this segment would employ about 1 million people, and that significant employment opportunities would also be provided in the other segments of the IT sector, taking the total number of people employed in the sector to about 2 million by 2008. However, given India’s need to generate employment for some 100 million new job entrants in the coming decade, its contribution to total employment is likely to remain small.
18. Several reasons have been put forward for the phenomenal success of the sector. These include the availability of highly qualified professionals and people proficient in English; low labor costs; and conducive policies of the government, especially with respect to FDI, taxation, and external trade.
19. However there are a number of external and domestic constraints that India may face in realizing the growth potential of the IT sector. The external factors include nontariff barriers such as visa restrictions, and the negative publicity in importing countries affected by outsourcing, including in the Unites States. These measures may make it more difficult to lend onsite support to the clients and affect adversely total IT exports from India. The IT sector may also be challenged in the future by shortages of skilled labor as the sector advances; a loss of cost advantage either because of the increase in the demand for skilled IT personnel or an appreciation of the Indian rupee; infrastructure constraints; and internal issues within the industry such as rapid turnover of employees.
6 For example, a study by Deloitte Research has shown that the global market in offshore financial services could grow to US$356 billion by 2008/09, of which a large share would go to India.

- 19 -
References Bhagwati, Jagdish, 1984, “Splintering and Disembodiment of Services and Developing
Nations,” World Economy, 7:2, pp. 133–43. Bhattacharya, B.B. and Arup Mitra, 1990, “Excess Growth of Tertiary Sector in Indian
Economy, Issues and Implications,” Economic and Political Weekly, November 3, pp. 2445–2450.
Gordon, James, and Poonam Gupta, 2004, “Understanding India’s Services Revolution,”
IMF Working Paper 04/171 (Washington: International Monetary Fund). Hansda, Sanjay Kumar, 2002, “Services Sector in the Indian Economy: A Status Report,”
RBI Staff Studies (Mumbai: Reserve Bank of India, Department of Economic Analysis and Policy).
Mattoo, Aaditya, Deepak Mishra, and Anirudh Shinghal, 2003, Trade in Services: Access to Foreign Markets, Domestic Reform and International Negotiations (Washington: World Bank).
NASSCOM-McKinsey, 2002, Report on Strategies to Achieve the Indian IT Industry’s
Aspiration (New Delhi: National Association of Software and Service Companies).

- 20 -
III. FOREIGN DIRECT INVESTMENT IN INDIA: HOW CAN IT BE INCREASED?1
A. Introduction
1. Foreign Direct Investment (FDI) is favored over other capital flows by emerging markets. FDI is not debt creating, is less volatile than portfolio flows, and relatively resistant during financial crises (Albuquerque, 2003). FDI has also been associated with positive spillovers through technology transfer and training to local industry (Blomstrom and Kokko, 2003), and may lead to enhanced export performance and growth (Borzenstein, DeGregario, and Lee, 1998).
2. FDI flows into India have risen since the 1990s but remain low, compared to other emerging markets (Table III.1, Figure III.1).2 In 2002 India received FDI inflows of less than 1 percent of GDP whereas China received FDI worth 3.7 percent of GDP. In dollar terms, China received 15 times the FDI than India in 2002.
3. At the same time, investor surveys point to a strong interest in India as a destination for FDI. Surveys by UNCTAD and AT Kearney in 2004 place India as the second and third most attractive destinations for FDI respectively. This indicates that while India is on investors’ radar screens, the interest has not yet translated into actual FDI.
4. The bullishness regarding India implies that further reform could have a significant impact. Recently a number of steps have been taken to simplify and liberalize 1 Prepared by Sonali Jain-Chandra.
2 The Indian authorities revised the FDI data to conform to international standards by including reinvested earnings. The data used here is the revised FDI data net of outflows.
CountryIn percent of GDP In billions of U.S. dollars
Vietnam 4.0 1.4China 3.7 46.8Brazil 3.1 14.1Chile 2.4 1.6Singapore 2.3 2.0Mexico 2.1 13.5Sri Lanka 1.4 0.2Argentina 1.4 1.4Malaysia 1.4 1.3Pakistan 1.3 0.8Philippines 1.3 1.0Thailand 0.7 0.8India 0.6 3.2Bangladesh 0.1 0.0Indonesia 0.1 0.1Nepal 0.0 0.0Korea -0.1 -0.7Venezuela -0.3 -0.2
Source: World Development Indicators.
Net Foreign Direct Investment
Table III.1. Foreign Direct Investment in Selected Countries, 2002
Figure III.1. Foreign Direct Investment as a Percent of GDP for Selected Asian Economies (1980–2002)
0
1
2
3
4
5
6
7
8
9
1980 1982 1984 1986 1988 1990 1992 1994 1996 1998 2000 2002
China India Korea Malaysia Thailand
- 21 -
the FDI regime in India. In 2004, the FDI caps on civil aviation and petroleum subsectors, among others, were raised. The transfer of equity shares between residents and non-residents does not now require approval.
5. This chapter studies the reasons for the underperformance of FDI in India and examines potential measures to enhance it. Utilizing panel data for a number of emerging market countries, the chapter concludes that the most important factors affecting FDI are not FDI-specific policies but, rather, broader economic policies including corporate taxes, trade openness, and other business climate issues, such as regulatory quality and burden. This chapter also looks at differences across Indian states in attracting FDI and concludes that broad business climate issues largely determine FDI.
B. Foreign Direct Investment Regime in India
6. India’s regulatory regime for FDI has been gradually liberalized since 1991, and, as a result, the regime is no longer particularly restrictive by international standards.3 The pre-1991 policy considered all FDI proposals on a case-by-case basis with FDI capped at 40 percent of total equity investment. In 1991, the policy was amended to allow automatic approval of up to 51 percent ownership in 34 sectors. This list was expanded to cover 111 sectors in 1997. In 2000, the policy was altered to one using a “negative list” approach. Since then, 100 percent FDI is permitted in most sectors via the automatic route, with the requirement that the RBI be notified within 30 days. There are important exceptions to this general policy for which FDI approvals are routed through the Foreign Investment Promotion Board (FIPB). These exceptions include: industries subject to licensing, the acquisition of an existing Indian company under certain conditions,4 industries where the foreign investor has a presence in the same field, and industries where sectoral policies apply (Table III.2).5
3 India ranks 41st of 102 countries in terms of the restrictiveness of foreign ownership (Global Competitiveness Report 2003–04). Most other emerging markets fare worse: China (81), Indonesia (95), Korea (68), Malaysia (67), Philippines (83), Thailand (75), Vietnam (84), Brazil (42), while Mexico fares better with a rank of 26.
4 For the acquisition of existing Indian companies (with an equity expansion), approval is required if the following conditions are not met: (i) the equity level of the company should increase without the acquisition of shares by foreign investors, (ii) funds should be in foreign exchange, and (iii) the sector should be under the automatic route.
5 FDI is not permitted in retail trading, lottery business, gambling and betting, housing and real estate business, and agriculture and plantation.

- 22 -
Table III.2. Sectoral Caps and Controls on Foreign Direct Investment in India
Sector Cap Specifics
Private sector banking 49
Nonbanking financial companies 100 Various minimum capitalization norms for fund-based NBFCs.
Insurance 26 Automatic route available, subject to obtaining license from the regulatory body.2004/05 budget proposed raising it to 49 percent; however, this is not yet operational.
Domestic airlines 49
Telecom 49
2004/05 budget proposed raising it to 74 percent; however, this is not yet operational.
100 For email, voice mail, ISPs not providing gateways.
74 For ISPs with gateways, radio-paging and end-to-end bandwidth. FDI beyond 49 percent needs approval from FIPB
Petroleum (refining) 26 Cap applies to public sector units. Automatic route not available. 100 Cap applies to private Indian companies. Automatic route available.
Petroleum (other than refining) 100
Housing and real estate 100
Coal and lignite 100 For most activities in this sector.74 For coal exploration or mining.
Venture capital Sectoral Automatic route available. Subject to SEBI regulations.caps apply
Trading 51 Automatic route available. Meant for export activities.
Atomic minerals 74 For sub sectors, mining, seperation, value addition and integrated activities.
Defense and strategic 26 Automatic route not available. Subject to licensing and security requirements.industries
Agriculture 0 No FDI is permitted, with some exceptions.100
Print media 100
26
Broadcasting 100 In TV software production.49 In cable networks, direct to home.
Drugs and pharmaceuticals 100 Automatic route available in the manufacture of drugs and pharmaceuticals.
Roads, highways, ports, harbor, and metro 100 Automatic route available.
Mining 74 Automatic route available in the exploration and mining of diamonds and precious stones.100 Automatic route available in the exploration and mining of gold, silver and other metals.
Postal services 100
Establishment and operation 74 Automatic route not available. of satellites
Automatic route not available. Subject to no direct or indirect equity participation by foreign airlines.
For basic, cellular, value added services, subject to licensing requirements, and a lock in period for transfer of equity.
Restrictions include licensing, FDI beyond 49 percent needs approval from FIPB, and divestiture of 26 percent in 5 years.
Automatic route available. A ceiling of 10 percent on voting by a single or group of related foreign entities in private sector banks.
FDI of 100 percent in courier services, with prior approval. No FDI allowed in the distribution of letters.
In newspapers and periodicals dealing with current events, subject to editorial control by Indian residents.
Automatic route available. FDI of 100 percent is possible in oil exploration in small- and medium-size fields, petroleum product marketing, natural gas/ LPG (approval required).
Applies to the development of integrated townships, with prior government approval. No FDI allowed in other real estate sub sectors.
Tea, including tea plantations. Restrictions apply, including approval from government, divestiture of 26 percent in five years, and approval in case of change in land use.
Automatic route not available. FDI allowed in publishing/printing scientific and technical magazines, periodicals and journals

- 23 -
C. FDI Inflows into Selected Countries: Is India an Outlier?
7. As India’s FDI regime is relatively unrestrictive, the key question is what other factors could explain the underperformance of FDI. Some papers emphasize macroeconomic stability and openness, while others the quality of institutions.6 The standard determinants of FDI include labor market conditions, the quality of infrastructure, corporate taxation, inflation, trade openness, market size, corruption and administrative procedures and bottlenecks. Existing qualitative work on India emphasizes factors limiting FDI such as, relatively high tariffs, and limited scale of Export Processing Zones, stringent labor laws, high corporate tax rates, exit barriers, a restrictive FDI regime, and the lack of transparent sectoral policies for FDI.7 The Global Competitiveness Report 2004, based on investor surveys, lists key constraints to doing business in India (Figure III.2).
8. The investment climate in other emerging markets in Asia appears to be more conducive to attracting FDI inflows (Table III.3). Compared to selected Asian countries, India’s overall infrastructure quality ranks low (Global Competitiveness Report 2004). The significant burden of bureaucratic red tape and regulation in India further worsens the investment climate. For instance, it takes 89 days to start a business in India, whereas for the sample average is 43 days. The enforcement of contracts takes longer in India (425 days) than average (286 days). Also, once in business, firms find it difficult to exit.8
9. We estimate the following reduced form equation using a fixed effects model:
titiititi XGDPFDI ,,,, / εβα ++=
where, αi is the country specific effect, the matrix Xi,t contains the lagged independent variables (to alleviate the simultaneity bias), including standard determinants of FDI and 6 For details, please see Mercereau (2004), Dollar et al (2004), Hines (1996), Javorcik and Spatareanu (2004), Wei (2000), Wheeler and Mody (1992).
7 See Bajpai and Sachs, 2000. Progress in the liberalization of the FDI regime has taken place since this paper was written.
8 Gorg (2002) examines U.S. investment in 33 countries to conclude that exit costs are more important than incentives to attract FDI.
Figure III.2. India: The Most Problematic Factors for Doing Business
0 5 10 15 20 25
Inadequately educated Workforce
Access to Financing
Poor Work Ethic
Policy Instability
Tax Regulations
Tax Rates
Restrictive Labor Regulations
Corruption
Inefficient Bureaucracy
Inadequate Infrastructure
Percent of ResponsesSource: World Economic Forum, Global Competitiveness Report 2004.

- 24 -
institutional quality variables.9 All indicators used in Table III.3 are not included in the panel due to insufficient data. The variables used here include the marginal statutory corporate tax rate, proxy for infrastructure development (the number of telephone lines per 1000 inhabitants), inflation, and openness (trade as a percent of GDP). Institutional quality is measured by the World Bank governance indicators (voice and accountability, political instability, government effectiveness, regulatory burden, rule of law, corruption). These variables are highly correlated and are therefore included in the regressions one at a time to avoid multicollinearity. To check for robustness, we also include alternative measures of institutional quality.
10. We find that marginal corporate tax rates, trade openness and institutional factors, and to some extent, the quality of infrastructure are significant determinants of FDI (Table III.4).10 While the results are sensitive to the specification, they are nevertheless indicative of the potential for a large response of FDI to reforms:
• A decrease in India’s marginal corporate tax rate to that of China would increase FDI by one percentage point of GDP.
• An increase in trade openness in India to China’s level would garner another 0.6 percentage points of GDP.
• Improving regulatory quality in India to the level of Thailand would add another percentage point of GDP.
• If India halves the number of days to needed to start a business or halves the years to resolve insolvency, FDI could rise by 0.7 percentage points and 1.4 percentage points of GDP respectively.
9 Data sources include World Development Indicators, the IMF’s International Financial Statistics, RBI Annual Reports, OECD FDI database, World Investment Report, World Bank Governance Database (Kaufmann, 2004), and PRS Groups’ International Country Risk Guide. The countries in the sample are the ones listed in Table III.1. The estimation is done using an unbalanced panel from 1980–2002.
10 Regressions using the between panel estimator conclude that the quality of infrastructure is a determinant of FDI.

- 25 -
Table III.3. Snapshot of the Investment Climate in Selected Asian Countries
China India Korea Malaysia Thailand Average
Macroeconomic environmentGDP per capita (constant 1995 US$, 2003) 1,023.6 525.2 15,290.8 4,964.8 3,182.0 4,997.3GDP growth (2003) 9.1 8.0 3.1 5.2 6.7 6.4Gross capital formation (current US$, 2003) 594.4 143.1 177.9 22.5 33.1 194.2Inflation 1.2 3.8 3.6 1.1 1.8 2.3Openness (trade in goods as a percent of GDP, 2002) 49.0 20.8 66.0 182.4 105.6 84.8
Governance indicators (2002) 1/Voice and accountability -1.4 0.4 0.6 -0.3 0.2 -0.1Political stability 0.2 -0.8 0.5 0.5 0.5 0.2Government effectiveness 0.2 -0.1 0.8 0.9 0.3 0.4Regulatory quality -0.4 -0.3 0.9 0.6 0.3 0.2Rule of law -0.2 0.1 0.9 0.6 0.3 0.3Control of corruption -0.4 -0.3 0.3 0.4 -0.2 0.0
InfrastructureOverall Infrastructure Quality (rank out of 102 countries) 55.0 70.0 21.0 12.0 29.0 37.4Electric power consumption (kwh per capita, 2001) 893.4 364.7 5,288.4 2,731.0 1,508.4 2,157.2Internet users (per 1,000 people, 2003) 46.0 15.9 551.9 319.7 77.6 202.2Roads, paved (percent of total roads, 1999) 91.0 45.7 74.5 75.8 97.5 76.9Telephone mainlines (per 1,000 people, 2002) 166.9 39.8 488.6 190.4 105.0 198.1
Bureaucratic red tape and corporate taxationNumber of start-up procedures to register a business (2004) 12.0 11.0 12.0 9.0 8.0 10.4Time to start a business (days, 2004) 41.0 89.0 22.0 30.0 33.0 43.0Time to enforce a contract (days) 241.0 425.0 75.0 300.0 390.0 286.2Time to exit a business (years, 2004) 2.4 10.0 1.5 2.3 2.6 3.8Protection against dismissal 2/ 0.4 0.9 0.3 -- 0.3 0.5Difficulty in firing index (2004) 40.0 90.0 30.0 10.0 20.0 38.0Efficiency of legal framework (rank out of 102) 3/ 4/ 50.0 35.0 41.0 19.0 32.0 35.4Burden of regulation (rank out of 102) 3/ 21.0 67.0 23.0 16.0 25.0 30.4Transparency of government policymaking (rank out of 102) 3/ 5/ 33.0 41.0 25.0 14.0 31.0 28.8Efficiency of the tax system (rank out of 102) 3/ 29.0 59.0 37.0 5.0 27.0 31.4Highest marginal tax rate, corporate rate (percent, 2003) 30.0 36.8 27.0 28.0 30.0 30.4
1/ Higher values correspond to better outcomes.
3/ A higher rank implies a better outcome.
5/ Defined as to what extent firms are usually informed clearly and transparently by the govvernment on changes in policies and regulations.4/ Defined as the legal framework for private businesses to settle disputes and challenge the legality of government actions and/or regulations.
Sources: World Development Indicators, World Bank Governance Database, Global Competitiveness Report 2004. World Bank Doing Business Database 2004.
2/ Methodology: Protection against dismissal is measured by the taking into account whether an employer has to notify a third party before firing one worker, whether the employer needs the approval of the third party, if the employer must provide retraining before dismissal among other factors.

- 26 -
Openness 0.022 0.025(2.94)* (3.60)**
Corporate tax -0.176 -0.157 -0.172 -0.062 -0.067 -0.101 -0.082 -0.033 -0.176 -0.195 -0.179 -0.158 -0.191 -0.181 -0.191(2.27)* (2.22)* (2.07)* -0.88 -0.9 -1.25 -1.01 -0.43 (1.87)+ (2.08)* (1.95)+ (1.74)+ (2.24)* (2.26)* (2.24)*
Inflation -0.033 -0.036 -0.016 0.031 0.027 0.003 0.03 0.013 -0.02 -0.025 -0.03 -0.024 -0.013 0.018 -0.013-0.88 -1 -0.49 -1.04 -0.88 -0.09 -0.98 -0.42 -0.55 -0.67 -0.8 -0.64 -0.34 -0.47 -0.34
Telecommunication 18.4 10.81 6.379 6.067 6.337 9.307 9.461 3.293 6.25 6.056 7.827 2.506 2.115 2.506(1.91)+ -1.18 -0.79 -0.72 -0.7 -1.1 -1.13 -0.3 -0.57 -0.55 -0.74 -0.23 -0.21 -0.23
Voice and accountability -1.096-1.41
Government stability 0.521 0.521(2.58)** (2.58)**
Law and order 1.278(3.55)**
Corruption (PRS) 0.786(1.90)+
Days to startup -0.015(1.73)+
Years to resolve insolvency -0.25(1.83)+
Days to enforce a contract -0.006(2.12)*
Corruption 2.016(3.41)**
Rule of law 1.993(2.99)**
Regulatory quality 1.45(2.21)*
Government effectiveness 2.188(3.42)**
Political stability 2.145(3.98)**
Constant 7.075 5.494 7.662 4.413 4.008 5.24 4.601 3.519 8.93 9.292 8.896 5.754 4.079 3.787 4.079(2.90)* (2.33)* (2.95)* (2.02)* (1.68)+ (2.04)* (1.81)+ -1.46 (3.03)* (3.15)* (3.10)* (1.85)+ -1.3 -1.35 -1.3
1/ Absolute value of z statistics in parentheses; + significant at 10 percent; * significant at 5 percent; ** significant at 1percent.
Table III.4. Results of the Panel Estimation of the Determinants of Foreign Direct Investment 1/

- 27 -
11. Labor market flexibility also appears to be an important factor determining FDI, and India has a relatively inflexible labor market.11 Protection against dismissal is stringent in India (Table III.3) as in downturns it is exceedingly difficult to fire workers (Figure III.3). Correlation between the labor market flexibility and FDI across countries suggests that countries with inflexible labor markets receive less FDI (Figure III.4).12
D. Indian States: Differences in Investment Climate and FDI
12. FDI has been concentrated in a few Indian states. During 2000–03, five (of twenty-nine) rapidly growing states received 60–70 percent of FDI inflows into India: Andhra Pradesh, Delhi, Karnataka, Maharasthra, and Tamil Nadu (Figure III.5). Even among these states, there is considerable heterogeneity. Maharasthra received more than ten times the amount of FDI per capita than Andhra Pradesh in 2000 (Table III.5). It is also these very states that are most successful in converting FDI approvals into actual inflows.13
11 However, for emerging markets data on labor costs are generally not available over time for a number of countries and therefore not included in the above regression.
12 Javorick and Spatareanu (2004) also find that, for a sample of 25 European countries, increased labor market flexibility is associated with larger FDI inflows.
13 This analysis includes data for only 2 years, and it is possible that it takes longer for approved FDI to translate into realized inflows.
0 10 20 30 40 50 60 70 80 90
Singapore
Malaysia
Bangladesh
Thailand
Korea, Rep.
Pakistan
China
Philippines
Indonesia
Vietnam
Sri Lanka
India
Figure III.3. Labor Market Flexibility: Difficulty in Firing Index
More difficult to fire a worker
Source: World Bank, Doing Business Database.
Figure III.4. FDI and Labor Market Flexibility
-2
-1
0
1
2
3
4
5
6
7
8
0 10 20 30 40 50 60 70 80 90 100
Employment Ridigity IndexFD
I/GD
P
Singapore
India
China Increasing inflexibility
Figure III.5. India: FDI Flows by State, 2000–2003
0 5 10 15 20 25 30 35 40 45 50
2000
2001
2002
2003
Percent of Total FDI Flows
DelhiTamil NaduMaharashtraKarnatakaAndhra Pradesh
Source: Ministry of Finance.

- 28 -
Table III.5. Approvals and Inflows of Foreign Direct Investment into Indian States
FDI Inflows (2000-02) FDI Approvals (2000-02) Realization FDI/ State Domestic Product FDI/Population(In billions of rupees) (In billions of rupees) Ratio 2000 2001 2000
Andhra Pradesh 8.8 17.0 51.9 0.2 0.3 3.3Assam 0.1 0.0 -- 0.0 0.0 0.0Bihar 0.0 0.3 5.0 0.0 0.0 0.0Gujarat 4.3 24.2 17.7 0.0 0.1 0.6Haryana 0.0 6.7 0.0 0.0 0.0 0.0Himachal Pradesh 0.0 8.1 0.0 0.0 0.0 0.0Karnataka 27.9 42.8 65.1 0.6 1.3 11.0Kerala 1.8 7.2 24.7 0.1 0.1 1.7Madhya Pradesh 0.2 4.0 5.6 0.0 0.0 0.1Maharashtra 114.4 103.0 111.0 1.7 1.2 37.0Meghalaya 0.0 0.0 -- 0.0 0.0 0.0Orissa 0.0 2.4 0.0 0.0 0.0 0.0Punjab 0.0 0.4 0.0 0.0 0.0 0.0Rajasthan 0.1 5.6 1.5 0.0 0.0 0.0Tamil Nadu 26.4 61.9 42.6 0.4 0.6 8.9Uttar Pradesh 0.0 11.2 0.0 -0.1 0.0 -1.2West Bengal 2.3 12.5 18.6 0.2 0.0 2.9Chattisgarh 0.0 0.2 0.0 0.0 0.0 0.0Chandigarh 10.1 0.5 2,003.6 4.0 0.1 181.2Dadra & Nagar Haveli 0.0 0.0 500.0 -- -- 0.9Delhi 123.7 63.5 194.7 4.7 -- 178.3Goa 1.9 4.7 41.0 -- -- 22.8Pondicherry 3.0 8.5 35.3 0.0 8.8 0.0
Sources: Ministry of Finance; and CEIC Asia Database .
13. Investor surveys of business climate are consistent with the observed patterns of FDI flows. A survey of foreign investors (FICCI, 2002) puts Maharasthra in the clear lead in terms of investor perception. In the 2002 CII-World Bank survey of investment climate of Indian states, Maharasthra and Gujarat are classified as the best investment climate (IC) states while Kerala, West Bengal and Uttar Pradesh are classified as poor IC states. While the perceptions of business climate in states are appropriately correlated with the inflows of FDI, there are outliers. For example, Delhi gets much more FDI than would be indicated by an assessment of its business climate.
14. Differences in FDI appear to be explained by differences in the functioning of labor markets, regulatory burden, and infrastructure quality.14 Labor market flexibility appears to be important in determining FDI as states with the most man-days lost due to strikes fare worse in terms of FDI inflow (Figure III.6).15 There is some evidence that
14 The absence of consistent time series data for Indian states precludes a rigorous econometric investigation.
15 While there are national labor laws, states do have the power to amend national legislation. According to an assessment of the investment climate by the World Bank (2002), the best
(continued…)

- 29 -
infrastructure is also a determinant of FDI location. Specifically, states with higher teledensity attract more FDI (Figure III.6). Finally the burden of regulation also influences the location of FDI. States where it takes longer to enforce contracts and clear customs are also states with lower FDI (Figure III.7).
15. State specific policies and incentives to attract FDI are not a substitute for improving the overall business climate. The federal structure in India empowers the states to design their own investment policies to attract FDI, along with instituting specific incentives for certain sectors. A one-stop clearance window is now available in most states to for investors to meet all regulatory requirements and obtain all approvals. In addition, some states have offered tax concessions, capital and interest subsidies, and reductions in power tariffs. For instance, Karnataka has been aggressive in attracting FDI and has outlined a series of policies, such as investment subsidies, exemptions for export-oriented units, refunds and fiscal incentives for specific industries such as information technology, biotechnology and BPOs. While incentives make it easier to conduct business, they are unlikely to be the main determinant of the location of FDI.16 This is borne out by the experience of states such as Haryana, Himachal Pradesh and West Bengal, which offer incentives, but attract little FDI.
investment climate (IC) states in India have on average 11.9 percent of over staffing, while this number rises to 15.5 percent in poor IC states.
16 Most studies conclude that tax incentives neither affect significantly the amount of direct investment nor usually determine the location to which investment is drawn. (Wells and Allen, 2001; Chang and Cheng, 1992; FIAS, 1999; IMF, 2003; Tanzi and Shome, 1992; UNCTAD, 2004). In fact, Lim (1983) finds a negative relationship between incentives and investment, as the latter compensate for an otherwise unfavorable business climate. A survey of ASEAN firms also shows that the removal of incentives will not have a great impact on investment decisions (Mirza et. al, 1996).
Figure III.6.Indian States: FDI and Infrastructure and Labor Markets
0
20
40
60
80
100
120
140
160
180
0 500 1000 1500 2000
FDI per capita (in rupees)
Tele
phon
e lin
es p
er 1
000
inha
bita
nts
0
0.5
1
1.5
2
2.5
3
Man
days
lost
due
to in
dust
rial
di
sput
es (i
n m
illio
ns)
Telephone lines per 1000 inhabitants
Mandays lost due to industrial disputes
Figure III.7.Indian States: FDI Inflow and the Burden of Regulation
0
5
10
15
20
25
30
35
-30 20 70 120 170 220 270 320 370FDI Per Capita (in rupees)
Day
s to
Cle
ar C
usto
ms
0
0.5
1
1.5
2
2.5
3
3.5
Yea
rs to
enf
orce
a c
ontra
ct
Years to enforce a contract
Days to clear customs

- 30 -
E. Conclusion
16. The most important factors influencing FDI into India are not FDI-specific policies but, rather, broader economic policies including corporate taxes, trade openness, and other business climate issues, such as regulatory quality and burden. India has made considerable progress in liberalizing its FDI regime, which is a necessary but not a sufficient condition to attract significant FDI inflows. The differences across Indian states in attracting FDI further underscore the importance of business climate in determining FDI rather than FDI-specific incentives. With the current international attention on India’s tremendous potential for FDI, it would be an opportune time to push for rapid progress on structural reform to drastically increase FDI inflows.

- 31 -
References Albuquerque, R, 2003, “The Composition of International Capital Flows: Risk Sharing
through Foreign Direct Investment,” Journal of International Economics, 61, pp. 353–383.
Bajpai, Nirupam and Jeffrey D. Sachs, 2000, “Foreign Direct Investment in India,”
Development Discussion Paper No. 759 (Cambridge, Massachusetts: Harvard Institute for International Development).
Borzenstein, E, J. Degregorio and J. W. Lee, 1998, “How Does Foreign Direct Investment
Affect Economic Growth?,” Journal of International Economics, 45, pp. 115–135. Confederation of Indian Industry and the World Bank, 2002, Competitiveness of Indian
Manufacturing: Results from a Firm-Level Survey. Cheng C, and P. Cheng, 1992, “Tax Policy and Foreign Direct Investment in Taiwan”, in The
Political Economy of Tax Reform, eds. by Ito, T., and A. Krueger (Chicago, Illinois: The University of Chicago Press).
Dollar, David, Mary Hallward-Driemeier, and Taye Mengistae, June 2004, “Investment
Climate and International Integration,” Policy Research Working Paper 3323 (Washington: World Bank).
Foreign Investment Advisory Service, 1999, “Thailand: A Review of Investment Incentives”
(Washington). Hines, James, 1996, “Altered States: Taxes and the Location of Foreign Direct Investment in
America,” American Economic Review, Vol. 86, pp. 1076–1094. International Monetary Fund, 2003, Report of the Working Group of the Capital Markets
Consultative Group, September (Washington). Gorg, Holger, 2002, “Fancy a Stay at the Hotel California? Foreign Direct Investment,
Taxation and Firing Costs,” mimeo (Bonn: Institute for the Study of Labor). Javorcik, Beata, and Mariana Sparatreanu, 2004, “Do Foreign Investors Care about Labor
Market Regulations?,” Policy Research Working Paper 3275 (Washington: World Bank).
Kaufmann, Daniel, Aart Kraay, and Massimo Mastruzzi, 2004, “Governance Matters III:
Governance Indicators for 1996–2002,” Policy Research Working Paper 3106 (Washington: World Bank).

- 32 -
Lim, D., 1983, “Fiscal Incentives and Direct Foreign Investment in LDCs,” Journal of Development Studies, Vol. 19(2) (Oxford, United Kingdom: Taylor & Francis Ltd.).
Mercereau, Benoit, 2004, “FDI Flows to Asia: Did Dragon Crowd Out the Tigers?,”
Thailand—Selected Issues (Washington: International Monetary Fund). Mirza, H. F. Bartels, and M. Hiley, 1996, “The Promotion of Foreign Direct Investment into and
within ASEAN,” ASEAN Secretariat. Tanzi, V, and P. Shome, 1992, “The Role of Taxation in the Development of East Asian
Economics,” in The Political Economy of Tax Reform, eds. by Ito, T., and A. Krueger (Chicago, Illinois: The University of Chicago Press).
World Bank, 2002, “Improving the Investment Climate in India,” Pilot Investment Climate
Assessment (Washington). ———, 2003, Doing Business in 2004 (Washington). World Economic Forum, 2004, “Executive Opinion Survey,” Global Competitiveness
Report. Wei, Shang-Jin, 2000, “How Taxing is Corruption on International Investors”, Review of
Economics and Statistics. Wheeler, David and Ashoka Mody, 1992, “International Investment Location
Decisions: The Case of U.S. Firms,” Journal of International Economics, 33, pp. 57-76.
Wells, L. and N. Allen, 2001, “Tax Holidays to Attract Foreign Direct Investment: Lessons
from Two Experiences,” Foreign Investment Advisory Service (Washington). UNCTAD, 2004a, Prospects for FDI Flows, Transnational Corporation Strategies and
Promotion Policies: 2004–2007 (Geneva: United Nations Conference on Trade and Development).
———, 2004b, International Investment Perspectives, Chapter 3 (Geneva: United Nations
Conference on Trade and Development).
- 33 -
IV. THE TAX SYSTEM IN INDIA: COULD REFORM SPUR GROWTH?1
A. Introduction and Overview
1. While the average tax intake in India is low by international standards, marginal rates are high. High tax rates are thought to depress employment, investment, and growth. The empirical evidence is mixed. Cross-country studies generally confirm the negative impact of taxation on economic activity, but results are not robust. Firm-level evidence and simulation results are more conclusive, supporting the view that high tax rates have an adverse effect on growth and distort financing and investment decisions (Box IV.1). High tax rates may also contribute to the growth of the “shadow economy,” carrying costs in terms of foregone tax receipts and lower productivity growth (Farrel, 2004; Schneider and Klinglmair, 2004).
2. To improve the tax intake and savings and investment rates, which are low by regional standards,2 a series of tax reforms have been considered in India.3 Their main thrust is to combine lower statutory rates with base broadening, to realize more revenues while lowering the marginal tax burden and removing distortions. This in turn should foster growth, leading to an “expansionary” fiscal adjustment.
3. This chapter assesses the potential impact of India’s tax system on growth. Section B establishes stylized facts about the tax system: (i) a high dependence on indirect taxes, (ii) low average effective tax rates (AETRs) and tax productivity, and (iii) high marginal tax rates and tax-induced distortions on marginal investment and financing decisions. Section C finds that the proposed tax reforms would improve tax productivity and lower the marginal tax burden and tax-induced distortions. But firms that rely on internal sources of funds or face problems borrowing would continue to face high marginal tax rates.
1 Prepared by Hélène K. Poirson.
2 National savings during 1999–2004 in India reached 24 percent of GDP on average annually, compared to 43 percent in China, 34 percent in Malaysia, and 32 percent in Korea.
3 For a history of reforms, see Ministry of Finance (1982, 2001, and 2004), Patel (1995), Mulheisen (1998), Burgess, Howes and Sterne (1997), and Shome (2004).

- 34 -
Box IV.1. Empirical Evidence on Taxation and Growth
High labor taxation can negatively impact employment and growth by pushing up labor costs. In the presence of strong and decentralized labor unions, labor taxes are shifted into real wages, reducing labor demand; this in turn leads to substitution away from labor and downward pressure on the marginal product of capital, reducing investment and growth. Empirical evidence for European Union (EU) countries confirms this view.1 High marginal effective tax rates (due to the combination of tax and benefit systems) can also affect labor supply decisions by affecting the choice between additional work and leisure.2
Consumption taxes do not affect savings and investment decisions since future and current consumption are treated equally, and they remain neutral with respect to various sources of income. Empirical evidence is mixed, however. Some studies find that such taxes indeed have no impact on employment and growth,3 but others find that—like income taxes, although to a lesser extent—they have a negative impact on growth by distorting the choice between labor and leisure, and also could depress savings.4
Corporate taxes raise the required rate of return on investment and depress investment. In addition corporate taxes tend to favor debt over equity financing or retained earnings, potentially leading to an inefficient allocation of resources, higher insolvency risks, and discrimination against smaller companies that face more difficulties borrowing. Corporate taxes are also non-neutral given the widespread use of rebates, exemptions and special regimes for specific sectors or regions. This also benefits large companies which can bear a lower tax burden through tax planning and fiscal engineering.5 Cross-country studies confirm a negative link between the tax burden and growth for high-income countries. However, the result does not hold for low- and middle-income countries, perhaps reflecting measurement problems.6 Firm-level empirical results, as well as simulation results using computable general equilibrium models, in contrast support the view that higher taxes negatively affect growth.7
Taxation of capital income—even when at a low level—as is the case in most EU countries, appears to have a distortionary effect on savings. Although there is little evidence for the EU that taxes affect the aggregate level of savings, they appear to influence its composition and location. Many EU countries tend to grant favorable treatment to specific savings instruments, such as retirement schemes and housing investment. Moreover, they generally apply a preferential treatment to non-residents, thus distorting saving flows and potentially enhancing tax evasion possibilities associated with cross-border investment.8
___________________________ 1See Daveri, F., and G. Tabellini, 2000, “Unemployment, Growth, and Taxation in Industrial Countries,” Economic Policy, Vol. 30, pp. 48–104. 2For example, see OECD, 2001, Tax and the Economy: A Comparative Assessment of OECD Countries, (Paris: Organisation for Economic Co-operation and Development). 3See Daveri and Tabellini, 2000; and Kneller, R., M. F. Bleaney, and N. Gemmel, 1999, “Fiscal Policy and Growth: Evidence from OECD Countries,” Journal of Public Economics, Vol. 74(2), pp. 171–190. 4For example, see Milesi-Ferretti, G. and N. Roubini, 1995, “Growth Effects of Income and Consumption Taxes: Positive and Normative Analysis,” NBER Working Paper 5317; and Tanzi V. and H. Zee, 2000, “Taxation and the Household Saving Rate: Evidence from OECD Countries,” Banca Nazionale del Lavoro Quarterly Review, Vol. 53, pp. 31–43. 5See Rao, S., and J. Lukose, 2002, “An Empirical Study of the Determinants of the Capital Structure of Listed Indian Firms,” unpublished (Mumbai: Indian Institute of Technology); OECD, 2001; and Joumard, I., 2001, “Tax Systems in European Union Countries,” OECD Economic Studies, Vol. 34, pp. 91–151; and Nicodeme, G., 2002, “Sector and Size Effects on Effective Corporate Taxation,” Economic Papers No. 175 (Brussels: European Commission). 6See Blankenau, S., S. Nicole, and M. Tomljanovich, 2004, “Public Education Expenditures, Taxation, and Growth,” unpublished (Kansas: Kansas State University). Such studies typically use the tax revenue to GDP to proxy for the tax burden instead of the marginal or effective tax rate on corporates, which ideally should be used. 7See Fishman, R. and J. Svensson, 2000, “Are Corruption and Taxation Really Harmful to Growth? Firm Level Evidence,” unpublished (New York: Columbia University); and Feltenstein, A. and A. Shah, 1995, “General Equilibrium Effects of Investment Incentives in Mexico,” Journal of Development Economics, Vol. 46, pp. 253–69. 8See OECD (2001).

- 35 -
B. The Indian Tax System: Stylized Facts and Issues
The Tax System4
4. India has a well developed tax structure, with the authority to levy taxes divided between the central government and the state governments. The central government levies direct taxes such as personal income tax (PIT) and corporate tax (CIT), and indirect taxes such as customs duties, excise duties, and central sales tax. The states levy state sales tax and various local taxes. Since 1991, the tax structure has been substantially rationalized. Changes include reducing customs and excise duties, lowering CIT rates, extending a form of VAT to some industries, and broadening the tax structure to some services.5
5. The principal direct taxes include PIT and CIT, state taxes on agricultural income, wealth tax, and various withholding taxes. The PIT is levied on non-agricultural income at rates of 10 percent–31.5 percent. It applies to Indian residents and foreigners, on income earned in India. The exemption threshold of Rs. 50,000 (US$1,111) results in a relatively narrow tax base of about 34 million taxpayers.6 States levy some taxes on agricultural income (land revenue tax and agricultural income tax), but their combined incidence is considerably less than that of the PIT. A wealth tax is levied on net assets in excess of Rs. 1.5 million. The corporate income tax (CIT) is levied at a basic rate of 35 percent, but with significant exemptions. Other corporate taxes include a dividend distribution tax (DDT), a minimum alternative tax on profits, and various withholding taxes on interest, royalties, etc.
6. The main indirect taxes are the sales tax, custom and excise duties, and service tax. A state sales tax is levied on intrastate trade and a central sales tax (CST) on interstate trade, at a rate that varies depending on the type of transaction and the rate of the state sales tax. The center also levies custom duties and a basic excise duty (modified VAT or CENVAT) on goods manufactured or produced in India. The CENVAT base is truncated to manufacturing and eroded by a complex and extensive system of exemptions, including for small-scale industries and Special Economic Zones. Special excise duties are levied on specific items. In 1994, a selective turnover tax on services was introduced on three specified services. The base was gradually widened to cover 58 services.7 Other minor taxes and duties
4 As of June 2004. See Annex IV.1 for detailed provisions of the tax system.
5 The budget 2004/05 imposed a 2 percent education surcharge on all taxes.
6 The exemption threshold was raised to Rs. 111,250 (US$2,472) in the 2004/05 budget. An estimated 14 million taxpayers are expected to benefit, further narrowing the base.
7 The service tax net has been further widened in the 2004/05 budget to cover 71 services. The service tax rate was raised to 10 percent. Credit of service tax and excise duty was extended across goods and services.

- 36 -
imposed at both center and state level include stamp duty, taxes on land and buildings, and taxes on motor vehicles.
7. As in other developing countries, tax incentives feature prominently in India. They are used to encourage new industry to locate in “backward” regions; to promote exports; and to promote investment in sectors including hotels, power, telecommunications, and infrastructure. The question remains whether tax incentives are decisive factors in the decision to invest. They may be important for some companies to offset other costs of doing business in India—such as still relatively high import duties, cascading sales taxes, and inadequate public infrastructure—but an unfortunate outcome has been to thin out the overall direct and indirect tax bases (Shome, 2004). Tax holidays, which are the preferred form of incentives in India, have the most serious shortcomings (Tanzi and Zee, 2001).
Stylized Facts
8. India’s general government tax revenue has declined since the 1990s, to under 14 percent of GDP in 2002/03. This is more than 5 percentage points below the average for selected non-OECD countries and 2 percentage points below the Asian average. The decline in revenue during 1992–2002 contrasts with the increase in tax intake observed in other large Asian countries (Indonesia, China, and Korea) over the same period. It occurred as major tax reforms were implemented, aimed at improving the buoyancy of revenues and increasing the share of direct taxes in total revenues. Direct tax revenues increased, but indirect tax collections declined, mainly due to tariff reductions (Figure IV.1).
9. The most recent reforms (2002-04) were moderately successful in reversing the declining trend of revenues. The peak tariff reduction for non-agricultural imports advocated by the 2002 Kelkar committee reports (Box IV.2) was fully implemented and the revenue loss was more than offset by buoyant corporate tax collections. However, excise and PIT revenues rose only marginally, reflecting the extension of further exemptions, deductions, and rebates (against the recommendation of the Kelkar reports). The states succeeded in raising sales tax collections, but the introduction of a VAT was postponed.
Figure IV.1. India: Tax Burden, 1974/75-2003/04 (In percent of GDP)
0.0
2.0
4.0
6.0
8.0
10.0
12.0
14.0
16.0
18.0
1974A1 1978A1 1982A1 1986A1 1990A1 1994A1 1998A1 2002A1
Total tax burden
Indirect taxes
Direct taxes
Sources: Indian authorities; and staff projections.

- 37 -
Box IV.2. Kelkar 2002 Reports Proposals
As part of its overall reform agenda, the government in 2002 set up a tax reform task force (Kelkar task force) to propose a far-reaching reform agenda for direct and indirect taxes. 1 Proposals centered around the following elements: • A change in the exemption level and rate structure of the personal income tax and
broadening of the base, as well as minimizing exemptions and replacing allowances by credits. A constitutional device would allow the government to tax agricultural income. The general exemption would be increased, the number of brackets reduced, and the highest marginal rate reduced to 30 percent. A range of special deductions would be eliminated and some would be converted into credits. The report also proposed changes to the taxation of capital income, specifically exempting dividends from Indian companies and long-term capital gains on equity.
• A reduction in the rate and in the large number of deductions and exemptions of the corporate income tax. The rate would be reduced to 30 percent for domestic companies and 35 percent for foreign companies. The minimum alternate tax would be eliminated.
• A rationalization of the import tariff structure and export promotion schemes. The existing 20 tariff rates, ranging up to 182 percent, were to be reduced to a range of 0 percent-20 percent for most goods, with higher rates—up to 150 percent—for certain agricultural products and “demerit” goods, with the new schedule to be adopted as of 2004/05. Exemptions would be significantly narrowed.
• Broadening the base of the central excise tax (CENVAT) and moving it further toward a VAT.
___________________________ 1 See Ministry of Finance, 2002a, Report of the Task Force on Indirect Taxes, (New Delhi: Government of India); and Ministry of Finance, 2002b, Report of the Task Force on Direct Taxes, (New Delhi: Government of India).
10. Despite reforms, the tax structure remains dominated by indirect taxes. State taxes on commodities and services are the prominent source of general government revenue (representing more than a third of the total tax intake), followed by central government excises (one-fifth of the total) (Table IV.1). The share of revenue from indirect taxes is more than three quarters, compared to half in the average non-OECD country (Table IV.2).
Billions of Percent of Percent ofRupees GDP Total
Central government 2,544.4 9.2 61.0Corporate tax 636.1 2.3 15.2Income tax 414.4 1.5 9.9Excises 907.6 3.3 21.8Customs 486.3 1.8 11.7Other 1/ 100.0 0.4 2.4
States and union territories 2/ 1,626.7 5.9 39.0Taxes on income 25.7 0.1 0.6Taxes on property and capital transactions 177.5 0.6 4.3Taxes on commodities and services 1,423.4 5.1 34.1
Total 4,171.0 15.0 100.0
Sources: Indian authorities; and staff estimates.
1/ Mostly service tax. 2/ Staff estimates based on projected GDP growth and historical elasticities.
Table IV.1. India: Structure of General Government Tax Revenue, 2003/04

- 38 -
Taxes on Taxes on Indirect TaxesTaxes on Social International on Domestic Taxes Direct Taxes Direct TaxesPayroll or Security Trade and Goods and on on onWorkforce Contributions Transactions Services Property Corporates Individuals Total
Albania ... ... ... ... ... ... ... ... Argentina ... 15.1 2.8 23.8 11.2 8.3 15.2 100.0Azerbaijan ... ... ... ... ... ... ... ... Belarus 2.2 26.3 4.2 44.1 3.3 6.6 ... 100.0Bolivia ... 10.4 5.0 58.0 9.6 6.9 ... 100.0Brazil ... ... ... ... ... ... ... ... Bulgaria ... 27.1 2.3 42.3 1.2 8.6 12.5 100.0Chile ... 7.3 6.0 55.8 3.7 ... ... 100.0Croatia ... 32.3 6.3 45.0 1.3 3.0 10.4 100.0Estonia ... 33.8 0.1 39.4 1.4 2.4 22.9 100.0India ... ... 12.8 60.3 4.2 11.6 11.1 100.0Israel 2.8 16.9 0.7 33.4 ... 10.2 32.5 100.0Kazakhstan ... ... ... ... ... ... ... ... Kyrgyz Republic ... ... ... ... ... ... ... ... Latvia ... 31.2 1.1 37.4 3.3 7.0 20.1 100.0Lithuania 0.1 27.2 1.0 41.5 2.1 1.9 26.1 100.0Moldova ... 27.5 4.9 48.8 4.1 2.5 7.2 100.0Mongolia ... 18.3 8.1 49.4 0.5 8.3 6.2 100.0Peru 0.1 9.2 10.2 58.3 ... 13.2 11.3 100.0Romania ... 39.6 2.9 35.8 1.8 6.9 11.8 100.0Russia ... 21.3 11.4 35.2 3.8 7.4 8.8 100.0Slovenia 4.6 34.8 1.6 37.3 1.8 3.8 10.4 100.0South Africa 1.0 1.8 2.9 33.5 5.1 ... ... 100.0Thailand ... 3.3 11.3 52.6 1.6 17.0 11.8 100.0
Unweighted average 2.4 23.3 4.2 41.7 2.9 6.6 14.5 100.0
Sources: Government Finance Statistics (IMF); and International Financial Statistics (IMF).
Table IV.2. Non-OECD Countries General Government: Tax Revenue, 2001(In percent of total)
11. The tax system is characterized by extremely low AETRs. The AETR on labor, at 2 percent in 2001, is much lower than in the European Union, United States, or Japan, which range from 21–36 percent (Table IV.3). This reflects India’s narrow tax base and the lack of social security system.8 The AETR on capital income is also low, reflecting the wide
8 Estimates for non-OECD countries are not publicly available.
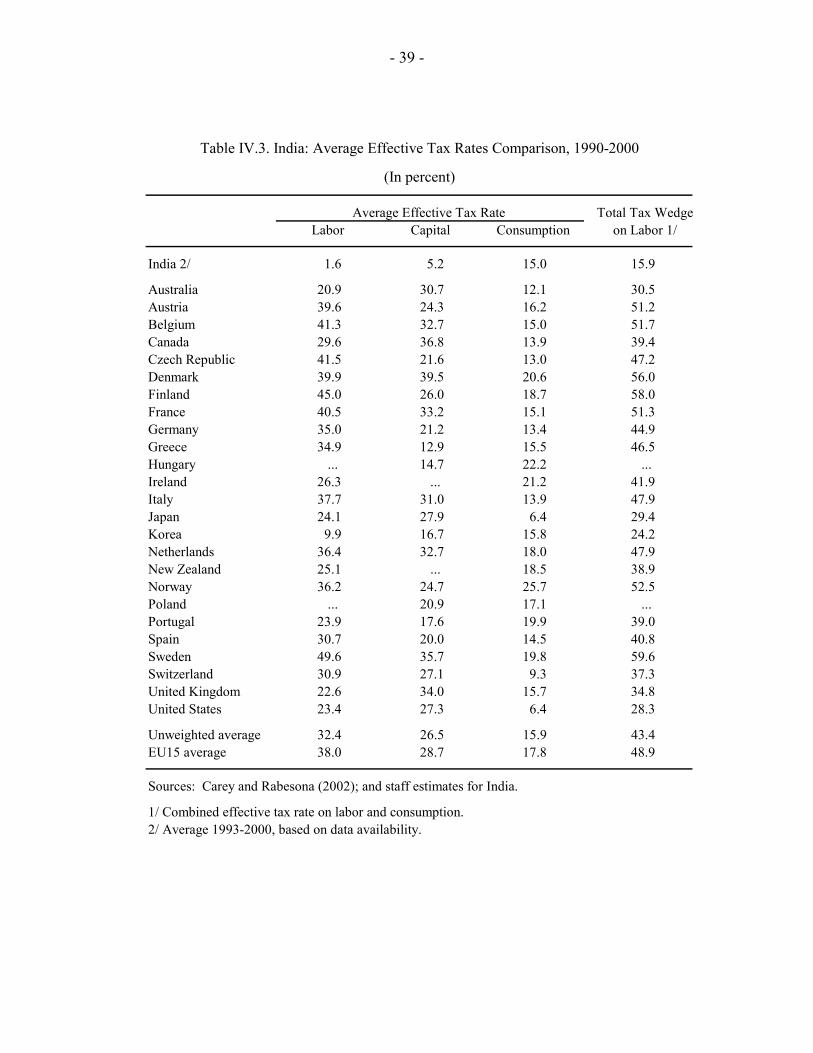
- 39 -
(In percent)
Total Tax WedgeLabor Capital Consumption on Labor 1/
India 2/ 1.6 5.2 15.0 15.9
Australia 20.9 30.7 12.1 30.5Austria 39.6 24.3 16.2 51.2Belgium 41.3 32.7 15.0 51.7Canada 29.6 36.8 13.9 39.4Czech Republic 41.5 21.6 13.0 47.2Denmark 39.9 39.5 20.6 56.0Finland 45.0 26.0 18.7 58.0France 40.5 33.2 15.1 51.3Germany 35.0 21.2 13.4 44.9Greece 34.9 12.9 15.5 46.5Hungary ... 14.7 22.2 ... Ireland 26.3 ... 21.2 41.9Italy 37.7 31.0 13.9 47.9Japan 24.1 27.9 6.4 29.4Korea 9.9 16.7 15.8 24.2Netherlands 36.4 32.7 18.0 47.9New Zealand 25.1 ... 18.5 38.9Norway 36.2 24.7 25.7 52.5Poland ... 20.9 17.1 ... Portugal 23.9 17.6 19.9 39.0Spain 30.7 20.0 14.5 40.8Sweden 49.6 35.7 19.8 59.6Switzerland 30.9 27.1 9.3 37.3United Kingdom 22.6 34.0 15.7 34.8United States 23.4 27.3 6.4 28.3
Unweighted average 32.4 26.5 15.9 43.4EU15 average 38.0 28.7 17.8 48.9
Sources: Carey and Rabesona (2002); and staff estimates for India.
1/ Combined effective tax rate on labor and consumption. 2/ Average 1993-2000, based on data availability.
Table IV.3. India: Average Effective Tax Rates Comparison, 1990-2000
Average Effective Tax Rate

- 40 -
coverage of tax incentives, low personal taxes on capital income, and a large informal sector.9 Korea in the mid 1970s had similar low AETRs, but they have since risen significantly (Figure IV.2). Finally, the AETR on consumption is broadly average despite a tax base that largely excludes services. As in Korea, it has declined over time.
12. Reflecting the low AETRs, India’s tax productivity is also low relative to both OECD and non-OECD countries.10 For example, CIT tax productivity is much below average (Tables IV.4a and IV.4b).11 While this is unwelcome in a static sense, it is attractive if considered dynamically: by expanding the taxpayer net, broadening the tax base, or stepping up tax administration, revenue can be raised without rate increases. During the period 1993-2001, India increased AETRs on labor and capital despite reductions in statutory rates and a declining CIT tax base.12 This suggests that improved tax administration and compliance was the main factor underlying the improvement in tax productivity.
The Burden of Taxation on Investors
13. This section assesses to what extent the Indian income tax code affects incentives to invest. We calculate two standard indicators, the marginal effective tax wedge (METW) between the pre- and post-tax return on capital, and the marginal effective tax rate (METR),
9 The operating surplus of unincorporated enterprises (a proxy for the share of the informal sector) accounted for three quarters of the operating surplus of the economy in 2000/01.
10 Tax productivity measures the extent to which revenues that should be received—given the rate and base of the tax—are actually being realized. It is measured as the ratio of the effective to statutory tax rate (Kraemer and Zhang, 2004).
11 In Table IV.4a, following the Kraemer-Zhang approach, we use the operating surplus of the economy (from national accounts) as the potential tax base. In Table IV.4b, in the absence of such data for non-OECD countries, we use nominal GDP.
12 The operating surplus of the economy declined by 2.7 percent of GDP during 1993–2001.
Table IV.4a. India: Revenue Productivity of the Corporate Tax, 2001
(In percent)
India 35.9 3.5 9.7
France 33.3 8.9 26.8Germany 38.9 2.1 5.3Italy 37.0 6.7 18.2Japan 40.9 8.7 21.2Korea 29.7 9.6 32.4United Kingdom 30.0 9.9 32.9United States 2/ 45.8 5.3 11.6
OECD average 32.3 9.6 29.7
1/ Ratio of effective CIT rate to statutory CIT rate. 2/ As of 2000.
Sources: Standard & Poor's; and staff estimates for India and Korea.
Statutory CIT Rate
Effective CIT Rate
Revenue Productivity 1/

- 41 -
Figure IV.2. India and Korea: AETRs on Labor, Capital, and Consumption
AETRs on Labor, 1975-2002(In percent)
0
2
4
6
8
10
12
1975 1980 1985 1990 1995 2000
India (1993-2001)
Korea
0
4
8
12
16
20
1975 1980 1985 1990 1995 2000
Korea
India(1993-2001)
AETRs on Capital, 1975-2002(In percent)
AETRs on Consumption, 1974-2003 (In percent)
10
14
18
22
26
1974 1978 1982 1986 1990 1994 1998 2002
Korea
India
Source: Staff estimates.

- 42 -
Statutory Corporate RevenueCIT Rate 1/ Taxes/GDP 2/ Productivity 3/
India 35.9 2.3 6.4
Argentina 35.0 2.7 7.7Bolivia 25.0 1.8 7.2Chile (2001) 17.0 4.6 27.2China 33.0 2.5 7.5Colombia 35.0 4.7 13.4Hungary 16.0 8.0 49.8Indonesia 30.0 1.7 5.5Mexico (2000) 33.0 5.0 15.3Pakistan 35.0 3.6 10.2Peru 30.0 3.4 11.4Philippines 32.0 2.6 8.2Poland 19.0 4.9 25.6Russia 24.0 4.0 16.6Singapore (2001) 22.0 8.0 36.5South Africa 37.8 5.5 14.4Thailand 30.0 3.0 10.0Turkey 33.0 2.5 7.6Ukraine 25.0 5.0 20.0Uruguay 35.0 2.6 7.4Venezuela 34.0 14.7 43.1
All: Mean 29.0 4.5 17.2
1/ As of January 1, 2004. 2/ Used as proxy for the effective CIT rate. For 2003, unless otherwise indicated. 3/ Ratio of corporate tax/GDP to statutory CIT rate.
Sources: KPMG; Government Finance Statistics (IMF); and International Financial Statistics (IMF); and various country databases.
Table IV.4b. India: Revenue Productivity of the Corporate Tax, 2003
(In percent)

- 43 -
defined as the ratio of the METW to the real required pre-tax rate of return.13 By summarizing various tax effects, including the statutory CIT rate, depreciation allowances, inventory valuation method, and personal taxes, the METW measures the potential cost of taxation to investors, which in turn affects their decision to invest.14 Comparable estimates have been published for OECD countries.
14. The total tax wedge on capital income in India is broadly average, but tax-induced distortions tend to be high. Firms that rely on internal financing are particularly penalized (Tables IV.5a, IV.5b, and IV.6):
• The tax wedge on capital (1.4 percent) is slightly lower than the OECD average. This reflects low personal taxes and the indexation option available for long-term capital gains.
• The standard deviation of the tax wedge across investment assets is three times higher than the OECD average. Inventory investment is treated more harshly than investments in machinery and buildings, so that firms that need to carry more inventories are penalized, more so than in other countries.15
• The standard deviation of the tax wedge across financing sources is twice as high as the OECD average. The large negative tax wedge enjoyed by debt financing means that the government is effectively subsidizing marginal debt-financed investments, more so than in other countries. Investments financed by new equity face a below average tax wedge, thanks to low dividend taxation. However, investments financed by retained earnings face a tax wedge of nearly 3 percent (compared to the OECD average of 2 percent). Smaller firms that face problems in borrowing and tend to be more dependent on internal sources of funds are thus
13 See Annex IV.III for tax parameters used. See OECD (1991) and Poirson (2004) for further details on the methodology and parameters. Indirect taxes impose additional costs on investment, but the METR approach focuses on direct taxation, thus understating the tax burden on investors.
14 The AETR, although commonly used for this purpose, does not accurately reflect incentives, as it is backward looking. Moreover, international comparisons using this indicator are difficult to interpret due to differences in accounting definitions and the timing of tax payments. Further, it does not incorporate personal tax provisions.
15 The use of the FIFO method (first in first out) for inventory valuation also entails a higher tax burden, as increases in the value of inventories due solely to inflation are taxed.

- 44 -
Standard WeightedDeviation 2/ Average Machinery Building Inventories
India 1.5 1.4 0.7 0.5 3.2
Canada 1.0 3.6 2.7 4.1 5.1Germany 0.4 1.2 0.9 1.4 1.9Japan 1.0 2.0 1.0 3.1 2.8United Kingdom 0.5 2.2 1.9 2.2 3.1United States 0.4 1.9 1.5 2.5 2.0
OECD average 0.4 1.6 1.2 1.7 2.3
Sources: Dalsgaard (2001) based on OECD calculations; and staff estimates for India.
Table IV.5a. India: Marginal Effective Tax Wedge by Investment Type 1/
(In percent)
Investment Type
1/ These indicators show the degree to which the personal and corporate tax systems scale up (or down) the pre-tax real rate of return that must be earned on an investment, given that the representative investor can earn a 4 percent real rate of return on a demand deposit. The estimates shown refer to 2004 for India, 1999 for other countries.2/ The standard deviation across investment vehicles provides an indicator of the neutrality of the tax system towards corporate investment decisions. The lower the standard deviation, the more neutral the tax system.
Standard Retained New equity DebtDeviation 2/ earnings
India 2.0 2.9 2.8 -0.6
France 2.9 3.6 7.7 0.7Germany 0.7 0.9 2.5 1.3Italy 0.4 1.3 1.3 0.4Japan 2.3 3.3 5.5 -0.1Korea 0.5 0.6 1.6 1.6United Kingdom 0.5 2.9 2.4 1.6United States 1.5 1.7 4.8 1.4
OECD average 3/ 0.9 2.0 3.2 1.0
Sources: Joumard (2001) based on OECD calculations; and staff estimates for India.
3/ Weighted average across available countries (weights based on 1995 GDPs and PPPs).
2/ The standard deviation across financing instruments provides an indicator of the neutrality of the tax system towards corporate financing decisions. The lower the standard deviation, the more neutral the tax system.
Table IV.5b. India: Marginal Effective Tax Wedge by Financing Source 1/(In percent)
Sources of Financing
1/ These indicators show the degree to which the personal and corporate tax systems scale up (or down) the pre-tax real rate of return that must be earned on an investment, given that the representative investor can earn a 4 percent real rate of return on a demand deposit. The representative investor is supposed to be a resident person, taxed at the top marginal income tax rate (see OECD, 1991). The estimates shown refer to 2004 for India, to 1999 for other countries.

- 45 -
(In percent)
Statutory Corporate Statutory Corporate Marginal EffectiveTax Rate, 2004 1/ Tax Rate, 1999 Tax Rate 2/
India 35.9 ... 26.1
Australia 30.0 ... ... Austria 34.0 34.0 17.4Belgium 34.0 40.2 25.6Canada 36.1 34.6 24.0Czech Republic 28.0 ... ... Denmark 30.0 ... ... Finland 29.0 29.0 19.5France 34.3 36.4 29.9Germany 38.3 38.3 28.3Greece 35.0 37.5 27.7Hungary 18.0 ... ... Ireland 12.5 10.0 6.6Italy 37.3 40.3 9.2Japan 42.0 40.9 31.8Korea 29.7 ... ... Luxembourg 30.4 ... ... Netherlands 34.5 35.0 24.3New Zealand 33.0 ... ... Norway 28.0 ... ... Poland 19.0 ... ... Portugal 27.5 35.2 20.3Spain 35.0 35.0 29.5Sweden 28.0 28.0 16.1Switzerland 24.1 ... ... United Kingdom 30.0 30.0 20.3United States 40.0 39.3 23.8
Unweighted average 30.3 33.6 22.0EU15 average 32.2 34.4 22.3
1/ As of January 1, 2004.2/ Based on investment in plant and machinery, financed by equity or retained earnings (but not debt). Taxation at the shareholder level is not included (hence no distinction between new equity and retained earnings). Other assumptions: real post-tax required rate of return fixed at 10 percent. The estimate is for the current tax system for India, the 1999 tax system for all other countries.
Table IV.6. India: Statutory and Effective Tax Rates on Corporations
Sources: KPMG for 2004 statutory tax rates; staff estimates for India; Devereux, Griffifth and Klemm (2002) for 1999 statutory; and effective tax rates for other countries.

- 46 -
disadvantaged compared to larger firms (Rao and Lukose, 2002; Joseph et al., 1998). The relatively large tax advantage of debt finance may also have contributed to relatively high financial leverage in India, exacerbating firms’ vulnerability.16
15. A related result is that corporates that rely mainly on internal financing face a high marginal tax rate. The METR for investments financed by retained earnings is 26 percent, compared to the OECD average of 22 percent, reflecting a relatively high CIT rate.17
C. Priorities for Reforms
16. The facts highlighted above suggest that a tax reform combining lower statutory rates with base broadening is likely to enhance growth prospects in India. AETR and tax productivity estimates suggest ample scope for raising revenue through base-broadening and improved tax administration. These measures in turn would create room for lowering statutory rates, reducing the METR and raising investment. These broad directions for tax reform were highlighted in the FRBMA roadmap (Ministry of Finance, 2004).
An Assessment of the FRBMA Roadmap Tax Proposals
17. The roadmap proposes the introduction of a national VAT on goods and services and a number of changes to corporate and personal income taxation: reduction of the statutory CIT rate to 30 percent and elimination of the surcharge; reduction of the general depreciation rate to 15 percent; elimination of the withholding tax on distribution of dividends; and elimination of the long term capital gains tax. The reforms also envisage lifting most exemptions and incentives to expand the tax base and increased reliance on IT to improve tax administration and compliance.
18. The proposals implemented as a package would imply a significant increase in tax productivity. For example, the corporate tax to GDP ratio is projected to nearly double from 2.3 percent of GDP in 2003/04 to 4.2 percent of GDP by 2008/09, despite a lower CIT rate (Ministry of Finance, 2004). CIT tax productivity would more than double to 14 percent by 2008/09 (nearing the non-OECD average). The proposed extension of the CENVAT to services should also help enhance its revenue productivity.
16 The average debt-to-equity ratio for Indian companies is high relative to their counterparts in Asian countries and elsewhere, and has risen recently to 1.4 in 2002 from a low of 1.2 in 1996 (Topalova, 2004).
17 The METR calculated here follows the methodology of Devereux, Griffith, and Klem (2002) and ignores any personal taxes, focusing on the marginal tax burden at the firm level.

- 47 -
19. The reforms would also decrease the METW on capital income and reduce tax-induced distortions. The METW would be nearly halved thanks to lower personal taxes (Table IV.7). Neutrality with respect to sources of financing would improve, but firms that rely on internal finance would remain relatively penalized.18 Neutrality with respect to investment patterns would improve by a third, thanks to the lower depreciation rate, but remain more than double the OECD average, suggesting scope for further improvements. Replacement of the sales taxes and excise duties by a national VAT should also help reduce distortions, with favorable effects on investment and exports (Ministry of Finance, 2004).
20. To mitigate potentially excessive reliance on debt finance and help further improve the neutrality of the tax system, additional tax measures can be considered. These include (IMF, 2004): limiting the deductibility of interest to a percentage of net taxable income; limiting debt for the purposes of income tax (e.g., debt-to-equity ratios in Canada are limited to 2, in Germany to 1.5, and in Japan to 3); limiting interest to a referential rate (e.g., in Portugal, the 12-month Euribor plus 1.5 percent); or introducing an allowance for corporate equity.19
18 The METR on retained earnings (ignoring any personal taxes) would increase by 3 percentage points to 29 percent following reforms, due to the lower depreciation rate.
19 The notional rate of return on invested equity is deductible under the CIT in Croatia (1994–2001), and imputed equity return is taxed at a reduced rate in Austria and Italy (until 2001).

- 48 -
Mode of FinancingRetained New equity Debt Weighted Standard
Type of Investment earnings average Deviation 1/
Machinery 2.2 2.1 -1.1 0.7 1.941.2 40.0 -56.8 18.5
Buildings 2.1 1.9 -1.4 0.5 2.039.8 38.5 -82.1 14.2
Inventories 5.0 4.9 0.9 3.2 2.361.8 61.2 22.3 50.6
Weighted average 2.9 2.8 -0.6 1.4 2.048.6 47.6 -25.0 30.3
Standard deviation 1/ 1.7 1.7 1.3 1.5
Machinery 2.1 1.8 -0.2 1.0 1.339.7 36.1 -8.0 24.4
Buildings 1.2 0.9 -1.0 0.2 1.227.6 22.5 -47.5 5.6
Inventories 3.4 3.1 0.8 2.2 1.452.0 49.4 21.2 41.6
Weighted Average 2.3 2.0 -0.1 1.2 1.341.9 38.4 -3.0 27.4
Standard deviation 1/ 1.1 1.1 0.9 1.0
Source: Staff estimates.
2/ Corresponding marginal effective tax rates are reported in italics.
1/ The standard deviation measures the neutrality of the tax system with respect to corporate financing and investment decisions. The lower the standard deviation, the more neutral the tax system.
(In percent)
Tax System, 2003/04 2/
Tax System, FRBM Roadmap 2/
Table IV.7. India: Tax Wedges Under Current Tax System Versus Reformed Tax System

- 49 - ANNEX IV.IIn
dia:
Mai
n Fe
atur
es o
f the
Tax
Sys
tem
(Jun
e 20
04) 1
/ Ta
x N
atur
e of
Tax
Ex
empt
ions
and
Ded
uctio
ns
R
ates
1.
Dir
ect T
axes
1.
1. T
axes
on
Inco
me
and
Prof
its:
1.1.
1. B
usin
ess i
ncom
e 1.
1.1.
1. C
orpo
rate
inco
me
tax
(CIT
):
Com
pani
es a
re ta
xed
base
d on
th
e re
sidi
ng p
rinci
ple.
C
IT a
pplie
s to
net p
rofit
s de
term
ined
afte
r bus
ines
s ex
pens
es a
nd d
epre
ciat
ion
allo
wan
ces.
In
vent
orie
s are
gen
eral
ly v
alue
d at
the
low
er o
f cos
t or m
arke
t pr
ice.
Nor
mal
ly, t
here
is
conf
orm
ity b
etw
een
tax
and
book
re
porti
ng. F
IFO
and
ave
rage
cos
t ar
e ac
cept
able
, pro
vide
d th
ey a
re
cons
iste
ntly
app
lied.
Sh
ort-t
erm
cap
ital g
ains
are
taxe
d at
the
CIT
rate
. The
y ar
ise
on th
e sa
le o
f an
asse
t with
in th
ree
year
s of
its a
cqui
sitio
n (o
ne y
ear i
n th
e ca
se o
f sha
res)
. Oth
er c
apita
l ga
ins (
calle
d lo
ng-te
rm g
ains
) are
de
term
ined
afte
r inc
reas
ing
the
cost
by
pres
crib
ed in
flatio
n fa
ctor
s.
Shor
t-ter
m c
apita
l los
ses c
an b
e se
t off
aga
inst
any
cap
ital g
ains
. Lo
ng-te
rm c
apita
l los
ses c
an b
e se
t off
onl
y ag
ains
t lon
g-te
rm
capi
tal g
ains
dur
ing
the
year
. G
ains
and
loss
es (c
ompu
ted
unde
r “D
epre
ciat
ion”
) aris
ing
on
the
sale
of d
epre
ciab
le a
sset
s are
cl
assi
fied
as sh
ort-t
erm
cap
ital
gain
s/lo
sses
. St
ock
divi
dend
s may
be
dist
ribut
ed a
nd a
re n
ot ta
xed
at
the
time
of re
ceip
t in
the
hand
s of
the
reci
pien
t equ
ity sh
areh
olde
rs.
CIT
exe
mpt
ions
: (a
) agr
icul
tura
l inc
ome
(b
) for
eign
com
pani
es a
nd n
onre
side
nt in
divi
dual
s un
der a
n ag
reem
ent b
etw
een
the
cent
ral g
over
nmen
t an
d a
fore
ign
gove
rnm
ent o
r an
inte
rnat
iona
l or
gani
zatio
n;
(c) b
usin
ess i
ncom
e ar
isin
g fr
om sp
ecifi
ed so
urce
s (s
ee “
Tax
Ince
ntiv
es”)
; (d
) und
istri
bute
d fo
reig
n in
com
e of
a n
onre
side
nt
subs
idia
ry;
(e) l
ong-
term
cap
ital g
ains
on
sale
s of s
hare
s in
a go
vern
men
t app
rove
d en
terp
rise
who
lly e
ngag
ed in
sp
ecifi
ed in
fras
truct
ure
sect
ors,
subj
ect t
o fu
lfillm
ent
of p
resc
ribed
con
ditio
ns.
Dou
ble
taxa
tion
of fo
reig
n in
com
e is
avo
ided
th
roug
h tre
atie
s tha
t gen
eral
ly p
rovi
de fo
r ded
uctio
n of
the
low
er o
f for
eign
tax
or In
dian
tax
on th
e do
ubly
taxe
d in
com
e fr
om ta
x pa
yabl
e in
Indi
a in
the
case
of r
esid
ents
. Sim
ilar r
elie
f is a
llow
ed
unila
tera
lly w
here
no
treat
y ex
ists
. N
et o
pera
ting
loss
es m
ay n
ot b
e ca
rrie
d ba
ck. L
oss
carr
y fo
rwar
d is
allo
wed
as f
ollo
ws:
U
nabs
orbe
d de
prec
iatio
n
u
nlim
ited
Oth
er b
usin
ess a
nd c
apita
l los
ses
8
year
s
CIT
(in
clud
ing
surc
harg
e of
2.5
per
cent
):
- firm
35
per
cent
- d
omes
tic c
ompa
ny
35.8
75 p
erce
nt
- co-
oper
ativ
e so
ciet
ies
R
s. 0
– R
s. 10
,000
10
.25
perc
ent
R
s. 10
,000
- Rs.
20,0
0 0
20.
5 pe
rcen
t
Rs.
20,0
00-a
bove
35
.875
per
cent
- f
orei
gn c
ompa
ny
4
1 pe
rcen
t Ta
x on
cap
ital g
ains
:
- s
hort-
term
C
IT ra
te
- lon
g-te
rm
20.
5 pe
rcen
t
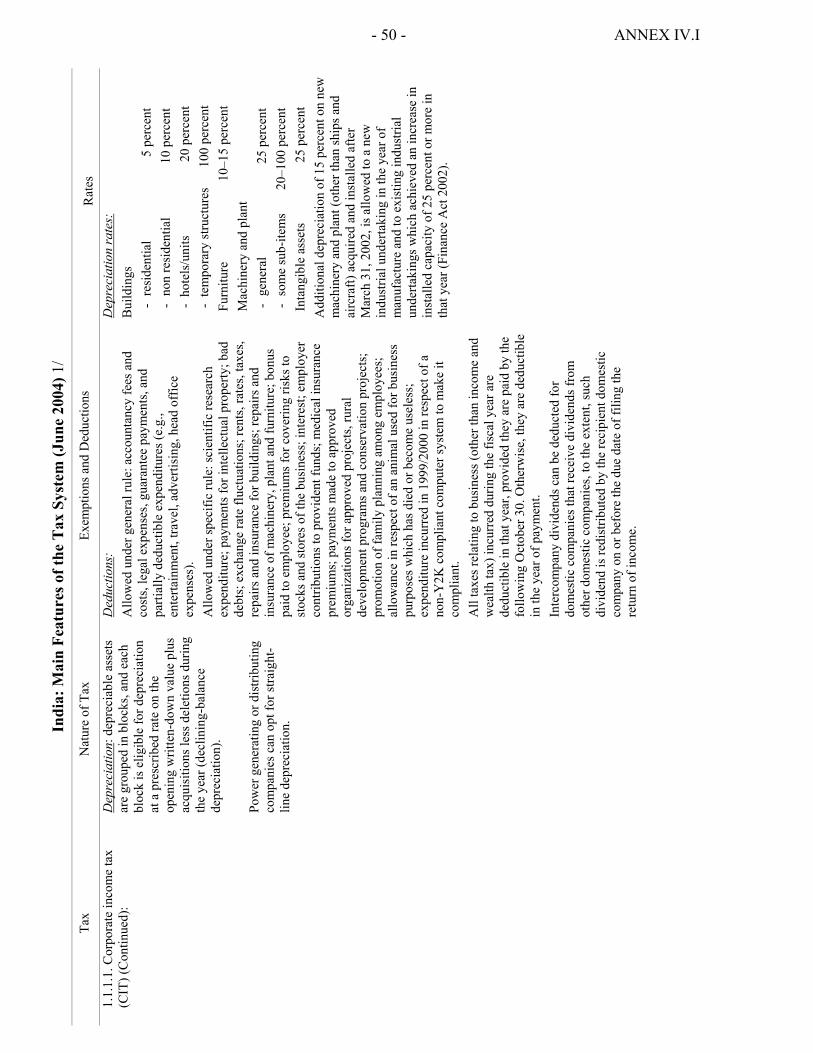
- 50 - ANNEX IV.I In
dia:
Mai
n Fe
atur
es o
f the
Tax
Sys
tem
(Jun
e 20
04) 1
/ Ta
x N
atur
e of
Tax
Ex
empt
ions
and
Ded
uctio
ns
R
ates
1.
1.1.
1. C
orpo
rate
inco
me
tax
(CIT
) (C
ontin
ued)
:
Dep
reci
atio
n : d
epre
ciab
le a
sset
s ar
e gr
oupe
d in
blo
cks,
and
each
bl
ock
is e
ligib
le fo
r dep
reci
atio
n at
a p
resc
ribed
rate
on
the
open
ing
writ
ten-
dow
n va
lue
plus
ac
quis
ition
s les
s del
etio
ns d
urin
g th
e ye
ar (d
eclin
ing-
bala
nce
depr
ecia
tion)
. Po
wer
gen
erat
ing
or d
istri
butin
g co
mpa
nies
can
opt
for s
traig
ht-
line
depr
ecia
tion.
Ded
uctio
ns:
Allo
wed
und
er g
ener
al ru
le: a
ccou
ntan
cy fe
es a
nd
cost
s, le
gal e
xpen
ses,
guar
ante
e pa
ymen
ts, a
nd
parti
ally
ded
uctib
le e
xpen
ditu
res (
e.g.
, en
terta
inm
ent,
trave
l, ad
verti
sing
, hea
d of
fice
expe
nses
).
Allo
wed
und
er sp
ecifi
c ru
le: s
cien
tific
rese
arch
ex
pend
iture
; pay
men
ts fo
r int
elle
ctua
l pro
perty
; bad
de
bts;
exc
hang
e ra
te fl
uctu
atio
ns; r
ents
, rat
es, t
axes
, re
pairs
and
insu
ranc
e fo
r bui
ldin
gs; r
epai
rs a
nd
insu
ranc
e of
mac
hine
ry, p
lant
and
furn
iture
; bon
us
paid
to e
mpl
oyee
; pre
miu
ms f
or c
over
ing
risks
to
stoc
ks a
nd st
ores
of t
he b
usin
ess;
inte
rest
; em
ploy
er
cont
ribut
ions
to p
rovi
dent
fund
s; m
edic
al in
sura
nce
prem
ium
s; p
aym
ents
mad
e to
app
rove
d or
gani
zatio
ns fo
r app
rove
d pr
ojec
ts, r
ural
de
velo
pmen
t pro
gram
s and
con
serv
atio
n pr
ojec
ts;
prom
otio
n of
fam
ily p
lann
ing
amon
g em
ploy
ees;
al
low
ance
in re
spec
t of a
n an
imal
use
d fo
r bus
ines
s pu
rpos
es w
hich
has
die
d or
bec
ome
usel
ess;
ex
pend
iture
incu
rred
in 1
999/
2000
in re
spec
t of a
no
n-Y
2K c
ompl
iant
com
pute
r sys
tem
to m
ake
it co
mpl
iant
. A
ll ta
xes r
elat
ing
to b
usin
ess (
othe
r tha
n in
com
e an
d w
ealth
tax)
incu
rred
dur
ing
the
fisca
l yea
r are
de
duct
ible
in th
at y
ear,
prov
ided
they
are
pai
d by
the
follo
win
g O
ctob
er 3
0. O
ther
wis
e, th
ey a
re d
educ
tible
in
the
year
of p
aym
ent.
Inte
rcom
pany
div
iden
ds c
an b
e de
duct
ed fo
r do
mes
tic c
ompa
nies
that
rece
ive
divi
dend
s fro
m
othe
r dom
estic
com
pani
es, t
o th
e ex
tent
, suc
h di
vide
nd is
redi
strib
uted
by
the
reci
pien
t dom
estic
co
mpa
ny o
n or
bef
ore
the
due
date
of f
iling
the
retu
rn o
f inc
ome.
Dep
reci
atio
n ra
tes:
B
uild
ings
-
resi
dent
ial
5
per
cent
-
non
resi
dent
ial
10
perc
ent
- ho
tels
/uni
ts
20
perc
ent
- te
mpo
rary
stru
ctur
es
10
0 pe
rcen
t F
urni
ture
10–1
5 pe
rcen
t M
achi
nery
and
pla
nt
- ge
nera
l 2
5 pe
rcen
t -
som
e su
b-ite
ms
2
0–10
0 pe
rcen
t I
ntan
gibl
e as
sets
25 p
erce
nt
A
dditi
onal
dep
reci
atio
n of
15
perc
ent o
n ne
w
mac
hine
ry a
nd p
lant
(oth
er th
an sh
ips a
nd
airc
raft)
acq
uire
d an
d in
stal
led
afte
r M
arch
31,
200
2, is
allo
wed
to a
new
in
dust
rial u
nder
taki
ng in
the
year
of
man
ufac
ture
and
to e
xist
ing
indu
stria
l un
derta
king
s whi
ch a
chie
ved
an in
crea
se in
in
stal
led
capa
city
of 2
5 pe
rcen
t or m
ore
in
that
yea
r (Fi
nanc
e A
ct 2
002)
.

- 51 - ANNEX IV.I In
dia:
Mai
n Fe
atur
es o
f the
Tax
Sys
tem
(Jun
e 20
04) 1
/ Ta
x N
atur
e of
Tax
Ex
empt
ions
and
Ded
uctio
ns
R
ates
1.
1.1.
2 M
inim
um a
ltern
ativ
e ta
x (M
AT)
B
oth
resi
dent
and
non
resi
dent
co
mpa
nies
are
liab
le to
pay
tax
on th
eir b
ook
prof
its w
here
the
tax
liabi
lity
of th
e ye
ar is
less
th
an 7
.5 p
erce
nt o
f the
adj
uste
d bo
ok p
rofit
s.
(a) s
ick
com
pani
es
(b) e
xpor
t pro
fits o
f und
erta
king
s set
up
in fr
ee-tr
ade
zone
s and
100
per
cent
exp
ort-o
rient
ed u
nder
taki
ngs
(dur
ing
the
tax
holid
ay p
erio
d)
(c) n
onta
xabl
e pr
ofits
from
the
expo
rt of
goo
ds a
nd
softw
are.
7.68
8 pe
rcen
t (in
clud
ing
2.5
perc
ent
surc
harg
e)
1.1.
2. W
ithho
ldin
g ta
xes
1.1.
2.1.
Res
iden
ts
Inco
me
earn
ed fr
om d
esig
nate
d so
urce
s (in
clud
ing
divi
dend
s, in
tere
st, r
oyal
ty, r
ent,
and
capi
tal
gain
s) is
subj
ect t
o w
ithho
ldin
g ta
x at
a v
arie
ty o
f rat
es.
The
tax
is w
ithhe
ld b
y th
e pe
rson
m
akin
g pa
ymen
ts to
the
reci
pien
t of
the
inco
me.
Re
side
nts (
in p
erce
nt):
In
tere
st
do
mes
tic c
ompa
ny
21
ot
her r
esid
ents
10.5
In
com
e fr
om:
lo
ttery
, cro
ssw
ord
puzz
les
3
1.5
ho
rse
race
s
31.
5
insu
ranc
e co
mm
issi
on
10
.5
fe
es fo
r sel
ecte
d se
rvic
es
5
.25
m
utua
l fun
ds a
nd U
TI u
nits
1
0.5
Lotte
ry ti
cket
sale
s com
mis
sion
s
10.5
N
on in
sura
nce
com
mis
sion
s
10.
5
Div
iden
ds
10.
5
Paym
ent t
o co
ntra
ctor
s:
1
–2
Ren
t
15
.75–
21
Any
oth
er in
com
e
21

- 52 - ANNEX IV.I In
dia:
Mai
n Fe
atur
es o
f the
Tax
Sys
tem
(Jun
e 20
04) 1
/ Ta
x N
atur
e of
Tax
Ex
empt
ions
and
Ded
uctio
ns
R
ates
1.
1.2.
2. N
onre
side
nts
Inco
me
earn
ed fr
om d
esig
nate
d so
urce
s (in
clud
ing
divi
dend
s, in
tere
st, r
oyal
ty, a
nd re
nt) i
s su
bjec
t to
with
hold
ing
tax
at a
va
riety
of r
ates
. Th
e ta
x is
with
held
by
the
pers
on
mak
ing
paym
ents
to th
e re
cipi
ent
of th
e in
com
e.
Som
e ta
x tre
atie
s pro
vide
for l
ower
with
hold
ing
rate
s fr
om c
erta
in ty
pes o
f inc
ome
(div
iden
ds, i
nter
est,
roya
lties
, tec
hnic
al se
rvic
e fe
es).
Non
resi
dent
com
pany
: G
ener
al ra
tes (
in p
erce
nt):
Roy
altie
s fro
m a
n ag
reem
ent c
oncl
uded
be
twee
n 19
61–1
976
52.
5
Tech
nica
l ser
vice
fees
fro
m a
n ag
reem
ent
conc
lude
d be
twee
n 19
54-1
976
52
.5
Oth
er in
com
e
42
Sp
ecifi
c ra
tes (
in p
erce
nt):
Div
iden
ds o
ther
than
div
iden
ds fr
om In
dian
co
mpa
nies
21
Inte
rest
on
fore
ign
curr
ency
loan
s
21
Lo
ng te
rm c
apita
l gai
ns
21
Inco
me
dist
ribut
ions
from
fore
ign
curr
ency
un
its h
eld
in a
ppro
ved
mut
ual f
unds
or t
he
UTI
10.
5–21
In
com
e di
strib
utio
ns fr
om b
onds
or G
loba
l D
epos
itory
Rec
eipt
s pur
chas
ed in
fore
ign
curr
ency
10
.5
Inco
me
rece
ived
by
spec
ified
fore
ign
finan
cial
inst
itutio
ns fr
om li
sted
secu
ritie
s:
Sh
ort-t
erm
cap
ital g
ains
3
1.5
Lo
ng-te
rm c
apita
l gai
ns
10.
5
Oth
er in
com
e
2
1 R
oyal
ties/
tech
nica
l ser
vice
fees
in re
spec
t of
an a
ppro
ved
agre
emen
t con
clud
ed b
etw
een:
1976
-199
7
31
.5
A
fter 1
997
21
Oth
er n
onre
side
nts:
Inte
rest
21
Lo
ng te
rm c
apita
l gai
ns
2
1 In
com
e di
strib
utio
ns a
risin
g fr
om G
loba
l D
epos
itory
Rec
eipt
s
10.
5
Ren
t
15.
75
Any
oth
er in
com
e
31.5

- 53 - ANNEX IV.I In
dia:
Mai
n Fe
atur
es o
f the
Tax
Sys
tem
(Jun
e 20
04) 1
/ Ta
x N
atur
e of
Tax
Ex
empt
ions
and
Ded
uctio
ns
R
ates
1.
1.3.
In
divi
dual
s 1.
1.3.
1. In
divi
dual
inco
me
tax
(IIT
)
Res
iden
ts a
re ta
xed
on th
eir
wor
ldw
ide
inco
me,
exc
ept f
or
thos
e w
ho a
re n
ot o
rdin
arily
re
side
nt in
Indi
a. S
uch
a re
side
nt
is ta
xed
like
a no
nres
iden
t but
is
also
liab
le to
tax
on in
com
e ac
crui
ng a
broa
d if
it is
from
a
busi
ness
con
trolle
d or
a
prof
essi
on se
t-up
in In
dia.
N
onre
side
nts a
re ta
xed
only
on
inco
me
that
is re
ceiv
ed in
Indi
a or
that
acc
rues
or i
s dee
med
to
accr
ue in
Indi
a.
Empl
oyee
gro
ss in
com
e A
n in
divi
dual
’s e
ntire
re
mun
erat
ion
(incl
udin
g be
nefit
s in
kin
d va
lued
as p
er th
e ta
x ru
les)
rece
ived
from
an
empl
oyer
is
taxa
ble.
Inco
me
tax
is w
ithhe
ld
from
sala
ries.
Cap
ital g
ains
and
inve
stm
ent
inco
me:
Sh
ort-t
erm
cap
ital g
ains
are
ag
greg
ated
with
taxa
ble
inco
me,
w
hich
is ta
xed
at th
e ap
plic
able
ra
tes.
Long
-term
cap
ital g
ains
are
de
term
ined
afte
r adj
ustin
g co
sts
by p
resc
ribed
infla
tion
fact
ors.
Long
-term
cap
ital l
osse
s can
be
set o
ff o
nly
agai
nst l
ong-
term
ca
pita
l gai
ns. S
hort-
term
cap
ital
loss
es c
an b
e se
t off
aga
inst
long
-te
rm a
s wel
l as s
hort-
term
cap
ital
gain
s.
Exem
ptio
ns:
Empl
oyee
gro
ss in
com
e:
a. T
he ta
x pa
id b
y th
e em
ploy
er o
n no
nmon
etar
y pe
rqui
site
s pro
vide
d to
the
empl
oyee
in th
e ha
nds o
f th
e em
ploy
ee (F
inan
ce A
ct, 2
002)
. b.
Reg
ardi
ng e
mpl
oyee
s sto
ck o
ptio
n pl
ans o
r sc
hem
es, i
f the
pla
n/sc
hem
e is
in a
ccor
danc
e w
ith
gove
rnm
ent g
uide
lines
, the
taxa
ble
even
t will
occ
ur
only
at t
he ti
me
of sa
le o
f sha
res.
Any
gai
ns a
re
taxe
d as
cap
ital g
ains
at t
he ti
me
of e
xerc
ise.
c.
leav
e pa
ssag
e w
ithin
Indi
a, re
imbu
rsem
ent o
f m
edic
al e
xpen
ses a
nd c
erta
in re
tirem
ent b
enef
its.
d. fo
reig
n em
ploy
ees o
f a fo
reig
n en
terp
rise
who
are
no
t pre
sent
in In
dia
for m
ore
than
90
days
in a
yea
r fo
r rem
uner
atio
n re
ceiv
ed fr
om th
e fo
reig
n em
ploy
er
for s
ervi
ces p
erfo
rmed
in In
dia,
pro
vide
d th
e fo
reig
n en
terp
rise
is n
ot e
ngag
ed in
any
trad
e or
bus
ines
s in
Indi
a an
d pr
ovid
ed th
e re
mun
erat
ion
is n
ot
dedu
ctib
le in
com
putin
g th
e em
ploy
er’s
taxa
ble
inco
me
in In
dia.
e.
Spe
cifie
d in
com
e of
a fo
reig
n ci
tizen
and
a p
erso
n w
ho is
not
ord
inar
ily re
side
nt, i
f he/
she
is e
ngag
ed
with
the
appr
oval
of t
he p
resc
ribed
aut
horit
y to
re
nder
tech
nica
l ser
vice
s und
er a
n ag
reem
ent e
nter
ed
into
by
an in
tern
atio
nal o
rgan
izat
ion
with
the
gove
rnm
ent o
f Ind
ia a
nd fu
nded
by
the
gove
rnm
ent
of a
fore
ign
stat
e.
f. ag
ricul
tura
l inc
ome
Cap
ital g
ains
and
inve
stm
ent i
ncom
e: In
com
e fr
om
spec
ified
inve
stm
ents
is e
xem
pt, u
p to
cer
tain
lim
its.
Inco
me
brac
kets
and
IIT
rate
s:
R
s. 0–
Rs.
50,0
00
N
il
Rs.
50,0
00–R
s. 60
,000
1
0 pe
rcen
t
Rs.
60,0
00–R
s. 15
0,00
0
Rs.
1,00
0 pl
us
21%
of i
ncom
e in
exc
ess o
f Rs.
60,0
00
R
s. 15
0,00
0–an
d ab
ove
R
s. 19
,000
plu
s 31
.5%
on
inco
me
in e
xces
s of R
s. 15
0,00
0 Th
e hi
ghes
t mar
gina
l rat
e fo
r ind
ivid
uals
w
ith a
gric
ultu
ral i
ncom
e ho
wev
er c
an d
iffer
. H
owev
er, i
f an
indi
vidu
al h
as a
gric
ultu
ral
inco
me
exce
edin
g R
s. 5,
000
in a
dditi
on to
to
tal i
ncom
e, a
nd to
tal i
ncom
e ex
clud
ing
agric
ultu
ral i
ncom
e ex
ceed
s the
ann
ual
exem
ptio
n, a
gric
ultu
ral i
ncom
e is
take
n in
to
acco
unt t
o de
term
ine
the
high
est m
argi
nal
rate
. A
5%
tax
surc
harg
e of
the
tax
liabi
lity
appl
ies f
or re
side
nts w
hose
taxa
ble
inco
me
exce
eds R
s. 60
,000
. Ta
x on
cap
ital g
ains
:
- sho
rt-te
rm
II
T ra
te
- lon
g-te
rm
2
1 pe
rcen
t

- 54 - ANNEX IV.I In
dia:
Mai
n Fe
atur
es o
f the
Tax
Sys
tem
(Jun
e 20
04) 1
/ Ta
x N
atur
e of
Tax
Ex
empt
ions
and
Ded
uctio
ns
R
ates
1.
1.3.
1. I
ndiv
idua
l inc
ome
tax
(IIT
) (C
ontin
ued)
Ded
uctio
ns a
re a
llow
ed u
p to
ce
rtain
lim
its.
Ded
uctio
ns:
a. B
usin
ess-
conn
ecte
d ex
pens
es, d
epen
ding
on
sala
ry
draw
n:
les
s tha
n R
s. 15
0,00
0
33.3
3 pe
rcen
t of
the
sala
ry o
r Rs.
30,0
00, w
hich
ever
is le
ss
R
s. 15
0,00
0–R
s. 30
0,00
0
R
s. 25
,000
Rs.
300,
000–
Rs.
500,
000
Rs.
20,0
00
R
s. 50
0,00
0–ab
ove
N
il b.
app
rove
d ch
arita
ble
cont
ribut
ions
, med
ical
in
sura
nce
prem
ium
s, an
d to
a li
mite
d ex
tent
, ch
ildre
n’s’
edu
catio
n/ho
stel
allo
wan
ce re
ceiv
ed fr
om
the
empl
oyer
(up
to c
erta
in li
mits
).
c. c
erta
in a
llow
ance
s in
conn
ectio
n w
ith a
pos
ting
in
spec
ified
hill
y, b
orde
r, re
mot
e, o
r trib
al a
reas
(up
to
certa
in li
mits
). d.
pro
fess
iona
l tax
es im
pose
d by
cer
tain
stat
es.
Ta
x re
bate
s are
allo
wed
on
spec
ified
inve
stm
ents
from
the
gros
s tax
up
to a
max
imum
of
Rs.
20,0
00 (R
s. 15
,000
if g
ross
to
tal i
ncom
e is
bet
wee
n R
s. 15
0,00
0 an
d R
s. 50
0,00
0),
out o
f whi
ch th
e re
bate
in e
xces
s of
Rs.
14,0
00 (R
s. 10
,500
if g
ross
to
tal i
ncom
e is
bet
wee
n R
s. 15
0,00
0 an
d R
s. 50
0,00
0)
mus
t be
out o
f inv
estm
ent i
n in
fras
truct
ure.
Spec
ified
inve
stm
ents
incl
ude:
am
ount
s pai
d fo
r life
in
sura
nce
prem
ium
s, sp
ecifi
ed sc
hem
es,
cont
ribut
ions
to sp
ecifi
ed p
rovi
dent
fund
s, lo
ng-te
rm
inve
stm
ents
, am
ount
s spe
nt o
n co
nstru
ctio
n/pu
rcha
se
of a
resi
dent
ial h
ouse
, or r
epay
men
t of c
erta
in lo
ans,
and
subs
crip
tions
to sp
ecifi
ed in
fras
truct
ure
bond
s.
Tax
reba
te ra
tes:
G
ross
tota
l inc
ome
R
s. 15
0,00
0 or
less
20
perc
ent
Rs.
100,
000
or le
ss in
spec
ified
ci
rcum
stan
ces
3
0 pe
rcen
t
R
s. 15
0,00
0–R
s. 50
0,00
0
1
5 pe
rcen
t
1.1.
3.2.
Loc
al ta
xes o
n in
com
e Pr
ofes
sion
al ta
xes i
mpo
sed
by
certa
in st
ates
are
min
imal
and
are
de
duct
ible
in c
ompu
ting
taxa
ble
inco
me.

- 55 - ANNEX IV.I In
dia:
Mai
n Fe
atur
es o
f the
Tax
Sys
tem
(Jun
e 20
04) 1
/ Ta
x N
atur
e of
Tax
Ex
empt
ions
and
Ded
uctio
ns
R
ates
1.
2. T
ax in
cent
ives
: 1.
2.1.
Inw
ard
inve
stm
ent
An
initi
al p
erio
d of
tax
holid
ay,
follo
wed
by
reba
tes a
t a
decr
easi
ng p
erce
ntag
e in
late
r ye
ars,
is a
llow
ed to
Indi
an
com
pani
es. T
he fu
ll ta
x ex
empt
ion
perio
d, a
s wel
l as t
he
num
ber o
f ini
tial a
nd la
ter y
ears
va
ries f
rom
sect
or to
sect
or.
Expo
rt co
nces
sion
s are
als
o gr
ante
d to
spec
ified
com
pani
es.
a. N
ew in
dust
rial u
nder
taki
ngs l
ocat
ed in
spec
ific
“bac
kwar
d” st
ates
and
dis
trict
s. D
istri
cts a
re
clas
sifie
d in
cat
egor
y A
or B
dep
endi
ng o
n le
vel o
f in
fras
truct
ure
deve
lopm
ent.
b. H
otel
s sat
isfy
ing
pres
crib
ed c
ondi
tions
. c.
Und
erta
king
s eng
aged
in d
evel
opin
g an
d bu
ildin
g a
hous
ing
proj
ect,
scie
ntifi
c re
sear
ch, c
omm
erci
al
prod
uctio
n, o
r ref
inin
g of
min
eral
oil
or se
tting
up
and
oper
atin
g a
cold
cha
in fo
r agr
icul
tura
l pro
duce
or
eng
aged
in th
e in
tegr
ated
bus
ines
s of h
andl
ing,
st
orag
e, a
nd tr
ansp
orta
tion
of fo
od o
r gra
ins,
subj
ect
to fu
lfillm
ent o
f pre
scrib
ed c
ondi
tions
. d.
Und
erta
king
s eng
aged
in b
uild
ing,
ow
ning
, and
op
erat
ing
a m
ultip
les t
heat
er o
r con
vent
ion
cent
er
satis
fyin
g pr
escr
ibed
con
ditio
ns (e
xten
ded
unde
r the
Fi
nanc
e A
ct, 2
002)
e.
Pow
er g
ener
atin
g or
dis
tribu
ting
com
pani
es,
ente
rpris
es p
rovi
ding
tele
com
mun
icat
ion
serv
ices
, or
deve
lopi
ng o
r ope
ratin
g an
d m
aint
aini
ng a
not
ified
in
fras
truct
ure
faci
lity
or a
n in
dust
rial p
ark
or sp
ecia
l ec
onom
ic z
one
f.
Expo
rt pr
ofits
of n
ew in
dust
rial u
nder
taki
ng
satis
fyin
g pr
escr
ibed
con
ditio
ns e
stab
lishe
d in
a fr
ee-
trade
zon
e, so
ftwar
e te
chno
logy
par
k, o
r ele
ctro
nic
hard
war
e te
chno
logy
par
k, o
r 100
per
cent
exp
ort-
orie
nted
und
erta
king
g.
Exp
orts
of n
ew u
nder
taki
ngs e
ngag
ed in
the
man
ufac
ture
or p
rodu
ctio
n of
arti
cles
or c
ompu
ter
softw
ares
in a
ny sp
ecia
l eco
nom
ic z
one.
Shar
e of
pro
fits e
xem
pt fr
om ta
x (in
per
cent
): a.
for c
ompa
nies
: C
ateg
ory
A d
istri
cts:
Firs
t 5 y
ears
of o
pera
tion
100
Nex
t 5 y
ears
30
Cat
egor
y B
dis
trict
s:
Fi
rst 3
yea
rs o
f ope
ratio
n
1
00
N
ext 5
yea
rs
30
b.
Sam
e as
a.
c.
Firs
t 5-1
0 ye
ars
100
Fol
low
ing
year
s
30/5
0/10
0
Lat
er y
ears
30
d. F
irst 5
yea
rs
50
e. A
ny 1
0 co
nsec
utiv
e ye
ars f
allin
g w
ithin
th
e fir
st 1
5 ye
ars o
f ope
ratio
n (2
0 ye
ars i
n th
e ca
se o
f inf
rast
ruct
ure
proj
ects
exc
ept p
orts
, ai
rpor
ts, i
nlan
d w
ater
way
s, an
d in
land
po
rts)
1
00
f. Fi
rst 1
0 ye
ars
90
Th
is e
xem
ptio
n is
onl
y av
aila
ble
until
ta
xpay
er’s
fina
ncia
l yea
r 200
8–09
g.
Firs
t 5 y
ears
1
00
F
ollo
win
g 2
year
s
5
0

- 56 - ANNEX IV.I In
dia:
Mai
n Fe
atur
es o
f the
Tax
Sys
tem
(Jun
e 20
04) 1
/ Ta
x N
atur
e of
Tax
Ex
empt
ions
and
Ded
uctio
ns
R
ates
1.
2.2.
Oth
er ta
x in
cent
ives
O
ther
exe
mpt
ions
and
ded
uctio
ns
are
allo
wed
to In
dian
com
pani
es
and
othe
r res
iden
ts.
Exem
ptio
ns:
a. E
xpor
t of g
oods
(oth
er th
an m
iner
al o
ils, s
peci
fied
min
eral
s, an
d or
es) a
nd c
ompu
ter s
oftw
are
(incl
udin
g te
chni
cal s
ervi
ces p
rovi
ded
outs
ide
Indi
a fo
r its
dev
elop
men
t or p
rodu
ctio
n), w
here
pro
ceed
s ar
e re
ceiv
ed w
ithin
a sp
ecifi
ed ti
me
in c
onve
rtibl
e fo
reig
n ex
chan
ge o
r exp
orts
of f
ilm, t
elev
isio
n,
mus
ic, t
elev
isio
n ne
ws,
softw
are
or te
leca
stin
g rig
hts,
subj
ect t
o fu
lfillm
ent o
f pre
scrib
ed c
ondi
tions
. b.
Pro
fits o
f new
indu
stria
l und
erta
king
s set
up
in
notif
ied
deve
lopm
ent c
ente
rs lo
cate
d in
the
Nor
th-
East
regi
on
Ded
uctio
ns:
c. In
com
e re
ceiv
ed in
con
verti
ble
fore
ign
exch
ange
fr
om fo
reig
n go
vern
men
ts o
r for
eign
ent
erpr
ises
for
the
use
outs
ide
Indi
a of
any
pat
ent,
desi
gn, o
r re
gist
ered
trad
emar
k.
d. P
rofit
s der
ived
from
the
cons
truct
ion
of a
ny
build
ing,
dam
, roa
d, b
ridge
, or o
ther
stru
ctur
e ou
tsid
e In
dia,
or t
he a
ssem
bly
or in
stal
latio
n of
m
achi
nery
or p
lant
out
side
Indi
a, if
the
proc
eeds
are
re
ceiv
ed in
con
verti
ble
fore
ign
exch
ange
with
in a
sp
ecifi
ed ti
me.
In
the
case
of a
ppro
ved
hote
ls, p
rofit
fr
om se
rvic
es to
fore
ign
tour
ists
that
are
ear
ned
in
conv
ertib
le fo
reig
n ex
chan
ge, s
ubje
ct to
pre
scrib
ed
cond
ition
s.
Exem
ptio
n ra
tes (
in p
erce
nt):
a. T
hese
con
cess
ions
are
onl
y av
aila
ble
until
fin
anci
al y
ear 2
003-
04 in
a p
hase
d-ou
t m
anne
r: p
rior t
o FY
2000
–01
100
F
Y20
00–0
1
80
FY
2001
–02
7
0 F
Y20
02–0
3
50
FY
2003
–04
3
0 F
ollo
win
g ye
ars
Nil
b.
Firs
t 10
year
s
1
00
Rat
es o
f ded
uctio
n (in
per
cent
): c.
FY
2002
–03
20
F
Y 2
003–
04
1
0
Fol
low
ing
year
s
Nil
d. S
ame
as c
.
1.3.
Oth
er ta
xes o
n ca
pita
l and
pr
oper
ty
1.3.
1. L
and
tax
Impo
sed
by th
e st
ates
on
the
valu
e of
land
. The
loca
l au
thor
ities
can
impo
se a
su
rcha
rge
(“la
nd c
esse
s”).
M
etho
ds o
f val
uatio
n an
d ra
tes v
ary
from
st
ate
to st
ate.
1.3.
2. T
ax o
n la
nd a
nd b
uild
ings
Im
pose
d by
the
loca
l aut
horit
ies
base
d on
the
annu
al re
ntal
val
ue.

- 57 - ANNEX IV.I In
dia:
Mai
n Fe
atur
es o
f the
Tax
Sys
tem
(Jun
e 20
04) 1
/ Ta
x N
atur
e of
Tax
Ex
empt
ions
and
Ded
uctio
ns
R
ates
1.
3.3.
Bet
term
ent t
axes
Im
pose
d by
loca
l aut
horit
ies
base
d on
incr
ease
s in
land
val
ues
caus
ed b
y to
wn
plan
ning
and
to
wn
impr
ovem
ent.
1.3.
4. T
axes
on
the
trans
fer o
f im
mov
able
pro
perty
Le
vied
by
loca
l aut
horit
ies b
ased
on
the
valu
e of
pro
perty
.
1.3.
6. T
ax o
n m
otor
veh
icle
s Im
pose
d by
the
stat
es
1.4.
Wea
lth ta
x
Bas
ed o
n th
e re
sidi
ng p
rinci
ple.
The
first
Rs.
1.5
mill
ion
of n
et w
ealth
is e
xem
pt.
1% o
f the
val
ue o
f spe
cifie
d ne
t ass
ets
exce
edin
g in
the
aggr
egat
e R
s. 1.
5 m
illio
n.
2.
Indi
rect
Tax
es
2.1
Cus
tom
s dut
y
Spec
ific
rate
and
/or a
d va
lore
m
dutie
s are
impo
sed
on e
xpor
ts a
nd
impo
rts.
Impo
rt du
ties :
- b
asic
cus
tom
s dut
y, le
vied
on
item
s lis
ted
in th
e Fi
rst S
ched
ule
of th
e C
usto
ms T
ariff
Act
197
5.
- add
ition
al d
uty
of c
usto
ms
(“co
unte
rvai
ling
duty
”), e
quiv
alen
t to
the
exci
se d
uty
impo
sed
on
good
s pro
duce
d or
man
ufac
ture
d in
Indi
a.
- oth
er d
utie
s (an
ti-du
mpi
ng,
safe
guar
d du
ty to
rest
rain
ex
cess
ive
impo
rts th
at m
ay a
ffec
t lo
cal i
ndus
tries
) Ex
port
dutie
s :
- cus
tom
dut
y, le
vied
on
item
s lis
ted
in th
e Se
cond
Sch
edul
e of
th
e C
usto
ms T
ariff
Act
197
5.
Exem
ptio
ns:
(a) G
oods
in tr
ansi
t or b
eing
tran
sshi
pped
via
Indi
a (b
) War
ehou
sing
faci
lity
(allo
ws i
mpo
rted
good
s the
n us
ed in
the
man
ufac
ture
of e
xpor
t goo
ds to
be
exem
pt fo
r a sp
ecifi
c pe
riod
of ti
me)
(c
) Exp
ort p
rom
otio
n sc
hem
es (a
llow
for g
oods
whi
ch
will
be
used
in a
man
ufac
turin
g ac
tivity
to b
e im
porte
d fr
ee fr
om c
usto
ms d
uty,
pro
vide
d th
e m
anuf
actu
red
prod
uct i
s exp
orte
d).
Basi
c cu
stom
s dut
y :
vary
ing
rate
s for
di
ffer
ent g
oods
Ad
ditio
nal d
uty
of c
usto
ms:
sam
e as
co
rres
pond
ing
exci
se d
uty
rate
Th
e cu
stom
s val
ue is
the
trans
actio
n va
lue.

- 58 - ANNEX IV.I In
dia:
Mai
n Fe
atur
es o
f the
Tax
Sys
tem
(Jun
e 20
04) 1
/ Ta
x N
atur
e of
Tax
Ex
empt
ions
and
Ded
uctio
ns
R
ates
2.
2. E
xcis
e ta
x Le
vied
on
good
s pro
duce
d or
m
anuf
actu
red
in In
dia
as:
- a b
asic
exc
ise
duty
kno
wn
as th
e ce
ntra
l val
ue a
dded
tax
(CEN
VA
T); a
nd
- a sp
ecia
l exc
ise
duty
, in
addi
tion
to C
ENV
AT,
on
spec
ified
goo
ds.
The
tax
is a
dmin
iste
red
by th
e ce
ntra
l gov
ernm
ent,
via
the
Cen
tral
Boa
rd o
f Exc
ise
and
Cus
tom
s. Th
e du
ty m
ust b
e pa
id b
y th
e m
anuf
actu
rer a
t the
tim
e of
re
mov
al o
f goo
ds fr
om h
is fa
ctor
y pr
emis
es o
r war
ehou
se, t
he ta
xabl
e ba
se b
eing
the
who
lesa
le p
rice
of
the
good
s man
ufac
ture
d.
CEN
VAT
cred
it: A
mod
ified
val
ue
adde
d ta
x (M
OD
VA
T) w
as
intro
duce
d in
198
6 to
pre
vent
ca
scad
ing
of e
xcis
e du
ty a
nd
doub
le ta
xatio
n. U
nder
this
sc
hem
e, a
man
ufac
ture
r of
exci
sabl
e go
ods r
ecei
ves a
cre
dit
for t
he d
uty
paid
on
spec
ified
in
puts
and
cap
ital g
oods
und
er
cond
ition
s spe
cifie
d in
CEN
VA
T C
redi
t Rul
es 2
002.
C
redi
t is a
lso
avai
labl
e fo
r ad
ditio
nal c
usto
ms d
uty
(cou
nter
vaili
ng d
uty)
pai
d on
im
porte
d ca
pita
l goo
ds a
nd in
puts
.
Exem
ptio
ns:
(a) S
mal
l sca
le in
dust
ries u
p to
the
spec
ified
val
ue o
f go
ods c
lear
ed.
(b) G
oods
pro
duce
d or
man
ufac
ture
d in
Spe
cial
Ec
onom
ic Z
ones
. N
o cr
edit
of e
xcis
e ta
x is
ava
ilabl
e on
inpu
ts if
the
rela
ted
final
pro
duct
s are
exe
mpt
unl
ess t
hey
are
expo
rted.
Bas
ic e
xcis
e du
ty (i
tem
s lis
ted
in th
e Fi
rst
Sche
dule
of t
he C
entra
l Exc
ise
Tarif
f A
ct 1
986)
:
G
ener
al
16 p
erce
nt
Spec
ified
item
s
“N
il” o
r 8 p
erce
nt
Spec
ial e
xcis
e du
ty (l
evie
d on
item
s lis
ted
in th
e Se
cond
Sch
edul
e of
the
Cen
tral
Exci
se T
ariff
Act
198
6):
Gen
eral
8
perc
ent
Sepa
rate
rate
s are
app
licab
le fo
r pet
rol,
dies
el, a
nd to
bacc
o pr
oduc
ts.
Ces
s (su
rcha
rge)
:
var
ying
rate
s
2.
2. S
ales
tax
All
stat
es im
pose
sale
s tax
on
virtu
ally
all
sale
s of g
oods
. Eac
h st
ate
has i
ts o
wn
sale
s tax
act
. St
ate
sale
s tax
es a
re g
ener
ally
si
ngle
-poi
nt ta
xes.
In m
ost s
tate
s, th
e ta
x is
impo
sed
on th
e fir
st p
oint
of
sale
s. In
cer
tain
stat
es, t
he ta
x is
le
vied
at t
he p
oint
of l
ast s
ale
of
good
s. In
cer
tain
oth
er st
ates
, the
Stat
e sa
les t
ax:
(a) e
xpor
t sal
es
(b) g
oods
spec
ified
und
er th
e lo
cal A
ct o
f the
stat
e C
ST e
xem
ptio
ns:
(a) g
oods
unc
ondi
tiona
lly e
xem
pt fr
om ta
x un
der t
he
loca
l Act
of t
he st
ate.
CST
rate
s:
(a) S
ale
to th
e go
vern
men
t: th
e lo
wer
of
4% o
r the
pre
vaili
ng st
ate
sale
s tax
(b
) Sal
e to
regi
ster
ed d
eale
rs o
f goo
ds
incl
uded
in th
e re
gist
ratio
n ce
rtifi
cate
: the
lo
wer
of 4
per
cent
or t
he p
reva
iling
stat
e sa
les t
ax ra
te

- 59 - ANNEX IV.I In
dia:
Mai
n Fe
atur
es o
f the
Tax
Sys
tem
(Jun
e 20
04) 1
/ Ta
x N
atur
e of
Tax
Ex
empt
ions
and
Ded
uctio
ns
R
ates
ta
x is
a m
ulti-
stag
e ta
x.
The
cent
ral g
over
nmen
t im
pose
s a
cent
ral s
ales
tax
(CST
) on
inte
rsta
te sa
les,
whi
ch is
levi
ed in
th
e st
ate
in w
hich
the
mov
emen
t of
good
s com
men
ces (
CST
A
ct, 1
956)
. The
reve
nue
is
adm
inis
tere
d by
the
stat
e in
whi
ch
it is
levi
ed. E
very
dea
ler l
iabl
e to
pa
y ta
x un
der t
he C
ST A
ct m
ust b
e re
gist
ered
. The
CST
pay
able
is
dete
rmin
ed b
y ap
plyi
ng th
e ap
prop
riate
tax
rate
to th
e de
aler
’s
turn
over
.
(b) a
ny su
bseq
uent
sale
(afte
r a ta
xabl
e in
ters
tate
sa
le) o
f the
sam
e go
ods d
urin
g th
e m
ovem
ent i
n in
ters
tate
trad
e.
(c) c
onsi
gnm
ent/b
ranc
h tra
nsfe
rs.
(d) s
ales
of i
mm
ovab
le p
rope
rty, n
ewsp
aper
s, sh
ares
, st
ock,
secu
ritie
s, an
d ac
tiona
ble
clai
ms.
(e
) sal
es o
f goo
ds fr
om d
omes
tic ta
riff a
rea
to u
nits
lo
cate
d in
spec
ial e
cono
mic
zon
es.
(c) S
ale
of d
ecla
red
good
s to
unre
gist
ered
de
aler
s: d
oubl
e th
e ra
te o
f sta
te sa
les t
ax
appl
icab
le to
sim
ilar g
oods
(d
) Sal
e of
goo
ds, o
ther
than
dec
lare
d go
ods t
o un
regi
ster
ed d
eale
rs: t
he h
ighe
r of
10
perc
ent o
r the
pre
vaili
ng st
ate
sale
s ta
x.
2.
3. S
ervi
ce ta
x
Serv
ice
tax
is le
vied
on
certa
in
type
s of s
ervi
ces r
ende
red
(yea
r w
hen
the
tax
beca
me
appl
icab
le in
br
acke
ts):
(a) b
roke
rage
fees
(199
4)
(b) i
nsur
ance
pre
miu
ms
(199
4, 2
001
for l
ife in
sura
nce)
(c
) tel
ecom
mun
icat
ions
(199
4)
(d) a
dver
tisin
g, p
ager
s, an
d co
urie
rs (1
996)
(e
) cus
tom
s hou
se a
gent
s (19
96)
(f) a
ir tra
vel a
gent
s (19
97)
(g) r
eal e
stat
e ag
ents
(199
8)
(h) e
ngin
eerin
g co
nsul
ting
(199
7)
(i) m
anag
emen
t con
sulta
nts (
1998
) (j)
ban
king
and
oth
er fi
nanc
ial
serv
ices
(200
1)
(k) b
road
cast
ing
(200
1)
(l) p
orts
(200
1)
(l) p
orts
(200
1)
(m) b
eaut
y, h
ealth
and
fitn
ess
Indi
an st
ates
of J
amm
u an
d K
ashm
ir ar
e ex
empt
. O
ther
exe
mpt
ions
: (a
) ser
vice
s pai
d fo
r in
conv
ertib
le fo
reig
n ex
chan
ge
(b) b
road
cast
ing
serv
ices
pro
vide
d by
cab
le T
V
oper
ator
s (c
) con
sulti
ng e
ngin
eer s
ervi
ces i
n re
spec
t of
com
pute
r sof
twar
e (d
) vid
eo ta
pe p
rodu
ctio
n (e
) life
insu
ranc
e se
rvic
es o
ther
than
pre
miu
ms
(f) s
peci
fied
insu
ranc
e sc
hem
es
(g) s
peci
fied
acco
untin
g an
d au
ditin
g se
rvic
es
(h) v
ario
us se
rvic
es re
nder
ed to
dip
lom
atic
mis
sion
s, th
e U
N, i
nter
natio
nal o
rgan
izat
ions
. Th
e Se
rvic
e Ta
x C
redi
t Rul
es 2
002
allo
w th
e ut
iliza
tion
of c
redi
ts w
ithin
the
sam
e ca
tego
ry o
f se
rvic
es.
A u
nifo
rm 8
per
cent
.
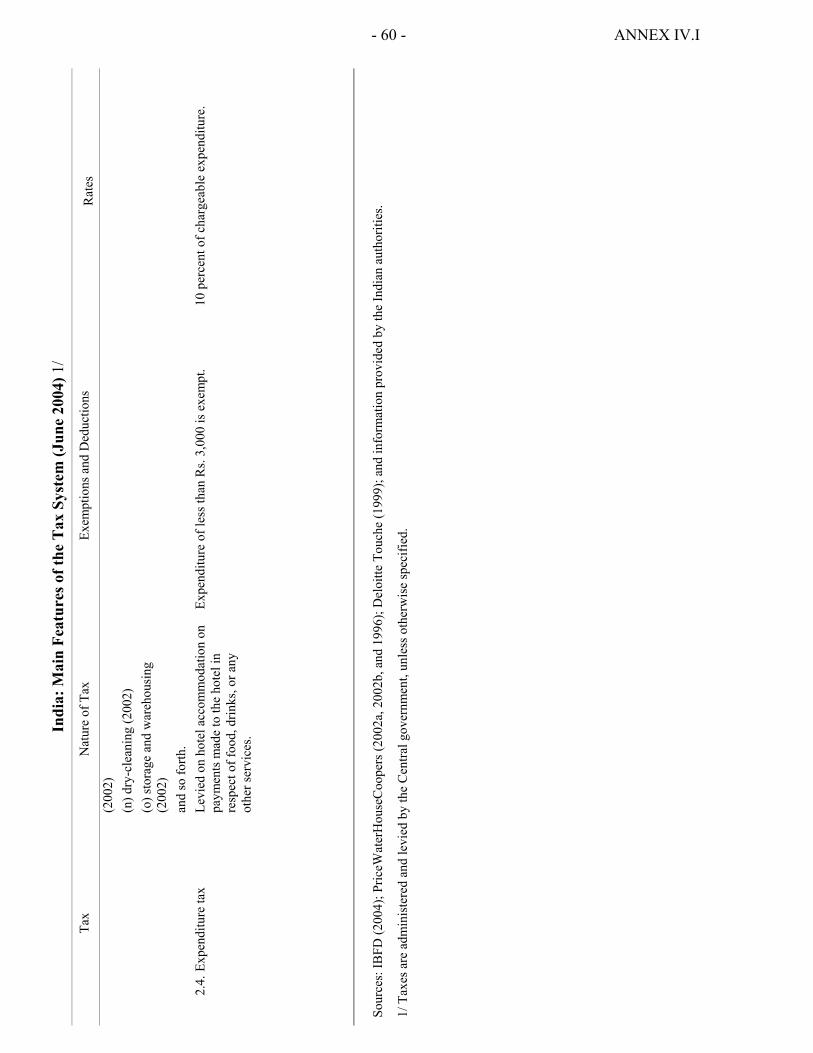
- 60 - ANNEX IV.I In
dia:
Mai
n Fe
atur
es o
f the
Tax
Sys
tem
(Jun
e 20
04) 1
/ Ta
x N
atur
e of
Tax
Ex
empt
ions
and
Ded
uctio
ns
R
ates
(2
002)
(n
) dry
-cle
anin
g (2
002)
(o
) sto
rage
and
war
ehou
sing
(2
002)
an
d so
forth
.
2.4.
Exp
endi
ture
tax
Le
vied
on
hote
l acc
omm
odat
ion
on
paym
ents
mad
e to
the
hote
l in
resp
ect o
f foo
d, d
rinks
, or a
ny
othe
r ser
vice
s.
Expe
nditu
re o
f les
s tha
n R
s. 3,
000
is e
xem
pt.
10 p
erce
nt o
f cha
rgea
ble
expe
nditu
re.
Sour
ces:
IBFD
(200
4); P
riceW
ater
Hou
seC
oope
rs (2
002a
, 200
2b, a
nd 1
996)
; Del
oitte
Tou
che
(199
9); a
nd in
form
atio
n pr
ovid
ed b
y th
e In
dian
aut
horit
ies.
1/ T
axes
are
adm
inis
tere
d an
d le
vied
by
the
Cen
tral g
over
nmen
t, un
less
oth
erw
ise
spec
ified
.

- 61 - ANNEX IV.II
Average Effective Tax Rates (AETRs) Based on Macroeconomic Data
1. The AETR on labor is derived in two steps. First, the effective tax rate on total household income is calculated as the ratio of individual income tax and household income. including: operating surplus of unincorporated enterprises (OSPUE), property income (PEI), and wage income (CE). Second, the AETR on labor is calculated by dividing the sum of taxes paid on labor income (tax on wages and salaries—calculated by applying the household income AETR to wage income—,1 social security contributions, and other payroll taxes) by the sum of wages and salaries and employer-paid social security contributions.
2. The AETR on capital is obtained by dividing the sum of taxes paid by capital (corporate income tax, household taxes on capital income, and various property taxes) by the net operating surplus of the economy.
3. The AETR on consumption is calculated as the sum of domestic taxes on goods and services, export, and import duties, divided by the sum of private and government nonwage consumption, net of indirect taxes. Indirect taxes are excluded in the denominator to reflect the common practice of expressing indirect tax rates as a percentage of the price before tax.
4. More recent studies however have argued that it is preferable to express the consumption tax base in gross terms (i.e., including indirect tax rates in the denominator), to improve comparability with the tax ratios on labor and capital and facilitate calculating a combined AETR on labor and consumption (Carey and Rabesona, 2002). We therefore also present this alternative (revised) estimate together with the original Mendoza et al estimate.
1 Labor and capital income of households are assumed to be taxed at the same rate.

- 62 - ANNEX IV.III
Tax Parameter Data, June 2004
(In percent) A. Corporate Tax System Corporate tax rate on retained earnings 35.875 Inventory valuation FIFO Long term capital gains tax rate 21 Dividend distribution tax rate 12.81 B. Personal Tax System Interest income tax rate 21 Dividend income tax rate 0 Short-term capital gains tax rate 31.5 Long-term capital gains tax rate 21 Proportion of assets realized each period 10 C. Tax Depreciation Rates Machinery Buildings Depreciation method Declining balance Declining
balance Rate for declining balance 25 10

- 63 -
References
Burgess, Robin, Stephen Howes, and Nicholas Stern, 1997, “The Reform of Indirect Taxes in India,” in Cassen, R. and V. Joshi (ed.), India: the Future of Economic Reform, Chapter 6 (New York: Oxford University Press).
Carey, David and Josette Rabesona, 2002, “Tax Ratios on Labour and Capital Income and on
Consumption,” OECD Economic Studies, No. 35, Vol. 2, pp. 129–174. Dalsgaard, Thomas, 2001, “The Tax System in New Zealand: An Appraisal and Options for
Change,” Economics Department Working Paper No. 7 (Paris: Organisation for Economic Co-operation and Development).
Devereux, Michael, Rachel Griffith, and Alexander Klemm, 2002, “Corporate Income Tax
Reforms and Tax Competition,” Economic Policy, pp. 451–495, October. European Commission, 2000, European Economy: Public Finances in EMU—2000
(Brussels: Directorate General for Economic and Financial Affairs). Farrel, Diana, 2004, “Boost Growth by Reducing the Informal Economy,” The Asian Wall
Street Journal, October 18. International Bureau of Fiscal Documentation, 2004, Asia-Pacific Taxation Database
(Netherlands). Available on CD-ROM. International Monetary Fund, 2004, “Taxation and the Financing Structure of the Firm,”
paper presented at the IMF-Singapore Regional Training Institute and the Fiscal Affairs Department (unpublished; Washington).
Joseph, Mathew, Rupa Nitsure, L. Bhagirathi, and Madan Sabnavis, 1998, “India’s
Economic Reforms: Private Corporate Sector Response,” paper presented to 1998 ABAS International Conference on Emerging Economies (Budapest, Hungary).
Joumard, Isabelle, 2001, “Tax Systems in European Union Countries,” Economics
Department Working Papers No. 301 (Paris: Organisation for Economic Co-operation and Development).
KPMG, 2004, Corporate Tax Rate Survey. Available via the internet: http://www.kpmg.com. Kraemer, Moritz and Eileen Zhang, 2004, “Flexibility in Taxing Times—A New Index of
Governments’ Revenue-Raising Potential” (London: Standard & Poor’s). Martinez-Mongay, Carlos, 2000, “ECFIN’s Effective Tax Rates: Properties and Comparisons
with Other Tax Indicators,” Economic Papers No. 146 (Brussels: European Commission, Directorate General for Economic and Financial Affairs).

- 64 -
Mendoza, Enrique, Assaf Razin, and Linda Tesar, 1994, “Effective Tax Rates in Macroeconomics, Cross-Country Estimates of Tax Rates on Factor Incomes and Consumption,” Journal of Monetary Economics, No. 34, pp. 297–323.
Ministry of Finance, 2004, Report of the Taskforce on Implementation of the Fiscal
Responsibility and Budget Management Act, 2003 (New Delhi: Government of India).
———, 2001, Economic Survey 2000–2001 (New Delhi: Government of India). ———, 1982, “Economic Reforms Two Years After and the Task Ahead,” Department of
Economic Affairs Discussion Paper (New Delhi: Government of India). Mulheisen, Martin, 1998, “Tax Revenue Performance in the Post-Reform Period,” India—
Selected Issues (Washington: International Monetary Fund). Organisation for Economic Co-operation and Development, 1991, Taxing Profits in a Global
Economy (Paris). Patel, Urjit, 1995, “State Indirect Taxes: Present System and Scope for Reform,” India—
Background Papers (Washington: International Monetary Fund). Poirson, Hélène, 2004, “The Tax System in India: Could Reform Spur Growth?,” IMF
Working Paper, forthcoming. PricewaterhouseCoopers, 2002a, Individual Taxes 2003–04 Worldwide Summaries
(Canada: John Wiley & Sons). ———, 2002b, Corporate Taxes 2003–04 Worldwide Summaries (Canada: John Wiley
& Sons). Rao, S. Narayan, and Jijo Lukose, 2002, “An Empirical Study on the Determinants of the
Capital Structure of Listed Indian Firms,” mimeo (Mumbai: Indian Institute of Technology).
Schneider, Friedrich, and Robert Klinglmair, 2004, “Shadow Economies Around the World:
What Do We Know,” CESifo Working Paper Series No. 1167 (Munich: Center for Economic Studies and Institute for Economic Research).
Shome, Partha, 2004, “India: Resource Mobilization through Taxation,” mimeo
(Washington: International Monetary Fund). Tanzi, Vito and Howell Zee, 2001, Tax Policy for Developing Countries (Washington:
International Monetary Fund). Topalova, Petia, 2004, “Overview of the Indian Corporate Sector: 1989–2002,” IMF
Working Paper No. 04/64 (Washington: International Monetary Fund).

- 65 -
V. THE INTEREST RATE RISK MANAGEMENT OF BANKS’ GOVERNMENT SECURITIES HOLDINGS IN INDIA1
The large holdings of government securities by banks entail some risk as interest rates are at historical low levels. This paper first measures the interest rate risk associated with such holdings and then assesses its management by banks. Finally, it identifies key issues that could mitigate banks’ vulnerability to interest rate risk.
A. Banks’ Government Securities Holdings as a Source of Risk
1. Banks in India invest heavily in government securities, compared with other countries (Table V.1). Such investments grew by 25 percent in 2003–04 to reach Rs. 6.4 trillion, or 24 percent of GDP at end March 2004.2 They represented one third of total banking system assets at end-March 2004. As a result, Indian banks have some of the highest holdings of government securities relative to their assets when compared to other countries. Furthermore, government securities holdings are well in excess of the statutory reserve requirements. The ratio of statutory liquid securities (SLR)—mainly government securities—reached 41 percent of net demand and time liabilities by end-March 2004, well above the required 25 percent.
2. With declining interest rates in recent years, banks have earned substantial profits through interest and trading income on government securities. Interest income on these investments represented 35.8 percent of banking system interest income at end-March 2004. Similarly, trading income accounted for 49 percent of the banking system noninterest income at end-2004. Trading income has become one of the main drivers of banking system profitability, accounting for 37 percent of operating profit at end-March 2004. 1 Prepared by Amadou Sy.
2 Based on a nominal GDP of US$603 billion and an exchange rate of Rs. 43.6/U.S. dollar at end 2003/04.
Number Government Government of Securities to Securities/
Banks Total Assets Total Securities
Argentina 66 19.1 85.2Australia 30 1.4 10.3Canada 26 2.8 9.9Colombia 34 20.6 72.6Costa Rica 31 9.5 46.7Germany 79 5.6 19.9Hungary 10 9.7 95.9India 93 32.4 79.7Indonesia 13 30.9 83.0Korea 19 0.8 4.9Lebanon 6 21.3 93.4Malaysia 34 7.2 36.7Mexico 40 8.8 47.9New Zealand 6 4.9 38.1Norway 45 24.5 85.5Panama 67 1.2 23.0Philippines 21 11.0 80.4Singapore 8 7.8 74.8South Africa 20 7.4 66.2Spain 22 18.7 76.7Sweden 21 3.2 25.3Thailand 19 15.4 63.0Turkey 31 37.2 91.6United States 7,770 12.3 64.8
Sources: Bankscope; FDIC; RBI; and staff calculations.
1/ Data for commercial banks for Germany, Spain, and Japan and for public sector banks for India.
Table V.1. International Comparison of Banks' Holdings of Government Securities, 2003 1/
(In percentage)

- 66 -
3. However, the holdings of government securities by the banking system entail risk as interest rates have reached their historical low levels. Most government securities held by banks are long-term fixed-rate government bonds which are sensitive to changes in interest rates. Fixed-rate government securities with a 5–30 year tenor account for 58.2 percent of banks’ total investment portfolios. In contrast, investments with a maturity less than one year represent only 10.4 percent of total as of end-March 2004. At the same time, inflationary pressures have prompted the RBI to raise interest rates in 2004. Further increases in the yields of government securities are a significant risk to the profitability and capital adequacy of the banking system.
B. Measuring the Risk from Government Securities Holdings
4. Given their significant share in the assets of commercial banks in India, it is important to measure the risk of government securities holdings. Gauging the likely reduction in the market value of banks’ government securities holdings and the associated reduction in capital adequacy and profitability can guide banks in managing these risks. In addition, identifying banks most vulnerable to the risks can be useful to supervisors.
Duration Method
5. First, we use a duration/convexity method to estimate the government securities portfolio interest rate risk. From the price-yield relationship for bonds, this method estimates bond price changes for a change in yields. The duration of a bond is a linear approximation of a bond price change. The longer the duration of a bond—measured in years—the more interest rate sensitive it is. Since the price-yield relationship for bonds is not linear but convex, a measure of convexity is also used to account for small changes in yields. Convexity is a second order effect that describes how duration changes as yields change. Mathematically, the duration/convexity method uses a Taylor expansion to approximate the relative change in government securities price, dG/G, following a small change in the yields of government securities dy. D* and C denote the government securities modified duration and convexity, respectively (Jorion, 1997).
( )2* 12
dG D dy C dyG
= − + where 1* dGDG dy
⎛ ⎞= −⎜ ⎟⎝ ⎠
and *dDC
dy= − . (1)
6. The interest rate risk sensitivity of banks’ government securities portfolio has increased over time, with public sector banks (PSBs) and old private sector banks the most exposed to a rise in yields. Our estimates (Table V.2) are that, as of end-March 2004, the average duration of the government securities portfolio of scheduled commercial banks (SCBs) was 5.8 years. Public sector banks (PSBs), which account for about 75 percent

- 67 -
Old Private New Private ForeignSCBs PSBs Banks Banks Banks
Banking indicatorsTotal assets 19,750.2 14,714.3 1,207.0 2,465.8 1,363.2Deposits 15,751.4 12,683.8 1,053.3 1,632.2 797.6Net worth 1,165.9 792.2 72.9 152.3 148.4Net profit 222.7 165.5 14.46 20.35 22.4Capital adequacy ratio (CAR), in percent 12.9 13.2 13.7 10.2 15.0Investment in government securities (G-Sec)
Total investment portfolio 8,020.7 6,256.8 474.6 873.4 415.9G-Sec holdings 6,391.4 5,102.3 352.9 609.5 326.7G-Sec in AFS and HFT categories 5,093.8 4,023.4 293.1 474.3 302.2
Duration method Modified duration (in years) 5.8 6.3 6.1 3.3 2.9Convexity 63.9 70.8 68 26.4 20.7Average coupon 9.3 9.1 9.4 10.3 10.4
LossesLoss from 100 bps parallel shift in yield curve 297.1 253.7 17.8 15.5 8.8Loss as percent of portfolio value 5.8 6.3 6.1 3.3 2.9Loss as percent of net profit 133 153 123 76 39Loss as percent of net worth 25.5 32 24.4 10.2 6New CAR 9.6 9 10.4 9.2 14.1
Value-at-risk method Value-at-risk (1-month, 99 percent) 1/ 320.0 252.8 16.1 26.0 12.0
Investment fluctuation reserve (IFR) Actual IFR (in percent of AFS + HFT) 3.0 3.1 2.8 2.3 2.8Actual IFR in billions of rupees 189.2 151.9 11.1 15.6 10.6IFR shortfall -107.9 -101.8 -6.7 0.1 1.8
Sources: Reserve Bank of India; National Stock Exchange; and staff estimates.
1/ Value-at-risk for a one-month holding period and a 99 percent confidence interval using a variance-covariance (or normal) method.
Table V.2. India: Interest Rate Risk of Banking System's Government Securities Holding
(In billions of rupees as of end-March 2004, unless otherwise indicated)

- 68 -
of total banking system’ holding have the highest duration with 6.3 years. Similarly, old private banks have a duration of 6.1 years. In contrast, the Government securities portfolio of foreign banks has the shortest duration with 2.9 years compared to 3.3 years for new private sector banks. The average duration for all banks has increased from 4 years in 1999 to 5.8 years at end-March 2004, pointing to potential increased risk.
Scenario Analysis
7. In order to approximate interest rate risk to the banking system, we consider both the direct effect on banks’ securities portfolio as well as how banks can manage such a shock to attenuate its effects. As a base case we consider a one percentage point rise in the benchmark government bond rate. This is similar to the increase experienced between mid-April and mid-July 2004, when the benchmark 10-year bond rose from 5.07 percent to 6.26 percent. This scenario can also be seen in the context of the worst-case increase in Government securities yields over 90 days.3 4
Portfolio Losses
8. In the absence of any interest rate risk management by banks, potential portfolio losses from a hike in interest rates would be significant. A one percentage point increase in interest rates would result in losses worth 133 percent of net profit (Table V.2). The market value of banks’ government securities holdings would be reduced by about Rs. 300 billion or 6 percent of portfolio.5 Some public sector and old private banks would be the most exposed with average portfolio losses worth 153 percent and 123 percent of net profit, respectively, as of end-March 2004. Foreign banks and new private sector banks would be the least vulnerable to such a shock, with losses worth 39 percent and 76 percent of net profit, respectively. However, as discussed below, any such losses would be cushioned by gains previously earned, but not booked under India’s conservative accounting rules, and
3 Using five years of monthly data on government securities yields, Sarkar (2003) estimates the 99 percent confidence level to range from 103 bps to 127 bps for maturities of 1-10 years.
4 We also consider two additional scenarios. Scenario 2 simply assumes a shock double the size of that in Scenario 1. Scenario 3 assumes a 320 basis points increase, the worst-case increase in government securities yields over one year with a 1 percent probability, assuming that yields are normally distributed (the standardized interest rate shock recommended by the BIS (2003)). Given the strong linearity of equation (1), portfolio losses under these scenarios would be approximately proportional to losses obtained under the base scenario.
5 A similar approach finds market losses in Japanese banks’ portfolio of Japanese government bonds equivalent to 208 percent of net profit or 14 percent of Tier 1 capital (see Nemoto, 2004).

- 69 -
by an investment fluctuation reserve, and could also be offset by higher income from other sources.
Capital Adequacy
9. Such losses would represent about 26 percent of total capital and a drop in the capital adequacy ratio (CAR) to 9.6 percent from 13 percent (Table V.2). A similar exercise using 1999 data finds that banks would have lost 18.3 percent of total capital and their CAR would have fallen by 2 percent in 1999, suggesting that the exposure to interest rate risk has increased over the years. The capital adequacy of public sector banks would be the most exposed, with their average CAR falling to about the level of the 9 percent regulatory minimum (from 13.2 percent).
10. Our results are consistent with previous findings. For instance, Sarkar (2003) estimates the worst-case loss at end-2002 (for a 90 days horizon and a 99 percent confidence level) for a sample of 51 Indian banks at around Rs. 265 billion or almost 5 percent of their holdings of government securities. Similarly, private banks are found to be the least exposed to interest rate risk and public sector banks the most exposed. No foreign banks (out of 9 banks) would erode more than 25 percent of net worth while, among private banks, the proportion with such risk was around 47 percent (out of 15 banks) and, among public sector banks, 85 percent (out of 27 banks). Sarkar (2003) finds that Indian banks are not uniform in their interest rate risk exposure and there is no clear relationship between their capital adequacy ratio and the market risk they take.
Value-at-Risk (VAR) Approach
11. The duration/convexity approach has well-known limitations, as it measures exposures only for parallel shifts of the yield curve. The Value at Risk (VAR) approach offers a complementary method to measure the interest rate risk of bond portfolios. VAR is the measure of the maximum (worst case) market loss for a given portfolio, for a certain holding period, and for a given confidence interval (see also Patnaik and Shah, 2004). VAR is a measure of the rupee loss on the government securities portfolio that will be exceeded by the end of the chosen time period with the specified confidence level. Duration is directly linked to value at risk and the worst case rupee loss calculations in Scenario 3 can be seen as a VAR estimation at a 99 percent level of significance for a one-year horizon.
Value-at-Risk Estimation Results
12. Using a variance-covariance (or normal) method, we find results that are comparable to the duration method’s estimates.6 We find that the maximum (worst case)
6 We use a duration mapping method with linear interpolation using information from zero-coupon government securities (ZCYC) from NSE. Since the NSE database does not provide the correlation of zero-coupon bonds for different maturities, our estimates measure
(continued…)

- 70 -
market loss for scheduled commercial banks’ portfolio for a one month holding period, and for a 99 percent confidence interval is Rs. 320 billion (Table V.2). This figure is close to the portfolio loss resulting from a 100 basis points increase in the yield curve obtained using the duration approach (Rs. 300 billion). We also use alternative value-at-risk methods, including historical simulation methods together with weighted normal, weighted historical simulation and extreme value methods. Although the results—not reported here—are sensitive to the choice of methods, policy conclusions are qualitatively similar.
C. Interest Rate Risk Management
13. While rising interest rates makes banks vulnerable to treasury losses, banks in India have a number of lines of defense. First, banks have, in recent years, realized substantial profits from their holdings of government securities, thanks to the soft interest rate environment. Banks are required to follow conservative accounting practices in respect of unrealized capital gains on their investment portfolio and have constituted latent reserves.7 Moreover, banks in India have been encouraged to build up investment fluctuation reserves as a cushion against interest rate risk (Gangadhar, 2001). Finally, banks can adjust their behavior to offset treasury losses by adequately managing their asset-liability mismatch.
Basel Core Principles
14. The Basel Committee on Banking Supervision (BCBS) has issued principles regarding the supervision of the interest rate risk management of banks, which can be used as a benchmark for the Reserve Bank of India (RBI). Investment portfolios are bifurcated into a banking book, which includes securities that banks intend to hold to maturity, and a trading book. Since 1996, Basel I regulation requires banks to set aside capital to cover their market risks, where the latter includes the interest rate risk in the trading book, but not the banking book (BIS, 1996). Pillar II of Basel II advises bank regulators to control the level of the interest rate risk in the banking book. It urges supervisors to identify banks that are “outliers,” i.e., those that would lose more than 20 percent of their Tier 1 and Tier 2 capital due to a specific stress scenario (see BIS, 2003).
15. The RBI is moving gradually towards Basel I principles for managing interest rate risk. In 1995, the RBI introduced asset liability management guidelines and in 1999 guidelines for risk management. To measure liquidity risk, banks are required to submit
the undiversified portfolio VAR of Indian banks. As a result, our estimates assume perfect correlation across all zero-coupon bonds and ignore possible diversification benefits, which may overestimate the diversified VAR.
7 The RBI conducts periodic sensitivity analyses of banks’ investments portfolio and estimates the cushion available in terms of unrealized gains on banks’ investment portfolio.

- 71 -
periodic reports to the RBI. More recently, the RBI is phasing in the implementation of Basel norm for capital charge for market risk over a two year period.8 In addition, since 2000, banks are required to use a 2.5 percent risk weight for their portfolio of government securities in order to determine their capital adequacy ratio, as compared to zero under Basel I. The RBI also advised banks advised to examine the soundness of their risk-management systems and draw up a road map by end-December 2004 for migration to Basel II. In addition the RBI has initiated in 2004 pilot program for risk-based supervision.
Investment Fluctuation Reserves (IFR)
16. As an alternative to Basel I, the RBI currently uses the investment fluctuation reserve (IFR) as the main line of defense against a potential reversal of the interest rate environment. Given, the large holdings of government securities, the IFR can be seen as a reserve to guard against possible reversal of interest rate environment. In 2002, banks were advised to build up an IFR of a minimum of 5 percent of the investment in HFT and AFS categories within a period of five years. Banks were also advised to achieve the goal earlier and are encouraged to reach a 10 percent ratio. Transfer to IFR is as an appropriation of net profit after appropriation to statutory reserve.
17. Basel I can be viewed as a more efficient approach to interest rate risk. This is because it recommends capital charges commensurate with the risk exposure of banks, whereas IFR requirements are uniformly applied to banks with no consideration as to the level of interest rate risk and its associated management. As a result, banks with low exposure to interest rate risk bear a regulatory cost if they comply with the advised IFR level. In contrast, the advised uniform level of IFR may not be sufficient to protect some banks from their high exposure to interest rate risk. Furthermore, a number of banks may not have sufficient profitability and capital to build the advised level of IFR. As the RBI moves to international standards, it is expected that the current system will be replaced by Basel I principles.
18. The current aggregate level of IFR is about half that needed to absorb market losses resulting from a one percentage increase in government bonds yields. The aggregate banking system’s IFR stood at 3.0 percent of eligible government securities at end-March 2004, just over half the 5.8 percent needed to absorb a one percentage increase in the benchmark 10-year government bond (Table V.2). The shortfall would be from public sector banks and old private sector banks. In contrast, new private banks and foreign banks have IFR levels sufficient to absorb the shock.
8 The RBI announced in 2004 that banks would be required to maintain capital charge for market risk in respect of the securities included under the Held For Trading (HFT) and Available for Sale (AFS) category by 2005 and 2006, respectively.

- 72 -
19. Moreover, the required IFR level would not be short of adequate for public sector and old private banks but too high for new private and foreign banks. In contrast to the advised 5 percent, PSBs and old private banks would require IFR levels of about 6.3 percent and 6.1 percent of eligible securities. However, foreign and new private banks would need only about 2.9 percent and 3.3 percent of eligible securities to absorb a one percentage point shock.
20. Individual bank data show a wide dispersion of IFR suggesting that the RBI should scrutinize closely the most exposed banks, as their IFR could be insufficient to cushion them against large interest rate increases and they could need capital injections. The IFR level of public sector banks ranges from zero percent for two small PSBs to 5.21 percent of eligible securities, with a median of 3.13 percent. All public sector banks have an IFR level below the minimum needed to absorb the average 6.3 percentage-point reduction in the value of government securities holdings following a one percentage point increase in interest rates. After using their existing IFR as a cushion to absorb their portfolio losses, the average CAR of PSBs would fall to 10.4 percent from 13.1 percent, and six out of the 27 PSBs would require capital injection as their CAR would fall below the minimum regulatory level of 9 percent.
Mark-to-Market Requirements
21. The RBI has introduced conservative mark-to-market requirements. Since 2000, banks are required to classify their investment portfolios into three categories with progressively mark-to-market norms: (i) Held to Maturity (HTM); (ii) Available for Sale (AFS); and (iii) Held for Trading (HFT). While investments under the HTM category are not marked-to-market, those under AFS and HFT are to be marked-to-market at year-end and monthly, respectively or at more frequent intervals. Guidelines were also issued for the classification of investments, shifting of investments among the three categories, valuation of the investments, and a conservative methodology for booking profits and losses on sale of investments as well as providing for depreciation. In particular, while net depreciations are recognized and fully provided for, net appreciations are ignored.
22. As a one-time measure in September 2004, the RBI allowed banks to shift securities to HTM, after immediately providing for transfer losses. Prior to September 2004, banks were allowed to classify a maximum of 25 percent of their total investments in government securities in the held-to-maturity category (HTM) category when calculating their IFR. Since September 2004, banks are allowed to hold up to 25 percent of their demand and time liabilities (DTL) in the held-to-maturity category (HTM). However, upon shifting additional securities to HTM, a bank would incur accounting losses equal to the difference between their prevailing market value and acquisition cost or book value. Under both regulations, the advised IFR is worth 5 percent of banks’ government securities in the AFS and HFT categories.
23. The RBI explains the measure—which is consistent with international standards that do not place limits on HTM category—as a regulatory response to concerns about

- 73 -
the impact of the rising interest rates on banks’ investment portfolios.9 Banks that choose to apply this measure will reduce their exposure to interest rate risk but will have to incur the cost upfront of transferring more securities to the HTM category. In contrast, banks that decide not to hold more securities to maturity will be exposed to potential future mark-to-market losses if interest rates increase further. Such banks would be particularly at risk if they currently lack the capital to absorb the cost of shifting securities to the HTM category, should interest rates rise in the future. Market participants note that very few banks have chosen to shift more securities to the HTM category in part due to concerns about the immediate impact on their net profits.
Other Aspects of Bank Asset Liability Management
24. Offsetting potential treasury losses, higher interest rates on loans can positively affect the net interest rate income of banks. Banks can take advantage of rising short-term rates as loans re-price quicker than deposits, hence widening spreads in an environment of increasing loan-to-deposit ratios. Such higher spreads may attenuate the effect of holding fixed rate government securities in a rising interest rate environment. However, the volatility of deposits needs to be considered as well, as they could be withdrawn in case of a significant interest rate shock. The RBI conducts periodic sensitivity analyses of banks’ balance sheets and found a 4.9 percent positive impact on net interest income (NII) following a 200 basis points increase in interest rates at end-March 2003. This analysis does not, however, incorporate the depreciation of banks’ holdings of government securities.
25. Banks could also manage interest rate risk through a number of measures. Banks could (i) reduce the duration of their assets by selling long-dated government securities; (ii) reduce their holdings of government securities and increase their loan books building on the recent high growth in consumer credit and infrastructure; and (iii) increase the contribution of fee-based income to operating income.
Government Policies to Limit Interest Risk
26. Over the medium-term, a stronger fiscal policy and enhanced opportunities for lending would reduce banks’ reliance on government paper. A reduction of the fiscal deficit would reduce the supply of government securities to the banking system. At the same time, continued structural reforms will make lending to domestic enterprises more attractive, allowing banks to bring their government securities holdings down to the legally required level.
9 See RBI (2004a), page 171. The RBI has also noted that banks are required to hold 25 percent of their DTL in the form of approved securities—mostly government securities—as statutory reserves and argued that at least this level should be eligible as HTM.

- 74 -
27. Increasing the issuance of short-dated or floating rate government securities—in line with sound debt management practices—would also help banks manage their interest rate risk. The Indian authorities have initiated the sale of floating rate government securities and as of 2003, 3 percent of the total stock of outstanding Government securities was in the form of floating rate instruments. Increasing this proportion could provide banks with an additional tool to manage their interest rate risk. Capital market development could also ensure a better functioning of markets for hedging instruments such as interest rate swaps and forward rate agreements (FRAs), and interest rate futures (see Sarkar, 2003).
28. Widening the investor base for government securities could also help reduce the reliance on banks as the main investors in this market. Commercial banks held 61 percent of the outstanding stock of government securities at end-March 2002. The next most important investor was the state-owned Life Insurance Corporation of India (LIC). Other investors included provident funds, mutual funds, other financial institutions, and retail investors. In order to widen the investor base for government securities, the authorities have allowed FIIs to purchase government securities since February 2004 (see also Arvai and Heenan, 2004). From a systemic perspective, the transfer of long-dated government securities from the banking system to institutional investors would shift the interest rate risk outside the banking system. However, given the long-dated nature of their obligations, non-banks may well be better armed to manage their interest rate exposure than banks.
D. Conclusion
29. This paper measures and assesses the management of, the interest rate risk of banks’ government securities portfolios in India, which it identifies as a key risk for the banking system. We find that the current aggregate level of investment fluctuation reserves (IFR) in the banking system would be insufficient to compensate from market losses resulting from a one percentage point parallel shift in the yield curve. However, while some public sector banks and old private banks are vulnerable, foreign banks and new private banks have built an adequate cushion. Moreover, opportunities exist to offset these losses with higher earnings from lending to the private sector and higher fee-base income. A key priority for the Indian authorities is to scrutinize the risk management practices of individual banks. Given the potential for interest shocks higher than the one percentage increase studied in the paper, an accelerating convergence towards Basel I risk-weighted capital charges and the adoption of the Basel II, Pillar II approach for interest rate risk supervision, especially for those banks most vulnerable to a reversal of the interest rate cycle, could help ensure the stability of the financial system.
- 75 -
References
Arvai Zsofia and Geoffrey Heenan, 2004, “A Framework for Developing Secondary Markets for Government Securities,” MFD Operational Paper (unpublished;
Washington: International Monetary Fund). Bank for International Settlements, 1996, Amendment to the Capital Accord, Basel
Committee on Banking Supervision.
Bank for International Settlements, 2003, “Principles for the Management and Supervision of Interest Rate Risk,” Basel Committee on Banking Supervision (Geneva).
Gangadhar, Darbha, 2001, “Value-at-Risk for Fixed Income Portfolios—A Comparison of Alternative Models,” (Mumbai: National Stock Exchange). Jorion, Philippe, 1997, “Value at Risk: The New Benchmark for Controlling Market Risk,” (Chicago: Irwin Professional). Nemoto, Naoko, 2004, “Rising Long-Term Interest Rates Highlight Importance of Japanese Banks’ Asset-Liability Management,” Standard & Poor’s. Patnaik, Ila and Ajay Shah, 2004, “Interest Rate Volatility and Risk in Indian Banking,” IMF
Working Paper No. 04/17 (Washington: International Monetary Fund). Reserve Bank of India, 2004a, Reports on Trends and Progress of Banking in
India, 2003-04, also available at www.rbi.org.in. ———, 2004b, Annual Report 2003–04. Available via the Internet: www.rbi.org.in ———, 2003, Reports on Trends and Progress of Banking in India, 2002–03. Available via
the Internet: www.rbi.org.in ———, 2002, Handbook of Statistics in Indian Economy (Mumbai). Sarkar, Soumya, 2003, “Interest Rate Risk in the Investment Portfolios of the Indian Banking System,” Treasury Research Group, ICICI Bank (India).