india inc. prepares for a long innings - health | aon hewitt trq_vol 5 issue 1.pdf · india inc....
TRANSCRIPT

India • Volume 5 • Issue 1
Data-Driven Insights — Finding the Answer to the Puzzle
20
Building an Organization Predicated on Purpose Animesh Kumar
16
India Inc. Prepares for a Long Innings
Executive Compensation: The Winds of Change
04

what’s inside
04 24
cover story
10
Executive Compensation: The Winds of Change 04Building an Organization Predicated on Purpose Animesh Kumar
16
Data-Driven Insights – Finding the Answer to the Puzzle20Flexing it with Benefits24
Trend Check Campus Hiring – Positive Patterns
28Survey Calendar30
Amidst all the positive economic growth signs the country is witnessing, India Inc. continues to reward with cautious optimism
20
India Inc. Prepares for a Long Innings

Total Rewards QuarterlyIndia • Volume 5 • Issue 1
www.aon.com/india
Anandorup Ghose
Director – Talent and Rewards,
Aon Hewitt
For more information, please write to us
Follow us on LinkedIn at Aon India & Twitter @Aon_India
Dear Reader,We are glad to present to you our 14th edition of the Total Rewards Quarterly. Over the last few years, we have been delighted to see how this journal has established a niche for itself among the range of HR/rewards publications in India. Your support and feedback in this regard has been truly valuable.
Our focus with this edition is to provide you information that is relevant and contextual to the pay revision cycles you are currently engaged in. The two lead stories on salary increases in India and executive compensation levels should help you frame your points of view on these two areas. These stories are based on two of our comprehensive surveys that cover data from companies across sectors, sizes and performance/ownership dynamics. We are also presenting to you in this edition a summary of our findings from the Campus Study – an analysis of pay levels being offered across a range of vocational campuses in India.
As a firm, over the last year, we have increasingly become more convinced that two fundamental shifts are happening in HR – firstly, leading organizations are becoming far more aware of the power of HR analytics. We have, over the last few months, spent time with our partner organization, Bridgei2i, in developing approaches that can bring the power of HR analytics to our clients. Secondly, the Total Rewards needle is slowly and gradually settling into the benefits box – and organizations with flexible benefits structures that can align to their varied employee demographics are seeing far greater engagement levels. We are bringing to you our thoughts on these two topics and we look forward to your comments on how you see these two changes in your organizations.
We are also delighted to bring to you our conversations with Animesh Kumar, Group Head, HR & Corporate Services, IDFC. We were very keen to interview Animesh not only because he is leading a very interesting HR transition of IDFC from an NBFC “conglomerate” to a bank, but also because he has the knack of throwing interesting challenges on core beliefs around pay and benefits!
Before I sign off, I wanted to invite you all to our annual ‘Around the World with Total Rewards” conference. It is scheduled for the 11th of June in Mumbai and we look forward to seeing you all there.
We enjoyed putting together this edition and hope you will enjoy reading it. Thank you.
Editor
Roopank [email protected]
Editorial Team
Manasi [email protected]
Sagorika [email protected]
Marketing & Branding
Sushil [email protected]
Tel: +91 124 4155000
Subscription Requests
Editorial Feedback
Design
CREATIVE INC. (www.creative-inc.in)
Total Rewards Quarterly is published
four times a year by Aon Hewitt
Copyright © 2015 Aon
Services India Pvt Ltd
Editorial, Reprints & Syndication Office
Aon Centre, Building 2, 3rd FloorUnitech Info Space, Tikri, Sector-48Gurgaon-122001, Haryana, India
Tel: +91 124 4155000 Fax: +91 124 4052010
India • Volume 5 • Issue 1TotalRewards QUARTERLY
03

executive compensation: The Winds of change
www.aon.com/india04

Companies Act. Apart from regulations, there are factors like advent of new age organizations and rising expectations that are impacting executive pay. In this article, we have discussed some of these changes and how they are impacting the executive compensation landscape in India.
regulatory requirements, Disclosures and shareholder ActivismThe Companies Act, 2013, taking a page out of RBI guidelines, has extended some such requirements to other sectors as well, primarily to the listed organizations in India. In our view, the checks and disclosures required under the Companies Act, 2013 can be divided into two broad themes i.e. parity and performance (refer Table 1). There are set of disclosures that point towards pay parity not only between the CEO pay and other executives in the company but also between the CEO pay and pay levels in the organization as a whole. These disclosures also need to show how the increase in compensation levels for the top management is commensurate with the overall performance of the organization. The impact of growing shareholder activism in India is also becoming quite visible. Rejection of pay proposals by shareholders in some companies forced them to revise the compensation package for top executives in 2014. This
The first serious attention paid to executive compensation in India was after the financial meltdown half a decade back. Financial services and specifically, the private and foreign banking sector that was at the forefront of impact was the first one to experience a plethora of checks and balances when the Reserve Bank of India (RBI) released guidelines on compensation of whole-time directors, Chief Executive Officers, risk takers and control function staff, etc. These guidelines were broadly based on Financial Stability Board (FSB) principles of sound compensation practices. Not only were the checks and balances to be brought in place, a number of disclosures with respect to executive compensation also went along with these guidelines. Executive compensation in India Inc. at a much broader level is facing something similar with the new
PERSPECTIVE
Table 1
Parity: Key Disclosures Performance: Key Disclosures
The ratio of remuneration of each director to the median remuneration of the employees of the company for the financial year
The percentage increase in remuneration of each director, Chief Financial Officer, Chief Executive Officer, Company Secretary or manager, if any, in the financial year
The percentage increase in the median remuneration of employees in the financial year
Average percentile increase already made in the salaries of employees other than the managerial personnel in the last financial year and its comparison with the percentile increase in the managerial remuneration and justification thereof and point out if there are any exceptional circumstances for increase in the managerial remuneration
The ratio of the remuneration of the highest paid director to that of the employees who are not directors but receive remuneration in excess of the highest paid director during the year
The explanation on the relationship between average increase in the remuneration and company performance
Comparison of the remuneration of the key managerial personnel against performance of the company
Variations in the market capitalization of the company, price earnings ratio as at the closing date of the current financial year and previous financial year and percentage increase over decrease in the market quotations of the shares of the company in comparison to the rate at which the company came out with the last public offer in case of listed companies, and in the case of unlisted companies, the variations in the net worth of the company as at the close of the current financial year and the previous financial year
Comparison of each remuneration of the key managerial personnel against the performance of the company
The key parameters for any variable component of remuneration availed by directors
Shareholder ActivismPerformance AlignmentPay Parity
Wealth CreationIncreasingly Competitive Environment
India • Volume 5 • Issue 1TotalRewards QUARTERLY
05

activism is bound to grow as more and more global capital enters the Indian system. The shareholders will necessarily bring along with capital, the checks and balances on executive compensation which will ensure that the remuneration is commensurate with performance. The Nomination and Remuneration Committees of the Board has an interesting and challenging task of balancing what seems to be divergent aspects of executive compensation.
changing competitive Landscape The second important factor that is impacting executive compensation is the competitive landscape for executive talent. This landscape is fast changing with the emergence of new age businesses especially the ones catering to the large Indian middle class whose spending capacity is expected to increase in the coming years if the India growth story continues. The executive talent movement
was never limited within an industry but inter-industry movement has intensified and will continue to do so as the sunrise industries like e-Commerce achieve scale. The Aon Hewitt Executive Compensation study brings up some interesting insights on how the executives are being paid in today’s environment in different industries. The analysis not only throws light on the quantum of pay for CEOs and other executives but also shows some interesting insights on how total compensation is structured.
Executive Compensation LevelsThe survey data represents a period when India was on the verge of a change in government and in our view, the compensation data for the top/senior management shows cautious optimism with respect to the overall growth of the economy. Fixed compensation for CEOs based on same company analysis has moved in a range of 5.5% to 12.0% with a median of 9%. For the other CXO level population, the fixed pay has moved in the range of 5.7% to 12.2% with a median of 9.2%. Compensation levels for CEOs (refer Chart 1) show a very wide variance in compensation in companies between a revenue range of `50-100 billion. The compensation level at 75th percentile in this revenue bracket is more than four times the 25th percentile. The overall correlation of executive compensation with key fundamentals like revenue size remains low in India compared to western economies1. For companies that offer long-term incentives, approximately half of the total compensation is not guaranteed i.e. it is either delivered through annual variable pay or long-term incentives. For these companies, annual variable pay is approximately 40% of fixed pay and long-term incentives are approximately 50% of fixed pay. The CEO compensation on an average is 2.33 times the compensation of other CXOs2 (refer Table 2). If
The Nomination and Remuneration Committees of the Board have an interesting and challenging task of balancing what seem to be divergent aspects of executive compensation
Source: Aon HewittSource: Aon Hewitt
Chart 1
CEO Total Cost to Company with LTI (` Million) CEO Total Cost to Company with LTI (` Million)
Source: Aon Hewitt
CEO Pay Mix
www.aon.com/india06

we analyze the ratio of CEO compensation with other CXOs in companies that offer long-term incentives, we see that there is not much difference in fixed pay ratio (1.93 in all companies and 2.08 in companies with LTI at median levels), however, the ratio is much higher on TCC with LTI (2.06 in all companies and 2.62 in companies with LTI at median levels). It is evident that companies offering LTI create a considerable difference through higher long-term incentive grants to the CEO.
Table 2: Ratio of CEO Pay to Key CXOs
All Companies Fixed Pay TCC w/o LTI TCC with LTI
25th %ile 1.52 1.61 1.61
Median 1.93 2.04 2.06
Average 2.03 2.23 2.33
75th %ile 2.24 2.50 2.69
Source: Aon Hewitt
Cos. with LTI Fixed Pay TCC w/o LTI TCC with LTI
25th %ile 1.71 1.96 2.05
Median 2.08 2.38 2.62
Average 2.18 2.47 2.73
75th %ile 2.37 2.74 2.92
Source: Aon Hewitt
The ratio of CEO compensation to other CXOs differs substantially by industry (refer Table 3). If we analyze companies that have long-term incentives, the ratio on total compensation is lowest in manufacturing sector reflecting that the difference in CEO and other CXO level compensation is lowest in this sector. The differential in CEO and CXO level pay is highest in the IT sector mainly on account of larger long-term incentive grants. In our view, these ratios are fairly low compared to differentials we see between the CEO and next level CXOs in western economies.
Table 3: Industry-wise Ratio of CEO Pay to Key CXOs
Industry Fixed Pay TCC w/o LTI TCC with LTI
FMCG 2.17 2.39 2.45
Infrastructure 2.29 2.37 2.37
IT 2.21 2.32 3.00
ITeS 1.79 2.03 2.10
Manufacturing 1.64 1.80 1.84
Other Services 1.98 2.05 2.09
Source: Aon Hewitt
Compensation structure for CXOs (refer Chart 2) shows that approximately 40% of total pay is not guaranteed and is in the form of annual incentives or long-term incentives (considering only those companies that offer long-term incentives). Annual variable pay as a percentage of fixed compensation is approximately 30% and long-term incentives are approximately 37% of fixed pay.
Chart 2: CXO Pay Mix
Source: Aon Hewitt
Wealth CreationThe third important factor is change in compensation packages that provide executives an opportunity to create wealth. Stock option programs have been used traditionally to provide this opportunity and continue to do so. However, the stock based long-term incentive component for executives should be viewed in the right context i.e. in compensation surveys, the long-term incentive values are captured as on the date of grant using fair value methodology (e.g. worth of stock options on the grant date using models like Black-Scholes, Binomial, etc.). It is important to note that this fair value does not necessarily show the wealth creation opportunity of the grant. In most models, the starting point is share price on grant date and fair value in all cases is less than or equal to share price on grant date (depending on number of factors, fair value of “at the money” stock options typically vary from 30% to 50% of share price and fair value of full value instruments i.e. options issued at par value of share vary between 90-100% of share price on
The overall correlation of executive compensation with key fundamentals like revenue size remains low in India compared to western economies
PERSPECTIVE
India • Volume 5 • Issue 1TotalRewards QUARTERLY
07

grant date). So, while the survey data may show a lower long-term incentive component for some industries (e.g. other services which include e-Commerce), the actual realized wealth or realizable wealth could be multiple times of fair value. This is especially true for new age businesses like e-Commerce where valuations have increased multifold in a very short span of time creating wealth both for shareholders and executives. What is becoming increasingly important is the pace of wealth creation. On one side of the spectrum we have traditional manufacturing businesses that are facing tough times with overall global economy being slow and on other side are new age businesses like e-Commerce where valuations are multiplying in matter of months. Option holders in companies on these two sides of the spectrum see a very different wealth creation opportunity. This is the area where the Compensation Committees and the Boards need to be cautious and ensure that long-term health of an organization is by no means compromised to increase the pace of wealth creation. Sustainability of performance is the key in the longterm health of a company and the structure of stock programs should aim at providing the same. Our academic analysis of stock option programs, to an extent, proves that albeit a slower pace, option programs have created wealth for executives in most sectors over the long run and the wealth realized by executives is multiple times the fair value determined on the date of grant.
Realized vs. Fair Value DebateWe analyzed data from 43 listed organizations that form part of Sensex and Nifty excluding the Public Sector Enterprises. Assuming that these companies made an “at the money” stock option grant in April 2010, most common practices of vesting and exercise periods, these options would have had an “expected exercise” period
of 4.5 years i.e. options will be exercised in October 2014. 25% of these companies’ options would have been underwater as of October 2014 (share price in October less than the exercise price i.e. share price on grant date). Majority of these organizations are part of infrastructure and manufacturing, two sectors that have been facing strong headwinds both from global economic standpoint and internal policy challenges. Our analysis show that if we consider all companies i.e. including companies with underwater options (see Chart 3), the realized gain from options would have been 2.16 times the fair value on an average. Excluding the companies with underwater options (see Chart 4), the realized gains would have been 2.83 times of fair value on an average. This essentially means that if an executive was granted `10 million worth of options (the value considered in the survey), the realized gain is actually `28.3 million.
Chart 3
Source: Aon Hewitt
Chart 4
Source: Aon Hewitt
The realized gains shown here are assuming that the options are exercised on the expected exercise date which is mid-way between options vesting and expiry. If the options are held till maturity the realized gains could be much higher if the stock price maintains the growth momentum.
If we consider all companies i.e., including companies with underwater options, the realized gain from options would have been 2.16 times the fair value on an average
www.aon.com/india08

Aditya Nanavaty Senior Analyst,
McLagan, An Aon Company
Anubhav Gupta Senior Consultant,
Aon Hewitt
For more information, please write to us at [email protected]
Follow us on LinkedIn at Aon India & Twitter @Aon_India
Surbhi Jain Consultant,
Aon Hewitt
Compensation Committees and the Boards need to be cautious and ensure that long-term health of an organization is by no means compromised to increase the pace of wealth creation
conclusionExecutive compensation is about creating a right balance between expectations, fairness, competitiveness, performance and sustainability. All these factors should be considered from both the executive’s standpoint and also from the standpoint of other stakeholders which include shareholders, customers and other employees. The Compensation Committees and the Boards have an unenviable task to find this right balance and ensure that the compensation decisions are justified and are fair to all. With the Indian economy on the verge of getting back to a high single-digit growth rate, the expectations for executives who efficiently lead the organizations and take advantage of opportunities will be to get rewarded in a fair manner. The Compensation Committees while managing these expectations need to ensure that performance is real and sustainable, and the rewards reflect these sound principles of governance.
Data Source:1. Refer to our story in Total Rewards Quarterly Volume 4, Issue 2
2. Data referred to includes CFO, COO, CHRO, Head of Sales/S&M and Large
Business Heads
India • Volume 5 • Issue 1TotalRewards QUARTERLY
09
India Inc. Prepares for a Long Innings
www.aon.com/india10
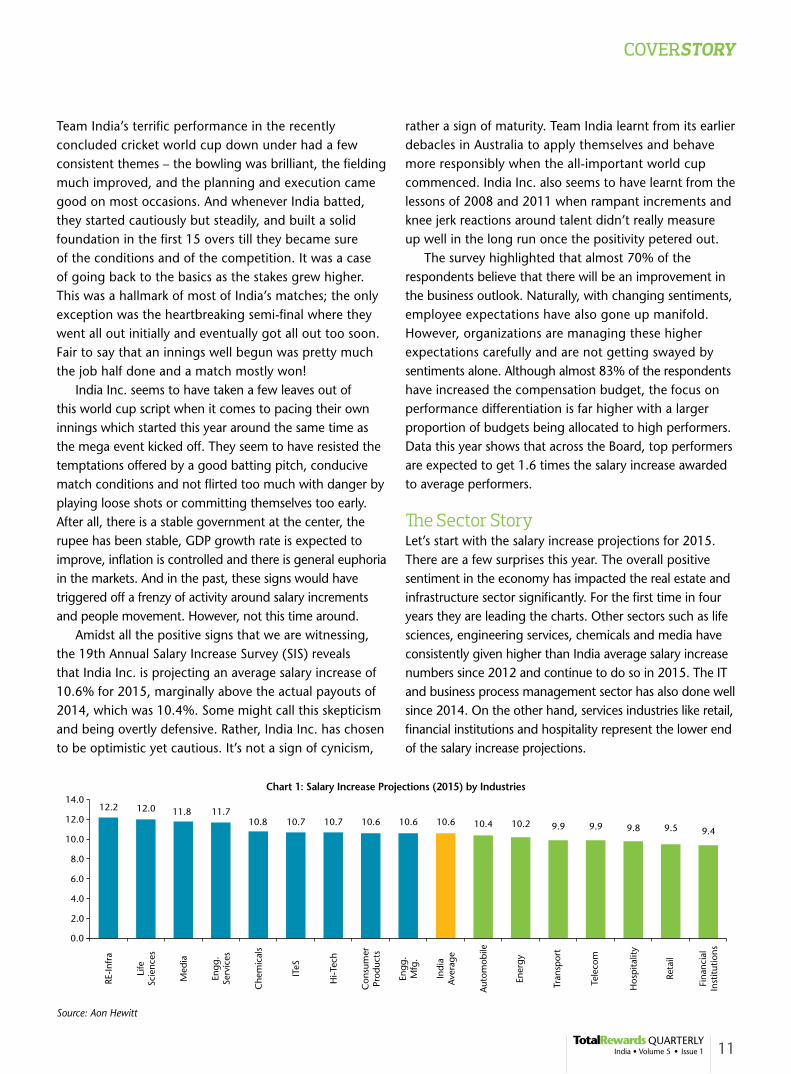
Team India’s terrific performance in the recently concluded cricket world cup down under had a few consistent themes – the bowling was brilliant, the fielding much improved, and the planning and execution came good on most occasions. And whenever India batted, they started cautiously but steadily, and built a solid foundation in the first 15 overs till they became sure of the conditions and of the competition. It was a case of going back to the basics as the stakes grew higher. This was a hallmark of most of India’s matches; the only exception was the heartbreaking semi-final where they went all out initially and eventually got all out too soon. Fair to say that an innings well begun was pretty much the job half done and a match mostly won! India Inc. seems to have taken a few leaves out of this world cup script when it comes to pacing their own innings which started this year around the same time as the mega event kicked off. They seem to have resisted the temptations offered by a good batting pitch, conducive match conditions and not flirted too much with danger by playing loose shots or committing themselves too early. After all, there is a stable government at the center, the rupee has been stable, GDP growth rate is expected to improve, inflation is controlled and there is general euphoria in the markets. And in the past, these signs would have triggered off a frenzy of activity around salary increments and people movement. However, not this time around. Amidst all the positive signs that we are witnessing, the 19th Annual Salary Increase Survey (SIS) reveals that India Inc. is projecting an average salary increase of 10.6% for 2015, marginally above the actual payouts of 2014, which was 10.4%. Some might call this skepticism and being overtly defensive. Rather, India Inc. has chosen to be optimistic yet cautious. It’s not a sign of cynicism,
rather a sign of maturity. Team India learnt from its earlier debacles in Australia to apply themselves and behave more responsibly when the all-important world cup commenced. India Inc. also seems to have learnt from the lessons of 2008 and 2011 when rampant increments and knee jerk reactions around talent didn’t really measure up well in the long run once the positivity petered out. The survey highlighted that almost 70% of the respondents believe that there will be an improvement in the business outlook. Naturally, with changing sentiments, employee expectations have also gone up manifold. However, organizations are managing these higher expectations carefully and are not getting swayed by sentiments alone. Although almost 83% of the respondents have increased the compensation budget, the focus on performance differentiation is far higher with a larger proportion of budgets being allocated to high performers. Data this year shows that across the Board, top performers are expected to get 1.6 times the salary increase awarded to average performers.
The sector storyLet’s start with the salary increase projections for 2015. There are a few surprises this year. The overall positive sentiment in the economy has impacted the real estate and infrastructure sector significantly. For the first time in four years they are leading the charts. Other sectors such as life sciences, engineering services, chemicals and media have consistently given higher than India average salary increase numbers since 2012 and continue to do so in 2015. The IT and business process management sector has also done well since 2014. On the other hand, services industries like retail, financial institutions and hospitality represent the lower end of the salary increase projections.
COVERstory
Chart 1: Salary Increase Projections (2015) by Industries
Source: Aon Hewitt
India • Volume 5 • Issue 1TotalRewards QUARTERLY
11

Table 1: Top 10 Industries with Highest Projected Increases for 2015
Industry 2015(P) 2014 2013 2012 2011
RE - Infra 1 5 1
Life Sciences 2 1 1 1 2
Media 3 9
Engineering Services
4 4 4
Chemicals 5 2 6 8 7
Hi-Tech 6 4 7 5 8
ITeS 6 7 10
Consumer Products
8 3 2 2 5
Engineering Manufacturing
8 4 7 5
Automotive 10 8 5
Source: Aon Hewitt
While life sciences has consistently given out one of the highest salary increases in the last five years, it is interesting to note that industries like telecom, retail and financial institutions that have traditionally given high increases, no longer feature in the top 10. And there are a few reasons which explain that – on the back of buoyant growth and high increases in the past, their fixed pay continues to be higher in relation to the other industries; the business performance still continues to be largely difficult on an overall basis and the need to be more judicious in payout continues to be high.
The Match Winners Who MatterPay for performance is not a clichéd jargon anymore. Over the years, India Inc. has moved from a socialistic view with limited differentiation based on performance; to a stage, where organizations have rigorously followed the bell curve principles. India Inc.’s performance distribution curve today is very different from what it was earlier. Employee distribution has become significantly sharper since 2007. Almost 68% of the population falls under the
‘meets expectation and below’ category. This proportion has increased by approximately ~20% since 2012. In the last five years, the percentage of employees with top performance rating has dropped by close to 30%, implying that organizations are not hesitating to differentiate sharply on the basis of performance and are allocating the share of the total increase budget accordingly.
Chart 2: Performance Rating Distribution Expressed as Percentage
Source: Aon Hewitt
An increasing percentage of employees moving away from the top 2 ratings, shows how invested firms are today ensuring that they recognize true performance. Even though firms have reported that they have increased their C&B budget, a significant proportion of this increased budget is to reward high performance. A stricter performance curve only assists this process. Since many firms today are able to differentiate higher performance and potential, their ability to drive this pay for performance is sharper. The people who make a difference and are the real match winners get rewarded commensurately; the rest of the team has to earn their stripes and there are no free loaders anymore.
Is the Divide Increasing?Top performers in India will get almost 1.6 times of what their colleagues will get for being solid citizens. Amongst all industries, financial institutions is giving out the highest differentiation at 1.8 times. Life sciences, consumer product, telecom and ITeS are a close second at 1.7 times. While financial institutions leads the pack, it is interesting to note that industries like life sciences are also making the cut as top differentiators. Other industries like telecom and consumer products have continued rewarding high performance. Junior management is gaining the most due to this stark differentiation. At this level, the top performers receive almost 1.6 times, whereas the top and middle management gets ~1.5 times.
Even though firms have reported that they have increased their C&B budget, a significant proportion of this increased budget is to reward high performance
Rank 1, 2, 3 Rank 4, 5, 6, 7 Rank 8, 9, 10
www.aon.com/india12
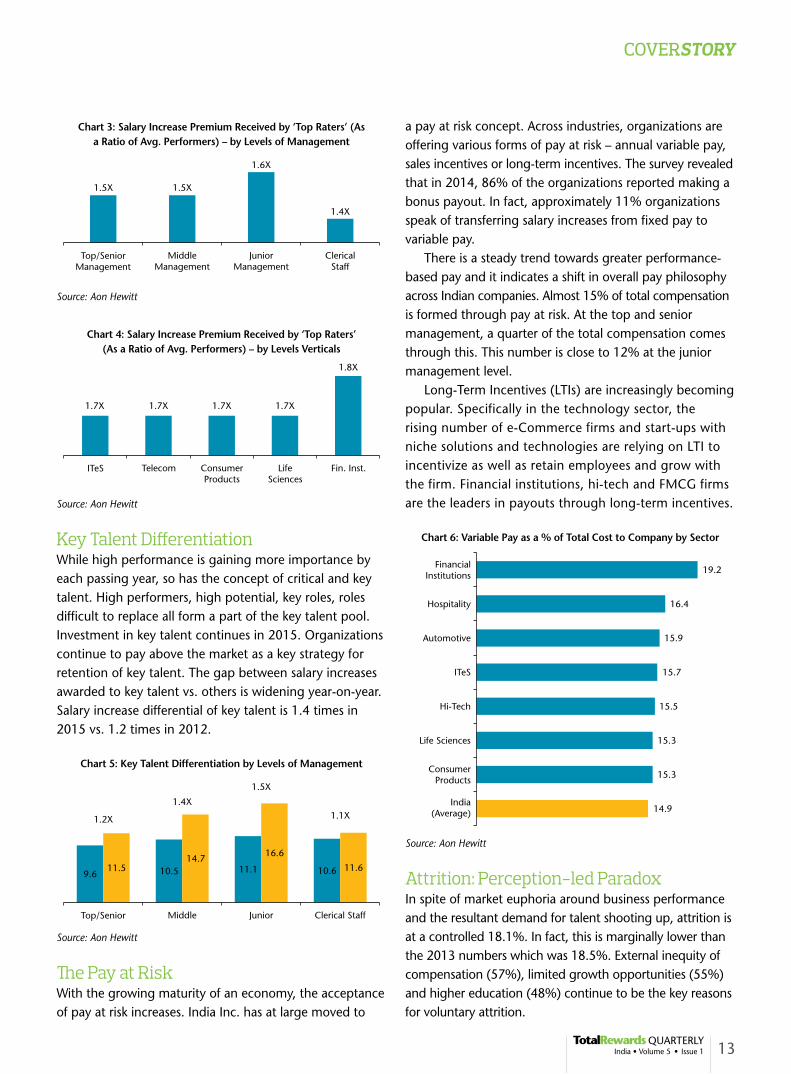
Chart 3: Salary Increase Premium Received by ‘Top Raters’ (As a Ratio of Avg. Performers) – by Levels of Management
Source: Aon Hewitt
Chart 4: Salary Increase Premium Received by ‘Top Raters’ (As a Ratio of Avg. Performers) – by Levels Verticals
Source: Aon Hewitt
Key talent DifferentiationWhile high performance is gaining more importance by each passing year, so has the concept of critical and key talent. High performers, high potential, key roles, roles difficult to replace all form a part of the key talent pool. Investment in key talent continues in 2015. Organizations continue to pay above the market as a key strategy for retention of key talent. The gap between salary increases awarded to key talent vs. others is widening year-on-year. Salary increase differential of key talent is 1.4 times in 2015 vs. 1.2 times in 2012.
Chart 5: Key Talent Differentiation by Levels of Management
Source: Aon Hewitt
The Pay at riskWith the growing maturity of an economy, the acceptance of pay at risk increases. India Inc. has at large moved to
a pay at risk concept. Across industries, organizations are offering various forms of pay at risk – annual variable pay, sales incentives or long-term incentives. The survey revealed that in 2014, 86% of the organizations reported making a bonus payout. In fact, approximately 11% organizations speak of transferring salary increases from fixed pay to variable pay. There is a steady trend towards greater performance-based pay and it indicates a shift in overall pay philosophy across Indian companies. Almost 15% of total compensation is formed through pay at risk. At the top and senior management, a quarter of the total compensation comes through this. This number is close to 12% at the junior management level. Long-Term Incentives (LTIs) are increasingly becoming popular. Specifically in the technology sector, the rising number of e-Commerce firms and start-ups with niche solutions and technologies are relying on LTI to incentivize as well as retain employees and grow with the firm. Financial institutions, hi-tech and FMCG firms are the leaders in payouts through long-term incentives.
Chart 6: Variable Pay as a % of Total Cost to Company by Sector
Source: Aon Hewitt
Attrition: Perception-led Paradox In spite of market euphoria around business performance and the resultant demand for talent shooting up, attrition is at a controlled 18.1%. In fact, this is marginally lower than the 2013 numbers which was 18.5%. External inequity of compensation (57%), limited growth opportunities (55%) and higher education (48%) continue to be the key reasons for voluntary attrition.
COVERstory
13India • Volume 5 • Issue 1TotalRewards QUARTERLY

It is interesting to note that key talent attrition has moved up. In 2014, it was at 5.9% vs. 4.5% in 2013. While organizations have not jumped at the positive sentiments in the market and have not gone all out on hiring, they have definitely started looking out for better talent available in the market. The services industry has been hit hardest by this phenomenon. Particularly, ITeS and hospitality have key talent attrition in the 9%+ category, which is a big concern. Manufacturing firms on the contrary continue to keep their key talent attrition at bay.
Table 2: Key Talent Attrition
Highest Key Talent Attrition
ITeS 9.7
Hospitality 9.0
Financial Institutions 7.2
Hi-Tech 6.6
Media 6.2
Source: Aon Hewitt
total rewards: The time has comeWith the increasing pressures on the salary budgets, organizations are now taking a holistic approach to rewards. Firms now focus on other aspects of rewards apart from compensation. They have increasingly started listening to their employees, focusing on engagement scores and employee preference surveys to understand the pulse of the workforce and provide solutions that help improve the employee’s lifestyle, without increasing the compensation budgets. Of the 500+ organizations that were surveyed, 76% have indicated an increase in their overall benefits budget. The changing demographics, spanning across Gen X, Y and Z have forced organizations to drop the ‘one-size-fits-all’ approach. Employee preference is now an additional factor considered when designing benefits program for the workforce. Employee wellness and health benefits are gaining significant momentum.
While salary-linked benefits (retirals) are mandatory, firms are designing bespoke benefits plans to meet separate needs of Gen X, Y and Z. Therefore, flex-ben has been taken up quite seriously by many firms. The number of people availing these benefits has also seen an increase from the years before. Benefits have been identified as one of the key retention measures apart from compensation. In spite of the efforts made by organizations to build customized rewards solutions for their employees, the perceived value of the rewards is restricted to compensation. Organizations are now increasingly focusing their efforts to develop an effective communication program to enhance employee appreciation of the Total Rewards paradigm, rather than the traditional mindset that cash is king.
The Match is yet to be WonWe believe that the industry’s response to the economic sentiment and reform-led growth outlook has been sustained, steady and systematic. This augurs well for a country that is increasingly bringing in maturity in its orientation towards rewards, retention and performance differentiation. It also makes sense as some organizations believe that the positive business sentiment and market buoyancy is yet to take shape in the form of a spurt in actual business – most believe this to become a reality in the next 6-8 months. And even if the evidence of a strong economic upturn emerges sharp and clear, India Inc. would do well to keep humility and prudence at the forefront of its rewards strategy, and be mindful of the scars that previous profligacies have left. Team India may have bowed out of the world cup after a thoroughly professional performance, but India Inc. needs to maintain the focus and the mindset to win the longer term battle of people and profitability as the good days start to shine, sooner than later.
Employee preference is now an additional factor considered when designing benefits program for the workforce
For more information, please write to us at [email protected]
Follow us on LinkedIn at Aon India & Twitter @Aon_India
Roopank ChaudharyAssociate Partner, McLagan,
An Aon Company
Sagorika Roy Manager, McLagan,
An Aon Company
www.aon.com/india14

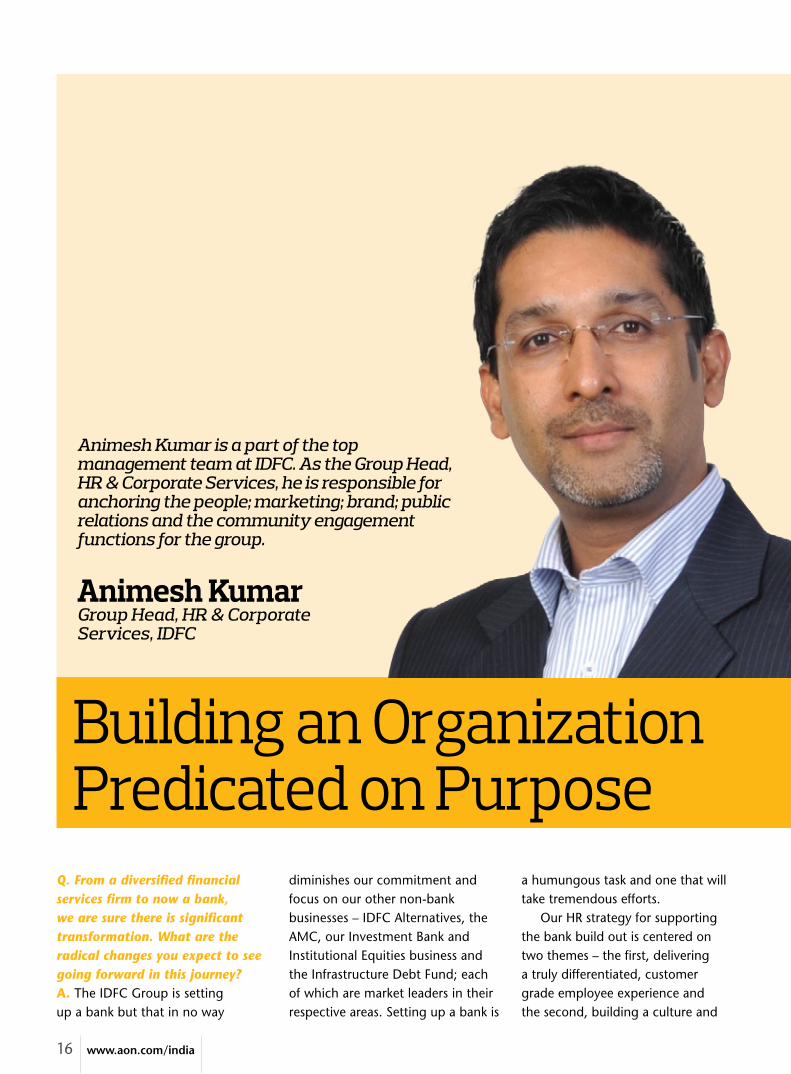
Building an organization Predicated on Purpose
Animesh KumarGroup Head, HR & Corporate Services, IDFC
Q. From a diversified financial services firm to now a bank, we are sure there is significant transformation. What are the radical changes you expect to see going forward in this journey?A. The IDFC Group is setting up a bank but that in no way
diminishes our commitment and focus on our other non-bank businesses – IDFC Alternatives, the AMC, our Investment Bank and Institutional Equities business and the Infrastructure Debt Fund; each of which are market leaders in their respective areas. Setting up a bank is
a humungous task and one that will take tremendous efforts. Our HR strategy for supporting the bank build out is centered on two themes – the first, delivering a truly differentiated, customer grade employee experience and the second, building a culture and
Animesh Kumar is a part of the top management team at IDFC. As the Group Head, HR & Corporate Services, he is responsible for anchoring the people; marketing; brand; public relations and the community engagement functions for the group.
www.aon.com/india16

ThEinterview
organization that is fired by purpose. While the conceptual underpin of our HR strategy has not changed from our earlier avatar, setting up a bank creates an execution challenge of an entirely different magnitude. “Delivery innovation at scale” will be the biggest shift and we expect to use mobile technology in radically new ways to create a self-service ecosystem that is intuitive and personalized. The other big shift we expect to see is in the “role of the manager”. HR must take a leaf out of risk, and just as line managers are the first line of defense from a risk management perspective so must they become the first line of people management. Line managers cannot outsource people management to HR.
Q. Given the competition with mainstream banks, what would you want to retain and reflect as your employee value proposition?A. Our value proposition in HR is built around four pillars:a) Attract and motivate the
younger employee base – we are discovering their interests, attitudes, what motivates them and what they want in the workplace. And we have come up with interesting insights – besides the attraction of being part of the team that is reimagining the way banking is done, personalization and purpose are powerful motivators for this genotype
b) Act as a beacon for women returning to work – anecdotally we know that in India a significant number of women tend to take a break from their careers at the point of starting a family. A lot of them would like to come back to full time work and our focus
is on creating a workplace that offers them that opportunity
c) Making banking services available to rural populations that historically have been underbanked is a key focus of our banking aspiration. For us, rural banking is not the cost of doing banking but an integral part of our value proposition for the communities we seek to serve. This implies that between 50-60% of the IDFC headcount will be rural. Delivering our value proposition in rural geographies will need innovative delivery formats. As an example, our wellness model of risk assessment, medical advice, counseling, social support is expected to be delivered entirely through a technology-enabled ecosystem supported with a layered on-ground response framework that leverages NGO partners that we work with for community development
d) Retaining leaders – while it is critical to retain talent across levels, for any start-up having continuity of people in leadership roles is critical for success. We are building a framework that provides a “reason to stay” for employees across all levels but with a special focus on the leadership roles
These four pillars underpin our Employee Xperience (EX) model. The significance of EX is, that the biggest swing factor in the quality of service delivered, is people. Delivering what you experience personally is so much easier, not to mention it makes for a happier and more engaged workforce. So the entire Employee Xperience platform is built on the premise that
employees should be treated the same way we would treat the most valuable customer of the bank. This concept of EX is not HR- focused, but instead employee- focused. So EX will manage all services and transactions that an employee will “consume” in a company – bills reimbursement, procuring stationery, internal IT support, internal communications, social platforms and of course, all HR-related services and transactions will be delivered through this framework.
Q. With the current growth plans, there has been an increased focus on hiring. How has your talent strategy changed to cater to this business need?A. I think we have a powerful employer brand and attracting talent has not been a challenge. We are not a new player in that sense and especially in the financial services space, we have built a unique position of being “hatke” (different). That said, the deeper we go into the country the greater is the variety of channels and models that we discover. Let me share a short story to explain – as part of our process of identifying locations for our rural bank branches we had a team that was travelling in rural
If we treat employees as commodities, it is very likely that they will treat customers the same. In a service industry, you must treat an employee as you would want them to treat your best customer
17India • Volume 5 • Issue 1TotalRewards QUARTERLY

Madhya Pradesh. While on these visits people would ask us why we were making inquiries. As is practice, we handed out visiting cards and informed them about IDFC setting up a bank. After two days of such interactions, we were flooded with calls and text messages with people expressing interest and wanting to join IDFC! We eventually had to build a process to handle this information and engage potential hires. From that one trip to the district and a few visiting cards, we identified almost 150 people. I am not sure if this experience will play out in other rural geographies but you are just overawed by how diverse this country is – there is a war for talent in metros and two hours flight time away you can hire people by just being there and talking about your plans! Our primary focus when hiring is on culture fit. We run a fit-for-culture assessment across all levels right down to the frontline. The intensity increases as we move up the hierarchy with increased weightage at senior levels. You could join us even if you are 80% on technical competence but you must
meet our culture fit requirements a 100%. Although this is the aspiration of every HR Head, it is having a leadership team like we do at IDFC which is committed to building an organization with the right kind of cultural framework that allows me to push this agenda. I will always compromise individual brilliance on the altar of corporate culture because misfits, even if they are outstanding performers create a domino effect of compromising the culture in your company and that is a slippery slope! Start pulling that one loose string and the entire fabric starts to unravel. In terms of origination, we are experimenting with some interesting frameworks. One interesting concept is the idea of video job descriptions. As evident, instead of writing a boring word document we will have the line manager talk about the job and bring out the passion and excitement of the role and why one should join IDFC. We are also experimenting with the technology of contextual and unstructured data search. This technology should be able to replace the visual scanning of CVs. If successful, this should help shortlist the right resumes and reduce our recruitment timelines and costs significantly.
Q. How would you use rewards/pay effectively to drive the right behaviors in the financial services industry?A. We believe there are two sides to rewards – intrinsic (motivators) and extrinsic (demotivators). Demotivators as Herzberg explained are those elements, the absence of which will demotivate but increased presence of the same will not
necessarily motivate. For example, if the compensation for an employee is well-positioned when compared to the market, further increases will not alter behavior or performance in any significant manner. Hence, extrinsic rewards have limited utility in driving top performance. The intrinsic elements on the other hand include intangible things like the joy of doing the job that you do, the culture of the organization, working with a great team, finding a purpose at work, etc. These on the other hand have almost a limitless correlation with engagement and performance. The approach we have is to maintain threshold on the extrinsic factors but our focus is on investing in intrinsic rewards to help our workforce align to a sense of purpose and create an emotional connect which is crucial to creating differentiated and rich outcomes.
For more information, please write to us at
total.rewardstaonhewitt.com
Follow us on LinkedIn at Aon India
& Twitter @Aon_India
Always compromise individual brilliance on the altar of corporate culture because misfits, even if they are outstanding performers create a domino effect of compromising the culture in your corporate. Start pulling that one loose string and the entire fabric starts to unravel
www.aon.com/india18

For more information, please write to us at
Follow us on LinkedIn at Aon India
& Twitter @Aon_India
Aon hewitt Salary Increase Survey is Going Mobile!
Launching soon!
For making budgetary decisions, our Salary Increase Survey app gives rewards managers the numbers they need, fast. It enables them with detailed budgetary information to make informed, accurate decisions on the go!
Key Features
Quick access to information
Ease of navigation
Information on trends across the years

Data-Driven Insights — Finding the Answer to the Puzzle
www.aon.com/india20
In the past decade, the HR function has undergone a significant transformation. It has evolved from being a support function to a strategic business driver. This has also significantly changed business’ expectations from HR. The 2008 economic crisis also brought in fresh set of challenges for HR professionals. As custodians of one of the highest cost items, it was imperative for them to make prudent decisions on investments, to be able to deliver on a higher ROI. This challenge forced HR professionals to innovate and improve their decisioning process. They had to dig deeper into the existing data at hand and develop insights and identify true performance and reward the same. The analytics and the rigor behind rewards decisions have increased drastically. Let us examine the ITeS sector. Compensation in this sector is one of the highest cost items in the operating expenses. The sector has emerged strongly from the 2008 economic crisis and the business outlook has been far more positive, but the optimism has not translated into salary increases. In spite of the overall sector growing by more than 15% in the past two years, the salary increases provided have been stable around 10.2%. The greater focus on data has ensured that the HR professionals are able to identify and reward true performance, which is demonstrated by an increasing differentiation for top talent.
However, despite the salary increase efforts by the industry, compensation still remains one of the top reasons for attrition in the industry, especially for the key talent that the companies are trying to retain. Further analysis of engagement scores across the industry has indicated, that in spite of rigorous efforts by the HR teams in the sector, the average engagement levels on the rewards programs has seen no impact. We still continue to miss the mark. This highlights the need for further analysis and deeper understanding of the employee preferences. This need is further accentuated by the fact that organizations, in the current day, cannot drastically change their salary structures, and hence, are being forced to utilize levers other than compensation to drive engagement. There is a plethora of data available around employees: Just as we speak about a 360 degree view of customer lifecycle, data analytics
Despite the salary increase efforts by the industry, compensation still remains one of the top reasons for attrition in the industry
PERSPECTIVE
21India • Volume 5 • Issue 1TotalRewards QUARTERLY

should now focus on getting a 360 degree view of employees across the employee lifecycle. There is a need to dive deeper to understand the differences in expectations across the various sub groups of employees. Though, we as professionals are extremely cognizant of the power of analytics, we would need to build a far more structured approach to the process.
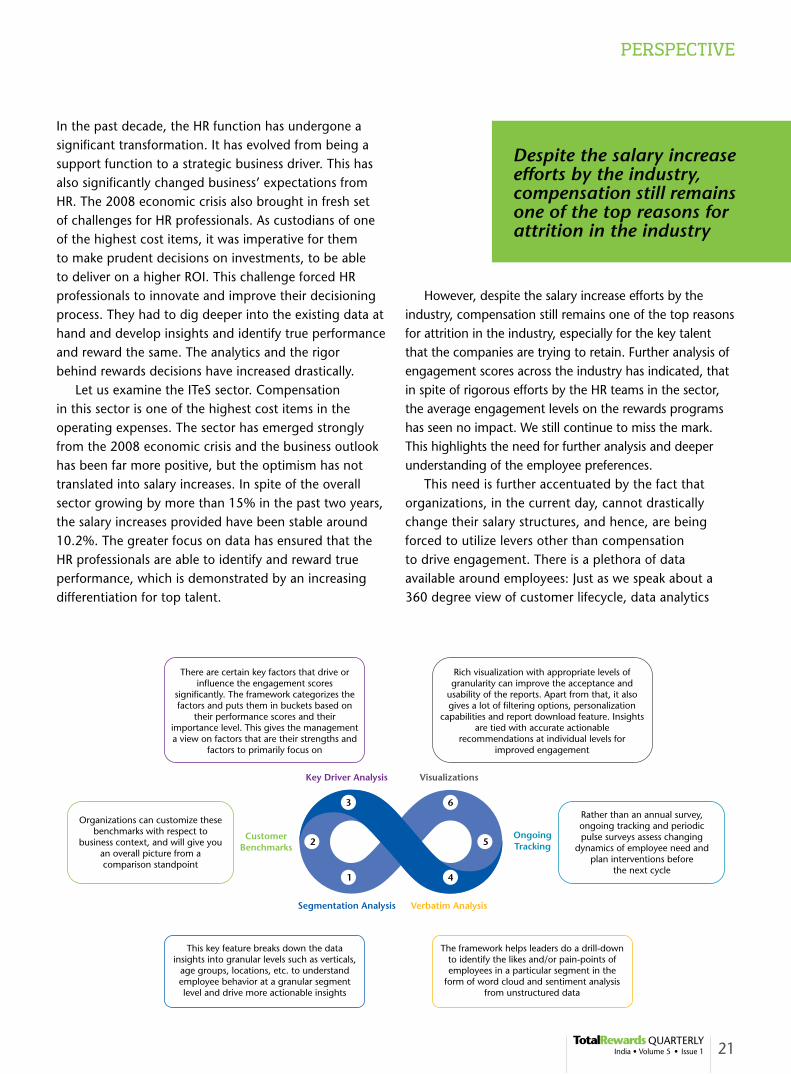
The BrIDGei2i Framework for Deeper InsightsBRIDGEi2i has created a framework that uses the available data to identify data-driven employee lifecycle analysis and improve business metrics.
case study 1 – relying on Analytics to Build Focused Interventions to Drive engagementFor organization ‘A’, in spite of exhaustive engagement surveys, action planning workshops, multiple interventions and investments, the impact on the engagement score was negligible. The organization decided to partner and leverage on the large data inputs received to build a targeted approach to driving employee engagement across employee pools. The objective of the study was to:1. Understand satisfaction and engagement levels of the
overall as well as specific segments of employees2. Provide specific, actionable recommendations
at a granular detail in order to make meaningful interventions and ensure sustainable improvement in satisfaction, engagement and morale
Anchor Questions: The anchor questions were focused on employee satisfaction, willingness to act as an advocate for the organization and employee engagement Themes: A dedicated set of themes were identified after brainstorming with the HR team, to identify key areas which impact the employee’s engagement and collect more focused data. The themes ranged from co-workers,
work content, integrity and communication, value to Total Rewards, manager and performance management Segmentation Analysis: The analysis was done at multiple levels such as – horizontal levels, business units, enabling units, geography, employee band, tenure in the company, custom dimensions – Gen Y, B School hires, women employees, highly valued contributor, top talent, etc. Custom Benchmarks: Relevant benchmarks were chosen based on the employee segments at every level, right from the business unit to the individual teams Key Driver Analysis: The drivers of satisfaction, engagement and advocacy were identified for each employee segments and manager levels. Each manager got visibility to his/her team’s performance and clear mandate on strength and improvement opportunities. Manager could also benchmark his/her team’s performance relative to other teams Verbatim Analysis: Verbatim analysis was conducted to augment the quantitative analysis with picture of employee voice drilled-down at granular levels to identify the likes and/or pain-points of employees in each segment in the form of sentiment analysis, theme and topic clouds. In-depth analysis was conducted to highlight the employee mood around particular topics such as growth, salary, HR policies, etc. Continuous Tracking: Employee responses were tracked to key initiatives, trigger events to understand the needle moments in employee engagement. These insights were used to create meaningful short-term course correction for managers Visualizations: Three types of reports were presented to the stakeholders – manager report, functional report and executive report Managers and Functional Heads found it easy to consume personalized recommendations in the form of interactive report with appropriate visualizations and benchmarks. Engagement research experts provided critical insights and recommendations to improve employee engagement at organization level to the top executives.
The ImpactWithout a drastic change in the salary framework and with re-prioritized initiatives, the organization was able to see an increase in engagement through the granular analysis and the pulse survey-driven planned interventions.
Given companies may not be able to drastically change their salary structures, are there ways then to look differently at employee engagement?
www.aon.com/india22
case study 2 – Better Analytics to Develop a More optimal variable Pay Allocation Model and to Forecast Drivers for AttritionIn order to institutionalize a performance-based rewards culture, the organization wanted to differentiate the variable compensation pools allocated to the units in accordance with their performance observed across few key parameters of balance scorecard along with understanding what drives attrition at a granular level and leverage employee data to formulate focused retention strategies. Data Used: The analysis for the tool was done across multiple parameters like business performance, targets and tolerance zones, total available budget, historic attrition information and employee demographics across levels
Approach for the Intervention Performance Differentiated: The first step was to normalize the key parameters in the balanced scorecard and to determine the best degree of performance differentiation using statistical measures within the overall variance Optimization: Optimized the differentiated bonus pools based on sub business performance, making dynamic changes to employee rating distributions and average bonus pay outs while still reconciling to the overall total Tools Development: Developed an automated spreadsheet tool that took in performance input, while keeping bonus fund allocation criteria to be completely flexible and generates the most optimal outcome Drivers of Attrition: Formulated key hypothesis and tested them using the data to understand what drove attrition and to identify effective retention factors that have shown significant impact in the past Forecasting Model: Created ensemble models optimized for minimizing forecasting error that provided a reliable four-month ahead forecast of expected attrition levels across various skills groups
The ImpactThe actionable recommendations enabled the organization to have a more scientific data backed allocation of budgets, and effectively combat attrition and maximize retention. The forecasting model is enabling the organization to develop a proactive hiring plan to ensure availability of critical skills.
The Full circle“When people go to work, they shouldn’t have to leave their hearts at home.” – Betty Bender Evolving workforce and growing economy call for such a deep dive into the data to identify what motivates your employee and how to better their working environment. Harvard Business Review speaks about the Whole Self Model which reflects not just the employee work self but also his/her relationships, internal self and external self. Traditional ways of annual employee touchpoints may be fast moving towards extinction in this scenario. When we look into the future, big data might be analysing potential candidates peer rated contributions on social media, wearable devices might be sharing insights on employee productivity. The futuristic view may not show a dramatic increase in salary hike. But a 360 degree understanding of employees across the lifecycle may lead the way to a deeper and granular understanding of employees through a combination of data and behavioral science. And not wait to be surprised by the next cycle of attritions and engagement reports.
PERSPECTIVE
Evolving workforce and growing economy call for a deep dive into the data to identify what motivates your employee and how to better their working environment
For more information, please write to us at [email protected]
Follow us on LinkedIn at Aon India & Twitter @Aon_India
This article has been written in partnership with Bridgei2i
23India • Volume 5 • Issue 1TotalRewards QUARTERLY

Flexing it with BenefitsEconomists believe there is a reason that explains why people make the choices they do. From observing people's behavior, economists ascertain that the best theory for why individuals make economic decisions is that they make choices that are in their own best interest. This principle of choice is evident in modern day business environment – restaurants serving buffet meals, hypermarkets offering a variety of choices for a single product, etc. The concept of “flexible benefits” emerges from this very premise of choice and can be used as a very effective rewards tool by human capital experts to drive overall employee satisfaction and engagement.
While organizations in India have run flexible compensation plans successfully for years, little has been explored or debated on the subject of "flexible benefits".Apart from the very basic premise of choice, flexible compensation thrives on the principles of tax management. From the period of early industrialization in India, there was a pre-dominance of government and public enterprises and the very socialist fabric of post-independence India with dominance of trade unionism led to a very different connotation of the term “employment” whereby the employee would consider an employer to be someone who would look after all his/her basic needs of food, shelter and
www.aon.com/india24

clothing. Thus, the emphasis would largely be on housing, healthcare, pensions and numerous other emoluments in kind whereas the overall emphasis on cash was very less. Those were also the days where individuals would work all their lives with a single employer and would expect the employer to take care of all of his/her family’s needs. Preferences were limited; as long as basic needs of food, shelter and clothing were met, satisfaction prevailed and thus any employer who took care of these could easily expect a lifetime of commitment and loyalty from his/her employees. Benefits in those days were merely basic needs and exercising a choice was never an option. Cash emoluments were largely to meet day-to-day needs and some nominal savings – because the employer would largely take care of healthcare needs, post retirement needs, housing, children’s education, basic amenities like transport and electricity (enterprises would have their own townships with all facilities at subsidized rates or offered as perks). With the advent of privatization in the 90s, the focus on rewards largely shifted to cash emoluments. What was reckoned as benefits, was perceived as an organization’s need to comply with regulation and cover potential risks arising out of health and life concerns of employees and beyond this, all other benefit offerings essentially blend into broader HR policies and guidelines. Does that mean benefits are completely out of flavor? If one was to simply go by the prevailing circumstances, the answer would be “Yes” and in this thinking rests a lot of complacency and lack of initiative. As against old times, where benefits could have been directly linked to livelihood, today the positioning of the benefits needs to be different from livelihood. Today, high salaries are more than sufficient to provide for livelihood – and still manage a significant disposable income in hand. In addition to this, the workforce continues to be influenced by dynamic economic factors, making them focus on issues of personal risk and long-term income security. Industry surveys show that the perceived value of benefits by employees has not yet been encouraging enough, in spite of the increased employer spending in traditional benefits programs. Employers have started looking beyond the concept of “one-size-fits-all” and are willing to offer flexible choices to employees by bringing in innovation in design, communication and by introducing technology as a key driver for plan administration.The question then is how benefits can augment the cash emoluments and still have a great amount of acceptability and utilization.
the Answer Lies in Adopting Flexible Benefits If your spend on benefits is quantified, let that amount be apportioned to employees as Flexi Spending Amount (FSA) and let employees decide what they want from a bouquet of offerings. So, if retirement savings is the top of the mind concern for some groups of employees, let them allocate their FSA to retirement. Likewise, if employees are individually covered for life insurance or health insurance, they should be free to divert part of the premium paid by the employer for such benefits to avail some other benefit from the bouquet of offerings which may have more significance as against an additional life or health cover. While this may be a very elementary conception of “Flexible Benefits”, the real challenge lies in design, delivery, communication, taxability and above all, technology.
Flexible Benefits - An evolving Journey in IndiaBeing in its infancy in India, flexible benefits are offered by companies on a limited scale in terms of benefit options and employee audience. The plan design or the level of flexing as we may call it, is generally modular in nature like a combo meal plan with limited benefit options centered around insurance and wellness. With seamless integration of technology-driven communication and administration and ensuing program viability, the level of flexing can be enhanced to the next level (core benefits + higher flex allowance) and then to that of complete flex (absolute freedom to employees in deciding their rewards).
Implementing a Flexible Benefits ProgramRedefining the Total Rewards Statement is the precursor to flex implementation, for which it is essential to assess the program feasibility taking into account factors namely employee aspirations, employer alignment and long-term cost & risk management encompassing the entire rewards spectrum. This would entail developing a
As against old times, where benefits could have been directly linked to livelihood, today the positioning of the benefits needs to be different from livelihood
India • Volume 5 • Issue 1TotalRewards QUARTERLY
25

Review current state for flex readiness
Objective setting• Benchmarking and • cost analysisEmpower alignment• Understand and enhance • employee’s value perception Establish action plan • and road map
Communicate Total Rewards Communicate the • value of an employee’s Total RewardDesign flex scheme• Technology implementation • and system roll out Introduce flex to a • pilot group
ReviewGather employee feedback• Study utilization• Review and fine tune• Roll out to wider audience•
RefreshReview market trends• Review offering• Introduce new elements• Refresh communication•
PERSPECTIVE
hypothesis through in-depth analysis of benefits utilization and benchmarking studies and testing it by conducting stakeholder interviews, employee surveys and focused group discussions. Simultaneously, a comprehensive review of internal HR systems and its seamless integration with technology-driven administration and its related communication is vital to putting in motion a successful flex program. Though perceived as a useful mechanism for addressing issues of employee empowerment and enhancing the perceived value of benefits, it is important that the stakeholders involved would also need to delve into critical aspects of long-term cost and risk management of the program. Flex being an evolving journey, it would be advisable for organizations planning to implement it as an alternate mode of benefit management, to initially roll it out to a limited audience, review utilization, fine tune and scale it up to a larger group by incorporating new elements.
technologyFor a flex program to be successful, it is imperative to have a robust technology platform integrating the core elements of benefits design, administration and communication. Online benefits platforms and mobile applications developed in-house by employers and the ones driven by technology companies, brokers and consultants have to be adept in harmonizing these core elements through constant innovation and enabling introduction of new benefit features.
As technology is changing the way we communicate, employees have expectations that devices used in their work-life matches that of their social life viz. smartphones and tablets.
Moving ForwardStriking a balance between leadership challenges and employee aspirations would be key to devising a rewards program that enhances the Employee Value Proposition (EVP). As India aspires for a transformation from an emerging vibrant economy into a mature one and industrial development being given the much needed fillip, the key to sustaining the competitive edge is to constantly innovate and reinvent itself in the value chain. The most important challenge being people related, the success of global companies with diverse workforces is defined by its ability to create, harness and retain the right talent and flexible benefits as an effective alternate mode of benefit management can be a game changing employee engagement tool to achieve these goals.
Souvik NagSenior Consultant,
Aon Hewitt
For more information, please write to us at
Follow us on LinkedIn at Aon India & Twitter @Aon_India
The Flex Journey for a Company
Feasibility Study
Current State
Restructuring the Total Rewards Statement is a prelude to introducing flexible benefits
Future State Scale Up Remain Market Leaders
Phase 1Launch Communication
and Design Flex
Phase 2Review and Scale Up
Phase 3Build Upon Success
www.aon.com/india26

For further details and queries, please write to us at [email protected]
Follow us on LinkedIn at Aon India & Twitter @Aon_India
"Total Rewards Statements" (TRS )An impactful approach to communicating your Total Rewards programOur research suggests that a majority of companies are spending vast sums of money on complex Total Rewards packages, which many employees do not fully understand or appreciate.
At Aon Hewitt, we believe that progressive organizations offer compelling rewards to employees. But the leverage of these offers is lost if it is not communicated effectively to the employees.
Aon Hewitt's comprehensive and customized approach to communicating Total Rewards can help:
We have built a comprehensive and robust online portal that communicates your Total Rewards programs. This portal generates unique and customized Total Rewards Statements for each employee, helping them see the value of their Total Rewards package.
Total Rewards Statements – Showcase the value, build engagement.
Enhance an employee's understanding of rewards programs
Define and articulate all elements of rewards programs
Showcase the differentiation of rewards programs from competitors
Enhance the appreciation of rewards programs

With the new government taking reigns and its reform-based approach, the Indian economy has been experiencing a sense of optimism last over the six months. Hiring trends at campuses mirror these market sentiments and show similar signs of positivity. This year, both the number of hires as well as pay packages offered, have seen a rise. The average number of campus hires for MBA graduates is expected to increase by 30% in 2015 as compared to 2014. Sectors dominating this increase – e-Commerce and KPO sector; are expected to increase the number of intakes by 33%. Similar trends are also expected for the B.Tech and commerce graduates qualification, with average increase number expected to increase by 36% and 27% respectively.
campus Hiring – Positive Patternstrend check
Percentage Change in Number of Campus Hires Interestingly, a comparison between the two years for MBA graduates in terms of average number of intakes shows a monumental shift in the market sentiments; the shift has grown from a negative 33% in 2014 to a massive positive 30% in 2015. This is primarily due to the growth expected in e-Commerce and KPO market in India.
Smart Pay Packages at Campuses
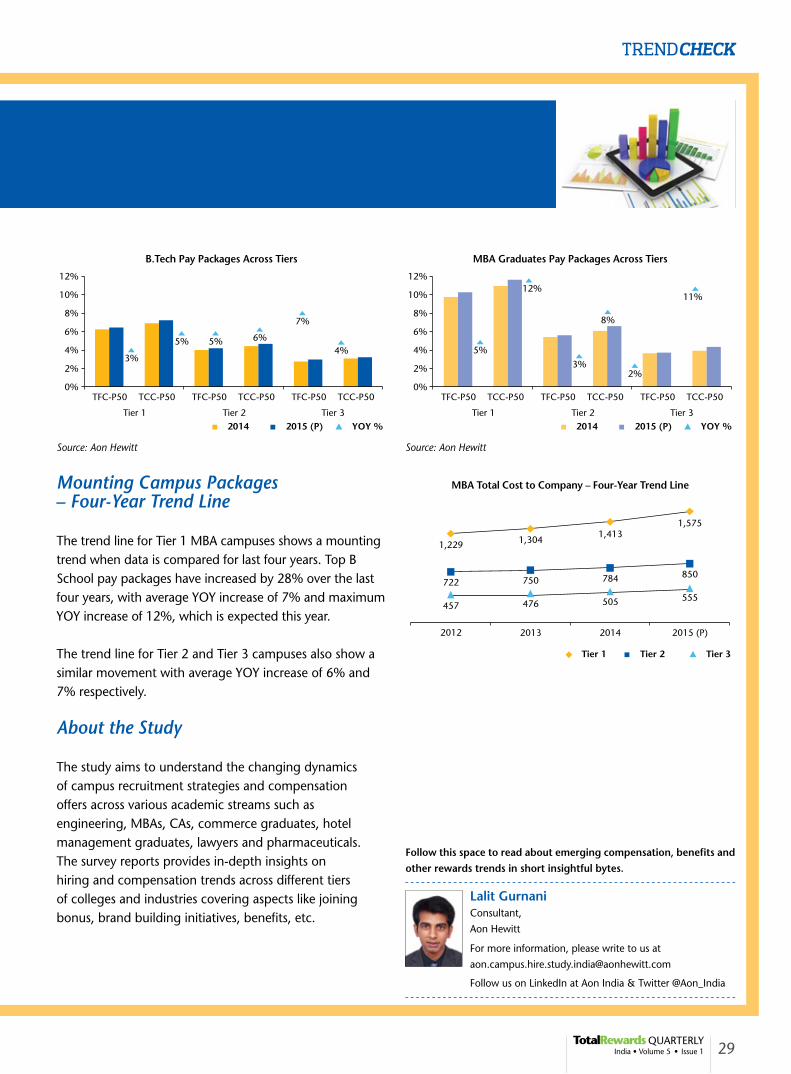
The positivity also resonates in the pay packages offered in campuses. 2015 will witness some of the highest compensation offered to students. Pay package is one of the simplest yet effective levers to attract students, and sectors like consumer products and e-Commerce are using this to their advantage to hire the best talent. The overall MBA Tier 1 median on total cost to company has increased by 12% in 2015 as compared to last year, whereas the total fixed pay median has only increased by 5%. This shows companies are adopting smarter ways to design pay packages at campuses, with minimal increase in fixed pay component and substantially increasing one time payouts such as joining bonus or increasing the variable pay component to link performance and pay aggressively at the start of student careers.
By increasing the TFP nominally and TFC substantially (by increasing/introducing one time payout of joining bonus/ completion bonus), companies are able to maintain year-on-year on MBA batch parity and salary differential.
While the engineering colleges are churning high number of graduates and the industry is picking up talent in large volumes, the year-on-year increase on both the anchors is ranging from 3% to 7% across tiers. Similar trend is seen each year with flat or not so drastic changes in the pay packages at engineering campuses.
Source: Aon Hewitt
www.aon.com/india28
TREnDcheck
B.Tech Pay Packages Across Tiers MBA Graduates Pay Packages Across Tiers
MBA Total Cost to Company – Four-Year Trend Line
Follow this space to read about emerging compensation, benefits and other rewards trends in short insightful bytes.
For more information, please write to us at
Follow us on LinkedIn at Aon India & Twitter @Aon_India
Lalit Gurnani Consultant,
Aon Hewitt
Mounting Campus Packages – Four-Year Trend Line
The trend line for Tier 1 MBA campuses shows a mounting trend when data is compared for last four years. Top B School pay packages have increased by 28% over the last four years, with average YOY increase of 7% and maximum YOY increase of 12%, which is expected this year.
The trend line for Tier 2 and Tier 3 campuses also show a similar movement with average YOY increase of 6% and 7% respectively.
About the Study
The study aims to understand the changing dynamics of campus recruitment strategies and compensation offers across various academic streams such as engineering, MBAs, CAs, commerce graduates, hotel management graduates, lawyers and pharmaceuticals. The survey reports provides in-depth insights on hiring and compensation trends across different tiers of colleges and industries covering aspects like joining bonus, brand building initiatives, benefits, etc.
Source: Aon Hewitt Source: Aon Hewitt
29India • Volume 5 • Issue 1TotalRewards QUARTERLY

Capital Markets Forum Study
April-SeptemberA benchmark study conducted for global investment banks and Indian institutional securities firms covering equity capital markets, debt capital markets and investment banking job families.
India Banking Forum Study May-OctoberA platform for all major Indian and MNC banks to come together to share and benchmark their positions, levels, functions and sub-functions across the industry.
Investment Management Forum Study June-OctoberA flagship study in the asset management sector covering key job families like fund management and sales.
Private Banking Forum Study
June-SeptemberThis study covers large Indian and MNC private wealth management organizations benchmarking key roles across functions.
Life Insurance Forum Study September-JanuaryThis study covers the largest life insurance players in India covering positions across all channels of distribution and key corporate functions.
General Insurance Forum Study September-FebruaryThis study covers the largest general insurance players in India covering positions across all channels of distribution and key corporate functions.
McLagan – Banking & Financial Services Insights
SuRVEycalendar
FMCG/D Outsourced Field Sales Force (OFS) Study July-October Flagship study in the FMCG/D industry focused on presenting comprehensive compensation and benefits benchmarking trends for the off-roll field sales staff in India.
Aon Hewitt FMCG Forum May-October This forum brings together 15 leading FMCG organizations in India to benchmark compensation, benefits and other best practices for on-roll employee population.
Aon Hewitt Consumer Industry Study September-DecemberThis study provides benchmark information around compensation, benefits, manning, sales incentives and structures across small and mid-sized FMCG and FMCD organizations.
Cement Forum October-December The study covers leading organizations in the cement sector and benchmark compensation and benefits and rewards trends.
Chemicals Forum July-September The study covers leading organizations in the chemicals sector and benchmarks compensation and benefits and rewards trends.
SIAM C&B Forum September-January A study facilitated by SIAM members covering more than 25 large auto OEMs in the country. The study benchmarks compensation, benefits and people and productivity measures in the auto OEM industry.
India Hotel Survey July-December The forum brings together leading hotel groups to benchmark their compensation, benefits, people practices and key organizational metrics and covers multiple properties and locations.
India Retail Forum July-OctoberThe study covers leading organizations, in the retail industry providing robust, and comprehensive information on cash compensation and industry trends.
India QSR (Quick Service Restaurant) Forum August-DecemberThis forum brings together leading QSRs to benchmark compensation, benefits and other best practices.
India Pharmaceutical Forum June-SeptemberThe forum brings together the key MNCs and Indian pharmaceutical organizations to benchmark their positions, levels and benefits across the industry.
Medical Technology Forum July-OctoberThe study covers leading organizations in the medical devices/technology domain providing robust and comprehensive information on cash compensation and industry trends.
Life Sciences Forum August-NovemberThe study covers leading organizations in the contract research, manufacturing, clinical research, vaccine, biotech domain providing robust and comprehensive information on cash compensation and industry trends.
ITeS Industry Study May-August The forum brings together ITeS sector organizations to benchmark their compensation, people practices and presents detailed analysis across third-party, BFSI captives, other captives and KPOs.
Hi-Tech Industry Study May-September The study provides robust information on cash compensation and other industry trends across IT sectors – IT services, IT products, semiconductors and engineering design.
Hi-Tech/ITeS Benefits Study April-AugustThis study provides benchmark information and best practices in the benefits space in the overall IT and ITeS industry, as well as across different sectors within the industry.
Salary Increase Survey Phase I June-September
Phase 2 December-FebruaryOne of the most exhaustive studies in the area of performance and rewards in India, the study measures actual and projected salary increases, variable pay and performance data across employee categories.
Aon Campus Hire Study
October-January The study aims to understand the changing dynamics of campus recruitment strategies and compensation offers across various academic streams such as engineering, MBAs, CAs, commerce graduates, hotel management graduates and lawyers
For more information, please write to us at
Follow us on LinkedIn at Aon
India & Twitter @Aon_India
upcoming Insights
www.aon.com/india30


For further details and queries, please write to us at [email protected]
Follow us on LinkedIn at Aon India & Twitter @Aon_India
AON HEWITT 8th ANNUAL REWARDS CONFERENCE
11th June 2015, ThursdayGrand Hyatt, Mumbai
Watch this space for more…
New Age Rewards Practices – Do They Really Work?