india fresh deciduous fruit annual 2018 - usda...nov 14, 2018 · africa dominates market share for...
TRANSCRIPT

Page 1 of 15
THIS REPORT CONTAINS ASSESSMENTS OF COMMODITY AND TRADE ISSUES MADE
BY USDA STAFF AND NOT NECESSARILY STATEMENTS OF OFFICIAL U.S.
GOVERNMENT POLICY
Required Report - public distribution
Date: 11/14/2018
GAIN Report Number: IN8123
India
Fresh Deciduous Fruit Annual
2018
Approved By:
Daniel Alvarado
Prepared By:
Shubhi Mishra
Report Highlights:
FAS New Delhi forecasts marketing year (MY) 2018/19 declines in fresh apple imports of
approximately 9 percent year-over-year reaching 0.23 million metric tons (MMT). FAS New Delhi
estimates declines in pear imports of 4 percent year-on-year to 14,000 metric tons (MT). Import
declines are largely due to significant rupee depreciation, Indian trade concerns about the global
trade outlook, and a temporary ban on Chinese apples and pears from entry into the Indian market.
India will remain a major exporter of fresh table grapes. FAS New Delhi projects MY 2018/19
table grape exports to increase by 6 percent year-over-year to 0.18 MMT from 0.17 MMT in MY
2017/18.

Page 2 of 15
India Fresh Deciduous Report 2018
Table of Contents
Fresh Apples Section I Page 3-7
Production
Consumption
Price
Trade
Policy
Production, Supply and Demand Data Statistics
Fresh Pears Section II Page 8-11
Production
Consumption
Price
Trade
Policy
Production, Supply and Demand Data Statistics
Fresh Table Grapes Section III Page 12-15
Production
Consumption
Price
Trade
Policy
Production, Supply and Demand Data Statistics

Page 3 of 15
Commodities:
Apples, Fresh
Production:
FAS New Delhi forecasts a 19 percent year-on-year increase to 2.3 million metric tons (MMT)
in marketing year (MY) 2018/19 (July–June) of Indian apple production, anticipating favorable
weather conditions. Indian apple production is limited to the hill states of Jammu and Kashmir,
Himachal Pradesh (HP), and Uttarakhand. The northeastern hill states of Arunachal Pradesh,
Nagaland, Meghalaya, Manipur, and Sikkim also grow smaller quantities of deciduous fruits.
FAS New Delhi revises MY 2017/18 Indian production estimates down to 1.92 MMT based on
unexpected rains during early flowering time followed by a dry spell in the major apple-
producing state of HP.
On May 27, 2016, the World Bank approved the India HP Horticulture Development Project,
through which the Government of India will work on increasing yield and rejuvenating orchards.
Most of the orchards are 30 to 35 years old of the popular Red Delicious, Royal Delicious, and
Rich Red varieties. These areas generally harvest between July and October.
Consumption:
FAS New Delhi forecasts a rebound in MY 2018/19 of Indian apple consumption to 2.2 MMT.
The increase is due to availability, accessibility, food choice, changing demographics,
urbanization, culture, and consumer attitudes in India. Most importantly, Indian consumers’
continued and growing health awareness and apple availability drive consumption year-round.
As a result, apples are the most heavily consumed imported fruit in India. The uninterrupted
supply of apples has led to increased consumption in smaller markets of the country too. Indians
primarily consume the fruit fresh; out of the entire production, two percent is processed and
according to the Ministry of Food Processing and Industries, 10.39 percent of apples are spoiled
or wasted.
Domestic production is limited by seasonality, geographical separation, and insufficient
infrastructure. Production cannot meet increased consumption from the growing middle class.
FAS New Delhi revises down the MY 2017/18 consumption numbers to 1.9 MMT. The revision
reflects a depreciated Indian rupee that decreased Indian consumer’s purchasing power, India’s
trade concerns about global trade outlooks, and noticeably lower domestic production.
Price
The MY 2017/18 average unit price for U.S. fresh apples imported into India was USD 1,099 per
ton; Italy at USD 1,125 per ton; and, New Zealand at USD 1,246 per ton.

Page 4 of 15
Figure 1. India: Apples, Fresh, (HS Code 080810), Unit Price July 2017- August 2018
Source: Trade Sources and Global Trade Atlas
Trade:
MY 2017/18 imports declined dramatically to 0.25 MMT due to significant rupee depreciation,
Indian trade concerns about the global trade outlook, and a temporary ban on Chinese apples
from entry into Indian market. FAS New Delhi forecasts MY 2018/19 import declines of
approximately 9 percent to reach 0.23 MMT. Domestically produced apples are primarily
consumed in India’s northern regions; other regions face limited distribution prospects.
Therefore, the Indian market for imported apples in southern, western, and eastern markets of
the country continues to grow.
In MY 2017/18, U.S. apple imports accounted for 57 percent of India’s total apple imports by
volume, followed by Chile at 15 percent, and New Zealand at 8 percent. Notably, MY 2016/17
total apple imports into India stood at 0.36 MMT, of which 52 percent were Chinese apples.

Page 5 of 15
Table 1. India: Apples Fresh, Imports from Partner Countries, 2015-2017
Partner Country United States Dollars
2015 2016 2017
World 215,268,500 237,949,714 306,911,306
China 30,107,652 103,873,901 121,406,387
United States 115,339,208 55,610,227 96,598,765
Chile 22,395,412 32,907,150 24,558,081
Italy 11,944,192 12,309,490 21,548,012
New Zealand 19,184,428 15,597,481 11,974,864
Belgium 4,505,578 7,778,252 9,168,074
Turkey 70,376 1,181,280 4,360,789
Poland 251,999 1,533,546 4,094,734
France 1,658,821 813,318 3,031,122
Others 9,810,833 6,345,070 10,170,478
Source: Ministry of Commerce and Industries, Government of India
In MY 2017/18, India exported 12,500 metric tons (MT) of fresh apples primarily to
neighboring countries. Nepal and Bangladesh accounted for 71 and 28 percent of India’s fresh
apple exports, respectively. India’s MY 2017/18 exports dropped due to decreased domestic
production. FAS New Delhi forecasts MY 2018/19 exports increasing to 18,000 MT based on
augmented domestic production.
Table 2. India: Apples Fresh, Exports from India to Partner Countries, 2015-2017
Partner Country United States Dollars
2015 2016 2017
World 10,338,651 8,095,811 6,664,900
Nepal 4,037,415 3,725,662 4,095,941
Bangladesh 6,264,052 4,098,961 2,558,629
Seychelles 0 0 7,602
Qatar 24 0 1,525
Oman 352 0 400
United Arab Emirates 0 0 236
United Kingdom 0 0 209
Singapore 130 0 117
Germany 0 0 67
Others 36,678 271,188 174
Source: Ministry of Commerce and Industries, Government of India
Page 6 of 15
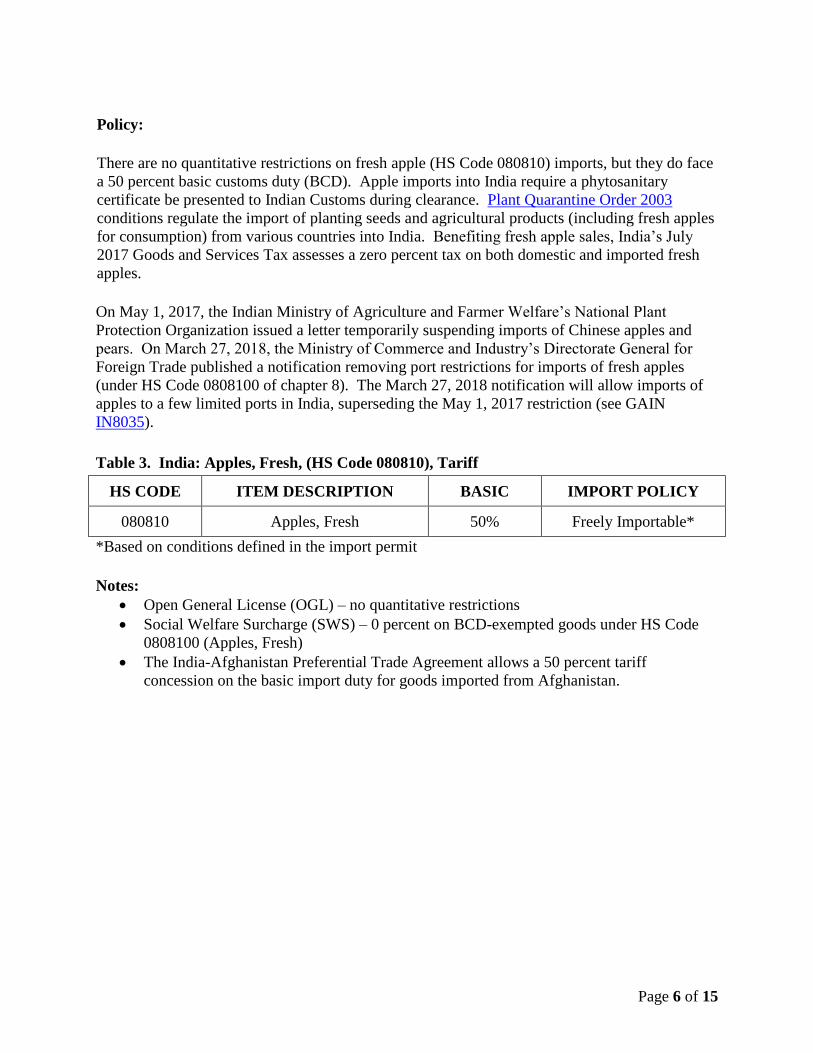
Policy:
There are no quantitative restrictions on fresh apple (HS Code 080810) imports, but they do face
a 50 percent basic customs duty (BCD). Apple imports into India require a phytosanitary
certificate be presented to Indian Customs during clearance. Plant Quarantine Order 2003
conditions regulate the import of planting seeds and agricultural products (including fresh apples
for consumption) from various countries into India. Benefiting fresh apple sales, India’s July
2017 Goods and Services Tax assesses a zero percent tax on both domestic and imported fresh
apples.
On May 1, 2017, the Indian Ministry of Agriculture and Farmer Welfare’s National Plant
Protection Organization issued a letter temporarily suspending imports of Chinese apples and
pears. On March 27, 2018, the Ministry of Commerce and Industry’s Directorate General for
Foreign Trade published a notification removing port restrictions for imports of fresh apples
(under HS Code 0808100 of chapter 8). The March 27, 2018 notification will allow imports of
apples to a few limited ports in India, superseding the May 1, 2017 restriction (see GAIN
IN8035).
Table 3. India: Apples, Fresh, (HS Code 080810), Tariff
HS CODE ITEM DESCRIPTION BASIC IMPORT POLICY
080810 Apples, Fresh 50% Freely Importable*
*Based on conditions defined in the import permit
Notes:
Open General License (OGL) – no quantitative restrictions
Social Welfare Surcharge (SWS) – 0 percent on BCD-exempted goods under HS Code
0808100 (Apples, Fresh)
The India-Afghanistan Preferential Trade Agreement allows a 50 percent tariff
concession on the basic import duty for goods imported from Afghanistan.

Page 7 of 15
Production, Supply and Demand Data Statistics:
Table 4. India: Commodity, Apples, Fresh, PSD Table (Area in Hectares, Quantity in Metric Tons and Trees in Thousands)
Apples, Fresh 2016/2017 2017/2018 2018/2019
Market Begin Year Jul 2016 Jul 2017 Jul 2018
India USDA
Official New Post
USDA
Official New Post
USDA
Official New Post
Area Planted 326,000 326,000 326,000 326,000 0 326,000
Area Harvested 278,000 278,000 278,000 278,000 0 278,000
Bearing Trees 79,900 79,900 79,900 79,900 0 79,900
Non-Bearing Trees 13,500 13,500 93,700 13,800 0 13,800
Total Trees 93,400 93,400 173,600 93,700 0 93,700
Commercial
Production
2,258,000 2,258,000 2,300,000 1,920,000 0 2,300,000
Non-Comm.
Production
0 0 0 0 0 0
Production 2,258,000 2,258,000 2,300,000 1,920,000 0 2,300,000
Imports 369,800 369,800 250,000 249,000 0 225,000
Total Supply 2,627,800 2,627,800 2,550,000 2,169,000 0 2,525,000
Fresh Dom.
Consumption
2,231,000 2,231,000 2,150,000 1,919,100 0 2,213,000
Exports 20,800 20,800 15,000 12,500 0 18,000
For Processing 53,000 53,000 55,000 38,400 0 54,000
Withdrawal From
Market
323,000 323,000 330,000 199,000 0 240,000
Total Distribution 2,627,800 2,627,800 2,550,000 2,169,000 0 2,525,000
Page 8 of 15
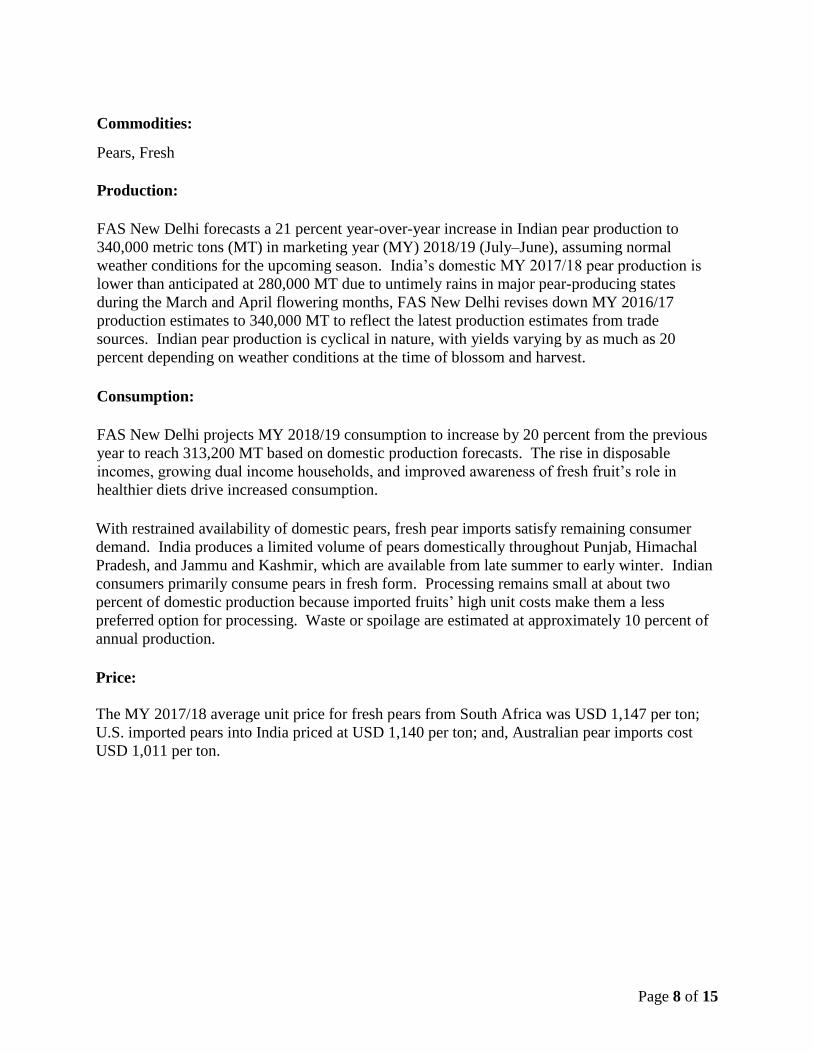
Commodities:
Pears, Fresh
Production:
FAS New Delhi forecasts a 21 percent year-over-year increase in Indian pear production to
340,000 metric tons (MT) in marketing year (MY) 2018/19 (July–June), assuming normal
weather conditions for the upcoming season. India’s domestic MY 2017/18 pear production is
lower than anticipated at 280,000 MT due to untimely rains in major pear-producing states
during the March and April flowering months, FAS New Delhi revises down MY 2016/17
production estimates to 340,000 MT to reflect the latest production estimates from trade
sources. Indian pear production is cyclical in nature, with yields varying by as much as 20
percent depending on weather conditions at the time of blossom and harvest.
Consumption:
FAS New Delhi projects MY 2018/19 consumption to increase by 20 percent from the previous
year to reach 313,200 MT based on domestic production forecasts. The rise in disposable
incomes, growing dual income households, and improved awareness of fresh fruit’s role in
healthier diets drive increased consumption.
With restrained availability of domestic pears, fresh pear imports satisfy remaining consumer
demand. India produces a limited volume of pears domestically throughout Punjab, Himachal
Pradesh, and Jammu and Kashmir, which are available from late summer to early winter. Indian
consumers primarily consume pears in fresh form. Processing remains small at about two
percent of domestic production because imported fruits’ high unit costs make them a less
preferred option for processing. Waste or spoilage are estimated at approximately 10 percent of
annual production.
Price:
The MY 2017/18 average unit price for fresh pears from South Africa was USD 1,147 per ton;
U.S. imported pears into India priced at USD 1,140 per ton; and, Australian pear imports cost
USD 1,011 per ton.

Page 9 of 15
Figure 2. India: Pears, Fresh, (HS Code 080830), Unit Price July 2017- August 2018
Source: Trade Sources and Global Trade Atlas
Trade:
FAS New Delhi revises MY 2017/18 pear imports down to 14,600 MT due to Indian currency
depreciation, Indian trade concerns about the global trade outlook, and a temporary ban on
Chinese pears from entry into the Indian market.
The MY 2017/18 ban on Chinese pears from entry into Indian market upturned market
dynamics. In MY 2016/17, China held the market share for imported pears at 70 percent,
followed by South Africa at 21 percent, and the United States at 4 percent. Currently, South
Africa dominates market share for imported pears at 70 percent, trailed by the United States at 14
percent, and Australia at 6.24 percent.
Assuming international prices for pears and the Indian rupee remain constant through MY
2018/19, FAS New Delhi estimates Indian pear imports will see an overall 4 percent year-on-
year decline to 14,000 MT. Post attributes this decline to the ban on entry of Chinese pears and
the devaluation of the Indian rupee.

Page 10 of 15
Table 5. India: Pears Imports from Partner Countries, 2015-2017
Partner Country United States Dollars
2015 2016 2017
World 20,636,388 27,668,101 18,602,424
South Africa 6,386,336 7,561,252 9,671,177
China 10,322,509 16,512,764 4,419,652
United States 3,628,964 2,573,486 2,616,191
Australia 0 0 514,339
Spain 0 60,863 485,034
Netherlands 0 90,193 292,083
Chile 0 18,129 270,954
Belgium 229,203 632,901 132,297
Argentina 0 83,000 101,238
Others 69,375 135,515 99,460
Source: Ministry of Commerce and Industries, Government of India
Policy:
The applicable basic customs duty (BCD) on fresh pears (HS Code 080830) is 30 percent with
no quantitative restriction. Plant Quarantine Order 2003 regulates the import of planting seeds
and agricultural products (including fresh pears for consumption) from various partner countries
into India. India’s Goods and Services Tax, implemented in July 2017, assesses a zero percent
tax on both domestic and imported fresh pears. On May 1, 2017, the Indian Ministry of
Agriculture and Farmer Welfare’s National Plant Protection Organization (NPPO) issued a letter
temporarily suspending Chinese pear imports effective June 1, 2017. The NPPO ban caused
China to lose its 70 percent share of the Indian fresh pear import market.
On February 1, 2018, the Government of India’s Union Budget of 2018 abolished the Education
Cess and the Secondary and Higher Education Cess. The budget introduced a Social Welfare
Surcharge of 10 percent of the BCD on imported goods, including fresh pears (see GAIN
IN8018).
Table 6. India: Pears, Fresh, (HS Code 080830), Tariff
HS CODE ITEM DESCRIPTION BASIC IMPORT POLICY
080830 Pears, Fresh 30% Freely Importable*
*Based on the conditions defined in import permit
Notes:
Open General License (OGL) – no quantitative restrictions.
Social Welfare Surcharge (SWS) – 10 percent on BCD- goods under HS Code 0808300
(Pears, Fresh)
Page 11 of 15
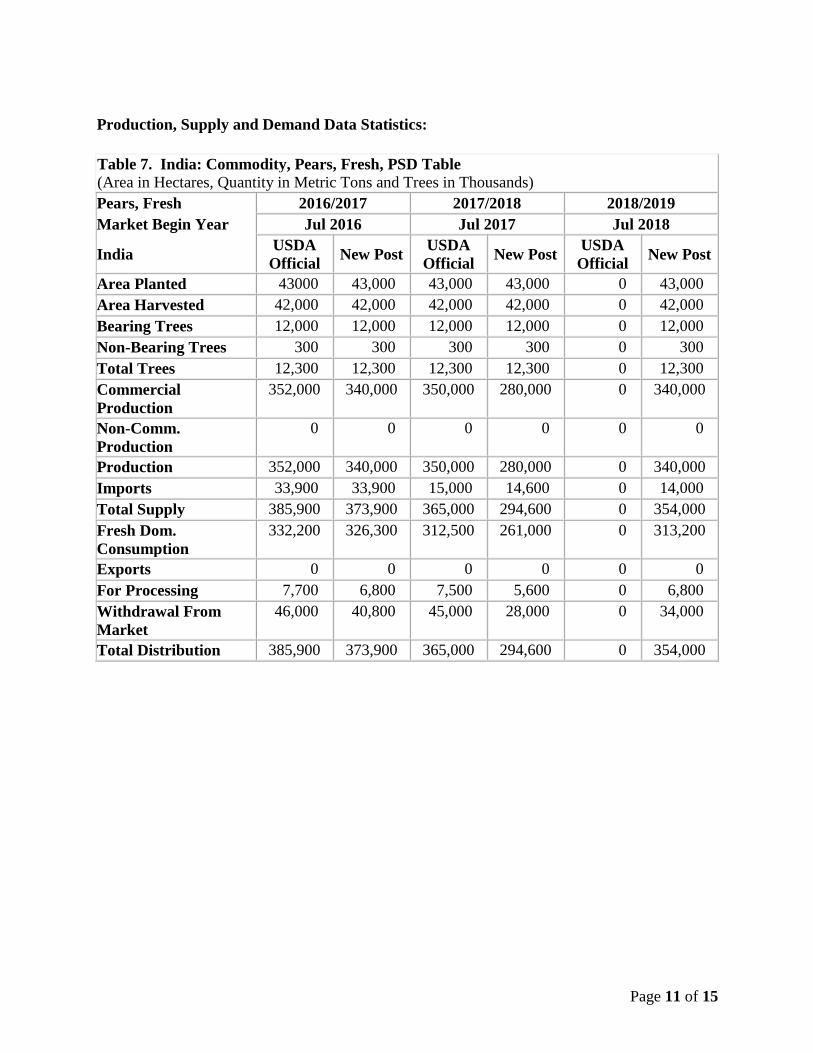
Production, Supply and Demand Data Statistics:
Table 7. India: Commodity, Pears, Fresh, PSD Table (Area in Hectares, Quantity in Metric Tons and Trees in Thousands)
Pears, Fresh 2016/2017 2017/2018 2018/2019
Market Begin Year Jul 2016 Jul 2017 Jul 2018
India USDA
Official New Post
USDA
Official New Post
USDA
Official New Post
Area Planted 43000 43,000 43,000 43,000 0 43,000
Area Harvested 42,000 42,000 42,000 42,000 0 42,000
Bearing Trees 12,000 12,000 12,000 12,000 0 12,000
Non-Bearing Trees 300 300 300 300 0 300
Total Trees 12,300 12,300 12,300 12,300 0 12,300
Commercial
Production
352,000 340,000 350,000 280,000 0 340,000
Non-Comm.
Production
0 0 0 0 0 0
Production 352,000 340,000 350,000 280,000 0 340,000
Imports 33,900 33,900 15,000 14,600 0 14,000
Total Supply 385,900 373,900 365,000 294,600 0 354,000
Fresh Dom.
Consumption
332,200 326,300 312,500 261,000 0 313,200
Exports 0 0 0 0 0 0
For Processing 7,700 6,800 7,500 5,600 0 6,800
Withdrawal From
Market
46,000 40,800 45,000 28,000 0 34,000
Total Distribution 385,900 373,900 365,000 294,600 0 354,000

Page 12 of 15
Commodities:
Grapes, Table, Fresh
Production:
Grapes are a commercially important fruit in India produced in three distinct agro-climatic
zones: sub-tropical, hot tropical, and mild tropical climatic. The hot tropical climatic region
covers Maharashtra and Andhra Pradesh and is major viticulture region. It represents over 80
percent of total production by area and volume. Irrigation is vital in this region as the
evapotranspiration surpasses the precipitation. The majority of these vineyard areas are drip
irrigated, while less than 10 percent are surface irrigated. The October 25, 2018 Central Water
Commission’s reservoir capacity report places the Maharashtra’s full reservoir level at 9.13
billion cubic meters (BCM), which is about 65 percentage of the reservoir’s 14.07 BCM
capacity in state irrigation water. Consequently, irrigation water will not be an issue for
growers.
Delayed rains in the hot climatic region pushed back pruning, which is anticipated to have a
ripple effect on marketing year (MY) 2018/19 (June–May) production numbers, projected to
decline 4 percent over the previous year’s to end at 2.77 metric tons (MT). FAS New Delhi
revises India’s grape production forecast for MY 2017/18 down to 2.8 million metric tons
(MMT) due to rain damage.
Consumption:
India is a both major producer and consumer of grapes. In MY 2017/18, India consumed 2.4
MMT of grapes. FAS New Delhi projects MY 2018/19 consumption at 2.3 MMT. Major
factors driving consumption include urbanization, increased disposable income resulting from
women entering the work force, and more health awareness. The Government of India’s
Ministry of Food Processing and Industries reports an approximate 8.63 percent grape wastage
or market withdrawal. Overall investment in raisin grape production remains small compared to
table grapes. However, this sector is sourcing, as industry sources report use of table grapes in
raisin production in India approximating 15 percent of total table grape production.
Trade:
India is a major exporter of fresh table grapes. FAS New Delhi projects MY 2018/19 table
grape exports to increase by 6 percent to 0.18 MMT from 0.17 MMT in MY 2017/18. Indian
grapes find shelf space at various markets globally: the Netherlands at 32 percent, Russia at 16
percent, and the United Kingdom at 9 percent make up the top three destinations. Over 50
percent of Indian grapes are exported to the European Union (EU). The EU continues to be the
most preferred destination by Indian table grape exporters.
Despite slow economic recovery in EU countries, fresh grape consumption remains stable. EU
MY 2017/18 table grape imports were high to compensate for reduced domestic production.

Page 13 of 15
Within the EU, top importing countries for Indian grapes remain the Netherlands at 32 percent,
the United Kingdom at 9 percent, and Germany at 9 percent. The Netherlands serves mainly as a
trans-shipping point. The top three major table grape suppliers to the EU market are South
Africa at 33 percent, Chile at 17 percent, and India at 14 percent.
Industry sources indicate South Africa’s increased production and free trade agreement with the
EU will give it an edge over Indian table grape exports. However, India’s delayed shipment
arrivals to market will help it partially avoid a direct face off with South African grapes in the
EU market.
Table 8. India: Table Grape Exports, 2015-2017
Partner Country United States Dollars
2015 2016 2017
World 127,646,990 227,542,851 280,872,506
Netherlands 43,327,954 94,675,704 94,779,597
Russia 14,269,775 22,090,996 39,772,654
United Kingdom 17,862,928 33,685,069 24,022,753
Germany 3,996,349 8,916,658 21,306,916
United Arab Emirates 15,749,134 15,224,600 19,248,462
Others 32,440,853 52,949,822 81,742,127
Source: Ministry of Commerce and Industries, Government of India
MY 2017/18 imports were limited to 6,000 MT because of the availability of domestic
production. FAS New Delhi projects MY 2018/19 imports to decline by 5 percent to 5,700 MT
primarily based on the Indian rupee devaluation. In 2017, imports came from the United States
at 41 percent, followed by Peru at 16 percent, and China at 13 percent.
Table 9. India: Table Grape Imports, 2015-2017
Partner Country United States Dollars
2015 2016 2017
World 12,867,646 10,773,117 11,227,101
United States 6,638,350 6,001,447 4,624,022
Peru 2,708,522 2,213,965 1,796,656
China 117,569 697,950 1,465,035
Chile 1,038,961 468,981 1,060,851
Others 2,364,246 1,390,773 2,280,536
Source: Ministry of Commerce and Industries, Government of India

Page 14 of 15
Price
Imported grapes arrive in India from July to December, when domestic produce is not available.
The United States holds the major market share by volume and sells at premium prices.
Figure 3. India: Grapes, Fresh, (HS Code 080610), Unit Price June 2017- August 2018
Source: Trade Sources and Global Trade Atlas
Policy:
There are no quantitative restrictions on fresh grape (HS Code 080610) imports. They are
assessed a basic tariff of 30 percent. Grape imports into India require a phytosanitary certificate
be presented to Indian Customs during clearance. Plant Quarantine Order 2003 conditions
regulate the import of planting seeds and agricultural products (including fresh grapes for
consumption) from various countries into India.
Table 10. India: Table Grapes (HS Code 080610), Tariff
HS CODE ITEM DESCRIPTION BASIC IMPORT POLICY
080610 Grapes, Fresh 30% Freely Importable
*Based on the conditions defined in import permit
Notes:
Open General License (OGL) – no quantitative restrictions.
Page 15 of 15
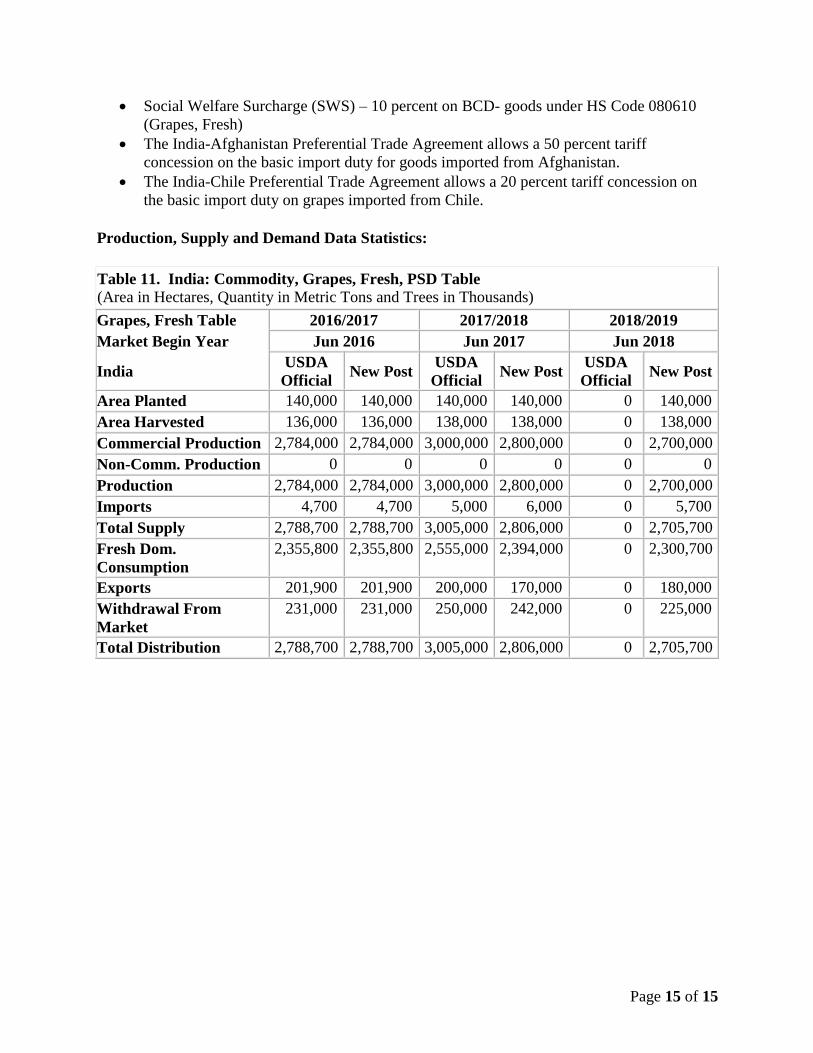
Social Welfare Surcharge (SWS) – 10 percent on BCD- goods under HS Code 080610
(Grapes, Fresh)
The India-Afghanistan Preferential Trade Agreement allows a 50 percent tariff
concession on the basic import duty for goods imported from Afghanistan.
The India-Chile Preferential Trade Agreement allows a 20 percent tariff concession on
the basic import duty on grapes imported from Chile.
Production, Supply and Demand Data Statistics:
Table 11. India: Commodity, Grapes, Fresh, PSD Table (Area in Hectares, Quantity in Metric Tons and Trees in Thousands)
Grapes, Fresh Table 2016/2017 2017/2018 2018/2019
Market Begin Year Jun 2016 Jun 2017 Jun 2018
India USDA
Official New Post
USDA
Official New Post
USDA
Official New Post
Area Planted 140,000 140,000 140,000 140,000 0 140,000
Area Harvested 136,000 136,000 138,000 138,000 0 138,000
Commercial Production 2,784,000 2,784,000 3,000,000 2,800,000 0 2,700,000
Non-Comm. Production 0 0 0 0 0 0
Production 2,784,000 2,784,000 3,000,000 2,800,000 0 2,700,000
Imports 4,700 4,700 5,000 6,000 0 5,700
Total Supply 2,788,700 2,788,700 3,005,000 2,806,000 0 2,705,700
Fresh Dom.
Consumption
2,355,800 2,355,800 2,555,000 2,394,000 0 2,300,700
Exports 201,900 201,900 200,000 170,000 0 180,000
Withdrawal From
Market
231,000 231,000 250,000 242,000 0 225,000
Total Distribution 2,788,700 2,788,700 3,005,000 2,806,000 0 2,705,700