india daily, february 13, 2012 - kotaksecurities.com · for private circulation only. for important...
TRANSCRIPT

For Private Circulation Only. FOR IMPORTANT INFORMATION ABOUT KOTAK SECURITIES’ RATING SYSTEM AND OTHER DISCLOSURES. REFER TO THE END OF THIS MATERIAL.
INDIA DAILYFebruary 13, 2012 India 10-Feb 1-day1-mo 3-mo
Sensex 17,749 (0.5) 9.9 3.2
Nifty 5,382 - 10.6 4.1
Global/Regional indices
Dow Jones 12,801 (0.7) 3.1 5.3
Nasdaq Composite 2,904 (0.8) 7.1 8.4
FTSE 5,852 (0.7) 3.8 5.5
Nikkie 8,963 0.2 5.5 5.3
Hang Seng 20,837 0.3 8.5 8.9
KOSPI 2,003 0.5 6.8 7.5
Value traded – India
Cash (NSE+BSE) 185 166 70
Derivatives (NSE) 1,371 1,079 1,107
Deri. open interest 1,372 1,112 1,260
Forex/money market
Change, basis points
10-Feb 1-day 1-mo 3-mo
Rs/US$ 49.4 (5) (204) (97)
10yr govt bond, % 8.3 1 (8) (64)
Net investment (US$mn)
9-Feb MTD CYTD
FIIs 294 1,810 3,994
MFs (77) (95) (282)
Top movers -3mo basis
Change, %
Best performers 10-Feb 1-day 1-mo 3-mo
IVRC IN Equity 56.7 (4.4) 48.0 51.0
TTMT IN Equity 257.4 0.0 23.3 41.8
WLCO IN Equity 133.6 1.9 20.6 38.7
MMTC IN Equity 875.2 (1.1) (8.0) 36.5
TGBL IN Equity 119.0 (3.3) 26.3 34.7
Worst performers
UNSP IN Equity 670.3 (2.3) 11.8 (19.8)
BHEL IN Equity 260.6 (0.5) (2.3) (19.7)
ESOIL IN Equity 66.0 (3.1) 6.5 (18.6)
MM IN Equity 691.6 (1.5) (0.1) (17.8)
NMDC IN Equity 189.2 (0.8) 8.0 (14.2)
Contents
Daily Alerts
Results
DLF: Right course but still in rough waters
Oil India: Country cousin steals a march
Tata Power: Coal production ramps up, low cost coal gives Mundra hope
IDFC: Growth strong, core in line
Reliance Communications: Weak results but do they matter?
Shriram Transport: A flat quarter
Reliance Capital: A mixed quarter
Eros International: Growing up
MTNL: Operational strife continues
Puravankara Projects: In-line results, poor sales
Results, Change in Reco
JSW Steel: Reports consolidated loss; stock expensive
Sun TV Network: A rainy quarter; Sun hides behind the clouds
Change in Reco
Tata Steel: Negatives out of the way
IndusInd Bank: Limited risks to business; valuations cap returns in the near term
Sector
Consumer products: Hale and hearty, for now
Economy
Economy: IIP growth likely to be near the bottom

For private Circulation Only. FOR IMPORTANT INFORMATION ABOUT KOTAK SECURITIES’ RATING SYSTEM AND OTHER DISCLOSURES, REFER TO THE END OF THIS MATERIAL.
Reported financials disappoint on lower execution
DLF reported revenues of Rs20.3 bn (-18% yoy, -20% qoq) and PAT of Rs2.6 bn (-45% yoy, -31% qoq) due to slowdown in execution (revenue recognition) as the company moved over to third-party contractors from in-house construction which caused associated delays. EBITDA came in at Rs8.2 bn (-30% yoy and qoq) while EBITDA margins dropped by 5.9% qoq and 7.1% yoy to 40.4% due to an increase in construction cost and other expenditure as a proportion of sales (53% versus 48% in 2QFY12 and 47% in 3QFY11). PAT also got impacted by increase in interest costs (average COD is now 12.75% on a debt of Rs250 bn) and lower interest capitalization of 25%.
Sales and deliveries have picked up and debt is marginally down qoq
DLF sold 3.3 mn sq. ft in 3QFY12 versus 1.3 mn sq. ft in 2QFY12 and 2.5 mn sq. ft in 3QFY11 and the company has guided for a slow and cautious 4QFY12/1QFY13 due to high interest rates. DLF has plans to launch 9.25 mn sq. ft under plots, 6 mn sq. ft under group housing and 0.5 mn sq. ft of commercial space and has indicated that approvals for several micro-markets are already in place. DLF’s area under execution has declined to 45 mn sq. ft from 53 mn sq. ft in 2QFY12 due to handovers of 10.5 mn sq. ft in the quarter. DLF’s handover of projects (both development and rental) in 3QFY12 is higher than total of FY2010 and FY2011 (9.2 mn sq. ft) and is now targeting to deliver >1.5 mn sq. ft in 4QFY12E and >12 mn sq. ft in FY2013E.
Asset sales release cash though debt reduction not as much as expected
DLF raised Rs12 bn through assets sales in 3QFY12 – (1) Rs7.9 bn from Noida and Pune IT Park, (2) Rs3.4 bn from FSI sales in Gurgaon and (3) Rs0.8 bn from other assets. Net debt, however, has only reduced by Rs4.9 bn as the company utilized (1) Rs4.5 bn in capex and land buying, (2) Rs1.2 bn to purchase Hilton stake in hotel JV and (3) Rs0.8 bn on new launches. DLF is now targeting Rs60 bn of asset sales by end-FY2013E from – (1) Aman Resorts (Rs20 bn), (2) Wind/utilities/miscellaneous (Rs20 bn) and (3) Chennai and Mumbai project disposal including Hindoostan Mills land (Rs35-40 bn).
DLF (DLFU)
Property
Right course but still in rough waters. We believe DLF is moving in the right direction with (1) aggressive asset sale plans and visible intent of sticking to core areas, (2) outsourcing of construction once again and (3) a pick-up in deliveries and sales. Key negatives include (1) weak revenue recognition, (2) a subdued demand (residential and office space) environment and (3) high D/E of 0.9X. We cut our FY2012E/13E/14E earnings by 19%/19%/15% and maintain ADD rating at a revised target price of Rs260/share (earlier Rs270) factoring delays in execution and revised debt estimates.
DLFStock data Forecasts/Valuations 2012 2013E 2014E
52-week range (Rs) (high,low) EPS (Rs) 9.7 12.7 16.9Market Cap. (Rs bn) 395.9 EPS growth (%) 6.5 31.5 33.1
Shareholding pattern (%) P/E (X) 23.9 18.2 13.6Promoters 78.6 Sales (Rs bn) 97.5 117.7 155.4FIIs 15.5 Net profits (Rs bn) 16.4 21.6 28.7MFs 0.1 EBITDA (Rs bn) 41.6 51.1 64.2
Price performance (%) 1M 3M 12M EV/EBITDA (X) 15.2 12.3 9.5Absolute 25.0 (1.0) (6.1) ROE (%) 6.1 7.6 9.5Rel. to BSE-30 13.8 (3.2) (7.6) Div. Yield (%) 1.1 1.3 1.5
Company data and valuation summary
281-173
ADD
FEBRUARY 13, 2012
RESULT
Coverage view: Cautious
Price (Rs): 231
Target price (Rs): 260
BSE-30: 17,749
QUICK NUMBERS
• Revenues of Rs20.3 bn in 3QFY12 (-18% yoy, -20% qoq)
• EBITDA of Rs8.2 bn in 3QFY12 (-30% yoy and qoq)
• Sales of 3.3 mn sq. ft versus 1.3 mn sq. ft in 2QFY12

DLF Property
KOTAK INSTITUTIONAL EQUITIES RESEARCH 3
Revenue impacted due to slowdown in execution Interim results, DLF, March fiscal year-ends (Rs mn)
3QFY12 3QFY12E 2QFY12 3QFY11 3QFY12E qoq yoy 9HFY12 9HFY11 % changeNet sales 20,344 25,505 25,324 24,799 (20) (20) (18) 70,126 68,775 2Total cost (12,116) (13,805) (13,594) (13,020) (12) (11) (7) (39,059) (37,910) 3Construction cost (8,103) (9,466) (9,526) (14) (15) (26,991) (27,005) (0)Staff cost (1,379) (1,539) (1,338) (10) 3 (4,374) (4,250) 3Other expenditure (2,635) (2,589) (2,156) 2 22 (7,694) (6,656) 16EBITDA 8,227 11,699 11,730 11,780 (30) (30) (30) 31,067 30,865 1Other income 3,617 511 448 1,143 608 708 216 4,638 3,973 17Interest costs (6,199) (5,300) (5,263) (4,277) 17 18 45 (16,426) (12,499) 31Depreciation (1,797) (1,775) (1,753) (1,612) 1 3 11 (5,252) (4,650) 13Pretax profits 3,848 5,135 5,161 7,034 (25) (25) (45) 14,027 17,688 (21)Tax (1,353) (1,489) (1,475) (2,026) (9) (8) (33) (4,106) (4,439) (7)Net income 2,495 3,646 3,686 5,008 (32) (32) (50) 9,921 13,249 (25)Minority interest 109 0 (284) (57) (385)Share of profit/(loss) in associates (17) (5) (2) 259 725 20 51 (60)Net income before prior period adjustments 2,587 3,646 3,682 4,722 (29) (30) (45) 9,885 12,916 (23)Prior period adjustments (4) 42 (65) (94) 7 35Reported net income 2,584 3,646 3,724 4,657 (29) (31) (45) 9,891 12,951 (24)
Key ratiosEBITDA margin (%) 40.4 45.9 46.3 47.5 44.3 44.9PAT margin (%) 12.7 14.3 14.7 18.8 14.1 18.8Effective tax rate (%) 35.2 29.0 28.6 28.8 29.3 25.1
(% change)
Source: Company, Kotak Institutional Equities estimates
EBITDA margin declines to 40.4% Quarterly revenues, EBITDA, EBITDA margins and gross margins, DLF, March fiscal year-ends
0
10
20
30
40
50
1QFY
08
2QFY
08
3QFY
08
4QFY
08
1QFY
09
2QFY
09
3QFY
09
4QFY
09
1QFY
10
2QFY
10
3QFY
10
4QFY
10
1QFY
11
2QFY
11
3QFY
11
4QFY
11
1QFY
12
2QFY
12
3QFY
12
01020304050607080
Revenues (Rs bn) EBITDA (Rs bn) EBITDA margins (%) Gross margins (%)
Source: Company, Kotak Institutional Equities

Property DLF
4 KOTAK INSTITUTIONAL EQUITIES RESEARCH
Operational performance
Development for sale. After declining to 1.3 mn sq. ft in 2QFY12 (lowest since 4QFY09) sales picked up to 3.3 mn sq. ft versus 2.5 mn sq. ft in 3QFY11. The company has, however, guided for a cautious 4QFY12/1QFY13 due to high interest rates which is making buyers delay their purchases. Majority of the sales have happened from plotted development launches in 3QFY12 in Lucknow and Mullanpur, New Chandigarh. DLF is targeting to launch 9.25 mn sq. ft of plots, 6 mn sq. ft of group housing and 0.5 mn sq. ft of commercial projects and has indicated that it has approvals to launch in most of the target micro-markets. DLF is in a good position to scale up its launches once approvals are in place since – (1) it has embarked on a strategy to use third-party contractors and so scaling up should not be a problem and (2) area under execution has declined to 44.9 mn sq. ft from 52.5 mn sq. ft at end-2QFY12 as DLF has readied 10.5 mn sq. ft for handing over.
Plans launches of 16 mn sq. ft Status of launch plans of DLF as of end-Jan 2012
Product type Location Launched Pipeline
Plots Gurgaon 1.8 2.3
Plots Lucknow 2.5 2.5
Plots Mullanpur, New Chandigarh - Ph 2 0.5 1.0
Plots Panchkula - Ph 2 1.0
Plots Hyderabad 2.5 2.5
Subtotal plots 7.3 9.3
Group Housing New Gurgaon 2.0
Group Housing Bengaluru 0.7 1.0
Group Housing Jallandhar 0.5 0.5
Super Premium Golf Links, Gurgaon 2.5
Subtotal 1.2 6.0
Commercial Delhi 0.5
Source: Company, Kotak Institutional Equities
Lease portfolio. On a net basis, incremental leasing (including 2.4 mn sq. ft sold which was earlier meant to be leased) increased to 2.6 mn sq. ft versus 0.2 mn sq. ft in 2QFY12 and 1.7 mn sq. ft in 3QFY11. DLF earned Rs 3.9 bn (Rs15.7 bn annualized) rental income from its retail and commercial offices in 3QFY12 which is steady qoq.
Execution. On the conference call, the company indicated that it is targeting 28 mn sq. ft of deliveries over the next two years. In 3QFY12, DLF handed over 10.5 mn sq. ft of projects (both development and rental) which is higher than FY2010 and FY2011 combined (9.2 mn sq. ft) and is targeting to deliver >1.5 mn sq. ft in 4QFY12E and >12 mn sq. ft in FY2013E. As a result of the deliveries in the quarter (readies 10.5 mn sq. ft for deliveries, adds 5 mn sq. ft of projects and suspends 2.2 mn sq. ft), area under execution has declined by 7.6 mn sq. ft qoq to 45 mn sq. ft which puts DLF in a good position to launch and add more projects to its portfolio from an execution angle.

DLF Property
KOTAK INSTITUTIONAL EQUITIES RESEARCH 5
Area under execution declines as DLF readies 10.5 mn sq. ft for handover Area under execution, DLF, March fiscal year-ends
3QFY12 2QFY12 3QFY11
Gurgaon 12.6 21.5 21.5
Super Metro 8 8 7.2
Rest of India 15.1 10.5 12
Rental Company 9.2 12.5 15.7
Total 44.9 52.5 56.4
Source: Company, Kotak Institutional Equities
Targeting to deliver 28 mn sq. ft over next two years Delivery plans of DLF
Project Segment Area (mn sq. ft)
Phase V, Gurgaon Group Housing 9.5
SIEL, Delhi Commercial Complex 0.5
OMR, Chennai (21 Towers) Group Housing 3
Kolkata Group Housing and Commercial C 2
Corporate Greens, Kolkata Commercial Complex 1.8
NTH, Gurgaon Group Housing 10
Rental Company Offices 1.5
Total 28.3
Source: Company, Kotak Institutional Equities
Asset monetization. Non-core asset monetization yielded Rs12 bn in 3QFY12 versus Rs2.4 bn in 2QFY12 as the company raised - (1) Rs7.9 bn from Noida and Pune IT Park, (2) Rs3.4 bn from FSI sales in Gurgaon and (3) Rs0.8 bn. DLF is now targeting Rs60 bn of asset sales by end-FY2013 from – (1) Aman Resorts (Rs20 bn), Wind/utilities/miscellaneous (Rs20 bn) and (3) Chennai and Mumbai project disposal including Hindoostan Mills land (Rs35-40 bn). The management has indicated that the company is in advanced talks for the sale of Aman Resorts and several buyers are waiting for global conditions to improve/stabilize before taking a decision.

Property DLF
6 KOTAK INSTITUTIONAL EQUITIES RESEARCH
Asset disposal plans – targeting Rs60 bn from asset sales by March 2013 Visible non-core asset disposal plans
Non-core asset Description
Hospitality 20 In deep negotiations; delays due to adverse global macro conditions
Wind/Utilities 10
Misc. assets 10
Strategic proects in Mumbai and Chennai 35-40 Includes Hindoostan Mills land in Lower Parel
Total across medium term 75-80 Targetting Rs60 bn by March 2013 from 3 key assets
Value realizable (Rs bn)
Source: Company, Kotak Institutional Equities
Land bank. DLF’s land bank has now been declining since 3QFY10 and now stands at 349 mn sq. ft (due to land sales, handovers, business proposition changes from group housing to plotted which has a lower FSI). The company spends Rs3-4 bn every quarter on land purchases associated with plot sales (land aggregation).
Land bank declines as 10.3 mn sq. ft is ready for handing over Land bank details, DLF, March fiscal year-ends, 1QFY10-3QFY12 (mn sq. ft)
1QFY10 2QFY10 3QFY10 4QFY10 1QFY11 2QFY11 3QFY11 4QFY11 1QFY12 2QFY12 3QFY12
Total land (mn sq. ft)
Gross area (beginning of quarter) 425 423 432 430 416 413 406 399 367 363 359
Add: New Land 10
Less: Projects disposed off (net) 2 0 3 13 3 7 7 12 2 4
Less: Handed over/Business proposition changes 19 2 0.2 10.3
Net land bank (end of quarter) 423 432 430 416 413 406 399 367 363 359 349
Other land (mn sq. ft)
Gross area (beginning of quarter) 412 411 421 418 405 402 395 388 359 355 351
Add: New Land 10
Less: Projects disposed off (net) 1 0 2.8 12 3 7 7 12 2 4
Less: Handed over/Business proposition changes 16 2 0.2 10.3
Net land bank (end of quarter) 411 421 418 405 402 395 388 359 355 351 341
Hotel land (mn sq. ft)
Gross area (beginning of quarter) 13 12 12 12 12 11 11 11 8 8 8
Add: New Land
Less: Projects disposed off (net) 1 0 0 0
Less: Handed over/Business proposition changes 3
Net land bank (end of quarter) 12 12 12 12 12 11 11 8 8 8 8
Source: Company, Kotak Institutional Equities

DLF Property
KOTAK INSTITUTIONAL EQUITIES RESEARCH 7
Sales subdued due to high interest rates and high property prices while leasing is subdued due to global uncertainty DLF, March fiscal year-ends
4QFY09 1QFY10 2QFY10 3QFY10 4QFY10 1QFY11 2QFY11 3QFY11 4QFY11 1QFY12 2QFY12 3QFY12Development businessSales status (mn sq. ft)Opening balance 27.5 28.3 30.1 32.8 35.2 38.9 40.2 42.3 44.8 46.4 48.7 49.7Add: sales booked during quarter 0.8 2.7 2.7 3.1 3.6 1.9 2.1 2.5 3.8 2.3 1.3 3.3Less: handed over/suspended 0.0 0.8 0.0 0.7 0.0 0.5 0.0 0.0 2.2 0.0 0.2 9.5Closing balance 28.3 30.1 32.8 35.2 38.9 40.2 42.3 44.8 46.4 48.7 49.7 43.5Under Construction (mn sq. ft)Opening Balance 17.3 18.3 25.0 31.6 33.4 38.8 38.3 40.7 40.7 39.4 39.4 39.6Add: new launches/additions/suspended 1.0 7.5 6.6 2.6 5.4 0.0 2.4 0.0 0.9 0.0 0.5 4.9Less: handed Over 0.0 0.8 0.0 0.7 0.0 0.5 0.0 0.0 2.2 0.0 0.2 9.5Closing Balance 18.3 25.0 31.6 33.4 38.8 38.3 40.7 40.7 39.4 39.4 39.6 35.0
Rental businessLease status (mn sq. ft)Opening balance 17.5 17.5 17.0 16.5 18.7 19.4 20.4 22.1 23.7 23.8 24.5 24.7Add: lease booked during quarter (0.1) 0.0 (0.4) 0.4 0.7 1.2 2.0 2.0 1.4 1.0 0.7 0.4Less: cancellation/adjustment/sold 0.0 0.6 0.0 0.0 0.0 0.2 0.3 0.3 1.3 0.2 0.5 2.6Closing balance 17.4 17.0 16.5 16.9 19.4 20.4 22.1 23.7 23.8 24.5 24.7 22.5Under Construction (mn sq. ft)Opening Balance 37.2 17.7 17.1 17.1 17.1 17.1 16.3 15.8 15.7 14.5 12.5 12.5Add: new launches/additions 0.0 0.0 0.0 0.0 0.0 0.0 0.9 0.9 0.0 (0.2) 0.0 0.0Less: handed Over 0.4 0.6 0.0 0.0 0.0 0.86 1.3 1.0 1.2 1.9 0.0 1.0Less: Suspension/adjustment 19.1 0.0 0.0 0.0 0.0 0.0 0.0 0.0 0.0 0.0 0.0 2.2Closing balance 17.7 17.1 17.1 17.1 17.1 16.3 15.8 15.7 14.5 12.5 12.5 9.2
Source: Company, Kotak Institutional Equities
Net-debt declines 2%; cost of debt at 12.75%
DLF’s net debt has dropped by 2% qoq to Rs238 bn as DLF utilized cash from assets sales to reduce its debt burden and net-D/E is now at 0.86X versus 0.88X at end-2QFY12 and 0.82X at end-3QFY11. DLF’s average cost of debt is now at 12.75% on a gross debt of Rs250 bn out of which Rs12 bn is linked to rental properties and likely funded through lease rental inflows. Net fixed assets declined by Rs6.3 bn due to sale of the IT Parks in Pune and Noida. Loans and advances have increased by Rs4.3 bn as the company had to pay Rs1-1.5 bn while shifting to third party contractors and tax outflow connected to properties under litigation (taxes on SEZs) have been classified under loans and advances.

Property DLF
8 KOTAK INSTITUTIONAL EQUITIES RESEARCH
Consolidated summary statement of assets and liabilities Quarterly Balance Sheet, DLF, March fiscal year-ends (Rs mn)
Particulars Dec-09 Mar-10 Jun-10 Sep-10 Dec-10 Mar-11 Jun-11 Sep-11 Dec-11 yoy qoqNet fixed assets 143,540 277,300 278,040 262,224 263,460 281,841 284,110 285,070 278,690 15,230 (6,380)Investments 29,750 55,200 30,060 16,816 13,110 9,958 9,610 15,039 11,800 (1,310) (3,239)Current assets, loans and advances 309,390 280,740 279,640 301,524 305,810 332,717 334,710 343,632 346,350 40,540 2,718
Stocks 115,500 124,120 130,960 143,974 147,850 150,388 152,610 152,338 154,690 6,840 2,352Sundry debtors 19,830 16,660 14,390 19,177 19,460 17,257 18,180 19,540 18,480 (980) (1,060)Cash and bank balances 8,140 9,130 12,970 15,560 11,780 13,461 11,040 11,820 12,460 680 640Other current assets 82,630 44,830 47,680 47,337 49,720 78,900 77,030 79,361 75,870 26,150 (3,491)Loans and advances 83,290 86,000 73,640 75,477 77,000 72,712 75,850 80,572 84,850 7,850 4,278
Goodwill 20,070 12,670 12,580 12,769 13,730 13,840 15,060 15,086 15,200 1,470 114Total use of funds 502,750 625,910 600,320 593,334 596,110 638,357 643,490 658,827 652,040 55,930 (6,787)
Total loans 171,680 216,770 233,740 232,388 236,110 239,903 238,630 254,498 250,260 14,150 (4,238)Secured loans 146,840 193,020 209,460 208,100 219,470 222,762Unsecured loans 24,840 23,750 24,280 24,288 16,640 17,141
Current liabilities and provisions 70,580 92,510 86,110 89,146 88,840 131,014 133,600 129,414 126,450 37,610 (2,964)Deferred tax liability (net) (800) 2,620 2,970 (774) (820) (1,633) (1,260) (1,469) (1,840) (1,020) (371)Shareholders funds 261,290 314,010 277,500 272,574 271,980 269,073 272,520 276,384 277,170 5,190 786Total sources of fund 502,750 625,910 600,320 593,334 596,110 638,357 643,490 658,827 652,040 55,930 (6,787)
Change
Source: Company, Kotak Institutional Equities
Changes to our model – maintain ADD at a revised target price of Rs260/share
We make the following changes to our model –
Delay execution in projects noting (1) delay in launches, (2) the shift over to third-party contractors from in-house construction which implies projects were likely delayed than earlier expected.
Increase gross debt to Rs260 bn for FY2012E from Rs235 bn earlier.
We are cutting our revenues and earnings estimate by 12%/15%/16% and 19%/19%/15% for FY2012E/13E/14E respectively.
Cut revenue estimates by 12%/15%/16% for FY2012E/13E/14E Changes in estimates, DLF
2012E 2013E 2014E 2012E 2013E 2014E 2012E 2013E 2014ERevenue (Rs mn) 97,464 117,734 155,352 110,891 137,989 184,744 (12) (15) (16) EBITDA (Rs mn) 41,630 51,142 64,237 47,624 62,124 73,566 (13) (18) (13) Net income (Rs mn) 16,402 21,576 28,720 20,224 26,649 33,985 (19) (19) (15)
New estimates Old estimates % change
Source: Company, Kotak Institutional Equities estimates

DLF Property
KOTAK INSTITUTIONAL EQUITIES RESEARCH 9
We set our target price at Rs260/share NAV-based valuation, DLF, March fiscal year-ends (Rs bn)
Valuation Methodology 0% 3% 5% 10%Valuation of land reserves 458 559 635 857 Residential 191 244 284 402 Retail 113 139 159 215 Commercial (sold) 80 102 118 164 Commercial (leased) 79 84 88 99Add: 22 Hotel sites 1X land acquisition cost 25 25 25 25Add: Construction JV 10X FY2013E P/E 8 8 8 8Add: Investments in power business 15 15 15 15Less: Net debt as on March 31, 2013 (235) (235) (235) (235)Less: Land cost to be paid (1) (1) (1) (1)NAV (Rs bn) 270 372 448 669NAV/share (Rs) 157 217 261 390Total no. of shares including ESOPs of 17 mn shares (mn) 1,716Target price/share (Rs) 260
Growth rate in selling pricesMarch '13 based NAV
Source: Kotak Institutional Equities estimates
Profit model of DLF March fiscal year-ends, 2008-2014E (Rs mn)
2008 2009 2010 2011 2012E 2013E 2014ETotal revenues 144,329 100,354 74,229 95,606 97,464 117,734 155,352 Land and construction cost (39,998) (32,295) (25,795) (42,999) (39,750) (48,758) (70,375) Employee costs (2,998) (4,537) (4,668) (5,721) (6,825) (8,651) (11,420) SG&A costs (4,229) (7,622) (8,650) (9,358) (9,259) (9,183) (9,321) EBITDA 97,105 55,900 35,116 37,527 41,630 51,142 64,237 Other income 2,464 3,960 4,280 5,839 5,314 6,762 7,222 Interest (3,100) (5,548) (11,100) (17,056) (16,818) (17,929) (20,239) Depreciation (901) (2,390) (3,249) (6,307) (6,855) (10,259) (12,926) Pretax profits 95,568 51,922 25,046 20,002 23,271 29,715 38,294 Current tax (17,146) (6,754) (7,762) (4,594) (8,114) (10,210) (12,613) Deferred tax (176) 739 - 1,246 2,071 3,039 Net income 78,247 45,168 18,024 15,408 16,402 21,576 28,720 Reported net income 78,156 44,682 18,140 15,424 16,402 21,576 28,720
EPS (Rs)Primary 47.1 26.2 10.1 9.1 9.7 12.7 16.9 Fully diluted 46.6 26.2 10.1 9.0 9.6 12.6 16.8 Shares outstanding (mn)Year end 1,705 1,697 1,697 1,698 1,698 1,698 1,698 Primary 1,661 1,697 1,697 1,698 1,698 1,698 1,698 Fully diluted 1,678 1,714 1,714 1,715 1,715 1,715 1,715 Cash flow per share (Rs)Primary 46.4 18.1 4.6 18.1 5.3 9.6 15.9 Fully diluted 45.9 17.9 4.6 18.0 5.3 9.5 15.7 Growth (%)Net income (adjusted) 302 (43) (59) (15) 6 32 33 EPS (adjusted) 259 (44) (61) (11) 6 32 33 DCF/share 1,000 (61) (75) 294 (71) 79 66 Cash tax rate (%) 18 13 31 23 35 34 33 Effective tax rate (%) 18 13 28 23 30 27 25 DPS 4 3 3 2.0 2.5 3.0 3.5
Source: Company, Kotak Institutional Equities estimates

Property DLF
10 KOTAK INSTITUTIONAL EQUITIES RESEARCH
Balance Sheet of DLF March fiscal year-ends, 2008-2014E (Rs mn)
2008 2009 2010 2011 2012E 2013E 2014EEquityShare capital 12,905 17,354 62,593 21,498 21,498 21,498 21,498 Reserves/surplus 183,977 224,184 241,734 241,823 253,386 269,155 291,100 Total equity 196,883 241,538 304,327 263,321 274,884 290,653 312,598 Deferred tax liability/(asset) 359 (414) 2,515 (1,633) (2,878) (4,949) (7,989) LiabilitiesSecured loans 80,534 132,623 193,016 239,903 250,903 247,903 236,903 Unsecured loans 42,237 30,578 23,751 — — — — Total borrowings 122,771 163,201 216,766 239,903 250,903 247,903 236,903 Currrent liabilities 72,157 78,244 87,771 131,014 100,357 108,240 122,869 Total capital 396,065 488,906 617,658 638,357 629,017 647,598 670,134 AssetsCash 21,421 11,956 9,282 13,461 12,794 13,227 22,857 Current assets 244,579 304,268 263,775 319,257 343,632 364,932 382,549 Gross block 51,626 84,867 178,845 190,687 195,865 205,182 215,431 Less: accumulated depreciation 3,435 5,743 13,265 19,572 22,853 33,113 46,038 Net fixed assets 48,191 79,124 165,580 171,115 173,011 172,069 169,392 Capital work-in-progress 51,840 56,882 111,288 110,727 75,782 73,572 71,538 Total fixed assets 100,031 136,006 276,868 281,841 248,794 245,641 240,930 Intangible assets 20,931 22,651 12,680 13,840 13,840 13,840 13,840 Investments 9,102 14,025 55,052 9,958 9,958 9,958 9,958 Misc. expenses — — — — — — — Total assets 396,065 488,906 617,658 638,357 629,017 647,598 670,134
Leverage ratios (%)Debt/equity 62.2 67.7 70.6 91.7 92.2 86.8 77.8 Debt/capitalization 38.4 40.4 41.4 47.8 48.0 46.5 43.7 Net debt/equity 51.4 62.7 67.6 86.5 87.5 82.1 70.3 Net debt/capitalization 33.9 38.5 40.3 46.4 46.7 45.1 41.3 RoAE 65.9 20.4 6.6 5.4 6.1 7.7 9.7 RoACE 35.3 13.8 5.4 5.6 5.1 5.9 7.3
Source: Company, Kotak Institutional Equities estimates

For private Circulation Only. FOR IMPORTANT INFORMATION ABOUT KOTAK SECURITIES’ RATING SYSTEM AND OTHER DISCLOSURES, REFER TO THE END OF THIS MATERIAL.
Better-than-expected EBITDA led by lower operating costs; net income boosted by lower DD&A
OIL reported 3QFY12 EBITDA of `14.3 bn (-27% qoq and +8.8% yoy), 11% higher than our estimate of `12.9 bn. 3QFY12 reported net income was `10.1 bn (-16.2% qoq and +11.7% yoy), 15.5% higher than our estimate of `8.8 bn. The positive variance against our estimates reflects (1) higher-than-expected oil and gas sales volumes, (2) lower staff costs and other expenditure and (3) lower DD&A expenses. The qoq decline in net income reflects (1) lower net realized price of US$57/bbl (-US$29.3/bbl qoq) and (2) a sharp decline in DD&A expense to `2.9 bn (-51% qoq).
Stock trades at 2.9X FY2012E EBITDA despite assuming a conservative subsidy burden
We highlight that OIL stock trades at an inexpensive 2.9X FY2012E EBITDA of `68 bn, out of which the company reported `58 bn in 9MFY12. Besides, we have modeled a fairly conservative scenario of upstream companies bearing 45% of gross under-recoveries of `1.4 tn in FY2012E versus actual sharing of ~38% in 9MFY12. We note that OIL has a large net cash balance of `552/share (as of September 30, 2011). More important, OIL continues to perform well operationally with its 9MFY12 crude sales volumes growing 9% yoy and gas sales volumes jumping 19% yoy. We note that OIL’s volume trajectory is better than ONGC’s.
Maintain BUY with a target price of `1,750 (`1,720 previously)
We maintain our BUY rating on the stock with a revised target price of `1,750 (`1,720 previously) based on 9X FY2013E EPS plus value of investments, potential upside of 32% from current levels. We find OIL’s valuations attractive with the stock trading at 9X FY2012E EPS and 7X FY2013E EPS. The earnings are rather depressed given higher subsidy burden assumed by us.
Revise earnings for FY2012-14E
We have revised our FY2012-14 EPS estimates to `146 (-5.4%), `190 (+1.6%) and `219 (+14.2%) respectively to reflect (1) higher subsidy sharing by upstream companies, (2) higher crude price assumptions, (3) revised exchange rates and (4) other minor changes. We have assumed that upstream companies will bear 45% of total under-recoveries in FY2012 and 50% in FY2013-14 versus 37.9% in 9MFY12 and 38.7% in FY2011.
Oil India (OINL)
Energy
Country cousin steals a march. OIL reported better-than-expected net income of `10.1 bn (-16% qoq and +12% yoy) in 3QFY12 versus our estimate of `8.8 bn, led by (1) higher oil and gas sales volumes, (2) lower operating costs and (3) lower DD&A expenses. The company reported EPS (adjusted) of `128 in 9MFY12, higher than FY2011 EPS of `120. We reiterate our BUY rating on OIL with a revised target price of `1,750 (`1,720 previously) noting (1) attractive valuations with the stock trading at 9X FY2012E EPS and (2) strong long-term growth prospects.
Oil IndiaStock data Forecasts/Valuations 2011 2012E 2013E
52-week range (Rs) (high,low) EPS (Rs) 120.0 146.1 189.9Market Cap. (Rs bn) 317.7 EPS growth (%) 4.2 21.8 30.0
Shareholding pattern (%) P/E (X) 11.0 9.0 7.0Promoters 78.4 Sales (Rs bn) 83.0 100.2 121.3FIIs 2.3 Net profits (Rs bn) 28.8 35.1 45.7MFs 4.2 EBITDA (Rs bn) 48.0 67.7 81.8
Price performance (%) 1M 3M 12M EV/EBITDA (X) 4.2 2.9 2.2Absolute 19.0 3.6 2.4 ROE (%) 16.2 17.5 20.1Rel. to BSE-30 8.4 1.3 0.7 Div. Yield (%) 2.8 4.2 5.7
Company data and valuation summary
1,424-1,101
BUY
FEBRUARY 12, 2012
RESULT
Coverage view: Attractive
Price (Rs): 1,321
Target price (Rs): 1,750
BSE-30: 17,749
QUICK NUMBERS
• 13.6% yoy growth in gas sales; 4.1% yoy growth in crude oil sales
• OIL’s share of the subsidy burden on upstream in 9MFY12 was 12.1%
• 32% potential upside from current levels

Energy Oil India
12 KOTAK INSTITUTIONAL EQUITIES RESEARCH
Key highlights of 3QFY12 results
We highlight the key highlights of 3QFY12 results (see Exhibit 1) below.
OIL interim results, March fiscal year-ends, (` mn)
(% chg.) yoy3QFY12 3QFY12E 3QFY11 2QFY12 3QFY12E 3QFY11 2QFY12 9MFY12 9MFY11 (% chg.) 2012E
Net sales 25,898 25,405 24,734 33,571 1.9 4.7 (22.9) 83,130 65,148 27.6 100,233 Total expenditure (11,616) (12,532) (11,606) (14,020) (7.3) 0.1 (17.1) (36,885) (31,149) 18.4 (47,244) Increase/(decrease) in stock 5 129 267 207 216 —Raw materials (a) (381) (443) (375) (335) (14.1) 1.7 13.7 (1,015) (1,066) (4.8) (1,265) Staff expenditure (2,611) (3,233) (2,867) (3,502) (19.2) (8.9) (25.4) (9,117) (7,635) 19.4 (12,086) Statutory levies (7,172) (7,019) (6,762) (8,784) 2.2 6.1 (18.3) (22,716) (18,341) 23.9 (27,334) Other expenditure (1,457) (1,836) (1,732) (1,666) (20.6) (15.9) (12.5) (4,244) (4,323) (1.8) (6,560) EBITDA 14,282 12,873 13,128 19,551 10.9 8.8 (27.0) 46,245 33,999 36.0 52,988 Other income 3,756 3,615 2,773 4,555 3.9 35.4 (17.5) 11,337 6,857 65.3 14,690 Interest (11) (59) (12) (5) (104) (27) 278.8 (162) DD&A (2,887) (3,433) (2,261) (5,901) (15.9) 27.7 (51.1) (11,572) (6,065) 90.8 (15,136) Depletion (1,040) (896) (932) 16.0 11.7 (2,830) (2,344) 20.7 Depreciation (388) (427) (373) (9.3) 3.8 (1,119) (1,296) (13.7) Dry wells (including provision) (1,459) (938) (4,596) 55.6 (68.3) (7,624) (2,425) 214.3 Pretax profits 15,140 12,996 13,629 18,201 16.5 11.1 (16.8) 45,906 34,764 32.1 52,381 Extraordinary/Prior period adjustment — — (1,081) (1,081) — (1,081) Tax (5,000) (4,228) (4,549) (5,734) 18.3 9.9 (12.8) (14,804) (11,513) 28.6 (16,891) Deferred tax — 11 — — — — (4) Net income 10,140 8,780 9,080 11,385 15.5 11.7 (10.9) 30,021 23,251 29.1 34,405 Adjusted net income 10,140 8,780 9,080 12,104 15.5 11.7 (16.2) 30,754 23,251 32.3 35,137 EPS (Rs) 42.2 36.5 37.8 50.3 127.9 96.7 146.1 Tax rate (%) 33.0 32.4 33.4 33.5 32.2 33.1 32.3
Volume dataSubsidy loss 18,530 18,529 5,586 8,444 231.7 119.4 44,781 16,877 165.3 74,060 Crude sales ('000 tons) 950 938 913 966 1.3 4.1 (1.7) 2,883 2,645 9.0 3,832 Gas sales (mcm) 544 525 479 543 3.7 13.6 0.2 1,595 1,344 18.7 2,123 Crude production ('000 tons) 962 928 991 3.7 (2.9) 2,918 2,665 9.5 Gas production (mcm) 676 616 677 9.7 (0.1) 1,994 1,752 13.8
Pricing data (US$/bbl)Gross crude price realization 110.1 109.0 85.7 112.5 28.5 (2.1) 112.8 79.7 41.5 112.8 Subsidy discount 53.1 52.7 18.5 26.2 186.1 102.4 45.5 19.2 137.3 54.7 Net crude price realization 57.0 56.3 67.1 86.3 (15.1) (33.9) 67.3 60.6 11.1 58.0
Notes:(a) Represents consumption of stores & spares.
Source: Company, Kotak Institutional Equities estimates
A sharp decline in net realized price for crude oil. OIL’s 3QFY12 net realized crude price was US$57bbl versus US$86.3/bbl in 2QFY12 and US$67.1/bbl in 3QFY11. OIL’s subsidy burden in 3QFY12 was `18.5 bn or US$53.1/bbl in crude price oil equivalent terms versus crude price equivalent of US$26.2/bbl in 2QFY12 and US$18.5/bbl in 3QFY11.
Oil and gas sales volumes increase yoy. 3QFY12 gas sales volume increased 13.6% yoy and 0.2% qoq to 544 mcm (equivalent of 5.9 mcm/d). 3QFY12 crude sales volume increased 4.1% yoy and declined 1.7% qoq to 0.95 mn tons.
Lower employee cost. OIL’s employee cost declined 25.4% qoq and 8.9% yoy to `2.6 bn in 3QFY12. The employee cost in 3QFY12 includes a provision of `192 mn due to differential superannuation benefits to employees versus `376 mn accounted in the previous quarter.
Other expenditure declines. OIL’s other expenditure declined 12.5% qoq and 15.9% yoy to `1.5 bn.

Oil India Energy
KOTAK INSTITUTIONAL EQUITIES RESEARCH 13
Lower DD&A expenses qoq. DD&A expenses declined sharply by 51.1% qoq to `2.9 bn (+27.7% yoy). The sharp qoq decline in DD&A expenses represents lower write-off of dry wells and provisions, which declined to `1.5 bn (-68.3% qoq and +55.6% yoy). We note that the company made a provision of ~`4 bn in 2QFY12 to cover prospective liabilities related to Minimum Work Program (MWP) requirements for its NELP blocks.
Other income declines qoq. OIL’s adjusted other income declined by 17.5% qoq to `3.8 bn (+35.4% yoy). We note that reported other income in 2QFY12 included pipeline revenues of `1.4 bn for FY2008-11 due to revision in forward pumping transportation tariff effective from April 2008.
Additional interim dividend and bonus issue. OIL’s Board declared a second interim dividend of `10/share in addition to the interim dividend of `25/share paid earlier. The Board has also recommended a bonus issue of 3:2 scheduled to be completed by April 10, 2012, subject to shareholder approval.
Key assumptions behind our earnings model
We discuss the key assumptions behind our earnings model below. Exhibit 2 gives the major assumptions behind our earnings model and Exhibit 3 gives sensitivity of OIL’s EPS to key variables (INR/USD rate, crude oil price, natural gas price).
Strong growth in net crude price realizations over the next few years Key assumptions, March fiscal year-ends, 2007-2014E
2007 2008 2009 2010 2011 2012E 2013E 2014E Rs/US$ rate 45.3 40.3 45.8 47.4 45.6 48.0 50.5 50.0 Subsidy share scheme loss (Rs mn) 19,938 23,051 30,233 15,488 32,931 74,060 53,400 33,571 Import tariff on crude oil (%) 5.1 5.2 0.9 0.4 5.2 1.2 — —
Crude/natural gas pricesCrude priceCrude price, Bonny Light (US$/bbl) 64.8 78.9 83.0 67.1 84.0 113.0 105.0 100.0 Net crude price, OIL-India (US$/bbl) 47.0 59.8 55.6 56.2 58.5 58.0 67.8 76.7
Natural gas priceCeiling natural gas price, India (Rs/cu m) 3.20 3.20 3.20 3.20 6.78 7.54 7.94 7.86Ceiling natural gas price, India (US$/mn BTU) 1.89 2.12 1.87 1.80 3.98 4.20 4.20 4.20Net natural gas price, OIL-India (Rs/cu m) 2.88 2.88 2.88 2.88 5.49 6.10 6.42 6.36Net natural gas price, OIL-India (US$/mn BTU) 1.70 1.91 1.68 1.62 3.22 3.40 3.40 3.40
Sales volumes—Domestic fieldsCrude oil (mn tons) 3.0 3.0 3.4 3.5 3.6 3.8 3.9 4.0Natural gas (bcm) 1.8 1.8 1.7 1.9 1.8 2.1 2.2 2.4Total sales (mn toe) 4.6 4.7 4.9 5.2 5.2 5.7 5.9 6.1Total sales (mn boe) 34 35 37 39 39 43 44 45Crude oil (%) 66 65 69 68 69 67 67 65Natural gas (%) 34 35 31 32 31 33 33 35
Source: Company, Kotak Institutional Equities estimates

Energy Oil India
14 KOTAK INSTITUTIONAL EQUITIES RESEARCH
OIL's earnings are highly sensitive to crude and gas price assumptions Earnings sensitivity of OIL to key variables
2012E 2013E 2014EDownside Base case Upside Downside Base case Upside Downside Base case Upside
Exchange rateRs/US$ 47.0 48.0 49.0 49.5 50.5 51.5 49.0 50.0 51.0Net profits (Rs mn) 33,126 35,137 37,149 43,753 45,670 47,587 50,824 52,706 54,588Earnings per share (Rs) 137.8 146.1 154.5 182.0 189.9 197.9 211.4 219.2 227.0% upside/(downside) (5.7) 5.7 (4.2) 4.2 (3.6) 3.6Average crude pricesCrude price (US$/bbl) 111.0 113.0 115.0 103.0 105.0 107.0 98.0 100.0 102.0Net profits (Rs mn) 33,568 35,137 36,706 43,998 45,670 47,343 51,018 52,706 54,394Earnings per share (Rs) 139.6 146.1 152.7 183.0 189.9 196.9 212.2 219.2 226.2% upside/(downside) (4.5) 4.5 (3.7) 3.7 (3.2) 3.2CessCess on domestic crude (Rs/ton) 3,090 2,575 2,060 3,090 2,575 2,060 3,090 2,575 2,060Net profits (Rs mn) 33,821 35,137 36,453 44,328 45,670 47,013 51,337 52,706 54,075Earnings per share (Rs) 140.7 146.1 151.6 184.4 189.9 195.5 213.5 219.2 224.9% upside/(downside) (3.7) 3.7 (2.9) 2.9 (2.6) 2.6Natural gas pricesNatural gas price (US$/mn BTU) 3.2 4.2 5.2 3.2 4.2 5.2 3.2 4.2 5.2Net profits (Rs mn) 33,053 35,137 37,221 43,408 45,670 47,932 50,280 52,706 55,132Earnings per share (Rs) 137.5 146.1 154.8 180.5 189.9 199.3 209.1 219.2 229.3% upside/(downside) (5.9) 5.9 (5.0) 5.0 (4.6) 4.6
Source: Kotak Institutional Equities estimates
Subsidy amount. We model a subsidy amount for FY2012, FY2013 and FY2014 of `74.1 bn, `53.4 bn and `33.6 bn respectively. We assume that upstream companies will bear 45% of gross under-recoveries in FY2012 and 50% in FY2013-14 versus 37.9% in 9MFY12 and 38.7% in FY2011. We assume (1) moderate price increases in diesel, kerosene and LPG, and (2) lower crude oil prices, which result in gross under-recoveries declining to `921 bn in FY2013E versus `1.4 tn in FY2012E. We model OIL bearing 12.2% of the subsidy burden on upstream companies in FY2012 and ~12% in FY2013-14 versus 12.1% in 9MFY12. We assume a modest decline in OIL’s share in FY2013-14 due to an increase in GAIL’s share, given a lower proportion of under-recoveries on diesel in the overall under-recoveries over the next two years, led by lower crude prices.
Oil and gas volumes. We model crude oil sales volumes of 3.83 mn tons in FY2012, 3.91 mn tons in FY2013 and 3.98 mn tons in FY2014 versus a run-rate of 3.84 mtpa in 9MFY12 and 3.6 mn tons in FY2011. We model gas volumes at 5.8 mcm/d for FY2012, 6 mcm/d in FY2013 and 6.5 mcm/d in FY2014 versus 5.8 mcm/d in 9MFY12 and 5 mcm/d for FY2011. Implementation of EOR/IOR techniques in OIL’s existing producing fields will contribute to higher volumes. We note that OIL’s 2P reserves are meaningfully higher than its 1P reserves (see Exhibit 4 for details of OIL’s reserves), which offers OIL scope to increase its production volumes significantly from current levels.

Oil India Energy
KOTAK INSTITUTIONAL EQUITIES RESEARCH 15
2P reserves are 87% higher than proven reserves for Oil India Oil India’s reserves, March fiscal year-ends, 2007-11 (mn boe)
2007 2008 2009 2010 20111P reservesCrude oil 283 296 285 282 280 Natural gas 169 233 247 239 225 Overall 452 529 532 521 505 2P reservesCrude oil 540 588 575 580 584 Natural gas 289 345 399 377 360 Overall 829 933 974 957 944 3P reservesCrude oil 1,000 1,039 999 915 867 Natural gas 471 472 543 522 505 Overall 1,471 1,511 1,542 1,437 1,372
Source: Company, Kotak Institutional Equities
Crude oil price assumption. We have assumed higher crude oil (Dated Brent) prices for FY2012, FY2013 and FY2014 at US$113/bbl, US$105/bbl and US$100/bbl respectively versus US$110/bbl, US$100/bbl and US$95/bbl previously. However, we would focus more on OIL’s net realized crude price and our long-term crude price assumption. Exhibit 5 gives OIL’s historical net realized price and our expectations for FY2012 (US$58/bbl), FY2013 (US$67.8/bbl) and FY2014 (US$76.7/bbl).
OIL’s net realization has improved over the past few years OIL's net crude price realization, March fiscal year-ends, 2004-14E (US$/bbl)
28.234.4
48.8 47.0
59.855.6 56.2 58.5 58.0
67.8
76.7
0
15
30
45
60
75
90
2004
2005
2006
2007
2008
2009
2010
2011
2012
E
2013
E
2014
E
(US$/bbl)
Source: Company, Kotak Institutional Equities estimates
The lower net realization for FY2012E (US$58/bbl) versus 9MFY12’s US$67.3/bbl reflects our assumption of higher subsidy burden on upstream companies at 45% of gross under-recoveries in FY2012E.
Natural gas price assumption. We assume FY2012-14 natural gas price at US$4.2/mn BTU.
INR-USD exchange rate. We have revised our exchange rate assumptions for FY2012, FY2013 and FY2014 to `48/US$, `50.5/US$ and `50/US$ respectively versus `48.7/US$, `52.5/US$ and `51/US$ previously.

Energy Oil India
16 KOTAK INSTITUTIONAL EQUITIES RESEARCH
Fair value of OIL (`/share)
FY2013E EPS 190 P/E (X) 9 Valuation 1,709 Investments 41 Numaligarh Refinery Limited 24 Other investments 17
Fair value 1,750
Source: Kotak Institutional Equities estimates
Profit model, balance sheet, cash model of OIL, March fiscal year-ends, 2006-2014E (` mn)
2007 2008 2009 2010 2011 2012E 2013E 2014EProfit model (Rs mn)Net sales 53,892 60,819 72,414 79,056 83,034 100,233 121,348 136,321EBITDA 22,280 23,812 28,400 34,486 36,160 52,988 67,679 77,505Other income 5,335 6,770 9,372 9,371 11,851 14,690 14,090 15,450Interest (140) (344) (87) (37) (139) (162) (2) —Depreciation and depletion (2,595) (3,093) (3,768) (4,811) (4,781) (15,136) (14,162) (14,935)Pretax profits 24,881 27,145 33,916 39,010 43,091 52,381 67,605 78,019Tax (7,406) (8,538) (11,910) (11,598) (12,973) (16,891) (21,917) (25,300)Deferred tax (1,020) (707) (343) (1,211) (1,282) (4) (17) (14)Adjusted net profits 16,436 17,897 21,646 26,169 28,850 35,137 45,670 52,706Earnings per share (Rs) 76.8 83.6 101.1 115.2 120.0 146.1 189.9 219.2
Balance sheet (Rs mn)Total equity 68,491 79,330 93,310 137,638 156,019 175,053 199,764 228,716Deferred tax liability 8,033 8,655 8,998 10,209 11,491 11,495 11,512 11,526Liability for abandonment cost 11 11 15 19 1,645 1,645 1,645 1,645Total borrowings 8,140 1,749 565 375 10,268 50 — —Currrent liabilities 10,320 17,541 30,914 32,693 33,216 32,180 37,194 38,671Total liabilities and equity 94,995 107,286 133,801 180,934 212,638 220,423 250,115 280,558Cash 32,757 42,808 60,700 85,429 117,693 114,359 131,425 148,182Current assets 22,350 18,957 22,853 37,266 30,318 29,447 31,735 33,357Total fixed assets 35,813 40,633 45,361 49,460 55,723 67,712 78,050 90,115Investments 4,075 4,887 4,887 8,594 8,904 8,904 8,904 8,904Deferred expenditure — — — 184 — — — —Total assets 94,995 107,286 133,801 180,934 212,638 220,422 250,115 280,558
Free cash flow (Rs mn)Operating cash flow, excl. working capital 18,357 20,104 27,246 23,621 26,353 25,104 38,510 45,205Working capital changes (8,696) 7,435 2,368 (9,113) 4,034 (166) 2,726 (145)Capital expenditure (9,370) (9,492) (8,496) (11,485) (9,518) (17,374) (17,250) (20,000)Investments 226 (811) — (3,201) (310) — — —Other income 2,892 4,214 5,470 7,268 6,343 14,690 14,090 15,450Free cash flow 3,409 21,450 26,587 7,091 26,902 22,254 38,076 40,510
Ratios (%)Debt/equity 11.9 2.2 0.6 0.3 6.6 — — —Net debt/equity (32.8) (31.9) (31.9) (38.3) (54.1) (46.9) (47.2) (47.9)RoAE 23.1 21.8 22.8 20.9 18.3 19.8 23.0 23.3RoACE 23.0 21.5 22.7 20.9 18.1 19.6 22.8 23.2
Key assumptionsRs/dollar rate 45.3 40.3 45.8 47.4 45.6 48.0 50.5 50.0 Crude fob price (US$/bbl) 64.8 78.9 83.0 67.1 84.0 113.0 105.0 100.0 Ceiling/actual natural gas price (Rs/'000 cm) 3,200 3,200 3,200 3,200 6,783 7,544 7,937 7,858 Subsidy loss (Rs bn) 19.9 23.1 30.2 15.5 32.9 74.1 53.4 33.6
Source: Company, Kotak Institutional Equities estimates

For private Circulation Only. FOR IMPORTANT INFORMATION ABOUT KOTAK SECURITIES’ RATING SYSTEM AND OTHER DISCLOSURES, REFER TO THE END OF THIS MATERIAL.
Consolidated operations hit by write-offs in the coal business
TPWR reported standalone revenue of Rs21.6 bn (35% yoy, 16% qoq), operating profit of Rs3.8 bn (39% yoy, 15% qoq) and adjusted net profit of Rs2.5 bn (70% yoy, -20% qoq) in 3QFY12 against our estimates of Rs20.3 bn, Rs3.5 bn and Rs2.5 bn respectively. TPWR posted consolidated revenues of Rs66.5 bn (51% yoy, 6% qoq), operating profit of Rs9.9 bn (-4% yoy, -27% qoq) and adjusted net profit of Rs2 bn (-50% yoy, -45% qoq) in 3QFY12. Despite robust volume and realization in the coal business (aided further by currency depreciation), consolidated profitability was dented by a Rs6.5 bn write-off of deferred stripping costs in the coal business.. We discuss key highlights of the performance subsequently.
Bumi guidance of 80-85 mn tons production in CY2012, ramp-up to 100 mn tons by CY2013
According to media reports, Bumi Resources’ guidance is for production of 80-85 mn tons in CY2012 from 63 mn tons in CY2011—to be subsequently ramped up to 100 mn tons from KPC and Arutmin (mines in which TPWR has effective stake of 30%) by CY2013E. As we highlighted in our note dated August 24, 2011, “Revisiting the coal equation”, higher production at coal mines is crucial for TPWR to absorb losses at Mundra and maximize benefits of higher coal prices. We note that our estimates factor 70 mn tons in FY2013 and sustainable volumes of 80 mn tons. Higher-than-estimated production volumes at Bumi could be the key upside to earnings and a strong catalyst for the stock.
Mundra losses contained through low costs, better tariffs could be a strong trigger
Our interactions with industry sources and power and coal companies highlighted increased deliberations on a way to compensate power producers with fixed-price tariffs for the increased cost of imported coal. While we are skeptical about such an arrangement coming through, the same could be significantly beneficial for TPWR. We are however more optimistic about prospects of blending low-grade Indonesian coal available at 10-30% lower energy-adjusted value to help to contain generation costs. The management indicated that it was successfully blending low-grade coal during the first few days of operations at Mundra.
Tata Power (TPWR)
Utilities
Coal production ramps up, low cost coal gives Mundra hope. An aggressive production ramp-up at the Indonesian mines could tilt the equation between losses at Mundra and profitability of coal mines in favor of the latter. Contained losses at Mundra through low cost coal or compensation through tariffs could significantly alter the earnings profile. We maintain our BUY rating and target price of Rs125 as ownership of resources and stable utility business better insulate TPWR from macro-risks affecting the power sector.
Tata PowerStock data Forecasts/Valuations 2011 2012E 2013E
52-week range (Rs) (high,low) EPS (Rs) 7.6 4.9 8.7Market Cap. (Rs bn) 273.5 EPS growth (%) 21.5 (36.3) 77.6
Shareholding pattern (%) P/E (X) 14.5 22.7 12.8Promoters 31.8 Sales (Rs bn) 194.5 260.0 288.9FIIs 23.3 Net profits (Rs bn) 18.9 12.0 21.4MFs 4.3 EBITDA (Rs bn) 47.0 55.9 66.5
Price performance (%) 1M 3M 12M EV/EBITDA (X) 10.8 9.3 8.0Absolute 17.9 8.3 (8.8) ROE (%) 13.8 8.4 14.4Rel. to BSE-30 7.4 5.9 (10.3) Div. Yield (%) 1.3 1.4 1.5
Company data and valuation summary
136-80
BUY
FEBRUARY 13, 2012
RESULT
Coverage view: Cautious
Price (Rs): 111
Target price (Rs): 125
BSE-30: 17,749
Tata Power Utilities
KOTAK INSTITUTIONAL EQUITIES RESEARCH 19
Maintain BUY rating with a target price of Rs125
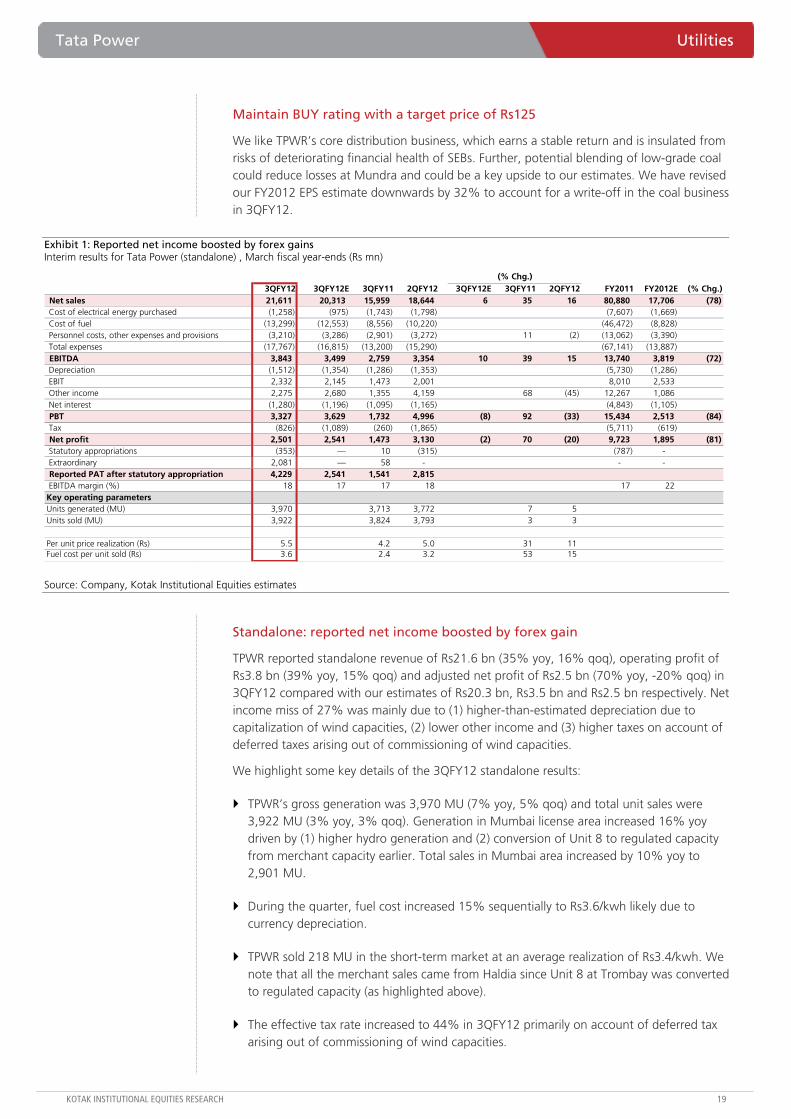
We like TPWR’s core distribution business, which earns a stable return and is insulated from risks of deteriorating financial health of SEBs. Further, potential blending of low-grade coal could reduce losses at Mundra and could be a key upside to our estimates. We have revised our FY2012 EPS estimate downwards by 32% to account for a write-off in the coal business in 3QFY12.
Exhibit 1: Reported net income boosted by forex gains Interim results for Tata Power (standalone) , March fiscal year-ends (Rs mn)
(% Chg.)3QFY12 3QFY12E 3QFY11 2QFY12 3QFY12E 3QFY11 2QFY12 FY2011 FY2012E (% Chg.)
Net sales 21,611 20,313 15,959 18,644 6 35 16 80,880 17,706 (78) Cost of electrical energy purchased (1,258) (975) (1,743) (1,798) (7,607) (1,669) Cost of fuel (13,299) (12,553) (8,556) (10,220) (46,472) (8,828) Personnel costs, other expenses and provisions (3,210) (3,286) (2,901) (3,272) 11 (2) (13,062) (3,390) Total expenses (17,767) (16,815) (13,200) (15,290) (67,141) (13,887) EBITDA 3,843 3,499 2,759 3,354 10 39 15 13,740 3,819 (72) Depreciation (1,512) (1,354) (1,286) (1,353) (5,730) (1,286) EBIT 2,332 2,145 1,473 2,001 8,010 2,533 Other income 2,275 2,680 1,355 4,159 68 (45) 12,267 1,086 Net interest (1,280) (1,196) (1,095) (1,165) (4,843) (1,105) PBT 3,327 3,629 1,732 4,996 (8) 92 (33) 15,434 2,513 (84) Tax (826) (1,089) (260) (1,865) (5,711) (619) Net profit 2,501 2,541 1,473 3,130 (2) 70 (20) 9,723 1,895 (81) Statutory appropriations (353) — 10 (315) (787) - Extraordinary 2,081 — 58 - - - Reported PAT after statutory appropriation 4,229 2,541 1,541 2,815 EBITDA margin (%) 18 17 17 18 17 22
Key operating parametersUnits generated (MU) 3,970 3,713 3,772 7 5 Units sold (MU) 3,922 3,824 3,793 3 3
Per unit price realization (Rs) 5.5 4.2 5.0 31 11 Fuel cost per unit sold (Rs) 3.6 2.4 3.2 53 15
Source: Company, Kotak Institutional Equities estimates
Standalone: reported net income boosted by forex gain
TPWR reported standalone revenue of Rs21.6 bn (35% yoy, 16% qoq), operating profit of Rs3.8 bn (39% yoy, 15% qoq) and adjusted net profit of Rs2.5 bn (70% yoy, -20% qoq) in 3QFY12 compared with our estimates of Rs20.3 bn, Rs3.5 bn and Rs2.5 bn respectively. Net income miss of 27% was mainly due to (1) higher-than-estimated depreciation due to capitalization of wind capacities, (2) lower other income and (3) higher taxes on account of deferred taxes arising out of commissioning of wind capacities.
We highlight some key details of the 3QFY12 standalone results:
TPWR’s gross generation was 3,970 MU (7% yoy, 5% qoq) and total unit sales were 3,922 MU (3% yoy, 3% qoq). Generation in Mumbai license area increased 16% yoy driven by (1) higher hydro generation and (2) conversion of Unit 8 to regulated capacity from merchant capacity earlier. Total sales in Mumbai area increased by 10% yoy to 2,901 MU.
During the quarter, fuel cost increased 15% sequentially to Rs3.6/kwh likely due to currency depreciation.
TPWR sold 218 MU in the short-term market at an average realization of Rs3.4/kwh. We note that all the merchant sales came from Haldia since Unit 8 at Trombay was converted to regulated capacity (as highlighted above).
The effective tax rate increased to 44% in 3QFY12 primarily on account of deferred tax arising out of commissioning of wind capacities.

Utilities Tata Power
20 KOTAK INSTITUTIONAL EQUITIES RESEARCH
Reported net income of Rs4.2 bn includes forex gain of Rs2.7 bn, mainly due to a retrospective (effective April 2011) change in accounting policy to capitalize forex gain/loss arising out of revaluation of long-term foreign currency monetary items. We note that as per the previous policy (such forex gain/losses being carried through P&L), forex loss for the quarter would have been Rs1.7 bn.
Consolidated: profitability hit by write-off of deferred stripping costs
TPWR reported consolidated revenues of Rs66.5 bn (51% yoy, 6% qoq), operating profit of Rs9.9 bn (-4% yoy, -27% qoq) and adjusted net profit of Rs2 bn (-50% yoy, -45% qoq) in 3QFY12. Despite robust volume and realization in the coal business (aided further by currency depreciation), consolidated profitability was dented by (1) a Rs6.5 bn write-off of deferred stripping costs in one of the coal companies (KPC), (2) unscheduled outage of the generation plant for Delhi distribution and (3) losses at Maithon.
We note that during the quarter, KPC, in light of uncertainty involved in estimated strip ratio, wrote off the entire stripping cost accumulated over years. We note that adjustment from stripping costs would henceforth be done only in Arutmin.
Reported net income of Rs2.6 bn includes a forex gain of Rs3.9 bn, mainly due to a retrospective (effective April 2011) change in accounting policy to capitalize forex gain/loss arising out of revaluation of long-term foreign currency monetary items. We note that as per the previous policy (such forex gain/losses being carried through P&L), forex loss for the quarter would have been Rs1.7 bn. Further, reported net income also includes Rs1.6 bn of provision for impairment of assets of the Mundra project.
We discuss below performance of businesses in detail
Coal: robust volume and realizations, margins dented
TPWR’s coal business reported volumes of 17.5 mn tons (9.5% yoy, 9.5% qoq) and realization of US$95/ton (30% yoy, flat qoq) and cash cost declined sequentially from US$46/ton to US$40.9/ton. The management attributed the reduction in cash costs to automation capex being carried out in coal mines and expects the full impact to flow in from September 2011.
We note that during the quarter, KPC, in light of uncertainty involved in estimates of strip ratio, wrote down the entire stripping cost (Rs6.5 bn) accumulated over years. We note that adjustment from stripping cost would henceforth be done only for Arutmin.
Delhi distribution
TPWR’s Delhi distribution reported revenues of Rs10.6 bn (35% yoy, -39% qoq), operating profit of Rs1.3 bn (41% yoy, -26% qoq) and PAT of Rs304 mn (-13% yoy, -65% qoq). The decline in PAT was primarily on account of unscheduled outage of generation assets. The management indicated that at current costs, once the tariff hike is carried out (as per automatic adjustment to be carried out with a lag of a quarter), NDPL would operationally break even.
Maithon: still stabilizing operational efficiencies
Maithon reported revenues of Rs1 bn, operating loss of Rs1 mn and losses before taxes of Rs858 mn. Loss at Maithon was mainly due to (1) higher fuel and O&M cost on account of stabilization of unit 1, (2) lower PLFs due to unavailability of coal during 3QFY12. The management has highlighted that Unit 1 has completely stabilized and coal supply has ramped up and is stable. The management’s guidance for synchronization of the second unit is 4QFY12.

Tata Power Utilities
KOTAK INSTITUTIONAL EQUITIES RESEARCH 21
Exhibit 2: Impairment provisioning and forex losses mar consolidated result Interim results for Tata Power (consolidated) , March fiscal year-ends, (Rs mn)
3QFY12 3QFY11 2QFY12 (qoq) (yoy) FY2011 FY2012E (% Chg.)Net sales 66,459 44,129 62,483 6 51 194,508 259,983 34
Employee cost (3,104) (2,304) (3,026) (8,259) (11,638) Royalty towards coal mine (3,168) - (2,673) (7,658) (11,819) Cost of power purchased (12,850) (8,499) (16,769) (49,143) (57,916) Cost of coal purchased (297) (209) (2) (484) (581) Cost of fuel (17,574) (10,563) (14,154) (43,231) (62,032) Coal processing charges (4,705) (4,395) (5,408) (16,675) (20,001) Cost of raw material and components 220 (1,226) (317) - - Other expenditure (15,091) (6,669) (6,628) (23,101) (41,266) EBITDA 9,889 10,266 13,508 (27) (4) 45,956 54,730 19 Depreciation (3,469) (2,490) (3,066) (9,802) (12,586) EBIT 6,421 7,776 10,442 36,153 42,144 Other income 819 742 1,414 2,386 3,727 Net interest (4,213) (2,109) (3,313) (8,684) (14,769) PBT 3,028 6,409 8,543 (65) (53) 29,856 31,102 4 Tax (1,026) (2,089) (4,535) (9,756) (17,728) Minority interest and share of associates 38 (227) (283) (1,223) (1,341) Net profit 2,039 4,093 3,725 (45) (50) 18,877 12,033 (36) Extraordinary 940 321 (15,599) 1,719 (13,760) Statutory appropriations (353) 10 (315) 285 - Reported profit after statutory appropriation 2,627 4,424 (12,189) 20,881 (1,727) EBITDA margin (%) 15 23 22 24 21 Effective tax rate (%) 34 33 53 33 57
Segment revenuesPower 39,099 26,113 39,344 (1) 50 128,885 157,553 22 Coal 27,007 16,723 21,673 25 61 64,005 98,490 54 Others 1,701 2,125 2,138 (20) (20) 1,618 3,939 143 Total 67,807 44,961 63,155 7 51 194,508 259,983 34 Less: Inter segment revenues (1,208) (552) (333) - - Net revenues 66,599 44,409 62,823 194,508 259,983 EBITPower 4,819 4,018 4,622 4 20 21,646 21,557 (0) Coal 1,353 4,326 5,962 (77) (69) 16,731 24,314 45 Others/ Unallocated 58 26 (152) (138) 121 162 - (100) Total 6,229 8,370 10,432 (40) (26) 38,540 45,871 19 EBIT margin (%)Power 12.3 15.4 11.7 16.8 13.7 Coal 5.0 25.9 27.5 26.1 24.7 Others 3.4 1.2 (7.1) 10.0 - Total 9.2 18.6 16.5 19.8 17.6
(% Chg.)
Source: Company, Kotak Institutional Equities estimates
Exhibit 3: Coal prices have shown signs of moderation recently Coal prices at Richard Bay (US$/ton)
50
70
90
110
130
150
170
Feb-
09
May
-09
Aug
-09
Nov
-09
Feb-
10
May
-10
Aug
-10
Nov
-10
Feb-
11
May
-11
Aug
-11
Nov
-11
Feb-
12
Source: Bloomberg, Company, Kotak Institutional Equities
Exhibit 4: Bumi’s realizations have followed the trend in international coal prices Comparison of Bumi’s average realization and average Richard Bay index, 1QFY09– 3QFY12 (US$/ton)
0
40
80
120
160
200
1QFY
09
2QFY
09
3QFY
09
4QFY
09
1QFY
10
2QFY
10
3QFY
10
4QFY
10
1QFY
11
2QFY
11
3QFY
11
4QFY
11
1QFY
12
2QFY
12
3QFY
12
-100
0
100
200
300
400
500
600
Richard Bay (US$/ton) [LHS]
Bumi realization (US$/ton) [LHS]
EBIT/ton (Rs/ton) [RHS] (Rs/ton)(US$/ton)
Source: Bloomberg, Company, Kotak Institutional Equities
Utilities Tata Power
22 KOTAK INSTITUTIONAL EQUITIES RESEARCH
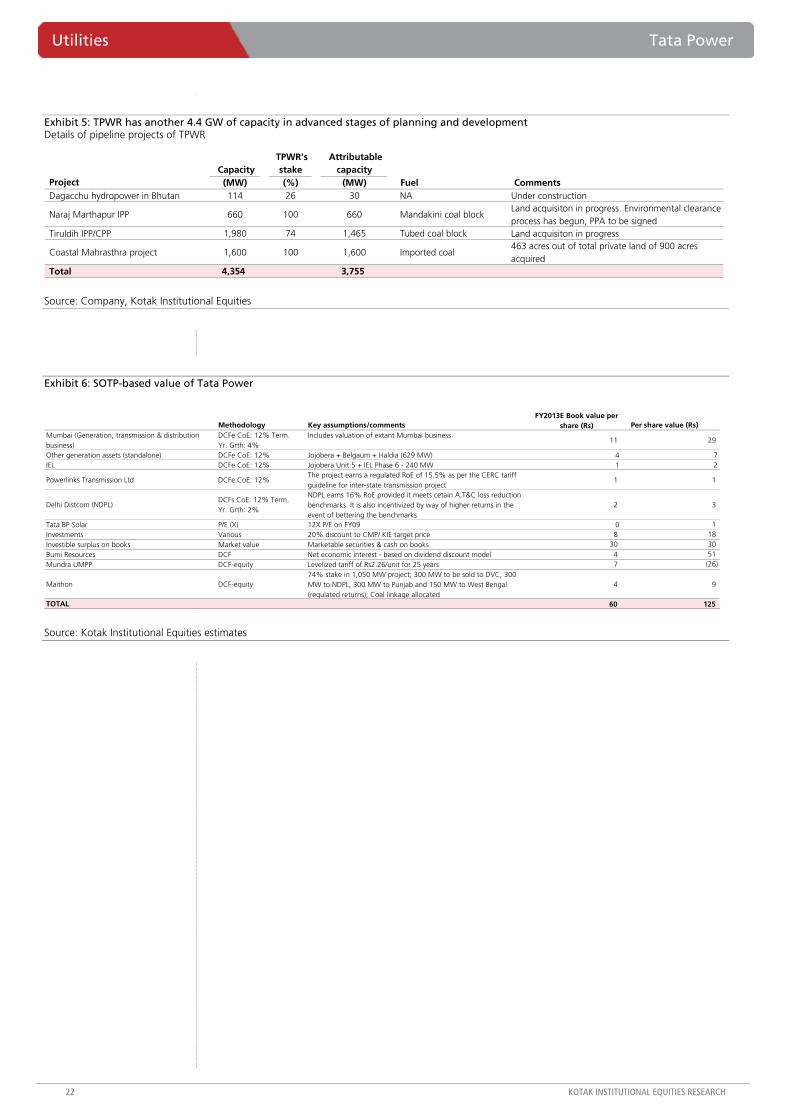
Exhibit 5: TPWR has another 4.4 GW of capacity in advanced stages of planning and development Details of pipeline projects of TPWR
Capacity TPWR's
stake Attributable
capacity Project (MW) (%) (MW) Fuel Comments Dagacchu hydropower in Bhutan 114 26 30 NA Under construction
Naraj Marthapur IPP 660 100 660 Mandakini coal blockLand acquisiton in progress. Environmental clearance process has begun, PPA to be signed
Tiruldih IPP/CPP 1,980 74 1,465 Tubed coal block Land acquisiton in progress
Coastal Mahrasthra project 1,600 100 1,600 Imported coal463 acres out of total private land of 900 acres acquired
Total 4,354 3,755
Source: Company, Kotak Institutional Equities
Exhibit 6: SOTP-based value of Tata Power
Methodology Key assumptions/commentsFY2013E Book value per
share (Rs) Per share value (Rs)Mumbai (Generation, transmission & distribution business)
DCFe CoE: 12% Term. Yr. Grth: 4%
Includes valuation of extant Mumbai business11 29
Other generation assets (standalone) DCFe CoE: 12% Jojobera + Belgaum + Haldia (629 MW) 4 7 IEL DCFe CoE: 12% Jojobera Unit 5 + IEL Phase 6 - 240 MW 1 2
Powerlinks Transmission Ltd DCFe CoE: 12%The project earns a regulated RoE of 15.5% as per the CERC tariff guideline for inter-state transmission project
1 1
Delhi Distcom (NDPL)DCFs CoE: 12% Term. Yr. Grth: 2%
NDPL earns 16% RoE provided it meets cetain A,T&C loss reduction benchmarks. It is also incentivized by way of higher returns in the event of bettering the benchmarks
2 3
Tata BP Solar P/E (X) 12X P/E on FY09 0 1 Investments Various 20% discount to CMP/ KIE target price 8 18 Investible surplus on books Market value Marketable securities & cash on books 30 30 Bumi Resources DCF Net economic interest - based on dividend discount model 4 51 Mundra UMPP DCF-equity Levelized tariff of Rs2.26/unit for 25 years 7 (26)
Maithon DCF-equity74% stake in 1,050 MW project; 300 MW to be sold to DVC, 300 MW to NDPL, 300 MW to Punjab and 150 MW to West Bengal (regulated returns); Coal linkage allocated
4 9
TOTAL 60 125
Source: Kotak Institutional Equities estimates

Tata Power Utilities
KOTAK INSTITUTIONAL EQUITIES RESEARCH 23
Exhibit 7: Tata Power: Profit model, balance sheet, cash model (consolidated) 2009-2014E, March fiscal year-ends (Rs mn)
2009 2010 2011 2012E 2013E 2014EProfit model (Rs mn)Net sales 175,875 189,858 194,508 259,983 288,942 317,658EBITDA 36,496 38,379 45,956 54,730 65,287 68,113Other income 2,266 1,841 2,671 3,727 5,618 5,671Interest (8,129) (7,818) (8,684) (14,769) (18,909) (23,513)Depreciation (6,565) (8,777) (9,802) (12,586) (17,858) (21,066)Pretax profits 24,069 23,625 30,141 31,102 34,138 29,205Tax (11,651) (6,287) (9,756) (17,728) (11,948) (10,160)Minority interest (800) (1,718) (1,223) (1,341) (824) (863)Net profits 11,618 15,620 19,162 12,033 21,365 18,181Extraordinary items 1,023 3,984 1,719 (12,441) — —Earnings per share (Rs) 5 6 8 5 9 7
Balance sheet (Rs mn)Total equity 92,576 120,403 137,442 132,703 149,159 162,431Deferred taxation liability 5,154 4,308 4,753 4,066 3,380 3,380Total borrowings 141,434 184,469 247,624 305,735 318,468 319,673Currrent liabilities 67,812 74,080 95,087 106,968 111,143 122,525Capital contribution from Consumers 2,030 3,664 3,823 3,823 3,823 3,823Minority interest 9,444 12,098 14,143 15,483 16,308 17,171Total liabilities and equity 318,450 399,021 502,871 568,779 602,281 629,003Cash 11,780 23,108 22,066 73,257 70,649 81,078Current assets 62,686 73,794 88,862 82,450 97,651 108,545Total fixed assets 201,076 267,402 356,124 374,867 395,775 401,174Investments 32,512 30,823 28,410 30,797 30,797 30,797Deferred expenditure 10,397 3,896 7,409 7,409 7,409 7,409Total assets 318,450 399,021 502,871 568,779 602,281 629,003
Free cash flow (Rs mn)Operating cash flow, excl. working capital 22,396 29,242 31,888 12,887 39,146 40,079Working capital 10,724 (10,899) (769) 18,035 (11,285) 519Capital expenditure (65,047) (78,368) (97,932) (31,329) (38,767) (26,465)Investments (4,684) 3,486 (1,100) (2,387) — —Free cash flow (36,612) (56,540) (67,913) (2,793) (10,906) 14,134
Source: Company, Kotak Institutional Equities estimates

For private Circulation Only. FOR IMPORTANT INFORMATION ABOUT KOTAK SECURITIES’ RATING SYSTEM AND OTHER DISCLOSURES, REFER TO THE END OF THIS MATERIAL.
Core expansion promising
IDFC reported PAT of Rs3.8 bn, up 19% yoy but 6% below estimates. Growth in net operating income was strong at 15% yoy and 7% above estimates on the back of 25% loan growth and higher capital gains. While provisions were higher than expected, PBT was up 19% yoy and 1% below estimates.
Loans grow well
IDFC reported a loan book of Rs439 bn, up 25% yoy and 12% qoq. Gross disbursements increased by 16% yoy and 60% qoq to Rs58 bn. Repayment rate (repayments/opening loan book) declined to 3% for the quarter from 5% in 2QFY12 and 13% in 3QFY11. Notably, repayment rate in 3QFY12 was the lowest in the past four years. We believe that the competitive scenario has been favorable as most public banks (primarily SBI) currently charge higher interest rates on infrastructure loans as compared to IDFC.
Loans to telecom sector have increased by 31% yoy and 22% qoq. Telecom was the biggest growth driver accounting for 43% of qoq loan book accretion. This was followed by transportation at 30%. The management has highlighted that most of their telecom exposure is towards top three telecom companies.
Approvals were up 108% yoy and down 5% qoq. Most of the approvals are likely for refinancing, and general business activity in the sector was low during the quarter.
NIM improves marginally
IDFC reported NIM (as per KS estimates) of 4.5% as compared to 4.3% in 2QFY12 and 3QFY11.
The share of bonds increased to 65% of total borrowings from 53% in 2QFY12, short-tem loans increased to 12% from 10% qoq while bank loan declined to 10% from 25% for the same period.
IDFC (IDFC)
Banks/Financial Institutions
Growth strong, core in line. IDFC’s 3QFY12 performance was broadly as per our expectations. Highlights to focus on are—(1) loan growth accelerated to 25% from 15% in 2QFY12 and (2) NPLs inched up marginally. NIMs were somewhat ahead of expectations but fees were lower. Higher-than-expected provisions and tax rate pulled down reported earnings. We will revisit our estimates and target price after the conference call with the management.
IDFCStock data Forecasts/Valuations 2012 2013E 2014E
52-week range (Rs) (high,low) EPS (Rs) 10.3 12.1 14.7Market Cap. (Rs bn) 202.0 EPS growth (%) 17.1 18.2 20.9
Shareholding pattern (%) P/E (X) 13.0 11.0 9.1Promoters 0.0 NII (Rs bn) 21.0 24.9 30.3FIIs 47.2 Net profits (Rs bn) 15.5 18.3 22.2MFs 4.1 BVPS 82.4 91.7 103.0
Price performance (%) 1M 3M 12M P/B (X) 1.6 1.5 1.3Absolute 31.3 9.4 6.4 ROE (%) 13.6 13.9 15.1Rel. to BSE-30 19.6 7.0 4.6 Div. Yield (%) 1.5 1.8 2.2
Company data and valuation summary
167-90
ADD
FEBRUARY 10, 2012
RESULT
Coverage view: Attractive
Price (Rs): 134
Target price (Rs): 150
BSE-30: 17,749
QUICK NUMBERS
• PAT up 19%
• Loan growth up 25%
• Gross NPLs at 0.33%

IDFC Banks/Financial Institutions
KOTAK INSTITUTIONAL EQUITIES RESEARCH 25
Fees below expectations, capital gains high
Despite the traction in loan growth, IDFC booked lower loan-related fees—Rs300 mn, down from Rs480 mn in 2QFY12. While income from asset management was almost stable, IDFC Capital’s income was weak largely due to sharp decline in broking income even as investment banking income increased qoq.
During the quarter, IDFC sold 25% stake in IDFC AMC. Consequently, the company booked capital gains of Rs910 mn.
NPLs and provisions increase
IDFC’s gross NPLs inched up by Rs700 mn to 0.33% from 0.22%. The management highlighted that the slippage does not pertain to core infrastructure sectors like energy, transportation or telecom.
IDFC reported provisions of Rs978 mn, up from Rs631 in 2QFY12. This comprised excess provisions of Rs400 mn, specific provisions of Rs100 mn and provisions on equity/other fees etc. of Rs470 mn.
IDFC - Quarterly results March fiscal year-ends, 3QFY11-3QFY12 (Rs mn)
3Q11 4Q11 1Q12 2Q12 3Q12 YoY (%) 3Q12E Actual vs
KS (%) Consolidated financialsTotal Income 13,100 13,066 13,580 17,149 16,392 Interest and other charges 6,500 6,835 7,539 8,259 8,802
Net operating income 6,600 6,231 6,040 8,997 7,597 15 7,075 7 Net operating inc excl cap gains 6,020 5,941 6,060 6,407 6,687 11 6,350 5 Net interest income on infra 4,130 4,250 4,280 4,390 4,730 15 4,500 5
Treasury (incl secu and others) 470 490 550 590 730 55 600 22 Fees and advisory 1,370 1,170 1,120 1,310 1,220 (11) 1,125 8
Asset management 630 880 620 650 680 8 625 9 IDFC SSKI / Investment banking 80 280 80 60 160 100 50 220
Institutional brokerage 140 100 110 120 80 (43) 100 (20) Advisory and other fees 520 (90) 310 480 300 (42) 350 (14)
Profit on sale of equity 580 290 (20) 2,590 910 57 850 7 Total expenditure 2,018 2,016 1,436 1,948 2,147 6 1,550 39
Staff expenses 874 841 649 771 726 (17) 750 (3) Other expenses 657 230 387 546 443 (33) 500 (11) Provisions and contingencies 487 945 399 631 978 101 300 226
PBDT 4,582 4,215 4,605 7,049 5,449 19 5,525 (1) Depreciation 103 99 95 97 96 (6) 100 (4) Profit before Tax 4,480 4,117 4,510 6,953 5,353 19 5,425 (1) Provision for Tax 1,272 1,252 1,378 1,712 1,537 21 1,356 13 Profit after tax 3,207 2,865 3,132 5,241 3,816 19 4,069 (6) Share of profit in associates / minority interest (8) — (6) (1) (1) (87) (1) —PAT (incl minorities share/ after minority share) 3,215 2,865 3,138 5,242 3,817 19 4,070 (6) PBT bef treasury and provisions and extra ordinary items 4,110 4,495 4,653 4,717 5,144 25 4,598 12 Tax rate 28 30 31 25 29 — 25 —
Balance sheet (Rs mn)Shareholders funds 113,900 112,480 115,510 120,730 124,300 Loan funds 366,330 363,040 386,690 395,760 437,290 Total 480,300 475,540 502,200 516,490 561,590 Fixed assets 4,500 4,470 — — —Investments 350,210 375,520 375,270 393,130 438,970 25 412,893 6
Equity 22,160 21,190 19,430 30,900 31,120 Treasury 88,220 61,840 86,650 71,110 66,540
Infrastructure loans 350,210 375,520 375,270 393,130 438,970 Deferred Tax 2,240 2,500 — — —Net current assets 1,380 (16,100) 9,220 21,360 24,960 Total 480,310 461,060 502,210 516,500 561,590
Source: Company, Kotak Institutional Equities estimates

Banks/Financial Institutions IDFC
26 KOTAK INSTITUTIONAL EQUITIES RESEARCH
IDFC - Quarterly results March fiscal year-ends, 3QFY11-3QFY12
3Q11 4Q11 1Q12 2Q12 3Q12 YoY (%) 3Q12E Actual vs
KS (%) Other details Gross approvals (Rs bn) 37 62 58 81 77 108 Gross disbursements (Rs bn) 50 43 30 36 58 16 Loan book (Rs bn) 350 376 375 393 439 25 Repayment (% of opening loan book) 13 5 8 5 3 Outstanding disbursements (Rs bn)Loans 353 378 377 396 442 25 Project loans 206 223 223 237 269 31
Corporate loans 140 149 144 143 154 10 Loans against shares 7 7 9 15 18 154 Mezzanine products 4 3 3 3 3 (25) Equity/ pref shares 23 20 21 20 21 (10)Non-funded 17 16 24 24 23 38
Total 396 417 425 443 488 23
Sectorwise break upsTotal exposure (Rs bn) 576 582 616 627 660 15
Energy 270 267 267 269 275 2 Transportation 159 167 162 151 166 5 Telecom 86 92 129 135 147 72 Others 62 56 57 71 71 15
O/s disbursements 396 416 423 442 488 90 Energy 167 174 187 195 204 22 Telecom 85 90 89 91 111 31 Transportation 93 105 100 102 115 24 Others 51 47 47 54 58 13
Breakup of outstanding borrowings (% of total)Short term 14 5 10 10 12LT Rupee loans 18 18 18 25 10LT bonds 63 67 63 53 65Foreign currency loans 4 8 8 10 11Sub debt 2 2 2 2 1
ROA analysis (%)Net interest income 3.8 3.8 3.9 4.0 4.0 Infrastructure 3.5 3.5 3.5 3.5 3.5
Treasury 0.3 0.3 0.4 0.4 0.5 Non Interest income 2.5 2.0 1.6 1.8 1.7
Fees, syndication and advisory 1.4 1.2 1.0 1.0 1.0 Capital gains & dividend 0.5 0.4 0.1 0.7 0.7
Mis. Fees 0.6 0.5 0.1 0.1 - Operating income 6.4 5.9 5.5 5.8 5.7
Operating expenses 1.6 1.2 1.1 1.1 1.1 Pre- provisioning profits 4.8 4.7 4.4 4.7 4.7 Provisions and losses 0.5 0.5 0.5 0.5 0.6 PBT 4.3 3.1 3.9 4.2 4.1 Tax 1.1 1.2 1.1 1.2 1.2 Associate co profit — — — — —Net Income (PAT) 3.1 3.0 2.8 3.0 3.0
NIMs (KS calc- %) 4.3 4.3 4.3 4.3 4.5
Source: Company

IDFC Banks/Financial Institutions
KOTAK INSTITUTIONAL EQUITIES RESEARCH 27
IDFC—1-year fwd rolling PER and PBR (X) August 2005-Feb 2012
-
9
18
27
36
45
Aug
-05
Feb-
06
Aug
-06
Feb-
07
Aug
-07
Feb-
08
Aug
-08
Feb-
09
Aug
-09
Feb-
10
Aug
-10
Feb-
11
Aug
-11
Feb-
12
0
2
4
6Rolling PER (X) (LHS) Rolling PBR (X) (RHS)
Source: Bloomberg, Kotak Institutional Equities estimates
IDFC: Sum-of-the-parts based valuation
ValuationValue per
share Comments (Rs mn) (Rs)
IDFC (core) 171,419 114Based on residual growth model- implies 1.8X core PBR for medium term RoE of 16-17%
IDFC (Private equity) 6,862 5 10% of FY2013E AUM - US$1.8 bnIDFC (Project equity) 7,500 5 10% of FY2013E AUM - US$1.4 bnIDFC MF 10,143 7 3.5% of FY2013E AUMsIDFC Capital 5,345 4 10X FY2013E PATIDFC's investment in NSE 10,200 7 12X FY2013E PERValue of market investments 14,437 10 At book valueTotal 212,181 150
Source: Kotak Institutional Equities estimates

Banks/Financial Institutions IDFC
28 KOTAK INSTITUTIONAL EQUITIES RESEARCH
IDFC (consolidated), key ratios March fiscal year-ends, 2007-13E (%)
2007 2008 2009 2010 2011E 2012E 2013EIncome Statement growth rate (%)Operating income 64 70 38 4 31 29 21 Net fund based income 51 63 35 26 45 24 18 Fee income 160 64 8 16 31 (16) 23
On AUM 84 5 287 (8) 25 (5) 23 Other operating income 7 29 (15) 81 (30) 15 12 Operating expenses 43 228 55 9 46 0 26 Net profit 60 21 1 44 17 21 18 Core operating profit (PBT-treasury+provisions)
84 42 16 26 36 20 18
Balance Sheet growth rate (%)AssetsInvestments 52 174 40 (24) 40 (1) 8 Infrastructure loans 37 43 3 22 50 17 21 Total assets 44 61 7 13 42 15 18 LiabilitiesLoan funds 57 57 7 13 41 14 21 Total liabilities 52 55 6 12 41 14 20 Shareholders equity 14 90 10 14 48 19 11 Key ratios (%)Yield on
Earning assets exld treasury assets 9.1 10.2 11.3 10.7 10.7 10.8 11.1 Earning assets incl treasury income and assets
9.7 10.5 11.1 10.9 10.6 10.8 11.1
Infrastructure loans 9.3 10.2 11.8 11.3 11.0 11.3 11.6 Interest on bank deposits 8.4 16.0 10.0 15.4 19.9 14.7 16.5 Average cost of funds 7.2 8.1 9.1 7.8 7.5 8.0 8.4 Capital gains to eqty investments 21.3 20.6 10.1 14.1 9.1 10.3 11.5 NIM (excl capital gains) 2.8 3.0 3.2 3.6 4.1 4.0 4.1 Employee .exp to income 0.5 1.1 1.3 1.3 1.4 11.7 12.9 Operating expnses/ income 9.0 18.9 24.8 20.7 23.3 20.6 21.9 Du Pont (%age of average assets)Net interest income 2.8 3.0 3.1 3.6 4.0 4.0 4.0 Loan loss provisions 0.1 0.3 0.5 0.4 0.6 0.5 0.4 Other operating income 2.7 2.7 2.1 2.6 2.2 1.6 1.6 Operating expenses 0.5 1.1 1.3 1.3 1.4 1.1 1.2 ROA 4.1 3.2 2.6 3.4 3.1 2.9 3.0 Average assets/average equity 5.5 5.5 5.0 4.9 4.8 4.6 4.7 ROE 22.6 17.6 12.9 16.6 14.7 13.6 13.9
Source: Company, Kotak Institutional Equities estimates

IDFC Banks/Financial Institutions
KOTAK INSTITUTIONAL EQUITIES RESEARCH 29
IDFC (consolidated): Income statement and balance sheet March fiscal year-ends, 2007-13E (Rs mn)
2007 2008 2009 2010 2011E 2012E 2013E
Total income 16,917 27,928 36,338 39,446 50,015 61,301 74,037 Operating income 12,778 21,700 30,032 31,132 40,762 52,770 63,927 Dividend 91 62 542 1,321 819 818 817
Other charges 136 101 - 15 15 15 15 Net fund based income 4,223 6,866 9,237 11,630 16,897 21,025 24,878 Less: provisions for NPLs 174 688 1,495 1,304 2,349 2,453 2,439 Net fund based income post provisions 4,049 6,178 7,742 10,326 14,548 18,572 22,440
Fee income 2,406 3,944 4,253 4,951 6,498 5,433 6,692 SSKI 1,873 1,070 1,793 1,818 1,253 1,616 On guarantees/commissions- standalone 656 1,515 1,032 1,184 2,212 1,840 2,195 Fees on AMC 528 556 2,150 1,975 2,468 2,340 2,881
Net operating income 8,137 12,288 13,835 18,608 23,386 26,689 32,135 Operating expenses 745 2,447 3,795 4,121 5,997 6,000 7,557 Profit before tax 7,444 9,959 10,254 14,519 17,804 21,104 24,992 Tax 1,235 2,463 2,697 3,611 4,991 5,607 6,672 Net profit 6,209 7,496 7,557 10,908 12,813 15,497 18,320 % growth 60 21 1 44 17 21 18 Net profit post minority interest 6,209 7,353 7,495 10,908 12,813 15,497 18,320 PBT - treasury 5,710 7,675 8,200 11,157 15,049 18,005 21,575 % chg 112 34 7 36 35 20 20 PBT - treasury + provisions 5,884 8,363 9,695 12,190 16,598 19,958 23,514 No. of shares 1,126 1,294 1,295 1,301 1,461 1,509 1,509 Balance SheetAssets
Mutual Funds 3,477 7,148 100 1,378 23 14 14 Equity Shares 6,147 12,606 19,652 20,910 21,973 20,875 21,918 Venture Capital Units 954 1,273 2,983 3,784 4,541 4,531 5,061 Infrastructure loans 139,155 199,024 205,918 250,270 376,523 441,141 534,309 Current assets 18,287 28,674 17,950 30,358 26,556 35,274 39,003 Fixed assets 486 3,812 4,438 4,131 3,907 4,038 4,222 Other assets 854 953 1,393 1,743 2,449 2,571 2,700
Total assets 178,506 286,600 305,583 344,291 490,519 563,067 666,367 LiabilitiesSubordinated debt (unsecured) 6,500 6,500 6,500 6,500 6,500 6,500 6,500 Loan funds 137,136 214,784 228,791 257,401 363,640 415,088 503,492 Current liabilities and provisions 5,561 9,484 8,622 10,290 16,295 17,138 18,029 Total liabilities 149,197 230,767 243,913 274,191 386,435 438,726 528,020 Paid-up capital 11,259 12,943 12,953 13,006 14,609 15,087 15,087 Reserves and surplus 18,049 42,889 48,717 57,094 89,474 109,254 123,259 Shareholders equity 29,308 55,832 61,670 70,100 104,084 124,341 138,346
Source: Company, Kotak Institutional Equities estimates

For private Circulation Only. FOR IMPORTANT INFORMATION ABOUT KOTAK SECURITIES’ RATING SYSTEM AND OTHER DISCLOSURES, REFER TO THE END OF THIS MATERIAL.
3QFY12 consolidated results below expectations
RCOM reported a disappointing set of numbers for the Dec 2011 quarter. Consolidated revenues at Rs50.5 bn (flat qoq, +1% yoy) missed our estimate by 3.7% while EBITDA at Rs16.1 bn (flat qoq, down 3.4% yoy) missed expectations by 6.2%. Net income of Rs1.9 bn (down 26% qoq and 61% yoy) came in ahead of our estimated Rs1.3 bn on the back of (1) depreciation write-back at one of the subsidiaries, RTL, driven by change in accounting policy; this aided PBT to the tune of Rs3.1 bn, and (2) lower-than-expected net finance cost – this line item continues to remain difficult to forecast, in any case (see Exhibit 3). We note that RCOM would have reported a net loss but for the depreciation write-back. ETR remained low at 5.5%.
Operational performance weak across segments
Wireless – revenues of Rs44.5 bn (+0.7% qoq, +9.4% yoy) missed our estimate by 2.6%. EBITDA of Rs11.8 bn (flat qoq as well as yoy) came in 4% below expectations. EBITDA margin was flat qoq. Network traffic grew a modest 1% qoq (weak in the context of strong seasonality), while RPM was flat qoq at Rs0.446/min. We note that RCOM’s voice RPM continues to be substantially lower than the GSM incumbents as the company’s non-voice revenues (as % of revenues) are at least 6-7% points higher and overall RPM similar. ARPU and MOU both came down 1.4% qoq to Rs100 and 224 per sub per month, respectively.
Global Enterprise – revenues were flat qoq and down 7.5% yoy at Rs23.5 bn while EBITDA declined 8.6% yoy (flat qoq) to Rs5.7 bn. Margins were flat qoq as well as yoy at a little over 24%. The company saw sequential decline in both NLD as well as ILD volumes while it stopped disclosing its Fixed-Line/ Broadband ARPU.
‘Others segment’ – revenues fell sharply (19% qoq and 26% yoy) to Rs2.3 bn. DTH forms a major part of this segment and we presume the revenue weakness reflects loss of market share (loss of subs, possibly) in this segment.
Reliance Communications (RCOM)
Telecom
Weak results but do they matter? RCOM reported a weak set of numbers for the Dec 2011 quarter with revenues and EBITDA missing our estimates by a good margin. Depreciation write-back on account of change in accounting policy at one of the subsidiaries helped the company stay in the black at the net income level. We cut estimates, maintain TP at Rs60 and reiterate SELL. Nonetheless, the stock could continue to trade ahead of fundamentals in anticipation of positive news flow as it has in the recent past. To that extent, the fundamental challenges and expensive valuations may not matter much till the anticipated events are out or the market loses patience.
Reliance CommunicationsStock data Forecasts/Valuations 2012 2013E 2014E
52-week range (Rs) (high,low) EPS (Rs) 3.9 1.0 3.9Market Cap. (Rs bn) 194.0 EPS growth (%) (39.7) (73.5) 270.5
Shareholding pattern (%) P/E (X) 23.9 90.1 24.3Promoters 67.9 Sales (Rs bn) 202.1 221.5 239.0FIIs 8.5 Net profits (Rs bn) 8.1 2.2 8.0MFs 0.8 EBITDA (Rs bn) 65.2 73.2 81.3
Price performance (%) 1M 3M 12M EV/EBITDA (X) 8.1 6.9 5.9Absolute 16.0 12.3 (2.7) ROE (%) 2.0 0.6 2.0Rel. to BSE-30 5.6 9.9 (4.3) Div. Yield (%) 0.0 0.0 0.0
Company data and valuation summary
114-61
SELL
FEBRUARY 10, 2012
RESULT
Coverage view: Cautious
Price (Rs): 94
Target price (Rs): 60
BSE-30: 17,749

Reliance Communications Telecom
KOTAK INSTITUTIONAL EQUITIES RESEARCH 31
3-years out, has pan-India GSM expansion delivered for RCOM? Why is this important?
We compare RCOM’s consolidated/wireless financials and wireless operational metrics for Dec 2008 quarter (the last quarter before they completed their pan-India GSM expansion in Jan 2009) to the latest reported quarter (Dec 2011) or on some parameters to Sep 2011 quarter (as industry data is available only till Sep 2011) to assess the success of RCOM’s pan-India GSM pursuit. We would let the chart (Exhibit 1 below) do the talking.
Exhibit 1: RCOM metrics have all seen a deterioration compared to Dec 2008 levels
Dec-08 Dec-11ConsolidatedRevenues (Rs mn) 58,502 50,521 EBITDA (Rs mn) 23,525 16,111 EBITDA margin (%) 40.2 31.9 EBIT (Rs mn) 13,456 6,331 PAT (Rs mn) 14,103 1,862 WirelessRevenues (Rs mn) 44,119 44,471 EBITDA (Rs mn) 16,616 11,823 EBITDA margin (%) 37.7 26.6 EBIT (Rs mn) 9,657 7,195 Volumes (mn mins) 72,100 99,900 RPM (Rs/min) 0.612 0.446 ARPU (Rs/sub/month) 251 100 MOU (min/sub/month) 410 224 Revenue mkt share (%) 16.1 12.7 (Sep-11)Subs total (mn) 61.3 150.1
GSM 10.4 94.9 CDMA 51.0 55.2
Cumulative investments (Rs mn) 486,449 657,111
Incremental rev mkt share (%) 0.1 (Sep-11)Incremental subs mkt share (%) 16.2 Incremental mins mkt share (%) 7.5 (Sep-11)
Notes:(a) GSM-CDMA subs split for Dec 2011 assumes CDMA subs flat at Sep 2011 levels
Source: TRAI, COAI, AUSPI, Company, Kotak Institutional Equities estimates
From an industry perspective, we would only note that substantial capital infusion and/or market disruption (and RCOM did disrupt the market with its Simply Reliance plan) do not necessarily form a winning strategy. We are not suggesting it is possible to succeed without either of the two; however, it is an extremely risky pursuit. We mention this in light of increased concern we have noticed in some sections of the Street that a deep-pocketed player or two could participate in the upcoming 2G spectrum auctions and/or buy one of the challengers out and be the new ‘market disruptor’. Unlike 2008, we now have several case studies of challengers who have tried creating a viable business model using the aforementioned capital+disruption combination without much success (at least in our view). These, in our view, should (and likely would) be a key input for anybody wanting to pursue a disruption strategy to gain foothold in the Indian wireless market and build a viable business model on top of the same.

Telecom Reliance Communications
32 KOTAK INSTITUTIONAL EQUITIES RESEARCH
Cut estimates; retain TP of Rs60/share. Reiterate SELL
Exhibit 2 gives the key changes to our FY2012-14E financial model for RCOM. Our revised EBITDA estimates for FY2012E, 13E, and 14E stand at Rs65 bn, Rs73 bn, and Rs81 bn, respectively, down 3.5-8.2% versus our earlier forecasts. EPS estimate for FY2012E goes up to Rs3.93 on account of lower-than-earlier estimated net finance costs and ETR. We however reduce our FY2013E and FY2014E EPS estimate by 59.8% and 30.1% to Rs1.04 and Rs3.87, respectively. We reiterate SELL with an unchanged target price of Rs60/share.
Other potential corporate developments – in the price largely; margin of safety low
Even as we refrain from commenting on the likelihood or quantifying the impact of some of potential positive developments (tower deal with RIL, tower sale to PE players, more material collaboration with RIL) keeping the market excited about RCOM, we do believe that the current valuations (7.2X FY2013E EV/EBITDA) more than price in the upside from such developments. We see little margin of safety. We also note that potential regulatory negatives like high spectrum renewal pricing, spectrum refarming etc. impact RCOM as well – an aspect largely ignored by the Street preoccupied with worrying about the impact of the same on Bharti and Idea.
Exhibit 2: Key changes to RCOM earnings model, March fiscal year-ends, FY2012-14E
FY2012E FY2013E FY2014E FY2012E FY2013E FY2014E FY2012E FY2013E FY2014EConsolidatedRevenues (Rs mn) 202,088 221,457 238,957 207,781 231,628 253,723 (2.7) (4.4) (5.8) EBITDA (Rs mn) 65,219 73,243 81,251 67,567 77,518 88,544 (3.5) (5.5) (8.2) EBIT (Rs mn) 24,488 26,563 32,932 24,959 30,161 38,150 (1.9) (11.9) (13.7) EPS (Rs/share) 3.93 1.04 3.87 3.46 2.60 5.53 13.6 (59.8) (30.1)
EBITDA margin (%) 32.3 33.1 34.0 32.5 33.5 34.9 -25 bps -40 bps -90 bpsCapex (Rs bn) 14 21 26 15 39 49 (5.9) (45.7) (46.2)
Wireless metricsRevenues (Rs mn) 177,925 196,123 212,274 182,075 203,424 223,843 (2.3) (3.6) (5.2) EBITDA (Rs mn) 47,549 53,483 59,117 49,570 57,517 65,610 (4.1) (7.0) (9.9) EBITDA margin (%) 26.7 27.3 27.8 27.2 28.3 29.3 Subs (mn) 154 168 179 156 174 189 (1.7) (3.8) (5.2) Volumes (bn min) 399 429 457 406 427 464 (1.7) 0.4 (1.6) RPM (paise/min) 0.446 0.457 0.464 0.449 0.476 0.482 (0.6) (4.0) (3.7) ARPU (Rs/sub/month) 102 102 102 104 103 103 (1.4) (0.8) (0.7) MOU (min/sub/month) 230 223 220 232 215 213 (0.8) 3.3 3.1
Revised Earlier Change (%)
Source: Kotak Institutional Equities estimates

Reliance Communications Telecom
KOTAK INSTITUTIONAL EQUITIES RESEARCH 33
Exhibit 3: Quarterly net finance cost for RCOM
Rs mn 3QFY10 4QFY10 1QFY11 2QFY11 3QFY11 4QFY11 1QFY12 2QFY12 3QFY12Rupee loans 60,748 60,953 103,609 149,103 107,000 120,064 73,158 75,157 67,818 Foreign currency loans 188,600 186,520 228,553 228,941 232,348 253,693 258,421 261,838 314,080 Less: FCCB (b) 65,023 64,596 66,752 64,625 64,251 64,093 50,435 55,298 59,934 ex-FCCB FC loans 123,577 121,924 161,801 164,316 168,097 189,600 207,986 206,540 254,146 Estimated interest rate on Re loans (%) 11.0 11.0 11.0 11.0 11.0 11.0 11.0 11.5 11.5 Estimated interest rate on FC loans (%) 7.0 7.0 7.0 7.0 7.0 7.0 7.0 7.0 7.0 Estimated interest on Re loans 1,743 1,673 2,263 3,475 3,521 3,122 2,657 2,132 2,055 Estimated interest on FC loans 2,147 2,148 2,483 2,854 2,909 3,130 3,479 3,627 4,031 Estimated total interest cost 3,889 3,822 4,745 6,328 6,430 6,252 6,136 5,759 6,086 Cash on books + investments 61,956 49,784 48,578 87,338 16,061 54,361 12,916 19,147 15,551 Estimated yield on cash balance (%) 6.0 6.0 6.0 6.0 6.5 6.5 8.0 8.0 8.0 Estimated interest income 804 838 738 1,019 840 572 673 321 347 Net finance (cost)/income reported 4,075 8,134 (4,396) (2,797) (1,296) (2,234) (4,050) (2,274) (3,780)
Estimated forex gains (loss)/ other income 7,160 11,117 (388) 2,512 4,294 3,446 1,413 3,164 1,959
Note:(a) Interest rates and yield on cash balances both pre-tax.(b) Adjusted for Re/US$ movement; FY2008 FCCBs at Rs55 bn, FY2009 FCCB's at Rs71 bn and FY2010 FCCB's of Rs65 bn
Source: Kotak Institutional Equities estimates
Exhibit 4: RCOM's balance sheet for the most recent quarters (Rs mn)
Dec-08 Mar-09 Jun-09 Sep-09 Dec-09 Mar-10 Jun-10 Sep-10 Dec-10 Mar-11 Jun-11 Sep-11 Dec-11CapitalShare capital 10,320 10,320 10,320 10,320 10,320 10,320 10,320 10,320 10,320 10,320 10,320 10,320 10,320 Reserves and surprlus 280,329 359,683 366,845 369,084 373,742 377,505 377,948 370,902 368,413 347,198 344,523 345,692 339,223 Equity 290,649 370,003 377,165 379,404 384,062 387,825 388,268 381,222 378,733 357,518 354,843 356,012 349,543 Minority interest 11,014 8,228 7,001 8,688 9,212 7,472 7,360 7,578 9,857 8,245 8,838 9,802 10,263 Debt 266,722 335,520 314,631 254,665 249,348 247,473 332,162 378,044 339,348 373,757 331,579 336,995 381,898 Current liabilities 272,944 225,980 224,206 227,706 224,407 198,855 184,346 166,725 166,561 126,860 126,089 128,696 143,918 Provisions 36,954 39,162 39,312 37,685 39,680 39,121 39,423 39,310 36,337 24,901 33,310 33,272 30,076 Total capital 878,283 978,893 962,315 908,148 906,709 880,746 951,559 972,879 930,836 891,281 854,659 864,777 915,698
AssetsCash 80,747 109,577 93,001 43,873 60,639 48,585 47,349 86,148 14,878 53,272 11,825 17,959 14,271 Inventories 5,111 5,427 5,390 5,494 5,210 5,446 5,441 5,414 5,191 5,172 5,265 5,565 5,193 Debtors 47,441 54,785 53,797 45,117 37,703 33,380 32,438 32,538 37,649 40,017 41,390 44,188 49,314 Other current assets 32,167 16,912 21,679 20,575 20,691 22,455 20,487 19,321 21,544 11,460 22,647 23,544 23,685 Loans and advances 64,911 59,859 71,071 71,471 61,796 54,286 53,871 57,691 61,346 50,863 57,087 57,994 72,039 Gross block 582,120 756,489 775,079 781,996 778,988 786,643 811,386 814,503 821,324 820,902 821,227 929,484 991,667 Less: Depreciation 128,634 141,069 162,527 167,519 178,361 190,765 206,277 217,864 231,923 273,406 286,826 307,250 324,787 Depreciation for the quar 10,069 11,426 11,144 7,144 8,331 10,647 9,648 9,550 10,338 Net block 453,486 615,420 612,552 614,477 600,627 595,878 605,109 596,639 589,401 547,496 534,401 622,234 666,880 CWIP 191,602 114,056 103,527 105,776 118,716 119,517 185,635 173,938 199,644 181,912 180,953 92,105 83,036 Net fixed assets incl CWIP 645,088 729,476 716,079 720,253 719,343 715,395 790,744 770,577 789,045 729,408 715,354 714,339 749,916 Investments 2,818 2,857 1,298 1,365 1,327 1,199 1,229 1,190 1,183 1,089 1,091 1,188 1,280 Total assets 878,283 978,893 962,315 908,148 906,709 880,746 951,559 972,879 930,836 891,281 854,659 864,777 915,698
Net debt 183,157 223,086 220,332 209,427 187,382 197,689 283,584 290,706 323,287 319,396 318,663 317,848 366,347
Source: Company

Telecom Reliance Communications
34 KOTAK INSTITUTIONAL EQUITIES RESEARCH
Exhibit 5: RCOM 3QFY12 review, Indian GAAP, March fiscal year-ends (Rs mn)
(Rs mn) 3QFY11 2QFY12 3QFY12 qoq (%) yoy (%) 3QFY12E Deviation %)Consolidated resultsRevenues 50,041 50,402 50,521 0.2 1.0 52,436 (3.7) Operating costs (33,361) (34,351) (34,410) 0.2 3.1 (35,267) (2.4) EBITDA 16,680 16,051 16,111 0.4 (3.4) 17,169 (6.2) EBITDA margin (%) 33.3 31.8 31.9 32.7 Depreciation and Amortization (10,338) (10,540) (9,780) (7.2) (5.4) (10,931) (10.5) EBIT 6,342 5,511 6,331 14.9 (0.2) 6,238 1.5 EBIT margin (%) 12.7 10.9 12.5 11.9 Net finance (cost)/income (1,296) (2,274) (3,782) 66.3 191.8 (4,406) (14.2) PBT 5,046 3,237 2,549 (21.3) (49.5) 1,832 39.2 Tax provision 214 (14) (141) 907.1 (165.9) (5) 2,778 PAT before minority interest 5,260 3,223 2,408 (25.3) (54.2) 1,827 31.8 Minority interest (457) (699) (556) (20.5) 21.7 (564) (1.3) Extraoridnaries - (3) 10 6 Reported net income 4,803 2,521 1,862 (26.1) (61.2) 1,270 46.6
Segmental performanceWirelessRevenues 40,644 44,170 44,471 0.7 9.4 45,671 (2.6) EBITDA 11,792 11,756 11,823 0.6 0.3 12,331 (4.1) OPM (%) 29.0 26.6 26.6 27.0 ARPU (Rs/sub/month) 112 101 100 (1.4) (10.3) 102 (2.4) MOU (min/sub/month) 251 227 224 (1.4) (10.8) 228 (1.7) RPM (Rs/min) 0.44 0.45 0.45 (0.0) 0.5 0.45 (0.7) EPM (Rs/min) 0.13 0.12 0.12 (0.4) (8.2) 0.12 (2.5) Total minutes (bn) 91.5 98.9 99.9 1.0 9.2 101.6 (1.7)
Enterprise businessRevenues 25,417 23,353 23,516 0.7 (7.5) 24,116 (2.5) EBITDA 6,233 5,694 5,694 - (8.6) 5,945 (4.2) OPM (%) 24.5 24.4 24.2 24.7
OthersRevenues 3,106 2,827 2,292 (18.9) (26.2) 3,048 (24.8) EBITDA (1,345) (1,389) (1,378) (0.8) 2.5 (1,097) 25.6 OPM (%) (43.3) (49.1) (60.1) (36.0)
Change (%)
Source: Company, Kotak Institutional Equities estimates

Reliance Communications Telecom
KOTAK INSTITUTIONAL EQUITIES RESEARCH 35
Exhibit 6: Our DCF-based end-FY2013E fair value for RCOM's core business is Rs69
2010E 2011E 2012E 2013E 2014E 2015E 2016E 2017E 2018E 2019E 2020E 2021E EBITDA 71,852 84,042 65,219 73,243 81,251 87,772 94,072 100,498 106,972 113,745 120,583 127,558 Tax (2,945) (3,011) (2,123) (990) (2,279) (3,862) (5,424) (7,110) (8,900) (10,839) (12,877) (15,025) Change in working capital (7,642) (35,330) (18,154) (5,590) (2,796) (1,764) (2,698) (2,340) (2,043) (1,821) (1,685) (1,596) Post-tax operating cash flow 61,265 45,702 44,942 66,663 76,177 82,145 85,950 91,048 96,028 101,085 106,022 110,937 Capex (41,621) (128,441) (8,963) (21,189) (26,318) (33,715) (34,445) (35,671) (37,457) (39,511) (41,744) (44,068) Free cash flow 19,644 (82,740) 35,979 45,474 49,859 48,430 51,505 55,377 58,571 61,574 64,278 66,869
Mar-13 WACC and terminal year assumptionsPV of cash flows 292,608 Terminal growth (%) 3.0 PV of terminal value 187,483 WACC (%) 15.0 EV 480,091 Net debt 337,124 Equity value (Rs mn) 142,967 Equity value (US$ mn) 2,978RCL shares (mn) 2,064 Equity value (Rs/RCOM share) 69 Exit FCF multiple (X) 8.6 Exit EBITDA multiple (X) 4.5
Key assumptions (%) 2010E 2011E 2012E 2013E 2014E 2015E 2016E 2017E 2018E 2019E 2020E 2021ERevenue growth (3.4) 4.3 (9.9) 9.6 7.9 6.9 6.0 5.5 5.2 4.9 4.7 4.6 EBITDA growth (16.5) 17.0 (22.4) 12.3 10.9 8.0 7.2 6.8 6.4 6.3 6.0 5.8 EBITDA margin 33.4 37.5 32.3 33.1 34.0 34.4 34.7 35.2 35.6 36.1 36.5 36.9 Capex/sales 19.4 57.3 4.4 9.6 11.0 13.2 12.7 12.5 12.5 12.5 12.6 12.8 Cash tax rate 7.1 (18.5) - - - - - - - - - - Effective tax rate 8.5 0.8 - 6.0 8.0 10.0 12.0 14.0 16.0 18.0 20.0 22.0 Return on avg. capital employed 4.2 3.0 3.3 3.6 4.6 5.5 6.4 7.4 8.4 9.5 10.6 11.8
Source: Company, Kotak Institutional Equities estimates
Exhibit 7: RCOM - target price derivation
Core business value - end-FY2013E DCF-based (Rs/share) 69 Regulatory impact (Rs/share) (19) Upside from towerco transaction (Rs/share) 10
Target price (Rs/share) 60
Regulatory impact built inNegatives Worst-case impact (Rs/share) % of worst-case taken Impact (Rs/share)One time excess spectrum charge (1) 50 (0) Charges on spectrum renewal (NPV of the impact) (45) 50 (22) Change in roaming regulations (10) 25 (2) Spectrum refarming (2) — — 5 paise reduction in termination charges (12) 25 (3) 8% license fee for towercos (3) 25 (1) Total negatives (29)
PositivesReduction in license fees 3 100 3 Lower USO fee from meeting rural rollout obligations 14 50 7 Total positives 10
Net impact (Rs/share) (19)
Source: Kotak Institutional Equities estimates

Telecom Reliance Communications
36 KOTAK INSTITUTIONAL EQUITIES RESEARCH
Exhibit 8: RCOM's condensed financial statements, March fiscal year-ends, 2010-17E
2010 2011 2012E 2013E 2014E 2015E 2016E 2017EProfit model (Rs mn)Revenue 214,964 224,304 202,088 221,457 238,957 255,359 270,780 285,789EBITDA 71,852 84,042 65,219 73,243 81,251 87,772 94,072 100,498EBIT 34,387 19,004 24,488 26,563 32,932 38,755 44,215 49,875Net interest income / (expense) 18,222 (3,950) (13,873) (21,611) (21,537) (19,444) (17,094) (14,326)Tax (4,454) (118) 0 (297) (912) (1,931) (3,255) (4,977)Net profit 46,899 13,335 8,115 2,154 7,983 14,880 21,366 28,072Fully diluted EPS 22.6 6.5 3.9 1.0 3.9 7.2 10.4 13.6 Balance sheet (Rs mn)Cash 8,185 48,663 22,892 27,448 32,137 33,054 34,635 37,819Other current assets 113,388 115,984 106,488 114,768 122,247 129,258 135,850 142,265Fixed assets 712,539 729,409 697,641 672,150 650,148 634,846 619,434 604,482Other current liabilities 187,351 139,608 111,959 114,648 119,332 124,579 128,472 132,548Shareholders funds (incl. minorities) 440,190 413,236 398,851 403,506 413,989 431,369 455,235 485,807Net (debt)/ cash (288,969) (342,050) (342,822) (318,266) (288,577) (257,660) (221,079) (177,895)Free cash flow (Rs mn)EBITDA 71,852 84,042 65,219 73,243 81,251 87,772 94,072 100,498 Change in working capital (7,642) (35,330) (18,154) (5,590) (2,796) (1,764) (2,698) (2,340)Cash tax (paid) (3,725) (118) 0 (297) (912) (1,931) (3,255) (4,977)Capex on PP&E and intangibles (41,621) (128,441) (8,963) (21,189) (26,318) (33,715) (34,445) (35,671)Free cash flow 29,422 (93,350) 21,082 23,045 27,901 28,961 34,550 41,010 Ratios (%)EBITDA margin 33.4 37.5 32.3 33.1 34.0 34.4 34.7 35.2 RoAE 11.0 3.2 2.0 0.6 2.0 3.7 5.0 6.3ROAE (excl. cash and int. income) 9.6 1.6 1.4 0.2 1.7 3.5 5.0 6.3 RoACE 5.0 4.0 3.5 3.7 4.7 5.6 6.4 7.3ROACE (excl. cash and int. income) 4.2 3.0 3.3 3.6 4.6 5.5 6.4 7.4 Net debt/EBITDA (X) 4.0 4.1 5.3 4.3 3.6 2.9 2.4 1.8Net debt/equity (X) 0.7 0.8 0.9 0.8 0.7 0.6 0.5 0.4
Source: Company, Kotak Institutional Equities estimates

For private Circulation Only. FOR IMPORTANT INFORMATION ABOUT KOTAK SECURITIES’ RATING SYSTEM AND OTHER DISCLOSURES, REFER TO THE END OF THIS MATERIAL.
NII growth subdued at 4% yoy
STFC reported NII growth of 4% yoy in 3QFY12 to Rs8 bn on the back of 16% loan growth and compression in NIM (according to our calculations): 8.3% versus 8.9% in 2QFY12. Notably, the company has regrouped its securitization income (the securitization income is now net of operating expenses).
STFC reported 4% decline in disbursements to Rs49 bn during the quarter. While the pre-owned segment grew by 14%, new vehicles finance declined sharply by 50% yoy.
With increase in activity in the market for priority sector assets from NBFCs, STFC sold Rs33 bn of loans to banks during the quarter. The management expects loan sell-down to remain strong in the next quarter as well though this would be much lower that Rs61 bn of loans sold down in 4QFY11.
NIM (according to our calculations) declined to 8.3% from 8.9% in previous quarter and 9.4% in 3QFY11, likely due to higher borrowings cost. The management has highlighted that it faces increased competition from banks and other NBFCs that are gradually focusing more on pre-owned CVs though at the lower-end (5-7 years old vehicles).
Other highlights
Gross NPLs increased by 2% qoq to Rs6.7 bn. Gross NPL ratio was 2.8% as compared to 2.7% in September 2011. The management made write-offs of Rs200 mn from its portfolio of CVs deployed in the mining industry. In light of the challenging business environment for CV operators (due to a slowing economy), STFC has already tightened its underwriting practices and reduced maximum loan-to-value ratio. The management highlighted that in October, the scope of procuring freight business in the return trip (for CV operators) had declined sharply; this was a cause of concern. However, a bumper winter crop helped deployment of trucks in November and December.
Operating expenses increased by 7% yoy. The company has shifted its focus to cost control from growth.
Shriram Transport (SHTF)
Banks/Financial Institutions
A flat quarter. Shriram Transport (STFC) reported PAT of Rs3 bn, flat yoy and qoq. Truck assets under management increased by 16% yoy but lower NIM pulled down net operational income growth to 4%. NPLs increased marginally to 2.8% from 2.7% qoq. We are reducing our estimates to factor lower NII and higher credit cost.
Shriram TransportStock data Forecasts/Valuations 2012 2013E 2014E
52-week range (Rs) (high,low) EPS (Rs) 58.3 67.7 79.0Market Cap. (Rs bn) 128.1 EPS growth (%) 5.7 16.2 16.7
Shareholding pattern (%) P/E (X) 9.9 8.5 7.3Promoters 41.4 NII (Rs bn) 32.9 38.5 46.5FIIs 43.2 Net profits (Rs bn) 13.0 15.1 17.6MFs 1.9 BVPS 254.8 298.4 354.8
Price performance (%) 1M 3M 12M P/B (X) 2.3 1.9 1.6Absolute 15.1 (0.2) (16.2) ROE (%) 24.1 23.3 22.8Rel. to BSE-30 4.9 (2.4) (17.5) Div. Yield (%) 2.0 2.4 2.8
Company data and valuation summary
850-416
RS
FEBRUARY 10, 2012
RESULT
Coverage view: Attractive
Price (Rs): 574
Target price (Rs):
BSE-30: 17,749

Banks/Financial Institutions Shriram Transport
38 KOTAK INSTITUTIONAL EQUITIES RESEARCH
Construction equipment finance business grows rapidly
STFC’s construction equipment finance subsidiary has reported a loan book of Rs15 bn from Rs9 bn in June and Rs13 bn in September 2011. The company proposes to scale up to Rs20 bn by March 2012. The company has already been capitalized with an equity base of Rs2.6 bn.
Revise earnings
We are reducing our earnings estimates by 5% for FY2012E and 2% for FY2013E to factor lower margins and growth in business. Key assumptions in our earnings model include:
Moderate growth, lower margins. We expect STFC to deliver 14% loan growth in FY2012E (unchanged) and 17% loan growth in FY2013E (down from 19% earlier). STFC has recently tightened its lending norms (increased minimum loan-to-value ratio) in order to check asset quality performance in a challenging business environment. This has partially driven revision in growth estimates.
We are reducing our NIM estimates by 20-40 bps. We now model NIM of 8.5% and 8.6% for FY2012E and FY2013E as compared to 9.5%, 8.6% and 8.1% for FY2011, FY2010 and FY2009, respectively.
Higher provisions for FY2012E. We are now modeling credit cost of 2% of average AUMs for FY2012E and 1.9% for FY2013E as compared to credit cost of 1.4-1.7% between FY2008 and FY2011.
Lower opex as well. We are reducing our operating expenses by 11-12% to factor lower traction in business momentum. The ratio of operating expenses to average AUMs will decline to 1.8% and 1.9% for FY2012E and FY2013E as compared to 2.1-2.5% over the past four years.
Impending regulatory changes and impact on STFC: Our views
We await three key regulatory developments with regards to NBFCs:
Clarity on recognition of priority sector classification for loans sold to banks. RBI has appointed a committee of bankers to review the entire framework of priority sector loans. The committee will debate the framework of outsourcing loans from NBFCs.
We find marginal (20-30 bps) decline to NIM estimates in case RBI imposes restrictions on STFC (and other NBFCs) to sell down priority sector loans to banks. While the issues are still under the regulatory scanner, we believe that banks will continue to outsource priority sector loans from NBFCs albeit with KYC restrictions. As such, the economics for loan sell-down transactions for NBFCs will be lower.
Finalization of revised draft securitization guidelines. Among other proposals, the guidelines propose that losses on loan sell-down transactions will be shared by banks and NBFCs on a pro-rata basis. However, the guidelines provide for a ‘first loss structure’ in case of securitization transactions. As such, we expect securitization transactions to pick up (and replace bilateral loan sell-down) if these guidelines are implemented.
The guidelines also propose risk weight of 1,111% on first loss above 10% of loan pool. We don’t find significant near-term impact on capitalization levels of STFC given its current Tier-I ratio of 17% and moderate growth estimates in the near term.
RBI NBFC committee report. The report proposes that (1) NBFCs should have minimum Tier-I ratio of 12% and (2) NBFCs should follow NPL recognition on 3-month past due basis (like banks) versus 6 months earlier.
If implemented, we don’t find significant impact on capitalization in the near term (as highlighted above). However, we find about 7-8% downside to our estimates if the (1) NPL norms are tightened to 3-month past due basis and (2) STFC continues to maintain the current levels of provision coverage. We expect NPLs to increase to 4.5% levels from about 2.5%, if STFC has to migrate to the more stringent norm.

Shriram Transport Banks/Financial Institutions
KOTAK INSTITUTIONAL EQUITIES RESEARCH 39
Shriram Transport Finance 3QFY11-3QFY12 (Rs mn)
3Q11 4QFY1 1QFY12 2Q12 3Q12 YoY (%)Total operational income 13,422 13,501 13,530 14,499 14,385 7
Income on securitised loans 3,640 4,467 5,162 4,824 4,927 35 Total interest expense 5,730 5,791 5,714 6,152 6,348 11 Net operational income (before provisions) 7,692 7,710 7,816 8,347 8,037 4 Net operational income 7,692 7,710 7,816 8,347 8,037 4 Net interest income 4,052 3,243 2,654 3,523 3,110 (23) Provision and credit costs 1,563 1,216 1,419 2,363 1,920 23 Net operational income after provisions 6,129 6,494 6,397 5,984 6,117 (0) Other income 186 174 477 258 294 58 Total income 7,878 7,884 8,293 8,605 8,331 6 Operating expenses 1,750 1,549 1,678 1,787 1,866 7 Pretax income 4,565 5,119 5,196 4,455 4,545 (0) Tax provisions 1,550 1,713 1,727 1,460 1,517 (2) Net Profit 3,015 3,407 3,470 2,995 3,028 0 PBT (excl provisions and extraordinaties) 6,128 6,335 6,615 6,818 6,465 5 PBT (before standard asset provisions) 4,565 5,119 5,196 4,455 4,545 - Tax rate (%) 34 33 33 33 33 - Other details Disbursements ( Rs mn) 51,440 62,011 47,842 47,943 49,270 (4)
Pre-owned 36,428 44,842 37,090 37,830 41,704 14 New 15,012 17,169 10,752 10,113 7,566 (50)
Securitisation during the period (Rs mn) 15,598 60,974 1,665 4,926 33,414 114 O/s Truck assets ( Rs mn) 224,043 197,690 222,253 243,277 237,178 6 Off balance sheet truck assets (Rs mn) 113,754 163,170 147,719 137,487 155,418 37 Total truck assets under management (Rs mn) 337,797 360,860 369,972 380,764 390,000 16 Used vehicle / total assets under management (%) 79 76 75 75 77 New vehicle / total assets under management (%) 21 25 25 25 23 NIMs (KS calc - %) 9.4 8.8 8.6 8.9 8.3 RoA (%) 4.0 4.4 4.3 3.6 3.6 RoE (%) 26.5 28.5 27.4 22.2 21.4 Cost to income (%) 22.7 24.1 21.5 21.4 23.2 Gross NPLs(%) 2.4 2.6 2.7 2.7 2.8 Gross NPL (Rs mn) 5,428 5,285 6,028 6,595 6,718 Net NPLs(%) 0.5 0.4 0.5 0.5 0.4 Net NPL (Rs mn) 1,050 745 1,090 986 931 Capital adequacy ratio (%) 24 25 23 24 25
Debt equity ratio (X) 4.53 4.05 3.69 3.93 3.94Balance Sheet Fixed assets 404 384 370 368 392 (3) Loans and advances 1,679 1,590 1,708 2,112 2,058 23 Cash and bank 39,105 36,251 62,568 38,984 37,924 (3) Investments 17,449 36,507 8,679 15,699 35,165 102 Truck receivables 224,044 197,690 221,274 242,090 235,992 5 Current assets 29,068 42,125 39,172 29,868 32,117 10 Total 311,748 314,548 333,770 329,121 343,647 10 Shareholders funds 46,690 49,044 52,519 55,520 57,891 24
Equity capital 2,262 2,262 2,262 2,262 2,263 0 Reserves 44,429 46,782 50,257 53,258 55,628 25
Loans 211,427 198,817 193,670 218,126 228,034 8 Current liabilities 54,989 68,223 89,313 57,276 59,692 9 Total 311,748 314,548 333,770 329,123 343,647 10
Source: Company, Kotak Institutional Equities estimates

Banks/Financial Institutions Shriram Transport
40 KOTAK INSTITUTIONAL EQUITIES RESEARCH
STFC—1-year forward PER and PBR (X) April 2006-February 2012
-
5.0
10.0
15.0
20.0
Apr
-06
Sep-
06
Feb-
07
Jul-0
7
Dec
-07
May
-08
Oct
-08
Mar
-09
Aug
-09
Jan-
10
Jun-
10
Nov
-10
Apr
-11
Sep-
11
Feb-
12
-
1.0
2.0
3.0
4.0
5.0Rolling PER (X) (LHS) Rolling PBR (X) (RHS)
Source: Company, Bloomberg, Kotak Institutional Equities estimates
Shriram Transport Finance - Old and New estimates March fiscal year-ends, 2012-13E (Rs mn)
Old estimates New estimates % change 2012E 2013E 2012E 2013E 2012E 2013E
Net interest income (a) 34,368 39,712 32,926 38,544 (4) (3) Loans (incl. securitised loans) 412,258 489,642 412,258 485,477 — (1) YoY(%) 14.2 18.8 14.2 17.8 — —NII/ AUMs (%) 8.9 8.8 8.5 8.6 — —NPL provisions 7,244 8,470 7,793 8,682 8 3 Operating expenses 8,044 9,568 7,044 8,657 (12) (10)
Employee 3,763 4,868 3,763 4,868 — —Others 4,281 4,700 3,281 3,790 (23) (19)
PBT 20,529 23,174 19,539 22,705 (5) (2) Tax 6,873 7,758 6,541 7,601 (5) (2) PAT 13,657 15,416 12,998 15,104 (5) (2)
Source: Company, Kotak Institutional Equities estimates

Shriram Transport Banks/Financial Institutions
KOTAK INSTITUTIONAL EQUITIES RESEARCH 41
About 7-8% earnings decline for Shriram Transport if RBI NBFC report is implemented Base and stress case scenarios on STFC's earnings, March fiscal year-ends, 2012-13E
2012E 2013E 2012E 2013E
Base Case Stress case
EPS (Rs) 58 68 54 62
Change from base case (%) (7.6) (8.6)
BVPS (Rs) 264 316 261 308
Change from base case (%) (1.3) (2.5)
ABVPS (X) 255 298 246 283
PER (X) 8.0 6.9 8.7 7.6
PBR (X) 1.8 1.5 1.8 1.5
APBR (X) 1.8 1.6 1.9 1.7
NIM (%) 8.5 8.6 8.5 8.6
Gross NPL (%) 2.8 2.8 4.2 4.2
Coverage (%) 67.2 52.7 66.2 56.1
RoA (%) 3.4 3.4 3.1 3.1
Source: Kotak Institutional Equities estimates
Shriram Transport Finance - key ratios March fiscal year-ends, 2008-13E (Rs mn)
2008 2009 2010 2011E 2012E 2013EGrowth in key parameters (%)Loans under management 145.6 16.8 28.2 23.8 14.2 17.8Total assets 68.6 36.8 7.9 17.2 15.5 20.5Borrowings 69.2 36.1 (8.3) 7.7 37.2 19.6Net interest income 73.7 45.9 30.1 39.4 6.1 17.1Operating expenses 50.9 47.9 5.4 44.0 (11.3) 22.9Key ratios(%)NII/ AUMs(%) 7.4 8.1 8.6 9.5 8.5 8.6Operating expenses/total income 29.7 29.9 24.1 24.8 20.5 21.6Tax rate 35.7 33.5 34.1 33.5 33.5 33.5Dividend payout ratio 30.5 19.5 18.2 13.9 20.0 20.0Debt/ equity (X) 8.14 8.69 4.80 4.05 4.62 4.62
Du Pont Analysis(% of average AUMs)Net interest income 7.4 8.1 8.6 9.5 8.5 8.6Loan loss provisions 1.5 1.4 1.6 1.7 2.0 1.9Net other income 0.1 0.2 0.2 0.3 0.4 0.3Operating expenses 2.2 2.5 2.1 2.4 1.8 1.9(1- tax rate) 64.3 66.5 65.9 66.5 66.5 66.5ROA 2.5 2.9 3.4 3.8 3.4 3.4Average AUMs/average equity (X) 10.9 10.2 8.4 7.5 7.2 6.9ROE 26.9 29.6 28.4 28.1 24.1 23.3
Source: Company, Kotak Institutional Equities estimates

Banks/Financial Institutions Shriram Transport
42 KOTAK INSTITUTIONAL EQUITIES RESEARCH
Shriram Transport Finance - Income statement and balance sheet March fiscal year-ends, 2008-13E (Rs mn)
2008 2009 2010 2011E 2012E 2013EIncome statement Total interest income 24,687 36,875 44,075 53,008 63,701 76,140 Total interest expense 12,966 19,777 21,826 21,982 30,774 37,596 Net interest income 11,721 17,098 22,249 31,026 32,926 38,544 Provisions and write/off 2,311 3,049 4,106 5,548 7,793 8,682 Net interest income (after prov.) 9,410 14,049 18,143 25,478 25,134 29,862 Other income 182 385 620 949 1,450 1,500 Operating expenses 3,534 5,228 5,512 7,938 7,044 8,657
Employee expenses 1,252 2,005 2,251 3,582 3,763 4,868 Depreciation 371 404 149 108 116 121 Advt and commission/brokerage 662 875 591 979 1,028 1,131 Sourcing and collection commission 6 9 30 30 30 30 Other expenses 1,309 1,977 2,483 3,238 2,107 2,507
Pretax income 6,058 9,206 13,251 18,490 19,539 22,705 Tax provisions 2,160 3,082 4,514 6,190 6,541 7,601 Net Profit 3,898 6,124 8,737 12,300 12,998 15,104 % growth 105 57 43 41 6 16 EPS (Rs) 19 30 39 55 58 68 % growth 86 57 30 41 6 16 BPS (Rs) 89 114 172 220 264 316 ABVPS (Rs) 86 110 166 216 255 298 Balance sheetTotal Loans 150,751 179,071 179,689 197,690 241,332 309,925 Investments 80 80 80 80 80 80 Cash & deposits 13,742 57,849 45,373 36,251 41,057 46,359 Loans and advances 405 4,437 912 1,590 2,067 2,687 Net fixed assets 1,426 1,343 465 384 237 234 Other current assets 2,508 386 23,979 42,125 42,272 42,420 Total assets 182,684 249,897 269,725 316,084 365,009 439,670 Total Borrowings 147,864 201,213 184,598 198,817 272,862 326,275Current liabilities 13,595 21,191 38,245 55,720 16,893 21,695 Provisions 2,703 4,327 8,458 12,503 16,254 21,130 Deffered tax liabilities 359 — — — — —Total liabilities 164,520 226,731 231,302 267,040 306,009 369,100 Share capital 2,032 2,035 2,231 2,231 2,231 2,231 Reserves 16,132 21,131 36,168 46,782 56,739 68,308 Shareholders fund 18,164 23,166 38,423 49,044 59,001 70,570 Truck AUM 194,761 227,400 291,489 360,860 412,258 485,477
Source: Company, Kotak Institutional Equities estimates

For private Circulation Only. FOR IMPORTANT INFORMATION ABOUT KOTAK SECURITIES’ RATING SYSTEM AND OTHER DISCLOSURES, REFER TO THE END OF THIS MATERIAL.
Life insurance: APE remains weak
Reliance Life reported 15% decline in APE collections in 3QFY12 against a 54% decline in 2QFY12. Notably, the new IRDA regime was implemented in September 2010 and 3QFY11 was the first quarter in the regime. Thus, the base effect of the new regime has fully played out. Traditional business contributed over half the incremental collection.
The conservation ratio (ratio of renewal premium to new and renewal premium collected last year) improved to 64% from 59% in 2QFY12.
The company has not reported NBAP margins for the quarter but expects reported NBAP margins to decline to 15% in FY2012 (from 17% in FY2011). Reliance Life reported marginal profit during the quarter, a surplus of about Rs2.6 bn. The policyholders’ accounts accrued over the past nine months will be consolidated by the end of the financial year.
Reliance Life concluded a deal with Nippon Life and the life business was valued at Rs115 bn. While the transaction is complete, the management highlighted that capital gains would be realized by the parent in the next quarter. Reliance Capital holds 100% economic stake in the life business. The investment in the life business has been made by Reliance Capital through its own balance sheet and affiliate companies, Viscount Management and Viscount Management Alpha. Viscount Management Alpha is likely to be merged with Reliance Capital in 4QFY12. Thus, Reliance Capital will directly hold 54% stake in the company, and the rest by Viscount Management and Nippon Life.
NBFC: Higher borrowing costs pull down earnings
RCAP’s retail lending loan book was up to Rs142 bn (3% qoq, 33% yoy). Sharp growth in mortgages (42% yoy), autos (59% yoy) and CV (33% yoy) drove growth.
Reliance Capital (RCAPT)
Banks/Financial Institutions
A mixed quarter. Reliance Capital reported mixed performance in 3QFY12. Key highlights of the quarter were: (1) lower APE growth and AUM decline in the life insurance business though earnings were strong, (2) AUM of mutual funds were down 12% qoq, and (3) the general insurance business continued to report losses. The recently concluded deal with Nippon Life will reduce debt and improve profitability. We retain our target price of Rs470, ADD. We believe developments at the ADA Group and simplification of intra-group holdings will be key catalysts to stock performance.
Reliance CapitalStock data Forecasts/Valuations 2012 2013E 2014E
52-week range (Rs) (high,low) EPS (Rs) 8.4 22.6 26.1Market Cap. (Rs bn) 100.7 EPS growth (%) (10.2) 170.0 15.5
Shareholding pattern (%) P/E (X) 48.9 18.1 15.7Promoters 54.1 NII (Rs bn) 5.6 9.6 12.8FIIs 20.8 Net profits (Rs bn) 2.1 5.6 6.4MFs 0.3 BVPS 289.1 301.1 315.0
Price performance (%) 1M 3M 12M P/B (X) 1.4 1.4 1.3Absolute 45.4 13.8 (2.8) ROE (%) 2.9 7.6 8.5Rel. to BSE-30 32.4 11.3 (4.3) Div. Yield (%) 0.8 2.2 2.5
Company data and valuation summary
635-226
ADD
FEBRUARY 13, 2012
RESULT
Coverage view: Attractive
Price (Rs): 409
Target price (Rs): 470
BSE-30: 17,831

Banks/Financial Institutions Reliance Capital
44 KOTAK INSTITUTIONAL EQUITIES RESEARCH
Overall earnings were lower yoy – PBT of Rs651 mn in 3QFY12 against Rs793 mn in 3QFY11 due to lower other income and higher borrowing costs. Gross NPLs increased to Rs2.1 bn from Rs1.8 bn in September and Rs1.5 bn in June. We expect provisioning expenses for the year to decline sharply (0.55% of loans in 2012E compared with 3.3% of loans in 2011) largely due to running down on the personal loan book.
Weak market pulls down AUMs of asset management business
RCAM reported 12% qoq and 16% yoy decline in mutual fund AUMs. PBT margins improved to 45% from 40% in 2QFY12.
During the quarter, Nippon Life agreed to pick up 26% stake in Reliance Asset Management Company for Rs15 bn. This values the business at Rs57 bn: 7% of AUMs in December 2012. The deal requires the approval of regulators.
Reliance Money and Securities: earnings improve
Reliance Securities reported PBT of Rs37 mn vis-à-vis Rs22 mn in 2QFY12 and Rs71 mn in 2QFY12. While its volumes were almost stable, broking yield improved marginally to 5 bps from 4.5 bps a quarter earlier.
Reliance Money (R-Money) reported PBT of Rs84 mn against Rs21 mn in 2QFY12. The financials of R-Money represent the earnings of the distribution business- wealth management (distribution of mutual funds, life insurance etc), money transfer agency and distribution of gold coins. Reliance Money is the largest distributor for Western India Money Transfer. Gold coins are distributed through the India Post network. The management is positive about steady growth from its current base though its reported financials have been weak over the past few quarters.
Retain target price of Rs470, ADD
We are reducing our estimates for FY2012 and FY2013 to factor higher borrowing costs. We have not yet taken cognizance of capital gains (estimated at Rs21 bn before tax) from the deal with Nippon Life in our estimates. The management has highlighted that proceeds from the deal would be used by the parent to reduce debt in the company and would hence help to boost NIM.
We value the contribution of the life insurance business at 2X invested capital, which is 10% NBAP margins and 13.6X NBV FY2013E after 20% holding company discount.
Key highlights of the 3QFY12 results
Standalone PAT was Rs152 mn versus Rs93 mn in 2QFY12 and Rs46 mn in 3QFY11. The company merged the NBFC subsidiaries in the parent company in 4QFY11 and hence the yoy financials are not comparable. No capital gains, high borrowings cost, high tax liability (reasons not clear) have pulled down earnings.
Reliance Capital reported consolidated PAT of Rs1.03 bn against Rs1.54 bn in 3QFY11 and Rs723 mn in 2QFY12.

Reliance Capital Banks/Financial Institutions
KOTAK INSTITUTIONAL EQUITIES RESEARCH 45
Reliance Capital: quarterly results 3QFY11-3QFY12 (Rs mn)
3Q11 4Q11 1Q12 2Q12 3Q12 YoY (%)Income statement (standalone)Operational income 3,972 7,770 7,194 7,049 7,570 91 Interest and finance cost 2,843 5,221 4,570 5,301 5,588 97 Net income (pre provisions) 1,129 2,548 2,624 1,748 1,982 76 Net total income (post provisions) 873 2,251 2,501 1,748 1,982 127 Operating expenses 705 1,381 1,045 1,451 1,589 125 PBT 168 870 1,455 297 393 134 Tax 122 (255) 67 204 241 98 Net profit 46 1,125 1,388 93 152 233 Other details Consumer finance business Loan book (Rs bn) 107,000 123,000 130,000 139,000 142,000 33
Mortgages 46,010 51,660 57,200 62,550 65,320 42 Auto 5,350 6,150 7,800 8,340 8,520 59 CV loans 17,120 19,680 22,100 20,850 22,720 33 SME 36,380 44,280 41,600 43,090 42,600 17 Personal loans 2,140 1,230 1,300 1,390 - -
Extracts of P&L (Rs mn)Interest income 3,123 3,299 3,888 4,455 4,733 52 Other income 359 457 290 256 204 (43) Interest expenses 1,785 2,106 2,673 3,141 3,491 96 Net interest income 1,697 1,650 1,505 1,570 1,242 (27) Provisions 276 103 133 198 86 (69) Net interest income (post provisions) 1,421 1,547 1,372 1,372 1,156 (19) Operating expenses 628 619 789 825 710 13 PBT 793 928 583 547 651 (18)
Source: Company

Banks/Financial Institutions Reliance Capital
46 KOTAK INSTITUTIONAL EQUITIES RESEARCH
Reliance Capital: quarterly data (Rs mn) 3QFY11-3QFY12 (Rs mn)
3Q11 4Q11 1Q12 2Q12 3Q12 YoY (%)Reliance Asset Management AUMsMutual fund (Rs mn) 978,000 1,000,000 1,013,000 931,000 823,000 (16) Offshore fund (US$ mn) 299 271 264 291 246 (18) PMS (Rs mn) 21,000 31,000 29,000 26,000 12,600 (40) Market share (%) 16.0 16.0 16.0 16.0 16.0 16.0 Extracts of P&LIncome 1857 2058 1674 1631 1550 -17Operating expneses 944 1,306 966 975 849 (10) PBT 913 752 709 656 700 (23) PBT margins (%) 49 37 42 40 45 (8)
Reliance General Insurance Gross underwritten premium 4,181 4,369 5,248 3,694 3,998 (4) Combined ratio (%) 124 163 130 123 130 5
Reliance Life Insurance First year premium 3,682 6,748 2,317 3,055 3,125 (15) Adjusted premium 3,908 7,103 2,630 3,164 3,210 (18) Renewal premium 8,570 13,045 8,161 8,600 7,804 (9) Average premium/ policy (Rs) 18,555 15,944 10,500 - 12,000 (35) Branches (#) 1,248 1,248 1,252 - 1,252 0
Assets under management 173,548 178,550 177,353 167,414 165,549 (5)
Persistency (%) 57 48 70 59 64 12 NBAP margin- reported (%) 18 17 - - - (100) Branches (#) 1,248 1,248 1,252 1,252 1,252 0
Reliance SecuritiesKey operational details Branches (#) 6,200 6,200 6,600 6,100 6,100 - Market volume (Rs bn/ day) 1,491 1,537 1,312 1,465 1,405 - Average daily volumes (Rs bn) 18 14 12 12 13 - Days (#) 63 62 60 63 60 - Total volume (Rs bn) 1,134 868 720 756 780 - Market share (%) 1.2 0.9 0.9 0.8 0.9 0.0Broking yield (bps) 2.2 6.6 4.6 4.5 5.0 0.0
Total income 271 570 332 343 390 44 Sub brokerage 95 92 61 - - Personal cost - 149 151 - - Other expenses 109 228 90 321 352 223 PBT 71 101 30 22 37 (48)
Source: Company

Reliance Capital Banks/Financial Institutions
KOTAK INSTITUTIONAL EQUITIES RESEARCH 47
Reliance Capital: sum-of-the-parts based valuations
ValuationValue per
share(Rs mn) (Rs) Comments
Reliance Life Insurance 78,608 256 100% stake, based on NPAB analysis,20% holding company discount works
out to 2X invested capital
Reliance Capital Asset Management 25,177 102 20% holding company discount, works out to 10X PER FY2013E or 2.7% of
AUMs Reliance Securities and R-Money 1,600 6 10X PER FY2013E, 20% holding company discount Reliance General Insurance 7,800 32 0.75X PBR, 20% holding company discount Residual networth (for NBFC business) 19,126 78 1X resudial networth (1) Total 132,311 474
Source: Kotak Institutional Equities
Reliance Capital: old and new estimates March fiscal year-ends, 2012-2013E (Rs mm)
Old estimates New estimates Old vs New (Rs mn) (Rs mn) (%)
2012E 2013E 2012E 2013E 2012E 2013EIncome 27,878 32,447 27,878 32,447 0 0Capital gains 1,850 2,450 1,850 2,450 0 0Interest expenses 17,882 18,600 19,287 19,144 8 3Net interest income 9,996 13,847 8,591 13,303 (14) (4)PBT 4,149 7,952 2,744 7,408 (34) (7)Tax 1,037 1,988 686 1,852 (34) (7)PAT 3,111 5,964 2,058 5,556 (34) (7)
Source: Kotak Institutional Equities estimates

Banks/Financial Institutions Reliance Capital
48 KOTAK INSTITUTIONAL EQUITIES RESEARCH
Reliance Capital: key ratios (%) March fiscal year-ends, 2009-2013E (Rs mn)
2009 2010 2011 2012E 2013EGrowth rates (%)Profit and loss Gross total income 45 (21) (19) 44 16 Interest expenses 203 2 (0) 53 (1) Net income (pre-provisions) 7 (36) (40) 27 55 Provisions and writeoffs 701 107 (46) 22 (40) Operating expenses 18 20 20 20 20 PBT (8) (63) (49) 37 170 PAT (6) (68) (25) (10) 170 Balance sheet Investments 88 28 (2) (19) (13)
Equity shares 69 (8) 121 (15) (10) Fixed assets 20 15 13 - - Total Assets 33 (8) 33 (0) 8 Total borrowings 50 (15) 55 (1) 10 Networth 13 3 2 2 4
Key ratios (%)Debt equity ratio (X) 2.1 1.7 2.6 2.6 2.7 Interest yield on consumer loans 14.7 19.8 11.9 15.6 15.7 Interest on investments 7.8 6.3 10.4 10.0 10.0 Capital gains to equity investments 63.3 26.3 1.7 5.0 10.0 Cost of borrowings 10.6 9.7 8.3 10.5 10.0 Spread on lending 4.1 10.1 3.6 5.1 5.7 Fees on consumer finance business/ loan book 0.5 0.6 0.4 0.4 0.4 Operating expenses to net total income 32.2 39.4 48.8 47.3 36.3 Debt equity ratio (X) 2.1 1.7 2.6 2.6 2.7 Tax rate 10.1 22.6 (14.2) 25.0 25.0 Dividend payout ratio 15.0 47.0 40.0 40.0 40.0
Du Pont analysis (% of average assets)Total revenues 15.8 11.4 8.3 10.5 11.8
Interest on investments 2.9 3.1 3.7 1.5 1.1 Capital gains 6.2 2.3 0.2 0.7 0.9
Interest expense 6.5 6.0 5.4 7.3 7.0 Net total income 9.3 5.4 2.9 3.2 4.8 Provisions/write offs 0.7 1.3 0.6 0.7 0.4 Operating expenses 3.0 2.1 1.4 1.5 1.8 (1-tax rate) 89.9 77.4 114.2 75.0 75.0 ROA 5.1 1.5 1.0 0.8 2.0 Average assets/ average equity (X) 3.0 3.1 3.4 3.8 3.8 RoE 15.3 4.7 3.3 2.9 7.6
Source: Company, Kotak Institutional Equities estimates

Reliance Capital Banks/Financial Institutions
KOTAK INSTITUTIONAL EQUITIES RESEARCH 49
Reliance Capital: P&L and balance sheet March fiscal year-ends, 2009-2013E (Rs mn)
2009 2010 2011 2012 2013EIncome statement Interest income 30,173 23,905 19,333 27,878 32,447 Interest on investments 5,610 6,490 8,627 3,939 3,098 Interest from consumer loans 11,585 11,800 9,274 20,951 25,644 Fees from consumer finance business 416 370 312 538 655 Dividends 360 100 100 100 100 Capital gains 11,777 4,745 520 1,850 2,450 Miscellanous income 424 290 500 500 500 Lease income (net of depreciation) 3.3 3.3 3.3 3.3 3.3 Interest and finance cost 12,368 12,596 12,566 19,287 19,144 Net operational income (pre provisions) 17,809 11,312 6,770 8,594 13,307
Net bad debts and provisions 1,308 2,712 1,459 1,784 1,064 Net operational income (post provisions) 16,501 8,601 5,311 6,810 12,243 Operating expenses 5,726 4,457 3,305 4,067 4,835 Administrative expenses 5,514 4,275 3,162 3,953 4,743
Staff expenses 1,490 1,216 1,094 1,368 1,641 Other expenses 4,024 3,059 2,068 2,585 3,102
Depreciation 212 182 143 114 92 PBT 10,774 3,963 2,006 2,744 7,408 Tax 1,090 894 (285) 686 1,852 Net profit 9,684 3,069 2,291 2,058 5,556 Dividend 1,596 1,596 916 823 2,222 Tax on dividend 271 271 156 140 378 Number of shares 246 246 246 246 246 EPS (Rs) 39 12 9 8 23 BVPS (Rs) 273 280 285 289 301 DPS (Rs) 6 6 4 3 9 Balance sheet Assets Loan book - consumer finance 85,800 33,170 123,000 146,124 181,253
Mortgages 30,500 12,200 51,660 61,992 80,590 Auto 16,300 8,150 6,150 7,380 8,856 CV loans 14,600 7,300 19,680 23,616 30,701 SME 13,800 - 44,280 53,136 61,106 Personal loans 10,600 5,520 1,230 - -
Investments 88,860 113,592 111,666 90,283 78,533 Equity investments 47,389 43,641 96,500 82,500 74,500
Reliance life insurance 14,210 19,210 31,210 31,210 31,210 Reliance general insurance 6,070 6,070 12,000 13,000 13,000 Reliance money 500 500 4,000 4,000 5,000 Prop. book 19,000 17,100 44,500 29,500 19,500 Others equity investments - affiliates 7,609 761 4,790 4,790 5,790
Preference shares 18,724 41,389 15,000 7,500 3,750 Debentures and bonds 22,630 28,445 166 166 166 Others 117 117 117 117 117
Net fixed assets 1,465 1,678 1,890 1,890 1,890 Current assets, loans and advances 41,904 51,781 29,325 26,393 23,754 Total assets 218,028 200,221 265,881 264,690 285,430 LiabilitiesTotal borrowings 140,000 119,581 184,830 182,544 200,327 Total liabilities 150,936 131,364 195,806 193,520 211,303 Networth 67,092 68,857 70,076 71,170 74,126
Equity capital 2,462 2,462 2,462 2,462 2,462 Reserves and surplus 64,631 66,395 67,614 68,709 71,665
Source: Company, Kotak Institutional Equities estimates

For private Circulation Only. FOR IMPORTANT INFORMATION ABOUT KOTAK SECURITIES’ RATING SYSTEM AND OTHER DISCLOSURES, REFER TO THE END OF THIS MATERIAL.
Robust 3QFY12 results led by new films and library income contribution
We provide the details of Eros’ 3QFY12 financial but highlight an important point: the performance of a film studio is not just a function of hit:flop ratio of its film slate, but also the timing of release as well as the timing of booking of library income (a couple of deals on an annual basis). Therefore, the performance is best-monitored on an annual basis than on a quarterly basis given its dynamic/volatile nature.
Eros reported strong 3QFY12 EBIT at Rs1 bn (+62% yoy), ahead of our Rs0.7 bn estimate, led by (1) robust financial performance of its Hindi film slate (RA.One, Rockstar and Desi Boyz) and (2) partial booking of library income in 3QFY12 (favorable base given Eros booked significant library income in 2QFY11) with more to come in 4QFY12E.
The film business also has some seasonality element given festival season and New Year (in 3Q) are considered good periods for film release (more number of holidays); therefore, 9MFY12 performance is more relevant. Eros reported 9MFY12 EBIT of Rs1.78 bn (+25% yoy) led by increase in number of films released (notably Hindi) as well as improved average performance of films (structural given improved BO and C&S TV prospects but also cyclical given Eros has witnessed an improved hit:flop ratio so far in FY2012E).
Retain BUY rating with FY2013E target price of Rs270 (unchanged)
Retain BUY with FY2013E fair value of Rs270 (unchanged); we leave the FY2012E-13E EPS estimates unchanged for now. We note that Eros is already ahead of our expectations for FY2012E with likelihood of a strong 4QFY12E: (1) Eros is confident of continuing with the library income trend in 3QFY12, (2) Eros has acquired the overseas rights of Agneepath and sold the same to Eros Plc and (3) its large big film, ‘Agent Vinod’, is due for release in end-4QFY12E.
The macro-environment (C&S rights) remains positive though we do not expect the C&S rights pricing shooting through the roof as in 2HFY12. Eros has executed well in a traditionally challenging Indian film industry (though many structural changes, Digital Cinema for example, have helped) with further additions to its FY2013E-14E film slate. However, Eros has also benefited from an improved hit:flop ratio in FY2012E, which may normalize in some time.
Eros International (EROS)
Media
Growing up. Eros reported robust 3QFY12 EBIT at Rs1 bn (+62% yoy), ahead of our Rs0.7 bn estimate, led by (1) robust financial performance of its Hindi film slate (RA.One, Rockstar and Desi Boyz) as well as (2) partial booking of library income in 3QFY12. The company has expanded its FY2013E film slate with the addition of Yohan (Tamil) and Go Goa Gone (mid-budget), with further scope for acquisitions. Retain BUY with FY2013E TP of Rs270 (unchanged) given positive macro-environment, continued robust execution by the company and fair valuations (11X FY2013E EPS estimate).
Eros InternationalStock data Forecasts/Valuations 2011 2012E 2013E
52-week range (Rs) (high,low) EPS (Rs) 11.8 15.6 19.6Market Cap. (Rs bn) 21.0 EPS growth (%) 19.0 32.7 25.6
Shareholding pattern (%) P/E (X) 18.4 13.8 11.0Promoters 78.1 Sales (Rs bn) 7.1 8.7 11.3FIIs 8.8 Net profits (Rs bn) 1.1 1.5 1.9MFs 2.3 EBITDA (Rs bn) 1.6 2.1 2.8
Price performance (%) 1M 3M 12M EV/EBITDA (X) 12.7 9.7 7.0Absolute 4.3 (18.7) 42.8 ROE (%) 24.9 20.1 20.4Rel. to BSE-30 (5.0) (20.4) 40.5 Div. Yield (%) 0.0 0.0 0.0
Company data and valuation summary
277-124
BUY
FEBRUARY 13, 2012
RESULT
Coverage view: Neutral
Price (Rs): 216
Target price (Rs): 270
BSE-30: 17,749

Eros International Media
KOTAK INSTITUTIONAL EQUITIES RESEARCH 51
Interim results of Eros International (EROS), March fiscal year-ends (Rs mn)
(% chg)3QFY12 3QFY12E 3QFY11 2QFY12 3QFY12E 3QFY11 2QFY12 9MFY12 9MFY11 (% chg)
Total revenues 4,084 3,400 2,798 1,748 20 46 134 7,370 5,927 24 Total expenditure (3,074) (2,700) (2,176) (1,275) 14 41 141 (5,589) (4,504) 24 Direct film costs (2,935) (2,500) (2,031) (1,121) 17 45 162 (5,163) (4,120) 25 Employee expenses (53) (100) (62) (53) (47) (13) 1 (161) (188) (14) Overhead expenses (86) (100) (83) (101) (14) 4 (15) (264) (197) 34
EBIT 1,010 700 622 473 44 62 114 1,782 1,422 25 OPM (%) 24.7 20.6 22.2 27.0 24.2 24.0 Other income 32 25 46 8 28 (31) 327 98 51 93 Interest expense (45) (25) (27) (34) 80 67 34 (110) (83) 33 Depreciation expenses (15) (25) (11) (14) (40) 31 4 (43) (28) 54
Pretax profits 982 675 630 433 45 56 127 1,727 1,363 27 Extraordinaries (0) (50) (3) (59) (33) 22 Tax provision (331) (175) (187) (107) 89 77 209 (543) (344) 58 Minority interest 40 — (12) 7 (433) 488 30 (5) (718)
Reported net income 691 450 428 274 54 61 153 1,181 1,036 14 Adjusted net income 691 500 431 332 38 60 108 1,215 1,014 20 Tax rate (%) 33.7 25.9 29.6 24.8 31.4 25.2
Source: Company data, Kotak Institutional Equities estimates
Eros reported 3QFY12 revenues of Rs4.08 bn (+46% yoy), much above our Rs3.4 bn expectation. The positive variance resulted largely from robust BO performance of released films (RA.One, Rockstar), despite some question marks on their creative aspects, and strong contribution from pre-sale of ancillary rights (C&S TV, among others). Additionally, Eros India also passed through overseas-only distribution rights of three films (notable among them, Rascals) to Eros Plc during 3QFY12.
Eros’ revenues were also driven by distribution of a number of Tamil films, in overseas as well as domestic markets, through Ayngaran (Velayudham and Mambattian) as well as through Eros standalone (in the domestic market). However, the Tamil business did not contribute to profits given positive minority interest.
The most significant impact to revenues and profits versus our expectation was due to library income, in both standalone as well as subsidiaries (Exhibit 2). Eros’ subsidiary ‘Copsale’ holds the majority of its legacy library (>1,100 films), with the exception of films done in the past 2-3 years (standalone Eros). Eros expects booking of library income to continue in 4QFY12E as well given current visibility.
We note that Eros’ subsidiary revenues witnessed a 30% yoy decline only on account of high base; Ayngaran distributed the movie ‘Endhiran’ in the overseas markets in 3QFY11, accounting for >50% of its revenues for FY2011.
3QFY12 films costs at Rs2.9 bn (+45% yoy) were also ahead of our estimates since the amortization on account of legacy library movies is booked in the same quarter as library income. Eros has highlighted that for FY2011-9MFY12, the library income run-rate has been higher than library amortization cost rate.
3QFY12 other operating expenses (employee, overheads) were below our estimates. However, 4QFY12E employee expenses may go up due to ESOPs.
Eros booked ~Rs20 mn of forex loss in the balance sheet, as part of gross block (against increase in long-term debt/liabilities). The reported tax is higher by Rs23 mn due to some prior-period tax booked in 3QFY12. Eros expects annual tax rate to remain in the region of 28-30% given ‘Copsale’ library income is tax free.

Media Eros International
52 KOTAK INSTITUTIONAL EQUITIES RESEARCH
Key financials of Eros, consolidated and standalone
Eros consolidated Eros standalone Eros "rest"3QFY12 2QFY12 3QFY11 3QFY12 2QFY12 3QFY11 3QFY12 2QFY12 3QFY11
Revenues 4,084 1,748 2,798 3,651 1,513 2,173 433 235 624 Expenses (3,074) (1,275) (2,176) (2,768) (1,097) (1,656) (306) (178) (520) Operating profits 1,010 473 622 882 416 518 128 57 105 OPM (%) 25 27 22 24 27 24 29 24 17 Pre-tax profits 982 433 630 865 384 531 117 49 99 Tax provision (331) (107) (187) (335) (106) (182) 4 (2) (5) Adjusted PAT 651 325 443 530 278 349 121 47 94 Tax rate (%) 34 25 30 39 27 34 (4) 3 5
Source: Company data, Kotak Institutional Equities
Trends in operating income of Eros, FY2010-12E (Rs mn)
92
511
226302
242
559622
134
299
473
1,010
-
200
400
600
800
1,000
1,200
1QFY10 2QFY10 3QFY10 4QFY10 1QFY11 2QFY11 3QFY11 4QFY11 1QFY12 2QFY12 3QFY12
Source: Company data, Kotak Institutional Equities
Release slate of Eros for FY2012E
Film Talent/(Director) Production House Release StatusChalo Dilli Lara Dutta, Vinay Pathak (Prashant Shah) Bheegi Basanti Productions 1QFY12 SuperhitReady Salman Khan, Asin (Aneez Bazmi) T-Series 1QFY12 BlockbusterAlways Kabhi Kabhi Ali Fazal, Zoa Morani (Roshan Abbas) Red Chillies Entertainment 1QFY12 FlopMurder 2 Emraan Hashmi, Jacqueline Fernandez (Mohit Zuri) Vishesh Films 2QFY12 SuperhitZindagi Na Milegi… Hritik, Katrina, Farhan, Abhay (Zoya Akhtar) Excel Entertainment 2QFY12 BlockbusterBol Atif Aslam, Iman Ali Shoman Productions 2QFY12 AverageMausam Shahid Kapoor, Sonam Kapoor (Pankaj Kapoor) Cinergy/Vistaar Religare 2QFY12 FlopRA.One Shahrukh Khan, Kareena Kapoor (Anubhav Sinha) Red Chillies Entertainment 3QFY12 SuperhitRockstar Ranbir Kapoor, Nargis Fakri (Imtiaaz Ali) Shree Ashtavinayak Films 3QFY12 SuperhitDesi Boyz Akshay, John, Deepika, Chitrangada (Rohit Dawan) Next Gen Films 3QFY12 AverageAgent Vinod Saif Ali Khan, Kareena Kapoor (Sriram Raghavan) Illuminati Films 4QFY12Taur Mitran Di Amrinder Gill, Ranvijay Singh (Nananiat Singh) Jimmy Shergill Productions 4QFY12 Punjabi
Source: Industry data, Company data, Kotak Institutional Equities estimates

Eros International Media
KOTAK INSTITUTIONAL EQUITIES RESEARCH 53
Release slate of Eros for FY2013E-14E
Film Talent/(Director) Production House Release StatusHousefull 2 Akshay Kumar, John Abraham, Asin (Sajid Khan) Sajid Nadiadwala 1QFY13Hum Se Tu Pyar Kar Le Shahid Kapoor, Priyanka Chopra (Kunal Kohli) Kunal Kohli Productions 1QFY13Vicky Donor Ayushman Khurana, Jhanvi Gautam (Shoojit Sarcar) John Abraham Entertainment 1QFY13Cocktail Saif Ali Khan, Deepika Padukone (Homi Adjania) Illuminati Films 2QFY13Kochadian Rajnikanth (Soundarya Rajnikanth) Media One 2QFY13 TamilKhiladi 786 Akshay Kumar, Hitesh Reshamia Hari Om Productions FY2013Yohan Adhyayam Ondru Vijay (Gautam Vasudev Menon) Photon Kathaas FY2013 TamilTanu Weds Manu 2 R Mahadevan, Kangana Ranaut (Anand Rai) FY2013Ranjhna Dhanush, Kangana Ranaut (Anand Rai) FY20133G Arjun Rampal (Shantanu Ray, Sheershak Anand) Next Gen Films FY2013Runaway Bahu Under consideration (Shashant Shah) FY2013Go Goa Gone Kunal Khemu, Puja Gupta (Krishna DK, Raj Nidimoru) Illuminati Films/Next Gen Films FY2013Maa Sherawali (3D) Under consideration (Sameer Ahmed) Eros-Eyecube FY2013Gang Bang Arshad Warsi, Rana Dugabatti, Bipasha Basu Super Cinema Films FY2013Rangeeley Jimmy Shergill and others (Nananiat Singh) Jimmy Shergill Productions FY2013 PunjabiUntitled Under consideration (Boney Kapoor) FY2013Rana Rajnikanth, Deepika Padukone (K S Ravikumar) Ocher Studios/Next Gen Films FY2014 Tamil/DelayedPurani Jeans Neil Nitin Mukesh (Tanushree Basu) Next Gen Films FY2014Akele Akele Under consideration (Vikram Jeet Singh) Next Gen Films FY2014Untitled Saif Ali Khan Illuminati Films FY2014Untitled Under consideration (Prabhu Deva) Next Gen Films FY2014Untitled Under consideration (Navaniat Singh) Jimmy Shergill Productions FY2014 Punjabi
Source: Industry data, Company data, Kotak Institutional Equities

Media Eros International
54 KOTAK INSTITUTIONAL EQUITIES RESEARCH
Operating and financial performance of EROS, March fiscal year-ends, 2008-12E
FY2008 FY2009 FY2010 FY2011 9MFY12New releasesBlockbuster/Success
Om Shanti Om Yuvraaj Love Aaj Kal Golmaal-3 ReadyHeyy Baby De Dana Dan Housefull Zindagi Na Milegi DobaraPartner Kambakht Ishq RA.OneCheeni Kum Mee Shivaji Raje… Rockstar
AverageProvoked U Me Aur Hum Aladin Anjaana Anjaani Chalo DilliDus Kahaniyaan Billu Karthi Calling Karthik Paathshaala Murder 2Sunday Heroes Tera Mera Ki Rishta No Problem BolOne Two Three Hashar… A Love Story Heer Ranjha… Haapus Desi Boyz
Shikshancha Aicha Gho Ideachi KalpanaFailure
Journey Bombay to Goa Drona Veer Toonpur Ka Superhero Always Kabhi KabhiGandhi My Father Mr Black Mr White Vaada Raha… Akrosh MausamBuddha Mar Gaya Dhoom Dhadakka Milenge Milenge Pankh GameNanhe Jaisalmer Money Hai Toh Honey Hai Meri Life Main Uski Wife The Great Indian ButterflyNo Smoking Hi Jack London Calling Tere Ishq NachiyaBombay to Bangkok Haal-E-Dil ChintujiBlack & White God Tussi Great Ho Shree Siddhivinayak
Aa Dekhen Zara MittiOverseas
Bhool Bhulaiyaan Sarkaar Raaj Wanted Dabangg RascalsAur Papu Pass Ho Gaya Krazzy 4 Khatta Meetha AgneepathJai Jagannath Bhootnath Benny and BablooKaisey Kahein Mehbooba A FlatDarling Ek Vivaah Aisa Bhi Khuda KasamDahek K KompanySpeed Kaash Mere Hote
Digital prints (#)Hey Baby 340 Yuvraaj 640 Kambakht Ishq 651 Housefull 878 RA.One
Love Aaj Kal 489 Anjaana Anjaani 654 ReadyFinancial performance (Rs mn)Revenues 4,747 6,265 6,409 7,070 7,370 Gross profit 861 1,724 1,605 2,110 2,207 Gross margin (%) 18 28 25 30 30 EBIT 551 1,279 1,130 1,561 1,782 EBIT margin (%) 12 20 18 22 24 Adj. margin (%) 18 16 18 22 24
Notes:(a) Operating margin adjusted for sale of C&S TV rights of blockbuster film 'Om Shanti Om' being sold in FY2009 versus FY2008.
Source: Company data, Kotak Institutional Equities estimates

Eros International Media
KOTAK INSTITUTIONAL EQUITIES RESEARCH 55
Indian regional print and broadcasting valuation comparables
Price Mcap EV Sales EV/EBITDA (X) P/E (X) Valuation Discount12-Feb (Rs bn) (Rs bn) (Rs bn) 2011 2012E 2013E 2011 2012E 2013E TP (Rs) EV/E (X) (%)
Eros International 216 21 20 7 13 9 7 16 14 11 266 9 Regional printJagran Prakashan 108 34 34 12 9 9 8 16 17 14 150 11 17 DB Corp Limited 200 36 37 13 9 10 9 14 18 15 300 13 30 Average 9 10 8 15 17 14 12 24 BroadcastingZee Entertainment 130 127 117 30 15 14 11 22 21 17 160 13 33 Sun TV Network 341 134 126 20 11 12 10 17 18 16 390 12 24 Average 13 13 11 20 20 16 13 29
Notes:(a) For Eros International and Sun TV Network, EBITDA corresponds to EBIT as these companies account for film costs under amortization.
Source: Company data, Kotak Institutional Equities estimates
Financial summary of EROS, March fiscal year-ends, 2008-14E (Rs mn)
2008 2009 2010 2011 2012E 2013E 2014EProfit model (Rs mn)Net sales 4,747 6,265 6,409 7,070 8,741 11,286 12,896 EBIT 551 1,279 1,130 1,561 2,133 2,843 3,133 Other income 6 13 63 91 185 199 242 Interest expense (28) (61) (127) (125) (143) (143) (143) D&A expenses (18) (50) (44) (38) (36) (59) (58) Pretax profits 511 1,181 1,022 1,489 2,139 2,839 3,174 Extraordinaries 149 (160) 101 30 (100) — —Tax incidence (233) (291) (296) (337) (525) (784) (922) Minority interest (16) (14) (5) (10) (80) (151) (152) Reported PAT 411 716 821 1,172 1,434 1,904 2,100 Adjusted PAT 330 836 750 1,149 1,509 1,904 2,100 EPS (Rs/share) 4.5 11.5 10.3 13.6 15.6 19.7 21.7
Balance sheet (Rs mn)Total equity 814 1,580 2,376 6,705 8,138 10,043 12,143 Deferred Tax 88 280 498 677 985 1,402 1,877 Minority interest 22 40 42 51 131 282 434 Total borrowings 1,239 2,118 2,178 1,986 1,986 1,986 1,986 Currrent liabilities 5,887 7,189 4,959 4,225 5,177 6,382 8,082 Total capital 8,050 11,207 10,053 13,645 16,418 20,095 24,521 Cash and equivalents 1,182 361 1,072 1,508 629 1,427 1,855 Loans and advances 3,060 5,148 3,709 4,454 6,480 7,470 9,473 Other current assets 2,329 3,423 2,469 2,332 2,979 3,513 4,020 Total fixed assets 1,419 2,195 2,723 3,797 4,775 6,131 7,620 Investments 60 80 80 1,555 1,555 1,555 1,555 Total assets 8,050 11,207 10,052 13,645 16,418 20,095 24,521
Free cash flow (Rs mn)Operating cash flow, excl. WC 2,619 3,027 3,087 3,932 4,928 6,440 7,328 Working capital 579 (1,844) 210 (1,402) (1,721) (319) (810) Capital expenditure (2,736) (2,702) (2,554) (3,059) (4,127) (5,330) (6,139) Free cash flow 463 (1,519) 743 (530) (920) 791 379 Adjusted FCF (117) 326 533 872 801 1,110 1,189
Source: Company data, Kotak Institutional Equities estimates

For private Circulation Only. FOR IMPORTANT INFORMATION ABOUT KOTAK SECURITIES’ RATING SYSTEM AND OTHER DISCLOSURES, REFER TO THE END OF THIS MATERIAL.
3QFY12 results highlights
MTNL’s P&L deterioration continues – the company reported a 1% qoq and 7.6% yoy decline in revenues to Rs8.5 bn. Increase in absolute cost base led to an expansion in EBITDA loss qoq. EBITDA loss for the quarter stood at Rs3.6 bn (versus Rs3.2 bn EBITDA loss in both 2QFY12 as well as 3QFY11). Net loss was Rs9.4 bn, marking the 9th consecutive quarter of negative PAT for the company. More importantly, continued negative OCF/FCF and increasing interest payments are driving a sustained increase in net debt for the company and also accelerated erosion of net worth.
Rating and target price remain suspended
Saddled with deteriorating operational performance (declining revenue base, little control on employee expenses, negative EBITDA), MTNL’s net debt continues to increase. Ability to raise further debt to sustain its OCF-negative operations, given the sustained P&L deterioration, is a big question mark. It is difficult to value the stock unless there is a dramatic turnaround in the operational performance, which does not seem likely.
Asset-based valuation approach could yield some equity value; however, there are practical considerations (primarily the company’s massive unionized employee base – MTNL’s employee base is nearly 3X Bharti’s in India) that could impede an asset sale. Essentially, our rating/TP suspension reflects our view that a turnaround in company’s financial position appears implausible. We also note that NPV hit from just two potential negative regulatory developments, i.e. excess spectrum charge and spectrum renewal charge, sums up to Rs59/share for MTNL.
Return of spectrum (BWA and 3G) to the Government, as reported in the press, could ease balance sheet constraints for a while. However, (1) we are not sure if the fiscal situation allows for a quick ‘quasi bailout’ for MTNL and (2) P&L would still remain stretched; competitive positioning, in the absence of 3G, would actually worsen and P&L situation could deteriorate further. Even as return of spectrum and associated cash inflow, if it happens, will likely excite the market, we would advise keeping the excitement in check.
MTNL (MTNL)
Telecom
Operational strife continues. MTNL’s EBITDA loss expanded qoq to Rs3.6 bn as revenues declined sequentially and cost base expanded. We note that this is MTNL’s 9th consecutive quarter in the red at the operational level. Net debt continues to rise and incremental interest hit is driving higher net losses and faster net worth erosion. Our rating and target price for the stock remain suspended. It is difficult to value the stock unless there is a dramatic turnaround in operational performance, which does not seem likely without massive equity infusion.
MTNLStock data
52-week range (Rs) (high,low)Market Cap. (Rs bn) 18.5
Shareholding pattern (%)Promoters 56.3FIIs 11.2MFs 0.1
Price performance (%) 1M 3M 12MAbsolute 8.5 (3.3) (29.1)Rel. to BSE-30 (1.2) (5.4) (30.3)
Company data and valuation summary
55-22
RS
FEBRUARY 10, 2012
RESULT
Coverage view: Cautious
Price (Rs): 29
Target price (Rs): -
BSE-30: 17,749

MTNL Telecom
KOTAK INSTITUTIONAL EQUITIES RESEARCH 57
MTNL, interim results for 3QFY12, March fiscal year-ends (Rs mn)
3QFY11 2QFY12 3QFY12 qoq yoyRevenues 9,225 8,606 8,521 (1.0) (7.6) Interconnection charges (1,186) (1,290) (1,056) (18.1) (11.0) License fee (908) (722) (716) (0.9) (21.2) Staff cost (8,129) (8,012) (8,233) 2.8 1.3 Admin/operative (2,241) (1,769) (2,102) 18.8 (6.2) Total operating expenditure (12,464) (11,793) (12,107) 2.7 (2.9) EBITDA (3,239) (3,187) (3,586) 12.5 10.7 EBITDA margin -35.1% -37.0% -42.1%Interest and other income 1,455 484 423 Interest expense (1,360) (2,350) (2,594) Depreciation (3,606) (3,587) (3,682) 2.6 2.1 PBT (6,750) (8,639) (9,439) 9.3 39.8 Provision for taxes - (0) (0) Extraordinaries/prior period 40 - - Reported net profit (6,710) (8,640) (9,439) 9.3 40.7 Adjusted net profit (6,750) (8,640) (9,439) 9.3 39.8
Effective Tax rate (%) - 0.0
Change (%)
Source: Company

For private Circulation Only. FOR IMPORTANT INFORMATION ABOUT KOTAK SECURITIES’ RATING SYSTEM AND OTHER DISCLOSURES, REFER TO THE END OF THIS MATERIAL.
In-line results
PVKP reports revenues of Rs1.9 bn (+12% yoy, -2% qoq, 4% below expectation), EBITDA of Rs0.4 bn (+21% yoy, -6% qoq, 9% below expectation) and PAT of Rs0.3 bn (+12% yoy, +21% qoq and 2% below expectation). EBITDA margin at 22.6% (versus our expectation of 23.7%) was 100 bps below 2QFY12 margin and 167 bps above 3QFY11 margin. Effective tax rate came in at 31.4% (31% in 2QFY12) and is now expected to stay in this range due to absence of 80-IB projects.
Sales decline due to high interest rates and absence of new launches
Puravankara (along with Provident) sold 0.5 mn sq. ft in 3QFY12 versus 0.6 mn sq. ft in 2QFY12 and 0.7 mn sq. ft in 3QFY11 as sales continue to suffer due to high interest rates and lack of new launches in the quarter. The key contributors in the quarter are – (1) Welworth City Phase 2 (0.11 mn sq. ft), (2) Windermeyer Phase 1 (0.05 mn sq. ft) and (3) Cosmos City Phase 2 (0.04 mn sq. ft). In January, the company launched Provident Harmony comprising 240 apartments of which 125 has been sold and the company’s quarterly presentation indicates that it expects to get approvals to launch 0.6 mn sq. ft under Puravankara and one phase of a project under the Provident brand (total area of 5.88 mn sq. ft) in 4QFY12E.
Sales realizations in Puravankara at Rs3,835/sq. ft improved 3% qoq and 18% yoy and overall realizations at Rs3,572/sq. ft improved by 3% qoq and 37% yoy. At end-3QFY12, PVKP had 20 mn sq. ft of launched area under execution comprising 15 residential projects (14.9 mn sq. ft), two affordable housing projects (4.5 mn sq. ft) and three commercial projects (0.5 mn sq. ft).
The company did not launch any projects in the quarter and it is expecting to get approvals to launch 6 mn sq. ft under Puravankara and 11 mn sq. ft under Provident in the coming financial year though the launches will likely be in phases. The company has delivered Ph 1 of Purva Highlands to its customers (1.3 mn sq. ft) and is targeting to deliver 5 mn sq. ft over the next 12 months.
After rising for 7 consecutive quarters, net-D/E declined to 0.69X from 0.7x at end-QFY12 while cash and cash equivalents declined by Rs0.5 bn to Rs0.5 bn.
Puravankara Projects (PVKP)
Property
In-line results, poor sales. Puravankara declared revenues of Rs1.9 bn (+12% yoy, -2% qoq) and earnings of Rs0.3 bn (+12% yoy, +21% qoq) while sales declined to 0.5 mn sq. ft versus 0.7 mn sq. ft in 3QFY11. Net-D/E has finally declined marginally to 0.69X after rising steadily for seven consecutive quarters from 0.5X to 0.7X over 3QFY10-2QFY12. We maintain our REDUCE rating and target price of Rs80/share and cut net-income estimates by 18%/13%/14% respectively while accounting for higher value of land bank and new project additions.
Puravankara ProjectsStock data Forecasts/Valuations 2012 2013E 2014E
52-week range (Rs) (high,low) EPS (Rs) 7.4 9.5 16.3Market Cap. (Rs bn) 16.1 EPS growth (%) 33.2 29.4 71.0
Shareholding pattern (%) P/E (X) 10.3 7.9 4.6Promoters 90.0 Sales (Rs bn) 8.2 10.2 19.4FIIs 6.9 Net profits (Rs bn) 1.6 2.0 3.5MFs 0.7 EBITDA (Rs bn) 2.0 2.7 5.5
Price performance (%) 1M 3M 12M EV/EBITDA (X) 13.3 11.0 4.6Absolute 26.8 (1.2) (27.1) ROE (%) 9.9 11.8 17.9Rel. to BSE-30 15.5 (3.4) (28.3) Div. Yield (%) 2.0 2.6 3.3
Company data and valuation summary
119-54
REDUCE
FEBRUARY 13, 2012
RESULT
Coverage view: Cautious
Price (Rs): 76
Target price (Rs): 80
BSE-30: 17,749
QUICK NUMBERS
• Revenue of Rs1.9 bn in 3QFY12 (+12% yoy, -2% qoq)
• EBITDA of Rs0.4 mn (+21% yoy, -6%qoq)
• 0.5 mn sq. ft residential area sold in 3QFY12 versus 0.6 mn sq. ft in 2QFY12

Puravankara Projects Property
KOTAK INSTITUTIONAL EQUITIES RESEARCH 59
In-line quarter Interim results, Puravankara, March fiscal year-ends (Rs mn)
(in Rs mn) 3QFY12 3QFY12E 2QFY12 3QFY11 3QFY12E yoy qoq 9HFY12 9HFY11 (% chg)Net sales 1,941 2,018 1,980 1,735 (4) 12 (2) 5,825 4,440 31
Operating costs (1,503) (1,539) (1,513) (1,372) (2) 10 (1) (4,466) (3,300) 35Cost of revenues (1,293) (1,304) (1,232) 5 (1) (3,833) (2,899) 32G&A (87) (74) (68) 29 18 (245) (211) 16Selling expense (122) (135) (73) 69 (9) (388) (190) 104EBITDA 438 479 467 362 (9) 21 (6) 1,359 1,140 19One-off items/pror period 21 21 - Net finance income / (charges) (12) (20) (20) 40 (41) (40) (52) 52 Share of profit in associates, net 19 15 (20) 3 25 596 5 29 (82)PBT 466 474 426 405 (2) 15 9 1,334 1,220 9Provision for taxes (146) (147) (161) (118) (0) 24 (9) (437) (210) 108PAT 320 327 265 287 (2) 12 21 897 1,010 (11)
Key ratios
EBITDA margin (%) 22.6 23.7 23.6 20.9 23.3 25.7 PAT margin (%) 16.5 16.2 13.4 16.5 15.4 22.8 Effective tax rate (%) 31.4 31.0 37.8 29.2 32.8 17.2
(% chg)
Source: Company, Kotak Institutional Equities estimates
Sales of 0.5 mn sq. ft in 3QFY12 versus 0.7 mn sq ft in residential segment in 3QFY11 and 0.6 mn sq. ft in 2QFY12 Area sold, units sold, sales value and average realization in residential segment, Puravankara, March fiscal year-ends
3QFY12 3QFY11 Change 3QFY12 3QFY11 Change 3QFY12 3QFY11 Change 3QFY12 3QFY11 Change
(Based on bookings) (mn sq. ft) (mn sq. ft) (%) (nos.) (nos.) (%) (Rs mn) (Rs mn) (%) (Rs / sq ft) (Rs / sq ft) (%)
Puravankara 0.32 0.30 5% 191 186 3% 1,220 988 23% 3,835 3,250 18%
Associates 0.02 0.06 -63% 12 35 -65% 90 173 -48% 4,262 3,026 41%
Provident 0.11 0.37 -71% 121 363 -67% 292 751 -61% 2,671 2,018 32%
Total 0.45 0.73 -39% 324 584 -44% 1,602 1,912 -16% 3,572 2,608 37%
2QFY12 2QFY11 Change 2QFY12 2QFY11 Change 2QFY12 2QFY11 Change 2QFY12 2QFY11 Change
(Based on bookings) (mn sq. ft) (mn sq. ft) (%) (nos.) (nos.) (%) (Rs mn) (Rs mn) (%) (Rs / sq ft) (Rs / sq ft) (%)
Puravankara 0.43 0.59 -27% 255 362 -30% 1,616 1,849 -13% 3,736 3,127 19%
Associates 0.02 0.06 -63% 12 35 -65% 90 173 -48% 4,262 3,026 41%
Provident 0.12 0.35 -66% 129 346 -63% 287 712 -60% 2,360 2,009 17%
Total 0.57 1.00 -43% 396 743 -47% 1,994 2,734 -27% 3,464 2,726 27%
Area sold Units sold Sale value Sale realization
Area sold Units sold Sale value Sale realization
Source: Company, Kotak Institutional Equities

Property Puravankara Projects
60 KOTAK INSTITUTIONAL EQUITIES RESEARCH
Puravankara has 20 mn sq. ft of ongoing projects Ongoing projects, Puravankara, March fiscal year-end, 3QFY12
Developable Area
JD/JV share for developer Launched Area sold Inventory
Name of the project Location (mn sq. ft) (%) (mn sq. ft) (mn sq. ft) (%)Puravankara ResidentialJoint developmentAtria Sanjay Nagar, Bengaluru 0.24 131 62 0.15 0.12 19
Platina Sanjay Nagar, Bengaluru 0.14 70 62 0.09 0.02 82
Midtown Residences K.R. Puram, Bengaluru 0.45 306 75 0.34 0.20 40
Joint ventureElita Promenade JP Nagar, Bengaluru 2.55 1,573 49 1.25 1.18 5
Elita Garden Vista Rajarhat, Kolkata 2.28 1,278 36 0.44 0.39 12
OwnedPurva Venezia Yelahanka, Bengaluru 2.09 1,332 100 2.09 1.76 16
Purva Highlands Mallasandra, Bengaluru 1.34 849 100 1.34 0.83 38
Purva Highlands II Mallasandra, Bengaluru 1.20 740 100 100
Purva Grand Bay Marine Drive, Kochi 0.50 265 100 0.51 0.33 34
Purva Eternity Kakkanad, Kochi 0.96 600 100 0.96 0.57 40
Purva Swanlake OMR, Chennai 0.83 522 100 0.83 0.40 51
Purva Swan Lake II OMR, Chennai 0.34 207 100 0.34 0.01 97
Moon Reach Airport-Seaport Rd, Kochi 0.39 196 100 0.15 0.14 5
Oceana Marine Drive, Kochi 0.26 96 100 0.26 0.06 76
Purva Skywood Sarjapur Rd, Bangalore 0.65 403 100 0.65 0.59 10
Purva Skywood II Sarjapur Rd, Bangalore 0.59 327 100 0.59 0.35 41
Purva Windermere Medavakkam, Chennai 1.45 756 100 1.45 0.79 45
Purva Windermere II & III Medavakkam, Chennai 2.68 1,932 100 2.68 100
Purva Bluemont Trichy Rd, Coimbatore 0.81 486 100 0.81 0.20 75
Purva Bluemont II Trichy Rd, Coimbatore 1.03 630 100 100
Total Residential 20.83 12,699 14.92 7.96 55 Provident HousingOwnedCosmos City Pudupakkam, Chennai 1.09 1,070 100 1.09 1.08 0.7
Cosmos City II Pudupakkam, Chennai 1.14 1,104 100 1.14 0.71 8
Welworth City Doddaballapur, Bengaluru 1.13 1,120 100 1.13 1.01 12
Welworth City II Doddaballapur, Bengaluru 1.09 1,088 100 1.09 0.41 48
Welworth City III Doddaballapur, Bengaluru 1.28 1,152 100
Total Provident Housing 5.74 5,534 4.45 3.21 44Puravankara CommercialJoint developmentPrimus OMR, Chennai 0.17 60 0.11 100
Gainz Hosur Rd, Bengaluru 0.24 70 0.20 100
OwnedMoneto Guindy, Chennai 0.36 100 0.36 100
Total Commercial 0.77 0.67 100
Total 27.34 18,233 20.04 11.17 44
No. of apartments
Source: Company, Kotak Institutional Equities

Puravankara Projects Property
KOTAK INSTITUTIONAL EQUITIES RESEARCH 61
PVKP has plans to launch 6.6 mn sq. ft under Puravankara and 11.1 mn sq. ft under Provident PVKP’s launch plans and status of approvals
Developable PPL share Saleable area
(mn sq. ft) (%) (mn sq. ft) Status
Projects in Puravankara
Residential 1 Bengaluru 1.08 59 0.64 4QFY12 1QFY15 Plan approved
Residential 5 Bengaluru 2.01 100 2.01 4QFY12 1QFY16 Plan approved
Residential 6 Bengaluru 0.72 100 0.72 4QFY12 1QFY16 Plan approved
Residential 2 Bengaluru 0.28 65 0.19 1QFY13 2QFY14 Development planning in progress
Residential 3 Bengaluru 0.51 100 0.51 1QFY13 1QFY15 Development planning in progress
Residential 4 Bengaluru 0.4 100 0.40 3QFY13 3QFY15 Development planning in progress
Residential 7 Chennai 2.01 100 2.01 1QFY13 4QFY15 Development planning in progress
Residential 8 Chennai 0.08 100 0.08 1QFY13 4QFY15 Development planning in progress
Total in Puravankara 7.09 6.56
Projects in Provident
Residential 11 Bengaluru 5.88 100 5.88 4QFY12 4QFY18 Awaiting approval
Residential 10 Mangalore 0.58 73 0.42 4QFY12 3QFY14 Development planning in progress
Residential 14 Coimbatore 0.59 70 0.41 1QFY13 4QFY14 Awaiting development plan approval
Residential 15 Mysore 0.17 72 0.12 1QFY13 2QFY14 Development planning in progress
Residential 12 Bengaluru 2.98 100 2.98 3QFY13 4QFY15 Development planning in progress
Residential 13 Bengaluru 1.77 70 1.24 3QFY13 3QFY15 Development planning in progress
Total in Provident 11.97 11.06
Expected approval date
Expected completion date
Source: Company, Kotak Institutional Equities
After rising for 7 consecutive quarters, debt has finally declined to Rs12.1 bn versus Rs12.5 bn at end-2QFY12 and cash and cash equivalents declined by Rs0.5 bn to Rs0.5 bn. Net-D/E has also declined to 0.69X versus 0.7X at end-2QFY12 after steadily increasing for 7 consecutive quarters. Properties under development have increased marginally by Rs0.1 bn qoq to Rs16 bn and its properties held for sale remained steady qoq at Rs0.5 bn is the lowest since at least end-June 2008.
Consolidated summary statement of assets and liabilities Quarterly Balance Sheet, Puravankara, March fiscal year-ends (Rs mn)
Particulars Dec-08 Mar-09 Jun-09 Sep-09 Dec-09 Mar-10 Jun-10 Sep-10 Dec-10 Mar-11 Jun-11 Sep-11 Dec-11Net fixed assets 477 463 452 440 430 362 355 367 365 461 494 686 710Investments 998 1,038 1,043 1,071 1,134 1,191 1,199 1,217 1,230 1,189 1,196 1,178 1,197Current assets, loans and advances 10,842 11,051 11,384 12,870 12,442 12,658 12,905 13,790 14,359 18,043 22,574 22,629 22,342
Cash and cash equivalents 698 268 262 276 812 782 556 408 650 999 1,180 1,020 542Inventories 191 197 189 175 229 227 207 241 217 284 303 312 339Trade debtors 1,047 1,146 1,244 2,499 1,268 1,112 1,202 1,360 1,236 1,144 1,375 1,769 1,828Properties under development 5,093 5,700 6,025 6,390 6,485 6,802 7,151 8,044 8,555 11,623 15,726 15,917 16,047Properies held for sale 948 974 946 915 873 852 823 748 731 706 707 541 543Loans and advances 2,865 2,766 2,718 2,614 2,774 2,883 2,967 2,989 2,971 3,287 3,283 3,071 3,043
Properties held for development 13,839 13,924 13,995 13,338 13,393 13,528 13,597 13,182 13,697 11,605 8,220 8,231 8,364Total application of funds 26,157 26,476 26,873 27,718 27,400 27,739 28,057 28,556 29,651 31,298 32,484 32,725 32,613
Total loans 8,269 8,146 8,297 8,326 8,326 8,811 9,168 9,744 10,502 11,587 12,274 12,447 12,080Current liabilities and provisions 4,366 4,659 4,802 5,007 4,384 4,068 3,680 3,249 3,301 3,944 4,140 3,939 3,870Deferred tax liability (net) 21 23 23 25 25 9 9 5 5 3 (4) (3) 2Shareholders funds 13,501 13,649 13,751 14,360 14,665 14,852 15,201 15,557 15,844 15,764 16,075 16,341 16,661Total sources of fund 26,157 26,476 26,873 27,718 27,400 27,739 28,057 28,556 29,651 31,298 32,484 32,725 32,613
Source: Company, Kotak Institutional Equities

Property Puravankara Projects
62 KOTAK INSTITUTIONAL EQUITIES RESEARCH
Changes to our model – maintain REDUCE at a target price of Rs80/share
We make the following changes to our model
We cut revenues and earnings estimates for FY2012E/13E/14E by 5%/9%/8% and 18%/13%/14% respectively as PVKP’s EBITDA margin has declined to 23% for 9MFY12E versus 30-38% in FY2008-10. EBITDA margin in FY2011 was 24% and we are now assuming margins of 25%/27%/28% for FY2012E/13E/14E respectively.
FSI cost of land bank is now Rs100/sq. ft versus Rs87/sq. ft earlier.
Take into account PVKP’s launch plans of 6.6 mn sq. ft over next one year.
Cut net income estimates by 18%/13%/14% for FY2012E/13E/14E Estimate changes, PVKP
2012 2013 2014 2012 2013 2014 2012 2013 2014Revenue (Rs mn) 8,221 10,218 19,421 8,662 11,277 21,124 (5) (9) (8) EBITDA (Rs mn) 2,016 2,723 5,502 2,605 3,248 6,357 (23) (16) (13) Net income (Rs mn) 1,571 2,033 3,477 1,920 2,333 4,023 (18) (13) (14)
New Old % Change
Source: Company, Kotak Institutional Equities estimates
We have a target price of Rs80/ share NAV-based valuation, Puravankara, March fiscal year-ends (Rs bn)
0% 3% 5% 10%Valuation (Rs bn) 15.7 19.5 22.2 29.8
Residential 15.6 19.4 22.1 29.7 Commercial 0.1 0.1 0.1 0.1 Land value 8.8 8.8 8.8 8.8 Less: Net debt (13.8) (13.8) (13.8) (13.8) NAV 10.8 14.6 17.3 24.9 NAV/share 50.5 68.2 81.0 116.6
Total no. of shares 213.4 Target price @ par to NAV 80.0
March '13 based NAV Growth rate in selling prices
Source: Company, Kotak Institutional Equities estimates

Puravankara Projects Property
KOTAK INSTITUTIONAL EQUITIES RESEARCH 63
Profit model of Puravankara March fiscal year-ends, 2009-14E (Rs mn)
2009 2010 2011 2012E 2013E 2014ETotal revenues 4,449 4,783 5,992 8,221 10,218 19,421 Land costs (282) (986) (526) (306) (359) (774) Construction costs (2,315) (1,664) (3,479) (5,069) (6,104) (11,397) Selling expenses (216) (171) (260) (427) (531) (932) G&A expenses (271) (271) (276) (403) (501) (816) EBITDA 1,366 1,691 1,452 2,016 2,723 5,502 Other income 46 44 95 95 95 95 Interest (38) (29) (41) (121) (143) (154) Depreciation (54) (111) (36) (163) (172) (176) Pretax profits 1,319 1,596 1,470 1,827 2,503 5,267 Profit/(loss) share of associates 151 152 (12) 365 381 - Current tax (13) (312) (285) (662) (896) (1,836) Deferred tax (13) 14 5 41 45 46 Net income 1,444 1,451 1,179 1,571 2,033 3,477
EPS (Rs)Primary 6.8 6.8 5.5 7.4 9.5 16.3 Fully diluted 6.8 6.8 5.5 7.4 9.5 16.3
Shares outstanding (mn)Year end 213 213 213 213 213 213 Primary 213 213 213 213 213 213 Fully diluted 213 213 213 213 213 213
Cash flow per share (Rs)Primary 6.5 7.4 5.4 8.1 10.3 9.9 Fully diluted 6.5 7.4 5.4 8.1 10.3 9.9
Growth (%)Net income (adjusted) (40) 0 (19) 33 29 71 EPS (adjusted) (41) 0 (19) 33 29 71 DCF/share (39) 13 (26) 48 28 (4)
Cash tax rate (%) 1 20 19 36 36 35 Effective tax rate (%) 2 19 19 34 34 34
Source: Company, Kotak Institutional Equities estimates

Property Puravankara Projects
64 KOTAK INSTITUTIONAL EQUITIES RESEARCH
Balance sheet of Puravankara March fiscal year-ends, 2009-14E (Rs mn)
2009 2010 2011 2012E 2013E 2014EEquityShare capital 1,067 1,067 1,067 1,067 1,067 1,067 Reserves/surplus 12,582 13,785 14,697 15,894 17,429 20,283 Total equity 13,649 14,852 15,764 16,961 18,496 21,350 Deferred tax liability/(asset) 23 9 3 (38) (83) (128) LiabilitiesSecured loans 8,106 8,726 11,209 12,022 14,022 14,022 Unsecured loans 40 85 379 11 11 11 Total borrowings 8,146 8,811 11,587 12,033 14,033 14,033 Currrent liabilities 4,659 4,068 3,944 5,719 6,127 9,286 Total capital 26,476 27,739 31,298 34,676 38,574 44,542 AssetsCash 268 782 999 1,290 261 4,684 Current assets 24,707 25,404 28,649 31,517 36,559 38,220 Gross block 632 642 744 1,527 1,537 1,764 Less: accumulated depreciation 169 280 317 479 652 828 Net fixed assets 463 362 427 1,047 885 937 Capital work-in-progress — — 34 (368) (321) (489) Total fixed assets 463 362 461 679 565 448 Intangible assets — — — — — — Investments 1,038 1,191 1,189 1,189 1,189 1,189 Misc. expenses — — — — — — Total assets 26,477 27,739 31,298 34,676 38,574 44,542
Leverage ratios (%)Debt/equity 59.6 59.3 73.5 71.1 76.2 66.1 Debt/capitalization 37.3 37.2 42.4 41.6 43.2 39.8 Net debt/equity 57.6 54.0 67.2 63.5 74.8 44.1 Net debt/capitalization 36.6 35.1 40.2 38.8 42.8 30.6 RoAE 11.2 10.2 7.7 9.6 11.5 17.5 RoACE 6.6 5.7 4.8 4.4 5.5 10.4
Source: Company, Kotak Institutional Equities estimates

For private Circulation Only. FOR IMPORTANT INFORMATION ABOUT KOTAK SECURITIES’ RATING SYSTEM AND OTHER DISCLOSURES, REFER TO THE END OF THIS MATERIAL.
Reported net income hurt by forex loss; EBITDA beat driven by strong standalone performance
JSW reported consolidated performance after reporting standalone performance on Jan 20 and JSW ISPAT numbers on Feb 8. JSW reported consolidated EBITDA of Rs13.2 bn (-5.5% qoq), 27.6% ahead of our estimate with the entire outperformance driven by the standalone unit. However, note that part of the forex losses of Rs5 bn reported as an extraordinary item pertained to coking coal imports which should form part of raw material costs. JSW reported a net loss of Rs479 mn in 3QFY12 owing to (1) forex loss of Rs5 bn, and (2) loss of Rs3.1 bn reported in 3QFY12 by JSW Ispat. JSW consolidated its proportionate share of loss of Rs1.5 bn.
Ispat reports loss of Rs3.1 bn, cost pressures will continue to impact profitability
JSW Ispat reported net loss of Rs3.1 bn resulting from (1) cost pressures due to elevated raw material and power costs which were impacted by sourcing issues and (2) forex losses of Rs1.1 bn pertaining to operating balances/forward exchange contracts and MTM losses on derivative contracts. Gross debt for the company continues to remain at worrying levels resulting in material interest outgo every quarter. We forecast loss of Rs17.7 bn and Rs3 bn for FY2012E and FY2013E.
Leverage hurts—debt unlikely to decline for the next few years
JSW’s overall debt is unlikely to decline over the next few years. Expansion plans, greenfield projects and acquisitions will keep debt at elevated levels. The company highlighted that it has a total of Rs150 bn to be spent as capex over FY2012-14E. Out of the total planned capex, around Rs80 bn would be financed through internal accruals and the balance through debt. We expect net debt/ EBITDA of 3.4X and 3.3X for FY2013E and FY2014E respectively (refer Exhibit 2).
Downgrade to SELL on recent rally in prices and cost pressures, TP of Rs680 (Rs610 earlier)
JSW stock has rallied 29.6% over the last month on increase in steel prices and potential restart of iron ore mining in Karnataka. Some of the headwinds are likely to clear out on iron ore availability in the next few weeks. However, the stock trades at an expensive 6.4X FY2013E EBTIDA. We downgrade the stock to SELL from REDUCE with a revised TP of Rs680.
JSW Steel (JSTL)
Metals & Mining
Reports consolidated loss; stock expensive. JSW reported consolidated net loss of Rs479 mn on (1) forex loss of Rs5 bn and (2) consolidation of share of quarterly loss of Ispat of Rs1.5 bn. JSW Ispat’s 3QFY12 performance was weak and continues to be plagued by elevated raw material costs and sourcing issues. Stock captures near-term upsides of potential restart of iron ore mining in Karnataka. Domestic overcapacity, leveraged balance sheet and expensive valuations underpin our negative stance on the company. Downgrade to SELL with a revised TP of Rs680 (Rs610 earlier).
JSW SteelStock data Forecasts/Valuations 2012 2013E 2014E
52-week range (Rs) (high,low) EPS (Rs) 32.4 77.8 94.9Market Cap. (Rs bn) 184.6 EPS growth (%) (58.7) 139.8 22.1
Shareholding pattern (%) P/E (X) 25.2 10.5 8.6Promoters 37.7 Sales (Rs bn) 340.8 398.5 416.8FIIs 22.9 Net profits (Rs bn) 23.7 17.6 21.5MFs 0.2 EBITDA (Rs bn) 60.4 62.2 67.8
Price performance (%) 1M 3M 12M EV/EBITDA (X) 6.0 6.4 6.1Absolute 29.6 21.7 (2.0) ROE (%) 14.1 9.9 11.1Rel. to BSE-30 18.1 19.0 (3.6) Div. Yield (%) 1.2 1.2 1.2
Company data and valuation summary
1,015-462
SELL
FEBRUARY 13, 2012
RESULT, CHANGE IN RECO.
Coverage view: Cautious
Price (Rs): 817
Target price (Rs): 680
BSE-30: 17,749
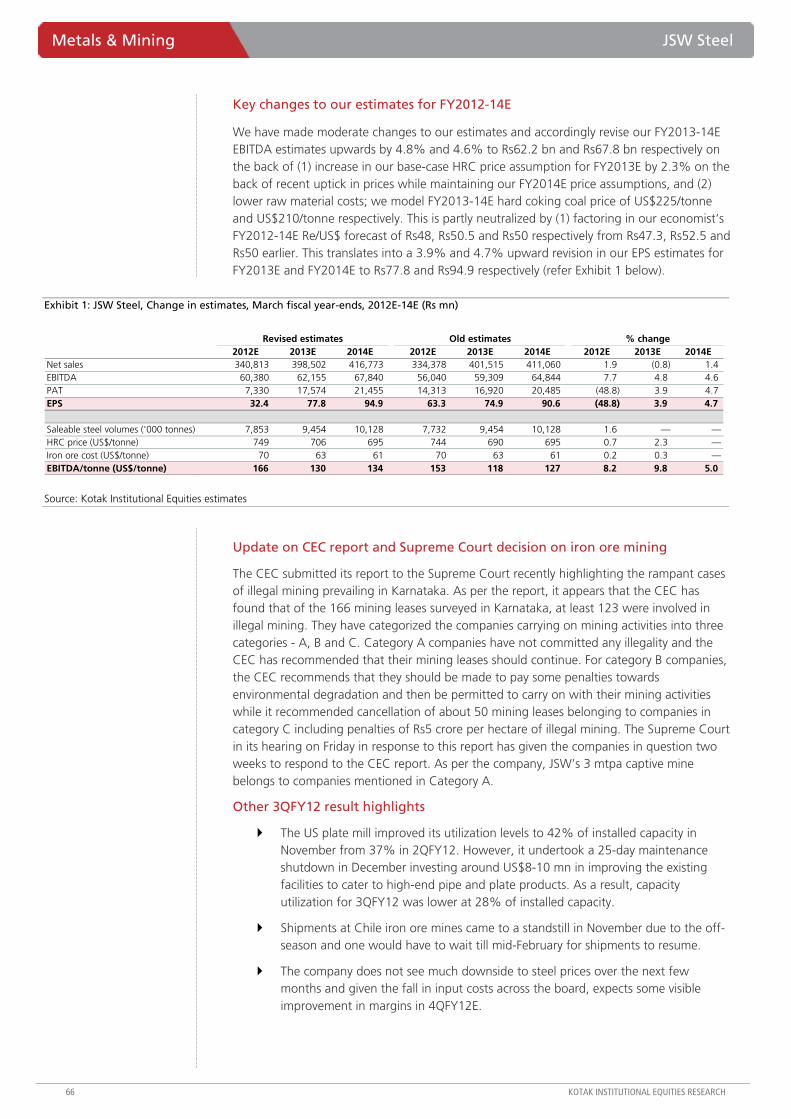
Metals & Mining JSW Steel
66 KOTAK INSTITUTIONAL EQUITIES RESEARCH
Key changes to our estimates for FY2012-14E
We have made moderate changes to our estimates and accordingly revise our FY2013-14E EBITDA estimates upwards by 4.8% and 4.6% to Rs62.2 bn and Rs67.8 bn respectively on the back of (1) increase in our base-case HRC price assumption for FY2013E by 2.3% on the back of recent uptick in prices while maintaining our FY2014E price assumptions, and (2) lower raw material costs; we model FY2013-14E hard coking coal price of US$225/tonne and US$210/tonne respectively. This is partly neutralized by (1) factoring in our economist’s FY2012-14E Re/US$ forecast of Rs48, Rs50.5 and Rs50 respectively from Rs47.3, Rs52.5 and Rs50 earlier. This translates into a 3.9% and 4.7% upward revision in our EPS estimates for FY2013E and FY2014E to Rs77.8 and Rs94.9 respectively (refer Exhibit 1 below).
Exhibit 1: JSW Steel, Change in estimates, March fiscal year-ends, 2012E-14E (Rs mn)
Revised estimates Old estimates % change2012E 2013E 2014E 2012E 2013E 2014E 2012E 2013E 2014E
Net sales 340,813 398,502 416,773 334,378 401,515 411,060 1.9 (0.8) 1.4 EBITDA 60,380 62,155 67,840 56,040 59,309 64,844 7.7 4.8 4.6 PAT 7,330 17,574 21,455 14,313 16,920 20,485 (48.8) 3.9 4.7 EPS 32.4 77.8 94.9 63.3 74.9 90.6 (48.8) 3.9 4.7
Saleable steel volumes ('000 tonnes) 7,853 9,454 10,128 7,732 9,454 10,128 1.6 — —HRC price (US$/tonne) 749 706 695 744 690 695 0.7 2.3 —Iron ore cost (US$/tonne) 70 63 61 70 63 61 0.2 0.3 —EBITDA/tonne (US$/tonne) 166 130 134 153 118 127 8.2 9.8 5.0
Source: Kotak Institutional Equities estimates
Update on CEC report and Supreme Court decision on iron ore mining
The CEC submitted its report to the Supreme Court recently highlighting the rampant cases of illegal mining prevailing in Karnataka. As per the report, it appears that the CEC has found that of the 166 mining leases surveyed in Karnataka, at least 123 were involved in illegal mining. They have categorized the companies carrying on mining activities into three categories - A, B and C. Category A companies have not committed any illegality and the CEC has recommended that their mining leases should continue. For category B companies, the CEC recommends that they should be made to pay some penalties towards environmental degradation and then be permitted to carry on with their mining activities while it recommended cancellation of about 50 mining leases belonging to companies in category C including penalties of Rs5 crore per hectare of illegal mining. The Supreme Court in its hearing on Friday in response to this report has given the companies in question two weeks to respond to the CEC report. As per the company, JSW’s 3 mtpa captive mine belongs to companies mentioned in Category A.
Other 3QFY12 result highlights
The US plate mill improved its utilization levels to 42% of installed capacity in November from 37% in 2QFY12. However, it undertook a 25-day maintenance shutdown in December investing around US$8-10 mn in improving the existing facilities to cater to high-end pipe and plate products. As a result, capacity utilization for 3QFY12 was lower at 28% of installed capacity.
Shipments at Chile iron ore mines came to a standstill in November due to the off-season and one would have to wait till mid-February for shipments to resume.
The company does not see much downside to steel prices over the next few months and given the fall in input costs across the board, expects some visible improvement in margins in 4QFY12E.

JSW Steel Metals & Mining
KOTAK INSTITUTIONAL EQUITIES RESEARCH 67
Exhibit 2: JSW Steel consolidated leverage details, March fiscal year-ends, FY2012-14E (X)
2012E 2013E 2014EEBITDA (Rs mn) 60,380 62,155 67,840 Shareholders funds 169,653 184,256 202,741 Net debt 173,073 212,659 222,533 Net debt/ EBITDA (X) 2.9 3.4 3.3 Net debt/ Equity (X) 1.0 1.2 1.1
Source: Kotak Institutional Equities estimates
Exhibit 3: Interim results of JSW Steel (consolidated), March fiscal year-ends (Rs mn)
(% chg.)3QFY12 3QFY12E 3QFY11 2QFY12 3QFY12E 3QFY11 2QFY12
Net sales 84,047 81,822 59,648 81,339 2.7 40.9 3.3 Operating other income 195 — 378 103 — (48.5) 88.5 Total expenditure (71,067) — (49,862) (67,505) — 42.5 5.3 Inc/(Dec) in stock 978 — (1,348) 1,868 — (172.6) (47.6) Raw materials (56,394) — (37,306) (54,166) — 51.2 4.1 Power & Fuel (4,542) — (3,070) (4,506) — 47.9 0.8 Staff cost (2,079) — (1,524) (1,992) — 36.4 4.4 Other expenditure (9,031) — (6,613) (8,709) — 36.6 3.7 EBITDA 13,174 10,321 10,164 13,938 27.6 29.6 (5.5) Other income 8 327 38 363 (97.7) (80.1) —Interest (3,557) (3,180) (1,968) (3,076) 11.9 80.7 15.6 Depreciation (4,970) (4,955) (3,906) (4,554) 0.3 27.2 9.1 Pretax profits 4,655 2,513 4,328 6,671 85.2 7.5 (30.2) Extraordinaries (5,040) (2,100) — (11,757) — — —Tax 1,306 (300) (1,501) (629) (534.8) (187.0) (307.7) Net income 920 113 2,827 (5,715) 713.3 (67.4) (116.1) Minority interest 72 (127) 60 (48) — 19.2 (249.4) Share of profit from associates (1,471) (450) 29 (930) — NM NMPAT after minority interest (479) (464) 2,917 (6,693) 3.3 (116.4) (92.8) RatiosETR (%) NM 72.6 34.7 (12.4) EPS (Rs) (2.1) (2.1) 13.1 (30.0)
Source: Company, Kotak Institutional Equities estimates
Exhibit 4: JSW Steel, Key assumptions, March fiscal year-ends, 2009-14E (Rs mn)
2009 2010 2011 2012E 2013E 2014ECrude steel capacity ('000 tonnes) 4,800 7,800 7,800 11,000 11,000 11,000 Saleable steel volumes ('000 tonnes) 3,421 5,705 6,099 7,853 9,454 10,128 HRC price (US$/tonne) 831 647 744 749 706 695 Average realizations, net (US$/ tonne) 892 695 833 856 783 772 EBITDA (US$/tonne) 181 163 165 166 130 134 Re/US$ rate 45.8 45.9 45.6 48.0 50.5 50.0
Source: Company, Kotak Institutional Equities estimates

Metals & Mining JSW Steel
68 KOTAK INSTITUTIONAL EQUITIES RESEARCH
Exhibit 5: JSW Steel (standalone), Profit model, balance sheet and cash flow model, March fiscal year-ends, 2009-14E (Rs mn)
2009 2010 2011 2012E 2013E 2014EProfit model (Rs mn)Net sales 139,744 182,025 231,632 322,623 373,893 390,999
EBITDA 28,331 42,729 45,735 57,285 57,481 63,035 Other income 2,596 5,328 2,826 787 824 943 Interest (7,973) (8,627) (6,952) (9,869) (11,721) (13,390) Depreciaiton (8,277) (11,234) (13,787) (16,920) (19,656) (21,620)
Profit before tax 6,776 28,197 27,823 21,433 26,929 28,967 Current tax 40 (2,277) (3,839) (3,529) (7,148) (7,946) Deferred tax (2,231) (5,692) (3,877) (1,163) (930) (744)
Net profit 4,585 20,228 20,107 16,741 18,850 20,277 Earnings per share (Rs) 50.0 101.8 90.1 74.1 83.4 89.7 Balance sheet (Rs mn)Equity 79,593 97,063 172,253 185,576 201,456 218,762 Deferred tax liability 14,212 19,650 23,170 24,333 25,264 26,008 Total Borrowings 112,726 115,851 119,513 173,211 208,173 222,699 Current liabilities 75,572 76,219 100,647 94,300 76,956 63,948
Total liabilities 282,103 308,783 415,584 477,421 511,848 531,416 Net fixed assets 223,285 235,504 272,712 299,342 323,927 342,266 Investments 12,501 17,684 40,988 41,609 41,609 41,609 Cash 4,200 2,871 18,869 33,983 32,418 29,843 Other current assets 42,117 52,724 83,015 102,487 113,893 117,699 Miscellaneous expenditure — — — — — —
Total assets 282,103 308,783 415,584 477,421 511,848 531,416 Free cash flow (Rs mn)Operating cash flow excl. working 19,856 40,331 41,230 45,796 52,948 57,782 Working capital changes 20,706 (7,353) (20,800) (25,289) (28,751) (16,814) Capital expenditure (55,537) (26,702) (49,089) (43,550) (44,242) (39,959)
Free cash flow (14,976) 6,276 (28,660) (23,043) (20,044) 1,009 RatiosDebt/equity (X) 1.4 1.2 0.7 0.9 1.0 1.0 Net debt/equity (X) 1.4 1.1 0.6 0.7 0.9 0.9 RoAE (%) 9.7 12.7 11.2 14.0 10.0 9.5
RoACE (%) 9.4 12.4 9.9 11.0 7.8 7.8
Source: Company, Kotak Institutional Equities estimates

JSW Steel Metals & Mining
KOTAK INSTITUTIONAL EQUITIES RESEARCH 69
Exhibit 6: JSW Steel (consolidated), Profit model, balance sheet and cash flow model, March fiscal year-ends, 2009-14E (Rs mn)
2010 2011 2012E 2013E 2014EProfit model (Rs mn)Net sales 190,738 239,002 340,813 398,502 416,773
EBITDA 41,873 46,627 60,380 62,155 67,840 Other income 4,194 2,840 800 838 956 Interest (11,080) (9,454) (12,032) (13,967) (15,606) Depreciaiton (12,987) (15,597) (18,811) (21,691) (23,648)
Profit before tax 22,000 24,417 30,336 27,335 29,542 Extra-ordinary items — — (16,349) — —Current tax (2,286) (3,855) (2,969) (6,762) (7,625) Deferred tax (4,182) (3,968) (433) (930) (744)
Net profit 15,533 16,594 10,584 19,643 21,173 Minority interest 332 239 (99) (440) (418) Share of earnings from associates 111 707 (3,155) (1,629) 701
PAT 15,976 17,540 7,330 17,574 21,455 Adjusted PAT 15,976 17,540 20,208 17,574 21,455 Earnings per share (Rs) 80.4 78.6 32.4 77.8 94.9 Balance sheet (Rs mn)Equity 92,572 165,293 169,653 184,256 202,741 Deferred tax liability 16,848 20,494 20,927 21,857 22,602 Total Borrowings 161,730 164,744 220,126 248,095 253,038 Current liabilities 80,727 106,014 125,380 107,933 91,337 Minority interest 2,187 2,358 2,458 2,897 3,316
Total liabilities 354,063 458,903 538,543 565,038 573,034 Net fixed assets 284,090 323,183 348,129 370,945 387,537 Goodwill on consolidation 8,992 10,932 10,932 10,932 10,932 Investments 6,282 29,138 25,983 24,354 25,055 Cash 3,030 20,480 47,053 35,436 30,505 Other current assets 51,669 75,169 106,446 123,372 119,005
Total assets 354,063 458,903 538,543 565,038 573,034 Free cash flow (Rs mn)Operating cash flow excl. working capital 38,323 41,439 29,829 42,264 45,565 Working capital changes (4,710) (13,137) (11,910) (34,374) (12,228) Capital expenditure (27,245) (52,994) (43,757) (44,507) (40,241)
Free cash flow 6,368 (24,691) (25,839) (36,616) (6,904) RatiosDebt/equity (X) 1.7 1.0 1.3 1.3 1.2 Net debt/equity (X) 1.7 0.9 1.0 1.2 1.1 RoAE (%) 18.7 13.6 4.4 9.9 11.1
RoACE (%) 10.9 9.5 9.8 8.2 8.3
Source: Company, Kotak Institutional Equities estimates

For private Circulation Only. FOR IMPORTANT INFORMATION ABOUT KOTAK SECURITIES’ RATING SYSTEM AND OTHER DISCLOSURES, REFER TO THE END OF THIS MATERIAL.
3QFY12 a rainy quarter as the Sun hid behind a few cyclical, structural clouds
Sun TV 3QFY12 financials are not comparable yoy given an ‘extraordinary’ Rs440 mn EBIT contribution by Endhiran movie in 3QFY11. However, 3QFY12 EBIT of Rs2.29 bn was down 19% yoy on (1) weak advertising revenue, (2) fall in cable subscription revenue in TN (Arasu) and (3) high film telecast costs. We adjust for the impact of Endhiran in line items in this note.
The negative variance in 3QFY12 was driven mainly by weak advertising revenue of Rs2.85 bn (-6% yoy). Sun TV highlighted generally challenging economic conditions and a weakening advertising trend in sectors such as telecom (Exhibit 2; data not complete given multiple unlisted firms in South India) and cyclicals.
Downgrade to ADD (BUY previously) with FY2013E FV of Rs390 (Rs400 previously)
We downgrade the Sun TV stock to ADD (from BUY) noting limited 14% upside from CMP after absolute returns of a sharp 47% and 36% outperformance versus the BSE-30 Index. We reduce our FY2012-13 EPS estimates to Rs18.5 (from Rs20) and Rs21.4 (Rs23.8) respectively due to (1) lower advertising revenue and (2) assuming zero contribution from Tamil cable subscription revenue (lack of clarity on Arasu). Our FY2103E FV is reduced to Rs390 (from Rs400) and stress-case valuation is Rs340 (from Rs350). We recognize potential impact from political risks through higher WACC in our DCF model; we use some of the savings left for a rainy day (reduced WACC of 13.5%; 50 bps higher than our coverage).
Our ADD rating is led by (1) robust franchise in South India (early 4QFY12 market share trends show promise), (2) our expectation of FMCG-led advertising uptick in FY2013E and (3) the Street’s under-appreciation of potential benefits of digitization for broadcasters such as Zee/Sun. Sun TV is valued at a fair 16X FY2013E EPS in the base case, but full 20X in the stress case. The stock has ~3.3% yield in FY2012E, with Rs2.5/share interim dividend in 3QFY12.
Sun TV Network (SUNTV)
Media
A rainy quarter; Sun hides behind the clouds. Sun TV posted weak 3QFY12 EBIT of Rs2.29 bn (-30% yoy), led by (1) weak advertising revenue, (2) lower cable subscription revenue in Tamil Nadu and (3) high film telecast costs (typically volatile in the quarter). The base was high, given a Rs440 mn contribution by ‘Endhiran’ movie in 3QFY11; adjusted EBIT declined 19% yoy. Downgrade to ADD with revised FY2013E FV of Rs390 (from Rs400) given limited 14% upside from CMP. Our ADD rating is due to (1) Sun TV’s robust franchise in South India (but rising competition), (2) potential benefits of digitization and (3) expected advertising recovery in FY2013. We use some savings for a rainy day: reduced WACC of 13.5% (50 bps higher than our media coverage) from 14% partially negates a 10% fall in FY2013 EPS estimate.
Sun TV NetworkStock data Forecasts/Valuations 2012 2013E 2014E
52-week range (Rs) (high,low) EPS (Rs) 18.5 21.4 25.2Market Cap. (Rs bn) 134.3 EPS growth (%) (5.4) 15.9 17.8
Shareholding pattern (%) P/E (X) 18.4 15.9 13.5Promoters 77.0 Sales (Rs bn) 19.2 21.9 25.7FIIs 14.9 Net profits (Rs bn) 7.3 8.4 9.9MFs 1.1 EBITDA (Rs bn) 12.1 13.9 16.1
Price performance (%) 1M 3M 12M EV/EBITDA (X) 10.5 9.0 7.7Absolute 21.9 21.1 (16.3) ROE (%) 30.2 32.2 35.1Rel. to BSE-30 11.1 18.4 (17.6) Div. Yield (%) 3.2 4.1 5.0
Company data and valuation summary
465-214
ADD
FEBRUARY 13, 2012
RESULT, CHANGE IN RECO.
Coverage view: Neutral
Price (Rs): 341
Target price (Rs): 390
BSE-30: 17,749
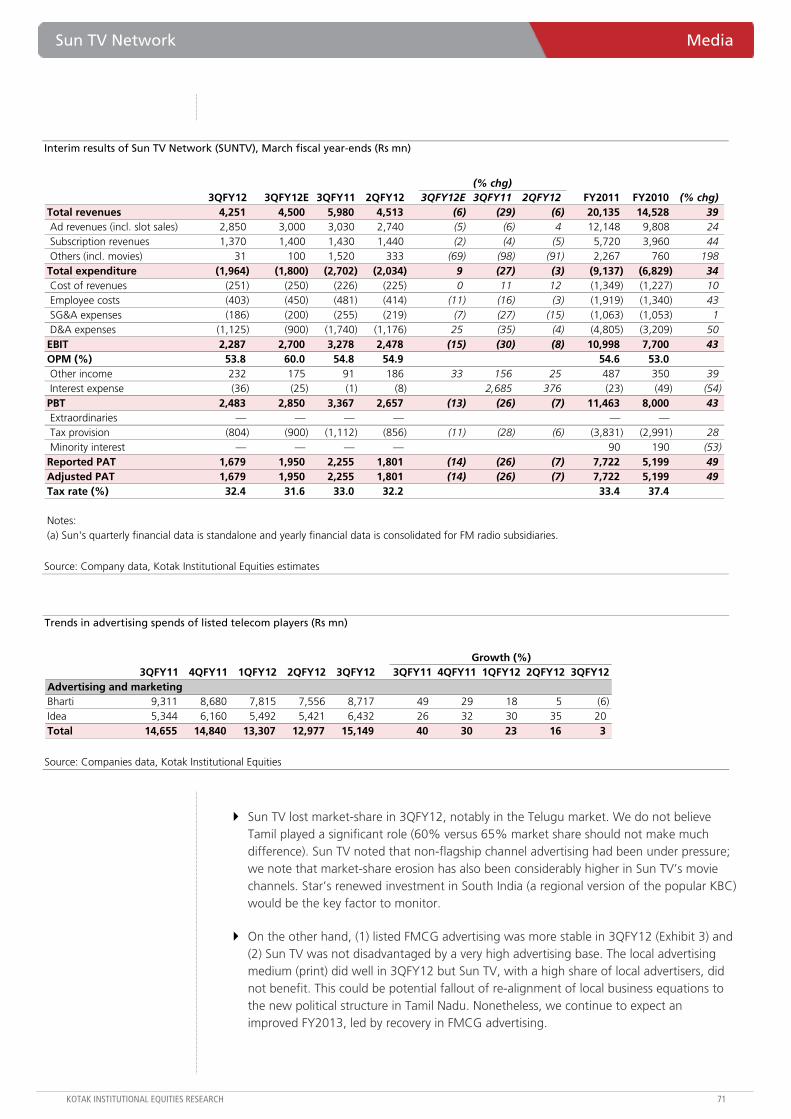
Sun TV Network Media
KOTAK INSTITUTIONAL EQUITIES RESEARCH 71
Interim results of Sun TV Network (SUNTV), March fiscal year-ends (Rs mn)
(% chg)3QFY12 3QFY12E 3QFY11 2QFY12 3QFY12E 3QFY11 2QFY12 FY2011 FY2010 (% chg)
Total revenues 4,251 4,500 5,980 4,513 (6) (29) (6) 20,135 14,528 39 Ad revenues (incl. slot sales) 2,850 3,000 3,030 2,740 (5) (6) 4 12,148 9,808 24 Subscription revenues 1,370 1,400 1,430 1,440 (2) (4) (5) 5,720 3,960 44 Others (incl. movies) 31 100 1,520 333 (69) (98) (91) 2,267 760 198
Total expenditure (1,964) (1,800) (2,702) (2,034) 9 (27) (3) (9,137) (6,829) 34 Cost of revenues (251) (250) (226) (225) 0 11 12 (1,349) (1,227) 10 Employee costs (403) (450) (481) (414) (11) (16) (3) (1,919) (1,340) 43 SG&A expenses (186) (200) (255) (219) (7) (27) (15) (1,063) (1,053) 1 D&A expenses (1,125) (900) (1,740) (1,176) 25 (35) (4) (4,805) (3,209) 50
EBIT 2,287 2,700 3,278 2,478 (15) (30) (8) 10,998 7,700 43 OPM (%) 53.8 60.0 54.8 54.9 54.6 53.0 Other income 232 175 91 186 33 156 25 487 350 39 Interest expense (36) (25) (1) (8) 2,685 376 (23) (49) (54)
PBT 2,483 2,850 3,367 2,657 (13) (26) (7) 11,463 8,000 43 Extraordinaries — — — — — —Tax provision (804) (900) (1,112) (856) (11) (28) (6) (3,831) (2,991) 28 Minority interest — — — — 90 190 (53)
Reported PAT 1,679 1,950 2,255 1,801 (14) (26) (7) 7,722 5,199 49 Adjusted PAT 1,679 1,950 2,255 1,801 (14) (26) (7) 7,722 5,199 49 Tax rate (%) 32.4 31.6 33.0 32.2 33.4 37.4
Notes:(a) Sun's quarterly financial data is standalone and yearly financial data is consolidated for FM radio subsidiaries.
Source: Company data, Kotak Institutional Equities estimates
Trends in advertising spends of listed telecom players (Rs mn)
Growth (%)3QFY11 4QFY11 1QFY12 2QFY12 3QFY12 3QFY11 4QFY11 1QFY12 2QFY12 3QFY12
Advertising and marketingBharti 9,311 8,680 7,815 7,556 8,717 49 29 18 5 (6) Idea 5,344 6,160 5,492 5,421 6,432 26 32 30 35 20 Total 14,655 14,840 13,307 12,977 15,149 40 30 23 16 3
Source: Companies data, Kotak Institutional Equities
Sun TV lost market-share in 3QFY12, notably in the Telugu market. We do not believe Tamil played a significant role (60% versus 65% market share should not make much difference). Sun TV noted that non-flagship channel advertising had been under pressure; we note that market-share erosion has also been considerably higher in Sun TV’s movie channels. Star’s renewed investment in South India (a regional version of the popular KBC) would be the key factor to monitor.
On the other hand, (1) listed FMCG advertising was more stable in 3QFY12 (Exhibit 3) and (2) Sun TV was not disadvantaged by a very high advertising base. The local advertising medium (print) did well in 3QFY12 but Sun TV, with a high share of local advertisers, did not benefit. This could be potential fallout of re-alignment of local business equations to the new political structure in Tamil Nadu. Nonetheless, we continue to expect an improved FY2013, led by recovery in FMCG advertising.

Media Sun TV Network
72 KOTAK INSTITUTIONAL EQUITIES RESEARCH
3QFY12 subscription revenue of Rs1.37 bn (-4% yoy) was weak but largely in line with our estimates, led by a robust 20% growth in DTH and international subscription revenue. Cable subscription revenue of Rs290 mn (-45% yoy) was below our Rs350 mn estimate; Sun TV and Arasu Cable are yet to come to an understanding.
We expect DTH to be the key driver of subscription revenue for Sun TV going forward, led by digitization mandate by the Government. Sun TV noted 2 mn C&S TV HHs in Chennai (Phase-I) and potential benefit of migrant South population in other metro markets (though likely to be moderate, in our view). Sun TV’s new channel launches (HD, action movies and lifestyle) are expected to add incremental revenue.
Other operating revenue in 3QFY12 mainly comprises Sun Pictures’ film distribution revenue, with contribution of Rs1.51 bn in 3QFY11 by Endhiran. Sun TV’s 3QFY12 revenue of Rs4.25 bn declined 5% yoy versus that in 3QFY11 (adjusted).
The operating costs were largely in line with expectations. The lower-than-expected employee costs were due to reduced director’s remuneration (already capped at 10% of adjusted EBIT) due to reduced profitability.
However, 3QFY12 D&A expenses (largely telecast costs of films) of Rs1.13 bn were ahead of our estimate of Rs900 mn. The volatility in this line item derives from new films being telecast during a quarter and Sun’s accounting policy (complete cost write-off on first telecast of film). However, higher D&A expenses point to telecast of high-budget high-profile films that have not supported advertising. Sun TV noted that Endhiran Tamil telecast was yet to take place, pending an improved environment.
3QFY12 other income was higher than our estimates given ~Rs50 mn of forex income. Sun TV repaid short-term loans of Rs1.7 bn disclosed in the prior quarter. The net cash with the company was ~Rs4.5 bn at the end of 3QFY12.
Trends in advertising spends of listed FMCG players (Rs mn)
Growth (%)3QFY11 4QFY11 1QFY12 2QFY12 3QFY12 3QFY11 4QFY11 1QFY12 2QFY12 3QFY12
Advertising and marketingHUL 7,433 6,233 6,330 6,514 6,902 17 (1) (16) 1 (7) Dabur India 1,090 748 929 725 1,276 (4) (15) (17) (23) 17 Glaxo India 898 1,026 1,000 1,196 1,142 5 4 34 11 27 Colgate India 1,206 804 988 1,143 1,075 60 (4) 42 45 (11) Marico India 592 413 727 627 877 10 (21) 24 15 48 Godrej Consumer 592 400 656 564 588 164 42 36 10 (1) Total 11,811 9,624 10,630 10,769 11,860 20 (1) (5) 4 0 Overhead expenditureNestle India 4,277 4,201 4,092 4,650 18 24 20 14 Asian Paints 3,343 3,348 3,277 3,848 4,102 37 20 24 30 23 TGB Limited 1,310 1,287 1,194 1,276 1,433 4 15 - 2 9 Total 8,930 8,836 8,563 9,774 22 21 18 18
Notes:(a) For lack of quarterly data on A&P spends, we have provided ovehead expenditure data including A&P spends.
Source: Companies data, Kotak Institutional Equities

Sun TV Network Media
KOTAK INSTITUTIONAL EQUITIES RESEARCH 73
Trends in Sun's advertising (incl. slot sales) revenue growth, March fiscal year-ends (%)
22
2924
3 4
30
38
52
43
2017 14
51
(6)
(10)
-
10
20
30
40
50
60
1QFY09 3QFY09 1QFY10 3QFY10 1QFY11 3QFY11 1QFY12 3QFY12
Source: Company data, Kotak Institutional Equities
Trends in Sun's subscription (incl. international) revenue growth, March fiscal year-ends (%)
(18)
311
3
71
4435
46
56 57
47
2419
3(4)
(20)
-
20
40
60
80
1QFY09 3QFY09 1QFY10 3QFY10 1QFY11 3QFY11 1QFY12 3QFY12
Source: Company data, Kotak Institutional Equities
Market share of key Tamil GE channels, CY2006-11E (%)
2006 2007 2008 2009 2010 2011Jaya TV 7 6 5 4 4 4 KTV 21 20 18 17 17 15 Kalaignar TV - 4 12 10 9 7 Raj TV 4 3 2 2 2 3 Sun TV 59 56 52 55 57 57 Vijay TV 6 8 6 6 6 7 Others 3 3 5 5 5 7 HH-Index 4,058 3,621 3,201 3,448 3,695 3,586
Source: TAM Media Research, Kotak Institutional Equities
24-hour GRPs of key Tamil GE channels (%)
3QFY11 4QFY11 1QFY12 2QFY12 3QFY12 4QFY12 chg (%)Jaya TV 97 102 111 112 102 97 6 KTV 442 404 417 389 310 339 (30) Kalaignar TV 238 218 171 194 183 191 (23) Sun TV 1,595 1,608 1,504 1,433 1,372 1,457 (14) Vijay TV 162 150 158 209 244 259 50 Vijay TV 76 70 63 74 86 96 14 Total 2,609 2,552 2,424 2,411 2,297 2,439 (12) Share (%) 61 63 62 59 60 60
Source: TAM Media Research, Kotak Institutional Equities

Media Sun TV Network
74 KOTAK INSTITUTIONAL EQUITIES RESEARCH
Market share of key Telugu GE channels, CY2006-11 (%)
2006 2007 2008 2009 2010 2011Eenadu TV 19 18 17 16 16 16 Gemini Movies 22 19 18 16 17 12 Gemini TV 38 36 32 31 35 33 Maa Movies - - - - - 5 Maa Telugu 10 13 16 17 16 17 Siti Telugu 5 3 3 2 - - Zee Telugu 4 7 13 16 15 15 Others 2 2 2 1 1 1 HH-Index 2,454 2,274 2,057 2,057 2,246 2,047
Source: TAM Media Research, Kotak Institutional Equities
24-hour GRPs of key Telugu GE channels (%)
3QFY11 4QFY11 1QFY12 2QFY12 3QFY12 4QFY12 chg (%)Eenadu TV 380 366 357 381 343 360 (10) Gemini Movies 367 329 298 271 204 291 (44) Gemini TV 853 794 758 743 640 807 (25) Maa Movies - 70 124 126 112 129 Maa Telugu 336 301 387 426 401 438 19 Zee Telugu 346 344 326 339 311 346 (10) Total 2,281 2,204 2,250 2,287 2,011 2,371 (12) Share (%) 37 36 34 32 32 34
Source: TAM Media Research, Kotak Institutional Equities
Market share of key Kannada GE channels, CY2006-11 (%)
2006 2007 2008 2009 2010 2011ETV Kannada 29 22 16 15 14 13 Kasturi - 2 8 6 7 6 Suvarna - 3 6 13 17 18 Udaya Movies 19 20 18 19 16 13 Udaya TV 44 46 37 33 34 35 Zee Kannada 3 5 12 12 11 15 Others 5 3 2 2 2 1 HH-Index 3,189 3,041 2,197 2,034 2,042 2,121
Source: TAM Media Research, Kotak Institutional Equities
24-hour GRPs of key Kannada GE channels (%)
3QFY11 4QFY11 1QFY12 2QFY12 3QFY12 4QFY12 chg (%)ETV Kannada 205 209 212 214 199 201 (3) Kasturi 111 100 91 99 87 76 (22) Suvarna 314 266 250 311 327 298 4 Udaya Movies 228 230 215 201 185 167 (19) Udaya TV 534 537 582 609 576 592 8 Zee Kannada 174 222 221 258 273 276 57 Total 1,566 1,564 1,571 1,691 1,648 1,610 5 Share (%) 34 34 37 36 35 37
Source: TAM Media Research, Kotak Institutional Equities
Market share of key Malayalam GE channels, CY2006-11E (%)
2006 2007 2008 2009 2010 2011Amrita TV 4 5 4 4 4 5 Asianet 31 36 37 41 41 43 Asianet Plus 8 10 9 11 10 10 Kairali 7 6 7 6 7 7 Kiran TV 7 7 8 9 9 6 Surya TV 37 31 31 26 25 23 Others 6 5 5 4 4 6 HH-Index 2,561 2,495 2,543 2,585 2,547 2,604
Source: TAM Media Research, Kotak Institutional Equities
24-hour GRPs of key Malayalam GE channels (%)
3QFY11 4QFY11 1QFY12 2QFY12 3QFY12 4QFY12 chg (%)Amrita TV 110 125 112 118 91 77 (18) Asianet 916 872 903 954 831 767 (9) Asianet Plus 233 222 198 201 178 185 (24) Kairali 195 183 146 143 103 80 (47) Kiran TV 193 107 139 144 127 143 (34) M Manorama - - - - 103 170 Surya TV 558 451 500 480 509 558 (9) Total 2,204 1,959 1,998 2,040 1,941 1,981 (12) Share (%) 25 23 25 24 26 28
Source: TAM Media Research, Kotak Institutional Equities

Sun TV Network Media
KOTAK INSTITUTIONAL EQUITIES RESEARCH 75
Breakdown of Sun TV financials, FY2013E (Rs bn)
Tamil C&S Non-Tamil C&S Sun TV totalAdvertising 6.5 6.5 13.0 Subscription 2.3 4.5 6.7 --Cable - 1.3 1.3 --DTH 1.8 2.6 4.4 --Overseas 0.5 0.5 1.0 FM Radio 1.3 1.3 Sun Pictures 0.9 0.9 Revenues 9.7 12.3 21.9 Rev share (%) 44 56 100 Expenditure (3.8) (6.4) (10.1) EBIT 5.9 5.9 11.8 EBIT share (%) 50 50 100 Margin (%) 61 48 54 EPS (Rs/share) 10.7 10.7 21.4 P/E (X; equivalent to Zee) 21 Non-Tamil-C&S valuation 228
Source: Kotak Institutional Equities estimates
Stress-case valuation of Sun TV, FY2013E (Rs/share)
Tamil C&S Non-Tamil C&S Total (Rs bn) CommentsAdvertising 5.2 6.5 11.7 20% impact on base caseSubscription 1.9 4.5 6.4 --Cable - 1.3 1.3 Assume zero from TN market--DTH 1.4 2.6 4.1 20% impact on base case--Overseas 0.5 0.5 1.0 FM Radio 1.3 1.3 Sun Pictures 0.9 0.9 Revenues 8.0 12.3 20.3 Rev share (%) 39 61 100 Expenditure (4.5) (6.4) (10.9) 10% impact on base caseEBIT 3.5 5.9 9.4 EBIT share (%) 37 63 100 Margin (%) 44 48 46 Normalized EBIT marginsEPS (Rs/share) 6.3 10.7 17.0 P/E (X) 17 21 20 20% impact on base caseValuation 108 228 336
Source: Kotak Institutional Equities estimates

Media Sun TV Network
76 KOTAK INSTITUTIONAL EQUITIES RESEARCH
Summary financials and valuations of Zee and Sun TV, March fiscal year-ends
Financials (Rs bn) Valuations (X)2010 2011 2012E 2013E 2010 2011 2012E 2013E
Zee consolidatedRevenues 22.0 29.5 29.4 34.4 EBITDA 6.1 7.6 8.2 10.3 18.7 15.1 14.0 11.1 EPS (Rs/share) 5.9 5.8 6.2 7.7 22.2 22.4 20.9 16.9 Sports businessRevenues 3.2 4.4 2.6 3.2 EBITDA (0.6) (2.1) (1.1) (0.8) R-GECs businessRevenues 1.1 5.3 5.8 6.8 EBITDA 0.3 1.8 1.8 2.3 Hindi-rest businessRevenues 17.8 19.8 21.0 24.3 EBITDA 6.4 7.9 7.5 8.8 Zee core businessRevenues 18.8 25.1 26.8 31.2 EBITDA 6.7 9.7 9.3 11.1 17.1 11.8 12.3 10.3 EPS (Rs/share) 6.4 7.4 7.1 8.2 20.3 17.5 18.4 15.8 Sun TV consolidatedRevenues 14.5 20.1 19.2 21.9 EBIT 7.7 11.0 10.3 11.8 16.6 11.6 12.4 10.8 EPS (Rs/share) 13.2 19.5 18.5 21.4 25.8 17.4 18.4 15.9 Sun TV stress-caseRevenues 14.5 20.1 19.2 20.3 EBIT 7.7 11.0 10.3 9.4 16.6 11.6 12.4 13.6 EPS (Rs/share) 13.2 19.5 18.5 17.0 25.8 17.4 18.4 20.0
Notes:(a) Zee's FY2010 financials include only one quarter (4QFY10) of R-GEC financials.
Source: Company data, Kotak Institutional Equities estimates

Sun TV Network Media
KOTAK INSTITUTIONAL EQUITIES RESEARCH 77
Consolidated financial summary of Sun TV Network, March fiscal year-ends, 2008-14E (Rs mn)
2008 2009 2010 2011 2012E 2013E 2014EProfit model (Rs mn)Net sales 8,699 10,394 14,528 20,135 19,177 21,924 25,724EBIT 4,736 5,166 7,700 10,974 10,306 11,786 13,962Other income 556 505 350 487 544 861 989Interest (expense)/income (159) (138) (49) (23) (7) (7) (7)Pretax profits 5,133 5,534 8,000 11,439 10,843 12,641 14,943Tax-cash (1,947) (2,045) (2,912) (3,760) (3,563) (4,176) (4,950)Tax-deferred (67) (250) (78) (71) (32) (16) (8)Minority interest 148 281 190 90 32 (13) (47)Net profits after minority interests 3,267 3,578 5,199 7,698 7,281 8,436 9,939Earnings per share (Rs) 8.3 9.1 13.2 19.5 18.5 21.4 25.2
Balance sheet (Rs mn)Total equity 14,485 17,016 18,856 22,537 24,768 26,776 28,911 Deferred Tax 11 261 339 410 442 457 465Total borrowings 695 716 1 1 — — —Currrent liabilities 2,516 2,343 4,607 4,472 2,692 3,041 3,457 Total capital 18,311 20,720 25,052 28,669 29,119 31,505 34,110Cash 4,297 3,654 4,367 6,030 7,165 8,926 10,354 Current assets 4,542 5,543 6,279 7,791 9,455 10,798 12,579 Total fixed assets 5,048 6,697 8,859 8,651 8,045 7,522 7,112 Intangible assets 2,620 3,021 3,268 3,481 1,737 1,542 1,348Total assets 18,311 20,720 25,052 28,669 29,119 31,505 34,110
Free cash flow (Rs mn)Operating cash flow, excl. working capital 4,393 5,620 8,107 12,240 10,483 11,835 13,913 Working capital (1,235) 413 (892) (965) (3,444) (994) (1,365) Capital expenditure (1,811) (4,291) (3,120) (2,002) (500) (500) (550) Investments (3,837) (627) (3,166) (4,335) (889) (3,007) (3,747) Other income 523 484 361 420 544 861 989Free cash flow (698) 1,116 1,396 6,468 5,649 7,334 8,251
Ratios (%)Debt/equity 4.8 4.2 — — — — —Net debt/equity (24.9) (17.3) (23.2) (26.8) (28.9) (33.3) (35.8) RoAE 25 23 29 37 30 32 35 RoACE 24 23 28 37 31 33 36
Source: Company data, Kotak Institutional Equities estimates

For private Circulation Only. FOR IMPORTANT INFORMATION ABOUT KOTAK SECURITIES’ RATING SYSTEM AND OTHER DISCLOSURES, REFER TO THE END OF THIS MATERIAL.
Tata Steel Europe set for rebound; near-term strength in the steel market to help
Tata Steel Europe (TSE) will return to positive EBITDA after US$147 mn of losses in 3QFY12. Decline in raw material costs (it helps that the raw material inventory has been written down to spot prices in 3QFY12) can potentially lead to US$45/tonne of EBITDA swing. In addition, steel price increase benefit, even if restricted to one month (spot has increased by US$50/tonne though it flows with a lag to the P&L), will aid overall profitability. Management commentary on expansion of spread between HRC and raw material in 4QFY12E gives further confidence on a turnaround. TSE has also taken steps to reduce cost structure that includes restructuring of long product division involving manpower reduction and other cost-control initiatives. While this may show up in restructuring charges over the next two years, this will also improve cost competitiveness. We forecast EBITDA/tonne of US$35 and US$43 for FY2013E and FY2014E.
Incremental volumes from brownfield expansion of 1 mn tonnes in FY2013E, a tad disappointing
Tata Steel has guided for steel deliveries of 7.6 mn tonnes for FY2013E, a tad disappointing. The company has started hot trials in most of the facilities for 2.9 mtpa brownfield expansion at Jamshedpur. Note this expansion is vertically integrated; management expects 5-6 months for all the facilities along with associated infrastructure to stabilize. The company indicated that close to 50% of new production will be directed towards downstream products in tubes, packaging, color-coated products, continuous annealing. The company expects only 1-1.2 mtpa production to be in the commodity grade HR. Profitability of the expansion will be similar to the corporate average due to better product mix and absorption of fixed costs at Jamshedpur.
Downgrade a notch to ADD; recent stock run-up limits upside
We downgrade Tata Steel to ADD from BUY earlier with a revised target price of Rs525 (Rs490 earlier). The 27.8% increase in stock price in the past month limits near-term upside. We have made marginal changes to our estimates for FY2012-14E as detailed later. Tata Steel is trading at 5.2X FY2013E adjusted EBITDA and 8.1X earnings. We like the Tata Steel story for strong and profitable domestic expansion over the next few years that will reduce TSE-induced volatility in financial performance.
Tata Steel (TATA)
Metals & Mining
Negatives out of the way. On expected lines, 3QFY12 was a weak quarter for Tata Steel. From here, Tata Steel has several positives going its way including brownfield expansion, shipments from raw material projects and possible strong near-term performance at Tata Steel Europe. The likely restocking cycle will provide further boost. However, the recent run-up in stock price leaves only modest upside to our revised fair value of Rs525. Downgrade a notch to ADD from BUY earlier.
Tata SteelStock data Forecasts/Valuations 2012 2013E 2014E
52-week range (Rs) (high,low) EPS (Rs) 36.2 58.4 80.4Market Cap. (Rs bn) 461.5 EPS growth (%) (51.9) 61.2 37.6
Shareholding pattern (%) P/E (X) 13.1 8.1 5.9Promoters 30.7 Sales (Rs bn) 1,263.6 1,355.7 1,404.7FIIs 17.1 Net profits (Rs bn) 35.2 56.7 78.1MFs 3.6 EBITDA (Rs bn) 118.6 159.5 193.1
Price performance (%) 1M 3M 12M EV/EBITDA (X) 8.0 6.1 5.0Absolute 27.8 6.1 (20.9) ROE (%) 7.1 13.4 16.3Rel. to BSE-30 16.4 3.8 (22.2) Div. Yield (%) 2.5 2.5 2.5
Company data and valuation summary
737-332
ADD
FEBRUARY 13, 2012
CHANGE IN RECO.
Coverage view: Cautious
Price (Rs): 475
Target price (Rs): 525
BSE-30: 17,749

Tata Steel Metals & Mining
KOTAK INSTITUTIONAL EQUITIES RESEARCH 79
Key changes to our estimates
We have made moderate changes to our estimates and accordingly revise our FY2013-14E EPS estimates upwards by 3.9% and 8.7% to Rs58.4 and Rs80.4 on the back of (1) increase in TSE EBITDA estimates for FY2013E and FY2014E respectively. Profitability estimates stand increased to US$35/tonne and US$43/tonne for FY2013E and FY2014E respectively from US$28/tonne and US$38/tonne earlier, and (2) increase in our base-case HRC price assumption for FY2013E by 2.3% on the back of recent uptick in prices while maintaining our FY2014E price assumption.
This is partly neutralized by (1) factoring in our economist’s FY2012-14E Re/US$ forecast of Rs48, Rs50.5 and Rs50 respectively from Rs47.3, Rs52.5 and Rs50 earlier, and (2) lowering our steel deliveries for FY2013E for Tata Steel India and TSE by 4.8% and 1.2% respectively (refer Exhibit 1 below).
Exhibit 1: Tata Steel, Change in estimates, March fiscal year-ends, 2012-14E (Rs mn)
2012E 2013E 2014E 2012E 2013E 2014E 2012E 2013E 2014EEarnings (consolidated)Net sales 1,263,607 1,355,692 1,404,723 1,292,002 1,409,872 1,394,263 (2.2) (3.8) 0.8 EBITDA 118,585 159,512 193,084 124,694 158,822 184,824 (4.9) 0.4 4.5 Adj. PAT 26,977 56,748 78,097 35,315 54,631 71,865 (23.6) 3.9 8.7 EPS (Rs) 27.8 58.4 80.4 36.4 56.2 74.0 (23.6) 3.9 8.7 VolumesIndia (mn tonnes) 6.6 7.6 9.4 6.6 8.0 9.4 — (4.8) —International operations (mn tonnes) 13.6 13.6 13.9 13.9 13.8 13.9 (1.9) (1.2) —PricingHRC price India (US$/tonne) 738 706 695 728 690 695 1.5 2.3 —Realization (US$/tonne) 1,180 1,135 1,100 1,180 1,135 1,100 — — —
Revised estimates Old estimates % change
Source: Company, Kotak Institutional Equities estimates
Capex spend of around US$2.5 bn each over the next 3 years
Tata Steel reiterated its focus on investing aggressively in various capacity expansion and raw material projects and is targeting an annual capex spend of around US$2.5 bn over the next three years. FY2013E capex would comprise (1) around US$600 mn on its European operations, (2) residual payments to the tune of US$400-500 mn on its Jamshedpur expansion, (3) US$800 mn on its Orissa expansion plans, (4) maintenance capex of around US$300mn, and (5) various other projects including raw material expansion projects and joint venture projects such as the JV with Nippon Steel. As a result, we expect gross debt to remain at elevated levels. We expect net debt/ EBITDA of 3.1X and 2.6X for FY2013E and FY2014E respectively and net debt/equity of 1.1X and 1X for FY2013E and FY2014E respectively (refer Exhibit 2 below).
Exhibit 2: Tata Steel consolidated leverage details, March fiscal year-ends, FY2012-14E (X)
2012E 2013E 2014EExistingEBITDA (Rs mn) 118,585 159,512 193,084 Shareholders funds 402,478 445,756 510,383 Net debt 475,012 500,406 500,810 Net debt/ EBITDA (X) 4.0 3.1 2.6 Net debt/ Equity (X) 1.2 1.1 1.0
Source: Kotak Institutional Equities estimates

Metals & Mining Tata Steel
80 KOTAK INSTITUTIONAL EQUITIES RESEARCH
Exhibit 3: Tata Steel group quarterly net debt trend, 2QFY10-2QFY12 (US$ bn)
505526
451408
466
528
481474
445
300
350
400
450
500
550
600
3QFY
10
4QFY
10
1QFY
11
2QFY
11
3QFY
11
4QFY
11
1QFY
12
2QFY
12
3QFY
12
Net Debt (Rs bn)
Source: Company, Kotak Institutional Equities estimates
Other highlights of the 3QFY12 conference call
The 2.9 mtpa brownfield expansion at Jamshedpur is nearing completion with all downstream and ancillary facilities progressing on schedule and is set to commission in a phased manner towards the end of the current fiscal year. The company expects incremental production of around 1 mtpa in FY2013E which would ramp up in FY2014E.
Focus on value-added product mix would help address concerns on overcapacity in the domestic market. The company expects around half of the incremental capacity to be fed to its downstream, facilities including tubes, packaging and continuous annealing products. A part of the remaining capacity would be sold to the auto sector, where the company enjoys healthy premiums. Hence, the company expects margins on an overall basis to be on par with current levels. Fixed-cost absorption would improve as the entire incremental capacity comes on stream.
The first phase of the Benga coking coal project is nearing completion, with the first dispatch expected around March. The company has guided for shipments of 1-1.2 mn tonnes in FY2013E (Tata Steel’s share would be around 0.5 mtpa).
3QFY12 saw material fall in steel prices on a qoq basis in Europe. Steel prices fell around US$43/tonne over the previous quarter on suppressed macro-economic conditions and destocking activities prevalent. 3QFY12 also saw the spread between steel and raw material prices narrowing by around EUR60-80/tonne sequentially qoq to EUR90/tonne. This spread was around EUR350/tonne in 1QFY12.
In India, prices remained firm in the flat segment while in the long segment, there was an uptick in prices vis-à-vis the previous quarter on build-up in demand, particularly from the construction segment.
The company expects some revival in Europe and improvement in profitability led by a combination of some uptick in demand from key-end user segments including restocking activities, softening of key input prices (iron ore down to US$140/tonne and coking coal to US$220/tonne) and some improvement in steel prices.

Tata Steel Metals & Mining
KOTAK INSTITUTIONAL EQUITIES RESEARCH 81
Exhibit 4: Tata Steel, valuation, March fiscal year-ends, 2013E basis (Rs mn)
EBITDA Multiple Enterprise value EV
(Rs mn) (X) (Rs mn) (Rs/share)
Tata Steel standalone 129,122 6.5 839,291 864
Tata Steel Europe 23,698 5.0 118,491 122
Tata Steel thailand and other businesses 4,840 5.0 24,199 25
Total Enterprise Value 981,981 1,011
Consolidated group net debt 500,406
Total borrowings 500,406 515
Arrived market capitalization 481,575 496
Add: Value of investments 28,000 29
Arrived market capitalization 509,575 525
Target price (Rs) 525
Source: Kotak Institutional Equities estimates
Exhibit 5: Tata Steel, Key assumptions, March fiscal-year ends, FY2009-14E (Rs mn)
2009 2010 2011 2012E 2013E 2014ETata Steel (India)Benchmark HRC Price (US$/tonne) 749 635 740 738 706 695 Volume (mn tonnes) 5.2 6.2 6.4 6.6 7.6 9.4 EBITDA/tonne (US$/tonne) 380 307 391 360 336 329 CorusAverage realization (US$/ tonne) 1,236 981 1,118 1,180 1,135 1,100 Volume (mn tonnes) 19.0 14.2 14.9 13.6 13.6 13.9 EBITDA/tonne (US$/tonne) 103 (20) 62 11 35 43
Source: Company, Kotak Institutional Equities estimates

Metals & Mining Tata Steel
82 KOTAK INSTITUTIONAL EQUITIES RESEARCH
Exhibit 6: Tata Steel (standalone), Profit model, balance sheet and cash flow model, March fiscal year-ends, 2009-14E (Rs mn)
2009 2010 2011E 2012E 2013E 2014EProfit model (Rs mn)Net sales 243,157 250,220 293,964 333,178 381,079 441,984 EBITDA 91,334 89,521 114,329 113,701 129,122 153,745 Other income 3,083 8,538 7,907 5,887 1,467 1,467 Interest (11,527) (15,084) (13,005) (8,923) (10,853) (9,848) Depreciation (9,734) (10,832) (11,462) (11,735) (15,285) (18,835) Profit before tax 73,156 72,143 97,769 98,929 104,450 126,529 Extraordinaries — — (45) — — —Taxes (21,139) (21,675) (29,112) (31,657) (31,335) (37,959) Profit after tax 52,017 50,468 68,612 67,272 73,115 88,570 Fully diluted EPS (Rs) 55.8 54.1 71.5 69.3 75.3 91.2
Balance sheet (Rs mn)Equity 242,319 371,688 469,446 523,248 582,893 657,993 Deferred tax liability 5,857 8,677 9,368 11,347 11,347 11,347 Total Borrowings 324,188 252,392 298,011 218,011 198,011 178,011 Current liabilities 100,077 99,607 118,692 128,209 136,083 146,095 Total liabilities 672,441 732,363 895,517 880,815 928,334 993,446 Net fixed assets 109,945 121,624 118,051 121,316 233,031 229,196 Capital work in progress 34,877 38,436 69,694 133,444 85,194 130,194 Investments 423,718 449,797 465,649 465,649 465,649 465,649 Cash 15,906 32,341 41,415 32,614 9,350 23,992 Other current assets 86,945 90,165 200,708 127,792 135,110 144,415 Miscellaneous expenditure 1,051 — — — — —Total assets 672,442 732,363 895,517 880,815 928,334 993,446
Free cash flow (Rs mn)Operating cash flow excl.working capital 66,599 71,874 83,539 80,986 88,400 107,405 Working capital changes 7,373 11,818 1,843 474 556 707 Capital expenditure (27,711) (20,237) (39,344) (78,750) (78,750) (60,000) Free cash flow 46,261 63,455 46,038 2,710 10,206 48,112
RatiosEBITDA margin (%) 37.6 35.8 38.9 34.1 33.9 34.8 EBT margin (%) 30.1 28.8 33.2 29.7 27.4 28.6 Debt/equity (X) 1.3 0.7 0.6 0.4 0.3 0.3 Net debt/equity (X) 1.1 0.5 0.5 0.3 0.3 0.2 Net debt/EBITDA (X) 3.0 2.3 2.0 1.4 1.2 0.8 RoAE (%) 22.7 16.5 16.3 13.6 13.2 14.3 RoACE (%) 13.9 12.3 12.9 11.2 12.4 13.8
Source: Company, Kotak Institutional Equities estimates

Tata Steel Metals & Mining
KOTAK INSTITUTIONAL EQUITIES RESEARCH 83
Exhibit 7: Tata Steel (consolidated), Profit model, balance sheet and cash flow model, March fiscal year-ends, 2009-14E (Rs mn)
2009 2010 2011 2012E 2013E 2014EProfit model (Rs mn)Net sales 1,473,293 1,023,931 1,187,531 1,263,607 1,355,692 1,404,723 EBITDA 181,277 80,427 159,956 118,585 159,512 193,084 Other income 2,657 11,859 9,810 8,687 4,467 4,497 Interest (32,902) (30,221) (27,700) (29,597) (32,891) (31,166) Depreciation (42,654) (44,917) (44,148) (47,162) (53,350) (58,179) Profit before tax 108,378 17,147 97,917 50,513 77,737 108,235 Extraordinaries (40,945) (16,837) 23,102 39,191 — —Taxes (18,940) (21,518) (32,459) (32,293) (23,710) (33,012) Profit after tax 48,492 (21,208) 88,561 57,411 54,027 75,223 Minority interest 409 (152) 603 1,700 1,530 1,683 Share in profit/(loss) of associates 607 1,269 664 1,179 1,191 1,191 Reported net income 49,509 (20,092) 89,827 60,290 56,748 78,097 Adjusted net income 61,750 (3,255) 72,281 26,977 56,748 78,097 Fully diluted EPS (Rs) 66.2 (3.5) 75.3 27.8 58.4 80.4 Balance sheet (Rs mn)Equity 217,700 230,208 355,639 402,478 445,756 510,383 Deferred tax liability 17,094 16,541 20,126 20,126 20,515 21,056 Total Borrowings 653,732 531,004 621,843 586,843 551,843 526,843 Current liabilities 313,109 309,678 346,578 353,521 366,455 357,347 Minority interest 8,949 8,841 8,889 7,189 5,659 3,976 Total liabilities 1,210,583 1,096,272 1,353,076 1,370,158 1,390,228 1,419,606 Net fixed assets 364,175 365,252 365,092 383,130 506,980 500,301 Capital work in progress 88,880 92,706 158,842 202,592 129,342 174,342 Goodwill 153,649 145,418 152,982 152,982 152,982 152,982 Investments 64,111 54,178 78,473 57,685 53,875 45,066 Cash 61,484 68,151 108,926 80,240 24,845 9,442 Other current assets 477,229 370,566 488,760 493,530 522,205 537,473 Miscellaneous expenditure 1,055 — — — — —Total assets 1,210,583 1,096,272 1,353,076 1,370,158 1,390,228 1,419,606 Free cash flow (Rs mn)Operating cash flow excl. working capital 116,077 23,343 105,012 60,713 103,299 129,447 Working capital changes 2,254 49,017 (71,749) 2,174 (15,741) (24,376) Capital expenditure (83,608) (69,472) (101,636) (108,950) (103,950) (96,500) Free cash flow 34,723 2,889 (68,373) (46,063) (16,392) 8,571 RatiosEBITDA margin (%) 12.3 7.9 13.5 9.4 11.8 13.7 EBIT margin (%) 9.4 3.5 9.8 5.7 7.8 9.6 Debt/equity (X) 3.0 2.3 1.7 1.5 1.2 1.0 Net debt/equity (X) 2.6 1.9 1.4 1.2 1.1 1.0 Net debt/EBITDA (X) 3.1 5.5 3.0 4.0 3.1 2.6 RoAE (%) 24.5 (1.5) 24.7 7.1 13.4 16.3 RoACE (%) 9.9 (34.8) 9.3 4.9 7.2 8.5
Source: Company, Kotak Institutional Equities estimates

For private Circulation Only. FOR IMPORTANT INFORMATION ABOUT KOTAK SECURITIES’ RATING SYSTEM AND OTHER DISCLOSURES, REFER TO THE END OF THIS MATERIAL.
Reasonably well-priced; downside risks to earnings limited in this phase of interest-rate cycle
We downgrade IndusInd Bank to an ADD from BUY but broadly retain our earnings—the change in rating driven by the strong outperformance. We believe that our earnings underestimate the potential for NIM improvement and factor conservative credit costs. We factor NII to grow by 24% CAGR for FY2012-14E on the back of similar loan growth, implying extremely low levels of NIM improvement from current levels (note that each quarter in FY2012 saw a decline in NIMs) and fairly conservative loan growth assumptions.
Decline in cost of funds and higher share of fixed-rate loans offer strong comfort on NIM outlook
We believe that the bank has positioned its balance sheet well to leverage the downward interest-rate cycle which should result in strong NIM expansion over the next few quarters. Wholesale rates, measured through the CD market, are yet to reflect a serious downward trend but we expect this to change sooner than later. The bank’s cost of funds at 8.2% in 3QFY12, one of the highest in the industry, despite CASA ratio closer to 27% levels indicates a reasonably higher cost of term deposits while the fixed interest rate retail portfolio is yielding 16% levels. We are conservative on NIM (expansion 20 bps by FY2014E) as change in the CASA acquisition strategy could partially erase this benefit but potentially improve the structure of total liabilities.
Two key risks which could be a potential overhang but reasonably factored in estimates
We see two key risks currently: (1) Balance sheet risks and the ability to maintain the current asset quality trends. Last reported data on asset quality shows limited signs of stress despite macro environment weakening and interest rates remaining fairly high for the past few quarters. IndusInd Bank has a reasonably higher share of business that is pro-cyclical in nature. Also, higher share of business in used vehicle loans (11% of the overall vehicle loans) as compared to new vehicles further increases the risk that is yet to be reflected. (2) Ability to improve liability franchise, especially CASA. Ability to improve margins can offset credit costs while the recent increase in savings account interest rates as well as an aggressive marketing campaign to improve the visibility of the bank should address some of these risks.
IndusInd Bank (IIB)
Banks/Financial Institutions
Limited risks to business; valuations cap returns in the near term. We downgrade IndusInd Bank to ADD from BUY as we believe that the current valuation of 2.8X book and 18X FY2013E EPS captures the strength of the business model for RoEs in the range of 18% levels and earnings growth of 14% CAGR. We are valuing the bank at `330 (from `325 earlier)—3X book and 18X FY2013 EPS. We see a possibility of earnings upgrade over the next few quarters but believe risks are primarily from balance sheet on slowdown in economic growth and ability to improve the liability franchise.
IndusInd BankStock data Forecasts/Valuations 2012 2013E 2014E
52-week range (Rs) (high,low) EPS (Rs) 16.8 17.9 22.1Market Cap. (Rs bn) 148.7 EPS growth (%) 35.2 7.1 23.0
Shareholding pattern (%) P/E (X) 19.0 17.8 14.5Promoters 19.5 NII (Rs bn) 16.8 21.2 26.0FIIs 49.1 Net profits (Rs bn) 7.8 8.4 10.3MFs 6.7 BVPS 100.4 114.9 132.7
Price performance (%) 1M 3M 12M P/B (X) 3.2 2.8 2.4Absolute 22.3 18.2 47.7 ROE (%) 19.3 17.4 18.5Rel. to BSE-30 11.4 15.6 45.3 Div. Yield (%) 0.8 0.9 1.1
Company data and valuation summary
321-200
ADD
FEBRUARY 10, 2012
CHANGE IN RECO.
Coverage view: Attractive
Price (Rs): 319
Target price (Rs): 330
BSE-30: 17,749

IndusInd Bank Banks/Financial Institutions
KOTAK INSTITUTIONAL EQUITIES RESEARCH 85
Margin expansion is now a near-certainty
We believe that IndusInd Bank’s NIM has definite scope for improvement from current levels. A combination of high-yield fixed interest rate retail assets as well as decline in funding costs from here should enable the bank to (1) expand NIM and (2) move towards low-risky assets, especially corporate loans, over the next few quarters. Retail loans have grown to 48% levels as compared to 40% levels in FY2010 while the risk levels have increased through used vehicle financing. The entire portfolio of retails loans are primary fixed in nature where the underlying yields are close to 16% levels and duration of close to 18 months (door-to-door maturity of about three years).
We expect the NIM improvement to be visible from FY2013E onwards though we are yet to fully factor this improvement in our current estimates. Cost of deposits of the bank is currently fairly high at 8.2% as of 3QFY12 but looks to have peaked (flat qoq). However, interest rates on wholesale deposits continue to remain high as reflected in CD rates as the underlying liquidity environment remains fairly tight over the past few months. The CASA ratio of 27% gives some confidence that the underlying liability has scope for strong decline as interest rates soften.
Attempt to neutralize margin volatility takes a back seat
Over the past few quarters, we note that IndusInd Bank seems to have taken a cyclical call on interest rates and has deliberately increased its portfolio exposure towards segments that have shown macro headwinds. We believe that the management’s intention to neutralize the margin volatility looks to have been postponed by a few quarters.
As against a CASA liability of 27% levels, the bank’s fixed interest portfolio is approximately 45%. The difference between the two has increased sharply in recent quarters to about 20% from about 15% levels witnessed in FY2011.
Well-positioned to drive margin expansion with the current portfolio of asset and reducing funding cost environment Drivers for margin expansion, March fiscal year-ends, 1QFY10-3QFY12 (%)
1QFY10 2QFY10 3QFY10 4QFY10 1QFY11 2QFY11 3QFY11 4QFY11 1QFY12 2QFY12 3QFY12 Yield management measures (%)Yield on advances 13.4 13.1 12.4 11.9 12.2 12.1 12.3 12.9 13.5 13.8 13.8 - Corporate and commercial 11.9 11.0 9.2 9.1 9.2 9.2 9.5 10.3 11.2 11.8 11.5 - Consumer finance 15.0 15.5 16.1 15.9 16.1 16.1 16.0 16.3 16.3 16.4 16.4Cost of deposits 7.7 7.2 6.6 6.0 6.0 6.0 6.2 7.0 7.7 8.2 8.2NIM 2.6 2.9 2.9 3.2 3.3 3.4 3.6 3.5 3.4 3.4 3.3
Composition of loansRetail loans to overall loans 44.4 42.6 41.6 40.4 41.5 41.7 42.3 44.4 44.8 47.7 48.4Vehicle loans to overall loans 43.2 42.6 40.6 39.6 40.8 41.2 41.6 43.5 43.4 45.9 46.3
Source: Company, Kotak Institutional Equities

Banks/Financial Institutions IndusInd Bank
86 KOTAK INSTITUTIONAL EQUITIES RESEARCH
Difference between fixed rate assets and CASA has increased in recent quarters Proportion of vehicles to overall loans, 1QFY10-3QFY12 (%)
0.0
10.0
20.0
30.0
40.0
50.0
1QFY
10
2QFY
10
3QFY
10
4QFY
10
1QFY
11
2QFY
11
3QFY
11
4QFY
11
1QFY
12
2QFY
12
3QFY
12
10.0
13.0
16.0
19.0
22.0
25.0CASA (LHS) Vehicle loans to overall loans (LHS) Difference (RHS)
Source: Company, Kotak Institutional Equities
Tight liquidity is keeping wholesale interest rates high CD and CP rate, March fiscal year-ends, February 2010-February 2012
-
2
5
7
10
12
Feb-
10
May
-10
Aug
-10
Nov
-10
Feb-
11
May
-11
Aug
-11
Nov
-11
Feb-
12
CP rate CD rate
Source: Bloomberg
….despite interest rates declining on G Sec 10-year G Sec, March fiscal year-ends, February 2010-February 2012
6.5
7.0
7.5
8.0
8.5
9.0
Feb-
10
May
-10
Aug
-10
Nov
-10
Feb-
11
May
-11
Aug
-11
Nov
-11
Feb-
12
Source: Bloomberg

IndusInd Bank Banks/Financial Institutions
KOTAK INSTITUTIONAL EQUITIES RESEARCH 87
Composition of CASA and NIM cycle suggests opportunity to increase SA rates further
We see a very strong reason for IndusInd Bank to use a part of the NIM expansion to improve the liability franchise by increasing savings account rate further, if the recent increase does not necessarily improve as per the bank’s internal benchmarks. The overall composition of CASA shows that IndusInd Bank has a weaker franchise on savings account as compared to current account. Current account is about 17-18% levels, almost comparable to HDFC Bank, ICICI Bank and Axis Bank. Savings account is about 10% as compared to 20-30% levels for the top-3 private banks.
Impact on cost of funds for IndusInd Bank is negligible at about 10 bps for 50 bps increase in savings rate—giving a strong incentive to increase interest rates, if required. We do understand that the medium-term implications remain high as the cost structures impact could be significant with retail deposits constituting a higher share of overall deposits.
IndusInd Bank’s current account is comparable to other leading banks Break-up of CASA across banks, March fiscal year-ends, 2008-3QFY12 (%)
2008 2009 2010 2011 3QFY12IndusInd Bank
Current 9.5 13.4 16.5 18.3 16.7 Savings 6.2 5.9 7.2 8.9 9.8
HDFC BankCurrent 28.5 19.9 22.2 22.3 18.3 Savings 26.0 24.4 29.8 30.4 30.2
ICICI BankCurrent 10.1 9.9 15.3 15.4 15.4
Savings 16.0 18.8 26.3 29.6 28.2
Axis BankCurrent 22.9 21.1 22.8 19.5 18.9 Savings 22.8 22.0 24.0 21.6 22.7
Yes BankCurrent 7.4 7.5 9.1 8.6 10.0 Savings 1.1 1.2 1.5 1.8 2.6
Source: Company, Kotak Institutional Equities
No signs of stress in any portfolio; but therein lies the risk to valuations
We see one of the biggest risks emerging on valuations as opposed to earnings. Sharper-than-expected slippages can be adequately provided by NIM expansion over the next few quarters but such slippages are likely to put valuations at risk. Discussions with the bank indicate no near-term stress in any of its portfolio.
We are building slippages to increase to about 1.7-1.8% levels over the next few years and loan-loss provisions to increase to 110-120 bps—which we believe are fairly conservative. However, sharper-than-expected slowdown along with a longer duration of weak industrial activity can result in higher slippages than what is currently estimated. We do note that IndusInd Bank has a strong portfolio in vehicle loans, having been in this business for over two decades—which reflects the strength of underwriting. Our growth outlook on overall vehicle volumes is subdued.
We see limited concerns of restructuring in the corporate portfolio. Overall loan exposure is comparatively lower and is primarily working capital in nature. As of 3QFY12, the overall restructured loans were about 20 bps.

Banks/Financial Institutions IndusInd Bank
88 KOTAK INSTITUTIONAL EQUITIES RESEARCH
Auto volumes to slow down to 10% CAGR in FY2011-13E led by weak car volumes Volumes across segments, March fiscal year-ends, 2004-13E (mn)
-
4.0
8.0
12.0
16.0
20.0
2004 2005 2006 2007 2008 2009 2010 2011 2012E 2013E
(8.0)
-
8.0
16.0
24.0
32.0
Cars Two wheelers CVs Growth (RHS)(mn)
(%)
Source: Industry, Kotak Institutional Equities
Gross NPLs across product segments have been stable for the past few quarters Gross and net NPL, March fiscal year-ends, 3QFY10-3QFY12 (%)
3QFY10 4QFY10 1QFY11 2QFY11 3QFY11 4QFY11 1QFY12 2QFY12 3QFY12Gross NPL (Rs mn) 2,576 2,555 2,752 2,864 3,060 2,659 3,093 3,326 3,342
Wholesale (Rs mn) 687 1,010 901 941 1,100 820 940 1,040 920 Retail (Rs mn) 1,889 1,540 1,851 1,921 1,960 1,840 2,150 2,280 2,410
Commercial vehicle 1.9 1.5 1.4 1.4 1.4 1.2 1.1 1.1 1.1 Utility vehicle 1.2 1.1 1.2 1.0 1.0 1.1 1.5 1.6 1.4 Construction equipments 1.7 1.6 1.5 1.7 1.6 1.4 1.4 1.5 1.3 3 Wheeler NA 0.4 1.1 0.6 0.5 0.6 1.1 1.0 1.1 2 Wheeler 2.7 5.3 5.5 5.8 4.6 3.9 3.8 3.9 3.8 Cars 4.8 3.7 3.4 2.7 2.2 1.6 1.5 1.0 1.1
Gross NPL ratio 1.3 1.2 1.3 1.2 1.2 1.0 1.1 1.1 1.0 Net NPL (Rs mn) 1,287 1,018 825 837 910 728 838 931 936 Net NPL ratio 1.3 1.2 1.3 1.2 1.2 1.0 1.1 1.1 1.0 Provision coverage 50.0 60.1 70.0 70.8 70.3 72.6 72.9 72.0 72.0 Notes: (1) Gross NPL ratios for individual retail products has been calculated based on period ending outstanding loans
Source: Company, Kotak Institutional Equities
Contribution of non-interest income (ex-treasury) to remain stable
IndusInd Bank has steadily improved the overall contribution of fee income to overall income or as a proportion of assets in recent quarters but we expect this contribution to remain stable over the next few years. Contribution of non-interest income (ex-treasury) to overall income is currently at 36% in 3QFY12 while it is at 1.8% as proportion of assets. We expect overall fee income to grow by 23% CAGR for FY2012-14E.
The bank is steadily building a fee income business that is independent of the overall growth in balance sheet mainly from income from third-party products (25% of the current non-interest income (ex-treasury). These products include credit card fees, housing loans origination, insurance and mutual fund distribution.

IndusInd Bank Banks/Financial Institutions
KOTAK INSTITUTIONAL EQUITIES RESEARCH 89
IndusInd Bank is building a strong platform on non-interest income business that is reasonably independent of balance sheet growth Comparison of non-interest income (ex-treasury) to income and proportion of assets, March fiscal year-ends, 3QFY09-3QFY12 (%)
3QFY09 4QFY09 1QFY10 2QFY10 3QFY10 4QFY10 1QFY11 2QFY11 3QFY11 4QFY11 1QFY12 2QFY12 3QFY12Non-interest income (ex treasury) to incomeAxis Bank 37.2 36.2 31.6 38.0 35.0 34.7 32.0 34.9 35.2 44.2 38.0 37.2 36.7 ICICI Bank 34.2 38.3 33.8 39.6 45.5 43.2 42.9 45.5 42.6 44.3 41.1 42.9 42.5 HDFC Bank 24.2 29.4 27.2 29.6 29.6 30.2 28.6 29.0 29.7 30.5 29.3 29.2 33.1 IndusInd Bank 31.7 27.7 27.6 37.8 31.7 27.7 28.4 32.3 30.7 28.9 30.9 32.2 36.0 Yes Bank 41.2 36.6 35.9 43.5 37.7 39.6 37.4 34.0 33.3 34.9 31.8 34.9 32.7
Non-interest income (ex treasury) to assetsAxis Bank 1.9 1.9 1.8 2.3 2.2 2.0 1.7 1.9 2.0 2.5 1.8 2.0 2.0 ICICI Bank 1.6 1.5 1.5 1.7 1.9 1.9 1.7 1.8 1.8 1.8 1.6 1.7 1.7 HDFC Bank 1.6 1.9 1.7 1.9 1.9 1.9 1.7 1.7 1.9 1.9 1.6 1.6 1.8 IndusInd Bank 1.2 1.3 1.3 1.6 1.3 1.3 1.3 1.6 1.6 1.4 1.6 1.6 1.8 Yes Bank 2.6 1.7 2.0 2.3 1.8 1.9 1.6 1.3 1.2 1.3 1.1 1.4 1.2
Source: Company, Kotak Institutional Equities
Cost structure to remain stable with expansion in branch network
We expect the overall cost-to-income ratio for the bank to remain stable, building in a marginal decline of 40 bps by 2014E. Higher contribution of retail portfolio and focus on expansion is likely to keep cost-income ratio high at 48% levels. Overall employee cost to total income is at 38% levels, one of the lowest compared to peers primarily due to higher operating expenses of the retail portfolio.
The bank has doubled the branch network over the past year to 365 branches in 3QFY12 (30% CAGR for FY2009-11E) while the total employees have grown by 35% CAGR for FY2008-11E. We are building overall expenses to grow by 22% with staff expenses growth at 24% CAGR for FY2012-14E.
Cost-to-income ratio likely to remain stable Cost-to-income ratio, March fiscal year-ends, 2008-14E (%)
40
46
52
58
64
70
2008 2009 2010 2011 2012E 2013E 2014E
Source: Company, Kotak Institutional Equities estimates
Investments in HR/branches to keep cost-income ratio high Branches and employee strength, March fiscal year-ends, 2008-14E
100
220
340
460
580
700
2008 2009 2010 2011 2012E 2013E 2014E
0
2000
4000
6000
8000
10000Branches (LHS)Employee strength (RHS)
Source: Company, Kotak Institutional Equities estimates

Banks/Financial Institutions IndusInd Bank
90 KOTAK INSTITUTIONAL EQUITIES RESEARCH
IndusInd Bank’s employee cost to total cost is lower than the industry average Employee cost as a percentage of overall costs, March fiscal year-ends, 2009-14E (%)
Bank 2008 2009 2010 2011 2012E 2013E 2014E
IndusInd 30.3 34.2 39.5 37.9 36.6 38.2 37.6 HDFC 34.7 40.5 39.7 39.6 40.0 40.6 41.1 ICICI 25.5 28.0 32.9 42.6 43.6 45.1 46.6 Yes 58.3 52.1 51.4 53.3 52.8 53.8 55.2
Source: Company, Kotak Institutional Equities estimates
IndusInd Bank- Rolling PBR and PER March fiscal year-ends, February 2005-February 2012
-
0.8
1.6
2.4
3.2
4.0
Feb-
05
Jun-
05
Oct
-05
Feb-
06
Jun-
06
Oct
-06
Feb-
07
Jun-
07
Oct
-07
Feb-
08
Jun-
08
Oct
-08
Feb-
09
Jun-
09
Oct
-09
Feb-
10
Jun-
10
Oct
-10
Feb-
11
Jun-
11
Oct
-11
Feb-
12
-
9
18
27
36
45Rolling PBR (X) (LHS) Rolling PER (X) (RHS)
Source: Company, Kotak Institutional Equities estimates

IndusInd Bank Banks/Financial Institutions
KOTAK INSTITUTIONAL EQUITIES RESEARCH 91
IndusInd Bank growth rates and key ratios March fiscal year-ends, 2009-14E (%)
2009 2010 2011 2012E 2013E 2014EGrowth rates (%)Net loan 23.3 30.3 27.3 26.0 19.8 18.2 Customer assets 23.0 30.3 27.7 25.9 19.7 18.1 Investments excld. CPs and debentures growth 15.6 35.2 17.5 40.5 25.8 19.8 Net fixed and leased assets (0.3) 3.5 (7.5) 57.5 26.5 19.6 Cash and bank balance (11.7) 35.3 54.6 21.7 14.2 12.9 Total Asset 18.4 28.1 29.0 26.5 19.2 16.9 Deposits 16.1 20.8 28.7 23.1 24.7 20.5
Current 64.0 49.1 42.3 32.5 29.7 22.9 Savings 9.6 47.3 59.7 32.8 40.2 31.7 Fixed 11.3 14.2 22.8 19.5 21.1 18.1
Net interest income 52.8 93.1 55.3 21.9 26.0 22.3 Loan loss provisions 93.3 15.2 20.9 (19.7) 169.6 29.7 Total other income 53.1 21.3 28.9 40.1 17.9 24.6
Net fee income (3.3) 176.1 39.5 42.0 19.4 26.3 Net exchange gains 148.8 17.5 82.5 18.7 16.9 17.6
Operating expenses 36.0 34.5 37.0 30.5 23.6 21.3 Employee expenses 53.5 55.3 31.7 26.0 29.0 19.2
Key ratios (%)Yield on average earning assets 9.8 9.1 9.3 10.8 10.5 10.3 Yield on average loans 12.6 11.6 12.1 14.0 13.7 13.5 Yield on average investments 6.6 6.1 6.1 7.3 7.1 6.9 Average cost of funds 8.0 6.4 6.1 8.0 7.5 7.2 Interest on deposits 7.7 6.4 6.0 7.4 6.9 6.7 Difference 1.8 2.8 3.2 2.8 3.0 3.1 Net interest income/earning assets 1.9 3.0 3.6 3.4 3.5 3.6 New provisions/average net loans 0.9 0.8 0.8 0.5 1.1 1.2 Total provisions/gross loans 0.5 0.7 0.7 1.0 1.8 2.6 Fee income to total income 7.7 13.4 12.3 13.6 13.2 13.6 Net trading income to PBT 41.3 20.9 3.7 5.5 4.8 5.2 Exchange income to PBT 31.6 15.8 17.5 15.6 17.3 16.5 Operating expenses/total income 59.8 51.1 48.2 49.1 49.4 48.7 Operating expenses/assets 2.1 2.3 2.5 2.5 2.6 2.6 Tax rate 34.8 34.3 34.4 33.5 33.5 33.5 Dividend payout ratio 30.1 21.1 16.1 16.1 16.1 16.1 Share of deposits - - - - - -
Current 13.4 16.5 18.3 19.7 20.5 20.9 Fixed 80.8 76.3 72.8 70.7 68.7 67.3 Savings 5.9 7.2 8.9 9.6 10.8 11.8
Loans-to-deposit ratio 71.3 76.9 76.1 77.9 74.9 73.4 Equity/assets (EoY) 6.0 6.8 8.9 8.1 7.8 7.7 Asset quality trends (%)Gross NPL 1.6 1.2 1.0 1.2 1.6 1.9 Net NPL 1.1 0.5 0.3 0.4 0.5 0.6 Slippages 1.7 1.4 0.9 1.5 1.7 1.8 Provision coverage 29.8 60.1 72.6 71.3 69.6 69.4 Dupont analysis (%)Net interest income 1.8 2.8 3.4 3.2 3.3 3.5 Loan loss provisions 0.5 0.5 0.5 0.3 0.6 0.7 Net other income 1.8 1.8 1.8 1.9 1.9 2.0 Operating expenses 2.2 2.4 2.5 2.6 2.6 2.7 Invt. depreciation (0.0) (0.0) 0.0 0.0 0.0 0.0 (1- tax rate) 65.2 65.7 65.6 66.5 66.5 66.5 ROA 0.6 1.1 1.4 1.5 1.3 1.4 Average assets/average equity 24.6 20.1 14.6 12.8 13.2 13.5 ROE (incl. preference capital) 14.3 22.4 20.8 19.3 17.2 18.3
Source: Company, Kotak Institutional Equities estimates

Banks/Financial Institutions IndusInd Bank
92 KOTAK INSTITUTIONAL EQUITIES RESEARCH
IndusInd Bank P&L and balance sheet March fiscal year-ends, 2009-14E (` mn)
2009 2010 2011 2012E 2013E 2014EIncome statementTotal interest income 23,095 27,070 35,894 53,387 63,636 74,270
Loans 17,933 21,129 28,346 41,409 49,500 58,119 Investments 4,832 5,592 7,333 11,308 13,769 15,912 Cash and deposits 329 349 215 669 367 238
Total interest expense 18,504 18,206 22,129 36,609 42,500 48,412 Deposits from customers 15,760 15,601 18,285 28,202 32,631 39,012
Net interest income 4,590 8,864 13,765 16,778 21,136 25,858 Loan loss provisions 1,322 1,523 1,841 1,478 3,985 5,169 Net interest income (after prov.) 3,269 7,341 11,924 15,299 17,150 20,688 Other income 4,563 5,535 7,137 10,001 11,793 14,690
Net fee income 701 1,936 2,570 3,649 4,355 5,499 Net capital gains 909 1,110 404 750 800 1,000 Net exchange gains 719 845 1,542 1,830 2,139 2,516
Operating expenses 5,470 7,360 10,085 13,161 16,269 19,727 Employee expenses 1,871 2,906 3,826 4,820 6,218 7,409
Depreciation on investments (31) (3) 76 100 200 200 Other Provisions 117 189 101 300 100 200 Pretax income 2,275 5,331 8,798 11,739 12,374 15,251 Tax provisions 792 1,827 3,025 3,932 4,145 5,109 Net Profit 1,483 3,503 5,773 7,806 8,229 10,142 % growth 97.7 136.1 64.8 35.2 5.4 23.3 PBT - Treasury + Provisions 2,773 5,929 10,413 12,867 15,859 19,820 % growth 56.3 113.8 75.6 23.6 23.3 25.0
Balance sheetCash and bank balance 19,237 26,032 40,246 48,991 55,944 63,165
Cash 1,419 1,896 2,070 2,484 2,609 2,739 Balance with RBI 10,489 19,096 22,490 27,684 34,512 41,603 Balance with banks 7,329 5,040 15,686 18,823 18,823 18,823
Net value of investments 80,834 104,018 135,508 176,095 212,422 247,610 Govt. and other securities 62,944 85,215 100,219 140,909 177,329 212,601 Shares 357 362 370 370 370 370 Debentures and bonds 143 135 1,034 931 838 754
Net loans and advances 157,706 205,506 261,656 329,687 394,892 466,690
Fixed assets 6,232 6,448 5,965 9,393 11,882 14,205 Net leased assets - - - - - - Net Owned assets 6,232 6,448 5,965 9,393 11,882 14,205
Other assets 12,138 11,691 12,983 12,983 12,983 12,983 P&L account balance (loss) 2,437 2,235 2,065 - - -
Total assets 276,147 353,695 456,358 577,149 688,123 804,653
Deposits 221,103 267,102 343,654 423,015 527,358 635,706 Borrowings and bills payable 30,919 53,173 58,854 93,997 93,997 93,997 Other liabilities 7,493 9,448 13,349 13,349 13,349 13,349 Total liabilities 259,514 329,723 415,856 530,361 634,704 743,052 Prefernce capital - - - - - - Paid-up capital 3,552 4,106 4,660 4,660 4,660 4,660 Reserves & surplus 13,081 19,866 35,842 42,129 48,759 56,941 Total shareholders' equity 16,632 23,972 40,502 46,789 53,418 61,601
Source: Company, Kotak Institutional Equities estimates

For private Circulation Only. FOR IMPORTANT INFORMATION ABOUT KOTAK SECURITIES’ RATING SYSTEM AND OTHER DISCLOSURES, REFER TO THE END OF THIS MATERIAL.
Indians are eating more pizza but buying fewer watches (maybe not even ‘Sonata’ which costs Rs300-400) and women probably prefer to buy silver! (Tanishq’s same-store volumes likely declined in double digits). Indians are painting their houses a lot less frequently (Asian Paints volume growth likely in single digits), they prefer to travel ‘light’ (VIP Industries had a 'soft' 12% sales growth), they are shopping a lot less (Shopper’s Stop and Pantaloon same-store volumes likely declined), indulging a lot less (HUL says Knorr soup sales were impacted by “market slowdown”), are not worried about health (Sugar Free of Zydus Wellness likely had very low growth), smoking (ITC volumes were 5%) and drinking a lot less (UNSP like-to-like volume growth was 6%) !!
We prefer a basket of Dabur, GSK, Godrej, Marico and Tata Global. We believe ITC is well placed to tackle the Budget risk as there is enough predictability about the taxation regime. We like HUL and Titan with a medium-term view. Expensive valuations and limited earnings upgrade potential prompt our recent HUL rating cut to REDUCE.
We recommend investors sell Asian Paints, Colgate, Jubilant Foodworks and Nestle.
While we like the structural thesis in Jyothy Laboratories and United Spirits, improvement in business performance and/or other tangential factors (like Kingfisher Airlines for UNSP, Henkel integration for JYL) are likely to play a key role in stock performance.
Consumer sector 3QFY12 results review: No slowdown, as yet
3Q saw strong volume growth in staples and some stress in discretionary consumption (as expected). Early signs of gross margin stability were visible for Dabur, Marico and Godrej Consumer. The potential for margin expansion in FY2013 exists for most companies except Godrej (flat margins expected due to likely higher brand investments).
At the industry level, 3QFY12 had sales growth of 17%, gross profit growth of 17%, EBITDA growth of 20% and PAT growth of 21%. Gross profit margin was marginally negative (14 bps) and EBITDA margin was marginally positive (38 bps).
We categorize the 14 companies (of which 13 have reported results) under our coverage as staples (including Colgate, Dabur, Godrej Consumer, HUL, Jyothy, Marico, Tata Global Beverages) and discretionary (including Asian Paints, GSK Consumer, ITC, Jubilant Foodworks, Titan, UNSP).
Consumer products India
Hale and hearty, for now. 3QFY12: good volume growth in staples and some stress in the discretionary space (as expected). Early signs of gross margin stability for Dabur, Marico and GCPL. Margin expansion potential in FY2013 exists for most, except GCPL. ‘Pizza’ was the standout performer in the stressed discretionary space. We continue to expect some moderation in demand in CY2012, which could well be a short-term blip; we recommend ‘choose and pick’. We prefer a basket of Dabur, GSK, GCPL, Marico and Tata Global. We believe ITC is well placed to tackle the Budget risk as there is sufficient predictability about the taxation regime.
ATTRACTIVE
FEBRUARY 13, 2012
UPDATE
BSE-30: 17,749

India Consumer products
94 KOTAK INSTITUTIONAL EQUITIES RESEARCH
Staples reported sales growth of 20%, driven by a mix of pricing and volume growth; key among these, HUL, reported sales growth of 16% with 9% volume growth, Dabur reported sales growth of 35% of which organic growth was 20% and volume growth, 10%, Marico reported sales growth of 29% with 16% organic volume growth.
In the discretionary space, companies reported sales growth of 15%, driven primarily by pricing growth. ITC reported 11% sales growth in cigarettes with 5% volume growth, Asian Paints reported 20% sales growth with likely single digit volume growth, Titan reported 25% sales growth in the jewelry segment with 5% decline in jewelry grammage sales (same-store volumes likely declined in double digits), and UNSP reported flat sales due to one-offs in the results (on a like-to-like basis yoy sales growth was 13%, with overall sales volume growth of 1% yoy and adjusted for the disruptions in select states, volume growth was 6% yoy). In contrast to its peers, which reported muted volume growth, Jubilant Foodworks stood out with 49% sales growth and a strong 30% same-store growth.
Gross margin pressure stays; signs of stability for Dabur, Marico, GCPL
EBITDA margin improved sequentially for most companies, but on a yoy basis, it declined for Dabur (416 bps decline due to higher price of light liquid paraffin oil, herbs etc and higher adspends as cuts in adspends in earlier quarters were hurting volume growth), Marico (185 bps decline; while gross margin improved, adspends were higher), Titan (125 bps decline due to higher fixed costs) and UNSP (452 bps decline due to higher material cost and adspends).
EBITDA margin improved yoy for Colgate (555 bps savings in adspends), HUL (299 bps savings in adspends), ITC (205 bps improvement in gross margin; benefit of price hikes taken in anticipation of an excise hike in the Budget), Jubilant Foodworks, Jyothy Laboratories (price hike of 7% in September 2011 and savings in adspends) and TGB (correction in tea and coffee prices).
Recommendation summary
Stocks rated BUY/ADD
Dabur: Distribution-led growth will be the next growth driver.
Godrej Consumer: Keep faith.
GSK Consumer: Watch for announcement of CY2011-14E targets.
ITC: Event risk exists; potential for higher dividend payout is a buffer.
Jyothy Laboratories: Early signs of turnaround visible.
Marico: Value-added hair oil and rural penetration to lead growth.
Titan: Solid specialty retail story; near-term challenges exist.
Tata Global Beverages: Margins have likely bottomed out; potential for better, efficient capital allocation.
United Spirits: In the balance.

Consumer products India
KOTAK INSTITUTIONAL EQUITIES RESEARCH 95
Stocks rated SELL/REDUCE
Asian Paints: The past may not be a reflection of the future; SELL.
Colgate: Robust sales growth; adspends at elevated levels triggered by competition.
Hindustan Unilever: Expensive valuations and limited earnings upgrade potential.
Jubilant Foodworks: The crust could potentially crack.
Nestle: Price-led profit management deserves a lower multiple.
When facts (or stock prices!) change, we change (estimates, ratings, TP)
Dabur (ADD, TP Rs115)
We retain our ADD rating on Dabur and increase TP to Rs115 (valued at an average of the past three years’ PE multiple of 25.5X) from Rs105 earlier. We are bullish on the distribution-led growth strategy adopted by Dabur and believe this will be the next growth driver for the company (we see some parallels with the strategy adopted by GSK and HUL during 2007-09). The company stepped up adspends in 3QFY12 and will likely keep them at elevated levels in 4QFY12 as well. We view this as a good tailwind for FY2013E sales growth. In the 3QFY12 concall, the company commented that it was witnessing moderation in raw material prices in 4QFY12 compared with 3QFY12. EBITDA margins likely bottomed out in 3QFY12 and there will likely be slow recovery from here, in our view. We model flat EBITDA margins of ~16.3% over FY2012-14, which potentially has upside risks. Key risks are (1) any slowdown in rural sales growth, (2) limited pricing power of the company, which makes it vulnerable to input cost inflation, (3) Dabur is not a market leader in many categories, (4) any prolonged unrest in its key international markets could impact operations (sales and margins).
Godrej Consumer Products (ADD, TP Rs500)
We retain our ADD rating on GCPL and revise TP to Rs500 (Rs460 earlier) as we increase the multiple for the India business to 18X from 17X earlier (in line with an increase in Dabur’s FY2013E EV/EBITDA multiple). We continue to value GCPL on an SOTP basis as the company operates in multiple categories with varying growth characteristics and in multiple geographies (India, Indonesia, Africa, the UK and Latin America). Our bullishness on the stock remains: the key reason is our strong positive view of its prospects in the insecticides business. The key risks are (1) integration of recent acquisitions, (2) increasing business, political and currency risks due to operations in multiple geographies and (3) any unexpected increase in competitive activity in the domestic insecticides business.
Marico (BUY, TP Rs190)
We retain our BUY rating and revise TP to Rs190 (Rs175 earlier) and upgrade FY2012 and FY2013 estimates by 4% and 5% respectively as we build in higher volume growth in Parachute, Saffola and value-added hair oil: In 3QFY12 volume growth surprised positively with 13%, 15% and 20% respectively. Value-added hair oil consistently reported over 20% volume growth in 9MFY12. Tailwinds for FY2013E are (1) potentially lower copra prices (which we do not model), (2) continuing volume gains in value-added hair oil and (3) distribution expansion gains. Key risks are (1) higher-than-expected input cost inflation, (2) exposure to currency risks and (3) lack of meaningful success in new ventures.

India Consumer products
96 KOTAK INSTITUTIONAL EQUITIES RESEARCH
Titan (ADD, TP Rs230)
We retain our ADD rating and revise TP to Rs230 (Rs210 earlier) as we value Titan at 29X FY2013E EPS. We are believers in the long-term opportunity for Titan, (1) likely higher discretionary spends, (2) penetration and consumption-led growth, (3) mix improvement in favor of diamond and studded jewelry is a positive as they enjoy higher margins and reduce Titan’s vulnerability to gold price volatility. However near-term challenges include (1) a slowdown in consumer demand, (2) volatility in gold prices, (3) stress in the eyewear business, and (4) high competitive intensity. Any weakness in the stock price due to these reasons would be an opportune point to enter a business with solid brands and a proven execution track record.
Tata Global Beverages (BUY, TP Rs110)
We retain BUY with a TP of Rs110. We reiterate the view in our TGB upgrade note of December 2011 that margins have likely bottomed out. We continue to believe the announcement of joint ventures with PepsiCo and Starbucks are potential game changers for possible better utilization of cash. We retain a BUY rating despite the stock price appreciation of 40% since December 2011.
According to media reports, TGB’s JV with Starbucks is likely a 50:50 joint venture wherein the stores will be named “Starbucks Coffee: A Tata Alliance”. The JV named “Tata Starbucks Limited” (TSL) is likely targeting to open 50 stores by the end of CY2012 with focus on Mumbai, Bangalore and Delhi.
The JV with Pepsi Co is a 50:50 venture, named NourishCo, and targets sales of Rs7 bn by 2016. ‘Himalayan’ mineral water is being sold by this entity and nutrient-based packaged water ‘Tata Water Plus’ has been launched. The product priced at Rs16 per 750 ml bottle has been launched in Tamil Nadu and will later be introduced across India. Tata Gluco Plus (a glucose-based lemon drink) has also been introduced and is part of NourishCo.
We view TGB’s JV with Starbucks to operate a coffee chain in India as a medium-term positive. This JV could potentially address a significant challenge faced by TGB, of appropriate allocation of capital in growth businesses. This deal could potentially be a win-win for TGB if it can leverage Starbucks’ retail skills for effective utilization of its cash. However, the cultural match would be a key operational challenge, in our view.
Given multiple changes at the corporate level, we retain our estimates and rating at this stage and will revisit our valuation thesis after a meeting with the management.

Consumer products India
KOTAK INSTITUTIONAL EQUITIES RESEARCH 97
Overall industry performance may not give the correct picture Key financials of consumer companies under our coverage
Rs mn Jun-09 Sep-09 Dec-09 Mar-10 Jun-10 Sep-10 Dec-10 Mar-11 Jun-11 Sep-11 Dec-11 Change yoy(bps)
Sales 152,123 156,979 165,821 168,496 178,561 183,754 205,275 202,875 221,436 224,924 240,658 17 Gross profit 77,686 81,372 86,019 85,331 91,902 95,252 102,010 98,911 104,612 109,288 119,262 17 EBITDA 31,590 33,295 35,530 32,593 36,028 37,632 40,279 37,041 41,605 44,181 48,146 20 PBT 30,616 32,779 35,710 31,885 35,238 38,529 41,386 37,366 42,082 45,789 49,928 21 PAT 21,963 23,582 25,743 23,145 25,290 27,917 29,698 26,952 29,949 32,917 36,007 21 Effective tax rate (%) 28 28 28 27 28 28 28 28 29 28 28
Change yoyMargins (%) (bps)Gross profit 51.1 51.8 51.9 50.6 51.5 51.8 49.7 48.8 47.2 48.6 49.6 (14) EBITDA 20.8 21.2 21.4 19.3 20.2 20.5 19.6 18.3 18.8 19.6 20.0 38 PBT 20.1 20.9 21.5 18.9 19.7 21.0 20.2 18.4 19.0 20.4 20.7 59 PAT 14.4 15.0 15.5 13.7 14.2 15.2 14.5 13.3 13.5 14.6 15.0 49
Growth (%)Sales 17.4 17.1 23.8 20.4 24.0 22.4 17.2Gross profit 18.3 17.1 18.6 15.9 13.8 14.7 16.9EBITDA 14.1 13.0 13.4 13.6 15.5 17.4 19.5PBT 15.1 17.5 15.9 17.2 19.4 18.8 20.6PAT 15.2 18.4 15.4 16.4 18.4 17.9 21.2
Source: Kotak Institutional Equities
Sales growth driven by a mix of pricing and volume growth; gross margin pressure: adspend cuts help to manage margins Key financials of staple consumer companies under our coverage
Rs mn Jun-09 Sep-09 Dec-09 Mar-10 Jun-10 Sep-10 Dec-10 Mar-11 Jun-11 Sep-11 Dec-11 Change yoy(%)
Sales 72,858 71,395 74,890 71,638 81,527 81,785 87,407 85,654 96,277 98,271 104,875 20 Gross profit 36,102 35,959 38,632 36,859 40,767 40,993 43,303 41,057 43,787 46,135 51,151 18 EBITDA 11,896 11,175 12,492 10,577 11,882 11,683 11,951 11,639 12,656 14,096 16,091 35 PBT 11,873 11,900 13,017 11,258 12,422 13,029 13,364 12,208 13,549 15,378 17,434 30 PAT 9,427 9,381 10,283 8,849 9,675 10,410 10,549 9,485 10,258 11,974 13,624 29
Change yoyMargins (%) (bps)Gross profit 49.6 50.4 51.6 51.5 50.0 50.1 49.5 47.9 45.5 46.9 48.8 (77) EBITDA 16.3 15.7 16.7 14.8 14.6 14.3 13.7 13.6 13.1 14.3 15.3 167 PBT 16.3 16.7 17.4 15.7 15.2 15.9 15.3 14.3 14.1 15.6 16.6 133 PAT 12.9 13.1 13.7 12.4 11.9 12.7 12.1 11.1 10.7 12.2 13.0 92
Growth (%)Sales 11.9 14.6 16.7 19.6 18.1 20.2 20.0Gross profit 12.9 14.0 12.1 11.4 7.4 12.5 18.1EBITDA -0.1 4.5 -4.3 10.0 6.5 20.7 34.6PBT 4.6 9.5 2.7 8.4 9.1 18.0 30.5PAT 2.6 11.0 2.6 7.2 6.0 15.0 29.1
Note: Includes Colgate, Dabur, Godrej Consumer, HUL, Jyothy, Marico, Tata Global Beverages
Source: Kotak Institutional Equities estimates

India Consumer products
98 KOTAK INSTITUTIONAL EQUITIES RESEARCH
Sales growth primarily driven by pricing growth; step up in adspends keeps margins muted Key financials of discretionary consumer companies under our coverage
Rs mn Jun-09 Sep-09 Dec-09 Mar-10 Jun-10 Sep-10 Dec-10 Mar-11 Jun-11 Sep-11 Dec-11 Change yoy(%)
Sales 79,265 85,585 90,931 96,859 97,034 101,968 117,868 117,221 125,159 126,652 135,783 15 Gross profit 41,584 45,414 47,387 48,472 51,134 54,259 58,706 57,854 60,826 63,153 68,110 16 EBITDA 19,694 22,120 23,037 22,016 24,146 25,950 28,328 25,402 28,949 30,085 32,055 13 PBT 18,743 20,879 22,694 20,628 22,816 25,501 28,022 25,158 28,533 30,411 32,494 16 PAT 12,535 14,201 15,459 14,297 15,615 17,507 19,149 17,467 19,690 20,942 22,383 17
Change yoyMargins (%) (bps)Gross profit 52.5 53.1 52.1 50.0 52.7 53.2 49.8 49.4 48.6 49.9 50.2 35 EBITDA 24.8 25.8 25.3 22.7 24.9 25.4 24.0 21.7 23.1 23.8 23.6 (43) PBT 23.6 24.4 25.0 21.3 23.5 25.0 23.8 21.5 22.8 24.0 23.9 16 PAT 15.8 16.6 17.0 14.8 16.1 17.2 16.2 14.9 15.7 16.5 16.5 24
Growth (%)Sales 22.4 19.1 29.6 21.0 29.0 24.2 15.2Gross profit 23.0 19.5 23.9 19.4 19.0 16.4 16.0EBITDA 22.6 17.3 23.0 15.4 19.9 15.9 13.2PBT 21.7 22.1 23.5 22.0 25.1 19.3 16.0PAT 24.6 23.3 23.9 22.2 26.1 19.6 16.9
Note: Includes Asian Paints, GSK Consumer, ITC, Jubilant Foodworks, Titan, UNSP
Source: Kotak Institutional Equities estimates
Company-wise sales growth, (%)
Company Mar-09 Jun-09 Sep-09 Dec-09 Mar-10 Jun-10 Sep-10 Dec-10 Mar-11 Jun-11 Sep-11 Dec-11Asian Paints 26 17 19 27 18 28 6 37 24 29 25 20Colgate 16 15 18 17 13 13 13 14 13 16 19 20Dabur 21 27 23 19 16 19 15 17 31 31 30 35Godrej Consumer 30 22 27 16 2 53 86 102 128 20 24 20GSK Consumer 31 25 17 26 20 14 24 21 9 22 18 19Hindustan Unilever 6 8 5 13 8 7 11 12 14 15 18 16ITC 0 5 16 20 28 18 16 18 15 20 18 14Jubilant Foodworks NA NA NA 50 68 59 67 58 56 60 47 49Jyothy NA 21 49 14 31 27 11 10 -18 -19 7 12Marico 21 17 14 8 6 13 12 22 24 33 26 29Tata Global Beverages 27 34 32 18 17 8 4 5 5 13 13 11Titan 7 9 5 30 49 42 34 47 36 61 36 25United Spirits 20 23 20 31 38 18 25 46 28 32 32 0
Source: Kotak Institutional Equities
Company-wise volume growth, (%)
Company Mar-09 Jun-09 Sep-09 Dec-09 Mar-10 Jun-10 Sep-10 Dec-10 Mar-11 Jun-11 Sep-11 Dec-11Asian Paints 20 15 19 23 18 19 (2) 30 12 11 8 5-8Colgate (toothpaste) 15 14 18 13 11 14 12 12 11 14 15 15 Dabur 14 16 14 14 13 17 12 10 9 9 10 10 Godrej Consumer - Domestic soaps 30 20 20 10 (8) (8) (10) 6 11 14 19 19 - Domestic hair colour 10 10 20 9 5 3 12 (1) 8 13 7 5 GSK Consumer 15 12 12 16 13 10 19 12 5 16 15 12 Hindustan Unilever (5) 2 1 5 11 11 14 13 14 8 9 9 ITC (3) 5 8 8 10 (3) - 2 (2) 7 9 5 Jyothy - Ujala NA NA 2 (2) 18 35 4 (7) (22) - 3 10 - Maxo NA 10 30 17 34 18 (9) (22) (42) - 2 (16) Marico - Parachute 7 14 10 8 10 14 10 5 5 10 10 13 - Saffola 5 13 22 18 13 18 18 13 14 15 11 15 Titan (jewelry) 4 33 13 4 45 33 13 25 15 35 3 (5)
Source: Kotak Institutional Equities

Consumer products India
KOTAK INSTITUTIONAL EQUITIES RESEARCH 99
Company-wise gross margins, (%)
Company Mar-09 Jun-09 Sep-09 Dec-09 Mar-10 Jun-10 Sep-10 Dec-10 Mar-11 Jun-11 Sep-11 Dec-11 Change yoy (bps)Asian Paints 39.3 45.6 44.2 44.4 44.3 43.5 44.7 40.5 41.1 40.2 40.8 40.6 13 Colgate 56.0 56.2 57.4 57.2 70.1 62.8 60.1 61.3 58.9 59.6 59.9 60.4 (90) Dabur 53.2 52.8 55.0 54.4 54.7 52.6 52.9 51.6 55.9 47.8 50.0 49.0 (253) Godrej Consumer 47.7 55.1 52.8 55.9 59.4 49.5 52.1 53.2 47.0 48.1 49.0 52.5 (67) GSK Consumer 60.3 63.3 62.3 66.2 60.5 62.3 62.8 64.9 61.9 59.4 62.1 64.4 (44) Hindustan Unilever 47.8 48.4 49.3 51.1 48.6 49.0 49.1 48.9 45.7 44.1 45.7 47.5 (143) ITC 62.7 60.3 63.3 63.2 57.3 62.8 63.4 62.9 57.9 60.1 61.2 64.9 205 Jubilant Foodworks 73.9 75.7 75.3 75.3 74.8 75.5 75.2 74.5 74.4 74.5 73.6 74.6 10 Jyothy 44.1 55.3 43.0 46.8 40.4 51.2 47.9 46.7 46.5 48.3 41.9 47.8 110 Marico 49.6 49.5 52.7 52.5 56.1 49.0 50.0 47.3 47.0 43.3 45.3 48.5 114 Tata Global Beverages 46.0 42.8 40.4 42.0 43.8 42.8 40.7 37.7 41.0 38.1 38.1 43.3 563 Titan 30.7 31.8 26.2 23.8 25.0 26.5 27.4 24.5 27.2 25.3 25.6 23.5 (106) United Spirits 46.0 42.2 45.4 43.4 45.1 45.4 46.7 41.0 42.4 40.3 41.7 39.1 (184)
Source: Kotak Institutional Equities
Adspends moderation may not be the solution to support earnings growth Company wise adspends as % of sales, (%)
Company Mar-09 Jun-09 Sep-09 Dec-09 Mar-10 Jun-10 Sep-10 Dec-10 Mar-11 Jun-11 Sep-11 Dec-11 Change yoy(bps)
Colgate 15.4 12.5 16.9 15.3 16.1 13.1 14.3 21.6 13.8 16.2 17.4 16.1 (555) Dabur 13.2 16.0 14.2 14.6 13.6 16.4 12.5 12.5 11.5 12.6 10.1 13.6 115 Godrej Consumer 4.1 8.5 6.8 7.1 10.0 9.3 8.4 9.3 6.2 10.5 7.4 7.7 (159) GSK Consumer 11.2 15.9 16.3 20.6 15.2 14.0 17.6 17.6 14.6 15.3 16.6 19.0 135 Hindustan Unilever 11.3 12.5 13.5 14.1 14.5 15.7 13.8 14.8 12.7 11.5 11.8 11.8 (299) Jyothy 3.6 6.2 4.9 8.1 6.4 6.3 11.9 10.3 7.5 7.5 10.9 4.0 (637) Marico 9.6 12.1 13.4 12.7 14.8 11.9 12.2 11.0 9.0 9.8 9.7 12.7 164 Titan 4.2 5.0 4.5 4.5 4.2 5.0 4.0 4.6 5.0 4.5 4.3 4.9 37 United Spirits 8.8 7.1 7.7 8.9 12.0 9.5 11.5 9.9 11.1 7.8 9.4 11.1 119
Source: Kotak Institutional Equities
Freight costs, adspends keep other expenditure high Company-wise other expenditure as % of sales, (%)
Company Mar-09 Jun-09 Sep-09 Dec-09 Mar-10 Jun-10 Sep-10 Dec-10 Mar-11 Jun-11 Sep-11 Dec-11Asian Paints 19 19 20 19 22 18 20 19 21 17 21 19Colgate 14 13 13 13 22 15 16 17 16 16 16 17Dabur 14 14 12 13 13 13 12 12 18 13 13 13Godrej Consumer 17 18 14 16 21 16 18 19 18 18 20 20GSK Consumer 18 20 20 26 17 21 20 24 18 19 20 25Hindustan Unilever 17 15 16 16 16 16 18 17 16 15 15 16ITC 25 21 22 22 22 22 23 21 22 21 21 23Jubilant Foodworks 27 32 30 32 31 30 29 29 29 29 28 30Jyothy 11 11 12 12 9 11 13 13 17 16 13 14Marico 19 16 16 16 20 16 16 16 19 15 16 17Tata Global Beverages 31 22 28 28 28 26 28 28 30 23 26 27Titan 12 11 7 6 7 6 7 6 8 7 7 5United Spirits 14 12 14 13 13 11 13 12 12 10 12 12
Source: Kotak Institutional Equities

India Consumer products
100 KOTAK INSTITUTIONAL EQUITIES RESEARCH
Company-wise effective tax rate, (%)
Company Mar-09 Jun-09 Sep-09 Dec-09 Mar-10 Jun-10 Sep-10 Dec-10 Mar-11 Jun-11 Sep-11 Dec-11Asian Paints 34.0 32.2 34.5 32.0 30.8 31.5 31.6 29.9 30.7 30.3 29.1 29.9Colgate 13.7 17.8 19.4 13.6 0.8 22.3 22.1 27.4 20.2 27.3 21.3 22.2Dabur 9.1 17.4 16.9 16.5 16.2 19.7 18.2 18.8 22.0 20.1 19.7 16.4Godrej Consumer 13.4 17.4 15.4 18.1 17.6 27.9 20.6 20.1 20.5 47.3 20.1 20.2GSK Consumer 36.6 35.7 32.1 28.8 34.4 33.3 33.3 33.3 34.0 32.6 32.6 39.3Hindustan Unilever 12.4 20.3 23.4 23.3 26.4 22.1 20.1 21.3 20.4 22.7 22.9 23.3ITC 32.1 33.3 32.3 32.7 31.7 31.8 31.9 31.6 30.2 31.2 31.6 31.3Jubilant Foodworks 6.4 6.8 -3.1 0.5 0.1 18.3 19.7 24.4 24.7 31.7 31.1 31.4Jyothy 19.8 25.2 18.8 12.8 23.0 21.0 14.0 21.4 5.8 19.5 26.3 14.5Marico 0.2 24.5 13.7 19.7 16.3 16.2 13.4 14.2 81.8 19.6 20.4 17.1Tata Global 29.0 30.7 33.0 27.2 35.4 28.5 32.0 27.5 -10.9 11.6 26.9 28.4Titan 10.8 27.8 20.3 20.3 12.4 25.2 25.2 29.6 30.0 27.1 27.0 27.1United Spirits 35.8 34.4 33.6 32.9 29.0 33.4 31.8 38.0 32.4 32.9 32.0 32.0
Source: Kotak Institutional Equities

Consumer products India
KOTAK INSTITUTIONAL EQUITIES RESEARCH 101
Summary of ratings and target prices
Asian PaintsNew 94.4 106.9 2,500 SELLOld 94.4 106.9 2,500 SELLChange (%) - - - ColgateNew 32.5 39.1 900 SELLOld 32.5 39.1 900 SELLChange (%) - - - DaburNew 3.7 4.4 115 ADDOld 3.7 4.4 105 ADDChange (%) - - 9.5Godrej ConsumerNew 16.8 21.8 500 ADDOld 16.8 21.8 460 ADDChange (%) - - 8.7GSK ConsumerNew 84.5 105.4 3,000 ADDOld 84.5 105.4 3,000 ADDChange (%) - - - Hindustan UnileverNew 11.8 14.2 420 REDUCEOld 11.8 14.2 420 REDUCEChange (%) - - - ITCNew 7.9 9.0 230 ADDOld 7.9 9.0 230 ADDChange (%) - - - Jubilant FoodworksNew 16.3 24.0 800 SELLOld 16.3 24.0 800 SELLChange (%) - - - Jyothy LaboratoriesNew 8.4 10.8 190 ADDOld 8.4 10.8 190 ADDChange (%) - - - MaricoNew 5.2 6.8 190 BUYOld 5.0 6.5 175 BUYChange (%) 4.0 4.6 8.6NestleNew 106.6 125.0 3600 SELLOld 106.6 125.0 3600 SELLChange (%) - - - Tata Global BeveragesNew 5.3 6.6 110 BUYOld 5.3 6.6 110 BUYChange (%) - - - TitanNew 6.5 7.9 230 ADDOld 6.5 7.9 210 ADDChange (%) - - 9.5United SpiritsNew 36.6 42.7 900 BUYOld 36.6 42.7 900 BUYChange (%) - - -
Source: Kotak Institutional Equities

India Consumer products
102 KOTAK INSTITUTIONAL EQUITIES RESEARCH
Summary valuation table
10-Feb-12 O/S shares EPS Grth, % TP
Company Price (Rs) Rating (Rs m) (US$ m) (mn) 2011 2012E 2013E 2011 2012E 2013E 2011 2012E 2013E (2011-2013) (Rs)
Consumer ProductsAsian Paints 3,099 SELL 297,299 5,991 96 80.8 94.4 106.9 13.0 16.8 13.3 38.4 32.8 29.0 15.0 2,500
Colgate-Palmolive (India) 1,025 SELL 139,386 2,809 136 29.6 32.5 39.1 (4.9) 9.9 20.3 34.6 31.5 26.2 15.0 900 Dabur India 103 ADD 179,346 3,614 1,740 3.3 3.7 4.4 12.8 12.1 19.2 31.5 28.1 23.6 15.6 115 GlaxoSmithKline Consumer (a) 2,639 ADD 110,982 2,236 42 71.3 84.5 105.4 28.8 18.5 24.8 37.0 31.2 25.0 21.6 3,000 Godrej Consumer Products 446 ADD 144,240 2,907 324 14.9 16.8 21.8 31.3 13.1 29.8 30.0 26.5 20.4 21.1 500
Hindustan Unilever 387 REDUCE 836,566 16,858 2,159 9.9 11.8 14.2 4.8 19.7 19.7 39.2 32.8 27.4 19.7 420 ITC 204 ADD 1,565,321 31,543 7,681 6.4 7.9 9.0 20.7 22.5 14.1 31.8 26.0 22.7 18.2 230 Jubilant Foodworks 1,000 SELL 65,626 1,322 66 11.2 16.3 24.0 99.6 45.4 47.3 89.3 61.4 41.7 46.3 800
Jyothy Laboratories 175 ADD 13,612 274 78 10.3 8.4 10.8 (6.2) (18.8) 28.0 17.0 20.9 16.3 1.9 190 Marico 163 BUY 100,156 2,018 615 3.9 5.2 6.8 (12.8) 33.5 31.7 42.0 31.4 23.9 32.6 190 Nestle India (a) 4,285 SELL 413,170 8,326 96 86.8 106.6 125.0 16.7 22.8 17.3 49.4 40.2 34.3 20.0 3,600 Tata Global Beverages 119 BUY 73,559 1,482 618 4.0 5.3 6.6 (34.6) 35.1 23.0 30.0 22.2 18.1 28.9 110 Titan Industries 207 ADD 183,727 3,702 888 4.9 6.5 7.9 71.7 32.5 20.7 42.1 31.8 26.3 26.5 230 United Spirits 670 BUY 84,186 1,696 126 35.3 36.6 42.7 29.5 3.5 16.9 19.0 18.3 15.7 10.0 900 KS universe 4,207,176 84,779 16.3 19.5 18.0 35.0 29.3 24.8
Company 2011 2012E 2013E 2011 2012E 2013E 2011 2012E 2013E 2012E 2013E
Asian Paints 25.6 22.3 18.0 14.5 11.1 9.1 4.6 3.7 3.2 0.9 1.1 Colgate-Palmolive (India) 30.2 27.1 21.8 36.3 36.9 29.4 6.1 5.2 4.4 2.8 2.7 Dabur India 25.4 21.5 18.4 13.7 10.6 8.4 4.6 3.5 3.0 1.3 1.5
GlaxoSmithKline Consumer (a) 26.9 23.6 19.3 11.9 10.1 8.3 4.4 3.7 3.2 1.3 1.7 Godrej Consumer Products 25.3 20.2 15.1 8.4 6.3 5.1 4.5 3.5 2.6 0.7 0.7 Hindustan Unilever 33.6 26.9 21.4 31.8 27.3 23.4 4.1 3.5 2.9 2.5 3.0
ITC 21.1 17.7 15.3 9.3 8.1 7.0 7.1 6.1 5.2 1.8 2.2 Jubilant Foodworks 54.7 34.1 23.4 34.2 22.0 14.4 9.7 6.4 4.5 — —Jyothy Laboratories 13.4 31.9 23.8 2.0 2.0 1.9 1.8 2.4 2.1 2.7 3.3 Marico 25.7 22.2 16.9 10.7 8.3 6.5 3.4 2.6 2.3 0.4 0.6
Nestle India (a) 32.9 26.6 22.2 48.3 34.2 25.5 6.6 5.4 4.5 1.4 1.6 Tata Global Beverages 12.5 12.1 9.8 1.4 1.4 1.3 1.2 1.1 0.9 1.5 1.8 Titan Industries 29.4 22.2 17.9 17.7 13.4 10.4 2.7 2.1 1.7 1.1 1.4
United Spirits 13.6 11.5 10.5 2.0 1.8 1.7 2.0 1.8 1.7 0.4 0.5 KS universe 24.5 20.5 17.1 10.8 9.3 8.0 4.6 3.9 3.3 1.7 2.0
Note:
(a) 2011 means calendar year 2010, similarly for 2012 and 2013 for these particular companies.
EV/EBITDA (X) Price/BV (X) EV/Sales (X) Dividend Yield (%)
Mkt cap. EPS (Rs) EPS Growth, % PER (X)
Source: Kotak Institutional Equities estimates

For Private Circulation Only.
Manufacturing continues to remain weak; mining sector shows some pick-up
Industrial production was back to the weak zone with December IIP growth coming in at 1.8% on the back of manufacturing sector growing at 1.8% (November at 6.6%). But this was on expected lines given our anticipation of a weaker-than-normal December post the production levels in November. The base effect from December 2010 was also strong and hence also accounted for a lower yoy growth in December 2011. The internals of the manufacturing sector indicate segments like “machinery and equipment”, “electrical machinery”, “textiles”, etc. experiencing contraction on a yoy basis. The mining sector continued to see contraction at (-)3.7% (though on a mom basis it showed a 6.4% growth). Electricity grew at 9.1% compared to 14.6% growth in November.
Capital goods sector pulling down industrial production
From a use-based perspective, capitals goods production was a major disappointment at (-)16.5%—the fourth consecutive month of contraction. This strongly signals a slowdown in the investment demand as the economy grapples with demand moderation and high interest rates. Ex-capital goods, the IIP growth appears much better at 4.4%. Along with that, demand from abroad is also likely to remain weak given the global growth moderation. Intermediate goods production also contracted at 2.8% while basic goods production grew at 4%. Consumer durables grew at a modest 5.3% against 11.5% in December (on a mom basis it contracted by 0.8%). Consumer non-durables growth remained strong at 13.4%.
Indicators point to bottoming out in near term; RBI action on April 17
A variety of indicators such as the PMI manufacturing, the core sector growth and also a bounce-up in the credit growth probably indicates that the worst has already been seen with respect to the IIP growth numbers. For instance, as of the current understanding, we project the IIP growth for January 2012 at 2.1% with the average for the fourth quarter at 1.7%, slightly higher than the average of 1.0% seen in the third quarter. However, this is not to indicate that the rebound would be very strong as the headwinds from the global environment as also the domestic environment are likely to continue. While we do not expect any V-shaped recovery as was seen in the post-Lehman phase, the key to a sustained recovery could be some strong policy actions from the government post the ongoing state elections, a clear direction to fiscal containment and some stability in the global environment.
From the monetary policy side, we continue to expect RBI to start its repo rate cutting cycle by 25 bps on April 17. However, we do not anticipate an aggressive increase in monetary accommodation as risks to inflation continue to remain strong (our base case is for a 100 bps cut in the repo rate in FY2013E). Brent crude oil is again at US$117 a barrel and USD/INR is again on a depreciating path. RBI, on the other hand, has already signaled that containing inflation would be difficult without help from the fiscal side. Hence, we expect that it would wait for the Union Budget on March 16 before starting to ease monetary policy.
Economy.dot
Economy Industrial Production
IIP growth likely to be near the bottom. The December IIP growth of 1.8% was much lower than market consensus (Kotak: 1.8%). While this outturn is weak, there has likely been some destocking this month given the stronger-than-anticipated November growth. Capital goods production continued to remain weak, supporting the fact that investment demand has slowed significantly. Based on our expectation of the trend going forward, we believe that industrial production has largely bottomed out. However, it is unlikely to bounce back strongly as headwinds from both the domestic and global factors continue. We reiterate our view of a 6.6% FY2013E GDP growth and point to a 25 bps repo rate cut on April 17.
INDIA
FEBRUARY 10, 2012
UPDATE
BSE-30: 17,749
QUICK NUMBERS
• December IIP growth at 1.8%
• Manufacturing sector grows by 1.8%; capital goods sector contracts by 16.5%
• RBI likely to cut repo rate by 25 bps on April 17

India Economy
104 KOTAK ECONOMIC RESEARCH
Exhibit 1: December IIP growth at 1.8% Sectoral classification of IIP growth, March fiscal year-ends, 2010-12 (%)
2010 2011 2012 2010 2011 2012 2010 2011 2012 2010 2011 2012Weights (%)April 3.1 9.2 1.6 (3.6) 14.5 5.7 7.1 6.5 6.5 (1.9) 13.0 5.3 May 3.2 7.8 1.8 (2.9) 8.9 6.3 3.2 6.2 10.3 (1.6) 8.5 6.2 June 13.0 7.0 (1.4) (4.5) 7.9 11.2 7.9 3.6 7.9 (1.8) 7.5 9.5 July 7.6 8.7 0.6 0.6 10.8 3.1 4.2 3.7 13.1 1.7 10.1 3.7 August 9.0 5.9 (5.5) 4.3 4.6 3.9 10.6 1.0 9.5 5.3 4.5 3.4 September 5.0 4.3 (7.6) 0.6 6.8 3.1 7.5 1.8 9.0 1.6 6.2 2.5 October 7.1 6.1 (6.1) 1.6 12.4 (5.7) 4.0 8.8 5.6 2.3 11.4 (4.7) November 7.9 6.9 (4.1) 6.6 6.5 6.6 1.8 4.6 14.6 6.3 6.4 5.9 December 7.6 5.9 (3.7) 10.2 8.7 1.8 5.5 5.9 9.1 9.5 8.1 1.8 January 11.6 1.7 14.5 8.1 5.5 10.5 13.3 7.5 February 8.2 1.1 15.3 7.5 7.3 6.8 13.7 6.7 March 11.1 0.3 16.3 11.0 8.3 7.2 15.0 9.4 April-December (FYTD) 7.0 6.9 (2.7) 1.4 9.0 3.9 5.7 4.7 9.4 2.4 8.3 3.6
Mining (%)
10.5 79.4
Manufacturing (%) Electricity (%) General (%)
10.2 100.0
Source: CEIC, Kotak Economic Research
Exhibit 2:Capital goods deceleration contributes to the moderation in December Use-based classification of IIP growth, March fiscal year-ends, 2010-12 (%)
2010 2011 2012 2010 2011 2012 2010 2011 2012 2010 2011 2012 2010 2011 2012 2010 2011 2012Weights (%)April 1.1 6.7 7.2 (14.2) 35.5 6.6 (0.9) 11.8 3.9 (1.2) 13.8 3.2 9.3 23.3 1.6 (7.7) 6.7 4.6 May 1.6 3.4 7.5 (9.9) 15.8 6.2 (1.6) 11.7 0.1 (2.4) 7.4 7.2 0.9 14.7 5.1 (4.8) 1.9 9.0 June 7.2 3.9 7.8 (23.2) 3.7 38.7 (0.7) 8.6 1.6 (1.1) 13.3 3.1 1.1 21.3 1.6 (2.6) 7.5 4.4 July 3.4 4.5 10.0 (15.3) 40.7 (13.7) 0.6 8.5 (0.1) 8.0 5.7 6.4 12.7 14.8 9.0 4.7 (0.9) 4.1 August 4.7 3.8 5.8 (1.0) 4.7 4.0 7.3 5.9 (1.0) 8.5 4.6 2.1 9.8 8.1 5.5 7.4 1.8 (0.7) September 2.1 3.5 5.3 (2.7) 7.2 (6.5) 6.6 4.6 (1.4) 1.4 9.6 5.7 5.6 14.2 8.9 (1.9) 5.9 2.7 October 3.0 9.8 1.4 (4.3) 21.0 (26.5) 6.1 9.7 (7.8) 3.4 9.4 0.2 7.2 14.3 (0.2) 0.4 5.1 0.7 November 6.0 5.7 6.4 (8.1) 25.7 (4.3) 8.0 4.3 0.2 12.8 0.7 13.0 30.6 7.2 11.5 2.0 (4.4) 14.4 December 5.8 7.8 4.0 4.9 20.2 (16.5) 12.4 8.1 (2.8) 15.1 3.6 10.0 46.5 7.8 5.3 0.2 0.6 13.4 January 8.8 7.7 14.3 5.4 14.2 7.4 18.6 8.3 57.4 12.5 - 5.0 February 5.6 5.6 39.4 (5.7) 10.3 6.3 16.6 13.4 28.9 18.2 8.7 9.7 March 7.3 6.5 48.6 14.5 10.9 3.1 12.6 13.3 13.0 14.9 12.4 11.9 April-December (FYTD) 3.9 5.8 6.1 (8.2) 18.4 (2.9) 4.0 8.1 (0.9) 4.9 7.4 5.7 12.6 13.8 5.3 (0.4) 2.5 6.0
15.7 29.8
Intermediate goods Consumer goodsBasic goods Capital goods
45.7 8.8
Consumer durablesConsumer non-
durables
8.5 21.3
Source: CEIC, Kotak Economic Research

Economy
KOTAK ECONOMIC RESEARCH 105
Exhibit 3: IIP growth shows some sign of stabilization Trends in IIP growth and IIP-ex capital goods production growth (4M MA, %)
(10)
(5)
0
5
10
15
20
Dec
-06
Mar
-07
Jun-
07
Sep-
07
Dec
-07
Mar
-08
Jun-
08
Sep-
08
Dec
-08
Mar
-09
Jun-
09
Sep-
09
Dec
-09
Mar
-10
Jun-
10
Sep-
10
Dec
-10
Mar
-11
Jun-
11
Sep-
11
Dec
-11
IIP growth (4M MA) IIP-ex capital goods (4M MA)
Source: CEIC, Kotak Economic Research
Exhibit 4: PMI manufacturing growth suggests an uptrend is likely for IIP growth Trends in PMI manufacturing (X, LHS) and IIP growth (%, RHS)
42
47
52
57
62
May
-07
Sep-
07
Jan-
08
May
-08
Sep-
08
Jan-
09
May
-09
Sep-
09
Jan-
10
May
-10
Sep-
10
Jan-
11
May
-11
Sep-
11
Jan-
12
(8)
(4)
0
4
8
12
16
20PMI Manufacturing (LHS) IIP (%, RHS)
Source: Bloomberg, CEIC, Kotak Economic Research

India Economy
106 KOTAK ECONOMIC RESEARCH
Exhibit 5: Industrial production tracking the recovery in core sector Trends in core industry growth and industrial production growth (%)
(10)
(5)
0
5
10
15
20
25
Dec
-06
Mar
-07
Jun-
07
Sep-
07
Dec
-07
Mar
-08
Jun-
08
Sep-
08
Dec
-08
Mar
-09
Jun-
09
Sep-
09
Dec
-09
Mar
-10
Jun-
10
Sep-
10
Dec
-10
Mar
-11
Jun-
11
Sep-
11
Dec
-11
Core Industry growth (3m MA) IIP (3m MA)
Source: CEIC, Kotak Economic Research

In
dia D
aily Sum
mary - Feb
ruary 13, 2012
107
KOTAK IN
STITUTIO
NAL EQ
UITIES RESEARCH
December 2011: Results calendar
Mon Tue Wed Thu Fri Sat6-Feb 7-Feb 8-Feb 9-Feb 10-Feb 11-FebAdani Port & SEZ AIA Engineering Bharat Forge ACC Apollo Hospital Enterprises Bajaj HindustanAdani Power Bajaj Corp Bharti Airtel Adani Enterprises Aurobindo Pharma Oil IndiaBGR Energy Systems Cadila Healthcare Essar Shipping Ambuja Cement BPCLDena Bank Career Point JSW Ispat Anant Raj Industries DLFGlaxosmithkline Consumers GMR Infra Jubilant Foodworks Apollo Tyres Essar OilHindustan Unilever IL&FS Transporation Kalpataru Power Cummins Gammon InfraJubilant Life Sciences JM Financial ONGC Dishman Pharmaceuticals GE ShippingMOIL Mahindra & Mahindra Power Grid Fortis Healthcare Hotel Leela VenturesNALCO Tech Mahindra Gammon India JSW SteelNCC GSPL Keynote Corporate Services
GTL Infra MTNLHindalco Industries Pantaloon RetailHPCL Puravankara ProjectsIndiabulls Securities Reliance CapitalJindal Saw Reliance CommunicationsJindal Stainless Religare EnterprisesMoser Baer Shriram TransportMRF Tata ChemicalsNDTV Tata Power
13-Feb 14-Feb 15-FebCastrol India Alok IndustriesCipla Educomp SolutionsCoal India Great OffshoreEngineers India GVKPILGujarat NRE Coke HDILLanco Infratech IVRCLReliance Power Jain IrrigationSAIL Jaiprakash AssociatesShree Renuka Sugar Max IndiaSun Pharma Reliance Infrastructure
Tata MotorsSunteck Realty Shipping Corp of India
Tecpro SystemsUnitechVishal RetailVoltas
Source: BSE, NSE, Kotak Institutional Equities
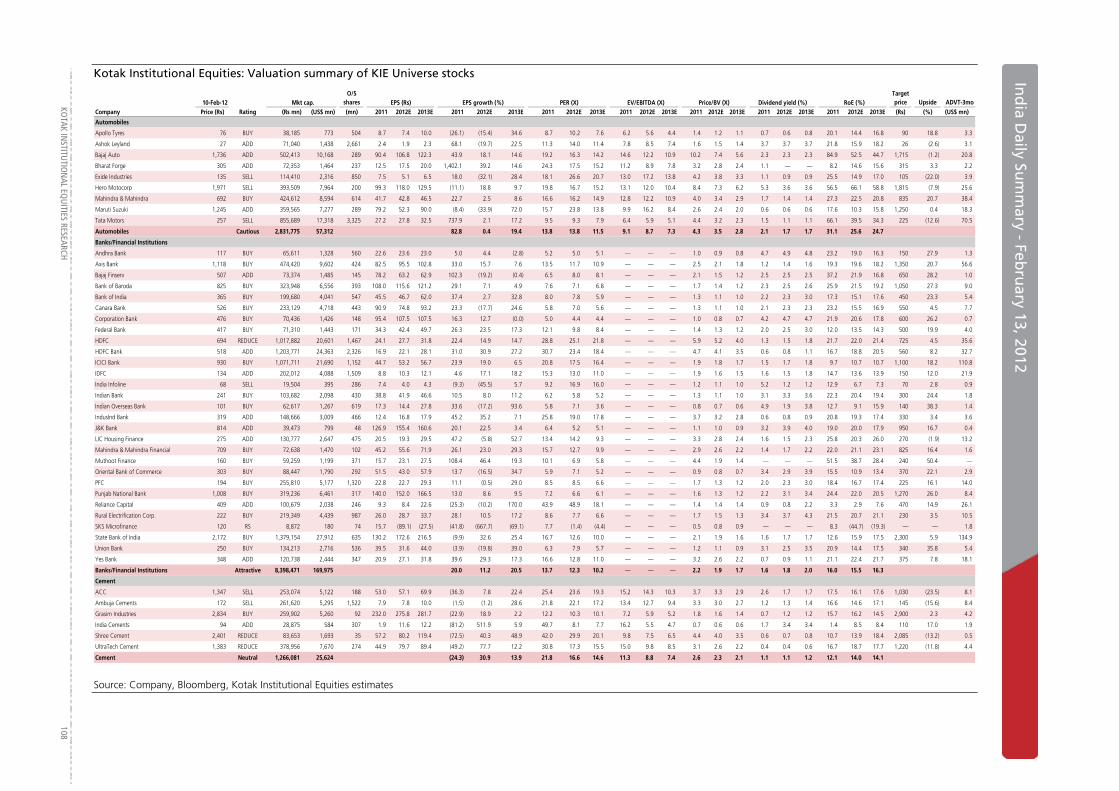
KO
TAK INSTITUTIO
NAL EQ
UITIES RESEARCH 108
In
dia D
aily Sum
mary - Feb
ruary 1
Ind
ia Daily Su
mm
ary - Febru
ary 13, 2012
Kotak Institutional Equities: Valuation summary of KIE Universe stocks
10-Feb-12 Mkt cap.O/S
shares EPS (Rs) EPS growth (%) PER (X) EV/EBITDA (X) RoE (%)Target price Upside ADVT-3mo
Company Price (Rs) Rating (Rs mn) (US$ mn) (mn) 2011 2012E 2013E 2011 2012E 2013E 2011 2012E 2013E 2011 2012E 2013E 2011 2012E 2013E 2011 2012E 2013E 2011 2012E 2013E (Rs) (%) (US$ mn)
Automobiles
Apollo Tyres 76 BUY 38,185 773 504 8.7 7.4 10.0 (26.1) (15.4) 34.6 8.7 10.2 7.6 6.2 5.6 4.4 1.4 1.2 1.1 0.7 0.6 0.8 20.1 14.4 16.8 90 18.8 3.3
Ashok Leyland 27 ADD 71,040 1,438 2,661 2.4 1.9 2.3 68.1 (19.7) 22.5 11.3 14.0 11.4 7.8 8.5 7.4 1.6 1.5 1.4 3.7 3.7 3.7 21.8 15.9 18.2 26 (2.6) 3.1
Bajaj Auto 1,736 ADD 502,413 10,168 289 90.4 106.8 122.3 43.9 18.1 14.6 19.2 16.3 14.2 14.6 12.2 10.9 10.2 7.4 5.6 2.3 2.3 2.3 84.9 52.5 44.7 1,715 (1.2) 20.8
Bharat Forge 305 ADD 72,353 1,464 237 12.5 17.5 20.0 1,402.1 39.2 14.6 24.3 17.5 15.2 11.2 8.9 7.8 3.2 2.8 2.4 1.1 — — 8.2 14.6 15.6 315 3.3 2.2
Exide Industries 135 SELL 114,410 2,316 850 7.5 5.1 6.5 18.0 (32.1) 28.4 18.1 26.6 20.7 13.0 17.2 13.8 4.2 3.8 3.3 1.1 0.9 0.9 25.5 14.9 17.0 105 (22.0) 3.9
Hero Motocorp 1,971 SELL 393,509 7,964 200 99.3 118.0 129.5 (11.1) 18.8 9.7 19.8 16.7 15.2 13.1 12.0 10.4 8.4 7.3 6.2 5.3 3.6 3.6 56.5 66.1 58.8 1,815 (7.9) 25.6
Mahindra & Mahindra 692 BUY 424,612 8,594 614 41.7 42.8 46.5 22.7 2.5 8.6 16.6 16.2 14.9 12.8 12.2 10.9 4.0 3.4 2.9 1.7 1.4 1.4 27.3 22.5 20.8 835 20.7 38.4
Maruti Suzuki 1,245 ADD 359,565 7,277 289 79.2 52.3 90.0 (8.4) (33.9) 72.0 15.7 23.8 13.8 9.9 16.2 8.4 2.6 2.4 2.0 0.6 0.6 0.6 17.6 10.3 15.8 1,250 0.4 18.3
Tata Motors 257 SELL 855,689 17,318 3,325 27.2 27.8 32.5 737.9 2.1 17.2 9.5 9.3 7.9 6.4 5.9 5.1 4.4 3.2 2.3 1.5 1.1 1.1 66.1 39.5 34.3 225 (12.6) 70.5
Automobiles Cautious 2,831,775 57,312 82.8 0.4 19.4 13.8 13.8 11.5 9.1 8.7 7.3 4.3 3.5 2.8 2.1 1.7 1.7 31.1 25.6 24.7
Banks/Financial Institutions
Andhra Bank 117 BUY 65,611 1,328 560 22.6 23.6 23.0 5.0 4.4 (2.8) 5.2 5.0 5.1 — — — 1.0 0.9 0.8 4.7 4.9 4.8 23.2 19.0 16.3 150 27.9 1.3
Axis Bank 1,118 BUY 474,420 9,602 424 82.5 95.5 102.8 33.0 15.7 7.6 13.5 11.7 10.9 — — — 2.5 2.1 1.8 1.2 1.4 1.6 19.3 19.6 18.2 1,350 20.7 56.6
Bajaj Finserv 507 ADD 73,374 1,485 145 78.2 63.2 62.9 102.3 (19.2) (0.4) 6.5 8.0 8.1 — — — 2.1 1.5 1.2 2.5 2.5 2.5 37.2 21.9 16.8 650 28.2 1.0
Bank of Baroda 825 BUY 323,948 6,556 393 108.0 115.6 121.2 29.1 7.1 4.9 7.6 7.1 6.8 — — — 1.7 1.4 1.2 2.3 2.5 2.6 25.9 21.5 19.2 1,050 27.3 9.0
Bank of India 365 BUY 199,680 4,041 547 45.5 46.7 62.0 37.4 2.7 32.8 8.0 7.8 5.9 — — — 1.3 1.1 1.0 2.2 2.3 3.0 17.3 15.1 17.6 450 23.3 5.4
Canara Bank 526 BUY 233,129 4,718 443 90.9 74.8 93.2 23.3 (17.7) 24.6 5.8 7.0 5.6 — — — 1.3 1.1 1.0 2.1 2.3 2.3 23.2 15.5 16.9 550 4.5 7.7
Corporation Bank 476 BUY 70,436 1,426 148 95.4 107.5 107.5 16.3 12.7 (0.0) 5.0 4.4 4.4 — — — 1.0 0.8 0.7 4.2 4.7 4.7 21.9 20.6 17.8 600 26.2 0.7
Federal Bank 417 BUY 71,310 1,443 171 34.3 42.4 49.7 26.3 23.5 17.3 12.1 9.8 8.4 — — — 1.4 1.3 1.2 2.0 2.5 3.0 12.0 13.5 14.3 500 19.9 4.0
HDFC 694 REDUCE 1,017,882 20,601 1,467 24.1 27.7 31.8 22.4 14.9 14.7 28.8 25.1 21.8 — — — 5.9 5.2 4.0 1.3 1.5 1.8 21.7 22.0 21.4 725 4.5 35.6
HDFC Bank 518 ADD 1,203,771 24,363 2,326 16.9 22.1 28.1 31.0 30.9 27.2 30.7 23.4 18.4 — — — 4.7 4.1 3.5 0.6 0.8 1.1 16.7 18.8 20.5 560 8.2 32.7
ICICI Bank 930 BUY 1,071,711 21,690 1,152 44.7 53.2 56.7 23.9 19.0 6.5 20.8 17.5 16.4 — — — 1.9 1.8 1.7 1.5 1.7 1.8 9.7 10.7 10.7 1,100 18.2 110.8
IDFC 134 ADD 202,012 4,088 1,509 8.8 10.3 12.1 4.6 17.1 18.2 15.3 13.0 11.0 — — — 1.9 1.6 1.5 1.6 1.5 1.8 14.7 13.6 13.9 150 12.0 21.9
India Infoline 68 SELL 19,504 395 286 7.4 4.0 4.3 (9.3) (45.5) 5.7 9.2 16.9 16.0 — — — 1.2 1.1 1.0 5.2 1.2 1.2 12.9 6.7 7.3 70 2.8 0.9
Indian Bank 241 BUY 103,682 2,098 430 38.8 41.9 46.6 10.5 8.0 11.2 6.2 5.8 5.2 — — — 1.3 1.1 1.0 3.1 3.3 3.6 22.3 20.4 19.4 300 24.4 1.8
Indian Overseas Bank 101 BUY 62,617 1,267 619 17.3 14.4 27.8 33.6 (17.2) 93.6 5.8 7.1 3.6 — — — 0.8 0.7 0.6 4.9 1.9 3.8 12.7 9.1 15.9 140 38.3 1.4
IndusInd Bank 319 ADD 148,666 3,009 466 12.4 16.8 17.9 45.2 35.2 7.1 25.8 19.0 17.8 — — — 3.7 3.2 2.8 0.6 0.8 0.9 20.8 19.3 17.4 330 3.4 3.6
J&K Bank 814 ADD 39,473 799 48 126.9 155.4 160.6 20.1 22.5 3.4 6.4 5.2 5.1 — — — 1.1 1.0 0.9 3.2 3.9 4.0 19.0 20.0 17.9 950 16.7 0.4
LIC Housing Finance 275 ADD 130,777 2,647 475 20.5 19.3 29.5 47.2 (5.8) 52.7 13.4 14.2 9.3 — — — 3.3 2.8 2.4 1.6 1.5 2.3 25.8 20.3 26.0 270 (1.9) 13.2
Mahindra & Mahindra Financial 709 BUY 72,638 1,470 102 45.2 55.6 71.9 26.1 23.0 29.3 15.7 12.7 9.9 — — — 2.9 2.6 2.2 1.4 1.7 2.2 22.0 21.1 23.1 825 16.4 1.6
Muthoot Finance 160 BUY 59,259 1,199 371 15.7 23.1 27.5 108.4 46.4 19.3 10.1 6.9 5.8 — — — 4.4 1.9 1.4 — — — 51.5 38.7 28.4 240 50.4 —
Oriental Bank of Commerce 303 BUY 88,447 1,790 292 51.5 43.0 57.9 13.7 (16.5) 34.7 5.9 7.1 5.2 — — — 0.9 0.8 0.7 3.4 2.9 3.9 15.5 10.9 13.4 370 22.1 2.9
PFC 194 BUY 255,810 5,177 1,320 22.8 22.7 29.3 11.1 (0.5) 29.0 8.5 8.5 6.6 — — — 1.7 1.3 1.2 2.0 2.3 3.0 18.4 16.7 17.4 225 16.1 14.0
Punjab National Bank 1,008 BUY 319,236 6,461 317 140.0 152.0 166.5 13.0 8.6 9.5 7.2 6.6 6.1 — — — 1.6 1.3 1.2 2.2 3.1 3.4 24.4 22.0 20.5 1,270 26.0 8.4
Reliance Capital 409 ADD 100,679 2,038 246 9.3 8.4 22.6 (25.3) (10.2) 170.0 43.9 48.9 18.1 — — — 1.4 1.4 1.4 0.9 0.8 2.2 3.3 2.9 7.6 470 14.9 26.1
Rural Electrification Corp. 222 BUY 219,349 4,439 987 26.0 28.7 33.7 28.1 10.5 17.2 8.6 7.7 6.6 — — — 1.7 1.5 1.3 3.4 3.7 4.3 21.5 20.7 21.1 230 3.5 10.5
SKS Microfinance 120 RS 8,872 180 74 15.7 (89.1) (27.5) (41.8) (667.7) (69.1) 7.7 (1.4) (4.4) — — — 0.5 0.8 0.9 — — — 8.3 (44.7) (19.3) — — 1.8
State Bank of India 2,172 BUY 1,379,154 27,912 635 130.2 172.6 216.5 (9.9) 32.6 25.4 16.7 12.6 10.0 — — — 2.1 1.9 1.6 1.6 1.7 1.7 12.6 15.9 17.5 2,300 5.9 134.9
Union Bank 250 BUY 134,213 2,716 536 39.5 31.6 44.0 (3.9) (19.8) 39.0 6.3 7.9 5.7 — — — 1.2 1.1 0.9 3.1 2.5 3.5 20.9 14.4 17.5 340 35.8 5.4
Yes Bank 348 ADD 120,738 2,444 347 20.9 27.1 31.8 39.6 29.3 17.3 16.6 12.8 11.0 — — — 3.2 2.6 2.2 0.7 0.9 1.1 21.1 22.4 21.7 375 7.8 18.1
Banks/Financial Institutions Attractive 8,398,471 169,975 20.0 11.2 20.5 13.7 12.3 10.2 — — — 2.2 1.9 1.7 1.6 1.8 2.0 16.0 15.5 16.3
Cement
ACC 1,347 SELL 253,074 5,122 188 53.0 57.1 69.9 (36.3) 7.8 22.4 25.4 23.6 19.3 15.2 14.3 10.3 3.7 3.3 2.9 2.6 1.7 1.7 17.5 16.1 17.6 1,030 (23.5) 8.1
Ambuja Cements 172 SELL 261,620 5,295 1,522 7.9 7.8 10.0 (1.5) (1.2) 28.6 21.8 22.1 17.2 13.4 12.7 9.4 3.3 3.0 2.7 1.2 1.3 1.4 16.6 14.6 17.1 145 (15.6) 8.4
Grasim Industries 2,834 BUY 259,902 5,260 92 232.0 275.8 281.7 (22.9) 18.9 2.2 12.2 10.3 10.1 7.2 5.9 5.2 1.8 1.6 1.4 0.7 1.2 1.2 15.7 16.2 14.5 2,900 2.3 4.2
India Cements 94 ADD 28,875 584 307 1.9 11.6 12.2 (81.2) 511.9 5.9 49.7 8.1 7.7 16.2 5.5 4.7 0.7 0.6 0.6 1.7 3.4 3.4 1.4 8.5 8.4 110 17.0 1.9
Shree Cement 2,401 REDUCE 83,653 1,693 35 57.2 80.2 119.4 (72.5) 40.3 48.9 42.0 29.9 20.1 9.8 7.5 6.5 4.4 4.0 3.5 0.6 0.7 0.8 10.7 13.9 18.4 2,085 (13.2) 0.5
UltraTech Cement 1,383 REDUCE 378,956 7,670 274 44.9 79.7 89.4 (49.2) 77.7 12.2 30.8 17.3 15.5 15.0 9.8 8.5 3.1 2.6 2.2 0.4 0.4 0.6 16.7 18.7 17.7 1,220 (11.8) 4.4
Cement Neutral 1,266,081 25,624 (24.3) 30.9 13.9 21.8 16.6 14.6 11.3 8.8 7.4 2.6 2.3 2.1 1.1 1.1 1.2 12.1 14.0 14.1
Price/BV (X) Dividend yield (%)
Source: Company, Bloomberg, Kotak Institutional Equities estimates

In
dia D
aily Sum
mary - Feb
ruary 13, 2012
109
KOTAK IN
STITUTIO
NAL EQ
UITIES RESEARCH
Kotak Institutional Equities: Valuation summary of KIE Universe stocks
10-Feb-12 Mkt cap.O/S
shares EPS (Rs) EPS growth (%) PER (X) EV/EBITDA (X) Price/BV (X) RoE (%)Target price Upside ADVT-3mo
Company Price (Rs) Rating (Rs mn) (US$ mn) (mn) 2011 2012E 2013E 2011 2012E 2013E 2011 2012E 2013E 2011 2012E 2013E 2011 2012E 2013E 2011 2012E 2013E 2011 2012E 2013E (Rs) (%) (US$ mn)
Consumer products
Asian Paints 3,099 SELL 297,299 6,017 96 80.8 94.4 106.9 13.0 16.8 13.3 38.4 32.8 29.0 25.6 22.3 18.0 14.5 11.1 9.1 1.0 0.9 1.1 43.9 39.9 35.6 2,500 (19.3) 5.1
Colgate-Palmolive (India) 1,025 SELL 139,386 2,821 136 29.6 32.5 39.1 (4.9) 9.9 20.3 34.6 31.5 26.2 30.2 27.1 21.8 36.3 36.9 29.4 2.1 2.8 2.7 113.4 116.1 124.9 900 (12.2) 1.9
Dabur India 103 ADD 179,346 3,630 1,740 3.3 3.7 4.4 12.8 12.1 19.2 31.5 28.1 23.6 25.4 21.5 18.4 13.7 10.6 8.4 1.1 1.3 1.5 51.2 43.2 40.2 115 11.6 3.1
GlaxoSmithkline Consumer (a) 2,639 ADD 110,982 2,246 42 71.3 84.5 105.4 28.8 18.5 24.8 37.0 31.2 25.0 26.9 23.6 19.3 11.9 10.1 8.3 1.9 1.3 1.7 32.2 33.8 35.2 3,000 13.7 1.1
Godrej Consumer Products 446 ADD 144,240 2,919 324 14.9 16.8 21.8 31.3 13.1 29.8 30.0 26.5 20.4 25.3 20.2 15.1 8.4 6.3 5.1 1.1 0.7 0.7 35.9 27.6 28.9 500 12.2 1.8
Hindustan Unilever 387 REDUCE 836,566 16,931 2,159 9.9 11.8 14.2 4.8 19.7 19.7 39.2 32.8 27.4 33.6 26.9 21.4 31.8 27.3 23.4 2.0 2.5 3.0 66.3 89.8 92.4 420 8.4 23.2
ITC 204 ADD 1,565,321 31,680 7,681 6.4 7.9 9.0 20.7 22.5 14.1 31.8 26.0 22.7 21.1 17.7 15.3 9.3 8.1 7.0 2.2 1.8 2.2 33.2 34.9 34.3 230 12.9 29.6
Jubilant Foodworks 1,000 SELL 65,626 1,328 66 11.2 16.3 24.0 99.6 45.4 47.3 89.3 61.4 41.7 54.7 34.1 23.4 34.2 22.0 14.4 — — — 46.6 43.6 41.7 800 (20.0) 22.5
Jyothy Laboratories 175 ADD 13,612 275 78 10.3 8.4 10.8 (6.2) (18.8) 28.0 17.0 20.9 16.3 13.4 31.9 23.8 2.0 2.0 1.9 3.4 2.7 3.3 12.3 9.7 11.7 190 8.3 0.2
Marico 163 BUY 100,156 2,027 615 3.9 5.2 6.8 (12.8) 33.5 31.7 42.0 31.4 23.9 25.7 22.2 16.9 10.7 8.3 6.5 0.4 0.4 0.6 30.3 30.3 30.8 190 16.7 0.8
Nestle India (a) 4,285 SELL 413,170 8,362 96 86.8 106.6 125.0 16.7 22.8 17.3 49.4 40.2 34.3 32.9 26.6 22.2 48.3 34.2 25.5 1.1 1.4 1.6 116.5 99.7 85.4 3,600 (16.0) 2.8
Tata Global Beverages 119 BUY 73,559 1,489 618 4.0 5.3 6.6 (34.6) 35.1 23.0 30.0 22.2 18.1 12.5 12.1 9.8 1.4 1.4 1.3 1.7 1.5 1.8 6.4 8.2 9.5 110 (7.5) 5.6
Titan Industries 207 ADD 183,727 3,718 888 4.9 6.5 7.9 71.7 32.5 20.7 42.1 31.8 26.3 29.4 22.2 17.9 17.7 13.4 10.4 0.6 1.1 1.4 49.2 48.0 44.4 230 11.1 18.1
United Spirits 670 BUY 84,186 1,704 126 35.3 36.6 42.7 29.5 3.5 16.9 19.0 18.3 15.7 13.6 11.5 10.5 2.0 1.8 1.7 0.4 0.4 0.5 11.2 10.5 11.1 900 34.3 17.0
Consumer products Attractive 4,207,176 85,148 16.3 19.5 18.0 35.0 29.3 24.8 24.5 20.5 17.1 10.8 9.3 8.0 1.7 1.7 2.0 31.0 31.7 32.1
Constructions
IVRCL 57 ADD 15,139 306 267 5.9 4.2 5.0 (25.2) (28.5) 18.5 9.6 13.4 11.3 6.7 7.8 6.9 0.8 0.7 0.7 1.1 0.7 0.7 8.2 5.5 6.2 59 4.1 7.6
Nagarjuna Construction Co. 53 BUY 13,663 277 257 6.4 1.8 3.7 (29.7) (71.1) 100.8 8.4 28.9 14.4 7.6 9.3 7.9 0.6 0.6 0.6 1.9 3.8 3.8 7.1 2.0 4.0 65 22.1 1.2
Punj Lloyd 59 REDUCE 19,934 403 340 (1.5) 3.4 6.5 (56.6) (328.7) 90.7 (39.5) 17.3 9.1 12.9 7.1 6.0 0.7 0.6 0.6 (0.1) 0.5 1.0 (1.7) 3.8 6.9 60 2.2 4.4
Sadbhav Engineering 144 BUY 21,567 436 150 7.8 10.0 10.0 51.0 28.5 0.5 18.5 14.4 14.3 10.9 8.8 8.6 3.4 2.8 2.3 0.4 0.4 0.4 18.1 19.2 16.3 180 25.1 0.4
Construction Attractive 70,303 1,423 (1.1) 9.7 40.9 18.1 16.5 11.7 9.1 7.9 6.9 0.9 0.8 0.8 0.7 1.2 1.3 4.8 5.1 6.8
Energy
Aban Offshore 521 BUY 22,669 459 44 134.2 71.5 92.4 25.9 (46.7) 29.1 3.9 7.3 5.6 6.7 7.8 6.9 1.0 1.4 1.1 0.7 0.8 0.9 33.3 20.8 21.4 615 18.1 10.5
Bharat Petroleum 598 RS 216,273 4,377 362 38.9 30.6 45.8 (32.5) (21.3) 49.5 15.4 19.6 13.1 10.1 9.9 8.7 1.4 1.4 1.3 2.3 1.7 2.5 9.2 6.8 9.6 — — 7.0
Cairn india 373 REDUCE 710,188 14,373 1,903 33.3 45.7 62.7 501.1 37.2 37.1 11.2 8.2 6.0 8.2 6.4 4.1 1.7 1.5 1.3 — - 4.0 16.9 19.7 23.5 355 (4.9) 18.5
Castrol India (a) 466 REDUCE 115,282 2,333 247 19.8 19.7 21.6 28.5 (0.6) 9.9 23.5 23.7 21.5 15.0 16.1 14.4 22.3 20.8 19.3 3.2 3.3 3.6 100.2 91.0 93.0 410 (12.1) 0.8
GAIL (India) 386 BUY 489,443 9,906 1,268 28.2 30.1 31.0 13.8 6.8 3.2 13.7 12.8 12.4 8.6 9.0 8.5 2.3 2.0 1.8 1.9 2.1 2.2 17.5 16.3 14.7 485 25.7 11.3
GSPL 83 REDUCE 46,638 944 563 8.9 9.2 8.5 21.7 3.4 (7.1) 9.3 9.0 9.7 6.1 5.6 5.7 2.1 1.7 1.5 1.2 1.7 2.6 25.2 20.5 16.2 87 4.9 2.1
Hindustan Petroleum 294 RS 99,669 2,017 339 40.8 14.4 23.7 (20.8) (64.8) 64.9 7.2 20.5 12.4 3.2 4.6 4.2 0.6 0.6 0.6 4.8 1.5 2.5 9.0 2.9 4.6 — — 4.4
Indian Oil Corporation 276 RS 669,386 13,548 2,428 32.4 14.5 32.3 (34.0) (55.2) 122.2 8.5 19.0 8.5 8.3 9.5 6.4 1.1 1.1 1.0 3.4 1.8 3.6 13.3 5.6 11.7 — — 2.8
Oil India 1,321 BUY 317,707 6,430 240 120.0 146.1 189.9 4.2 21.8 30.0 11.0 9.0 7.0 5.6 3.7 2.6 1.9 1.7 1.5 2.8 4.2 5.7 16.2 17.5 20.1 1,750 32.4 2.4
Oil & Natural Gas Corporation 282 BUY 2,410,517 48,786 8,556 24.7 31.2 37.5 7.4 26.6 20.2 11.4 9.0 7.5 4.3 3.7 2.9 1.6 1.4 1.3 3.1 3.5 4.3 14.3 16.1 17.1 350 24.2 15.6
Petronet LNG 167 SELL 125,138 2,533 750 8.1 14.9 13.6 50.3 83.4 (8.2) 20.6 11.2 12.2 11.8 7.9 8.5 4.1 3.2 2.6 1.2 1.8 1.8 20.9 31.1 22.5 140 (16.1) 6.3
Reliance Industries 843 ADD 2,513,728 50,875 2,981 62.0 62.8 63.5 24.8 1.4 1.0 13.6 13.4 13.3 7.4 6.7 6.5 1.5 1.4 1.3 0.9 0.9 0.9 13.0 11.9 10.9 915 8.5 85.8
Energy Attractive 7,736,638 156,580 11.6 5.7 21.3 11.5 10.9 9.0 6.4 5.8 4.7 1.6 1.4 1.3 2.0 2.0 2.9 13.8 13.1 14.3
Industrials
ABB 874 SELL 185,144 3,747 212 3.0 11.7 22.7 (82.2) 291.5 94.5 292.8 74.8 38.4 213.8 49.6 25.0 7.6 7.2 6.2 0.2 0.4 0.4 2.6 9.9 17.3 515 (41.1) 1.5
BGR Energy Systems 254 REDUCE 18,363 372 72 44.8 29.4 27.2 60.0 (34.4) (7.4) 5.7 8.7 9.4 4.0 4.7 3.8 1.9 1.6 1.5 3.9 2.3 2.1 39.0 20.5 16.5 260 2.2 4.2
Bharat Electronics 1,532 ADD 122,528 2,480 80 107.3 115.8 132.8 11.6 8.0 14.7 14.3 13.2 11.5 6.4 7.1 4.8 2.4 2.1 1.8 1.4 1.6 1.6 18.2 16.8 16.9 1,650 7.7 1.3
Bharat Heavy Electricals 261 REDUCE 637,845 12,909 2,448 24.6 27.5 23.3 39.7 12.0 (15.4) 10.6 9.5 11.2 6.8 6.8 7.3 3.2 2.5 2.2 2.4 2.3 1.9 33.3 29.7 20.9 230 (11.7) 27.7
Crompton Greaves 151 ADD 96,867 1,960 642 14.3 6.4 10.3 11.5 (55.2) 60.0 10.5 23.5 14.7 6.8 11.5 8.1 2.9 2.7 2.3 1.6 0.9 1.0 31.7 12.0 17.0 155 2.6 6.6
KEC International 63 BUY 16,107 326 257 8.0 6.7 8.1 4.1 (16.5) 21.6 7.8 9.4 7.7 6.2 6.6 5.8 1.6 1.4 1.2 1.9 2.1 1.9 22.5 16.2 17.2 65 3.8 0.4
Larsen & Toubro 1,351 REDUCE 822,556 16,648 609 67.7 80.7 87.0 18.1 19.2 7.8 20.0 16.7 15.5 14.5 11.3 10.3 3.1 2.6 2.2 1.1 1.0 1.0 17.0 16.8 15.4 1,325 (1.9) 74.3
Maharashtra Seamless 344 BUY 24,252 491 71 48.2 42.1 46.8 24.8 (12.6) 11.0 7.1 8.2 7.4 4.5 4.5 3.7 0.9 0.9 0.8 2.4 2.4 2.7 13.8 11.1 11.5 460 33.8 0.2
Siemens 790 SELL 268,952 5,443 340 25.5 22.3 27.9 13.6 (12.7) 25.5 31.0 35.5 28.3 21.5 22.6 17.9 6.9 6.0 5.2 0.8 0.6 0.7 24.4 18.2 19.7 550 (30.4) 3.5
Suzlon Energy 31 REDUCE 54,742 1,108 1,777 (6.0) 2.0 3.5 (4.6) (133.6) 72.0 (5.1) 15.2 8.9 18.4 6.9 5.9 0.8 0.7 0.6 — 0.6 0.6 (15.8) 4.8 7.5 40 29.9 15.9
Tecpro Systems 182 BUY 9,189 186 50 27.0 28.8 24.8 24.2 6.9 (14.1) 6.7 6.3 7.3 4.6 5.0 5.1 1.4 1.2 1.1 — — — 26.8 20.2 15.2 200 9.9 0.1
Thermax 472 REDUCE 56,215 1,138 119 31.6 32.8 31.4 44.3 3.7 (4.3) 14.9 14.4 15.0 9.9 9.5 9.6 4.3 3.6 3.1 1.9 1.9 1.8 31.5 27.0 21.9 440 (6.7) 1.1
Voltas 100 REDUCE 33,058 669 331 9.8 6.4 7.6 (14.3) (34.4) 17.6 10.2 15.6 13.2 5.9 10.3 8.1 2.4 2.2 2.0 2.0 2.0 2.3 26.1 14.8 15.9 90 (10.0) 3.4
Industrials Cautious 2,538,568 51,378 24.3 16.1 3.6 18.0 15.5 15.0 11.7 10.4 9.6 3.3 2.7 2.4 1.4 1.4 1.3 18.1 17.6 16.0
Infrastructure
Adani Port and SEZ 143 ADD 288,293 5,835 2,017 4.6 5.6 7.3 36.3 22.1 31.3 31.4 25.7 19.6 25.4 18.5 13.8 6.7 5.6 4.6 0.6 0.7 1.0 23.4 23.8 25.8 160 12.0 4.6
Container Corporation 938 ADD 121,908 2,467 130 67.6 71.0 77.5 11.7 5.0 9.2 13.9 13.2 12.1 9.9 8.8 7.6 2.4 2.2 1.9 1.7 1.7 1.9 18.9 17.4 16.7 1,100 17.3 1.2
GMR Infrastructure 30 RS 116,188 2,352 3,892 (0.3) (0.8) (0.2) (178.0) 131.2 (77.8) (88.7) (38.4) (172.5) 19.0 13.8 11.4 1.2 1.0 1.0 — — — (1.8) (4.0) (0.9) — — 3.7
Gujarat Pipavav Port 58 ADD 24,715 500 424 (1.2) 1.2 2.3 (65.8) (195.8) 100.8 (48.6) 50.7 25.2 25.5 16.9 13.0 3.4 3.1 2.8 — — — (9.1) 8.9 12.1 63 8.0 0.3
GVK Power & Infrastructure 17 RS 26,610 539 1,579 1.0 1.0 0.3 (0.6) 1.6 (73.4) 17.2 16.9 63.5 18.0 16.5 19.5 0.8 0.8 0.8 — 1.8 2.1 4.7 4.6 1.2 — — 4.4
IRB Infrastructure 171 ADD 56,984 1,153 332 13.6 11.9 15.2 30.4 (12.9) 27.9 12.6 14.5 11.3 8.3 8.7 7.3 2.2 1.6 1.3 0.9 — — 19.3 13.1 13.0 190 10.8 4.8
Infrastructure Cautious 634,698 12,846 10.5 5.3 30.5 28.6 27.1 20.8 16.8 14.0 11.4 2.5 2.1 1.9 0.7 0.7 0.9 8.7 7.9 9.3
Dividend yield (%)
Source: Company, Bloomberg, Kotak Institutional Equities estimates

KO
TAK INSTITUTIO
NAL EQ
UITIES RESEARCH 110
In
dia D
aily Sum
mary - Feb
ruary 1
Ind
ia Daily Su
mm
ary - Febru
ary 13, 2012
Kotak Institutional Equities: Valuation summary of KIE Universe stocks
10-Feb-12 Mkt cap.O/S
shares EPS (Rs) EPS growth (%) PER (X) EV/EBITDA (X) Price/BV (X) RoE (%)Target price Upside ADVT-3mo
Company Price (Rs) Rating (Rs mn) (US$ mn) (mn) 2011 2012E 2013E 2011 2012E 2013E 2011 2012E 2013E 2011 2012E 2013E 2011 2012E 2013E 2011 2012E 2013E 2011 2012E 2013E (Rs) (%) (US$ mn)
Media
DB Corp 200 BUY 36,683 742 183 14.1 11.2 13.5 32.7 (20.7) 20.6 14.2 17.9 14.8 9.2 10.4 8.6 4.4 3.9 3.4 2.0 2.0 3.0 35.0 23.0 24.5 300 49.9 0.1
DishTV 67 BUY 70,796 1,433 1,063 (1.8) (0.7) 0.6 (27.7) (62.1) (192.8) (37.3) (98.5) 106.1 32.8 15.3 11.4 112.8 (776.1) 123.0 — — — (81.9) (268.1) 275.3 80 20.1 6.5
Eros International 216 BUY 20,983 425 97 11.8 15.6 19.6 19.0 32.7 25.6 18.4 13.8 11.0 12.7 9.7 7.0 3.1 2.5 2.0 — — — 24.9 20.1 20.4 270 24.7 1.5
Hindustan Media Ventures 125 BUY 9,185 186 73 7.3 9.0 10.6 198.0 23.3 17.8 17.1 13.9 11.8 8.1 7.7 5.8 2.4 2.1 1.8 0.8 0.8 1.6 23.3 16.1 16.5 190 51.8 0.1
HT Media 144 ADD 33,751 683 235 7.7 7.5 9.2 31.0 (3.1) 23.3 18.7 19.3 15.6 8.9 9.7 7.2 2.4 2.2 2.0 0.3 1.4 2.8 14.9 11.8 13.4 160 11.5 0.1
Jagran Prakashan 108 BUY 34,092 690 316 6.8 6.5 7.8 16.7 (5.3) 21.6 15.8 16.7 13.7 9.4 9.1 7.8 4.9 4.4 3.9 3.2 3.2 3.7 32.8 27.6 30.0 150 39.1 0.2
Sun TV Network 341 ADD 134,302 2,718 394 19.5 18.5 21.4 48.1 (5.4) 15.9 17.4 18.4 15.9 10.6 11.0 9.6 5.6 5.1 4.7 2.6 3.2 4.1 36.5 30.2 32.2 390 14.4 6.5
Zee Entertainment Enterprises 130 BUY 127,041 2,571 978 5.8 6.2 7.7 10.0 6.4 23.3 22.2 20.9 16.9 15.0 13.8 10.9 3.0 2.9 2.8 1.0 1.0 1.2 14.2 14.3 16.9 160 23.2 3.4
Media Neutral 466,833 9,448 51.6 4.7 27.8 23.6 22.6 17.7 12.7 11.7 9.5 4.4 4.0 3.7 1.4 1.7 2.2 18.4 17.8 20.9
Metals & Mining
Coal India 332 ADD 2,096,086 42,422 6,316 17.3 22.9 27.4 13.6 32.1 20.0 19.2 14.5 12.1 11.2 8.4 7.1 6.0 4.8 3.8 1.2 2.1 2.5 35.1 36.5 34.9 380 14.5 27.9
Hindalco Industries 153 REDUCE 292,788 5,926 1,915 12.8 17.2 16.1 (36.0) 34.3 (6.0) 12.0 8.9 9.5 6.3 7.1 6.8 1.0 0.9 0.8 1.0 1.0 1.0 9.7 10.8 9.2 160 4.6 29.7
Hindustan Zinc 145 ADD 613,893 12,424 4,225 11.6 12.7 14.7 21.8 8.8 16.0 12.5 11.5 9.9 8.4 7.4 5.3 2.7 2.3 1.9 0.7 1.7 1.7 24.3 21.8 21.4 150 3.2 2.0
Jindal Steel and Power 604 REDUCE 564,504 11,425 934 40.2 40.9 46.1 5.1 1.7 12.7 15.0 14.8 13.1 10.9 10.5 9.7 4.0 3.2 2.6 0.2 0.3 0.3 30.9 24.1 21.8 530 (12.3) 21.7
JSW Steel 817 SELL 184,586 3,736 226 78.6 32.4 77.8 (2.2) (58.7) 139.8 10.4 25.2 10.5 7.1 6.0 6.4 1.1 1.1 1.0 1.5 1.2 1.2 13.6 14.1 9.9 680 (16.7) 41.1
National Aluminium Co. 63 SELL 163,139 3,302 2,577 4.2 3.2 3.7 36.4 (23.9) 15.8 15.2 20.0 17.3 7.0 9.9 7.9 1.5 1.4 1.4 2.4 2.4 2.4 9.9 7.2 8.0 53 (16.3) 0.7
Sesa Goa 235 REDUCE 210,165 4,253 895 48.6 32.7 46.8 65.3 (32.7) 43.1 4.8 7.2 5.0 4.1 6.2 6.7 1.6 1.4 1.0 1.7 1.7 1.7 36.8 17.2 22.1 190 (19.1) 14.6
Sterlite Industries 129 BUY 434,435 8,792 3,361 15.2 13.5 15.2 26.2 (11.0) 12.4 8.5 9.6 8.5 5.3 4.6 3.7 1.0 1.0 0.9 0.9 1.5 1.5 13.0 10.5 10.8 150 16.1 17.3
Tata Steel 475 ADD 461,468 9,340 971 75.3 36.2 58.4 (2,258.1) (51.9) 61.2 6.3 13.1 8.1 5.9 8.0 6.1 1.3 1.1 1.0 2.5 2.5 2.5 24.7 7.1 13.4 525 10.5 62.2
Metals & Mining Cautious 5,021,063 101,620 39.1 (0.7) 17.8 12.1 12.2 10.4 7.6 7.5 6.4 2.3 2.0 1.7 1.2 1.7 1.9 19.0 16.5 16.8
Pharmaceutical
Apollo Hospitals 624 BUY 86,678 1,754 139 13.2 17.1 21.2 21.0 29.3 24.0 47.1 36.4 29.4 21.4 16.0 13.7 4.5 3.4 3.0 — — — 9.8 10.3 10.5 650 4.2 5.3
Biocon 286 BUY 57,170 1,157 200 18.4 16.8 20.7 23.9 (8.7) 23.2 15.6 17.0 13.8 8.8 9.6 7.6 2.8 2.5 2.2 — — — 19.4 15.7 17.2 380 32.9 3.5
Cipla 350 SELL 280,822 5,684 803 12.3 15.6 18.4 (10.0) 26.2 18.0 28.4 22.5 19.0 24.6 16.9 13.5 4.2 3.7 3.2 0.8 0.9 1.0 15.4 17.2 18.0 330 (5.6) 9.8
Cadila Healthcare 695 REDUCE 142,372 2,881 205 34.7 31.1 40.9 40.6 (10.5) 31.4 20.0 22.4 17.0 17.4 17.6 13.2 6.6 5.4 4.3 0.9 0.9 1.2 37.5 26.4 28.1 700 0.7 1.8
Dishman Pharma & chemicals 61 REDUCE 4,937 100 81 9.8 5.1 8.3 (31.8) (48.6) 64.7 6.2 12.0 7.3 8.1 7.7 5.8 0.6 0.5 0.5 — — — 9.6 4.6 7.2 60 (1.2) 0.3
Divi's Laboratories 755 ADD 100,111 2,026 133 32.4 37.4 46.4 25.7 15.6 24.1 23.3 20.2 16.2 19.3 15.7 11.5 5.6 4.7 4.0 — — — 25.9 25.4 26.8 935 23.9 2.4
Dr Reddy's Laboratories 1,622 REDUCE 275,675 5,579 170 64.9 90.7 106.9 932.5 39.7 17.8 25.0 17.9 15.2 17.5 11.7 9.7 6.0 4.7 3.7 0.7 0.8 0.9 24.8 29.3 27.1 1,740 7.3 13.5
GlaxoSmithkline Pharmaceuticals (a) 2,035 SELL 172,333 3,488 85 68.3 75.5 83.3 15.5 10.6 10.3 29.8 26.9 24.4 19.7 18.8 16.4 8.8 9.0 8.4 2.0 2.5 2.8 30.9 33.2 35.7 1,930 (5.1) 0.9
Glenmark Pharmaceuticals 300 REDUCE 81,084 1,641 270 17.0 19.9 22.4 33.6 17.6 12.2 17.7 15.0 13.4 19.9 18.5 11.0 4.0 3.2 2.6 — — — 20.6 23.6 21.5 340 13.4 4.0
Jubilant Life Sciences 198 REDUCE 31,502 638 159 14.4 16.9 29.5 (45.6) 17.3 74.1 13.7 11.7 6.7 11.0 8.2 6.5 1.4 1.3 1.1 1.0 1.0 1.5 12.3 16.3 18.0 180 (9.0) 0.5
Lupin 459 ADD 205,675 4,163 448 19.2 21.1 26.5 25.6 9.7 25.3 23.8 21.7 17.3 20.0 17.3 12.8 6.2 5.0 4.0 0.7 0.8 1.0 29.5 25.8 26.2 520 13.3 7.4
Ranbaxy Laboratories 442 SELL 187,185 3,788 423 40.6 19.0 42.8 474.9 (53.3) 125.7 10.9 23.3 10.3 13.4 13.9 8.4 3.3 3.1 2.4 — — — 34.5 14.0 26.4 400 (9.6) 10.6
Sun Pharmaceuticals 541 ADD 560,726 11,348 1,036 17.5 21.7 28.3 34.4 23.5 30.5 30.9 25.0 19.1 26.5 18.6 14.4 5.4 4.5 3.7 0.6 0.7 0.9 21.0 21.6 23.4 625 15.4 9.8
Pharmaceuticals Neutral 2,186,268 44,247 43.1 7.6 31.5 22.9 21.3 16.2 18.5 14.6 11.0 3.7 3.2 2.7 0.7 0.8 0.9 16.0 14.8 16.4
Property
DLF 231 ADD 395,895 8,012 1,715 9.1 9.7 12.7 (14.5) 6.5 31.5 25.4 23.9 18.2 16.6 15.2 12.3 1.5 1.4 1.4 0.9 1.1 1.3 5.4 6.1 7.6 260 12.6 38.9
Housing Development & Infrastructure 97 BUY 42,579 862 441 19.8 24.8 32.7 24.2 25.0 32.1 4.9 3.9 3.0 5.1 6.2 4.2 0.4 0.4 0.3 — 1.0 1.6 10.0 10.7 12.4 150 55.4 20.9
Indiabulls Real Estate 74 RS 29,605 599 402 4.0 8.5 15.4 (1,095.5) 114.1 81.5 18.5 8.7 4.8 13.2 10.6 4.6 0.3 0.2 0.2 0.4 0.7 1.0 1.4 2.9 5.0 — — 10.2
Mahindra Life Space Developer 312 BUY 12,722 257 41 24.9 26.7 32.2 30.2 6.9 20.8 12.5 11.7 9.7 9.5 7.8 6.1 1.2 1.1 1.0 1.6 1.4 1.6 10.4 10.2 11.2 405 29.9 0.3
Oberoi Realty 271 BUY 89,326 1,808 330 15.7 14.9 26.4 14.8 (5.0) 77.3 17.3 18.2 10.2 13.1 13.3 6.4 2.7 2.4 2.0 0.4 0.6 0.9 19.9 13.9 21.1 300 10.7 0.2
Phoenix Mills 196 BUY 28,368 574 145 6.3 7.4 10.7 53.0 17.2 44.1 31.0 26.4 18.3 22.9 19.1 14.3 1.8 1.7 1.6 0.9 1.0 1.0 5.8 6.6 8.9 300 53.2 0.2
Puravankara Projects 76 REDUCE 16,124 326 213 5.5 7.4 9.5 (18.9) 33.2 29.4 13.7 10.3 7.9 18.4 13.3 11.0 1.1 1.0 0.9 1.3 2.0 2.6 8.0 9.9 11.8 80 5.9 0.1
Sobha Developers 271 BUY 26,575 538 98 18.8 15.6 25.7 33.8 (17.2) 65.3 14.4 17.4 10.5 12.2 13.3 8.3 1.4 1.3 1.2 1.1 1.3 1.5 10.2 7.9 12.0 340 25.5 0.8
Unitech 29 RS 76,919 1,557 2,616 2.3 2.3 2.3 (23.4) 0.2 (3.0) 12.7 12.6 13.0 14.2 12.1 10.1 0.7 0.6 0.6 0.3 0.7 1.0 5.4 5.0 4.4 — — 12.3
Property Cautious 753,672 15,253 5.3 23.0 36.2 17.6 14.3 10.5 13.8 12.0 8.8 1.1 1.0 0.9 0.7 1.0 1.3 6.1 7.0 8.7
Dividend yield (%)
Source: Company, Bloomberg, Kotak Institutional Equities estimates

In
dia D
aily Sum
mary - Feb
ruary 13, 2012
111
KOTAK IN
STITUTIO
NAL EQ
UITIES RESEARCH
Kotak Institutional Equities: Valuation summary of KIE Universe stocks
10-Feb-12 Mkt cap.O/S
shares EPS (Rs) EPS growth (%) PER (X) EV/EBITDA (X) Price/BV (X) RoE (%)Target price Upside ADVT-3mo
Company Price (Rs) Rating (Rs mn) (US$ mn) (mn) 2011 2012E 2013E 2011 2012E 2013E 2011 2012E 2013E 2011 2012E 2013E 2011 2012E 2013E 2011 2012E 2013E 2011 2012E 2013E (Rs) (%) (US$ mn)
Technology
HCL Technologies 469 REDUCE 330,434 6,688 705 22.9 33.8 39.9 30.4 47.9 18.0 20.5 13.9 11.8 12.4 8.2 7.0 3.9 2.9 2.4 1.6 1.7 1.7 21.0 22.8 22.3 460 (1.9) 10.7
Hexaware Technologies 110 ADD 32,182 651 294 3.0 9.1 10.7 (36.8) 207.9 17.3 37.1 12.1 10.3 29.8 10.6 7.1 3.3 3.2 2.6 1.3 2.7 3.0 9.3 26.9 28.0 110 0.3 3.0
Infosys 2,790 ADD 1,601,690 32,416 574 119.7 146.1 173.7 10.5 22.0 18.9 23.3 19.1 16.1 16.0 12.8 10.2 6.2 5.1 4.3 2.1 1.7 1.9 28.0 29.3 28.9 3,100 11.1 73.3
Mahindra Satyam 72 REDUCE 84,437 1,709 1,176 4.2 8.7 8.1 68.9 106.3 (6.5) 17.1 8.3 8.9 12.6 5.7 4.4 4.9 3.1 2.3 — — — 27.6 45.7 29.7 80 11.4 6.6
Mindtree 455 ADD 18,728 379 41 24.7 50.5 53.9 (52.7) 104.5 6.8 18.4 9.0 8.4 10.3 6.1 4.7 2.4 2.0 1.7 0.5 1.1 3.6 14.4 23.9 21.5 540 18.7 0.6
Mphasis 373 SELL 78,526 1,589 211 51.8 39.0 34.6 18.8 (24.6) (11.4) 7.2 9.5 10.8 6.1 8.0 7.2 2.4 2.0 1.7 1.1 1.2 1.3 38.6 22.8 17.3 310 (16.8) 2.2
Polaris Financial Technology 168 REDUCE 16,730 339 100 19.3 21.7 24.0 25.7 12.5 10.4 8.7 7.7 7.0 5.5 3.4 2.6 1.6 1.4 1.2 2.2 2.3 2.4 20.2 19.2 18.2 145 (13.6) 1.3
TCS 1,233 REDUCE 2,414,010 48,857 1,957 44.5 54.6 66.4 26.8 22.6 21.6 27.7 22.6 18.6 20.8 15.8 12.9 9.6 7.6 6.1 1.1 1.5 1.9 37.8 37.6 36.6 1,250 1.3 38.5
Tech Mahindra 650 SELL 81,932 1,658 126 48.0 74.7 80.7 (26.3) 55.5 8.0 13.5 8.7 8.1 9.1 9.7 8.0 2.4 2.1 1.9 0.6 0.6 1.5 20.2 27.0 25.5 600 (7.7) 2.1
Wipro 449 ADD 1,102,705 22,317 2,454 21.6 23.2 28.2 14.5 7.4 21.7 20.8 19.4 15.9 15.5 13.3 10.6 4.6 3.9 3.2 1.0 1.1 1.4 24.3 21.7 22.2 460 2.4 15.2
Technology Attractive 5,824,063 117,872 17.0 20.9 18.1 22.7 18.7 15.9 16.4 12.9 10.5 5.9 4.9 4.0 1.5 1.5 1.8 26.2 25.9 25.3
Telecom
Bharti Airtel 350 ADD 1,328,970 26,897 3,798 15.9 12.8 20.8 (32.6) (19.9) 62.9 22.0 27.4 16.8 9.7 8.2 6.3 2.7 2.7 2.3 — — — 13.3 9.9 14.7 390 11.4 56.0
IDEA 93 ADD 306,216 6,197 3,303 2.7 2.1 4.6 (0.5) (22.2) 118.5 34.1 43.8 20.0 10.9 8.5 6.5 2.5 2.5 2.2 — — — 7.6 5.7 11.6 100 7.9 14.2
MTNL 29 RS 18,459 374 630 (10.4) (9.1) (8.4) (33.7) (11.9) (8.1) (2.8) (3.2) (3.5) 1.1 1.5 1.8 0.2 0.2 0.2 — — — (6.1) (5.7) (5.5) — — 0.6
Reliance Communications 94 SELL 194,016 3,927 2,064 6.5 3.9 1.0 (71.1) (39.7) (73.5) 14.4 23.9 90.1 6.3 8.1 6.9 0.5 0.5 0.5 — — — 3.2 2.0 0.6 60 (36.2) 20.2
Tata Communications 224 REDUCE 63,726 1,290 285 (24.9) (27.0) (26.6) (13.0) 8.4 (1.4) (9.0) (8.3) (8.4) 11.5 8.6 7.7 1.8 2.5 4.1 — — — (17.5) (25.1) (37.0) 215 (3.8) 0.9
Telecom Cautious 1,911,387 38,684 (45.8) (27.5) 66.7 27.6 38.1 22.9 9.2 8.3 6.5 1.7 1.7 1.6 — — — 6.0 4.4 6.9
Utilities
Adani Power 72 SELL 172,310 3,487 2,393 2.4 2.3 8.1 200.7 (4.3) 259.1 30.6 31.9 8.9 33.6 22.8 6.5 2.7 2.3 1.8 — — — 8.5 7.9 23.2 60 (16.7) 3.3
CESC 280 BUY 34,945 707 125 39.1 37.8 41.4 13.1 (3.4) 9.5 7.2 7.4 6.8 4.8 6.2 6.4 0.7 0.7 0.6 1.4 1.7 1.8 10.8 9.6 9.6 400 43.0 1.5
JSW Energy 63 REDUCE 104,058 2,106 1,640 5.1 1.6 2.3 12.9 (69.5) 44.8 12.4 40.6 28.0 12.7 19.0 8.8 1.8 1.8 1.7 (1.6) — — 16.1 4.5 6.3 43 (32.2) 1.9
Lanco Infratech 16 BUY 36,013 729 2,223 1.6 1.9 2.6 (22.6) 14.7 36.9 9.8 8.6 6.3 10.3 10.5 7.4 0.8 0.7 0.6 — — — 9.2 8.4 10.3 39 140.7 4.7
NHPC 22 BUY 268,771 5,440 12,301 1.3 2.0 2.2 (27.2) 49.2 7.2 16.2 10.9 10.1 11.7 10.9 7.9 1.0 1.0 0.9 2.7 2.5 2.7 6.4 9.0 9.1 29 32.7 2.9
NTPC 180 REDUCE 1,487,070 30,097 8,245 10.9 11.4 12.2 4.2 4.1 7.6 16.5 15.9 14.7 12.5 13.9 11.9 2.2 2.0 1.8 2.2 1.9 2.0 13.6 13.0 12.9 175 (3.0) 9.2
Reliance Infrastructure 572 BUY 151,825 3,073 265 58.0 57.2 75.6 (6.5) (1.4) 32.2 9.9 10.0 7.6 12.8 8.2 8.0 0.6 0.6 0.6 1.3 1.8 2.0 6.8 10.3 9.0 890 55.5 21.7
Reliance Power 105 SELL 295,660 5,984 2,805 2.7 2.7 2.9 (0.2) (2.0) 7.7 38.9 39.7 36.8 152.7 53.8 24.4 1.8 1.7 1.6 — — — 4.9 4.3 4.5 76 (27.9) 8.9
Tata Power 111 BUY 273,492 5,535 2,468 7.6 4.9 8.7 21.5 (36.3) 77.6 14.5 22.7 12.8 11.1 9.5 8.2 1.9 1.9 1.7 1.3 1.4 1.5 13.8 8.4 14.4 125 12.8 7.6
Utilities Cautious 2,824,144 57,157 4.3 (0.4) 24.0 16.5 16.6 13.4 13.8 13.3 9.8 1.6 1.5 1.4 1.6 1.5 1.6 9.9 9.3 10.6
Others
Carborundum Universal 163 REDUCE 30,537 618 187 9.1 11.6 11.7 67.7 26.6 1.0 17.9 14.1 14.0 11.0 8.0 7.7 3.6 2.9 2.5 1.2 1.5 1.5 25.2 25.9 22.0 150 (8.2) 0.1
Havells India 486 ADD 60,628 1,227 125 24.5 29.7 33.0 334.1 21.1 11.0 19.8 16.4 14.7 12.6 10.5 9.1 8.5 6.0 4.4 0.5 0.6 0.6 53.9 43.3 34.7 500 2.9 3.3
Jaiprakash Associates 77 BUY 162,780 3,294 2,126 6.0 6.4 6.9 230.2 5.9 7.6 12.7 12.0 11.2 12.0 8.9 7.9 1.5 1.4 1.2 — — — 13.3 12.0 11.7 105 37.2 25.8
Jet Airways 326 ADD 28,105 569 86 (10.1) (233.8) (24.3) (91.0) 2,225 (89.6) (32.4) (1.4) (13.4) 10.1 (164.5) 9.9 1.8 (6.7) (4.5) — — — (5.0) — — 380 16.7 14.7
SpiceJet 25 BUY 10,813 219 441 2.5 (8.7) 1.9 (1.8) (450.3) (122.1) 9.8 (2.8) 12.7 14.5 (7.9) 11.4 3.4 17.6 7.4 — — — (961) (201.8) 82.1 45 83.7 1.8
Tata Chemicals 357 REDUCE 90,948 1,841 255 26.2 32.9 38.8 (0.7) 25.4 17.9 13.6 10.8 9.2 8.0 5.6 4.8 1.7 1.5 1.3 2.8 3.4 4.2 16.9 18.6 19.5 365 2.2 2.3
United Phosphorus 151 ADD 69,732 1,411 462 12.3 14.4 21.0 3.9 16.7 45.6 12.2 10.5 7.2 7.5 5.1 4.2 1.9 1.7 1.4 1.3 2.0 2.3 18.0 17.3 21.3 170 12.6 3.2
Others 453,543 9,179 233.8 (63.3) 276.0 16.0 43.5 11.6 10.6 10.0 7.3 1.9 1.9 1.7 0.9 1.2 1.4 12.1 4.4 14.4
KS universe (b) 47,150,695 954,274 18.4 6.6 21.5 16.1 15.1 12.4 10.3 9.3 7.6 2.5 2.2 1.9 1.5 1.5 1.8 15.4 14.6 15.7
KS universe (b) ex-Energy 39,414,057 797,694 20.6 6.9 21.6 17.4 16.3 13.4 12.0 10.8 8.8 2.8 2.5 2.2 1.4 1.5 1.6 16.0 15.2 16.2
KS universe (d) ex-Energy & ex-Commodities 33,126,914 670,450 19.3 7.9 22.7 18.5 17.1 13.9 13.5 11.9 9.6 2.9 2.6 2.2 1.4 1.4 1.6 15.6 15.0 16.1
Notes:
(a) For banks we have used adjusted book values.
(b) 2010 means calendar year 2009, similarly for 2011 and 2012 for these particular companies.
(c) EV/Sales & EV/EBITDA for KS universe excludes Banking Sector.
(d) Rupee-US Dollar exchange rate (Rs/US$)= 0.00
Dividend yield (%)
Source: Company, Bloomberg, Kotak Institutional Equities estimates

113 KOTAK INSTITUTIONAL EQUITIES RESEARCH
Disclosures
Kotak Institutional Equities Research coverage universeDistribution of ratings/investment banking relationships
Source: Kotak Institutional Equities As of December 31, 2011
Percentage of companies covered by Kotak Institutional Equities, within the specified category.
Percentage of companies within each category for which Kotak Institutional Equities and or its affiliates has provided investment banking services within the previous 12 months.
* The above categories are defined as follows: Buy = We expect this stock to deliver more than 17.5% returns over the next 12 months; Add = We expect this stock to deliver 7.5-17.5% returns over the next 12 months; Reduce = We expect this stock to deliver 0-7.5% returns over the next 12 months; Sell = We expect this stock to deliver less than 0% returns over the next 12 months. Our target prices are also on a 12-month horizon basis. These ratings are used illustratively to comply with applicable regulations. As of 31/12/2011 Kotak Institutional Equities Investment Research had investment ratings on 167 equity securities.
13.2%
42.5%
26.9%
17.4%
6.6%4.2%
2.4% 3.0%
0%
10%
20%
30%
40%
50%
60%
70%
BUY ADD REDUCE SELL
Ratings and other definitions/identifiers
Definitions of ratings
BUY. We expect this stock to deliver more than 17.5% returns over the next 12 months.
ADD. We expect this stock to deliver 7.5-17.5% returns over the next 12 months.
REDUCE. We expect this stock to deliver 0-7.5% returns over the next 12 months.
SELL. We expect this stock to deliver less than 0% returns over the next 12 months.
Our target prices are also on a 12-month horizon basis.
Other definitions
Coverage view. The coverage view represents each analyst’s overall fundamental outlook on the Sector. The coverage view will consist of one of the following designations: Attractive, Neutral, Cautious.
Other ratings/identifiers
NR = Not Rated. The investment rating and target price, if any, have been suspended temporarily. Such suspension is in compliance with applicable regulation(s) and/or Kotak Securities policies in circumstances when Kotak Securities or its affiliates is acting in an advisory capacity in a merger or strategic transaction involving this company and in certain other circumstances.
CS = Coverage Suspended. Kotak Securities has suspended coverage of this company.
NC = Not Covered. Kotak Securities does not cover this company.
RS = Rating Suspended. Kotak Securities Research has suspended the investment rating and price target, if any, for this stock, because there is not a sufficient fundamental basis for determining an investment rating or target. The previous investment rating and price target, if any, are no longer in effect for this stock and should not be relied upon.
NA = Not Available or Not Applicable. The information is not available for display or is not applicable.
NM = Not Meaningful. The information is not meaningful and is therefore excluded.

Corporate Office Overseas Offices
Kotak Securities Ltd.
Bakhtawar, 1st Floor
229, Nariman Point
Mumbai 400 021, India
Tel: +91-22-6634-1100
Kotak Mahindra (UK) Ltd
8th Floor, Portsoken House
155-157 Minories
London EC3N 1LS
Tel: +44-20-7977-6900
Kotak Mahindra Inc
50 Main Street, Suite No.310
Westchester Financial Centre
White Plains, New York 10606
Tel:+1-914-997-6120
Copyright 2012 Kotak Institutional Equities (Kotak Securities Limited). All rights reserved.
1. Note that the research analysts contributing to this report may not be registered/qualified as research analysts with FINRA; and
2. Such research analysts may not be associated persons of Kotak Mahindra Inc and therefore, may not be subject to NASD Rule 2711 restrictions on communications with a subject company, public appearances and trading securities held by a research analyst account.
Kotak Securities Limited and its affiliates are a full-service, integrated investment banking, investment management, brokerage and financing group. We along with our affiliates are leading underwriter of securities and participants in virtually all securities trading markets in India. We and our affiliates have investment banking and other business relationships with a significant percentage of the companies covered by our Investment Research Department. Our research professionals provide important input into our investment banking and other business selection processes. Investors should assume that Kotak Securities Limited and/or its affiliates are seeking or will seek investment banking or other business from the company or companies that are the subject of this material and that the research professionals who were involved in preparing this material may participate in the solicitation of such business. Our research professionals are paid in part based on the profitability of Kotak Securities Limited, which include earnings from investment banking and other business. Kotak Securities Limited generally prohibits its analysts, persons reporting to analysts, and members of their households from maintaining a financial interest in the securities or derivatives of any companies that the analysts cover. Additionally, Kotak Securities Limited generally prohibits its analysts and persons reporting to analysts from serving as an officer, director, or advisory board member of any companies that the analysts cover. Our salespeople, traders, and other professionals may provide oral or written market commentary or trading strategies to our clients that reflect opinions that are contrary to the opinions expressed herein, and our proprietary trading and investing businesses may make investment decisions that are inconsistent with the recommendations expressed herein. In reviewing these materials, you should be aware that any or all of the foregoing, among other things, may give rise to real or potential conflicts of interest. Additionally, other important information regarding our relationships with the company or companies that are the subject of this material is provided herein.
This material should not be construed as an offer to sell or the solicitation of an offer to buy any security in any jurisdiction where such an offer or solicitation would be illegal. We are not soliciting any action based on this material. It is for the general information of clients of Kotak Securities Limited. It does not constitute a personal recommendation or take into account the particular investment objectives, financial situations, or needs of individual clients. Before acting on any advice or recommendation in this material, clients should consider whether it is suitable for their particular circumstances and, if necessary, seek professional advice. The price and value of the investments referred to in this material and the income from them may go down as well as up, and investors may realize losses on any investments. Past performance is not a guide for future performance, future returns are not guaranteed and a loss of original capital may occur. Kotak Securities Limited does not provide tax advise to its clients, and all investors are strongly advised to consult with their tax advisers regarding any potential investment.
Certain transactions -including those involving futures, options, and other derivatives as well as non-investment-grade securities - give rise to substantial risk and are not suitable for all investors. The material is based on information that we consider reliable, but we do not represent that it is accurate or complete, and it should not be relied on as such. Opinions expressed are our current opinions as of the date appearing on this material only. We endeavor to update on a reasonable basis the information discussed in this material, but regulatory, compliance, or other reasons may prevent us from doing so. We and our affiliates, officers, directors, and employees, including persons involved in the preparation or issuance of this material, may from time to time have “long” or “short” positions in, act as principal in, and buy or sell the securities or derivatives thereof of companies mentioned herein. For the purpose of calculating whether Kotak Securities Limited and its affiliates holds beneficially owns or controls, including the right to vote for directors, 1% of more of the equity shares of the subject issuer of a research report, the holdings does not include accounts managed by Kotak Mahindra Mutual Fund. Kotak Securities Limited and its non US affiliates may, to the extent permissible under applicable laws, have acted on or used this research to the extent that it relates to non US issuers, prior to or immediately following its publication. Foreign currency denominated securities are subject to fluctuations in exchange rates that could have an adverse effect on the value or price of or income derived from the investment. In addition, investors in securities such as ADRs, the value of which are influenced by foreign currencies affectively assume currency risk. In addition options involve risks and are not suitable for all investors. Please ensure that you have read and understood the current derivatives risk disclosure document before entering into any derivative transactions.
This report has not been prepared by Kotak Mahindra Inc. (KMInc). However KMInc has reviewed the report and, in so far as it includes current or historical information, it is believed to be reliable, although its accuracy and completeness cannot be guaranteed. Any reference to Kotak Securities Limited shall also be deemed to mean and include Kotak Mahindra Inc.