indexing of canada pension plan and old age security benefits · source: service canada, old age...
TRANSCRIPT
Indexing of Canada Pension Plan and Old Age Security Benefits
Publication No. 2011-74-E 2 August 2011 Revised 2 July 2014
André Léonard
Economics, Resources and International Affairs Division Parliamentary Information and Research Service

Library of Parliament Background Papers provide in-depth studies of policy issues. They feature historical background, current information and references, and many anticipate the emergence of the issues they examine. They are prepared by the Parliamentary Information and Research Service, which carries out research for and provides information and analysis to parliamentarians and Senate and House of Commons committees and parliamentary associations in an objective, impartial manner.
© Library of Parliament, Ottawa, Canada, 2014
Indexing of Canada Pension Plan and Old Age Security Benefits (Background Paper)
Publication No. 2011-74-E
Ce document est également publié en français.
LIBRARY OF PARLIAMENT i PUBLICATION NO. 2011-74-E
CONTENTS
1 INTRODUCTION ....................................................................................................... 1
2 METHODS FOR INDEXING BOTH PROGRAMS .................................................... 1
2.1 Canada Pension Plan ............................................................................................ 1
2.2 Old Age Security .................................................................................................... 2
2.3 Comparison of Changes in Public Pension Program Benefits and the Consumer Price Index .............................................................................. 4
2.4 Possible Interaction in the Indexing of Both Plans ................................................. 4
3 DOES THE CONSUMER PRICE INDEX REFLECT ACTUAL SPENDING BY SENIORS? ....................................................................... 6
3.1 Difference in Consumption Patterns Between Seniors and the Rest of the Population ............................................................................... 6
3.2 Price Variations by Province .................................................................................. 7
4 CONCLUSION .......................................................................................................... 8

LIBRARY OF PARLIAMENT 1 PUBLICATION NO. 2011-74-E
INDEXING OF CANADA PENSION PLAN AND OLD AGE SECURITY BENEFITS
1 INTRODUCTION
The benefits provided by Canada’s public pension plans – the Canada Pension Plan
(CPP) and the Old Age Security (OAS) Program – follow Statistics Canada’s
Consumer Price Index (CPI), which reflects variations in the price of a basket of
goods and services that represents average spending in Canada.
The pension programs have different indexing frequencies and reference periods.
As well, because of a link between the CPP and the Guaranteed Income Supplement
(GIS) – a component of the OAS Program geared to low-income seniors – the
indexing of CPP benefits may affect the amount of GIS benefits.
Pegging the public pension plan benefits to the CPI can give rise to some questions:
Is the basket of goods and services used by the CPI actually representative of
spending by seniors? Is indexing based on the CPI – a national figure – inequitable
when the average rate of inflation is higher in certain provinces than in others?
This paper describes the methods used to index the two public pension plans and
briefly analyzes the fairness of using the CPI to index benefits.
2 METHODS FOR INDEXING BOTH PROGRAMS
CPP and OAS benefits are paid out in the last three banking days of each month.1
The first OAS benefit payment is issued the month after the recipient turns 65;
otherwise, a recipient whose birthday falls late in the month could receive his or her
first benefit payment at 64 years of age. Recipients who wish to begin receiving
CPP benefits before the usual age of 65 may do so, with a penalty, as early as the
month following their 60th birthday.
All CPP and OAS benefits are indexed based on variations in the CPI, although
using a slightly different method.2 The only exception is the CPP death benefit,
paid in full at death, whose maximum amount of $2,500 is not indexed.
2.1 CANADA PENSION PLAN
The initial amount of the CPP retirement benefit is determined largely by earnings
beginning at 18 years of age.3 The year’s maximum pensionable earnings (YMPE)
are calculated annually. This means that the premiums paid by a worker equal the
contribution rate (4.95% in 2014) multiplied by the YMPE (less the basic exemption),
when the worker’s earnings are equal to or above the YMPE. Otherwise, the
contribution rate is simply multiplied by the worker’s earnings (less the basic
exemption).
INDEXING OF CANADA PENSION PLAN AND OLD AGE SECURITY BENEFITS
LIBRARY OF PARLIAMENT 2 PUBLICATION NO. 2011-74-E
The YMPE is set each year based on average earnings growth in Canada, which
is published by Statistics Canada. The result is rounded down to the nearest $100.
If average earnings decline, the YMPE is frozen until average earnings grow beyond
their pre-freeze level.
The initial pension benefit is determined by calculating the ratio between the individual’s
earnings and the corresponding YMPE for almost every period of employment; this
method excludes up to 17% of the periods where income was lowest compared to
the YMPE. As a result, the initial benefit depends partly on the recipient’s earnings
growth over the course of employment, and, when the individual’s earnings are
higher than the average, partly on average earnings growth across the country.
After the initial benefit is determined, it increases based on variations in the CPI.
At the end of each year, the rate at which CPP benefits will be increased as of
1 January the following year is announced. This rate is calculated by determining the
average CPI for the period from November of the preceding year to October of the
current year, subtracting the average CPI for the corresponding period of the year
before that, and dividing the result by the latter average CPI. The result is rounded to
three decimal places, then expressed as a percentage, by multiplying by 100.
For example, the average CPI was 122.6 from November 2012 to October 2013, and
121.5 from November 2011 to October 2012. The rounded result was 0.009, or 0.9%.
Therefore, CPP benefits were increased by 0.9% on 1 January 2014.
If the average (in this case, 122.6) had instead been lower than for the preceding
year (121.5), the result would have been less than 1. In this example, benefits would
not have been decreased, but would instead have been frozen until the average from
November to October exceeded the pre-freeze level (121.5).
The CPI for October is released during the second half of November so that the
indexing rate for the following year may be calculated. Indexing is based on the
all-items CPI, including all components.4 Raw data is used, meaning that the data
is not seasonally adjusted.5
2.2 OLD AGE SECURITY
OAS benefits (OAS pension, GIS, Allowance and Allowance for the Survivor) were
indexed annually until 1973.6 At that time, inflation was very high (particularly for
energy and food), so the government believed that quarterly indexation would provide
better protection against unexpected sharp increases in prices over the year. This
meant that administrative changes were needed to reduce the time required to
produce CPI data and prepare benefits.7
As is the case for the CPP, the OAS indexing calculation is based on the all-items CPI.8
Table 1 shows the various months where the CPI is used to index OAS benefits for
each quarter. For example, to calculate the 1 January 2014 rate of increase for benefits
from January to March 2014, the difference between the average monthly CPI from
August to October 2013 and the average CPI from May to July 2013 is divided by the
latter average. The result is rounded to three decimal places, then expressed as a
percentage, by multiplying by 100. On 1 January 2014, then, OAS benefits were
INDEXING OF CANADA PENSION PLAN AND OLD AGE SECURITY BENEFITS
LIBRARY OF PARLIAMENT 3 PUBLICATION NO. 2011-74-E
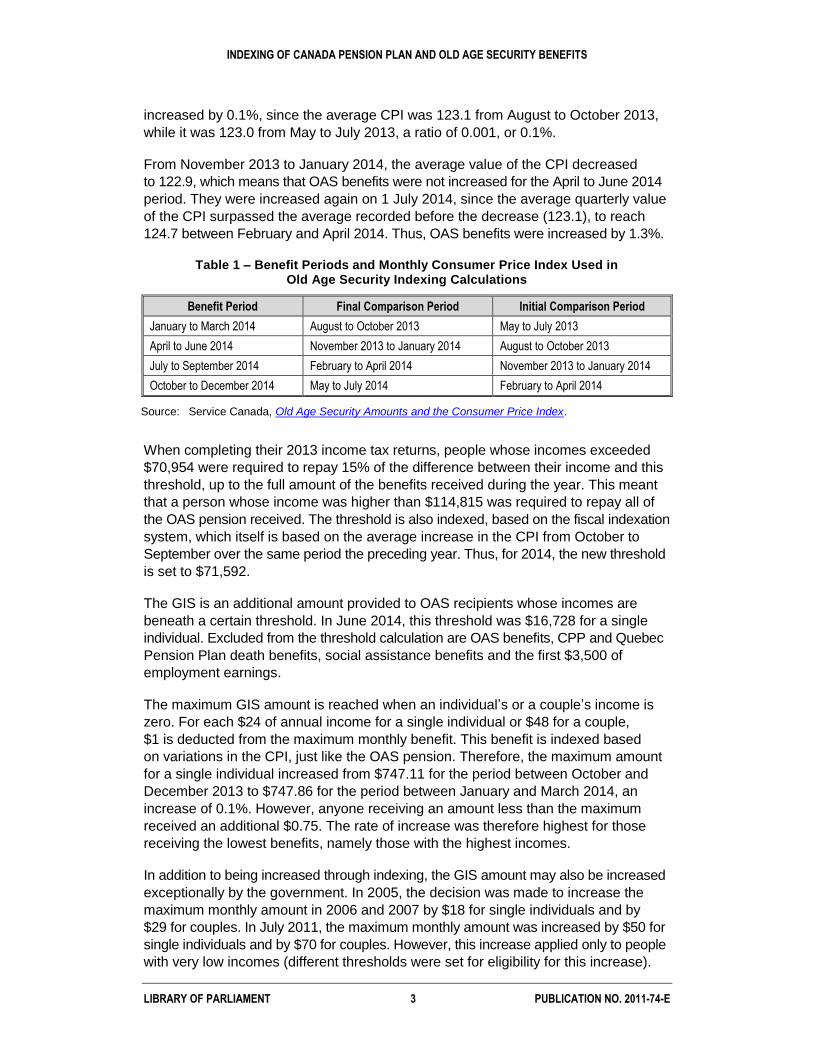
increased by 0.1%, since the average CPI was 123.1 from August to October 2013,
while it was 123.0 from May to July 2013, a ratio of 0.001, or 0.1%.
From November 2013 to January 2014, the average value of the CPI decreased
to 122.9, which means that OAS benefits were not increased for the April to June 2014
period. They were increased again on 1 July 2014, since the average quarterly value
of the CPI surpassed the average recorded before the decrease (123.1), to reach
124.7 between February and April 2014. Thus, OAS benefits were increased by 1.3%.
Table 1 – Benefit Periods and Monthly Consumer Price Index Used in Old Age Security Indexing Calculations
Benefit Period Final Comparison Period Initial Comparison Period
January to March 2014 August to October 2013 May to July 2013
April to June 2014 November 2013 to January 2014 August to October 2013
July to September 2014 February to April 2014 November 2013 to January 2014
October to December 2014 May to July 2014 February to April 2014
Source: Service Canada, Old Age Security Amounts and the Consumer Price Index.
When completing their 2013 income tax returns, people whose incomes exceeded
$70,954 were required to repay 15% of the difference between their income and this
threshold, up to the full amount of the benefits received during the year. This meant
that a person whose income was higher than $114,815 was required to repay all of
the OAS pension received. The threshold is also indexed, based on the fiscal indexation
system, which itself is based on the average increase in the CPI from October to
September over the same period the preceding year. Thus, for 2014, the new threshold
is set to $71,592.
The GIS is an additional amount provided to OAS recipients whose incomes are
beneath a certain threshold. In June 2014, this threshold was $16,728 for a single
individual. Excluded from the threshold calculation are OAS benefits, CPP and Quebec
Pension Plan death benefits, social assistance benefits and the first $3,500 of
employment earnings.
The maximum GIS amount is reached when an individual’s or a couple’s income is
zero. For each $24 of annual income for a single individual or $48 for a couple,
$1 is deducted from the maximum monthly benefit. This benefit is indexed based
on variations in the CPI, just like the OAS pension. Therefore, the maximum amount
for a single individual increased from $747.11 for the period between October and
December 2013 to $747.86 for the period between January and March 2014, an
increase of 0.1%. However, anyone receiving an amount less than the maximum
received an additional $0.75. The rate of increase was therefore highest for those
receiving the lowest benefits, namely those with the highest incomes.
In addition to being increased through indexing, the GIS amount may also be increased
exceptionally by the government. In 2005, the decision was made to increase the
maximum monthly amount in 2006 and 2007 by $18 for single individuals and by
$29 for couples. In July 2011, the maximum monthly amount was increased by $50 for
single individuals and by $70 for couples. However, this increase applied only to people
with very low incomes (different thresholds were set for eligibility for this increase).
INDEXING OF CANADA PENSION PLAN AND OLD AGE SECURITY BENEFITS
LIBRARY OF PARLIAMENT 4 PUBLICATION NO. 2011-74-E
The Allowance and Allowance for the Survivor are benefits provided to people between
the ages of 60 and 64 whose spouse is an OAS recipient or is deceased. Like the GIS,
these benefits are income tested. The monthly benefit decreases by $3 against the
maximum benefit for each $48 in annual income. The maximum amount is also
indexed, meaning that all recipients receive the same dollars increase, but not the
same percentage increase.
2.3 COMPARISON OF CHANGES IN PUBLIC PENSION PROGRAM BENEFITS AND THE CONSUMER PRICE INDEX
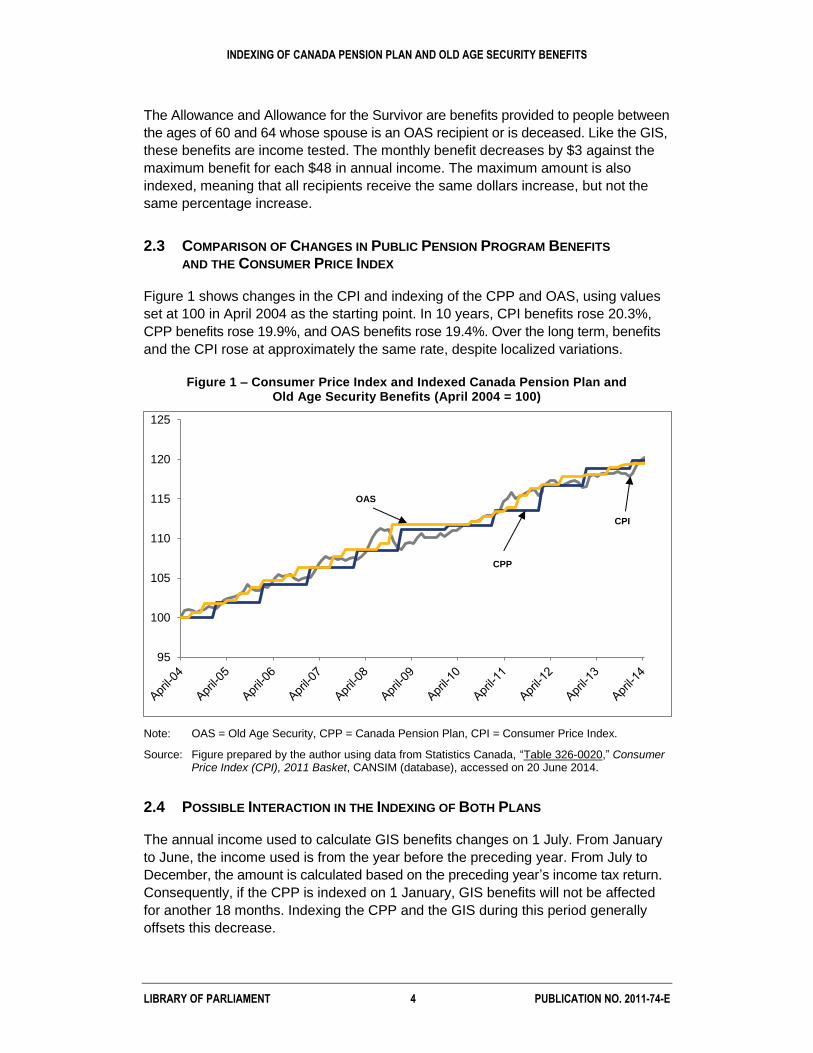
Figure 1 shows changes in the CPI and indexing of the CPP and OAS, using values
set at 100 in April 2004 as the starting point. In 10 years, CPI benefits rose 20.3%,
CPP benefits rose 19.9%, and OAS benefits rose 19.4%. Over the long term, benefits
and the CPI rose at approximately the same rate, despite localized variations.
Figure 1 – Consumer Price Index and Indexed Canada Pension Plan and Old Age Security Benefits (April 2004 = 100)
Note: OAS = Old Age Security, CPP = Canada Pension Plan, CPI = Consumer Price Index.
Source: Figure prepared by the author using data from Statistics Canada, “Table 326-0020,” Consumer Price Index (CPI), 2011 Basket, CANSIM (database), accessed on 20 June 2014.
2.4 POSSIBLE INTERACTION IN THE INDEXING OF BOTH PLANS
The annual income used to calculate GIS benefits changes on 1 July. From January
to June, the income used is from the year before the preceding year. From July to
December, the amount is calculated based on the preceding year’s income tax return.
Consequently, if the CPP is indexed on 1 January, GIS benefits will not be affected
for another 18 months. Indexing the CPP and the GIS during this period generally
offsets this decrease.
95
100
105
110
115
120
125
CPP
OAS
CPI
INDEXING OF CANADA PENSION PLAN AND OLD AGE SECURITY BENEFITS
LIBRARY OF PARLIAMENT 5 PUBLICATION NO. 2011-74-E
However, since both plans are not indexed at the same time or at the same rate,
occasionally the GIS benefit amount may temporarily be lower because of CPP
indexing. The Allowance and Allowance for the Survivor may be similarly affected.
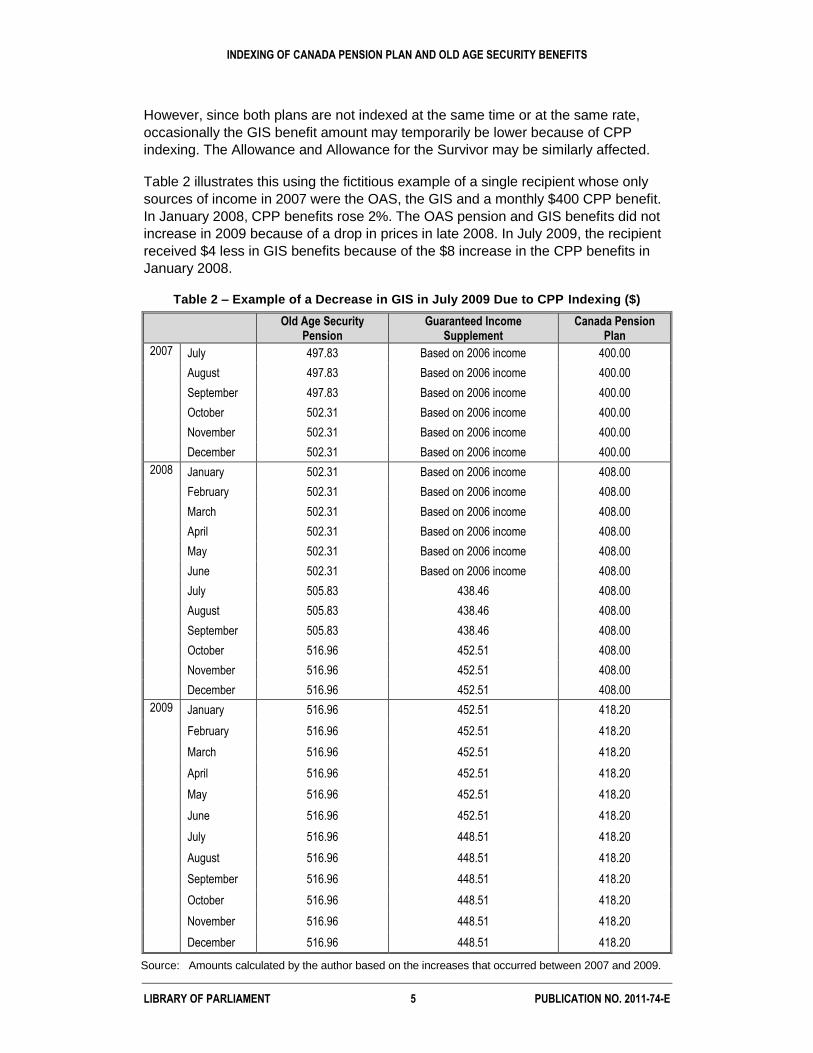
Table 2 illustrates this using the fictitious example of a single recipient whose only
sources of income in 2007 were the OAS, the GIS and a monthly $400 CPP benefit.
In January 2008, CPP benefits rose 2%. The OAS pension and GIS benefits did not
increase in 2009 because of a drop in prices in late 2008. In July 2009, the recipient
received $4 less in GIS benefits because of the $8 increase in the CPP benefits in
January 2008.
Table 2 – Example of a Decrease in GIS in July 2009 Due to CPP Indexing ($)
Old Age Security
Pension Guaranteed Income
Supplement Canada Pension
Plan
2007 July 497.83 Based on 2006 income 400.00
August 497.83 Based on 2006 income 400.00
September 497.83 Based on 2006 income 400.00
October 502.31 Based on 2006 income 400.00
November 502.31 Based on 2006 income 400.00
December 502.31 Based on 2006 income 400.00
2008 January 502.31 Based on 2006 income 408.00
February 502.31 Based on 2006 income 408.00
March 502.31 Based on 2006 income 408.00
April 502.31 Based on 2006 income 408.00
May 502.31 Based on 2006 income 408.00
June 502.31 Based on 2006 income 408.00
July 505.83 438.46 408.00
August 505.83 438.46 408.00
September 505.83 438.46 408.00
October 516.96 452.51 408.00
November 516.96 452.51 408.00
December 516.96 452.51 408.00
2009 January 516.96 452.51 418.20
February 516.96 452.51 418.20
March 516.96 452.51 418.20
April 516.96 452.51 418.20
May 516.96 452.51 418.20
June 516.96 452.51 418.20
July 516.96 448.51 418.20
August 516.96 448.51 418.20
September 516.96 448.51 418.20
October 516.96 448.51 418.20
November 516.96 448.51 418.20
December 516.96 448.51 418.20
Source: Amounts calculated by the author based on the increases that occurred between 2007 and 2009.
INDEXING OF CANADA PENSION PLAN AND OLD AGE SECURITY BENEFITS
LIBRARY OF PARLIAMENT 6 PUBLICATION NO. 2011-74-E
As can be seen, the combined CPP and GIS amount decreased from June to
July 2009, which may appear unfair since benefits are not supposed to decrease
when the CPI drops. It should be noted that the CPP increase on 1 January 2008
reflected rises in the CPI that had been occurring since late 2006, which had already
led to OAS and GIS increases in 2007 and 2008. The recipient had therefore already
benefited from these increases. In fact, not until July 2009 did it become apparent
that the GIS amount was too high, since it was based on the $400 monthly CPP benefit.
The decrease was therefore due to the 18-month delay and the different methods
used to index both plans.
3 DOES THE CONSUMER PRICE INDEX REFLECT ACTUAL SPENDING BY SENIORS?
3.1 DIFFERENCE IN CONSUMPTION PATTERNS BETWEEN SENIORS AND THE REST OF THE POPULATION
The consumption patterns of seniors are probably not the same as those for the rest
of the population. Statistics Canada studied spending by seniors based on the
Survey of Household Spending, which is used to weight the CPI’s various components
(goods and services).9
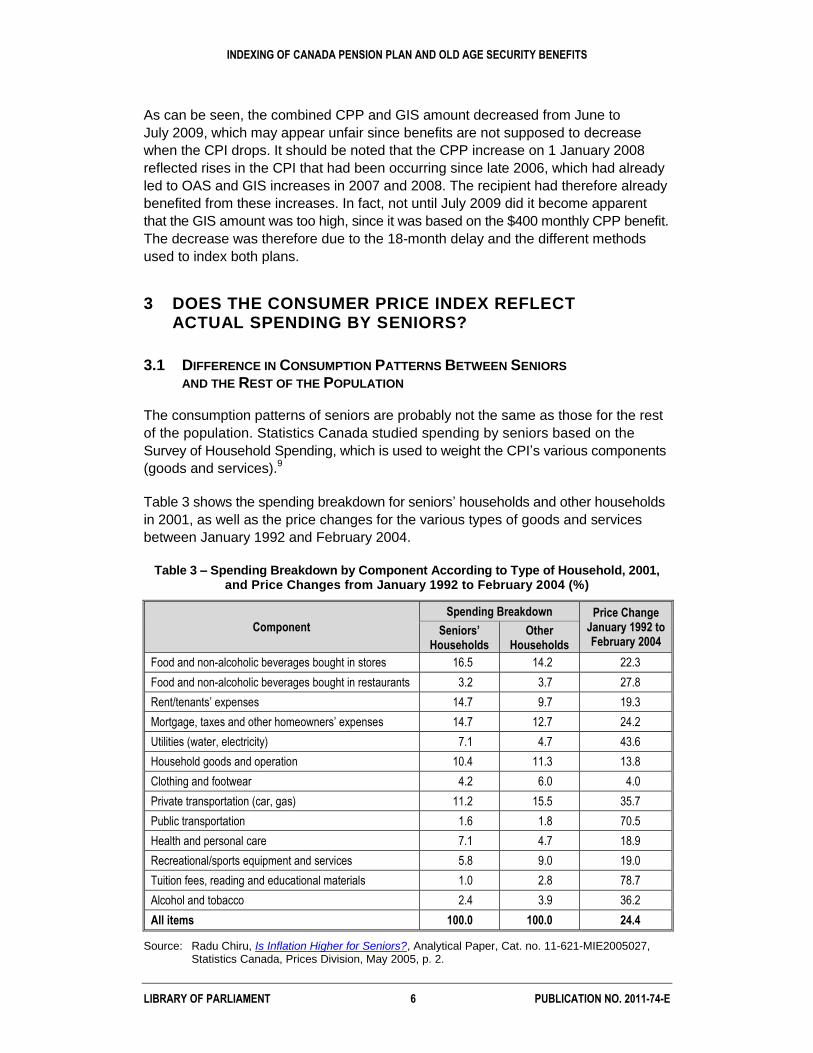
Table 3 shows the spending breakdown for seniors’ households and other households
in 2001, as well as the price changes for the various types of goods and services
between January 1992 and February 2004.
Table 3 – Spending Breakdown by Component According to Type of Household, 2001, and Price Changes from January 1992 to February 2004 (%)
Component
Spending Breakdown Price Change January 1992 to February 2004
Seniors’ Households
Other Households
Food and non-alcoholic beverages bought in stores 16.5 14.2 22.3
Food and non-alcoholic beverages bought in restaurants 3.2 3.7 27.8
Rent/tenants’ expenses 14.7 9.7 19.3
Mortgage, taxes and other homeowners’ expenses 14.7 12.7 24.2
Utilities (water, electricity) 7.1 4.7 43.6
Household goods and operation 10.4 11.3 13.8
Clothing and footwear 4.2 6.0 4.0
Private transportation (car, gas) 11.2 15.5 35.7
Public transportation 1.6 1.8 70.5
Health and personal care 7.1 4.7 18.9
Recreational/sports equipment and services 5.8 9.0 19.0
Tuition fees, reading and educational materials 1.0 2.8 78.7
Alcohol and tobacco 2.4 3.9 36.2
All items 100.0 100.0 24.4
Source: Radu Chiru, Is Inflation Higher for Seniors?, Analytical Paper, Cat. no. 11-621-MIE2005027, Statistics Canada, Prices Division, May 2005, p. 2.
INDEXING OF CANADA PENSION PLAN AND OLD AGE SECURITY BENEFITS
LIBRARY OF PARLIAMENT 7 PUBLICATION NO. 2011-74-E
Seniors devote a smaller proportion of their spending to recreational/sports equipment
and services and to clothing and footwear than the overall population. As a result, they
were less able to benefit from lower inflation in these areas between 1992 and 2004.
Utilities make up a greater portion of their spending, and inflation in this area was
higher than average.
On the other hand, seniors commit a higher share of their spending to health and
personal care, as well as to mortgages and property taxes. These areas were less
affected by inflation, which helped ease the burden on seniors. In addition, sharp
increases in tuition during this period, which pushed up the inflation rate, had little
impact on seniors.
From 1992 to 2004, the average annual inflation rate was 1.95% for seniors-only
households compared to 1.84% for all other households. The inflation rate was
therefore slightly higher for seniors. However, the difference is minimal and could be
offset by changes in consumption patterns.
Another Statistics Canada study shows identical inflation for the population as a whole
and for low-income seniors between 1992 and 1997,10
whereas the CPI appears to
have slightly underestimated inflation experienced by all seniors for the same period.
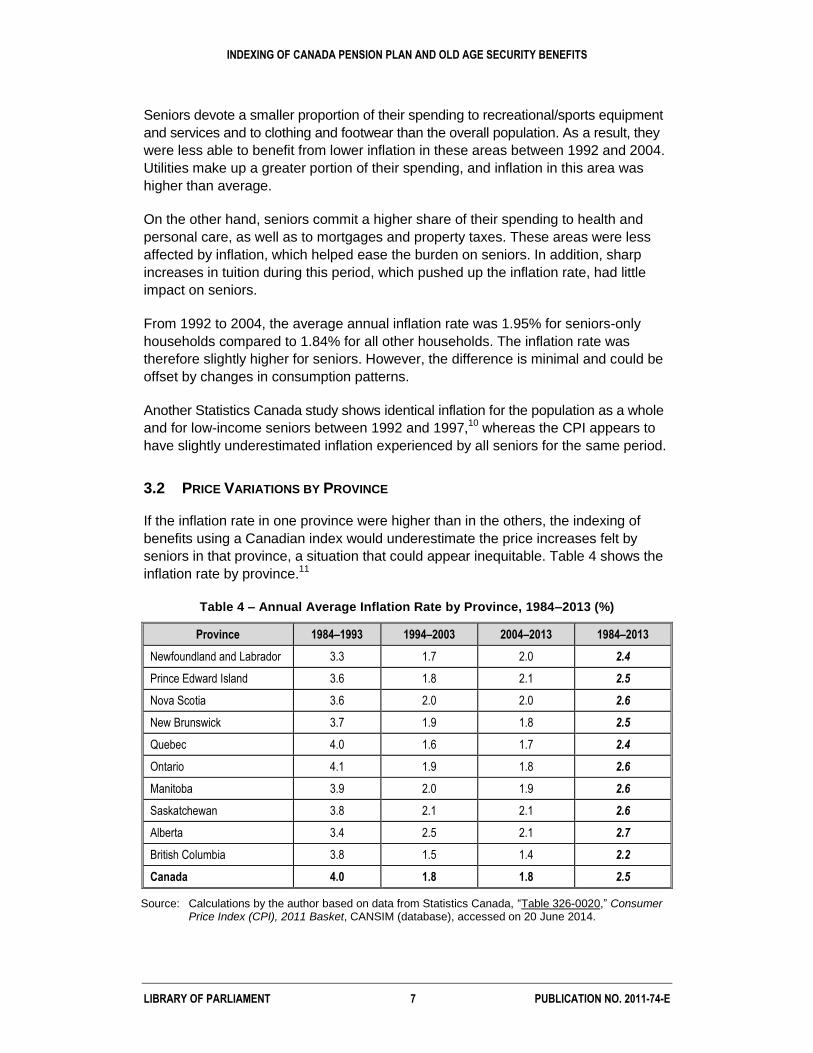
3.2 PRICE VARIATIONS BY PROVINCE
If the inflation rate in one province were higher than in the others, the indexing of
benefits using a Canadian index would underestimate the price increases felt by
seniors in that province, a situation that could appear inequitable. Table 4 shows the
inflation rate by province.11
Table 4 – Annual Average Inflation Rate by Province, 1984–2013 (%)
Province 1984–1993 1994–2003 2004–2013 1984–2013
Newfoundland and Labrador 3.3 1.7 2.0 2.4
Prince Edward Island 3.6 1.8 2.1 2.5
Nova Scotia 3.6 2.0 2.0 2.6
New Brunswick 3.7 1.9 1.8 2.5
Quebec 4.0 1.6 1.7 2.4
Ontario 4.1 1.9 1.8 2.6
Manitoba 3.9 2.0 1.9 2.6
Saskatchewan 3.8 2.1 2.1 2.6
Alberta 3.4 2.5 2.1 2.7
British Columbia 3.8 1.5 1.4 2.2
Canada 4.0 1.8 1.8 2.5
Source: Calculations by the author based on data from Statistics Canada, “Table 326-0020,” Consumer Price Index (CPI), 2011 Basket, CANSIM (database), accessed on 20 June 2014.
INDEXING OF CANADA PENSION PLAN AND OLD AGE SECURITY BENEFITS
LIBRARY OF PARLIAMENT 8 PUBLICATION NO. 2011-74-E
Over the last 30 years, the average annual inflation rate was 2.5% in Canada, ranging
from 2.2% in British Columbia to 2.7% in Alberta. Overall, these differences are
minimal in the long term. Some provinces experience higher-than-average rates in
one decade and then lower-than-average rates in the next. The fact remains that if
benefits had been indexed using a provincial CPI, a $100 benefit paid in 1983 in
British Columbia would have grown to roughly $194.87 by 2013; the same benefit
would have grown to $221.10 in Alberta.
That said, provinces with higher inflation rates often enjoy stronger growth, lower
unemployment and higher average incomes, which allows residents to better prepare
for retirement. These factors could justify the gap between the pension indexing rates
and the actual inflation rates in these provinces.
4 CONCLUSION
This paper has presented some observations about CPP and OAS benefits and the
effects of basing their indexing on the CPI.
CPP benefits are indexed annually, while OAS benefits are indexed quarterly. Some
interaction between the two programs leads, in very rare instances, to temporary
decreases in GIS or Allowance benefits due to CPP indexing. However, this decrease
is offset by prior increases in the GIS and the OAS pension.
Use of the CPI appears to have resulted in a very slight underestimation of the inflation
experienced by seniors between 1992 and 2004, because seniors’ consumption
patterns differ from those of other age groups.
Those consumption patterns are likely to change, which could help reduce the small
gap between the inflation experienced by seniors and that felt by the rest of the
population. For instance, seniors could become as great consumers of computers
and electronics, whose prices are dropping, as younger people.
The gap in inflation experienced by seniors and others is smaller than the differences
in inflation among the provinces. Despite this, interprovincial differences remain
relatively minor in the long term. It would be important to monitor these trends to
determine whether both types of gaps narrow or widen.
NOTES
1. In December, benefits are paid on the three banking days before Christmas.
2.
Most of the information in this paper comes from Service Canada, Canada Pension Plan
Amounts and the Consumer Price Index and Old Age Security Amounts and the
Consumer Price Index, as well as from the Old Age Security Act, R.S.C., 1985, c. O-9,
and Canada Pension Plan, R.S.C., 1985, c. C-8.
3.
Other factors are used to calculate benefits, such as age at first benefit payment, which
ranges between 60 and 70 years old.
INDEXING OF CANADA PENSION PLAN AND OLD AGE SECURITY BENEFITS
LIBRARY OF PARLIAMENT 9 PUBLICATION NO. 2011-74-E
4.
Other CPI indexes exclude certain more volatile components, such as food and energy.
The CPI used for indexing does not exclude any components and represents the average
basket of goods consumed in Canada.
5.
Seasonally adjusted data eliminates the seasonal effect of the CPI. Raw data and
seasonally adjusted data yield essentially the same result for a 12-month average, which
is also the case for CPP benefits.
6.
In 1973, only the GIS and the OAS pensions were in place. The Allowance was created
in 1975, and the Allowance for the Survivor was created in 1985.
7.
See House of Commons, Debates, 1st Session, 29
th Parliament, 4 September 1973,
pp. 6201–6204.
8.
Raw (non-seasonally adjusted) data is used to index benefits based on actual price
increases experienced by recipients, whether these increases are seasonal or not.
As well, the raw data is practically never revised, as opposed to seasonally adjusted
data; raw data is preferred so as not to have to make too many retroactive adjustments
caused by revised data.
9.
Radu Chiru, Is Inflation Higher for Seniors?, Analytical Paper,
Cat. no. 11-621-MIE2005027, Statistics Canada, Prices Division, May 2005.
10.
Nathalie Taktek, Comparative Study of Analytical Consumer Price Indexes (CPI)
for Different Subgroups of the Reference Population, Analytical Series No. 13,
Cat. no. 62F0014MPB, Statistics Canada, Prices Division, June 1998.
11.
There is no CPI for each entire territory, although there are indexes for Whitehorse,
Yellowknife and Iqaluit.