index investing and corporate investment-price sensitivity
TRANSCRIPT

Index Investing and Corporate Investment-Price Sensitivity
Matthew T. Billetta
Ha Diep-Nguyenb
Jon A. Garfinkelc
August 3, 2020
Abstract
Firm investment-stock price sensitivity declines in S&P500 index membership, consistent with indexing undermining the “feedback” channel. To address endogeneity, we show that non-indexed focal firm investment is less sensitive to stock prices of peer firms in the index. Results are concentrated in later years when passive investing rose to prominence, and also when the (indexed) peer’s passive ownership is higher. The learning channel is supported by: stronger results when peer price informativeness is lower; by weaker results when the focal firm manager is relatively more informed; and by dynamic reallocation of focal firm investment sensitivity to indexed vs. non-indexed peers.
We thank Laurent Frésard, Robin Greenwood and Kristine Hankins for very helpful comments and suggestions. All errors remain our own. a Indiana University, Bloomington, IN 47405, [email protected] b Purdue University, , [email protected] c University of Iowa, Iowa City, IA 52242, [email protected]

1
1. Introduction
Passive investing is now the dominant strategy. As of April 30, 2019, U.S. investors had as much
wealth dedicated to passive stock funds, $4.3 Trillion, as they had invested in active stock funds. 1
Moreover, from 2008 to 2018, the percent of U.S. stock ownership specifically held in index funds
doubled. Numerous papers document significant asset pricing effects from indexing, including both excess
volatility and excess comovement amongst index members (e.g. Barberis, Shleifer and Wurgler (2005) as
well as Greenwood (2008)). If these effects are either due to - or result in - increased stock price noise,
then indexing may associate with reduced stock price informativeness.
While the asset pricing implications of indexing have received much attention in the literature,
we know far less about the influence of these investor-behavior changes on corporate financial decision
making.2 In particular, given the above-noted concern that indexing reduces stock price informativeness,
corporate managers may (now) learn less from stock markets. This should have widespread real effects
on corporate policies given the large literature demonstrating that managers both acquire and use
information from stock prices (see in particular: Dow and Gorton (1997); Chen, Goldstein and Jiang (2007);
Bakke and Whited (2010); Foucault and Fresard (2012, 2014); Edmans, Jayaraman and Schneemier
(2017)). In this paper we study perhaps the fulcrum implication of this literature; corporate investment-
stock price sensitivity, and the effect of indexing on this feedback channel.
Our first set of tests investigate whether S&P500 membership affects corporate investment-stock
price sensitivity. We show that firms who join the S&P500 exhibit reduced sensitivity ex-post. We also
1 “History Made: U.S. Passive AUM Matches Active for First Time”; Institutional Investor, May 17, 2019, https://www.institutionalinvestor.com/article/b1fg0jnvbpc536/History-Made-U-S-Passive-AUM-Matches-Active-For-First-Time 2 Though recently work in this area has picked up. Brogaard, Ringgenberg and Sovich (2019) explore how financialization of commodities influences corporate performance of commodity-using/reliant firms. Bennett, Stulz and Wang (2020a) show that TFP (total factor productivity) falls when a firm joins the S&P500. In contemporaneous work, Bennet et al. (2020b) ask whether S&P500 index membership hurts the joining firm in terms of poor returns, weaker governance, and lower ROA, among other effects.

2
confirm the extant asset pricing result that commonly used measures of stock price informativeness (of
firms who joined) decline ex-post. Taken together, these results are consistent with managers using less
information from stock prices in making investment decisions when their firm belongs to the index.
However, endogeneity concerns may confound interpretations of these results. First, firms joining
the S&P500 are not chosen randomly, and unobservable (time-varying) characteristics may be a
determinant of index adoption.3 If said unobservable traits also change around indexing, in such a way as
to reduce a firm’s investment-price sensitivity, then we cannot draw causal inferences from the
documented reduction in investment-price sensitivity.
Second, if the act of index adoption itself exposes the corporate investment decision-making
process to (unobserved) non-stock price factors, it could lead to decreased investment-price sensitivity.
For example, if belonging to the S&P500 increases pressure to grow or attempt to garner attention, then
investment policy may change for reasons independent of the stock price, likely reducing the measured
investment-price sensitivity.
To address these endogeneity concerns, we investigate the investment behavior of firms that do
not join the index but are likely affected by the index adoption of related firms. Dessaint et al. (2018) and
Foucault and Fresard (2014) show that firms’ investment is sensitive to peer firm stock prices. Using their
frameworks, we study the investment sensitivity of focal firms to index-joining-peer firm stock prices.
Given that the focal firm is not subject to selection concerns associated with S&P500 index inclusion, any
documented changes in the sensitivity of focal firm investment to peer price around index adoption of
peer firms, should not be caused by selection effects due to index membership of the focal firms as
discussed above.
Our main tests explore the influence of peer stock price on focal firm investment when the peer
belongs to the S&P500. If index membership undermines the informativeness of stock prices, then peer
3 Time invariant unobservable characteristics (and their influence) will be captured by inclusion of fixed effects.

3
index membership should reduce the focal firm’s ability to learn about investment opportunities from the
peer’s stock price.4 As a result, the focal firm becomes less reliant on the peer’s stock price when setting
its own investment policy.
We find evidence supporting this hypothesis. Specifically, we find that when a peer firm belongs
to the S&P500 index, the (focal) firm’s investment becomes less sensitive to the peer’s stock price. Our
results are consistent with the joint hypothesis that peer-index membership reduces the information
content of peer-stock prices, leading focal-firm managers to rationally reduce their reliance on those peer
firms’ stock prices when setting their own investment decisions.
We address several threats to identification. First, time-varying within-pair omitted variables may
simultaneously lead the peer firm to join the index and the focal firm to change their investment policy.
We therefore study variations in indexing intensity (in both the time series and the cross-section), and
compare the treatment effects coming from two groups of peers who both join the index, but one of
which has higher indexing activity than the other. We argue that if the change in investment-price
sensitivity is not driven by indexing activity, but rather is merely a manifestation of index membership (or
unobservable factors that correlate with index membership), then we would expect to see no significant
difference in the effects between the high and low indexing intensity groups.
We first take a broad view of indexing intensity. As our sample of changes in S&P500 index
membership covers periods both before and after the prominent rise of index investing, we split our
sample into pre- and post-2005. We find that the decrease in sensitivity of focal-firm investment to peer
stock price around S&P500 membership, is only significant in the later period (i.e., when index investing
is much more influential). Specifically, the change in investment sensitivity to peer stock price is four times
stronger (more negative) during the post-2005 period. 5
4 The peer should necessarily face demand driven investment opportunities that overlap with the focal firm. As we discuss in greater detail below, that leads us to specify peers using the Hoberg-Phillips (2016) groupings. 5 We also provide results using other cut-offs (year 2000 or year 2010) which yield similar interpretations.

4
We also exploit cross-sectional differences in the changes in passive ownership following index
adoption. Sorting peer firms into groups based on the degree of passive ownership change, we find that
the treatment effects of index membership are concentrated among peers with the highest increases in
their passive ownership (index investing activity). In addition, as a falsification test we run our regression
using all institutional holdings instead of only passive holdings and find insignificant differences in the
effects between peers with high and those with low institutional ownership. The null result of the
falsification test suggests that the documented effects in the investment-peer firm stock price sensitivity
is not caused by differences in overall institutional ownership. It is indeed the difference in passive
ownership that is driving the results.6
Another concern may simply be alternative interpretations. 7 To underline our hypothesized
learning channel, we recognize that the asset pricing literature has emphasized that correlated investor
demand (from index investing) leads to noisier stock prices for index member firms. Therefore, we explore
how comovement as an inverse proxy for stock price informativeness, affects investment-price sensitivity.
Following that literature, we use Beta and R2 from regressions of firm returns on S&P500 index or
market returns to capture comovement. We find that both the Beta and R2 increase following index
adoption, consistent with prior studies. We then split the sample based on changes in peer firm
comovement. We find the decrease in the (focal) firm’s investment sensitivity to the peer’s stock price
(upon peer joining the index) is much more pronounced when the peer firm experiences a greater increase
in comovement. This too supports our learning hypothesis.
In our second analysis to buttress the learning channel explanation, we explore how the
treatment effect varies with the focal firm’s own information quality. We argue that managers with better
quality of private information about their firm may rely less on information from its peers' valuation (à la
6 Any concerns with omitted variables would have to be able to explain the relationship between investment-peer Q sensitivity and index membership in a way that systematically varies with indexing intensity. 7 One of which we confront directly (see below).

5
Foucault and Fresard (2014) and Edmans et al. (2017)). Therefore, they need not significantly adjust their
investments to the peer’s stock prices following the peer’s index adoption. We test this prediction using
the trading activity of the focal firm’s insiders, as well as the profitability of their trades, as proxies for the
quality of their private information. We find support for our hypothesis. The drop in investment to peer-
price sensitivity due to a peer’s indexing is significantly muted for focal firms with greater managerial
information quality, relative to those of focal firm managers with lower information quality.
Our third analysis of the learning channel tests an extension of the dynamic reallocation of
attention hypothesis that Foucault and Fresard (2014) posit. They argue that Bayesian managers will
increase attention on own-firm stock price when the peer’s stock price becomes less informative. While
this may happen in our setting, there is a third candidate stock that carries information – another peer
that was not indexed. Focal firm managers can dynamically adjust their use of both own stock price and
non-indexed peers’ stock prices, as any particular peer joins the index. Indeed we find that indexed peers’
stock prices carry less information for focal firm investment than both the focal firm’s price and other
(non-indexed) peers’ stock prices, in the latter part of our sample when passive investing rose to
prominence.
Finally, we investigate and find no support for one alternative interpretation of our results;
financial constraints. Baker et al. (2003) show that constrained firms have higher investment-stock price
sensitivity. If joining the S&P500 reduces financial constraints, then Baker and Wurgler (2003) would
suggest that this could lead to a reduction in investment-stock price sensitivity. Moreover, Wurgler and
Zhuravaskaya (2002) and Greenwood (2005) suggest firms related to the indexed one may also experience
incidental demand. Thus the focal firm may see relaxation of constraints and a concomitant reduction in
investment stock price sensitivity, when a peer joins the S&P500. However, we find no evidence of our
treatment effect among ex-ante constrained firms, inconsistent with this alternative explanation.

6
Our paper offers the following contributions. We are the first to study the combined effects of
S&P500 indexing and peer stock price information on (focal firm) corporate investment. The latter
element is particularly important because it shows that the feedback effect of asset prices to corporate
investment is not limited to own-firm relationships.8 This significantly broadens our view on asset pricing-
corporate finance linkages (à la Dessaint et al. (2018)).9
We also speak to a recent debate on the influence of indexing to stock price informativeness.
While Barberis et al. (2005), Greenwood (2008), Boyer (2011), and Bennett et al. (2020a) all argue for a
negative relationship, several others posit otherwise.10 We lean in the former direction. It is difficult to
construct a plausible narrative for increased (or even unchanged) stock price informativeness due to
indexing, while simultaneously finding that the indexed stock(s) receive(s) less attention in corporate
investment decisions. This would run counter to long-standing broad support of the main inference from
the investment feedback literature.
Third, we underline the learning channel in a couple of ways. One is through recognition that
passive investing has risen in prominence particularly over the last decade, and this conjoins with a
stronger treatment effect. These results enhance the timeliness of our study. A second underlining is
through the dynamic reallocation of attention by focal firm managers to own-firm and other-peer stock
prices. This enhances our understanding of the nuances of the feedback effect. Overall, our paper both
broadens and deepens our understanding of asset pricing-corporate finance linkages.
8 As well as because it enhances identification. 9 Notably though, our inference differs from theirs. We discuss in greater detail below, but primarily our experiment uses a different catalyst for changing stock price informativeness. 10 David et al. (2016) concludes that learning from stock prices is limited. Bai et al. (2016) suggests stock price informativeness has risen over time for S&P500 firms, contemporaneous with the rise of indexing. Coles et al. (2020) argue that index investing does not affect price efficiency.

7
2. Related Literature Review
2.1. Indexing and Stock Price Informativeness
There are two opposing views on the direction of the relationship, with earlier work largely
indicating a negative relationship, and later work largely a positive one. Our paper informs the debate by
couching the argument within the well-documented feedback-hypothesis literature.
2.1.1. Early work: Indexing undermines stock price informativeness
Barberis et al. (2005) are among the first (after Vijh (1994)) to show that comovement of a stock
with the index rises after inclusion in that index. They are particularly contributory in providing results
that distinguish the sentiment- or frictions-based explanation for this phenomenon, from the
fundamentals-based explanation. Their bivariate regressions show opposite effects of index-membership
on the beta of the stock with the index vs. the beta of the stock with the non-index remainder of the
market. This result is not consistent with fundamentals, but is consistent with frictions or sentiment. They
also highlight the growth in this effect from the sample period studied in earlier work, to the current
period. As indexing became more popular, so did the link between index membership and comovement.
Greenwood (2008) approaches the role of indexing in comovement using the Nikkei’s price-
weighting as opposed to value-weighting scheme. The price-weighting implies some index members are
over-weighted in comparison to their role in a value-weighted index (and vice versa). The analysis reveals
that over-weighting in the Nikkei associates with greater comovement, again suggesting that indexing
undermines the informativeness of stock price.
Boyer (2011) also shows that belonging to an index can cause excess covariation. He studies the
link in cases where arguably random reassignment between growth and value sub-indices of the S&P or
Barra groupings occur. Results indicate that the reassigned stock commoves more with the new index,
even when fundamentals suggest it still shares more economic characteristics with (or proximity to) the
old index.

8
Anton and Polk (2014) confirm the underlying notion that shared ownership – as happens with
indexing – causes greater comovement, via a natural experiment. Exploiting the 2003 mutual fund scandal
that exogenously reduced some mutual fund holdings, they connect the event with variation in common
ownership of some of the stocks those funds held. In turn, this variation associates with reduced abnormal
return correlations, indicating that common ownership positively influences comovement.
Finally (and more recently), Bennett et al. (2020a) show that two measures of stock price
informativeness decline in S&P500 membership. PIN (Easley et al. 2002) weakly falls in the one-to-two
years following addition. PSI (firm-specific stock return variation measured as in Durnev et al. 2004)
declines significantly in the one-to-two years following addition.
Taken together, the above papers indicate a positive relationship between index membership and
stock comovement. The sensitivity is often characterized as excess, suggesting a disconnect between
fundamentals and the observed return correlations. This literature concludes that indexing undermines
the information content of the stock price; it makes the observed return reflect fundamentals less than
otherwise.
2.1.2. Recent work: Indexing does not reduce stock price informativeness
David et al. (2016) link firm productivity to learning via resource allocation, when the learning is
through both internal information and external financial markets. The former carries primary importance.
Imperfect internal information undermines capital and especially labor decisions, and therefore
productivity. However, evidence on the latter potential effect is weak; learning from financial markets has
little influence on productivity (even in the U.S. where financial market information is thought to be
particularly useful). While this does not speak directly to indexing’s effect on stock price informativeness,
it questions the importance of stock prices for decision-making.
Bai et al. (2016) study the link between current stock price and future earnings – the extent to
which stock price captures information about future outcomes – for S&P500 firms. This link has risen over
9
time, suggesting stock prices impound more information about future outcomes among indexed firms
recently. This is opposite the narrative that rising indexing and passive investing undermine stock price
informativeness. However, it may alternatively reflect indexed firms’ increasing desire to manage earnings
towards expectations.
Coles et al. (2020) examine stocks that migrate from (the bottom of) the Russell 1000 to (the top
of) the Russell 2000. Chang et al. (2015) highlight that such changes raise the value-weight of the migrating
firm inside the new index. Coles et al. (2020) show that this affects investor composition and trading
activity. In turn this influences information production in the form of search efforts by investors and
analyst output. However, these effects apparently do not extend to impede price efficiency; there is no
apparent reduction in variance ratios nor anomalies (particularly post earnings announcement drift). They
conclude that indexing does not undermine stock price informativeness.
2.2. Investment-Price Sensitivity
A key paper providing theory that stock prices convey information to inform corporate managers’
investment decisions comes from Dow and Gorton (1997). They argue specifically that a firm’s stock price
conveys information to managers about the company’s potential investment opportunities.
Simultaneously though (they note), stock prices also summarize information about the efficiency of past
manager decisions. The dual information content presents challenges to empirical work seeking to identify
the first component.
Many papers followed, progressively getting more precise about identifying the feedback (from
stock prices to future investment decisions) channel. Chen et al. (2007) confront the relationship with two
accepted measures of stock price informativeness; PIN and stock price synchronicity. When the measures
indicate more informative stock price, investment is more positively related to that stock price. Foucault
and Fresard (2012) come at the problem of measuring stock price informativeness indirectly. They show

10
that cross-listing associates with a firm increasing its reliance on stock price for investment decisions. They
argue this happens as a result of the stock price becoming more informative after cross-listing.
Later work by Foucault and Fresard (2014) highlights a choice that managers face when relying on
stock price to inform investment. They note that a firm’s product market peers are subject to similar
demand structure as the focal firm, and so a peer’s stock price may be informative about investment
opportunities that the focal firm faces. Therefore, the focal firm could rely on the peer’s stock price as
well as their own, to inform investment. The choice managers make is directly related to the relative
information content of the focal firm’s vs. the peer’s stock price. When the firm’s stock price is relatively
more informative, the reliance is more on that (as opposed to the peer’s) stock price, when determining
investment. When the peer’s stock price is relatively more informative, the reliance is more on the peer’s
stock price for investment decisions. The recognition that (product market) peers and their stock prices
may contain useful information for the focal firm, underpins later work in this area, including ours.
Edmans et al. (2017) also emphasize the importance of relative information content. They show
that investment-stock price sensitivity is affected by more than just total information in stock price; it is
more influenced by information that the manager did not previously have. They measure such with insider
trading enforcement shocks. These shocks theoretically reduce informed trading, encouraging outsiders
to produce more information,11 and thus increasing the information in stock prices that managers do not
already possess. This should increase managers’ reliance on stock price information when making
investment decisions. The analysis indeed shows that investment-stock price sensitivity increases
afterward.
Dessaint et al. (2018) build on the work of Foucault and Fresard (2014). They explicitly recognize
the broadening impact of peer firm stock price for a focal firm’s investment decisions. However, they focus
on non-fundamental drops in the stock price of those peers, measuring such as the predicted value of a
11 The outsiders are no longer competing with insiders for profitable use (trading upon) of the information.

11
regression of the peer’s stock price on hypothetical sales of that stock by mutual funds experiencing large
investor redemptions. These peer stock price drops associate with reductions in the focal firm’s
investment. In short, managers of focal firms appear unaware that the decline in peer price is non-
fundamental, and they reduce their own firm’s investment [perhaps inappropriately]. The reduction in
investment associates with annual shareholder value losses in the range of $1 to $3.5 billion. The
documented inefficiency is further tied to situations when the focal firm’s managers are less likely to
understand the non-fundamental nature of it: when there is less overlap in mutual-fund ownership of
both the focal and peer firm.
Finally, Brogaard et al. (2019) explore the sharp increase in commodity indexing (known as
financialization) and its influence on commodity-using firms’ performance and behavior. They document
lower profits and higher costs, as well as evidence of decreased corporate investment efficiency by
exposed firms. While such tests by definition do not shed light on firm-specific feedback effects from stock
markets, they do indicate that market prices become less informative following financialization. Our study
complements theirs by showing that the effects of indexing have real consequences for (any) firm-specific
information production and feedback. This substantially broadens our view of the information
compromising influence of indexing and implications for corporate investment efficiency.
Overall, the literature on stock price information feeding (back) into managers’ investment
decisions strongly suggests a real economic effect. The debate is over how large – read widespread – this
effect is, and also concerns with identification. Our analysis contributes to both. By recognizing that peer
firms’ stock prices may affect a focal firm’s investment, the effect is broad. Our use of peer shocks also
helps to disentangle endogenous from causal effects. And our fixation on S&P500 indexing recognizes the
much greater emphasis on that index over others, in the passive investing universe.

12
3. Data and Variable Construction
3.1. Peer definition
We define peer firms as peers in the product-market space, using the Text-Based Network
Industry Classification (TNIC) developed by Hoberg and Phillips (2010, 2016). Hoberg and Phillips (2016)
construct this classification by analyzing the business description section of firms’ 10-K filings, where firms
give detail on the products they offer. For every pair of U.S. public firms, they calculate a score that
measures how similar products of the two firms are, based on the degree of commonality between their
product vocabulary vectors. Using these pairwise similarity scores, they then group firms into industries.
Specifically, for every firm, their categorization identifies its product market peers as all other firms with
a pairwise similarity score above a pre-specified minimum threshold. The threshold is determined so that
the generated groups (read industries) have the same fraction of industry pairs as the three-digit Standard
Industry Classification (SIC) system.
We believe the TNIC classification fits our research question for two reasons. First, the system
classifies firms based on the products that firms supply to the market, rather than inputs to their
production as NAICS does. Thus, firms within the same TNIC industry are more likely to be exposed to
common (demand) shocks that are in line with the type of information firms can learn from peers in the
theoretical framework of feedback effects. Second, as the business descriptions in 10-Ks are legally
required to be updated and representative of the current fiscal year, it follows that industry boundaries
in TNIC are dynamic. That is, when a firm modifies its product range or enters a new product-market, the
set of peer firms changes accordingly. This dynamic nature of TNIC is particularly useful when compared
to other static classification systems such as NAICS or SIC because it ensures that the identified peers are

13
relevant at the time of interest, which helps minimize false-negative errors due to confounding influence
from irrelevant peers.12
3.2. Index membership
For the purpose of our analysis, we need an index whose membership affects stock price
informativeness for non-fundamental reasons. Following Barberis et al. (2005), we choose the S&P500
index. First, the S&P 500 offers a clear and distinguishable turnover in its membership that helps with
identifying reclassification. Second, the stated goal of Standard and Poor’s is to make the index
representative of the U.S. economy, not to signal a view about future cash flows of any specific firms in
the index. Therefore, the act of adding a stock to the S&P 500 should not change investors’ perceptions
of the covariance between the included stock’s fundamental value and other stocks’ fundamental
values.13
In principle, the Russell 1000/2000 indexes would meet these requirements as well. However, we
believe that the Russell indexes are much less relevant to indexing than the S&P 500 when it comes to
market size. S&P500 is one of the most well-known barometers of the U.S. market and, thus, the most
followed index in terms of assets invested. Standard and Poors estimates that overall, more than USD 11.2
trillion in assets are indexed or benchmarked to S&P500. For example, all three of the largest ETFs (SPDR
SPY, iShares IVV, and Vanguard VOO) are indexed to the S&P500. Together, those three have $600 billion
of assets under management, while the three largest funds that track the Russell 1000 (from those same
families) have $50 billion in assets only.
More crucially, while increased comovement of stock prices with the broad market due to a firm
joining the S&P500 has been documented (Barberis et al., 2005), there has not been similar evidence
12 A null result using static peer identification can be incorrectly interpreted as indexing having no effects on investment-price sensitivity, even though it may actually reflect the fact that focal firms are not interested in learning from not-so-related peers, regardless of whether the peers are in the index or not. 13 Greenwood (2008) provides evidence that excess comovement induced by index membership is driven by correlated demand by investors who trade index stocks together, rather than changes in firm fundamentals.

14
concerning the Russell 1000/2000 index. A number of studies that use the Russell 1000/2000
reconstitution (Chang, Hong, and Liskovich, 2015; Wei and Young, 2019) find neither a significant change
in institutional ownership nor in comovement for stocks that move across the two indexes.14
Furthermore, starting from 2007, the FTSE group implemented a new method to construct the
Russell 1000/2000 index, which they refer to as the “banding” policy. This change in methodology makes
membership less clear-cut and more subject to factors that are endogenous to firm fundamentals. Indeed,
papers that use the Russell index to instrument for changes in exposure to indexing exclude the period
after 2006 for precisely this reason. As passive investing started to grow exponentially 10-15 years ago, a
study of indexing that disregards the recent years, in our opinion, would miss the period in which it
matters the most. Such a study would be considerably less meaningful.15 Overall, for these reasons, we
believe the S&P500 index is best suited to our research question.
3.3. Sample construction
Given the considerations mentioned above, we start our sample with all public firms in the TNIC
database from 1996 to 2017 and their according peers. We then match firms in TNIC to the CRSP-
Compustat Merged database (CCM) to identify their financial information. Firms in financial (SIC codes
6000-6999) and utility industries (SIC codes 4000-4999) are excluded. We also remove observations with
negative sales, or missing information on total assets, capital expenditures, fixed assets (property, plant,
and equipment), earnings before tax and (end-of-year) stock prices.
We restrict our sample to those pairs in which the peer changes its S&P500 membership at least
once. To determine a firm’s S&P500 membership status, we track its SPMIM flags in the CCM monthly
14 Some papers use the Russell 1000/2000 June ranking to identify index movers and find significant differences in institutional ownership. But the June ranking is subject to selection bias as the ranking is adjusted for publicly unavailable share (float adjusted). See Wei and Young (2019) and Appel, Gormley and Keim (2018) for a detailed discussion of this issue. 15 In fact, our analysis shows that the effects of indexing on learning was significantly weaker/statistically insignificant for the period prior to 2005. See section 4.3.1 for more details.

15
database. We aggregate the monthly data to the annual level, and a firm is considered to be in the S&P500
index for a particular year if it is in the index for at least nine months of that year.16 Our final sample
includes 58,290 pairs with 347,014 pair-year observations for 7,262 distinct firms. The average firm has
eight peers that change S&P index membership at least once during the studied period.
3.4. Summary statistics
Consistent with previous studies on the sensitivity of investment to stock price (Chen et al. (2007),
Foucault and Fresard (2013), Edmans et al. (2018)), we use Tobin's Q as a proxy for a firm's stock price. It
is defined as a firm's stock price times the number of shares outstanding plus the book value of assets
minus the book value of equity, all scaled by book assets.17 We also include control variables that may
affect corporate investment decisions. We proxy Firm Size with the natural logarithm of book value of
total assets, and we proxy Cash flows with the ratio of operating cash flows (EBIT + Depreciation) to book
assets. Appendix A describes the construction of all variables. To moderate the effect of outliers, we
winsorize all variables at 1% in both tails.
Table 1 presents descriptive statistics of these variables, which are generally in line with those
reported in related studies. Tobin's Q exhibits significant heterogeneity in our sample, ranging from 0.67
to 10.92, with a mean of 2.02 and a median of 1.36. The average capital investment rate (measured as
capital expenditure divided by lagged PP&E) is 34.6%, while the average R&D spending to book assets is
only 14%. We also report summary statistics for peers' characteristics. Peer firms are relatively larger than
focal firms, given that they are in the S&P500 index at some point in time. They also invest less but have
higher Tobin’s Q and are more profitable than the focal firms.
16 For robustness, we also identify S&P500 membership as staying in the index for at least six months of a year. Results are largely similar using this alternative definition. 17 Alternatively, we calculate Tobin’s Q as market value of equity plus values of long-term debt and preferred stock, scaled by total assets. Results are similar using this alternate definition of Tobin’s Q.

16
4. Results
4.1. Baseline: The Own-Firm Effects of Joining the S&P500
For benchmarking purposes, we first examine to what extent the sensitivity of a firm’s investment
to its own stock price changes as it moves in and out of the S&P500.
INV𝑖𝑖,𝑡𝑡 = αS𝑖𝑖,𝑡𝑡 + βQ𝑖𝑖,𝑡𝑡−1 + γS𝑖𝑖,𝑡𝑡×Q𝑖𝑖,𝑡𝑡−1 + Π𝐗𝐗𝒊𝒊,𝒕𝒕−𝟏𝟏 + µ𝑖𝑖 + δ𝑡𝑡 + ε𝑖𝑖,𝑡𝑡 (1)
The outcome variable INV𝑖𝑖,𝑡𝑡 for firm i in year t is either capital investment, measured as CAPEX in year t
scaled by lagged fixed assets (property, plant, and equipment); or R&D investment, measured as R&D in
year t scaled by lagged total assets. The explanatory variable Q𝑖𝑖,𝑡𝑡−1 is Tobin's Q (as defined earlier) of firm
i in year t - 1. S𝑖𝑖,𝑡𝑡 is a dummy that takes value of 1 if firm i is in the S&P500 index in year t, and 0 otherwise.
The coefficient of interest γ is expected to be negative. The vector 𝐗𝐗𝒊𝒊,𝒕𝒕−𝟏𝟏 includes control variables known
to correlate with investment decisions, including (natural log of) assets, as well as prior-year cash flows.
We also include firm fixed-effects (µ𝑖𝑖) to control for any unobservable time-invariant firm characteristics,
and time fixed-effects (δ𝑡𝑡) to account for market wide conditions.
Table 2 presents estimates for four variations of Eq. (1): two with CAPEX (columns (1) and (2)) and
two with R&D investment (columns (3) and (4)) as the dependent variable. The two regressions for each
dependent variable differ by definition of Q (see above and the appendix for details). In all four cases, the
following results obtain. First, consistent with previous literature, our results show a significant positive
relationship between investment and firm Q. Second, firms increase their investments as they enter the
S&P500 index. Third, the investment-price sensitivity drops significantly when firms belong to the
S&P500.18 The magnitude is nontrivial. A firm’s investment-price sensitivity when it is in the index is less
than half its sensitivity when it’s not.
18 In contemporaneous work, Bennett et al. (2020b) corroborate this finding.

17
In contemporaneous work Bennett et al. (2020b) corroborate our findings. They also show that
joining firms suffer poor financial results. One concern with these results on index joiners is that these
effects may be driven by selection and endogeneity for firms selected to join the S&P. We address such
concerns below with our main analysis that focuses on peer effects.
Finally, Table 2 illustrates similar effects in R&D. Focal firms rely less on peer Q when the peer is
indexed, to inform their R&D expenditures. Notably, the treatment effects in terms of R&D investment
are muted, with the reduction in investment-price sensitivity being approximately a third of the base rate.
Thus far, the documented decline in investment-price sensitivity when a firm belongs to the index
is consistent with the feedback channel explanation. That is, increased indexing activity makes it more
challenging for managers to extract fundamental information about their firm’s prospects from stock
prices. This reduces managers’ reliance on stock price when deciding on investment policy or, in other
words, investments become less sensitive to market prices.
However as noted earlier, endogeneity concerns are paramount. To repeat, firms joining the
S&P500 are not chosen randomly, and unobservable (time-varying) characteristics may be a determinant
of index adoption. If these characteristics change around the indexing event in ways that reduce a firm’s
investment-price sensitivity, our interpretations are compromised. Second, existing theories (e.g.,
financial or agency frictions) predict that managers may also alter investment sensitivity to their own stock
price for reasons other than the informative role of prices (such as hubris). If belonging to the S&P500
increases pressure to grow or attempt to garner attention, then investment policy may change for reasons
independent of the stock price, likely reducing the measured investment-price sensitivity.
Nevertheless, these alternative explanations for focal firm patterns do not easily explain
investment decision links to other firms’ stock prices. In contrast, the learning channel does—provided
that managers use other firms’ prices as signals. Therefore, to address the limitations of using own firm

18
stock prices, we next consider the response of a firm’s investment to its product market peers’ stock prices
instead.
4.2. Main Result: Focal Firm Investment Sensitivity to Peer firm Stock Price
4.2.1. Econometric specification discussion
To address the endogeneity concerns with using own firm index inclusion, we investigate the
investment behavior of firms that do not join the index but are affected by the index adoption of related
firms. This approach presumes that peer firm stock prices may carry relevant information for focal firm
investment behavior. The presumption is not without precedent. Dessaint et al. (2018) show that peer
firm prices may contain information useful to a focal firm; as do Foucault and Fresard (2014).19 Using their
framework, we study the investment sensitivity of focal firms to index-joining-peer firm stock prices.
Given that the focal firm is not subject to selection concerns associated with S&P500 index inclusion,
documented changes in the investment peer-price sensitivity around index adoption should not be caused
by selection effects due to index adoption.
INV𝑖𝑖,𝑗𝑗,𝑡𝑡 = αS𝑖𝑖,𝑡𝑡 + βQ𝑗𝑗,𝑡𝑡−1 + γ𝑝𝑝S𝑗𝑗,𝑡𝑡×Q𝑗𝑗,𝑡𝑡−1 + Π𝑝𝑝𝐗𝐗𝒋𝒋,𝒕𝒕−𝟏𝟏
+ γ𝑓𝑓S𝑗𝑗,𝑡𝑡×Q𝑖𝑖,𝑡𝑡−1 + Π𝑓𝑓𝐗𝐗𝒊𝒊,𝒕𝒕−𝟏𝟏 + η𝑖𝑖𝑗𝑗 + δ𝑡𝑡 + ε𝑖𝑖,𝑡𝑡 (2)
Our main specification in Eq. (2) is similar to Eq. (1), but with two crucial differences. First, the
analysis is at a firm i – peer j pair level. Second, we replace focal firm S&P500 index membership dummy
and focal firm Q measures with those of the peer firm(s). The parameter of interest, γ𝑝𝑝, captures the
effects of a peer’s index membership on the focal firm’s investment sensitivity to its peers’ stock prices,
and is expected to be negative.
Two elements of the specification help identify the effects of peer index-joining on a focal firm’s
investment – peer Q sensitivity. First, all regressions include pair fixed effects (η𝑖𝑖𝑗𝑗) to eliminate effects
19 Nevertheless, neither study the effect of indexing (especially that tied to the dominant stock benchmark in the world); and neither reach our conclusion.

19
from pair-specific time-invariant omitted variables. This allows us to exploit the within-pair variation in
index membership status and its effects on the investment-price sensitivity. That is, γ𝑝𝑝 represents the
change in the sensitivity of firm investment to a peer’s Q as the (same) peer moves in and out of the
S&P500 index. The second element of the identification is the inclusion of a comprehensive set of control
variables for both the firm (𝐗𝐗𝒊𝒊,𝒕𝒕−𝟏𝟏) and the peer (𝐗𝐗𝒋𝒋,𝒕𝒕−𝟏𝟏) that partial out the effect of focal firm and peer
characteristics on demand for investment. In addition, in all specifications, we include year fixed effects
to capture market-wide condition shifts over time.
The key assumption needed for Eq (2) to consistently estimate γ𝑝𝑝 is as follows. As the pair fixed
effects can effectively control for (time-invariant) characteristics of the bilateral relationship, the
assumption is that there are no time-varying within-pair omitted variables that simultaneously affect the
peer firm’s index adoption and the focal firm’s investment policy. For example, one might argue that as a
peer joins an index, it has more access to external capital, which in turn may help that firm expand and
quickly mature in its life cycle. But this maturity also means that the peer has become less relevant to the
focal firm and, consequently, its price becomes less useful for the focal firm in setting its investment. This
naturally reduces the observed investment-price sensitive but has nothing to do with indexing activity.
However, our definition of peers ensures that peers are dynamically identified to be relevant, at least in
terms of product market, and thus help mitigate this concern. We also provide strong evidence in section
4.3 to show that our results are uniquely consistent with the indexing explanation.
4.2.2. Estimation Results
Table 3 presents estimates for four variations of Eq. (2): two with CAPEX (columns (1) and (2)) and
two with R&D investment (columns (3) and (4)) as the dependent variable. Consistent with the prior table
results, we continue to find that a firm’s investment positively correlates with its own Q. Specifically, a
one standard deviation increase in Q is associated with a 7.61% increase in CAPEX investment.

20
More importantly, the coefficient on the key variable of interest (Peer SP500 dummy × Peer Q) is
significantly negative across all four specifications. The relationship between focal firm investment and
peer Q becomes less strong when the peer firm resides in the index.20 The reduction in the effect of peer
stock price on focal firm investment is approximately 33%.21 And economically, a one standard deviation
increase in peer Q is associated with a (roughly) 1% increase in focal firm CAPEX when the peer belongs
to the index, compared to a 1.565% increase when the peer does not.
Interestingly, we observe insignificant coefficients on Peer S&P500 Dummy as well as its
interaction with the focal firm’s own Q. A peer’s index membership does not have a significant effect on
the focal firm’s CAPEX investment, nor on the relationship between a focal firm’s CAPEX and its own Q.
These results undermine another threat to our identification. The concern might be that a peer’s index
membership enhances its competitiveness (potentially raising peer Q), and this reduces the focal firm’s
incentive to invest (potentially lowering focal-firm CAPEX); for reasons that have nothing to do with our
main hypothesis. But this alternative interpretation does not align with the two insignificant results noted
above. The zero relationship between peer index membership and focal firm CAPEX indicates no
extensive-margin evidence to lend credence to the intensive-margin argument of a competitive effect.
Moreover, the zero relationship between a firm’s investment and its own Q, when the peer belongs to
the index, raises serious doubts about a competitive (endogenous) alternative. This is because a dominant
competitive effect would suggest the focal firm should see a reduction in its own Q and would strategically
reduce its own investment.
With regard to R&D investment, we similarly find that firm investment – peer stock price
sensitivity significantly decreases following peer firms joining the S&P500 index. The reduction in R&D
20 We include pair-wise fixed effects to control for any unobservable pair characteristics and to ensure the measured changes in investment-price sensitivity only come from variations in the peer firm’s index membership (i.e. as the same peer firm moves in and out of the index). 21 The incremental coefficient on the interactive term is -0.003, relative to the coefficient on peer Q of 0.009.

21
investment – peer Q sensitivity is even more substantial to the point that it reverses the sign of the overall
sensitivity. However, unlike with capital investment, a peer’s index membership does have a stand-alone
effect on the firm’s investment as well as on the relationship between the firm’s investment and its own
Q. Overall, our main inference persists even when we use peer index membership to address endogeneity.
Passive – especially index – investing reduces the information content of stock price and its use in
determining corporate investment.
4.3. Heterogeneity in the Treatment Effect
In this section, we address the lingering concern that time-varying within-pair omitted variables
simultaneously lead the peer firm to join the index and the focal firm to change their investment policy in
two more ways. We begin broadly with time-series analysis to illustrate how our treatment effect is
stronger when market-level indexing activity is more prevalent. We follow with firm-level evidence on the
link between greater amounts of passive ownership (of peers) and stronger treatment results. In other
words, the null is that our results are merely a manifestation of index membership – not intensity – and
under that null we would expect no difference in treatment effects between high and low indexing
intensity sub-groups. Our findings consistently show the alternative; that the changes in investment-price
sensitivity are indeed driven by indexing intensity rather than mere index membership.
4.3.1. Time series variation
Given the substantial increase in indexing activity over time, we begin our heterogeneity
exploration at the market-level; studying the investment-price relationship with peer index membership
during periods of high vs. low indexing intensity. As an illustration of the potential importance of this cut,
Figure 1 shows different types of institutional ownership over the 1996-2017 period. The graph highlights
the exponential growth in passive investing, especially in the later 2000s and beyond. Overall institutional
ownership also increases during this window, though at a lower rate than passive investing. As a result,
passive ownership grows from a mere 7% of institutional ownership in 1996 (1.37% out of 19%) to [make

22
up] 60% of institutional ownership in 2017. Given that the rise in index investing is a recent phenomenon,
we split our sample into two periods: before and after 2005. We also use 2000 and 2010 as alternative
cutoffs for robustness.
Table 4 presents the estimation results of the main specification (Eq. 2) for these subperiods. The
first four columns present results using 2000 as the cutoff year, the middle four columns 2005, and the
final four columns 2010. We discuss the 2005 cutoff-year results as primary. They indicate that the effects
of a peer’s S&P500 membership on investment-(peer)price sensitivity of the focal firm, is only significant
in the later period (i.e. when index investing is much more influential). Moreover, the change in
investment sensitivity to peer stock price is four times more negative post-2005, when compared to the
pre-2005 period. When we formally test the statistical significance of the difference between the two
coefficients (using bootstrapped standard errors), we find they are indeed significantly different from each
other.
As an alternative perspective, we also perform regressions with an interaction term to test for
differences between the treatment effects before vs. after the cutoff year. In this specification, POST𝑡𝑡 is
an indicator for the years after the cut-off.22
INV𝑖𝑖,𝑗𝑗,𝑡𝑡 = αS𝑖𝑖,𝑡𝑡 + βQ𝑗𝑗,𝑡𝑡−1 + γ𝑝𝑝S𝑗𝑗,𝑡𝑡×Q𝑗𝑗,𝑡𝑡−1 + ξ𝑝𝑝S𝑗𝑗,𝑡𝑡×Q𝑗𝑗,𝑡𝑡−1×POST𝑡𝑡 + Π𝑝𝑝𝐗𝐗𝒋𝒋,𝒕𝒕−𝟏𝟏
+ γ𝑓𝑓S𝑗𝑗,𝑡𝑡×Q𝑖𝑖,𝑡𝑡−1 + Π𝑓𝑓𝐗𝐗𝒊𝒊,𝒕𝒕−𝟏𝟏 + η𝑖𝑖𝑗𝑗 + δ𝑡𝑡 + ε𝑖𝑖,𝑡𝑡 (3)
Column 8 confirms that the differences between post-2005 and pre-2005 are indeed statistically
significant. The coefficient ξ𝑝𝑝 is significantly negative. After the cutoff, the treatment effect is much
stronger. When passive investing is much more commonplace, peer index membership has a stronger
detrimental effect on the use of peer stock price to inform focal firm investment behavior.
Results for the year-2000 cutoff are similar. On the other hand, differences between post-2010
and pre-2010 are (expectedly) weaker. Notably, these results are not only robust to the choice of timing
22 This approach assumes control variables in the regression do not vary in influence, before vs. after the cutoff.

23
cutoff but are also consistent with the evolution of index investment over time. That is, when the cutoff
gets more recent, the differences in passive investment between before and after are less stark, and so
are the differences in the investment-price sensitivity. Overall, the results highlight that it is not the mere
act of joining an index but the striking rise in passive investing since the early 2000s that are driving the
results.
4.3.2. Cross-sectional variation
We next exploit cross-sectional differences in changes in passive ownership following index
adoption. If the reduction in investment-price sensitivity is caused by the increase in indexing, we expect
the effects to be more pronounced when the peer firms had larger changes in passive ownership after
joining an index.
To measure passive ownership, we aggregate the ownership of all mutual funds and exchange
traded funds whom we classify as passive (using two methods we lay out below). We match these passive
institutional investors by fund manager number to the Thomson Reuters s12 data on stockholdings of
mutual funds, and add the holdings by exchange traded funds manually. In the remainder of the paper,
we refer to the ownership of these index-tracking institutions as passive ownership.
We employ two methods - benchmark classification and name classification - to classify a fund as
passive. According to the benchmark classification method employed in Schmidt and Fahlenbrach (2017),
a fund is considered to be passive when its primary benchmark is S&P500 as identified by Morningstar.
Data on fund benchmark is from Cremer and Petajisto (2013). 23 One caveat with using benchmark
information to classify a mutual fund as passive is that many active funds also use the S&P500 as a
benchmark.24
23 We thank Antti Petajisto for making the data publicly available on his website http://petajisto.net/data.html. His data coverage is from 1996-2009, so we augmented it with benchmark data scraped from Morningstar for the years from 2010 to 2017. 24 Petajisto takes this into account when constructing his database on active share, partially mitigating the concern.

24
Therefore as an alternative, we also follow Appel, Gormley and Keim (2016) and define a fund as
passive when its fund name has one of following strings: Index, Idx, Indx, Ind_ (where _ indicates a space),
Russell, S and P, S and P, S&P, S&P, SP, DOW, Dow, DJ, MSCI, Bloomberg, KBW, NASDAQ, NYSE, STOXX,
FTSE, Wilshire, Morningstar, 100, 400, 500, 600, 900, 1000, 1500, 2000, and 5000 OR when the fund has
a CRSP Index fund and ETF fund flag.
To test if varying passive ownership plays a role in the effects of index adoption on the investment-
price relationship, we estimate specification (4).
INV𝑖𝑖,𝑗𝑗,𝑡𝑡 = αS𝑖𝑖,𝑡𝑡 + βQ𝑗𝑗,𝑡𝑡−1 + γ𝑝𝑝S𝑗𝑗,𝑡𝑡×Q𝑗𝑗,𝑡𝑡−1 + Π𝑝𝑝𝐗𝐗𝒋𝒋,𝒕𝒕−𝟏𝟏 + ζ𝑝𝑝 Q𝑗𝑗,𝑡𝑡−1×HiOS𝑖𝑖,𝑗𝑗
+ξ𝑝𝑝 S𝑗𝑗,𝑡𝑡×Q𝑗𝑗,𝑡𝑡−1×HiOS𝑖𝑖,𝑗𝑗 + γ𝑓𝑓S𝑗𝑗,𝑡𝑡×Q𝑖𝑖,𝑡𝑡−1 + Π𝑓𝑓𝐗𝐗𝒊𝒊,𝒕𝒕−𝟏𝟏 + η𝑖𝑖,𝑗𝑗 + δ𝑡𝑡 + ε𝑖𝑖,𝑡𝑡 (4)
In the equation, HiOS𝑖𝑖,𝑗𝑗 is a dummy that takes the value of 1 if peer j experiences an above-
median change in its passive ownership among all firm i’s peers, and 0 otherwise. Change in passive
ownership of a firm is calculated as the difference in passive ownership when the firm belongs to the
S&P500 index versus when it is not in the index. Since we expect the treatment effects to be more
pronounced when peer firms have larger changes in passive ownership after joining an index, ξ𝑝𝑝 is
expected to be negative.
Column (1) of Table 5 reports the estimation results using “benchmark classification” and
indicates that the effects are mostly concentrated when peers have higher changes in their passive
ownership. Results using “name classification” are presented in column (2) and show a similar pattern
[but stronger results]. We also highlight the results in column (3), where we run a falsification test using
all institutional ownership. Specifically, we aggregate all holdings in Thomson Reuter’s 13f filings which
track institutional holdings of investment companies with at least $100 million in assets under
management. The null results in column (3) suggest that the documented effects in the investment-price
sensitivity are not caused by differences in overall institutional ownership. It is the difference in passive
ownership that is driving the results.

25
4.4. Economic Mechanisms
4.4.1. Stock Price Informativeness Following Index Adoption
A premise to our analysis is that indexing is associated with lower stock price informativeness.
Existing work shows extensive evidence supporting this. In particular, previous studies document an
increase in excess comovement of a firm’s stock with the market after it joins an index, driven by the
mechanical rebalancing effects of indexing activity (rather than changes in fundamentals of the firm
effects) on price. We offer updated results on the relationship between S&P500 membership and
measures of price informativeness using our sample in Table 6.
Our main measure of price informativeness is comovement, proposed by Roll (1988) and later
developed by Durnev, Morck and Yeung (2004). It is computed on the basis of the correlation between
the stock’s return and the return of the corresponding industry and of the market. The idea is that if a
firm’s stock return is strongly correlated with the market and industry returns, then the firm’s stock price
is less likely to convey firm-specific information, which is useful for managerial investment decisions. Thus,
informativeness will be higher (the comovement measure will be lower) when the return on the stock is
less correlated with the market and industry returns.
We construct four comovement variables as follows: beta and R2, each from a regression of stock
returns on market returns, with two different proxies for market return (value-weighted market return
and the S&P500 index return). Table 6 offers both univariate and multivariate results on the relationship
between these comovement variables and index membership. For all four comovement variables, the
mean is significantly larger when the firm is in the index. Similarly, when we control for firm characteristics
(size, cash flow, CAPEX, and Q) in a multivariate regression setting, we observe a significant positive
correlation between comovement measures and index membership.

26
4.4.2. Variation in Peer Price Informational Content
Thus far we show that indexing is associated with (1) lower levels of firm-specific information
content in stock price (as measured by comovement), and (2) firms’ reduced reliance on stock price in
setting their investments. While the results lend strong support to the learning channel interpretation,
they can also be explained by other mechanisms. One such alternative is that joining an index can also
affect the focal firm through non-information channels – perhaps via competitive effects.
Therefore, to shed additional light on the learning hypothesis, we first explore how differences in
comovement - as a measure of stock price informativeness - affect investment-price sensitivity as in Eq. 5
below. HiComove𝑖𝑖,𝑗𝑗 is a dummy that takes the value of 1 if peer j experiences a higher than median
change in its comovement (or higher than median drop in informativeness) among all firm i’s peers, and
0 otherwise. Larger comovement theoretically implies lower information content and therefore lower
predicted usage by the focal firm’s managers in their investment decisions. As such, we argue that if the
changes in investment-price sensitivity are driven by changes in the information content of stock prices,
there ought to be a stronger effect when peer firms experience a larger drop in their stock price
informativeness; that is ξ𝑝𝑝 is expected to be negative.
INV𝑖𝑖,𝑗𝑗,𝑡𝑡 = αS𝑖𝑖,𝑡𝑡 + βQ𝑗𝑗,𝑡𝑡−1 + γ𝑝𝑝S𝑗𝑗,𝑡𝑡×Q𝑗𝑗,𝑡𝑡−1 + Π𝑝𝑝𝐗𝐗𝒋𝒋,𝒕𝒕−𝟏𝟏 + γ𝑓𝑓S𝑗𝑗,𝑡𝑡×Q𝑖𝑖,𝑡𝑡−1 + Π𝑓𝑓𝐗𝐗𝒊𝒊,𝒕𝒕−𝟏𝟏
+ ζ𝑝𝑝 Q𝑗𝑗,𝑡𝑡−1×HiComove𝑖𝑖,𝑗𝑗 + ξ𝑝𝑝S𝑗𝑗,𝑡𝑡×Q𝑗𝑗,𝑡𝑡−1×HiComove𝑖𝑖,𝑗𝑗 + η𝑖𝑖,𝑗𝑗 + δ𝑡𝑡 + ε𝑖𝑖,𝑡𝑡 (5)
Table 7 presents estimates of Eq. 5 using four different measures of comovement: beta and R2
respectively from the firm return regression against value-weighted market return (columns (1) and (2))
and the S&P500 index return (columns (3) and (4)) as different proxies for market return. The results show
that ξ𝑝𝑝 is indeed significantly negative across measures of comovement (except for the comovement
proxy R2 from the regression using S&P500 index return). In summary, we again see the importance of the
change in stock price informativeness associated with indexing, or how much less a firm can learn from
stock prices (of peers) that matters to investment-price sensitivity.

27
4.4.3. Variation in Own Firm Information Quality
According to the learning from peers hypothesis, firms with higher quality of managerial
information may rely less on information from peers' valuations. In other words, these firms should exhibit
lower sensitivity of investment to peers' Qs. As such, whether the peer is in the index should not
significantly change how the focal firm adjusts its investments to the peer’s stock price.
We test this prediction using the volume and profitability of trading by the focal firm’s insiders.25
Insider trading data are from Thomson Financial. We follow Beneish and Vargus (2002), Garfinkel et al.
(2007), and Ravina and Sapienza (2010), and restrict our attention to open market stock purchases
(transaction code P) initiated by the top executives (relationship code CEO, CFO, CO, CI, CB and P), as the
strongest indicators of inside information. Managers with more valuable private information are more
likely to buy shares (and more of them), as well as earn higher profits on these trades.
We measure the trading activity of firm i's insiders in year t as the number of shares bought by its
insiders during that year, divided by the total volume of trading in stock i in year t.26 The profitability of
insiders' trades in firm i in year t is measured as the average market-adjusted return over the one month
following the insider’s purchase. For robustness, we also measure insider trading profitability using the
market-adjusted return over the two months following the insider’s purchase.
INV𝑖𝑖,𝑗𝑗,𝑡𝑡 = αS𝑖𝑖,𝑡𝑡 + βQ𝑗𝑗,𝑡𝑡−1 + γ𝑝𝑝S𝑗𝑗,𝑡𝑡×Q𝑗𝑗,𝑡𝑡−1 + Π𝑝𝑝𝐗𝐗𝒋𝒋,𝒕𝒕−𝟏𝟏 + γ𝑓𝑓S𝑗𝑗,𝑡𝑡×Q𝑖𝑖,𝑡𝑡−1 + Π𝑓𝑓𝐗𝐗𝒊𝒊,𝒕𝒕−𝟏𝟏
+ ζ𝑝𝑝 Q𝑗𝑗,𝑡𝑡−1×HiInsider𝑖𝑖,𝑗𝑗 + ξ𝑝𝑝S𝑗𝑗,𝑡𝑡×Q𝑗𝑗,𝑡𝑡−1×HiInsider𝑖𝑖,𝑗𝑗 + η𝑖𝑖,𝑗𝑗 + δ𝑡𝑡 + ε𝑖𝑖,𝑡𝑡 (6)
To test if managerial information quality plays a role in the effects of indexing on the investment-
price relationship, we estimate specification (6). In this equation, HiInsider𝑖𝑖,𝑗𝑗 is a dummy that take the
value of 1 if firm i ranks above the median in terms of insider trading volume (or insider trading
profitability) among all focal firms of peer j in year t; and 0 otherwise. We include peer fixed effects (μ𝑗𝑗)
25 Similar to Chen et al. (2007) and Foucault and Fresard (2013). 26 Year t is the calendar year with same “end” as the firm’s fiscal year (over which investment is measured).

28
to capture how different firms with different levels of managerial information quality react to the same
peer joining an index. Since we expect the negative effects of indexing on investment-price sensitivity to
be less pronounced among focal firms with highest information quality, ξ𝑝𝑝 is expected to be positive.
Table 8 reports the estimation results with trading volume in columns (1) and (2), trading
profitability using a one-month horizon in columns (3) and (4) and trading profitability using a two-month
holding period in columns (5) and (6). First, similar to Foucault and Fresard (2013), we observe a negative
relationship between the sensitivity of a firm's investment to its peer’s Q interacted with our proxies for
quality of managerial information: ζ𝑝𝑝 is significantly negative under each proxy. This confirms that when
firm managers possess high quality information, they rely relatively less on the stock price of their peer
for their investment decisions.
Second, the results indicate that the treatment effects of indexing on the investment-(peer) price
sensitivity are mostly concentrated among firms with the indicator of lower quality insider information;
i.e. those who may depend more on a peer’s stock price for information. ξ𝑝𝑝 is strongly significant when
we use the indicator (HiInsider) to proxy for own-manager information quality. In columns (2), (4) and (6),
we use a continuous variable to measure the quality of managerial information. The results indicate a
similar pattern to using dummies but at slightly lower levels of statistical significance. Overall, the analysis
on managerial information quality provides additional evidence that is unique to the learning channel.
The treatment effect (sensitivity of focal firm investment to peer’s stock price declines when the peer is
indexed) is affected by the extent to which firms have to rely on learning from their peers.
4.4.4. Dynamic reallocation of attention to own-firm, indexed-peer, and non-indexed peer prices27
Foucault and Fresard (2014) assume that managers are Bayesian and that they therefore alter the
importance of either own-firm or peer-firm stock price for investment as the relative informativeness of
27 We especially thank Laurent Frésard for suggesting this additional exploration.
29
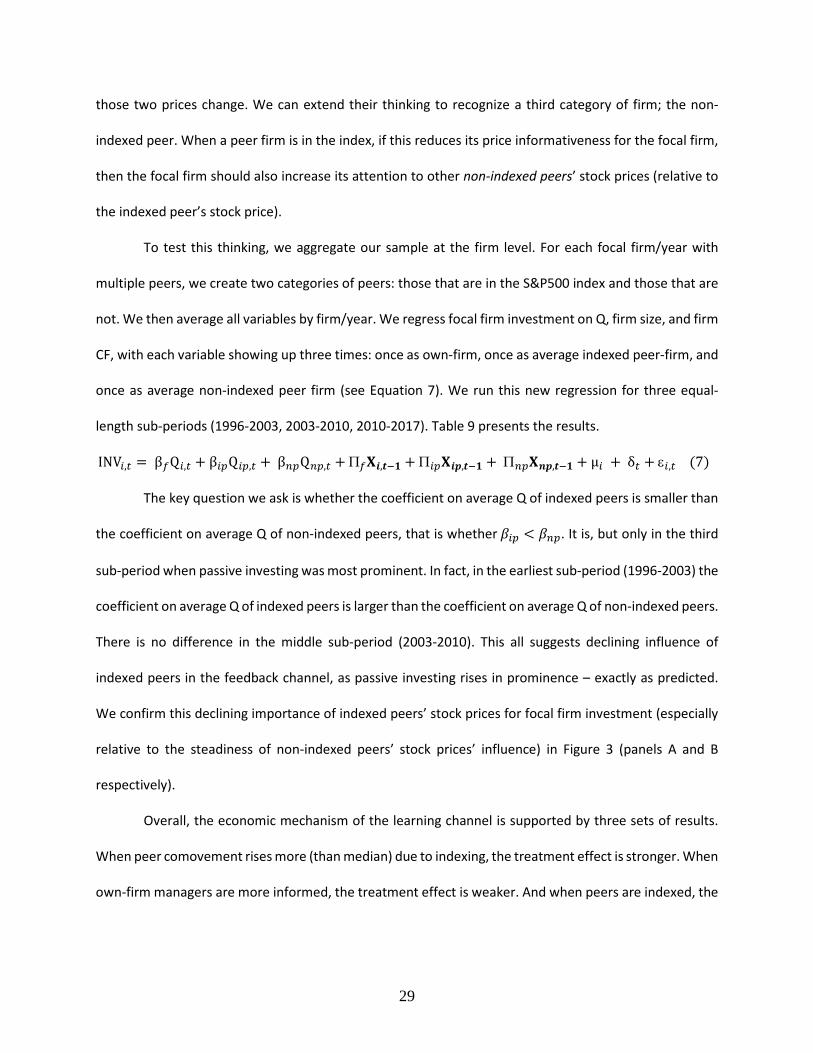
those two prices change. We can extend their thinking to recognize a third category of firm; the non-
indexed peer. When a peer firm is in the index, if this reduces its price informativeness for the focal firm,
then the focal firm should also increase its attention to other non-indexed peers’ stock prices (relative to
the indexed peer’s stock price).
To test this thinking, we aggregate our sample at the firm level. For each focal firm/year with
multiple peers, we create two categories of peers: those that are in the S&P500 index and those that are
not. We then average all variables by firm/year. We regress focal firm investment on Q, firm size, and firm
CF, with each variable showing up three times: once as own-firm, once as average indexed peer-firm, and
once as average non-indexed peer firm (see Equation 7). We run this new regression for three equal-
length sub-periods (1996-2003, 2003-2010, 2010-2017). Table 9 presents the results.
INV𝑖𝑖,𝑡𝑡 = β𝑓𝑓Q𝑖𝑖,𝑡𝑡 + β𝑖𝑖𝑝𝑝Q𝑖𝑖𝑝𝑝,𝑡𝑡 + β𝑛𝑛𝑝𝑝Q𝑛𝑛𝑝𝑝,𝑡𝑡 + Π𝑓𝑓𝐗𝐗𝒊𝒊,𝒕𝒕−𝟏𝟏 + Π𝑖𝑖𝑝𝑝𝐗𝐗𝒊𝒊𝒊𝒊,𝒕𝒕−𝟏𝟏 + Π𝑛𝑛𝑝𝑝𝐗𝐗𝒏𝒏𝒊𝒊,𝒕𝒕−𝟏𝟏 + μ𝑖𝑖 + δ𝑡𝑡 + ε𝑖𝑖,𝑡𝑡 (7)
The key question we ask is whether the coefficient on average Q of indexed peers is smaller than
the coefficient on average Q of non-indexed peers, that is whether 𝛽𝛽𝑖𝑖𝑝𝑝 < 𝛽𝛽𝑛𝑛𝑝𝑝. It is, but only in the third
sub-period when passive investing was most prominent. In fact, in the earliest sub-period (1996-2003) the
coefficient on average Q of indexed peers is larger than the coefficient on average Q of non-indexed peers.
There is no difference in the middle sub-period (2003-2010). This all suggests declining influence of
indexed peers in the feedback channel, as passive investing rises in prominence – exactly as predicted.
We confirm this declining importance of indexed peers’ stock prices for focal firm investment (especially
relative to the steadiness of non-indexed peers’ stock prices’ influence) in Figure 3 (panels A and B
respectively).
Overall, the economic mechanism of the learning channel is supported by three sets of results.
When peer comovement rises more (than median) due to indexing, the treatment effect is stronger. When
own-firm managers are more informed, the treatment effect is weaker. And when peers are indexed, the

30
remaining non-indexed peers carry increased importance for informing focal firm investment (in our latest
sub-period when passive investing is most pronounced).
4.5. Alternative Interpretation: Release of Financial Constraints28
Our main result of reduced investment-stock price sensitivity when a peer belongs to the index,
carries another alternative interpretation. This [general] sensitivity has been shown to be higher when a
firm is financially constrained (Baker et al. (2003)). If S&P500 membership reduces financial constraints,
then index membership may also reduce investment-stock price sensitivity. The key to link this with our
results is that our focal firm – who is not a member of the index – must also experience the reduction in
financial constraints.
Wurgler and Zhuravaskaya (2002) and Greenwood (2005) both contain results that loosely
suggest such a connection. The former note (by counter-example) that close substitutes of S&P500-
indexed firms are likely to experience incidental demand for their stock. Greenwood (2005) shows that
stocks which are correlated with those shocked by redefinition of the Nikkei 225, experience changes in
demand. In general, a non-indexed stock (in our case the focal firm) may experience incidental demand
when its peer is in the index. This could reduce the focal firm’s financial constraints and produce our main
observed result.
To explore the financial-constraints-loosening alternative explanation for our results, we posit
three effects. First under this alternative, peer membership in S&P500 should reduce the focal firm’s
sensitivity of investment to its own Q. Table 3 indicates that is not the case. Second under the alternative,
the treatment effect [our main result] should be more pronounced for ex-ante constrained firms. These
are the ones that experience benefits – constraint loosening – due to the peer’s membership in the index.
As we discuss below, we do not find evidence to support this. Third under the alternative, ex-ante
28 We especially thank Robin Greenwood for suggesting this alternative interpretation and the tests to explore it.
31
constrained firms may exploit the release of constraints to raise (particularly) more (equity) capital. Here
too, we find no evidence to suggest such behavior.
To test the latter two implications we require a proxy for financially constrained firms. We use
two proxies: the size-age index of Hadlock and Pierce (2010), as well as the Whited-Wu (2006) index.29
We also follow Farre-Mensa and Ljunqvist (2016) by classifying firms in the highest (lowest) tercile of
constraint proxy as constrained (unconstrained); i.e. we ignore the middle tercile.30
Table 10 offers results. Panel A presents our typical model, but run on sub-samples of constrained
and unconstrained firms (using the two different proxies for constraints). Our main treatment effect is
preserved. The coefficient on the [Peer SP500 Dummy*PeerQ] variable is significantly negative, but only
among the unconstrained firms. This is broadly inconsistent with the alternative explanation for our
results via the release of constraints channel. Moreover, when we sample on Whited-Wu constrained
firms the effect is opposite to our regular treatment result. These results are wholly inconsistent with the
alternative explanation tied to release of constraints.
Panel B of the table explores external financing of the focal firm as a function of peer membership
in the S&P500. The dependent variable is (respectively) equity issuance scaled by market value of equity,
and debt issuance scaled by assets. Both equity issuance and debt issuance are lower for the focal firm
when the peer is a member of the S&P500. This is also counter-intuitive to the relaxation of financial
constraints.
29 Both papers call into question the validity of the KZ-index, but our inferences are robust to using [both] KZ-index [or firm size stand-alone] to proxy financial constraints. 30 Our results are robust to splitting the samples into constrained and unconstrained based on whether the firm is above or below the median value of the proxy.

32
5. Conclusions
We study the influence of indexing on the feedback (learning) channel of stock prices to corporate
investment. Prior work indicates potential concerns with endogenous relationships clouding the
interpretation of early results. We address these concerns by using plausibly exogenous variation in stock
price informativeness to explain corporate investment.
Our unique approach is two-pronged. We use index membership – which has been shown to
undermine stock price informativeness generally in the asset pricing literature; and we focus on the index
membership of peer firms that are likely to be informative about the focal firm’s investment
opportunities. Using peer firms enables us to side-step endogeneity concerns arising from own firm’s
selection biases due to unobserved variables. We find that when product-market peer firms belong to the
S&P500 index, those (peer) firms’ stock prices are less impactful for the focal firm’s investment behavior.
In short, index membership undermines a stock’s price informativeness and managers rationally reduce
their use of the (undermined) stock’s price to guide investment.
Our results are confirmed and indeed stronger where there is higher indexing intensity. In the
latter stages of our sample period, when indexing (passive investing) became primary, the treatment
effect is most obvious. Also, when the specific peer’s passive ownership increases more as a result of
joining the index, its price becomes less influential for the focal firm’s investment.
We underline the hypothesized learning channel in a couple of ways. First we find the treatment
effects to be consistently stronger when the peer firm’s price informativeness decreases the most
(because of index membership). Second we find the same when the focal firm’s manager is likely less
informed about their own stock and thus more reliant on the peer’s stock price. Third, we document
dynamic reallocation of attention (by focal firm managers in setting investment) to indexed vs. non-
indexed peers’ prices. In the latter part of our sample period, when passive investing is most prominent,

33
the influence of non-indexed peer prices on focal firm investment is stronger than the influence of indexed
peer prices.
Overall, we offer a broader view of the interplay between asset pricing and corporate finance.
The rise of passive investing and its concomitant reduction in stock price informativeness, reduces a
valuable source of information for managers’ corporate investment decisions. Further work exploring
when this is most detrimental to aggregate economic growth would seem fruitful.

34
References
Anton, M., and Polk, C. (2014). Connected stocks. The Journal of Finance, 69(3), 1099-1127.
Appel, I. R., Gormley, T. A., and Keim, D. B. (2016). Passive investors, not passive owners. Journal of Financial Economics, 121(1), 111-141.
Appel, I., Gormley, T. A., and Keim, D. B. (2019). Identification using Russell 1000/2000 index assignments: A discussion of methodologies. Working paper.
Bai, J., Philippon, T., and Savov, A. (2016). Have financial markets become more informative? Journal of Financial Economics, 122(3), 625-654.
Baker, M., Stein, J., Wurgler, J. (2003). When does the market matter? Stock prices and the investment of equity-dependent firms. The Quarterly Journal of Economics, 118(3), 969-1005.
Bakke, T., and Whited, T. (2010). Which firms follow the market? An analysis of corporate investment decisions. The Review of Financial Studies, 23(5), 1941-1980.
Barberis, N., Shleifer, A., and Wurgler, J. (2005). Comovement. Journal of Financial Economics, 75(2), 283-317.
Beneish, M. D., and Vargus, M. E. (2002). Insider trading, earnings quality, and accrual mispricing. The Accounting Review, 77(4), 755-791.
Bennett, B., Stulz, R., and Wang, Z. (2020a). Does the stock market make firms more productive? Journal of Financial Economics, 136(3), 281-306.
Bennett, B., Stulz, R., and Wang, Z. (2020b). Does joining the S&P500 index hurt firms? OSU working paper, July 2020.
Boyer, B. H. (2011). Style-related comovement: Fundamentals or labels?. The Journal of Finance, 66(1), 307-332.
Brogaard, J., Ringgenberg, M. C., and Sovich, D. (2019). The economic impact of index investing. The Review of Financial Studies, 32(9), 3461-3499.
Chang, Y. C., Hong, H., and Liskovich, I. (2015). Regression discontinuity and the price effects of stock market indexing. The Review of Financial Studies, 28(1), 212-246.
Chen, Q., Goldstein, I., and Jiang, W. (2007). Price informativeness and investment sensitivity to stock price. The Review of Financial Studies, 20(3), 619-650.
Coles, J., Heath, D., Ringgenberg, M. (2020). On index investing. Working paper.
Cremers, K. M., and Petajisto, A. (2009). How active is your fund manager? A new measure that predicts performance. The Review of Financial Studies, 22(9), 3329-3365.
David, J., Hopenhayn, H., and Venkateswaran, V. (2016). Information, misallocation, and aggregate productivity. The Quarterly Journal of Economics, 131(2), 943-1005.
35
Dessaint, O., Foucault, T., Frésard, L., and Matray, A. (2019). Noisy stock prices and corporate investment. The Review of Financial Studies, 32(7), 2625-2672.
Dow, J., and Gorton, G. (1997). Stock market efficiency and economic efficiency: is there a connection?. The Journal of Finance, 52(3), 1087-1129.
Durnev, A., Morck, R., and Yeung, B. (2004). Value-enhancing capital budgeting and firm-specific stock return variation. The Journal of Finance, 59(1), 65-105.
Easley, D., Hvidkjaer, S., and O’Hara, M. (2002a) Is information risk a determinant of asset returns? The Journal of Finance, 57 (5), 2185-2221.
Edmans, A., Jayaraman, S., and Schneemeier, J. (2017). The source of information in prices and investment-price sensitivity. Journal of Financial Economics, 126(1), 74-96.
Farre-Mensa, J. and Ljungqvist, A. (2016). Do measures of financial constraints measure financial constraints? The Review of Financial Studies, 29(2), 271-308.
Foucault, T., and Frésard, L. (2012). Cross-listing, investment sensitivity to stock price, and the learning hypothesis. The Review of Financial Studies, 25(11), 3305-3350.
Foucault, T., and Fresard, L. (2014). Learning from peers' stock prices and corporate investment. Journal of Financial Economics, 111(3), 554-577.
Garfinkel, J. A., Kahle, K., and Shastri, K. (2007). Information, incentive alignment, and company loan financing of insider trades. Financial Management, 67-87.
Greenwood, R. (2005). Short- and long-term demand curves for stocks: theory and evidence on the dynamics of arbitrage. Journal of Financial Economics, 75(3), 607-649.
Greenwood, R. (2008). Excess comovement of stock returns: Evidence from cross-sectional variation in Nikkei 225 weights. The Review of Financial Studies, 21(3), 1153-1186.
Hadlock, C., and Pierce, J. (2010). New evidence on measuring financial constraints: Moving beyond the KZ Index. The Review of Financial Studies, 23(5), 1909-1940.
Hoberg, G., and Phillips, G. (2010). Product market synergies and competition in mergers and acquisitions: A text-based analysis. The Review of Financial Studies, 23(10), 3773-3811.
Hoberg, G., and Phillips, G. (2016). Text-based network industries and endogenous product differentiation. Journal of Political Economy, 124(5), 1423-1465.
Lamont, O., Polk, C. and Saaá-Requejo, J. (2001). Financial constraints and stock returns. The Review of Financial Studies, 14(2), pp.529-554.
Ravina, E., and Sapienza, P. (2010). What do independent directors know? Evidence from their trading. The Review of Financial Studies, 23(3), 962-1003.
Roll, R. (1988). R2. The Journal of Finance, 43(2), 51-566.
Schmidt, C., and Fahlenbrach, R. (2017). Do exogenous changes in passive institutional ownership affect corporate governance and firm value?. Journal of Financial Economics, 124(2), 285-306.

36
Vijh, A. M. (1994). S&P 500 trading strategies and stock betas. The Review of Financial Studies, 7(1), 215-251.
Wei, W., and Young, A. (2019). Selection bias or treatment effect? A re-examination of Russell 1000/2000 Index reconstitution. Critical Finance Review, forthcoming.
Whited, T., and Wu, G. (2006). Financial constraints risk. The Review of Financial Studies, 19(2), 531-559.
Wurgler, J., Zhuravaskaya, E. (2002). Does arbitrage flatten demand curves for stocks? The Journal of Business, 75(4), 583-608.

37
Figure 1: Passive ownership over 1996 - 2017
This figure graphs the level of passive ownership between 1996 and 2017. The blue dashed line represents passive ownership using benchmark classification that is a fund is considered to be passive when its primary benchmark is S&P500 as identified by Morningstar using data from Cremer and Petajisto (2013). The red solid line represents passive ownership held by funds that has one of the strings identified by Appel, Gormley and Keim (2016) to be indicative of passive. Data on fund holdings is from Thomson Reuters s12 filings. The grey dotted line plots all institutional ownership defined according to 13f filings requirements.

38
Figure 2: Comovement measures following index adoption
This figure plots different measures of comovement based on a firm’s index membership. We show four measures of comovement as follows: beta and R2, each from a regression of a firm’s stock returns on market returns, with two different proxies for market return (value-weighted market return and the S&P500 index return). The red solid bars represent when firms belong to the S&P500 index while the grey dotted bars represent when firms do not belong to the index.
0
0.3
0.6
0.9
1.2
Beta - Market R2 - Market Beta - S&P500 R2 - S&P500
Com
ovem
ent m
easu
re
In the S&P500 Not in the S&P500

39
Figure 3: Peer Q influence on focal firm investment, by period and by (non)index membership
This figure plots the focal firm investment sensitivity to the stock prices of two groups of peers: S&P500 indexed peers and non-indexed peers, over our sample period. For each focal firm/year with multiple peers, we create two categories of peers: those that are indexed in the S&P500 index and those that are not. We then average all variables by firm/year, separately for the two groups. To calculate the sensitivity, we run a regression similar to Equation 7 on a 3-year rolling window basis. Panel A graphs the sensitivity for the S&P500 indexed peer group, and Panel B presents the results for non-indexed peer group. The red solid lines represent the fitted trend line.

40
Table 1: Summary Statistics This table reports summary statistics of all focal and peer firms in our analysis. Unit of observation is a firm-peer pair by year. We start our sample with all public firms in the TNIC database from 1996 to 2017 and their according peers. We then match firms in TNIC to the CRSP-Compustat Merged database (CCM) to identify their financial information. Firms in financial and utility industries are excluded. We also remove observations with negative sales, or missing information on total assets, capital expenditures, fixed assets (property, plant, and equipment), earnings before tax and (end-of-year) stock prices. Finally, we restrict our sample to those pairs in which the peer changes its S&P500 membership at least once. All variables definition can be found in Appendix A.
Mean SD p1 p50 p99 TNIC score 0.050 0.048 0.001 0.038 0.189 Firms CAPEX/PPE 0.346 0.444 0.000 0.209 2.928 RD/TA 0.140 0.172 0.000 0.080 0.813 Tobin’s Q1 2.022 1.770 0.671 1.355 10.917 Tobin’s Q2 1.651 1.829 0.127 1.078 10.580 Firm Size 6.804 2.187 1.978 6.814 11.411 Cash flows -0.027 0.276 -1.481 0.038 0.302 Peers Capex/PPE 0.319 0.353 0.000 0.222 1.978 RD/TA 0.113 0.131 0.000 0.076 0.691 Tobin’s Q1 2.192 1.739 0.778 1.493 8.982 Tobin’s Q2 1.833 1.811 0.127 1.204 8.804 Firm Size 8.796 1.534 5.138 8.778 11.411 Cash flows 0.049 0.152 -0.605 0.063 0.290 Comovement Market beta 1.256 0.612 0.140 1.181 3.186 Market R2 0.280 0.168 0.007 0.259 0.693 S&P500 beta 1.220 0.588 0.154 1.143 3.148 S&P500 R2 0.271 0.169 0.008 0.248 0.693 Passive ownership (%) Benchmark classification 1.507 2.683 0.003 0.569 12.88 Name classification 7.502 5.760 0.017 6.546 23.84 All funds 24.91 12.56 0.070 25.31 52.51 # of firms 7,262 # of pairs 58,290 # of obs 347,014

41
Table 2: Baseline Effects on Firms’ Own Q This table presents the results of our baseline regressions of firm investment on its own Tobin’s Q as in Equation (1).
INV𝑖𝑖,𝑡𝑡 = αS𝑖𝑖,𝑡𝑡 + βQ𝑖𝑖,𝑡𝑡−1 + γS𝑖𝑖,𝑡𝑡×Q𝑖𝑖,𝑡𝑡−1 + Π𝐗𝐗𝒊𝒊,𝒕𝒕−𝟏𝟏 + µ𝑖𝑖 + δ𝑡𝑡 + ε𝑖𝑖,𝑡𝑡
The dependent variable is capital investment (CAPEX/PPE) in columns (1) and (2) and R&D investment (RD/TA) in columns (3) and (4). SP500 Dummy is an indicator variable set to 1 if firm i is in the S&P500 index for at least 9 months in year t. Column headings Q1 and Q2 signify two different methods to calculate Tobin’s Q. Q1 is defined as a firm's stock price times the number of shares outstanding plus the book value of assets minus the book value of equity, scaled by book assets. Q2 is calculated as market value of equity plus values of long-term debt and preferred stock, scaled by total assets. Other variables are defined in Appendix A. *, **, and *** denote statistical significance at (respectively) the 10%, 5%, and 1% level. t-statistics are in parentheses; standard errors are clustered by firm.
Dependent variable CAPEX/PPE RD/TA
Q1 Q2 Q1 Q2 (1) (2) (3) (4) Firm SP500 Dummy 0.034** 0.022* 0.006** 0.006** (2.29) (1.69) (2.18) (2.21) Firm Q 0.063*** 0.063*** 0.007*** 0.007*** (8.62) (8.75) (4.81) (4.86) Firm SP500Dummy × Firm Q -0.036*** -0.036*** -0.002* -0.002* (-6.13) (-5.90) (-1.80) (-1.87) Firm CF 0.087 0.122*** -0.031* -0.033* (1.33) (2.61) (-1.83) (-1.87) Firm Size -0.002 -0.005 -0.010*** -0.010*** (-0.13) (-0.39) (-3.11) (-3.13) Firm FE Yes Yes Yes Yes Year FE Yes Yes Yes Yes Observations 9,682 9,625 9,682 9,625 R2 0.16 0.17 0.09 0.09

42
Table 3: Baseline results: Response to peer firm change of membership This table presents the results of our baseline regressions of firm investment on its peer Tobin’s Q as in Equation (2).
INV𝑖𝑖,𝑗𝑗,𝑡𝑡 = αS𝑖𝑖,𝑡𝑡 + βQ𝑗𝑗,𝑡𝑡−1 + γ𝑝𝑝S𝑗𝑗,𝑡𝑡×Q𝑗𝑗,𝑡𝑡−1 + Π𝑝𝑝𝐗𝐗𝒋𝒋,𝒕𝒕−𝟏𝟏 + γ𝑓𝑓S𝑗𝑗,𝑡𝑡×Q𝑖𝑖,𝑡𝑡−1 + Π𝑓𝑓𝐗𝐗𝒊𝒊,𝒕𝒕−𝟏𝟏 + η𝑖𝑖𝑗𝑗 + δ𝑡𝑡 + ε𝑖𝑖,𝑡𝑡
Unit of observation is pair-year. The dependent variable is capital investment (CAPEX/PPE) in columns (1) and (2) and R&D investment (RD/TA) in columns (3) and (4). Peer SP500 Dummy is an indicator variable set to 1 if peer j is in the S&P500 index for at least 9 months in year t, and 0 otherwise. Peer Q is defined as a peer firm's stock price times the number of shares outstanding plus the book value of assets minus the book value of equity, scaled by book assets. Other variables are defined in Appendix A. *, **, and *** denote statistical significance at (respectively) the 10%, 5%, and 1% level. t-statistics are in parentheses; standard errors are clustered by firm.
Dependent variable CAPEX/PPE RD/TA
(1) (2) (3) (4) Peer SP500 Dummy -0.004 -0.005 0.003*** 0.005*** (-0.97) (-0.83) (3.49) (3.75) Peer Q 0.009*** 0.009*** 0.001*** 0.001** (5.45) (5.52) (2.66) (1.97) Peer SP500Dummy x Peer Q -0.003** -0.004** -0.002*** -0.001*** (-2.08) (-2.21) (-5.32) (-3.73) Peer CF 0.033*** 0.033*** 0.007*** 0.008*** (2.88) (2.87) (3.89) (4.01) Peer size 0.007* 0.007* -0.003*** -0.003*** (1.82) (1.82) (-3.35) (-3.25) Firm Q 0.043*** 0.043*** 0.011*** 0.012*** (11.26) (10.74) (15.44) (15.64) Peer SP500Dummy x Firm Q 0.000 -0.002*** (0.20) (-2.59) Firm CF 0.168*** 0.168*** -0.044*** -0.044*** (8.33) (8.33) (-8.15) (-8.13) Firm size 0.091*** 0.091*** -0.010*** -0.010*** (11.39) (11.40) (-5.50) (-5.46) Pair FE Yes Yes Yes Yes Year FE Yes Yes Yes Yes Observations 347,014 347,014 347,014 347,014 R2 0.08 0.08 0.10 0.10

43
Table 4: Indexing Intensity Before and After This table presents the estimation results of the baseline specification in Equation (2) for different subperiods over 1996-2017. The dependent variable is capital investment (CAPEX/PPE). Peer SP500 Dummy is an indicator variable set to 1 if peer j is in the S&P500 index for at least 9 months in year t. Peer Q is defined as a firm's stock price times the number of shares outstanding plus the book value of assets minus the book value of equity, scaled by book assets. Column headings Before and After signify the sample before and after the respective cutoff, with their difference reported in columns Diff. Column headings Full present estimation results of Equation (3) that examines how the relationship between peer index membership and investment-price sensitivity varies depending on the intensity of index investment over time. POST is an indicator for the years after the cut-off year. 31 Other variables are defined in Appendix A.
INV𝑖𝑖,𝑗𝑗,𝑡𝑡 = αS𝑖𝑖,𝑡𝑡 + βQ𝑗𝑗,𝑡𝑡−1 + γ𝑝𝑝S𝑗𝑗,𝑡𝑡×Q𝑗𝑗,𝑡𝑡−1 + ξ𝑝𝑝S𝑗𝑗,𝑡𝑡×Q𝑗𝑗,𝑡𝑡−1×POST𝑡𝑡 + Π𝑝𝑝𝐗𝐗𝒋𝒋,𝒕𝒕−𝟏𝟏 + γ𝑓𝑓S𝑗𝑗,𝑡𝑡×Q𝑖𝑖,𝑡𝑡−1 + Π𝑓𝑓𝐗𝐗𝒊𝒊,𝒕𝒕−𝟏𝟏 + η𝑖𝑖𝑗𝑗 + δ𝑡𝑡 + ε𝑖𝑖,𝑡𝑡
*, **, and *** denote statistical significance at (respectively) the 10%, 5%, and 1% level. t-statistics are in parentheses; standard errors are clustered by firm. Dependent Variable: CAPEX/PPE Cutoff = 2000 Cutoff = 2005 Cutoff = 2010 Before After Diff Full Before After Diff Full Before After Diff Full (1) (2) (3) (4) (5) (6) (7) (8) (9) (10) (11) (12) Peer SP500 Dummy -0.027** -0.003 -0.006 -0.005 -0.003 -0.008** -0.007 0.011* -0.005 (-1.99) (-0.82) (-1.48) (-0.64) (-0.69) (-1.97) (-1.29) (1.69) (-1.29) Peer Q -0.008** 0.006*** 0.011*** 0.011*** 0.008*** 0.012*** 0.009*** 0.008* 0.010*** (-2.24) (3.08) (4.15) (4.52) (3.37) (5.52) (4.46) (1.82) (5.12) Peer SP500Dummy × 0.005 -0.004** -0.009** 0.003 0.001 -0.004* -0.005* 0.001 -0.002 -0.008** -0.006* -0.003* Peer Q (1.23) (-2.28) (-2.03) (1.00) (0.42) (-1.73) (-1.88) (0.40) (-0.94) (-2.46) (-1.94) (-1.76) Peer Q × POST -0.003 -0.010*** -0.004 (-1.00) (-2.99) (-0.95) Peer SP500Dummy × -0.010** -0.013*** -0.003 Peer Q × POST (-2.30) (-4.51) (-0.97) Controls Yes Yes Yes Yes Yes Yes Yes Yes Yes Pair FE Yes Yes Yes Yes Yes Yes Yes Yes Yes Year FE Yes Yes Yes Yes Yes Yes Yes Yes Yes Observations 61,357 285,657 347,014 153,894 193,120 347,014 248,445 98,569 347,014 R2 0.08 0.05 0.08 0.12 0.05 0.08 0.10 0.04 0.08
31 POST𝑡𝑡 is subsumed by year fixed effects.

44
Table 5: Passive Ownership and the Investment-Peer Q relationship
This table presents the estimation results of Equation (4) that examines how the relationship between peer index membership and investment-price sensitivity varies depending on the level of passive ownership.32
INV𝑖𝑖,𝑗𝑗,𝑡𝑡 = αS𝑖𝑖,𝑡𝑡 + βQ𝑗𝑗,𝑡𝑡−1 + γ𝑝𝑝S𝑗𝑗,𝑡𝑡×Q𝑗𝑗,𝑡𝑡−1 + Π𝑝𝑝𝐗𝐗𝒋𝒋,𝒕𝒕−𝟏𝟏 + ζ𝑝𝑝𝑚𝑚Q𝑗𝑗,𝑡𝑡−1×HiOS𝑖𝑖 ,𝑗𝑗
+ξ𝑝𝑝𝑚𝑚S𝑗𝑗,𝑡𝑡×Q𝑗𝑗,𝑡𝑡−1×HiOS𝑖𝑖,𝑗𝑗 + γ𝑓𝑓S𝑗𝑗,𝑡𝑡×Q𝑖𝑖,𝑡𝑡−1 + Π𝑓𝑓𝐗𝐗𝒊𝒊,𝒕𝒕−𝟏𝟏 + η𝑖𝑖,𝑗𝑗 + δ𝑡𝑡 + ε𝑖𝑖,𝑡𝑡
Unit of observation is pair-year. The dependent variable is capital investment (CAPEX/PPE. Peer SP500 Dummy is an indicator variable set to 1 if peer j is in the S&P500 index for at least 9 months in year t. Peer Q is defined as a firm's stock price times the number of shares outstanding plus the book value of assets minus the book value of equity, scaled by book assets. HiOS is a dummy that takes the value of 1 if peer j experiences an above-median increase in its passive ownership among all firm i’s peers, and 0 otherwise. Column (1) reports results using fund benchmark while column (2) uses fund name to classify passive funds. Column (3) report results using all institutional ownership (as a falsification test). Other variables are defined in Appendix A. *, **, and *** denote statistical significance at (respectively) the 10%, 5%, and 1% level. t-statistics are in parentheses; standard errors are clustered by firm.
Dependent variable: CAPEX/PPE Fund benchmark Fund name All Institutions (1) (2) (3) Peer SP500 Dummy -0.015*** -0.012** -0.013*** (-3.13) (-2.56) (-2.76) Peer Q 0.008*** 0.011*** 0.008*** (3.50) (4.44) (3.58) Peer SP500 Dummy × Peer Q -0.000 -0.001 -0.003 (-0.13) (-0.68) (-1.23) HiOS × Peer Q -0.005** -0.008*** -0.003 (-2.33) (-3.55) (-1.39) Peer SP500 Dummy × HiOS × -0.007*** -0.010*** -0.002 Peer Q (-2.82) (-3.43) (-0.56) Controls Yes Yes Yes Pair FE Yes Yes Yes Year FE Yes Yes Yes Observations 271,456 282,248 283,645 R2 0.08 0.08 0.08
32 HiOS𝑖𝑖,𝑗𝑗 is subsumed by pair fixed effects.

45
Table 6: Changes in Comovement following S&P500 Adoption
This table reports the changes in comovement following S&P500 adoption. Column headings signify 4 measures of comovement: beta and R2, each from a regression of stock returns on market returns using value-weighted market return (columns (1) and (2)) and the S&P500 index return (columns (3) and (4)). Panel A presents summary statistics on comovement measures. Panel B presents differences in comovement measures between index adopters and non adopters. Panel C presents multivariate analysis of regressions of comovement on S&P500 indicator. *, **, and ***
denote statistical significance at (respectively) the 10%, 5%, and 1% level. t-statistics are in parentheses; standard errors are clustered by firm.
Dependent variable: Market beta Market R2 SP500 beta SP500 R2
(1) (2) (3) (4) Panel A: Summary statistics Count 10582 10582 10582 10582 Mean 1.107 0.268 1.071 0.259 SD 0.545 0.176 0.526 0.175 P1 0.118 0.004 0.121 0.004 P50 1.04 0.239 1.008 0.23 P99 2.817 0.703 2.705 0.696 Panel B: Firm-level difference between in and out of the index Mean difference 0.057*** 0.089*** 0.113*** 0.099*** t-stat (2.51) (13.11) (5.25) (14.78)
N 623 623 623 623 Panel C: The effects of joining S&P500 SP500 Dummy 0.098*** 0.025*** 0.076*** 0.033*** (7.89) (5.59) (6.29) (7.50) Size 0.125*** 0.057*** 0.147*** 0.055*** (17.51) (22.18) (21.26) (22.07) CF -0.712*** 0.008 -0.655*** 0.012 (-15.31) (0.47) (-14.50) (0.71) CAPEX 0.130*** 0.006 0.097*** -0.003 (6.82) (0.84) (5.27) (-0.48) Q 0.060*** -0.001 0.055*** -0.002 (14.47) (-0.73) (13.54) (-1.63) Firm FE Yes Yes Yes Yes Observations 8,938 8,938 8,938 8,938 R2 0.07 0.10 0.08 0.11
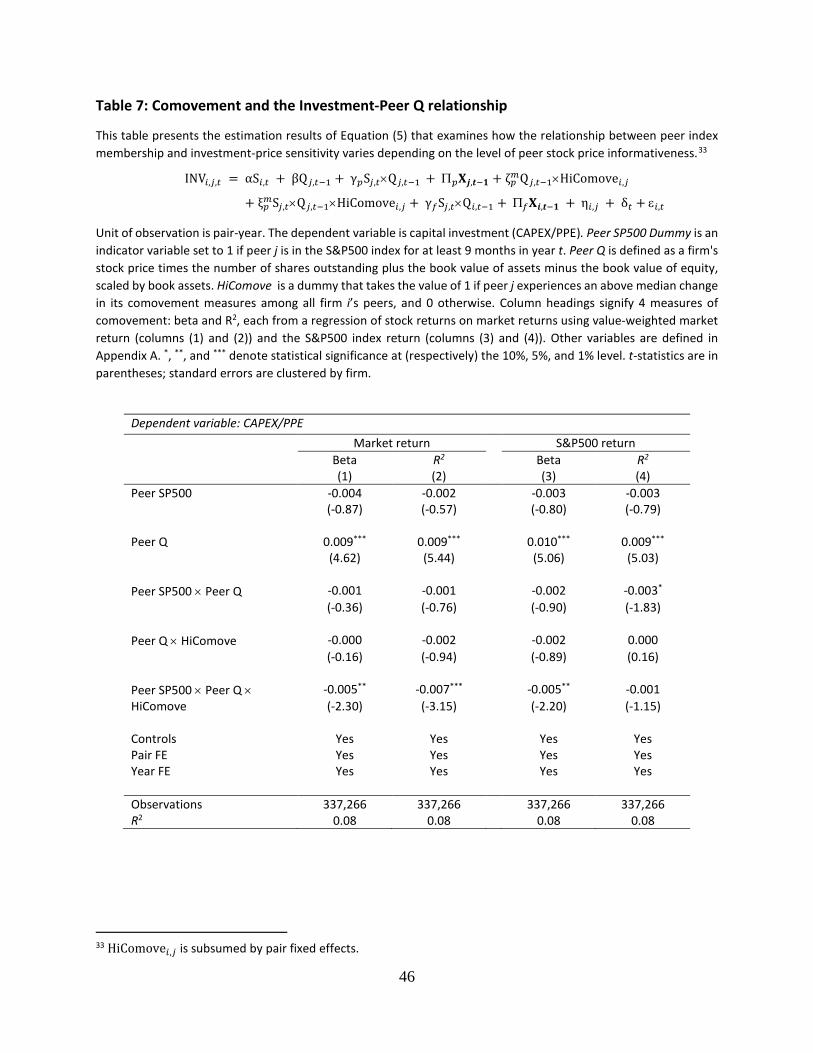
46
Table 7: Comovement and the Investment-Peer Q relationship
This table presents the estimation results of Equation (5) that examines how the relationship between peer index membership and investment-price sensitivity varies depending on the level of peer stock price informativeness.33
INV𝑖𝑖,𝑗𝑗,𝑡𝑡 = αS𝑖𝑖,𝑡𝑡 + βQ𝑗𝑗,𝑡𝑡−1 + γ𝑝𝑝S𝑗𝑗,𝑡𝑡×Q𝑗𝑗,𝑡𝑡−1 + Π𝑝𝑝𝐗𝐗𝒋𝒋,𝒕𝒕−𝟏𝟏 + ζ𝑝𝑝𝑚𝑚Q𝑗𝑗,𝑡𝑡−1×HiComove𝑖𝑖,𝑗𝑗
+ ξ𝑝𝑝𝑚𝑚S𝑗𝑗,𝑡𝑡×Q𝑗𝑗,𝑡𝑡−1×HiComove𝑖𝑖,𝑗𝑗 + γ𝑓𝑓S𝑗𝑗,𝑡𝑡×Q𝑖𝑖,𝑡𝑡−1 + Π𝑓𝑓𝐗𝐗𝒊𝒊,𝒕𝒕−𝟏𝟏 + η𝑖𝑖,𝑗𝑗 + δ𝑡𝑡 + ε𝑖𝑖,𝑡𝑡
Unit of observation is pair-year. The dependent variable is capital investment (CAPEX/PPE). Peer SP500 Dummy is an indicator variable set to 1 if peer j is in the S&P500 index for at least 9 months in year t. Peer Q is defined as a firm's stock price times the number of shares outstanding plus the book value of assets minus the book value of equity, scaled by book assets. HiComove is a dummy that takes the value of 1 if peer j experiences an above median change in its comovement measures among all firm i’s peers, and 0 otherwise. Column headings signify 4 measures of comovement: beta and R2, each from a regression of stock returns on market returns using value-weighted market return (columns (1) and (2)) and the S&P500 index return (columns (3) and (4)). Other variables are defined in Appendix A. *, **, and *** denote statistical significance at (respectively) the 10%, 5%, and 1% level. t-statistics are in parentheses; standard errors are clustered by firm.
Dependent variable: CAPEX/PPE Market return S&P500 return Beta R2 Beta R2
(1) (2) (3) (4) Peer SP500 -0.004 -0.002 -0.003 -0.003 (-0.87) (-0.57) (-0.80) (-0.79) Peer Q 0.009*** 0.009*** 0.010*** 0.009*** (4.62) (5.44) (5.06) (5.03) Peer SP500 × Peer Q -0.001 -0.001 -0.002 -0.003* (-0.36) (-0.76) (-0.90) (-1.83) Peer Q × HiComove -0.000 -0.002 -0.002 0.000 (-0.16) (-0.94) (-0.89) (0.16) Peer SP500 × Peer Q × -0.005** -0.007*** -0.005** -0.001 HiComove (-2.30) (-3.15) (-2.20) (-1.15) Controls Yes Yes Yes Yes Pair FE Yes Yes Yes Yes Year FE Yes Yes Yes Yes Observations 337,266 337,266 337,266 337,266 R2 0.08 0.08 0.08 0.08
33 HiComove𝑖𝑖 ,𝑗𝑗 is subsumed by pair fixed effects.
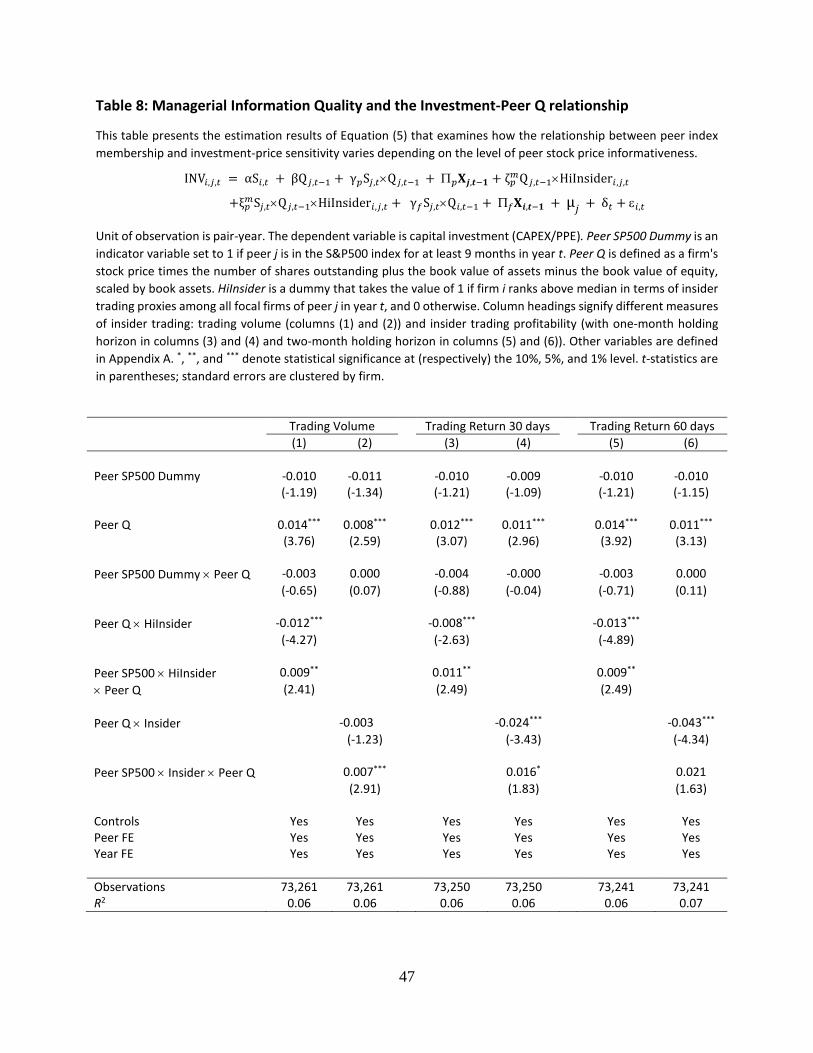
47
Table 8: Managerial Information Quality and the Investment-Peer Q relationship
This table presents the estimation results of Equation (5) that examines how the relationship between peer index membership and investment-price sensitivity varies depending on the level of peer stock price informativeness.
INV𝑖𝑖,𝑗𝑗,𝑡𝑡 = αS𝑖𝑖,𝑡𝑡 + βQ𝑗𝑗,𝑡𝑡−1 + γ𝑝𝑝S𝑗𝑗,𝑡𝑡×Q𝑗𝑗,𝑡𝑡−1 + Π𝑝𝑝𝐗𝐗𝒋𝒋,𝒕𝒕−𝟏𝟏 + ζ𝑝𝑝𝑚𝑚Q𝑗𝑗,𝑡𝑡−1×HiInsider𝑖𝑖 ,𝑗𝑗,𝑡𝑡
+ξ𝑝𝑝𝑚𝑚S𝑗𝑗,𝑡𝑡×Q𝑗𝑗,𝑡𝑡−1×HiInsider𝑖𝑖,𝑗𝑗,𝑡𝑡 + γ𝑓𝑓S𝑗𝑗,𝑡𝑡×Q𝑖𝑖,𝑡𝑡−1 + Π𝑓𝑓𝐗𝐗𝒊𝒊,𝒕𝒕−𝟏𝟏 + μ𝑗𝑗 + δ𝑡𝑡 + ε𝑖𝑖,𝑡𝑡
Unit of observation is pair-year. The dependent variable is capital investment (CAPEX/PPE). Peer SP500 Dummy is an indicator variable set to 1 if peer j is in the S&P500 index for at least 9 months in year t. Peer Q is defined as a firm's stock price times the number of shares outstanding plus the book value of assets minus the book value of equity, scaled by book assets. HiInsider is a dummy that takes the value of 1 if firm i ranks above median in terms of insider trading proxies among all focal firms of peer j in year t, and 0 otherwise. Column headings signify different measures of insider trading: trading volume (columns (1) and (2)) and insider trading profitability (with one-month holding horizon in columns (3) and (4) and two-month holding horizon in columns (5) and (6)). Other variables are defined in Appendix A. *, **, and *** denote statistical significance at (respectively) the 10%, 5%, and 1% level. t-statistics are in parentheses; standard errors are clustered by firm.
Trading Volume Trading Return 30 days Trading Return 60 days (1) (2) (3) (4) (5) (6) Peer SP500 Dummy -0.010 -0.011 -0.010 -0.009 -0.010 -0.010 (-1.19) (-1.34) (-1.21) (-1.09) (-1.21) (-1.15) Peer Q 0.014*** 0.008*** 0.012*** 0.011*** 0.014*** 0.011*** (3.76) (2.59) (3.07) (2.96) (3.92) (3.13) Peer SP500 Dummy × Peer Q -0.003 0.000 -0.004 -0.000 -0.003 0.000 (-0.65) (0.07) (-0.88) (-0.04) (-0.71) (0.11) Peer Q × HiInsider -0.012*** -0.008*** -0.013*** (-4.27) (-2.63) (-4.89) Peer SP500 × HiInsider 0.009** 0.011** 0.009** × Peer Q (2.41) (2.49) (2.49) Peer Q × Insider -0.003 -0.024*** -0.043*** (-1.23) (-3.43) (-4.34) Peer SP500 × Insider × Peer Q 0.007*** 0.016* 0.021 (2.91) (1.83) (1.63) Controls Yes Yes Yes Yes Yes Yes Peer FE Yes Yes Yes Yes Yes Yes Year FE Yes Yes Yes Yes Yes Yes Observations 73,261 73,261 73,250 73,250 73,241 73,241 R2 0.06 0.06 0.06 0.06 0.06 0.07
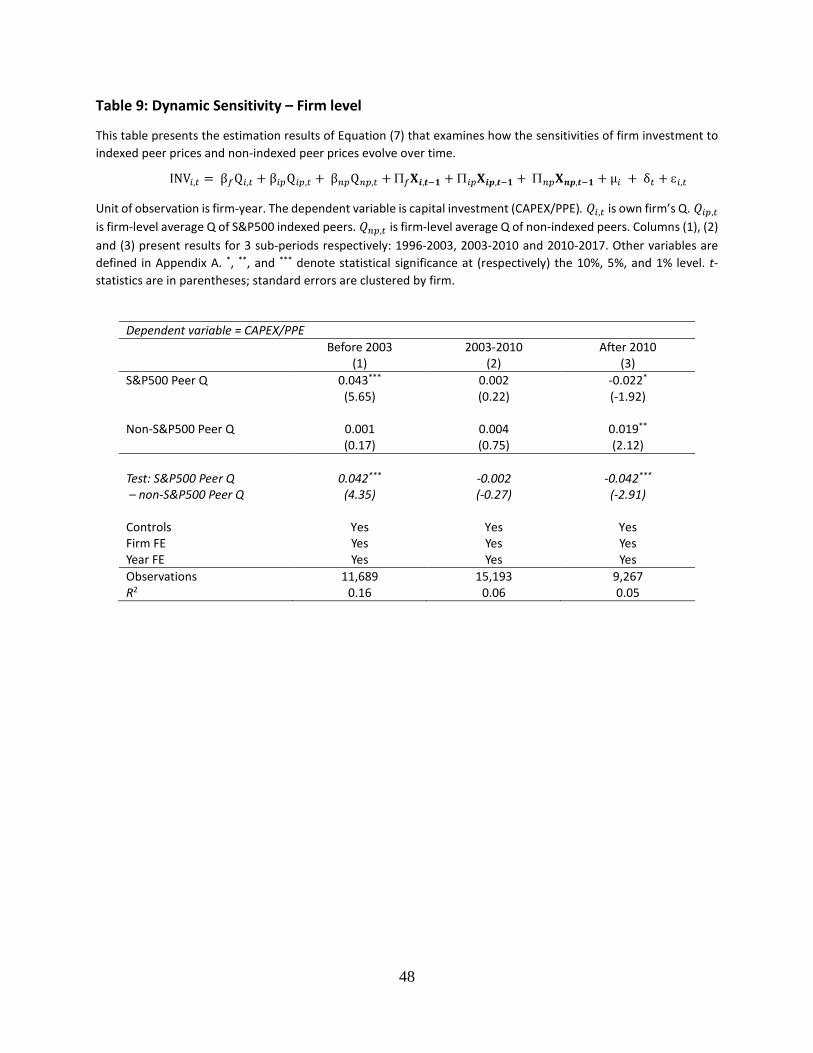
48
Table 9: Dynamic Sensitivity – Firm level
This table presents the estimation results of Equation (7) that examines how the sensitivities of firm investment to indexed peer prices and non-indexed peer prices evolve over time.
INV𝑖𝑖,𝑡𝑡 = β𝑓𝑓Q𝑖𝑖,𝑡𝑡 + β𝑖𝑖𝑝𝑝Q𝑖𝑖𝑝𝑝,𝑡𝑡 + β𝑛𝑛𝑝𝑝Q𝑛𝑛𝑝𝑝,𝑡𝑡 + Π𝑓𝑓𝐗𝐗𝒊𝒊,𝒕𝒕−𝟏𝟏 + Π𝑖𝑖𝑝𝑝𝐗𝐗𝒊𝒊𝒊𝒊,𝒕𝒕−𝟏𝟏 + Π𝑛𝑛𝑝𝑝𝐗𝐗𝒏𝒏𝒊𝒊,𝒕𝒕−𝟏𝟏 + μ𝑖𝑖 + δ𝑡𝑡 + ε𝑖𝑖,𝑡𝑡
Unit of observation is firm-year. The dependent variable is capital investment (CAPEX/PPE). 𝑄𝑄𝑖𝑖,𝑡𝑡 is own firm’s Q. 𝑄𝑄𝑖𝑖𝑝𝑝,𝑡𝑡 is firm-level average Q of S&P500 indexed peers. 𝑄𝑄𝑛𝑛𝑝𝑝,𝑡𝑡 is firm-level average Q of non-indexed peers. Columns (1), (2) and (3) present results for 3 sub-periods respectively: 1996-2003, 2003-2010 and 2010-2017. Other variables are defined in Appendix A. *, **, and *** denote statistical significance at (respectively) the 10%, 5%, and 1% level. t-statistics are in parentheses; standard errors are clustered by firm.
Dependent variable = CAPEX/PPE Before 2003 2003-2010 After 2010 (1) (2) (3) S&P500 Peer Q 0.043*** 0.002 -0.022* (5.65) (0.22) (-1.92) Non-S&P500 Peer Q 0.001 0.004 0.019** (0.17) (0.75) (2.12) Test: S&P500 Peer Q 0.042*** -0.002 -0.042***
– non-S&P500 Peer Q (4.35) (-0.27) (-2.91) Controls Yes Yes Yes Firm FE Yes Yes Yes Year FE Yes Yes Yes Observations 11,689 15,193 9,267 R2 0.16 0.06 0.05

49
Table 10: Financial Constraints and the Investment – Peer Q Relationship This table investigates the relationship between financial constraints and the firm investment – peer Q sensitivity. Panel A presents the estimation results of the baseline regression (Eq. 2) on subsamples of financially constrained and unconstrained firms. To proxy for financial constraints, we use Hadlock and Pierce (2010)’s Size-Age Index in columns (1) and (2) and Whited and Wu (2006) Index in columns (3) and (4). A firm is considered constrained if it ranks in the top tercile of the contraint measures in the previous year, and unconstrained if it ranks in the bottom tercile. Panel B Column headings signify different dependent variables: equity issuance scaled by market value of equity in column (1) and debt issuance scaled by total assets in column (2). *, **, and *** denote statistical significance at (respectively) the 10%, 5%, and 1% level. t-statistics are in parentheses; standard errors are clustered by firm. Panel A: Financial Constraints and the Investment – Peer Q Relationship
Size-Age Index Whited-Wu Index Constrained Unconstrained Constrained Unconstrained (1) (2) (3) (4) Peer SP500 Dummy -0.034*** 0.007* -0.053*** 0.009* (-2.75) (1.69) (-4.31) (1.92) Peer Q 0.002 0.005** -0.004* 0.010*** (0.74) (2.16) (-1.89) (3.80) Peer SP500 Dummy × 0.003 -0.005** 0.010*** -0.008*** Peer Q (1.05) (-2.43) (3.62) (-3.30) Controls Yes Yes Yes Yes Pair FE Yes Yes Yes Yes Year FE Yes Yes Yes Yes Observations 68,306 159,371 75,057 112,950 R2 0.09 0.08 0.08 0.14
Panel B: Financing activities
Dependent variable = Equity Issuance/MV Debt Issuance/AT (1) (2) Peer SP500 Dummy -0.004*** -0.004*** (-7.48) (-3.48) Controls Yes Yes Pair FE Yes Yes Year FE Yes Yes Observations 293,811 305,976 R2 0.04 0.03

50
APPENDIX A – Variable Definition
Variable Definition
S&P500 Dummy An indicator that takes value of 1 if firm i is in the S&P500 index for at least 9 months of year t and 0 otherwise.
Tobin’s Q1 Firm's stock price times the number of shares outstanding plus the book value of assets minus the book value of equity, scaled by total assets [(at + prcc_f×csho – ceq)/at]
Tobin’s Q2 Firm's stock price times the number of shares outstanding plus values of long-term debt and preferred stock, scaled by total assets [(prcc_f×csho + dltt + dlc + pstk)/at]
Firm Size Natural logarithm of book value of total assets [ln(at)]
Cash flows Operating cash flows divided by book assets [(ib + dp)/at]
CAPEX Capital expenditure divided by lagged PP&E [capx/ppent]
R&D R&D investment divided by lagged total assets [xrd/at]
Passive Ownership_Benchmark
Aggregate of passive investor holdings scaled by total shares outstanding. An investor is considered passive when its primary benchmark is identified by Morningstar as S&P500. Data on fund benchmark is from Cremer & Petajisto (2013) and Morningstar website. Data on fund holdings is from Thomson Reuters s12 file. Data on shares outstanding is from CRSP.
Passive Ownership_Fund name
Aggregate of passive investor holdings scaled by total shares outstanding. An investor is considered passive when its name contains one of the following strings: Index, Idx, Indx, Ind_ (where _ indicates a space), Russell, S & P, S and P, S&P, S&P, SP, DOW, Dow, DJ, MSCI, Bloomberg, KBW, NASDAQ, NYSE, STOXX, FTSE, Wilshire, Morningstar, 100, 400, 500, 600, 900, 1000, 1500, 2000, and 5000 OR when the fund has a CRSP Index fund and ETF fund flag. Data on fund holdings is from Thomson Reuters s12 file. Data on shares outstanding is from CRSP.
Institutional ownership Aggregate of institutional holdings scaled by total shares outstanding. Data on institutional holdings is from Thomson Reuters 13f file. Data on fund holdings is from Thomson Reuters s12 file. Data on shares outstanding is from CRSP.
HiOS A dummy that takes the value of 1 if peer j experiences a change in its passive ownership that is above median among all firm i’s peers, and 0 otherwise.
Market beta Beta coefficient in a regression of stock returns on market return (vwretd in CRSP)
Market R2 R2 in a regression of stock returns on market return (vwretd in CRSP)
S&P500 beta Beta coefficient in a regression of stock returns on S&P500 index return (sprtrn in CRSP)
S&P500 R2 R2 in a regression of stock returns on market return (sprtrn in CRSP)
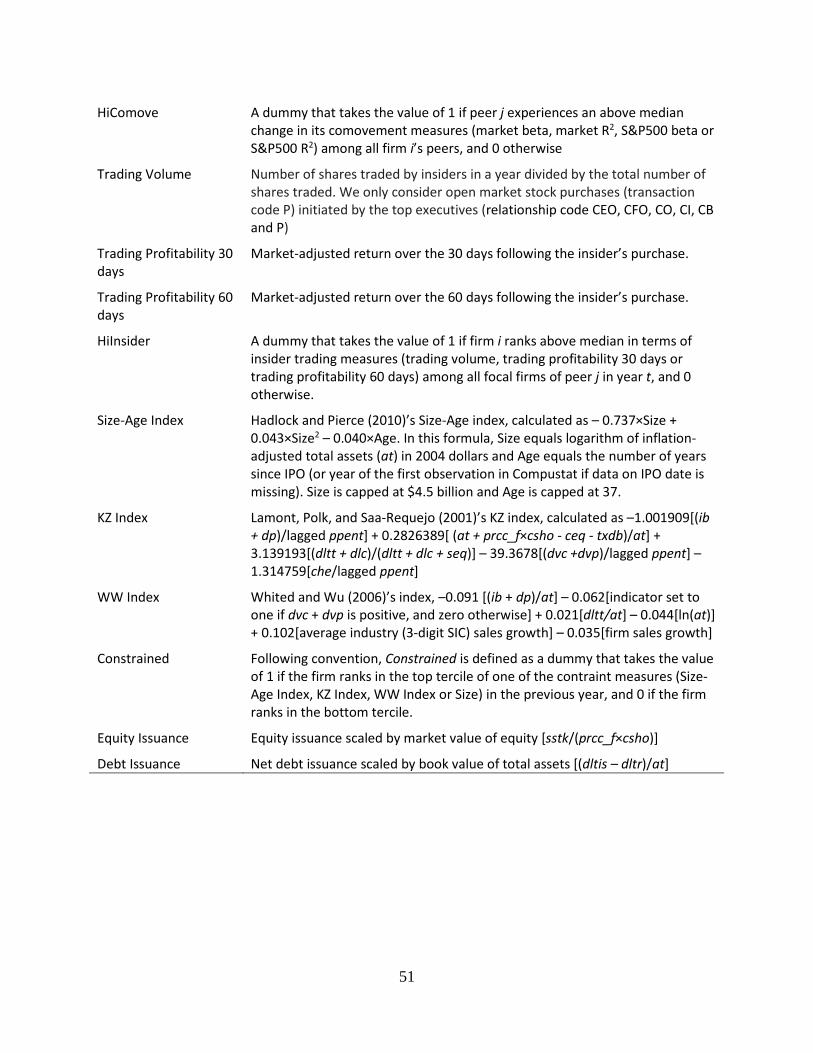
51
HiComove A dummy that takes the value of 1 if peer j experiences an above median change in its comovement measures (market beta, market R2, S&P500 beta or S&P500 R2) among all firm i’s peers, and 0 otherwise
Trading Volume Number of shares traded by insiders in a year divided by the total number of shares traded. We only consider open market stock purchases (transaction code P) initiated by the top executives (relationship code CEO, CFO, CO, CI, CB and P)
Trading Profitability 30 days
Market-adjusted return over the 30 days following the insider’s purchase.
Trading Profitability 60 days
Market-adjusted return over the 60 days following the insider’s purchase.
HiInsider A dummy that takes the value of 1 if firm i ranks above median in terms of insider trading measures (trading volume, trading profitability 30 days or trading profitability 60 days) among all focal firms of peer j in year t, and 0 otherwise.
Size-Age Index Hadlock and Pierce (2010)’s Size-Age index, calculated as – 0.737×Size + 0.043×Size2 – 0.040×Age. In this formula, Size equals logarithm of inflation-adjusted total assets (at) in 2004 dollars and Age equals the number of years since IPO (or year of the first observation in Compustat if data on IPO date is missing). Size is capped at $4.5 billion and Age is capped at 37.
KZ Index Lamont, Polk, and Saa-Requejo (2001)’s KZ index, calculated as –1.001909[(ib + dp)/lagged ppent] + 0.2826389[ (at + prcc_f×csho - ceq - txdb)/at] + 3.139193[(dltt + dlc)/(dltt + dlc + seq)] – 39.3678[(dvc +dvp)/lagged ppent] – 1.314759[che/lagged ppent]
WW Index Whited and Wu (2006)’s index, –0.091 [(ib + dp)/at] – 0.062[indicator set to one if dvc + dvp is positive, and zero otherwise] + 0.021[dltt/at] – 0.044[ln(at)] + 0.102[average industry (3-digit SIC) sales growth] – 0.035[firm sales growth]
Constrained Following convention, Constrained is defined as a dummy that takes the value of 1 if the firm ranks in the top tercile of one of the contraint measures (Size-Age Index, KZ Index, WW Index or Size) in the previous year, and 0 if the firm ranks in the bottom tercile.
Equity Issuance Equity issuance scaled by market value of equity [sstk/(prcc_f×csho)]
Debt Issuance Net debt issuance scaled by book value of total assets [(dltis – dltr)/at]