independent auditor’s report to the members of amec … assumptions used in respect of forecast...
TRANSCRIPT

86 Amec Foster Wheeler Annual report and accounts 2015
Our opinion on the financial statementsIn our opinion:
XAmec Foster Wheeler plc’s Group financial statements and Parent company financial statements (the ‘financial statements’) give a true and fair view of the state of the Group’s and of the parent company’s affairs as at 31 December 2015 and of the Group’s loss for the year then ended
X the Group financial statements have been properly prepared in accordance with International Financial Reporting Standards (‘IFRSs’) as adopted by the European Union
X the parent company financial statements have been properly prepared in accordance with United Kingdom Accounting Standards (United Kingdom Generally Accepted Accounting Practice), including Financial Reporting Standard 101 ‘Reduced Disclosure Framework’
X the financial statements have been prepared in accordance with the requirements of the Companies Act 2006, and, as regards the Group financial statements, Article 4 of the IAS Regulation
What we have auditedAmec Foster Wheeler plc’s ( the Group’s) financial statements for the year ended 31 December 2015 comprise:
Group Parent company
Consolidated income statement Balance sheet Consolidated statement of comprehensive income Statement of changes in equityConsolidated balance sheet Related notes 1 to 12 to the financial statementsConsolidated statement of changes in equity Consolidated cash flow statement Related notes 1 to 28 to the financial statements
The financial reporting framework that has been applied in the preparation of the Group financial statements is applicable law and IFRSs as adopted by the European Union. The financial reporting framework that has been applied in the preparation of the Parent company financial statements is applicable law and United Kingdom Accounting Standards (United Kingdom Generally Accepted Accounting Practice), including Financial Reporting Standard 101 ‘Reduced Disclosure Framework’.
Overview of our audit approach
Risks of material misstatement XAppropriateness of revenue recognition on contracts and adequacy of contract related provisions
XPurchase price allocation adjustments relating to the acquisition of Foster Wheeler
XGoodwill impairment
X Impact of tax planning, recognition of deferred tax assets and Research and Development tax credits
XAdequacy of legacy liabilities including asbestos and environmental
XRisk of fraud and management override
Audit scope XWe performed an audit of the complete financial information of 4 components and audit procedures on specific balances for a further 24 components
XThe components where we performed full or specific audit procedures accounted for 90% of profit before tax adjusted for certain pre-tax exceptional items and 89% of Revenue
Materiality XOverall Group materiality of £10m which represents 5% of profit before taxes adjusted for certain pre-tax exceptional items
This page does not form part of Amec Foster Wheeler’s annual report on Form 20-F as filed with the SEC.
Independent auditor’s report to the members of Amec Foster Wheeler plc

87Amec Foster Wheeler Annual report and accounts 2015
Fina
ncia
lsG
over
nanc
eS
trat
egic
rep
ort
Ad
dit
iona
l inf
orm
atio
n
Our assessment of risk of material misstatement We identified the risks of material misstatement described below as those that had the greatest effect on our overall audit strategy, the allocation of resources in the audit and the direction of the efforts of the audit team. In addressing these risks, we have performed the procedures below which were designed in the context of the financial statements as a whole and, consequently, we do not express any opinion on these individual areas.
Risk Our response to the risk What we concluded to the Audit Committee
Appropriateness of revenue recognition on contracts and adequacy of contract related provisions
Refer to the Strategic Report (page 19); the Audit Committee Report (page 59); Critical accounting policies and the use of judgments, estimates and assumptions (page 105) and Note 3 of the Group financial statements.
For the year ended 31 December 2015, and as detailed in Note 3, revenue recorded in the year was £5.5bn.
We focused on this area because there is a risk that due to the complexity associated with accounting for long term contracts and the judgements involved in determining contract provisions, Amec Foster Wheeler’s financial statements could be misstated.
Specific risks over revenue recognition include inappropriate percentage of completion accounting, incorrect recognition of variation orders and inappropriate accounting for contract contingencies.
Specific risks over contract related provisions include unrecorded liabilities for contractual disputes and inappropriate application of the Group’s policy for aged work in progress and receivables.
The magnitude of the risk (i.e., the likelihood of occurrence and the size of an error should it occur) is consistent with the prior year.
We tested internal financial controls over the calculation of revenue, including those used to determine the percentage of completion for fixed price contracts.
For a sample of contracts, we challenged management in respect of the reasonableness of judgements made regarding the cost to complete estimate, the timing of the recognition of variation orders and the appropriateness of assumptions made in estimating warranty provisions.
We have also challenged management’s assessment of the adequacy of contingency provisions against contract specific risks and their assessments around the potential for liquidated damages for projects with delays. For those contracts subject to claims, we have made enquires of internal and external legal counsel.
We have challenged the recoverabiltiy of aged work in progress and receivables and assessed whether the Group’s accouting policy has been appropriately applied.
We have assessed whether management’s policies and processes for making these estimates are appropriate, in accordance with IAS 37 and consistently applied.
Overall, we are satisfied that Amec Foster Wheeler’s accounting policy for revenue recognition and contract related provisions are reasonable and have been appropriately applied. The valuation of contract risk provisions at 31 December 2015 is within an acceptable range.
Purchase price allocation adjustments relating to the acquisition of Foster Wheeler
Refer to the Audit Committee Report (page 60); Critical accounting policies and the use of judgments, estimates and assumptions (page 105) and Note 24 of the Group financial statements.
We focused on this area given the judgements involved in making final adjustments to the provisional fair values of assets and liabilities acquired.
These judgements include determination of whether the circumstance which gave rise to the final adjustment existed at the acquisition date and also whether the valuation methodology applied in making the adjustment is reasonable.
The magnitude of the risk (i.e., the likelihood of occurrence and the size of an error should it occur) is higher than in the prior year.
We tested internal financial controls over the identification of adjustments to be made to the provisional fair value accounting of assets and liabilities acquired with Foster Wheeler. We also tested controls in place over the calculation of the final adjustments.
We challenged management over the assumptions and valuation techniques used in calculating the adjustments made to the provisional valuation of assets and liabilities acquired. This included corroborating the valuation to external sources such as settlement agreements as applicable.
We gained an understanding of the situation relating to each adjustment at the time of the acquisition to assess their appropriateness.
The fair values of the assets and liabilities recognised on the acquisition of Foster Wheeler have been measured within an acceptable range.
This page does not form part of Amec Foster Wheeler’s annual report on Form 20-F as filed with the SEC.

88 Amec Foster Wheeler Annual report and accounts 2015
Risk Our response to the risk What we concluded to the Audit Committee
Goodwill impairment
Refer to the Audit Committee Report (page 60); Critical accounting policies and the use of judgments, estimates and assumptions (page 106) and Note 12 of the Group financial statements.
The total carrying value of goodwill at the year end is £2.2bn. This is following an impairment of £308m which has been recorded in the Global Power Group (‘GPG’) segment. An impairment has arisen as the recoverable amount of GPG was less than the carrying value of the investment.
We focused on this area given the significant judgements and complexity of valuation methodologies used to determine whether the carrying value of goodwill is appropriate. These include the determination of the cash generating units used to assess goodwill for impairment, the allocation of goodwill to cash generating units and the assumptions used within models to support the recoverable amount of goodwill.
The magnitude of the risk (i.e., the likelihood of occurrence and the size of an error should it occur) is higher than in the prior year
We tested internal financial controls for the goodwill impairment process including the determination of assumptions used within the models to assess the recoverable amount of goodwill.
We tested the integrity of the models and challenged the appropriateness of the cash generating units determined by management. We challenged the assumptions used in respect of forecast growth rates and involved our valuation specialists to corroborate the appropriateness of the discount and growth rates used. We have evaluated the profit forecasts used within the models against current trading conditions and challenged management on the key assumptions underpinning the forecasts. This included stress testing the models, to determine the degree to which the assumptions would need to move before an impairment would be triggered.
The impairment recognised in respect of the goodwill allocated to GPG has been appropriately determined.
The carrying value of goodwill post the impairment recorded at the year end is appropriate.
Impact of tax planning, recognition of deferred tax assets and research and development tax credits
Refer to the Audit Committee Report (page 60) and Notes 8 and 15 of the Group financial statements.
We focused on the risk arising from tax planning given the significant judgements involved in assessing uncertain tax positions including those relating to the financing structures the Group has in place in Canada and the United States.
We focus on the recognition of certain deferred tax assets and assets relating to research and development credits as both these areas involve judgement in the assessment of the recoverability of the associated tax asset. This includes assessment of the period over which taxable profits will be available to utilise the assets against.
The magnitude of the risk (i.e., the likelihood of occurrence and the size of an error should it occur) is consistent with the prior year.
We tested internal financial controls over the determination of tax risk provisions. We also tested internal financial controls over the recognition of deferred tax and research and development assets.
We challenged tax exposures estimated by management. Using our tax experts, we evaluated the risk analysis associated with these exposures along with claims or assessments made by tax authorities to date. We have also reviewed documentation in relation to tax audits to ensure that any exposures the tax authorities are raising have been considered and provided for where necessary.
We have challenged the profit forecasts used by management in determining the period over which deferred tax assets and assets held in respect of research and development tax credits will be recovered. We have also assessed if management’s rationale over the length of time such assets will be recovered, is reasonable. We have evaluated the historical accuracy of forecasting taxable profits and the integrity of the models used.
We are satisfied that the provisions recorded in respect of tax risks are within an acceptable range.
The carrying value of assets relating to deferred tax and research and development tax credits are within an acceptable range at the year end.
Independent auditor’s report to the members of Amec Foster Wheeler plc continued
This page does not form part of Amec Foster Wheeler’s annual report on Form 20-F as filed with the SEC.

89Amec Foster Wheeler Annual report and accounts 2015
Fina
ncia
lsG
over
nanc
eS
trat
egic
rep
ort
Ad
dit
iona
l inf
orm
atio
n
Risk Our response to the risk What we concluded to the Audit Committee
Adequacy of legacy liabilities including asbestos and environmental
Refer to the Strategic Report (page 21), the Audit Committee Report (page 60); Critical accounting policies and the use of judgments, estimates and assumptions (page 105) and Note 21 of the Group financial statements.
The Group has risk relating to claims or potential claims resulting from the disposal of businesses in previous years and those relating to asbestos exposure and environmental contamination. Total provisions relating to legacy businesses at the year end are £124m, asbestos £378m and environmental £44m.
We focused on this area, as determining the impact and likely outcome of any litigation matters requires significant judgement. There is also a risk that provisions are not made for claims which have been received.
The magnitude of the risk (i.e., the likelihood of occurrence and the size of an error should it occur) is consistent with the prior year.
We tested internal financial controls over the appropriate valuation of liabilities. We assessed the judgements and accounting treatments made by management arising from contractual disputes and other risks. We performed audit procedures on supporting calculations and assumptions.
Where appropriate, we have held discussions with management’s legal experts and also obtained and considered legal letters from external counsel and other supporting documentation.
We have engaged our own actuarial specialists to support our audit procedures in respect of asbestos liabilities. These procedures include assessment of the methodology used by management.
The valuation of legacy liabilities including asbestos and environmental liabilities at 31 December 2015 is within an acceptable range.
The disclosures made in respect to contingent liabilities are appropriate.
Risk of fraud and management override
The risk of fraud exists in any business. However, fraud involving the manipulation of results to achieve performance targets are particularly harmful to shareholder value and the current economic environment has increased their risk of occurrence.
The evolution of the business and geographical footprint across new territories heightens the risk of fraud and bribery and corruption. Business practice in emerging markets may expose Amec Foster Wheeler to financial, legal and reputational risk.
The risk of fraud and management override could involve the manipulation of results to achieve performance targets or asset misappropriation, particularly involving third party suppliers who may overbill for goods or services and facilitation payments to secure business.
The magnitude of the risk (i.e., the likelihood of occurrence and the size of an error should it occur) is consistent with the prior year.
We considered Transparency International’s Corruption Perception Index 2014 when performing our scoping exercise. Components with significant operations in countries which are high on the Index have been included in our in scope components.
We have tested entity level controls over the implementation of Group wide policies and procedures.
We performed audit procedures including analytical review and journal entry testing in order to identify and address the risk of management override of controls. We designed testing procedures and thresholds for all balances in such a way as to ensure that the risk of fraud and error is mitigated.
We challenged and corroborated the basis of management’s key estimates, such as those made in determining trading provisions.
We have taken into account Transparency International’s Corruption Perception Index 2014 when preforming our scoping exercise.
As a result of procedures performed, we did not find any evidence of material management override or undetected fraud.
In addition to the risks identified as part of our audit planning, the size of and judgement involved in determining the Group’s exceptional items affected the allocation of resources and the direction of our audit efforts and for which our audit response was as follows:
This page does not form part of Amec Foster Wheeler’s annual report on Form 20-F as filed with the SEC.

90 Amec Foster Wheeler Annual report and accounts 2015
Risk Our response to the risk What we concluded to the Audit Committee
Presentation of exceptional items
Amec Foster Wheeler consider the separate reporting of exceptional costs helps to provide a better indication of the Group’s underlying business performance.
Continuing pre-tax exceptional costs including impairment and amortisation recorded in the current year are £559m (2014: £156m).
There is judgement in determining whether the classification and measurement of items presented as exceptional is reasonable. There is also a risk that the Group’s policy for such items is not applied consistently.
We have tested controls in place over the determination of items to be recorded as exceptional.
We have challenged management over whether the costs which have been recorded as exceptional are recorded in line with the Group’s policy and have been appropriately excluded from trading profit. In particular, we have challenged whether the inclusion of internal labour costs on the basis of time spent on integration activities is reasonable and whether the inclusion of restructuring costs is reasonable. We have considered the Financial Reporting Council (‘FRC’) guidance on items being reported as exceptional.
We have assessed whether the level of disclosure provided in the financial statements appropriately reflects the assessment made by management in determining the classification of such items as exceptional.
Overall, the disclosure of exceptional items are in accordance with the Group’s disclosed accounting policy for exceptional items and is in accordance with the requirements of IAS 1, Presentation of Financial Statements.
The scope of our audit Tailoring the scopeOur assessment of audit risk, our evaluation of materiality and our allocation of performance materiality determine our audit scope for each entity within the Group. Taken together, this enables us to form an opinion on the consolidated financial statements. We take into account size, risk profile, the organisation of the Group and effectiveness of Group-wide controls, changes in the business environment and other factors such as recent Group Internal Audit result findings when assessing the level of work to be performed at each entity.
In assessing the risk of material misstatement to the Group financial statements, and to ensure we had adequate quantitative coverage of significant accounts in the financial statements we selected 28 components covering entities within UK, US, Canada, Italy, China, Australia and Singapore, which represent the principal business units within the Group. The Primary Team performs audit procedures on those areas of accounting performed centrally such as goodwill and intangible asset impairment reviews and consolidation adjustments.
Of the 28 components selected, we performed an audit of the complete financial information of 4 components (‘full scope components’) which were selected based on their size or risk characteristics. For the remaining 24 components (‘specific scope components’), we performed audit procedures on specific accounts within that component that we considered had the potential for the greatest impact on the significant accounts in the financial statements either because of the size of these accounts or their risk profile. The audit risks disclosed above were subject to full scope audit procedures as appropriate.
The reporting components where we performed full and specific audit procedures accounted for 90% (2014: 90%) of the Group’s profit before tax adjusted for certain pre-tax exceptional items and 89% (2014: 92%) of the Group’s Revenue.
For the current year, the full scope components contributed 59% of the Group’s profit before tax adjusted for certain pre-tax exceptional items and 69% of the Group’s Revenue.
The specific scope component contributed 31% of the profit before tax adjusted for certain pre-tax exceptional items used to calculate materiality and 20% of the Group’s Revenue. The audit scope of these components may not have included testing of all significant accounts of the component but will have contributed to the coverage of risks tested for the Group.
Of the remaining components that together represent 10% of the Group’s profit before tax adjusted for certain pre-tax exceptional items, none are individually greater than 5% of the Group’s adjusted profit before tax. For these components, we performed other procedures, including analytical review, testing of consolidation journals, intercompany eliminations and foreign currency translation recalculations to respond to any potential risks of material misstatement to the Group financial statements.
Independent auditors’ report to the members of Amec Foster Wheeler plc continued
This page does not form part of Amec Foster Wheeler’s annual report on Form 20-F as filed with the SEC.

91Amec Foster Wheeler Annual report and accounts 2015
Fina
ncia
lsG
over
nanc
eS
trat
egic
rep
ort
Ad
dit
iona
l inf
orm
atio
n
The charts below illustrate the coverage obtained from the work performed by our audit teams.
Changes from the prior year The basis of our audit scoping has changed in the current year following a change to the Group’s internal reporting structure. Our audit coverage in 2015 is consistent with that of 2014.
Involvement with component teams In establishing our overall approach to the Group audit, we determined the type of work that needed to be undertaken at each of the components by us, as the primary audit engagement team, or by component auditors from other EY global network firms operating under our instruction. Of the 4 full scope components, audit procedures were performed on 1 of these directly by the primary audit team and 3 by component teams. For the 24 specific scope components, where the work was primarily performed by component auditors, we determined the appropriate level of involvement to enable us to determine that sufficient audit evidence had been obtained as a basis for our opinion on the Group as a whole.
The Group audit team continued to follow a programme of planned visits that has been designed to ensure that the Senior Statutory Auditor or his designate visits each of the key locations at both the interim and year end stages of the audit process. During the current year’s audit cycle, visits were undertaken by the primary audit team to the component teams in Canada, the United States and various sites in the UK, including some specific scope locations.
These visits involved co-developing the significant risk area audit approach, reviewing key local working papers and conclusions, meeting with local and regional leadership team, getting an understanding of key control processes including centralised entity level control processes and attending closing meetings. The primary team interacted regularly with the component teams where appropriate during various stages of the audit, attended all full scope and certain specific scope closing meetings in person and all other specific scope close meetings via conference call, reviewed key working papers and were responsible for the scope and direction of the audit process. This, together with the additional procedures performed at Group level, gave us appropriate evidence for our opinion on the Group financial statements.
Our application of materiality We apply the concept of materiality in planning and performing the audit, in evaluating the effect of identified misstatements on the audit and in forming our audit opinion.
MaterialityThe magnitude of an omission or misstatement that, individually or in the aggregate, could reasonably be expected to influence the economic decisions of the users of the financial statements. Materiality provides a basis for determining the nature and extent of our audit procedures.
We determined materiality for the Group to be £10 million (2014: £14.4 million), which is 5% (2014: 5%) of profit before tax adjusted for certain pre-tax exceptional items. We believe that profit before tax, adjusted for the items, as described below, provides us with a consistent year on year basis for determining materiality and is the most relevant performance measure to the stakeholders of the entity. Detailed audit procedures are performed on material exceptional items.
This page does not form part of Amec Foster Wheeler’s annual report on Form 20-F as filed with the SEC.
Profit before tax adjusted for certain pre-tax exceptional items%
Full scope components Specific scope components Other procedures
59
31
10 Revenue%
Full scope components Specific scope components Other procedures
20
69
11
Materiality
Adjustments
X £(235)m
X Loss before tax
X £429m
X Adjust for certain pre tax exceptional items to determine adjusted profit before tax
X Totals £194m
X Materiality of £10m (5% of materiality basis)
Starting basis

92 Amec Foster Wheeler Annual report and accounts 2015
Performance materialityThe application of materiality at the individual account or balance level. It is set at an amount to reduce to an appropriately low level the probability that the aggregate of uncorrected and undetected misstatements exceeds materiality.
On the basis of our risk assessments, together with our assessment of the Group’s overall control environment and other qualitative considerations, our judgement was that overall performance materiality (i.e. our tolerance for misstatement in an individual account or balance) was 50% (2014: 50%) of our planning materiality, namely £5m (2014: £7.2m). We have set performance materiality at this percentage to ensure that the total uncorrected and undetected audit differences in all accounts did not exceed our materiality.
Audit work at component locations for the purpose of obtaining audit coverage over significant financial statement accounts is undertaken based on a percentage of total performance materiality. The performance materiality set for each component is based on the relative scale and risk of the component to the Group as a whole and our assessment of the risk of misstatement at that component. In the current year, the range of performance materiality allocated to components was £1m to £4m (2014: £1m to £7m).
Reporting thresholdAn amount below which identified misstatements is considered as being clearly trivial.
We agreed with the Audit Committee that we would report to them all uncorrected audit differences in excess of £0.5m (2014: £0.5m), which is set at 5% of planning materiality, as well as differences below that threshold that, in our view, warranted reporting on qualitative grounds.
We evaluate any uncorrected misstatements against both the quantitative measures of materiality discussed above and in light of other relevant qualitative considerations in forming our opinion.
Scope of the audit of the financial statementsAn audit involves obtaining evidence about the amounts and disclosures in the financial statements sufficient to give reasonable assurance that the financial statements are free from material misstatement, whether caused by fraud or error. This includes an assessment of: whether the accounting policies are appropriate to the Group’s and the parent company’s circumstances and have been consistently applied and adequately disclosed; the reasonableness of significant accounting estimates made by the directors; and the overall presentation of the financial statements. In addition, we read all the financial and non-financial information in the annual report to identify material inconsistencies with the audited financial statements and to identify any information that is apparently materially incorrect based on, or materially inconsistent with, the knowledge acquired by us in the course of performing the audit. If we become aware of any apparent material misstatements or inconsistencies we consider the implications for our report.
Respective responsibilities of directors and auditorAs explained more fully in the Directors’ Responsibilities Statement set out on page 85, the directors are responsible for the preparation of the financial statements and for being satisfied that they give a true and fair view. Our responsibility is to audit and express an opinion on the financial statements in accordance with applicable law and International Standards on Auditing (UK and Ireland). Those standards require us to comply with the Auditing Practices Board’s Ethical Standards for Auditors.
This report is made solely to the company’s members, as a body, in accordance with Chapter 3 of Part 16 of the Companies Act 2006. Our audit work has been undertaken so that we might state to the company’s members those matters we are required to state to them in an auditor’s report and for no other purpose. To the fullest extent permitted by law, we do not accept or assume responsibility to anyone other than the company and the company’s members as a body, for our audit work, for this report, or for the opinions we have formed.
Opinion on other matters prescribed by the Companies Act 2006In our opinion:
X the part of the Directors’ Remuneration Report to be audited has been properly prepared in accordance with the Companies Act 2006
X the information given in the Strategic Report and the Directors’ Report for the financial year for which the financial statements are prepared is consistent with the financial statements
Independent auditors’ report to the members of Amec Foster Wheeler plc continued
This page does not form part of Amec Foster Wheeler’s annual report on Form 20-F as filed with the SEC.

93Amec Foster Wheeler Annual report and accounts 2015
Fina
ncia
lsG
over
nanc
eS
trat
egic
rep
ort
Ad
dit
iona
l inf
orm
atio
n
Matters on which we are required to report by exceptionISAs (UK and Ireland) reportingWe are required to report to you if, in our opinion, financial and non-financial information in the annual report is:
Xmaterially inconsistent with the information in the audited financial statements; or
Xapparently materially incorrect based on, or materially inconsistent with, our knowledge of the Group acquired in the course of performing our audit; or
Xotherwise misleading
In particular, we are required to report whether we have identified any inconsistencies between our knowledge acquired in the course of performing the audit and the directors’ statement that they consider the annual report and accounts taken as a whole is fair, balanced and understandable and provides the information necessary for shareholders to assess the entity’s performance, business model and strategy; and whether the annual report appropriately addresses those matters that we communicated to the Audit Committee that we consider should have been disclosed.
We have no exceptions to report.
Companies Act 2006 reportingWe are required to report to you if, in our opinion:
Xadequate accounting records have not been kept by the parent company, or returns adequate for our audit have not been received from branches not visited by us; or
X the parent company financial statements and the part of the Directors’ Remuneration Report to be audited are not in agreement with the accounting records and returns; or
Xcertain disclosures of directors’ remuneration specified by law are not made; or
Xwe have not received all the information and explanations we require for our audit
We have no exceptions to report.
Listing Rules review requirementsWe are required to review:
X the directors’ statement in relation to going concern set out on page 37 and longer-term viability set out on page 21
X the part of the Corporate Governance Statement relating to the company’s compliance with the provisions of the UK Corporate Governance Code specified for our review
We have no exceptions to report.
Statement on the directors’ assessment of the principal risks that would threaten the solvency or liquidity of the entityISAs (UK and Ireland) reportingWe are required to give a statement as to whether we have anything material to add or to draw attention to in relation to:
X the directors’ confirmation in the annual report that they have carried out a robust assessment of the principal risks facing the entity, including those that would threaten its business model, future performance, solvency or liquidity
X the disclosures in the annual report that describe those risks and explain how they are being managed or mitigated
X the directors’ statement in the financial statements about whether they considered it appropriate to adopt the going concern basis of accounting in preparing them, and their identification of any material uncertainties to the entity’s ability to continue to do so over a period of at least twelve months from the date of approval of the financial statements
X the directors’ explanation in the annual report as to how they have assessed the prospects of the entity, over what period they have done so and why they consider that period to be appropriate, and their statement as to whether they have a reasonable expectation that the entity will be able to continue in operation and meet its liabilities as they fall due over the period of their assessment, including any related disclosures drawing attention to any necessary qualifications or assumptions
We have nothing material to add or to draw attention to.
Colin Brown (Senior statutory auditor)for and on behalf of Ernst & Young LLP, Statutory Auditor London
10 March 2016
This page does not form part of Amec Foster Wheeler’s annual report on Form 20-F as filed with the SEC.

94 Amec Foster Wheeler Annual report and accounts 2015
The Board of Directors and Shareholders of Amec Foster Wheeler plc We have audited Amec Foster Wheeler plc’s internal control over financial reporting as of 31 December 2015, based on criteria established in Internal Control—Integrated Framework issued by the Committee of Sponsoring Organisations of the Treadway Commission 2013 framework (the COSO criteria). Amec Foster Wheeler plc’s management is responsible for maintaining effective internal control over financial reporting, and for its assessment of the effectiveness of internal control over financial reporting included in the accompanying Management’s Annual Report on Internal Control over Financial Reporting. Our responsibility is to express an opinion on the company’s internal control over financial reporting based on our audit.
We conducted our audit in accordance with the standards of the Public Company Accounting Oversight Board (United States). Those standards require that we plan and perform the audit to obtain reasonable assurance about whether effective internal control over financial reporting was maintained in all material respects. Our audit included obtaining an understanding of internal control over financial reporting, assessing the risk that a material weakness exists, testing and evaluating the design and operating effectiveness of internal control based on the assessed risk, and performing such other procedures as we considered necessary in the circumstances. We believe that our audits provide a reasonable basis for our opinion.
A company’s internal control over financial reporting is a process designed to provide reasonable assurance regarding the reliability of financial reporting and the preparation of financial statements for external purposes in accordance with generally accepted accounting principles. A company’s internal control over financial reporting includes those policies and procedures that (1) pertain to the maintenance of records that, in reasonable detail, accurately and fairly reflect the transactions and dispositions of the assets of the company; (2) provide reasonable assurance that transactions are recorded as necessary to permit preparation of financial statements in accordance with generally accepted accounting principles, and that receipts and expenditures of the company are being made only in accordance with authorisations of management and directors of the company; and (3) provide reasonable assurance regarding prevention or timely detection of unauthorised acquisition, use, or disposition of the company’s assets that could have a material effect on the financial statements.
Because of its inherent limitations, internal control over financial reporting may not prevent or detect misstatements. Also, projections of any evaluation of effectiveness to future periods are subject to the risk that controls may become inadequate because of changes in conditions, or that the degree of compliance with the policies or procedures may deteriorate.
In our opinion, Amec Foster Wheeler plc maintained, in all material respects, effective internal control over financial reporting as of 31 December 2015, based on the COSO criteria.
We also have audited, in accordance with the standards of the Public Company Accounting Oversight Board (United States), the consolidated balance sheets of Amec Foster Wheeler as of 31 December 2015 and 2014, and the related consolidated income statement, statement of comprehensive income, changes in equity and cash flow statement for each of the three years in the period ended 31 December 2015 of Amec Foster Wheeler plc and our report dated 10 March 2016, expressed an unqualified opinion thereon.
Ernst & Young LLPLondon, England
10 March 2016
Report of independent registered public accounting firm on internal control over financial reporting
95Amec Foster Wheeler Annual report and accounts 2015
Fina
ncia
lsG
over
nanc
eS
trat
egic
rep
ort
Ad
dit
iona
l inf
orm
atio
n
The Board of Directors and Shareholders of Amec Foster Wheeler plcWe have audited the accompanying consolidated balance sheets of Amec Foster Wheeler plc as of December 31, 2015 and 2014, and the related consolidated income statement, statements of comprehensive income, change in equity and cash flows for each of the three years in the period ended December 31, 2015. These financial statements are the responsibility of the Company’s management. Our responsibility is to express an opinion on these financial statements based on our audits.
We conducted our audits in accordance with the standards of the Public Company Accounting Oversight Board (United States). Those standards require that we plan and perform the audit to obtain reasonable assurance about whether the financial statements are free of material misstatement. An audit includes examining, on a test basis, evidence supporting the amounts and disclosures in the financial statements. An audit also includes assessing the accounting principles used and significant estimates made by management, as well as evaluating the overall financial statement presentation. We believe that our audits provide a reasonable basis for our opinion.
In our opinion, the financial statements referred to above present fairly, in all material respects, the consolidated financial position of Amec Foster Wheeler at December 31, 2015 and 2014, and the consolidated results of its operations and its cash flows for each of the three years in the period ended December 31, 2015, in accordance with International Financial Reporting Standards as adopted by the European Union and International Financial Reporting Standards as issued by the International Accounting Standards Board.
We also have audited, in accordance with the standards of the Public Company Accounting Oversight Board (United States), Amec Foster Wheeler plc’s internal control over financial reporting as of December 31, 2015, based on criteria established in Internal Control-Integrated Framework issued by the Committee of Sponsoring Organisations of the Treadway Commission (2013 framework) and our report dated 10 March 2016, expressed an unqualified opinion thereon.
Ernst & Young LLPLondon, England
10 March 2016
Report of independent registered public accounting firm
Notes 1 The maintenance and integrity of the Amec Foster Wheeler plc web site is the responsibility of the directors; the work carried out by the auditors does
not involve consideration of these matters and, accordingly, the auditors accept no responsibility for any changes that may have occurred to the financial statements since they were initially presented on the web site.
2 Legislation in the United Kingdom governing the preparation and dissemination of financial statements may differ from legislation in other jurisdictions.

96 Amec Foster Wheeler Annual report and accounts 2015
Consolidated income statementFor the year ended 31 December 2015
2015 2014 2013
Note
Before amortisation,
exceptional items and asbestos
related items £m
Amortisation, exceptional
items and asbestos
related items (note 5)
£mTotal
£m
Before amortisation,
exceptional items and asbestos
related items £m
Amortisation, exceptional
items and asbestos
related items (note 5)
£mTotal
£m
Before amortisation
and exceptional
items £m
Amortisation and
exceptional items
(note 5) £m
Total £m
Continuing operations Revenue 2, 3 5,455 − 5,455 3,993 – 3,993 3,974 – 3,974Cost of sales (4,787) − (4,787) (3,475) – (3,475) (3,431) – (3,431)
Gross profit 668 − 668 518 – 518 543 – 543Administrative expenses (334) (538) (872) (219) (135) (354) (228) (65) (293)Loss on business disposals and closures − (1) (1) – (16) (16) – (7) (7)
Profit/(loss) before net financing expense 4 334 (539) (205) 299 (151) 148 315 (72) 243
Financial income 16 − 16 11 – 11 12 – 12Financial expense (54) (20) (74) (11) (5) (16) (14) – (14)
Net financing expense 7 (38) (20) (58) – (5) (5) (2) – (2)Share of post-tax results of joint ventures 2, 13 28 − 28 12 – 12 14 – 14
Profit/(loss) before income tax 2 324 (559) (235) 311 (156) 155 327 (72) 255Income tax 8 (63) 45 (18) (67) 18 (49) (67) (2) (69)
Profit/(loss) for the year from continuing operations 261 (514) (253) 244 (138) 106 260 (74) 186(Loss)/profit for the year from discontinued operations 9 (5) 1 (4) (8) (19) (27) (8) – (8)
Profit/(loss) for the year 256 (513) (257) 236 (157) 79 252 (74) 178
Attributable to:Equity holders of the parent (256) 82 179Non-controlling interests (1) (3) (1)
(257) 79 178
Basic (loss)/earnings per share 10
Continuing operations 68.1p (66.1)p 81.8p 36.1p 89.0p 63.8pDiscontinued operations (1.3)p (1.1)p (2.6)p (8.9)p (2.7)p (2.7)p
66.8p (67.2)p 79.2p 27.2p 86.3p 61.1p
Diluted (loss)/earnings per share 10
Continuing operations 67.7p (66.1)p 79.5p 35.1p 87.2p 62.5pDiscontinued operations (1.3)p (1.1)p (2.5)p (8.6)p (2.7)p (2.7)p
66.4p (67.2)p 77.0p 26.5p 84.5p 59.8p

97Amec Foster Wheeler Annual report and accounts 2015
Fina
ncia
lsG
over
nanc
eS
trat
egic
rep
ort
Ad
dit
iona
l inf
orm
atio
n
Consolidated statement of comprehensive incomeFor the year ended 31 December 2015
Note2015
£m
2014 (restated)
£m2013
£m
(Loss)/profit for the year (257) 79 178Other comprehensive incomeItems that may be reclassified to profit and lossExchange movements:− Exchange movements on translation of foreign subsidiaries (46) (4) (70)− Net (loss)/gain on hedges of net investment in foreign subsidiaries 19 (3) (4) (1)− Tax on exchange movements − – 1Cash flow hedges:− Effective portion of changes in fair value (2) (1) 3− Tax on effective portion of changes in fair value 2 – (1)− Transferred to the income statement − – 1
(49) (9) (67)
Items that will not be reclassified to profit and lossActuarial gains/(losses) on defined benefit pension schemes 14 150 (58) 40Tax on actuarial gains/(losses) (25) 11 (20)
125 (47) 20
Other comprehensive income 76 (56) (47)
Total comprehensive income (181) 23 131
Attributable to:Equity holders of the parent (181) 26 133Non-controlling interests − (3) (2)
Total comprehensive income (181) 23 131

98 Amec Foster Wheeler Annual report and accounts 2015
Note2015
£m
2014 (restated)
£m
ASSETSNon-current assetsProperty, plant and equipment 11 127 150Intangible assets 12 3,025 3,443Interests in joint ventures 13 104 122Derivative financial instruments 19 18 2Retirement benefit assets 14 231 102Other receivables 20 145 167Deferred tax assets 15 50 56
Total non-current assets 3,700 4,042
Current assetsInventories 16 13 14Trade and other receivables 17 1,455 1,469Derivative financial instruments 19 16 12Current tax receivable 25 12Bank deposits (more than three months) 23 23 21Cash and cash equivalents (excluding bank overdrafts) 23 340 495
Total current assets 1,872 2,023
Total assets 5,572 6,065
LIABILITIESCurrent liabilitiesInterest-bearing loans and borrowings 23 (683) (710)Trade and other payables 18 (1,459) (1,438)Derivative financial instruments 19 (21) (14)Current tax payable (98) (130)
Total current liabilities (2,261) (2,292)
Non-current liabilitiesInterest-bearing loans and borrowings 23 (640) (609)Trade and other payables 20 (121) (111)Derivative financial instruments 19 (4) (5)Retirement benefit liabilities 14 (168) (188)Deferred tax liabilities 15 (106) (108)Provisions 21 (664) (756)
Total non-current liabilities (1,703) (1,777)
Total liabilities (3,964) (4,069)
Net assets 1,608 1,996
EQUITYShare capital 22 197 194Share premium account 133 101Merger reserve 540 877Hedging and translation reserves (26) 24Capital redemption reserve 34 34Retained earnings 721 744
Total equity attributable to equity holders of the parent 1,599 1,974Non-controlling interests 9 22
Total equity 1,608 1,996
The accounts on pages 96 to 156 were approved by the board of directors on 10 March 2016 and were signed on its behalf by:
Ian McHoulChief Financial Officer and interim CEO
Consolidated balance sheetAs at 31 December 2015Registered number 1675285

99Amec Foster Wheeler Annual report and accounts 2015
Fina
ncia
lsG
over
nanc
eS
trat
egic
rep
ort
Ad
dit
iona
l inf
orm
atio
n
Share capital
£m
Share premium
£m
Merger reserve
£m
Hedging reserve
£m
Translation reserve
£m
Capital redemption
reserve £m
Retained earnings
£mTotal
£m
Non-controlling
interests £m
Total equity
£m
As at 1 January 2015 (restated) 194 101 877 – 24 34 744 1,974 22 1,996
Loss for the year − − − − − − (256) (256) (1) (257)
Exchange movements on translation of foreign subsidiaries − − − − (47) − − (47) 1 (46)Net loss on hedges of net investment in foreign subsidiaries − − − − (3) − − (3) − (3)Effective portion of changes in fair value of cash flow hedges − − − (2) − − − (2) − (2)Tax on effective portion of changes in fair value on cash flow hedges − − − 2 − − − 2 − 2Actuarial gains on defined benefit pension schemes − − − − − − 150 150 − 150Tax on actuarial gains − − − − − − (25) (25) − (25)
Other comprehensive income for the year − − − − (50) − 125 75 1 76
Total comprehensive income for the year − − − − (50) − (131) (181) − (181)Dividends − − − − − − (167) (167) − (167)Dividends to non-controlling interests − − − − − − − − (4) (4)Equity-settled share-based payments − − − − − − 7 7 − 7Acquisition of shares by trustees of the Employee Share Trust − − − − − − (5) (5) − (5)Utilisation of treasury shares − − − − − − 15 15 − 15Acquisition of non-controlling interests − − − − − − (79) (79) (9) (88)Shares issued 3 32 − − − − − 35 − 35Transfer of impairment losses to merger reserve − − (337) − − − 337 − − −
As at 31 December 2015 197 133 540 − (26) 34 721 1,599 9 1,608
Consolidated statement of changes in equityFor the year ended 31 December 2015

100 Amec Foster Wheeler Annual report and accounts 2015
Share capital
£m
Share premium
£m
Merger reserve
£m
Hedging reserve
£m
Translation reserve
£m
Capital redemption
reserve £m
Retained earnings
£mTotal
£m
Non-controlling
interests £m
Total equity
£m
As at 1 January 2014 152 101 – 1 32 34 802 1,122 2 1,124
Profit for the year – – – – – – 82 82 (3) 79
Exchange movements on translation of foreign subsidiaries – – – – (4) – – (4) – (4)Net loss on hedges of net investment in foreign subsidiaries – – – – (4) – – (4) – (4)Effective portion of changes in fair value of cash flow hedges – – – (1) – – – (1) – (1)Actuarial losses on defined benefit pension schemes – – – – – – (58) (58) – (58)Tax on actuarial losses – – – – – – 11 11 – 11
Other comprehensive income for the year – – – (1) (8) – (47) (56) – (56)
Total comprehensive income for the year – – – (1) (8) – 35 26 (3) 23Dividends – – – – – – (124) (124) – (124)Equity-settled share-based payments – – – – – – 25 25 – 25Utilisation of treasury shares – – – – – – 6 6 – 6Arising on business combinations – – – – – – – – 23 23Shares issued 42 877 – – – – – 919 – 919Transfer to merger reserve − (877) 877 − − − − − − –
As at 31 December 2014 (restated) 194 101 877 – 24 34 744 1,974 22 1,996
Consolidated statement of changes in equity continuedFor the year ended 31 December 2014

101Amec Foster Wheeler Annual report and accounts 2015
Fina
ncia
lsG
over
nanc
eS
trat
egic
rep
ort
Ad
dit
iona
l inf
orm
atio
n
Share capital
£m
Share premium
£m
Hedging reserve
£m
Translation reserve
£m
Capital redemption
reserve £m
Retained earnings
£mTotal
£m
Non-controlling
interests £m
Total equity
£m
As at 1 January 2013 154 101 (2) 101 32 693 1,079 4 1,083
Profit for the year – – – – – 179 179 (1) 178
Exchange movements on translation of foreign subsidiaries – – – (69) – – (69) (1) (70)Net loss on hedges of net investment in foreign subsidiaries – – – (1) – – (1) – (1)Tax on exchange movements – – – 1 – – 1 – 1Effective portion of changes in fair value of cash flow hedges – – 3 – – – 3 – 3Tax on effective portion of changes in fair value of cash flow hedges – – (1) – – – (1) – (1)Cash flow hedges transferred to the income statement – – 1 – – – 1 – 1Actuarial gains on defined benefit pension schemes – – – – – 40 40 – 40Tax on actuarial gains – – – – – (20) (20) – (20)
Other comprehensive income for the year – – 3 (69) – 20 (46) (1) (47)
Total comprehensive income for the year – – 3 (69) – 199 133 (2) 131Dividends – – – – – (108) (108) – (108)Equity-settled share-based payments – – – – – 14 14 – 14Tax on equity-settled share-based payments – – – – – (1) (1) – (1)Acquisition of shares by trustees of the Employee Share Trust – – – – – (2) (2) – (2)Utilisation of treasury shares – – – – – 7 7 – 7Acquisition of shares under the buyback programme (2) – – – 2 – – – –
As at 31 December 2013 152 101 1 32 34 802 1,122 2 1,124
Consolidated statement of changes in equity continuedFor the year ended 31 December 2013

102 Amec Foster Wheeler Annual report and accounts 2015
Note2015
£m2014
£m2013
£m
Cash flow from operating activities(Loss)/profit before income tax from continuing operations (235) 155 255Loss before income tax from discontinued operations 9 (5) (33) (16)
(Loss)/profit before income tax (240) 122 239Financial income 7 (16) (11) (12)Financial expense 7 74 16 14Share of post-tax results of joint ventures 2, 13 (28) (12) (14)Intangible impairment and amortisation 5, 12 444 49 47Depreciation 11 26 16 12(Profit)/loss on disposal of businesses 5 (1) 44 6Difference between contributions to retirement benefit schemes and current service cost 14 (3) (2) –Profit on disposal of property, plant and equipment (1) – (1)Loss on disposal of intangible assets − 1 –Equity-settled share-based payments 7 8 14
262 231 305Decrease in inventories 1 – 1Decrease in trade and other receivables 38 106 66Decrease in trade and other payables and provisions (81) (137) (80)
Cash generated from operations 220 200 292Tax paid (79) (54) (52)
Net cash flow from operating activities 141 146 240
Cash flow from investing activitiesAcquisition of businesses (net of cash acquired) 24 (5) (781) (20)Investment in joint ventures (1) (1) (7)Purchase of property, plant and equipment (15) (14) (10)Purchase of intangible assets (23) (17) (13)Movements in bank deposits (more than three months) (2) (3) (1)Disposal of businesses (net of cash disposed of) (2) (2) (4)Disposal of joint ventures 11 (21) –Disposal of property, plant and equipment 2 – 1Interest received 3 4 9Dividends received from joint ventures 13 42 14 8Amounts received/(paid) on maturity of net investment hedges 37 (7) (3)
Net cash flow from investing activities 47 (828) (40)
Net cash flow before financing activities 188 (682) 200
Cash flow from financing activitiesProceeds from other borrowings 68 1,198 100Repayments of other borrowings (143) (100) (130)Cash flows in respect of facility arrangement fees (3) (13) –Interest paid (38) (7) (11)Dividends paid (167) (124) (108)Acquisition of non-controlling interest 24 (54) − −Cash received in respect of debt related cash flow hedges 23 12 − −Dividends paid to non-controlling interests (4) − −Acquisition of shares for cancellation − – (45)Cash flows in respect of treasury shares* 15 6 7Acquisition of shares by trustees of the Employee Share Trust (5) – (2)
Net cash flow from financing activities (319) 960 (189)
(Decrease)/increase in cash and cash equivalents (131) 278 11Cash and cash equivalents as at the beginning of the year 23 495 223 232Exchange losses on cash and cash equivalents 23 (24) (6) (20)
Cash and cash equivalents as at the end of the year 23 340 495 223
Consolidated cash flow statementFor the year ended 31 December 2015

103Amec Foster Wheeler Annual report and accounts 2015
Fina
ncia
lsG
over
nanc
eS
trat
egic
rep
ort
Ad
dit
iona
l inf
orm
atio
n
Note2015
£m2014
£m2013
£m
Cash and cash equivalents consist of:Cash at bank and in hand 23 307 377 153Bank deposits (less than three months) 23 33 118 79Bank overdrafts 23 − – (9)
Cash and cash equivalents as at the end of the year 23 340 495 223Bank deposits (more than three months) 23 23 21 18Bank loans 23 (1,264) (1,267) (120)Fees capitalised against bank facilities 23 − 9 –Derivatives classified as net debt 23 14 − −Finance leases 23 (59) (61) –
Net (debt)/cash as at the end of the year (946) (803) 121
*Cash received from SAYE option holders on exercise of options.
Consolidated cash flow statement continuedFor the year ended 31 December 2015

104 Amec Foster Wheeler Annual report and accounts 2015
1 Significant accounting policiesAmec Foster Wheeler plc is a public limited company, which is listed on both the London Stock Exchange and the New York Stock Exchange and incorporated and domiciled in the United Kingdom. The principal activities of the Company and its subsidiaries (the Group) are described in note 2.
Statement of complianceThe consolidated accounts include the accounts of Amec Foster Wheeler plc and all of its subsidiaries made up to 31 December each year, and the Group’s share of the profit after interest and tax and net assets of joint ventures based on the equity method of accounting.
In accordance with EU law (IAS Regulation EC 1606/2002), the consolidated accounts of the Group have been prepared in accordance with International Financial Reporting Standards (IFRS) adopted for use in the EU as at 31 December 2015 (adopted IFRS), International Financial Reporting Interpretations Committee (IFRIC) interpretations and those parts of the Companies Act 2006 applicable to companies reporting under IFRS. The company has elected to prepare its parent company accounts in accordance with Financial Reporting Standard 101 Reduced Disclosure Framework (FRS 101); these are presented on pages 157 to 165.
From the Group’s perspective, there are no applicable differences between adopted IFRS and IFRS as issued by the IASB, and therefore the financial statements also comply with IFRS as issued by the IASB.
RestatementOn 13 November 2014 (the acquisition date), the Group acquired 95.3 per cent of the issued share capital of Foster Wheeler AG. Due to the relatively short period of time between the acquisition date and 31 December 2014, management had not finalised its assessment of the fair values of certain of Foster Wheeler’s assets and liabilities at the time that the 2014 financial statements were completed and as a result the 2014 financial statements reflected the provisional assessment of the fair values as at the acquisition date. The restatement had no impact on the 2014 income statement.
During 2015, management has completed the fair value assessment and the comparative amounts shown in the Balance Sheet, Statement of Comprehensive Income, Statement of Changes in Equity and Cash Flow Statement have been restated to reflect changes made to the carrying amounts of assets and liabilities recognised on the acquisition of Foster Wheeler, details of which are set out in note 24.
In addition to the above, the acquisition balance sheet as presented on page 151 has been restated to present liabilities of £65m in respect of onerous leases within trade and other payables. These liabilities had previously been presented within provisions.
As the acquisition of Foster Wheeler AG in November 2014 resulted in the Group securing more than 90% of Foster Wheeler’s issued share capital, the acquisition qualifies for merger relief under section 612 of the Companies Act 2006 from crediting the share premium that arose on the new shares issued in consideration for Foster Wheeler to a share premium account. The balance sheet as at 31 December has been restated to present excess of the nominal value of the shares issued of £877m as a merger reserve.
Accounting standards adopted in the yearThere are no IFRS, IAS amendments or IFRIC interpretations effective for the first time this financial year that have had a material impact on the Group.
New standards, amendments and interpretations issued but not effective which have not been early adopted by the GroupIFRS 9 ‘Financial Instruments’ replaces the existing guidance in IAS 39 ‘Financial Instruments: Recognition and Measurement’. IFRS 9 includes revised guidance on the classification and measurement of financial instruments, including the new expected credit loss model for calculating impairment on financial assets and the new general hedge accounting requirements. It also carries forward guidance on recognition and derecognition on financial instruments from IAS 39. IFRS 9 is effective for annual periods beginning on or after 1 January 2018 with early application permitted.
IFRS 15 ‘Revenue from Contracts with Customers’ will supersede the current revenue recognition guidance including IAS 18 ‘Revenue’, IAS 11 ‘Construction Contracts’ and the related Interpretations when it becomes effective. Under IFRS 15 an entity recognises revenue when (or as) a performance obligation is satisfied. That is when the control of goods or services underlying the particular performance obligation is transferred to the customer. The standard provides far more prescriptive guidance with regards to specific scenarios and requires extensive disclosures. IFRS 15 is effective for annual periods beginning on or after 1 January 2018 with early application permitted.
IFRS 16 ‘Leases’ replaces the existing guidance in IAS 17 ‘Leases’. IFRS 16 eliminates the classification of leases as either operating leases or finance leases. The standard introduces a single lessee accounting model, which requires a lessee to recognise: assets and liabilities for all leases with a term of more than 12 months and depreciation of lease assets separately from interest on lease liabilities in the income statement.
The application of IFRS 9, IFRS 15 and IFRS 16 in the future may have a material impact on the amounts reported and disclosures made in the Group’s accounts. However it is not practical to provide a reasonable estimate of the effect of IFRS 9, IFRS 15 and IFRS 16 until the Group performs a detailed review.
Other than as described above, there are no other IFRS, IAS amendments or IFRIC interpretations which are not yet effective that would be expected to have a material impact on the Group.
Notes to the consolidated accounts

105Amec Foster Wheeler Annual report and accounts 2015
Fina
ncia
lsG
over
nanc
eS
trat
egic
rep
ort
Ad
dit
iona
l inf
orm
atio
n
1 Significant accounting policies continued
Basis of preparationThe accounts are presented in Sterling, rounded to the nearest million. All calculated numbers, for example earnings per share, are calculated on the underlying numbers to one decimal place precision. They are prepared on the historical cost basis except that derivative financial instruments and retirement benefit assets and liabilities are stated at fair value.
The preparation of accounts in accordance with generally accepted accounting principles requires management to make judgements, estimates and assumptions that affect the application of policies and reported amounts of assets and liabilities, income and expenses. The estimates and associated assumptions are based on historical experience and various other factors that are believed to be reasonable under the circumstances, the results of which form the basis of making the judgements about carrying values of assets and liabilities that are not readily apparent from other sources. Actual results may differ from these estimates.
The estimates and underlying assumptions are reviewed on an ongoing basis. Revisions to accounting estimates are recognised in the period in which the estimate is revised if the revision affects only that period, or in the period of the revision and future periods if the revision affects both current and future periods.
Amec Foster Wheeler believe some of these policies require a high level of judgement, and the most critical accounting policies and significant areas of judgement and estimation arise from:
Xacquisition accounting under IFRS 3 ’Business Combinations’
X long-term contracts under IAS 11 ‘Construction Contracts’
X intangible assets including goodwill under IAS 38 ‘Intangible Assets’ and IAS 36 ‘Impairment of Assets’
Xprovisions under IAS 37 ‘Provisions, Contingent Liabilities and Contingent Assets’
Xuncertain tax positions under IAS 12 ‘Income Taxes’
Xdefined benefit pension schemes under IAS 19 (revised) ‘Employee Benefits’
In addition, judgement has also been applied in the presentation of certain research and development government credits and in presenting the UK conventional power business as a discontinued operation in 2013.
IFRS 3 ‘Business Combinations’During 2014, the Group acquired Foster Wheeler. The acquisition was accounted for as a purchase under IFRS 3. Determining the fair value of the assets and liabilities acquired involved significant judgement and estimates. This involved the use of valuation models to determine the fair value of the intangible assets acquired. Inputs to these models include estimates of the future cash flows of Foster Wheeler; the appropriate discount rate to apply to these future cash flows, estimates of the retention rates for key customers and the likelihood of renewal of significant service contracts. Further information about the assumptions used for calculating provisions and goodwill are documented below.
IAS 11 ‘Construction Contracts’A significant amount of the Group’s activities is undertaken via long-term contracts. These contracts are accounted for in accordance with IAS 11 ‘Construction Contracts’ which requires estimates to be made for contract costs and revenues.
Management bases its judgements of contract costs and revenues on the latest available information, which includes detailed contract valuations. In many cases the results reflect the expected outcome of long-term contractual obligations which span more than one reporting period. Contract costs and revenues are affected by a variety of uncertainties that depend on the outcome of future events and often need to be revised as events unfold and uncertainties are resolved. The estimates of contract costs and revenues are updated regularly and significant changes are highlighted through established internal review procedures. In particular, the internal reviews focus on the timing and recognition of incentive payments and the age and recoverability of any unagreed income from variations to the contract scope or claims. The impact of the changes in accounting estimates is then reflected in the ongoing results.
Principally, there are two types of long-term contracts being cost reimbursable contracts and fixed price contracts. Due to the nature of these contracts the significant estimates tend to arise on fixed price contracts rather than cost reimbursable contracts.

106 Amec Foster Wheeler Annual report and accounts 2015
1 Significant accounting policies continued
Basis of preparation continuedIAS 38 ‘Intangible Assets’ and IAS 36 ‘Impairment of Assets’The Group has a significant amount of intangible assets on its balance sheet. Goodwill arising on acquisitions represents the excess of the fair value of the purchase consideration over the fair value of the assets and liabilities acquired. Goodwill is capitalised and subject to impairment review, both annually and when there are indications that its carrying value may not be recoverable. An impairment loss is recognised to the extent that the carrying value of an asset exceeds its recoverable amount.
The determination of carrying value involves significant judgements when allocating goodwill to the cash generating units (‘CGUs’) expected to benefit from the acquisition. The estimation of the recoverable amounts also requires significant judgements and estimates including the future cash flows of the CGU, terminal growth rates and the appropriate rate at which to discount those cash flows. See note 12 for further details of the impairment reviews performed during the year. The carrying amount of the Global Power Group CGU has been reduced to its recoverable amount through recognition of an impairment loss of £308m against goodwill.
Intangible assets, other than goodwill, are stated at cost less accumulated amortisation and impairment losses. The cost of an intangible asset acquired in a business combination is the fair value of the asset at the date of acquisition. Amortisation is charged to the income statement over the estimated useful lives of intangible assets.
IAS 37 ‘Provisions, Contingent Liabilities and Contingent Assets’When accounting for provisions for litigation and other items the Group has taken internal and external advice in considering known legal claims and actions made by or against the Group. It carefully assesses the likelihood of success of a claim or action. Appropriate provisions are made for legal claims or actions against the Group on the basis of likely outcome, but no provisions are made for those which, in the view of management, are unlikely to succeed.
The Group has a significant asbestos related provision. Some of the Group’s US and UK subsidiaries are defendants in numerous asbestos-related lawsuits and out-of-court informal claims pending in the US and UK. Plaintiffs claim damages for personal injury alleged to have arisen from exposure to or use of asbestos in connection with work allegedly performed by the Group’s subsidiaries during the 1970s and earlier.
The provision for asbestos is the Group’s best estimate of its obligation required to settle claims that is expected to continue up until 2050. The provision is discounted back to a net present value using a US Treasury yield curve discount rate.
See note 21 for further details of the Group’s provisions.
IAS 12 ‘Income Taxes’Significant judgement is required in determining liabilities related to uncertain tax positions, in particular those in respect of financing structures. There is also significant judgement required in assessing the recoverability of deferred tax assets.
IAS 19 (revised) ‘Employee Benefits’Defined benefit pension schemes are accounted for in accordance with the advice of independent qualified actuaries but significant judgements are required in relation to the assumptions for future salary and pension increases, discount rate, inflation and member life expectancy that underpin their valuations. For Amec Foster Wheeler, these assumptions are important given the relative size of the schemes that remain open for future accrual.
See note 14 for further details of the Group’s retirement benefit schemes.
IFRS 5 ‘Non-current Assets Held for Sale and Discontinued Operations’In accordance with IFRS 5 ‘Non-current Assets Held for Sale and Discontinued Operations’, the post-tax results of discontinued operations are disclosed separately in the consolidated income statement.
Discontinued operations include the non-core Built Environment businesses, which were sold during 2007, SPIE, which was sold in 2006, and the UK conventional power business that was discontinued in 2013. The judgements applied in presenting the UK conventional power business as discontinued are explained in note 1 to the 2013 financial statements. The cash flows of discontinued operations are fully consolidated within Amec Foster Wheeler up to the date of sale. The results and other disclosures in respect of discontinued operations are shown in note 9.
Going concernAs at 31 December 2015, the group had net debt of £946m and committed and available banking facilities of £442m.
On 2 March 2016 the Group announced the completion of a refinancing of its main debt facilities by entering into a new facility with a syndicate of 20 banks. The new facility, which has three tranches – a three-year £650 million term loan, a five-year £650 million term loan and a five-year £400 million revolving credit facility – replaces the Company’s existing revolving credit facility and the Foster Wheeler acquisition facility.
The Group has assessed it will be able to meet expected mandatory interest and repayment of its banking facilities in place.
Notes to the consolidated accounts continued

107Amec Foster Wheeler Annual report and accounts 2015
Fina
ncia
lsG
over
nanc
eS
trat
egic
rep
ort
Ad
dit
iona
l inf
orm
atio
n
1 Significant accounting policies continued
Going concern continuedThe Group will finance operations and growth from its existing cash resources and its committed banking facilities. The Group’s policy aims to ensure the constant availability of an appropriate amount of funding to meet both current and future forecast requirements consistent with the Group’s budget and strategic plans.
The directors consider it appropriate to adopt the going concern basis of accounting in preparing the financial statements.
If for any reason the Group is unable to continue as a going concern, it could impact the Group’s ability to realise assets at their recognised values; in particular goodwill and other intangible assets and to extinguish liabilities in the normal course of business at the amounts stated in the consolidated accounts.
Accounting policiesThe accounting policies set out below have, unless otherwise stated, been applied consistently to all periods presented in these consolidated accounts.
Basis of consolidationThe consolidated accounts comprise the accounts of the Group and its subsidiaries as at 31 December 2015. Control is achieved when the Group is exposed, or has rights, to variable returns from its involvement with the investee and has the ability to affect those returns through its power over the investee. Generally there is a presumption that a majority of voting rights result in control.
The Group re-assesses whether or not it controls an investee if facts and circumstances indicate there is a change of control. Consolidation of a subsidiary begins when the Group obtains control over the subsidiary and ceases when the Group loses control of the subsidiary. Assets, liabilities, income and expenses of a subsidiary acquired or disposed of during the year are included in the consolidated accounts from the date the Group gains control until the date the Group ceases to control the subsidiary.
Profit or loss and each component of comprehensive income is attributed to the equity holders of the parent of the Group and to the non-controlling interests, even if this results in the non-controlling interests having a deficit balance. When necessary, adjustments are made to the financial statements of subsidiaries to bring their accounting policies into line with the Group’s accounting policies. All intra-Group assets and liabilities, equity, income, expenses and cash flows relating to transactions between members of the Group are eliminated in full on consolidation.
A change in the ownership interest of a subsidiary, without a loss of control, is accounted for as an equity transaction.
If the Group loses control over a subsidiary, it derecognises the related assets (including goodwill), liabilities, non-controlling interest and other components of equity while any resultant gain or loss is recognised in profit or loss. Any investment retained is recognised at fair value.
A joint venture is a type of joint arrangement whereby the parties that have joint control of the arrangement have rights to the net assets of the joint venture. Joint control is the contractually agreed sharing of control of an arrangement, which exists only when decisions about the relevant activities require unanimous consent of the parties sharing control.
The considerations made in determining joint control are similar to those necessary to determine control over subsidiaries.
The Group’s investments in its joint ventures are accounted for using the equity method. Under the equity method, the investment in a joint venture is initially recognised at cost. The carrying amount of the investment is adjusted to recognise changes in the Group’s share of net assets of the joint venture since the acquisition date. The results of the joint ventures are included in the consolidated accounts from the date the joint control commences until the date that it ceases.
The aggregate of the Group’s share of profit or loss of a joint venture is shown on the face of the income statement and represents profit or loss after tax and non-controlling interests in the joint venture.
Losses of a joint venture are recognised only to the extent of the Group’s interest in the joint venture, unless the Group has incurred legal or constructive obligations or made payments on behalf of the joint venture.
A joint operation is a joint arrangement whereby the parties that have joint control of the arrangement have rights to the assets, and obligations for the liabilities, relating to the arrangement.
When a Group entity undertakes its activities under joint operations, the Group as a joint operator recognises in relation to its interest in a joint operation:
X its assets and liabilities, including its share of any assets and liabilities held jointly
X its revenue from the sale of its share of the output arising from the joint operation
X its share of the revenue from the sale of the output by joint operation
X its expenses, including its share of any expenses incurred jointly
108 Amec Foster Wheeler Annual report and accounts 2015
1 Significant accounting policies continued
Bid costsBid costs are expensed as incurred until the Group is appointed as the preferred bidder. Subsequent to appointment as preferred bidder, bid costs are capitalised and held on the balance sheet provided the award of the contract is virtually certain and it is expected to generate sufficient net cash flow to allow recovery of the bid costs. Where bid costs are reimbursed at financial close, the proceeds are applied first against the balance of costs included in the balance sheet, with any additional amounts treated as deferred income and released to profit over the period of the contract.
Business combinations and goodwillThe purchase method is used to account for all business combinations.
Goodwill represents the excess of the fair value of the purchase consideration over the fair value of the assets, liabilities and contingent liabilities acquired.
Goodwill arising on acquisitions since 1 January 2004 is capitalised and subject to an impairment review, both annually and when there are indications that its carrying value may not be recoverable. Goodwill is not amortised.
Cash and cash equivalents and short-term investmentsCash comprises cash balances and deposits repayable on demand and available within one working day without penalty.
Cash equivalents are other deposits with a maturity period of three months or less from date of acquisition; convertible without an undue period of notice and not subject to a significant risk of changes in value.
Bank overdrafts that are repayable on demand and form an integral part of Amec Foster Wheeler’s cash management are included as a component of cash and cash equivalents for the purpose of the statement of cash flows.
In the consolidated balance sheet, bank overdrafts are shown within borrowings in current liabilities.
Deposits with a maturity period of more than three months at inception are classified as bank deposits (more than three months).
Development expenditureExpenditure that is directly attributable to the development of wind farm projects is recognised as an intangible asset when the Group can demonstrate it is probable that the wind farm development will generate future economic benefits in excess of the amounts capitalised and other relevant criteria for capitalising such costs in accordance with IAS 38 ‘Intangible Assets’ have been met.
Following initial recognition of the development expenditure as an asset, the asset is carried at cost less any accumulated amortisation and accumulated impairment losses. Amortisation of the asset begins when the wind farm development is complete and the asset is available for use. It is amortised over the period of expected future benefit. During the period of development, the asset is reviewed for impairment annually.
Discontinued operations and assets and liabilities held for saleA discontinued operation is a separate major line of business or geographic area of operations that has either been disposed of, abandoned or is part of a plan to dispose of a major line of business or geographic area. An operation is classified as a discontinued operation in the year that the above criteria are met.
Certain legacy settlements and relevant provision adjustments are allocated to discontinued operations when those settlements and provisions arise from or are directly related to the discontinued operations.
Dividend incomeDividend income is recognised when the right to receive payment is established.
Employee benefitsDefined contribution plansObligations for contributions to defined contribution pension plans are recognised in the income statement as incurred.
Defined benefit plansThe Group’s net obligation in respect of defined benefit pension plans is calculated separately for each plan by estimating the amount of future benefit that employees have earned in return for their service in the current and prior periods. That benefit is discounted to determine its present value; and the fair value of any plan assets (at bid price) is deducted. The liability discount rate is the yield at the balance sheet date on AA-rated corporate bonds that have maturity dates approximating to the terms of the Group’s obligations. The calculation is performed by a qualified actuary using the projected unit credit method.
A net surplus from a defined benefit plan is recognised on the balance sheet when the asset would be recoverable as a result of an expected future refund after a gradual settlement of plan liabilities.
Net interest is calculated by applying the discount rate to the net defined benefit liability or asset.
Actuarial gains and losses are recognised in other comprehensive income in the year in which they arise.
Notes to the consolidated accounts continued

109Amec Foster Wheeler Annual report and accounts 2015
Fina
ncia
lsG
over
nanc
eS
trat
egic
rep
ort
Ad
dit
iona
l inf
orm
atio
n
1 Significant accounting policies continued
Exceptional itemsAs permitted by IAS 1 ‘Presentation of Financial Statements’, certain items are presented separately as exceptional on the face of the consolidated income statement. In the opinion of the directors, these exceptional items require separate disclosure by virtue of their nature, size or incidence in order to obtain a clear and consistent presentation of the Group’s underlying performance and to provide consistency with internal management reporting. Exceptional items may include, but are not restricted to: impairment charges, acquisition-related costs; restructuring costs; gains and losses on the disposal of fixed assets; and gains and losses on the disposal or closure of businesses. Acquisition-related costs may include transaction costs (including external advisory, legal, valuation and other professional fees and attributable internal costs), the amortisation of acquisition-related facility fees, payments to selling shareholders that are accounted for as remuneration and changes in the fair value of contingent consideration.
Financial instrumentsFinancial instruments are initially recorded at fair value. Subsequent valuation depends on the designation of the instrument.
Cash, bank deposits, borrowings and trade receivables and payables are held at amortised cost.
Bank loans and similar borrowings are recognised initially at fair value (i.e. proceeds received) net of directly attributable transaction fees. Interest expense, including transaction fees is recognised over the life of the bank loan using the effective interest method.
Derivative financial instruments are recognised initially and subsequently at fair value. The gain or loss on re-measurement to fair value is recognised immediately in the income statement. However, where derivatives qualify for hedge accounting, recognition of any resultant gain or loss depends on the nature of the item being hedged. The fair value of derivative financial instruments is determined by reference to market values for similar financial instruments or by discounting the expected future cash flows at prevailing interest rates.
The sale and purchase of derivative financial instruments are non-speculative.
Cash flow hedgesWhere a derivative financial instrument is designated as a hedge against the variability in cash flows of a recognised asset or liability, or a highly probable forecast transaction, any gain or loss on the effective part of the derivative financial instrument is recognised in other comprehensive income and accumulated within the hedging reserve. The gain or loss on any ineffective portion of the hedge is recognised immediately in the income statement.
Hedge accounting is discontinued when the hedging instrument no longer meets the criteria for hedge accounting, expires, or is sold, terminated or exercised. The cumulative gain or loss previously recognised in the hedging reserve remains there until the forecast transaction occurs. The cumulative gain or loss in the hedging reserve is transferred to the income statement in the same period that the hedged item affects profit or loss.
Net investment hedgesForeign currency differences arising on the retranslation of financial instruments designated as a hedge of a net investment in a foreign operation are recognised in other comprehensive income, to the extent that the hedge is effective. The gain or loss of any ineffective portion of the hedge is recognised immediately in the income statement. On disposal of the foreign operation, the cumulative value of gains and losses recorded in equity is transferred to the income statement.
Foreign currenciesThe Group’s consolidated accounts are presented in Sterling, which is also the parent company’s functional currency. Each entity in the Group determines its own functional currency and items included in the accounts of each entity are measured using that functional currency. An entity’s functional currency reflects the underlying transactions, events and conditions that are relevant to it.
At an individual entity level, transactions in a currency other than the functional currency of the entity are translated to the functional currency at the exchange rate ruling at the day of the transaction. Entities which have multiple foreign currency transactions apply the average rate for the month as an approximation of the exchange rate on the day of the transaction. Monetary assets and liabilities denominated in foreign currencies are translated into the functional currency at the rates of exchange ruling at the balance sheet date and any foreign exchange differences arising are recognised in the income statement except those arising on intra-Group balances, settlement of which is neither planned nor probable to occur, which are recognised in other comprehensive income. Non-monetary assets and liabilities are measured in terms of historical cost and are translated using the exchange rate at the date of the transaction.
On consolidation, the results of entities with a functional currency other than Sterling are translated into Sterling using a monthly average exchange rate. The net assets of such entities are translated into Sterling at the closing exchange rate.
Exchange differences arising on the translation of foreign currency net investments and any foreign currency borrowings, or forward contracts used to hedge those investments, are taken to a translation reserve. They are recycled and recognised as a profit or loss on the disposal or closure of a business. The cumulative translation difference for all foreign operations was deemed to be zero as at 1 January 2004, the date of transition to adopted IFRS.

110 Amec Foster Wheeler Annual report and accounts 2015
1 Significant accounting policies continued
ImpairmentThe carrying values of all of the Group’s assets other than inventories, balances on long-term contracts and deferred tax assets are reviewed at each balance sheet date to determine whether there is any indication of impairment. If there are indications of an impairment in the carrying value then the recoverable amount is estimated and compared to the carrying amount.
For goodwill and assets not yet available for use, the recoverable amount is estimated at each balance sheet date. An impairment loss is recognised to the extent that the carrying value of an asset exceeds its recoverable amount.
Intangible assets other than goodwillIntangible assets acquired by the Group, which include customer relationships, brands/trademarks, order backlog, patents and software, are stated at cost less accumulated amortisation and impairment losses. The cost of an intangible asset acquired in a business combination is its fair value at date of acquisition.
Amortisation is charged to the income statement on a straight line basis over the estimated useful lives of intangible assets, from the date they are available for use.
The estimated lives of intangible assets held at 31 December 2015 are as follows:
Customer relationships Two to 18 years
Brand/trademarks Up to 20 years
Order backlog Three to five years
Patents 15 years
Software Three to seven years
Other Up to six years
InventoriesInventories, including land held for and in the course of development, are stated at the lower of cost and net realisable value.
Development land and work in progress is included at cost less any losses foreseen in completing and disposing of the development. Cost includes cost of acquisition and development to date, including directly attributable fees and expenses net of rental and other income attributable to the development.
Leases The determination of whether an arrangement is (or contains) a lease is based on the substance of the arrangement at the inception of the lease. The arrangement is, or contains, a lease if fulfilment of the arrangement is dependent on the use of a specific asset or assets and the arrangement conveys a right to use the asset or assets, even if that right is not explicitly specified in an arrangement.
A lease is classified at the inception date as a finance lease or an operating lease. A lease that transfers substantially all the risks and rewards incidental to ownership to the Group is classified as a finance lease.
Finance leases are capitalised at the commencement of the lease at the inception date fair value of the leased property or, if lower, at the present value of the minimum lease payments. Lease payments are apportioned between finance charges and reduction of the lease liability so as to achieve a constant rate of interest on the remaining balance of the liability. Finance charges are recognised in finance costs in the income statement.
A leased asset is depreciated over the useful life of the asset. However, if there is no reasonable certainty that the Group will obtain ownership by the end of the lease term, the asset is depreciated over the shorter of the estimated useful life of the asset and the lease term.
Operating lease costs, including incentives received, are charged to the income statement on a straight line basis over the period of the lease.
Net financing expenseNet financing expense comprises interest receivable on funds invested, interest payable, pension financing income, the unwinding of discounted balances and foreign exchange gains and losses. Interest income and interest payable are recognised in the income statement as they accrue, using the effective interest method.
Directly attributable finance costs are capitalised in the cost of purchased and constructed property, plant and equipment, until the relevant assets are brought into operational use.
Notes to the consolidated accounts continued

111Amec Foster Wheeler Annual report and accounts 2015
Fina
ncia
lsG
over
nanc
eS
trat
egic
rep
ort
Ad
dit
iona
l inf
orm
atio
n
1 Significant accounting policies continued
Property, plant and equipmentProperty, plant and equipment is measured at cost less accumulated depreciation and impairment losses. The cost of property, plant and equipment as at 1 January 2004, the date of transition to adopted IFRS, was determined by reference to its fair value at that date.
Depreciation is provided on all property, plant and equipment, with the exception of freehold land, at rates calculated to write off the cost, less estimated residual value, of each asset on a straight line basis over its estimated useful life. Reviews are made annually of the estimated remaining lives and residual values of individual assets.
The estimated lives used are:
Freehold buildings Up to 50 years
Leasehold land and buildings The shorter of the lease term or 50 years
Plant and equipment Mainly three to five years
Provisions for liabilities and chargesProvisions are recognised when the Group has a present obligation (legal or constructive) as a result of a past event; it is probable that an outflow of resources embodying economic benefits will be required to settle the obligation; and a reliable estimate can be made of the amount of the obligation.
The Group has taken internal and external advice in considering known and reasonably likely legal claims and actions made by or against the Group. It carefully assesses the likelihood of success of a claim or action. Appropriate provisions are made for legal claims or actions against the Group on the basis of likely outcome, but no provisions are made for those which, in the view of management, are unlikely to succeed. These possible but not probable liabilities are disclosed in note 26 as contingent liabilities.
Research and development government creditsThe Group claims research and development government credits in the UK, US and Canada. These are judged to have characteristics more akin to grants than income taxes and are offset against the relevant expenditure caption. Credits are recognised to the extent there is reasonable assurance they will be received which, given the necessary claims processes, can be some time after the original expense is incurred.
Revenue recognition and long term contractsRevenue represents the amount received or receivable for goods and services supplied by the Group to its customers, including the Group’s share of revenue from work carried out by jointly controlled operations. Revenue excludes intra-Group sales and value added tax and other sales taxes.
The Group’s revenue is derived principally from service and construction-type contracts. Contract revenue is recognised over the term of the contract by reference to the stage of completion of the contract activity at the end of each reporting period.
Revenue from cost reimbursable contracts is based on the services provided, typically represented by man-hours worked, and is measured by reference to agreed charge-out rates or to the estimated total contract revenue. Flow-through costs on cost reimbursable contracts, typically consisting of materials, equipment or subcontractor services, are included as both contract revenue and contract costs.
Revenue from fixed price contracts is recognised using the percentage-of-completion method, measured by reference to physical completion or the ratio of costs incurred to total estimated contract costs. If the outcome of a contract cannot be estimated reliably, as may be the case in the initial stages of completion of the contract, revenue is recognised only to the extent of the costs incurred that are expected to be recoverable. If a contract is expected to be loss-making, the expected amount of the loss is recognised immediately in the income statement.
A variation is an instruction by the customer for a change in the scope of the work to be performed under the contract. Variations are included in contract revenue when it is probable that the customer will approve the variation and the related adjustment to the contract price can be measured reliably.
A claim is an amount that the contractor seeks to collect from the customer as reimbursement for costs whose inclusion in the contract price is disputed, and may arise from, for example, delays caused by the customer, errors in specification or design and disputed variations in contract work. Claims are included in contract revenue when negotiations with the customer have reached an advanced stage such that it is probable that the customer will accept the claim and the amount of the claim can be measured reliably.

112 Amec Foster Wheeler Annual report and accounts 2015
1 Significant accounting policies continued
Revenue recognition and long term contracts continuedIncentive payments are additional amounts payable to the contractor if specified performance standards are met or exceeded. Incentive payments are recognised when the contract is sufficiently far advanced that it is probable that the required performance standards will be met and the amount of the payment can be measured reliably.
Gross amounts due from customers included in trade and other receivables represent the costs incurred plus recognised profits, less provision for recognised losses and progress billings. Progress billings that have not been settled by customers (including retentions related to contracts in progress) are included in trade receivables where they are stated after allowance for any doubtful debts.
Trade receivables, which are generally of a short term nature, are recognised and carried at the original invoiced amount less an allowance for estimated irrecoverable amounts. Provision is made when there is objective evidence that the Group will not be able to recover balances in full. Balances are written off when the probability of recovery is assessed as being remote.
Gross amounts due to customers included in trade and other payables represent payments on account received from customers in excess of the gross amounts due from customers and advances. Advances are amounts received by the customer before the related work is performed.
Share-based paymentsThere are various share-based payment arrangements which allow Amec Foster Wheeler employees to acquire Amec Foster Wheeler shares; these awards are granted by Amec Foster Wheeler. The fair value of awards granted is recognised as a cost of employment with a corresponding increase in equity. The fair value is measured at grant date and spread over the period during which the employees become unconditionally entitled to the award. The fair value of the award is measured using a valuation model, taking into account the terms and conditions upon which the awards were granted. The amount recognised as an expense is adjusted to reflect the actual number of shares that vest except where non-vesting is due to total shareholder return not achieving the threshold for vesting.
TaxationIncome tax expense comprises the sum of the current tax charge and the movement in deferred tax.
Current tax payable or recoverable is based on taxable profit for the year using tax rates and laws that have been enacted or substantively enacted by the balance sheet date, and any adjustment to tax payable in respect of previous years. Taxable profit is different from accounting profit due to temporary differences between accounting and tax treatments, and due to items that are never taxable or deductible.
Tax is recognised in the income statement except to the extent that it relates to items recognised in other comprehensive income or equity, in which case it is recognised in other comprehensive income or equity as appropriate.
A current tax provision is recognised when the Group has a present obligation as a result of a past event, it is probable that the Group will be required to settle that obligation and a reliable estimate can be made of the amount of the obligation. The provision is the best estimate of the consideration required to settle the present obligation at the balance sheet date, taking into account risks and uncertainties surrounding the obligation. Separate provisions for interest and penalties are also recorded if appropriate. Movements in interest and penalty amounts in respect of tax provisions are not included in the tax charge, but are disclosed within profit/(loss) before income tax.
Tax provisions are based on management’s interpretation of country specific tax law and the likelihood of settlement. This involves a significant amount of judgement as tax legislation can be complex and open to different interpretation. Management uses in-house tax experts, professional firms and previous experience when assessing tax risks. Where actual tax liabilities differ from the provisions, adjustments are made which can have a material impact on the Group’s profits for the year.
Deferred tax is provided on temporary differences between the carrying amounts of assets and liabilities in the accounts and the corresponding tax bases used in the computation of taxable profit. Deferred tax liabilities are generally recognised for all taxable temporary differences with deferred tax assets being recognised where it is probable that future taxable profits will be available against which the asset can be utilised. The carrying amount of deferred tax assets is reviewed at each balance sheet date and adjustments made to the extent that it is no longer probable that sufficient profits will be available.
Assets and liabilities are not recognised if the temporary differences arise from the initial recognition (other than in a business combination) of assets and liabilities in a transaction that affects neither accounting nor taxable profit.
Deferred tax liabilities are recognised for taxable temporary differences arising on investments in subsidiaries and joint ventures, except where the Group is able to control the reversal of the temporary difference and it is probable that the temporary difference will not reverse in the foreseeable future.
Deferred tax is calculated using tax rates and laws that have been enacted or substantively enacted to apply when the deferred tax asset is realised or the liability is settled.
Deferred tax assets and liabilities are offset when they relate to income taxes levied by the same taxation authority and it is intended that they will be settled on a net basis.
Notes to the consolidated accounts continued

113Amec Foster Wheeler Annual report and accounts 2015
Fina
ncia
lsG
over
nanc
eS
trat
egic
rep
ort
Ad
dit
iona
l inf
orm
atio
n
2 Segmental analysis of continuing operationsAmec Foster Wheeler designs, delivers and maintains strategic and complex assets for its customers across the global energy and related sectors.
Segment information is presented on a consistent basis with the information presented to the Group Leadership Team for the purposes of allocating resources within the Group and assessing the performance of the Group’s businesses.
Prior to the acquisition of Foster Wheeler in November 2014, the Group’s continuing operations comprised of four operating segments: Americas, Europe, Growth Regions and Investment Services. For the short period between its acquisition and the end of 2014, Foster Wheeler’s results were presented to the Group Leadership Team analysed by its existing operating segments: E&C Services and Global Power Group.
With effect from 1 January 2015, the Group adopted three new geographical operating segments: Americas; Northern Europe & CIS; and Asia, Middle East, Africa & Southern Europe; with Foster Wheeler’s E&C Services segment being merged into these segments. Foster Wheeler’s Global Power Group continues to be reported as a separate operating segment. Investment Services also continues to be reported separately. Details of the services offered by each segment and the end markets in which they operate are given on pages 3 to 5 and 24 to 25.
The Group Leadership Team uses trading profit as the measure of the profitability of the Group’s businesses. Trading profit is, therefore, the measure of the segment profit presented in the Group’s segment disclosures. Trading profit represents profit before net financing expense excluding exceptional items; the amortisation and impairment of intangible assets; and asbestos-related costs (net of insurance recoveries). Trading profit includes the Group’s share of the trading profit of joint ventures.
Revenue and results
Revenue Profit/(loss)
2015 £m
2014 £m
2013 £m
2015 £m
2014 £m
2013 £m
Americas 2,646 2,184 2,247 161 212 241Northern Europe and CIS 1,492 1,293 1,227 134 105 93Asia, Middle East, Africa and Southern Europe 1,050 516 536 68 25 33Global Power Group 364 53 – 51 1 –Investment Services 15 8 6 14 9 11
5,567 4,054 4,016 428 352 378Internal revenue (112) (61) (42) – – –
External revenue 5,455 3,993 3,974 – – –
Corporate costs1 (54) (31) (35)
Trading profit2 374 321 343Net financing expense3 (40) (4) (11)
Adjusted profit before tax 334 317 332Tax on results of joint ventures4 (10) (6) (5)
324 311 327Intangible amortisation and impairment5 (444) (49) (47)Exceptional and asbestos-related items5 (115) (107) (25)
(Loss)/profit before income tax (235) 155 255
1 Corporate costs comprise the costs of operating central corporate functions and certain regional overheads.
2 Trading profit is earnings from continuing operations before net financing expense, tax, intangible amortisation and impairment, pre-tax exceptional items and asbestos related items of £334m (2014: £299m; 2013: £315m), but including joint venture trading profit of £40m (2014: £22m; 2013: £28m).
3 Net financing expense excludes exceptional and asbestos-related items, but includes Amec Foster Wheeler’s share of net interest payable of joint ventures.
4 The share of post-tax results of joint ventures is further analysed as follows:
2015 £m
2014 £m
2013 £m
Trading profit 40 22 28Net financing expense (2) (4) (9)Tax (10) (6) (5)
28 12 14
5 See note 5 for further details.

114 Amec Foster Wheeler Annual report and accounts 2015
2 Segmental analysis of continuing operations continued
Transactions between reportable segments are conducted on an arm’s length basis. Internal revenue arises in the segments as follows:
2015 £m
2014 £m
2013 £m
Americas 12 13 18Northern Europe and CIS 35 23 17Asia, Middle East, Africa and Southern Europe 65 24 7Global Power Group − − −Investment Services − 1 −
112 61 42
Other information
Share of post-tax results of joint ventures DepreciationIntangible amortisation
and impairment
2015 £m
2014 £m
2013 £m
2015 £m
2014 £m
2013 £m
2015 £m
2014 £m
2013 £m
Americas (1) 1 2 9 8 7 46 20 18Northern Europe and CIS 15 8 7 6 5 3 41 19 17Asia, Middle East, Africa and Southern Europe 3 2 2 4 2 2 23 6 12Global Power Group 11 2 − 4 1 − 334 4 −Investment Services − (1) 3 3 – − – − −
28 12 14 26 16 12 444 49 47
Geographical origin
Revenue Non-current assets
2015 £m
2014 £m
2013 £m
2015 £m
2014 (restated)
£m2013
£m
United Kingdom 1,223 1,067 1,112 647 801 326Canada 741 938 1,104 288 297 188United States 1,873 1,218 1,070 1,302 1,175 284Rest of the world 1,618 770 688 1,019 1,442 225
5,455 3,993 3,974 3,256 3,715 1,023
The non-current assets analysed by geography include property, plant and equipment, intangible assets and interests in joint ventures.
Revenue to external customers by region is based on the location of the group subsidiary which made the sale.
Notes to the consolidated accounts continued

115Amec Foster Wheeler Annual report and accounts 2015
Fina
ncia
lsG
over
nanc
eS
trat
egic
rep
ort
Ad
dit
iona
l inf
orm
atio
n
3 Revenue
2015 £m
2014 £m
2013 £m
Construction contracts 1,045 917 342Services 4,410 3,076 3,632
5,455 3,993 3,974
The revenue from construction contracts shown above is based on the definition of construction contracts included in IAS 11 and includes revenue from all contracts directly related to the construction of an asset even if Amec Foster Wheeler‘s role is as a service provider, for example project management.
4 Profit before net financing expense – continuing operations
2015 £m
2014 £m
2013 £m
Depreciation of property, plant and equipment 26 16 12Minimum payments under operating leases 89 87 96Research and development government credits (15) (23) (22)
There are no material receipts from subleases.
2015 £m
2014 £m
2013 £m
Fees paid to the auditor and its associates:The auditing of the accounts 4.1 3.9 0.3The auditing of accounts of any subsidiaries of the company 1.4 1.5 1.1Taxation compliance services 0.9 0.4 0.3All taxation advisory services other than compliance − – 0.1All services relating to corporate finance transactions entered into, or proposed to be entered into, by or on behalf of the company or any of its associates 0.9 6.4 1.6All other non-audit services 0.2 0.1 0.1
7.5 12.3 3.5

116 Amec Foster Wheeler Annual report and accounts 2015
5 Amortisation, impairment, exceptional and asbestos-related items
2015 £m
2014 £m
2013 £m
Continuing operations:
Administrative expenses – exceptional and asbestos-related items (94) (86) (18)Administrative expenses – intangible amortisation and impairment (444) (49) (47)
(538) (135) (65)Loss on business disposals and closures (1) (16) (7)Net financing expense (20) (5) –
(559) (156) (72)
Taxation credit/(charge) on exceptional and asbestos-related items of continuing operations 18 6 (6)Taxation charge on restructuring − – (16)Taxation credit on intangible amortisation and impairment 27 12 20
45 18 (2)
Post-tax amortisation, impairment, exceptional and asbestos-related items of continuing operations (514) (138) (74)Exceptional items of discontinued operations (post–tax) 1 (19) –
Post-tax amortisation, impairment, exceptional and asbestos-related items (513) (157) (74)
Post-tax exceptional and asbestos-related items (96) (120) (47)Post-tax intangible amortisation and impairment (417) (37) (27)
(513) (157) (74)
The charge of £444m in respect of intangible amortisation and impairment comprises amortisation of £129m and impairments of £315m. The goodwill in the Global Power Group business has been written down by £308m and there was a £7m write down on the order backlog intangible asset. See note 12 for further details.
Post-tax exceptional and asbestos-related items for 2015 are further analysed as follows:
2015
Profit on disposals
£m
Loss in respect of
business closures
£m
Profit/(loss) on business
disposals and closures
£m
Asbestos-related items
£m
Other exceptional
items £m
Total £m
Continuing operations − (1) (1) 6 (120) (115)Discontinued operations 1 − 1 − − 1
Profit/(loss) before tax 1 (1) − 6 (120) (114)Taxation on exceptional items – − − − 18 18
Profit/(loss) after tax 1 (1) − 6 (102) (96)
The pre-tax profit on disposal of £1m relates to costs and movements in indemnity provisions associated with businesses sold in prior years and classified as discontinued.
There was a credit of £5m relating to a change in the discount rate applied to the asbestos liability and experiential gains of £9m as the liability is reassessed on an annual basis. These credits were offset by a £7m charge in respect of unwinding the discount and £1m other costs of managing the liability.
Other exceptional items of £120m includes £97m relating to the costs of integrating the Amec and Foster Wheeler businesses, £13m amortisation of fees associated with the borrowings taken on to fund the acquisition, a £5m loss incurred following an unauthorised payment made from the Australian business and not expected to be recovered and other exceptional items totalling £5m.
Integration costs includes severance (£32m), professional and consultancy fees (£11m), costs of rationalisation of agents (£8m), property and office rationalisation (£27m), and staff costs (£11m) as well as IT, rebranding and Sarbanes-Oxley Act implementation costs totalling £8m.
Of the £120m of other exceptional items, £72m was paid in cash during the year.
Notes to the consolidated accounts continued

117Amec Foster Wheeler Annual report and accounts 2015
Fina
ncia
lsG
over
nanc
eS
trat
egic
rep
ort
Ad
dit
iona
l inf
orm
atio
n
5 Amortisation, impairment, exceptional items and asbestos-related items continued
Post-tax exceptional and asbestos-related items for 2014 are further analysed as follows:
2014
Loss on disposals
£m
Profit in respect of
business closures
£m
Loss on business
disposals and closures
£m
Asbestos-related items
£m
Other exceptional
items £m
Total £m
Continuing operations (21) 5 (16) (9) (82) (107)Discontinued operations (23) – (23) – – (23)
(Loss)/profit before tax (44) 5 (39) (9) (82) (130)Taxation on exceptional items 5 – 5 – 5 10
(Loss)/profit after tax (39) 5 (34) (9) (77) (120)
During the year ended 31 December 2014, the Group disposed of its investment in the Lancashire Waste project at a loss of £21m mainly arising from a reverse premium payable on exit. This combined with additional indemnity provisions and costs of £23m associated with businesses sold in prior years (and classified as discontinued) to give a pre-tax loss on disposal of £44m. This includes a provision £11m in respect of a new claim received in the year related to a contract completed by the DPS business which was sold in 2007.
There was a credit of £5m from the release of a provision no longer required in respect of a business closed in a prior year (and classified as continuing).
Other exceptional items of £82m includes transaction costs of £37m relating to the acquisition of Foster Wheeler AG, £35m costs of integrating the two businesses and £4m of fees associated with the borrowings taken on to fund the acquisition. Integration costs include consultancy and other costs of identifying cost synergies of £18m which includes associated internal labour, plus £17m costs of achieving cost synergies (including £14m redundancy costs). In addition £6m was incurred in completing the previously announced restructuring into geographic business units. There was a charge of £8m relating to a change in the discount rate applied to the asbestos liability and £1m in respect of unwinding the discount. Out of the £82m of other exceptional items £58m was paid in cash during the year.
Post-tax exceptional items for 2013 are further analysed as follows:
2013
Loss on disposals
£m
Loss in respect of
business closures
£m
Loss on business
disposals and closures
£m
Other exceptional
items £m
Total £m
Continuing operations – (7) (7) (18) (25)Discontinued operations (6) – (6) – (6)
Loss before tax (6) (7) (13) (18) (31)Taxation charge on restructuring – – – (16) (16)Taxation on exceptional items 6 – 6 (6) –
Loss after tax – (7) (7) (40) (47)
Additional indemnity provisions of £10m and costs in respect of businesses sold in prior years (and classified as discontinued) were offset by the release of a £5m litigation provision and indemnity provisions no longer required, and give a pre-tax exceptional loss on disposals of £6m.
There were additional litigation provisions of £9m offset by releases of £2m in respect of businesses closed in a prior year and classified as continuing.
Exceptional costs of £18m in continuing operations includes £14m restructuring costs associated with the management reorganisation into geographic business units and transaction costs of £4m which, in line with IFRS 3, are charged to the income statement.
A tax provision of £16m has been established for potential withholding tax following a Group restructuring that resulted in a significant amount of cash being repatriated from foreign subsidiaries.

118 Amec Foster Wheeler Annual report and accounts 2015
6 Staff costs and employee numbers – continuing operations
2015 £m
2014 £m
2013 £m
Wages and salaries 1,857 1,466 1,459Social security costs 193 100 98Equity-settled share-based payments (note 22) 7 8 14Contributions to defined contribution schemes 42 37 36Defined benefit pension scheme expense (note 14) 38 31 32
2,137 1,642 1,639
2015 number
2014 number
2013 number
The average number of people employed was as follows:Americas 15,040 12,365 13,046Northern Europe and CIS 9,232 7,898 7,216Asia, Middle East, Africa and Southern Europe 7,086 3,376 3,070Global Power Group 2,332 322 –Investment Services/Centre 323 264 240
34,013 24,225 23,572
The average number of people employed in 2014 includes AMEC staff for the full year and Foster Wheeler staff for the period following the acquisition.
Details of directors’ remuneration are provided in the Directors’ remuneration report on pages 67 to 80.
The average number of employees as stated above excludes agency staff.
7 Net financing expense – continuing operations
2015 £m
2014 £m
2013 £m
Financial incomeInterest income on bank deposits 7 3 7Other interest and similar income 3 5 3Pension financing income − 2 1Foreign exchange gains 6 1 1
16 11 12
Financial expenseInterest payable on bank loans and overdrafts (51) (10) (9)Other interest and similar expense (7) (4) (3)Pension finance expense (2) − –Foreign exchange losses (7) (1) (2)Unwinding of the discount on the asbestos provision (7) (1) –
(74) (16) (14)
Net financing expense (58) (5) (2)
The unwinding of the discount on the asbestos provision of £7m (2014: £1m) has been presented separately in the income statement and the amortisation of facility fees of £13m (2014: £4m) (included within interest payable on bank loans and overdrafts) has been presented as an exceptional item. There were no exceptional items included in net financing expense in the year ended 31 December 2013.
Notes to the consolidated accounts continued

119Amec Foster Wheeler Annual report and accounts 2015
Fina
ncia
lsG
over
nanc
eS
trat
egic
rep
ort
Ad
dit
iona
l inf
orm
atio
n
8 Income tax – continuing operations
Income tax arises in respect of the different categories of income and expenses as follows:
2015 £m
2014 £m
2013 £m
Income tax expense on continuing operations before amortisation, exceptionals and asbestos related items 63 67 67Income tax credit on amortisation (27) (12) (20)Income tax charge on restructuring − – 16Income tax (credit)/charge in respect of other exceptional items (18) (6) 6
Total income tax expense from continuing operations in the income statement 18 49 69
2015 £m
2014 £m
2013 £m
Current taxCurrent year 59 72 95Adjustments in respect of prior years (19) (6) (26)
40 66 69
Deferred taxOrigination and reversal of temporary differences (19) (13) (2)Adjustments in respect of prior years (3) (4) 2
(22) (17) –
Total income tax expense for continuing operations 18 49 69
During the year, effective from 1 April 2015, the standard rate of corporation tax in the UK changed from 21% to 20%. The rate is reduced to 19% with effect from 1 April 2017, with a further reduction to 18% from 1 April 2020. These changes were all substantively enacted prior to the end of the year.
Factors affecting the tax expense for the year are explained as follows:
2015 £m
2014 (restated)
£m
2013(restated)
£m
(Loss)/profit before tax (235) 155 255Less: share of net income from joint ventures (28) (12) (14)
(Loss)/profit before tax from continuing operations (excluding joint ventures) (263) 143 241Expected income tax expense at UK tax rate (53) 31 56Non-deductible expenses – pre-exceptional 7 13 11Non-deductible expenses – exceptional 3 11 −Non-deductible impairments 62 – –Non-taxable income – pre-exceptional (2) – −Benefit from finance structures (12) (6) (7)Closure of HMRC enquiry into intragroup lending (12) − −Impact of providing deferred tax on pension surplus at 20.0% − – (21)Impact of changes in UK tax rate on deferred tax (7) – –Overseas income and expenses taxed at rates other than UK rate 5 8 26Utilisation of tax assets not previously recognised (1) – (6)Recognition of tax assets not previously recognised (3) (8) –Current year tax assets not recognised 15 10 6Write-off of previously recognised tax assets 26 – 28Other adjustments in respect of prior years (10) (10) (24)
Total income tax expense for the year for continuing operations 18 49 69
During the year HMRC’s enquiry into the nature of the intercompany debt payable from the legacy Amec US group to the UK was concluded without tax adjustment. Accordingly, £12m of risk provision was released in full during the year.
Net income tax liabilities in the Group balance sheet include £105m (2014: £126m) relating to uncertain tax positions.
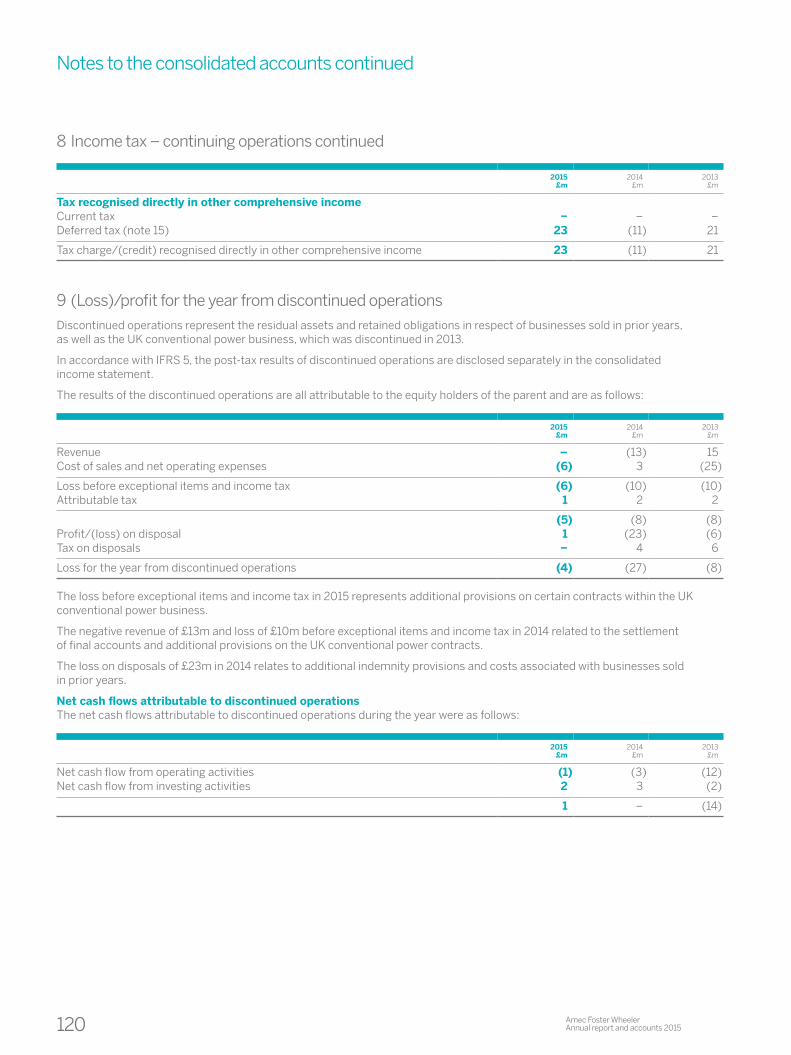
120 Amec Foster Wheeler Annual report and accounts 2015
8 Income tax – continuing operations continued
2015 £m
2014 £m
2013 £m
Tax recognised directly in other comprehensive incomeCurrent tax − – –Deferred tax (note 15) 23 (11) 21
Tax charge/(credit) recognised directly in other comprehensive income 23 (11) 21
9 (Loss)/profit for the year from discontinued operations
Discontinued operations represent the residual assets and retained obligations in respect of businesses sold in prior years, as well as the UK conventional power business, which was discontinued in 2013.
In accordance with IFRS 5, the post-tax results of discontinued operations are disclosed separately in the consolidated income statement.
The results of the discontinued operations are all attributable to the equity holders of the parent and are as follows:
2015 £m
2014 £m
2013 £m
Revenue – (13) 15Cost of sales and net operating expenses (6) 3 (25)
Loss before exceptional items and income tax (6) (10) (10)Attributable tax 1 2 2
(5) (8) (8)Profit/(loss) on disposal 1 (23) (6)Tax on disposals − 4 6
Loss for the year from discontinued operations (4) (27) (8)
The loss before exceptional items and income tax in 2015 represents additional provisions on certain contracts within the UK conventional power business.
The negative revenue of £13m and loss of £10m before exceptional items and income tax in 2014 related to the settlement of final accounts and additional provisions on the UK conventional power contracts.
The loss on disposals of £23m in 2014 relates to additional indemnity provisions and costs associated with businesses sold in prior years.
Net cash flows attributable to discontinued operationsThe net cash flows attributable to discontinued operations during the year were as follows:
2015 £m
2014 £m
2013 £m
Net cash flow from operating activities (1) (3) (12)Net cash flow from investing activities 2 3 (2)
1 – (14)
Notes to the consolidated accounts continued

121Amec Foster Wheeler Annual report and accounts 2015
Fina
ncia
lsG
over
nanc
eS
trat
egic
rep
ort
Ad
dit
iona
l inf
orm
atio
n
10 Earnings per share
Basic and diluted earnings per share are shown on the face of the income statement. The calculation of the average number of shares in issue has been made having deducted the shares held by the trustees of the Employee Share Trust and those held in treasury by the company. As the Group has reported a basic loss per ordinary share from continuing operations, any potential ordinary shares are anti-dilutive and so excluded from the calculation of diluted loss per share.
2015 2014 2013
Loss £m
Weighted average
shares number million
Loss per share
penceEarnings
£m
Weighted average
shares number
million
Earnings per share
penceEarnings
£m
Weighted average
shares number
million
Earnings per share
pence
Basic (loss)/earnings from continuing operations (252) 383 (66.1) 109 302 36.1 187 293 63.8Share options − − − – 2 (0.2) – 2 (0.4)Employee share and incentive schemes − − − – 7 (0.8) – 4 (0.9)
Diluted (loss)/earnings from continuing operations (252) 383 (66.1) 109 311 35.1 187 299 62.5
Basic loss from discontinued operations (4) 383 (1.1) (27) 302 (8.9) (8) 293 (2.7)Share options − − − – 2 0.1 – 2 –Employee share and incentive schemes − − − – 7 0.2 – 4 –
Diluted loss from discontinued operations (4) 383 (1.1) (27) 311 (8.6) (8) 299 (2.7)
Basic and diluted (loss)/profit from continuing operations is calculated as set out below:
2015£m
2014 £m
2013 £m
(Loss)/profit for the year from continuing operations (253) 106 186Loss attributable to non-controlling interests 1 3 1
Basic and diluted (loss)/profit from continuing operations (252) 109 187

122 Amec Foster Wheeler Annual report and accounts 2015
10 Earnings per share continued
In order to appreciate the effects on the reported performance of intangible amortisation and impairment, exceptional and asbestos related items along with the impact of the potential ordinary shares, additional calculations of earnings per share are presented.
2015 2014 2013
(Loss)/earnings
£m
Weighted average
shares number million
Earnings per share
penceEarnings
£m
Weighted average
shares number
million
Earnings per share
penceEarnings
£m
Weighted average
shares number
million
Earnings per share
pence
Basic (loss)/earnings from continuing operations (252) 383 (66.1) 109 302 36.1 187 293 63.8Exceptional and asbestos related items (post-tax) 97 − 25.3 101 – 33.4 47 – 16.0Amortisation and impairment (post-tax) 417 − 108.9 37 – 12.3 27 – 9.2
Basic earnings from continuing operations before impairment, amortisation, exceptional and asbestos related items 262 383 68.1 247 302 81.8 261 293 89.0Share options − − − – 2 (0.5) – 2 (0.6)Employee share and incentive schemes − 2 (0.4) – 7 (1.8) – 4 (1.2)
Diluted earnings from continuing operations before impairment, amortisation and exceptional and asbestos related items 262 385 67.7 247 311 79.5 261 299 87.2
Basic loss from discontinued operations (4) 383 (1.1) (27) 302 (8.9) (8) 293 (2.7)Exceptional items (post-tax) (1) − (0.2) 19 – 6.3 – – –
Basic loss from discontinued operations before exceptional items (5) 383 (1.3) (8) 302 (2.6) (8) 293 (2.7)Share options − − − – 2 – – 2 –Employee share and incentive schemes − 2 − – 7 0.1 – 4 –
Diluted loss from discontinuing operations before exceptional items (5) 385 (1.3) (8) 311 (2.5) (8) 299 (2.7)
Notes to the consolidated accounts continued

123Amec Foster Wheeler Annual report and accounts 2015
Fina
ncia
lsG
over
nanc
eS
trat
egic
rep
ort
Ad
dit
iona
l inf
orm
atio
n
11 Property, plant and equipment
Land and buildings
£m
Plant and equipment
£mTotal
£m
CostAs at 1 January 2015 (restated) 78 172 250Exchange and other movements (3) (4) (7)Reclassifications (2) (5) (7)Additions 4 12 16Disposals (2) (4) (6)
As at 31 December 2015 75 171 246
DepreciationAs at 1 January 2015 24 76 100Exchange and other movements (1) (2) (3)Provided during the year 7 19 26Disposals (1) (3) (4)
As at 31 December 2015 29 90 119
CostAs at 1 January 2014 30 95 125Exchange and other movements 4 (1) 3Acquired through business combinations 39 73 112Additions 6 8 14Disposals (1) (3) (4)
As at 31 December 2014 (restated) 78 172 250
DepreciationAs at 1 January 2014 17 69 86Exchange and other movements 2 – 2Provided during the year 6 10 16Disposals (1) (3) (4)
As at 31 December 2014 24 76 100
Net book valueAs at 31 December 2015 46 81 127
As at 31 December 2014 54 96 150
As at 1 January 2014 13 26 39
31 December 2015
£m
31 December 2014
(restated)£m
The net book value of land and buildings comprised:Freehold 24 29Short leasehold 22 25
46 54
The carrying value of land and buildings held under finance lease at 31 December 2015 was £5m (2014: £6m). The amount acquired through business combinations was £nil (2014: £6m). Additions during the year include £nil (2014: £nil) under finance leases.
The balance as at 1 January 2015 has been restated following the finalisation of the purchase price allocation of the Foster Wheeler acquisition.

124 Amec Foster Wheeler Annual report and accounts 2015
12 Intangible assets
Goodwill £m
Customer relationships
£m
Brands/trademarks
£m
Order backlog
£mPatents
£mSoftware
£mTotal
£m
CostAs at 1 January 2015 (restated) 2,551 560 186 137 109 123 3,666Exchange and other movements (21) 1 8 − 8 − (4)Additions 1 − − − − 21 22Disposals and retirements − (31) − − − (6) (37)Reclassifications − − − − − 7 7
As at 31 December 2015 2,531 530 194 137 117 145 3,654
AmortisationAs at 1 January 2015 (restated) 35 107 21 14 1 45 223Exchange and other movements (4) − − 1 1 1 (1)Impairment loss 308 − − 7 − − 315Provided during the year − 43 11 43 7 25 129Disposals and retirements − (31) − − − (6) (37)
As at 31 December 2015 339 119 32 65 9 65 629
CostAs at 1 January 2014 792 192 23 9 – 66 1,082Exchange and other movements (2) 4 1 – (1) 2 4Acquired through business combinations 1,761 367 162 129 110 5 2,534Additions – – – – – 51 51Disposals and retirements – (3) – (1) – (1) (5)
As at 31 December 2014 (restated) 2,551 560 186 137 109 123 3,666
AmortisationAs at 1 January 2014 35 85 19 7 – 29 175Exchange and other movements − 2 – – – 1 3Provided during the year – 23 2 8 1 15 49Disposals and retirements – (3) – (1) – – (4)
As at 31 December 2014 (restated) 35 107 21 14 1 45 223
Net book valueAs at 31 December 2015 2,192 411 162 72 108 80 3,025
As at 31 December 2014 (restated) 2,516 453 165 123 108 78 3,443
As at 1 January 2014 757 107 4 2 – 37 907
The carrying value of software held under deferred payment arrangements which are similar to finance leases as at 31 December 2015 was £24m (2014: £30m). Additions during the year include £nil (2014: £33m) of software held under deferred payment arrangements.
The impairment loss of £315m relates to a £308m impairment of goodwill in relation to the Global Power Group and a £7m impairment of the order backlog intangible asset.
Notes to the consolidated accounts continued

125Amec Foster Wheeler Annual report and accounts 2015
Fina
ncia
lsG
over
nanc
eS
trat
egic
rep
ort
Ad
dit
iona
l inf
orm
atio
n
12 Intangible assets continued
The Group is required to test its goodwill and intangible assets for impairment at least annually, or more frequently if indicators of impairment exist.
The review of goodwill for indications of impairment by management is performed at the operating segment level, being the lowest level of cash-generating units (CGU) monitored for goodwill purposes. With effect from 1 January 2015, the Group adopted three new geographical operating segments: Americas; Northern Europe and CIS; and Asia, Middle East, Africa and Southern Europe; with Foster Wheeler’s E&C Services segment being merged into these segments. Goodwill on the legacy AMEC and Foster Wheeler E&C businesses was allocated between these segments on a relative fair value basis.
The table below shows the goodwill allocated to each CGU, post recognition of any impairment losses.
Goodwill 31 December
2015 £m
Pre-tax discount rate
2015 %
Americas 1,054 11Northern Europe and CIS 654 11Asia, Middle East, Africa and Southern Europe 266 11Global Power Group 218 13
The recoverable amount of all CGUs has been based on value-in-use calculations. These calculations use cash flow projections included in the financial budgets approved by the Board for 2016 and pre-tax discount rates as set out in the table above. For the purposes of the calculation of the recoverable amount, the cash flow projections beyond the budgeted period include no growth in 2017 for the Americas, Northern Europe and CIS, and Asia, Middle East, Africa and Southern Europe, and 10% growth in the Global Power Group. For all segments, no growth is included in 2018, 5% growth in 2019, 10% growth in 2020 and 3% growth per annum thereafter. The long-term growth rates are in line with long-term average growth rates for the regions in which the CGUs operate.
The financial budgets reflect management’s judgement of the future cash flows which includes past experience and expectations of future performance. The most significant assumptions relate to trading profit margin and the conversion of trading profit into cash (cash conversion). Revenue is underpinned by a secure order book for each CGU and the order book remains strong at £6.6 billion as at 31 December 2015 (2014: £6.3 billion). The selection of trading profit margin takes into account the margins being generated on contracts in progress and management’s view of the margin on orders received, and is consistent with Amec Foster Wheeler’s growth strategy. The cash conversion reflects past experience and current contract mix.
The value-in-use has been compared to the carrying value for each CGU and no impairment is required nor has been charged in respect of the Americas, Northern Europe and CIS, or Asia, Middle East, Africa and Southern Europe CGUs.
The carrying amount of the Global Power Group CGU has been reduced to its recoverable amount through recognition of an impairment loss of £308m against goodwill. This has been included in administrative expenses in the income statement. The recoverable amount of the Global Power Group CGU is £396m. The impairment loss arose due to difficult market conditions and a reduction in forecast future profits of the Global Power Group. Any adverse changes in the key assumptions would increase this impairment loss.
A sensitivity analysis has been performed in respect of these CGUs in order to review the impact of changes in key assumptions. The value-in-use calculations referred to above showed headroom of £400m in the Americas CGU and £307m in the Northern Europe and CIS CGU. However, applying zero terminal growth would eliminate the headroom and would result in an impairment to goodwill of £40m in the Americas CGU and £27m in the Northern Europe and CIS CGU. A zero growth rate would not result in an impairment in the Asia, Middle East, Africa and Southern Europe CGU.
Consideration was also given to the impact of a 10% decrease in volume, a 1% decrease in margin, or a 1% increase in discount rate, in each case holding other assumptions constant. This did not identify any impairments in these CGUs.

126 Amec Foster Wheeler Annual report and accounts 2015
13 Interests in joint ventures
Interests in joint venturesDetails in aggregate of the Group’s interests in all joint ventures that are accounted for using the equity method are as follows:
£m
Net book valueAs at 1 January 2015 122Exchange and other movements 2Disposal of businesses (9)Additions 1Reclassifications 2Total comprehensive income 28Dividends received (42)
As at 31 December 2015 104
As at 1 January 2014 52Acquired through business combinations 73Disposal of businesses (2)Additions 1Total comprehensive income 12Dividends received (14)
As at 31 December 2014 122
Group companies are listed on pages 194 to 201.
Details of material joint venturesPetropower Energia LimitadaThe Group has an 85% interest in Petropower Energia Limitada, a joint venture alongside the state-owned oil company of the Republic of Chile, which began commercial operation in November 1998. The Group’s interest is accounted for using the equity method in the consolidated financial statements. Summarised financial information of the joint venture, based on its IFRS financial statements are set out below:
Summarised Balance Sheet of Petropower Energia Limitada:
2015 £m
2014 £m
Non-current assets 47 51Current assets, including cash and cash equivalents of £19,583,000 (2014: £14,607,000) 35 41Current liabilities (30) (29)Non-current liabilities (12) (13)
Equity 40 50
Summarised Income Statement of Petropower Energia Limitada:
2015 £m
Revenue 43Cost of sales (20)Administrative expenses (2)
Profit before tax 21Income tax expense (5)
Profit for the year 16
Although the Group has an 85% interest in Petropower Energia Limitada, the profits are split according to the joint venture agreement. In the year the profit after tax received by the Group from Petropower Energia Limitada was £11m (2014: £2m), the carrying value of the investment was £53m (2014: £54m).
In 2014 the income received from Petropower Energia Limitada was immaterial as the Group only acquired the 85% interest following the acquisition of Foster Wheeler on 13 November 2014.
Notes to the consolidated accounts continued

127Amec Foster Wheeler Annual report and accounts 2015
Fina
ncia
lsG
over
nanc
eS
trat
egic
rep
ort
Ad
dit
iona
l inf
orm
atio
n
13 Interests in joint ventures continuedNuclear Management Partners LimitedThe Group has a 36% interest in Nuclear Management Partners Limited. The Group’s interest is accounted for using the equity method in the consolidated financial statements. Summarised financial information of the joint venture, based on its IFRS financial statements are set out below:
Summarised Balance Sheet of Nuclear Management Partners Limited:
2015 £m
2014 £m
Non-current assets 10 30Current assets, including cash and cash equivalents of £4,635,000 (2014: £2,449,000) 8 8Current liabilities (6) (5)Non-current liabilities – (3)
Equity 12 30
Group’s carrying value of investment 4 11
Summarised Income Statement of Nuclear Management Partners Limited:
2015£m
2014£m
Revenue 6 6Cost of sales (6) (6)Administrative expenses (2) (3)Share of post tax results of associate 40 27
Profit before tax 38 24Income tax expense – –
Profit for the year 38 24
Group’s share of profit for the year 14 9
PPP service concessionsDetails of the PPP service concessions are as follows:
Financial close
Equity stake
Concession period
Net equity invested
Transport A13 Thames Gateway 2000 25% 30 years –Incheon Bridge, Korea 2005 23% 30 years £12m
Power Petropower Energía Limitada, Chile 1998 85% 20 years £53m
Interests in joint operationsThe Group does not hold any individual material interests in joint operations in either the current or prior year.

128 Amec Foster Wheeler Annual report and accounts 2015
14 Retirement benefit assets and liabilities
Defined benefit schemesThe Group operates a number of pension schemes for UK and overseas employees.
There are three principal defined benefit schemes. In the UK these are the AMEC Staff pension scheme, (which also has an associated Executive top-up scheme) and the Foster Wheeler Pension Plan and in the US, The Foster Wheeler Inc. Salaried Employees Pension Plan. The AMEC Staff and Executive pension schemes are closed to new members but remain open to further accrual. The Foster Wheeler Pension Plan is a hybrid benefit arrangement with distinct defined benefit and defined contribution sections. The defined benefit section is closed to new members and further accrual, but the defined contribution section remains open to further accrual. The Foster Wheeler Inc. Salaried Employees Pension Plan is also closed to new members and further accrual. Contributions by the Group into defined contribution schemes are disclosed in note 6.
The AMEC Staff and Executive pension schemes are average salary plans for UK employees. The Foster Wheeler Pension Plan was a final salary pension plan. All three schemes require contributions to be made to a separately administered fund. These schemes are governed by the employment laws of the UK. The level of benefits provided depends on the member’s length of service and salary each year. Once the benefits are in payment, the pension is adjusted each year relative to the UK’s Retail Prices Index for the AMEC Staff and Executive pension schemes. The Foster Wheeler Pension Plan is adjusted each year relative to the UK’s Consumer Price Index. Each scheme is established under trust law and are governed by a Board of Trustees, which consists of employers’ and employees’ representatives. In addition, the AMEC Staff and Executive pension schemes have two independent trustees. The Board of Trustees is responsible for the administration of the plan assets and for the definition of the investment strategy.
Every three years, the Board of Trustees is required by legislation to review the level of funding in the pension plans. The Board of Trustees decides the contribution levels in consultation with the employers’ based on the results of this triennial review. In the event that there is a funding deficit, the Trustees and the employer will agree a recovery plan to eliminate that deficit over as short a period as is reasonably affordable.
Due to the nature of the liabilities, the pension plans are exposed to inflation, interest rate risk and changes in the life expectancy for pensioners. As the plan assets include significant investments in quoted equities, the Group is also exposed to equity market risk.
The valuations used have been based on the final valuations of the AMEC Staff pension scheme and AMEC Executive pension scheme as at 31 March 2014. The Foster Wheeler Pension Plan’s most recent valuation took place as at 1 April 2013. These schemes have been updated by the schemes’ actuaries for the requirement to assess the present value of the liabilities of the schemes as at 31 December 2015. The assets of the schemes are stated at their aggregate market value as at 31 December 2015.
The Foster Wheeler Inc. Salaried Employees Pension Plan provides pension benefits to certain full-time employees. Under the pension plan, retirement benefits are primarily a function of both years of service and level of compensation. The pension plan is closed to new members and further accrual.
Following an employee consultation exercise at the end of 2015, the Company has now confirmed its intention to close its UK Staff and Executive defined benefit pension schemes to future accrual from 1 April 2016 and replace them with a new defined contribution arrangement. Subject to obtaining the necessary Trustee approval, all legacy defined contribution plans in the UK will be merged into the new arrangement by 30 June 2016.
Notes to the consolidated accounts continued

129Amec Foster Wheeler Annual report and accounts 2015
Fina
ncia
lsG
over
nanc
eS
trat
egic
rep
ort
Ad
dit
iona
l inf
orm
atio
n
14 Retirement benefit assets and liabilities continued
Defined benefit schemes continuedThe principal assumptions made by the actuaries are as follows:
31 December 2015
%
31 December 2014
%
31 December 2013
%
The AMEC Staff pension scheme and the AMEC Executive pension schemeRate of discount 3.9 3.6 4.6Rate of inflation 3.0 3.0 3.3Rate of increase in salaries 3.0 3.0 3.3Rate of increase in pensions in payment (service before/after 1 January 2008) 2.8/1.9 2.9/2.0 3.2/2.2
The Foster Wheeler Pension PlanRate of discount 3.9 3.7 –Rate of inflation 3.0 3.0 –Rate of increase in salaries 2.0 1.9 –Rate of increase in pensions in payment (service before/after 5 April 2005, nil before 6 April 1997) 2.0/1.5 1.1 –
The Foster Wheeler Inc. Salaried Employees Pension PlanRate of discount 3.9 3.6 –Rate of inflation 2.3 2.5 –Rate of increase in salaries N/A N/A –Rate of increase in pensions in payment N/A N/A –
In addition the Group has a number of smaller overseas schemes. During the year the rate of discount ranged from 1.5% to 10.1% (2014: 1.8% to 9.0%; 2013: 4.8% to 4.9%). The rate of increase in salaries ranged from 1.9% to 8.0% (2014: 1.9% to 8.0%; 2013: 2.8%).
For the three principal defined benefit schemes, the assumed life expectancy is as follows:
31 December 2015 Male years
31 December 2015
Female years
31 December 2014 Male
years
31 December 2014
Female years
31 December 2013 Male
years
31 December 2013
Female years
The AMEC Staff pension scheme and the AMEC Executive pension schemeMember aged 65 (current life expectancy) 22.4 24.6 22.5 24.6 22.9 24.4Member aged 45 (life expectancy at 65) 24.1 26.5 24.2 26.5 24.7 26.3
The Foster Wheeler Pension PlanMember aged 65 (current life expectancy) 23.4 23.2 23.5 23.2 N/A N/AMember aged 45 (life expectancy at 65) 25.1 25.1 25.3 25.1 N/A N/A
The Foster Wheeler Inc. Salaried Employees Pension PlanMember aged 65 (current life expectancy) 21.1 23.1 21.6 23.7 N/A N/AMember aged 45 (life expectancy at 65) 23.2 25.2 23.2 25.4 N/A N/A
The assumptions used by the actuaries are the best estimates chosen from a range of possible actuarial assumptions, which, due to the timescale covered, may not necessarily be borne out in practice.

130 Amec Foster Wheeler Annual report and accounts 2015
14 Retirement benefit assets and liabilities continued
Defined benefit schemes continuedThe amounts recognised in the balance sheet are as follows:
31 December 2015
£m
31 December 2014
£m
31 December 2013
£m
Retirement benefit assets 231 102 102Retirement benefit liabilities (168) (188) (62)
Retirement benefit net asset/(liability) 63 (86) 40
The retirement benefit net asset/(liability) is analysed as follows:
31 December 2015
£m
31 December 2014
£m
31 December 2013
£m
The AMEC Staff and the AMEC Executive pension scheme 184 65 102The Foster Wheeler Pension Plan 47 37 –The Foster Wheeler Inc. Salaried Employees Pension Plan (59) (57) –Other smaller pension schemes (109) (131) (62)
63 (86) 40
The retirement benefit liabilities of £168m (2014: £188m; 2013: £62m) reflect primarily the deficits on the smaller overseas schemes.
The major categories of scheme assets as a percentage of total scheme assets are as follows:
31 December 2015
per cent
31 December 2014
per cent
31 December 2013
per cent
Equities 34.6 35.4 41.3Bonds (including gilts) 51.8 52.6 47.6Property 8.7 8.4 8.8Other 4.9 3.6 2.3
100.0 100.0 100.0
The equities and bonds as listed above are predominantly quoted investments. There is a small investment in privately held pooled fund investments and the property/other investments are unquoted.
The amounts recognised in the income statement are as follows:
2015 £m
2014 £m
2013 £m
Current service cost, past service cost and administrative expenses 36 33 33Interest cost 104 84 72Interest income (102) (86) (73)
Total amount recognised in the income statement and included within staff costs (note 6) 38 31 32
Settlement gain (3) (3) –
Total amount recognised in the income statement 35 28 32
The total amount is recognised in the income statement as follows:Cost of sales 22 20 19Administrative expenses 11 10 14Net financing expense/(income) 2 (2) (1)
Total amount recognised in the income statement 35 28 32
Notes to the consolidated accounts continued

131Amec Foster Wheeler Annual report and accounts 2015
Fina
ncia
lsG
over
nanc
eS
trat
egic
rep
ort
Ad
dit
iona
l inf
orm
atio
n
14 Retirement benefit assets and liabilities continued
Defined benefit schemes continuedChanges in the present value of the defined benefit liability are as follows:
2015 £m
2014 £m
2013 £m
As at 1 January 2,931 1,743 1,652Exchange and other movements (1) 3 (14)Acquired through business combinations − 898 –Current and past service cost 32 29 31Interest cost 104 84 72Plan participants’ contributions 11 12 12Actuarial (gains)/charges arising from changes in financial assumptions and experience adjustments (177) 278 58Actuarial (gains)/charges arising from changes in demographic assumptions (14) (19) 7Settlements (31) (12) (4)Benefits paid (141) (85) (71)Reclassifications 3 − −
As at 31 December 2,717 2,931 1,743
The defined benefit obligation can be allocated to the plans’ participants as follows:
2015 %
2014 %
2013 %
Active plan participants 20.5 22.0 25.2Deferred plan participants 28.4 31.3 33.8Retirees 51.1 46.7 41.0
100.0 100.0 100.0
The weighted average duration of the defined benefit obligation at the end of the reporting period is 16 years.
Changes in the fair value of scheme assets are as follows:
2015 £m
2014 £m
2013 £m
As at 1 January 2,845 1,783 1,645Exchange and other movements − 3 (8)Acquired through business combinations − 826 –Interest income 102 86 73Actuarial (losses)/gains (41) 201 105Employer contributions 36 32 29Plan participants’ contributions 11 12 12Administrative expenses (4) (4) (2)Settlements (28) (9) –Benefits paid (141) (85) (71)
As at 31 December 2,780 2,845 1,783

132 Amec Foster Wheeler Annual report and accounts 2015
14 Retirement benefit assets and liabilities continued
Defined benefit schemes continuedThe movement in the scheme net asset/(liability) during the year is as follows:
2015 £m
2014 £m
2013 £m
Scheme net (liability)/asset as at 1 January (86) 40 (7)Exchange and other movements 1 – 6Acquired through business combinations − (72) –Total charge as per note 6 (38) (31) (32)Employer contributions 36 32 29Settlements 3 3 4Actuarial gains/(losses) recognised in other comprehensive income 150 (58) 40Reclassifications (3) − −
Scheme net asset/(liability) as at 31 December 63 (86) 40
The impact on the defined benefit obligation of the principal pension schemes of changes in the most significant assumptions as at 31 December 2015 is shown below:
The AMEC Staff and the
AMEC Executive pension schemes
£m
The Foster Wheeler Pension Plan
£m
The Foster Wheeler Inc. Salaried
Employees Pension Plan
£m
Discount rate-10 bps (29) (9) (2)+10 bps 29 9 2
Inflation-10 bps 27 4 −+10 bps (27) (4) −
Salary increase-10 bps 2 1 −+10 bps (2) (1) −
Mortality+1 year (53) (12) (9)- 1 year 53 12 9
The sensitivity analysis above is based on a method that extrapolates the impact on the defined benefit obligation of reasonable changes in key assumptions occurring as at 31 December 2015.
The defined benefit obligations of the other benefit schemes are significantly lower than those of the principal defined benefit schemes. Sensitivity analysis of reasonable changes in the key assumptions as at 31 December did not indicate any significant changes to the defined benefit obligations of those schemes.
Expected benefit payments from the defined benefit plans in future years are as follows:
£m
Year 1 139Year 2 142Year 3 145Year 4 147Year 5 150Next five years 793
1,516
The Group expects to contribute £36m to its defined benefit pension schemes in 2016. This includes special contributions of £6m.
Notes to the consolidated accounts continued

133Amec Foster Wheeler Annual report and accounts 2015
Fina
ncia
lsG
over
nanc
eS
trat
egic
rep
ort
Ad
dit
iona
l inf
orm
atio
n
15 Deferred tax assets and liabilities
Deferred tax assets and liabilities are attributable to the following:
Recognised deferred tax assets and liabilities
Assets Liabilities
31 December 2015
£m
31 December 2014
£m
31 December 2015
£m
31 December 2014
£m
Property, plant and equipment 17 15 (10) (9)Intangible assets 4 14 (226) (264)Retirement benefits 43 67 (43) (38)Derivative financial instruments 2 − (2) (2)Provisions 144 130 − –Employee share schemes − 1 − –Other items 12 28 (29) (37)Tax losses carried forward 30 42 − –Tax credits carried forward 2 1 − –
Deferred tax assets/(liabilities) 254 298 (310) (350)Offset of deferred tax assets and liabilities relating to income tax levied by the same taxation authority (204) (242) 204 242
Net deferred tax assets/(liabilities) 50 56 (106) (108)
As at 1 January
2015 £m
Exchange and other
movements £m
Reclassifications £m
Recognised in income
£m
Recognised in other
comprehensive income
£m
As at 31 December
2015 £m
Property, plant and equipment 6 − − 1 − 7Intangible assets (250) (6) (1) 35 − (222)Retirement benefits 29 2 − (5) (26) –Derivative financial instruments (2) − − − 2 −Provisions 130 1 − 12 1 144Employee share schemes 1 − − (1) − −Other items (9) 1 1 (9) (1) (17)Tax losses carried forward 42 (1) (1) (11) 1 30Tax credits carried forward 1 – 1 – − 2
(52) (3) − 22 (23) (56)
As at 1 January
2014 £m
Exchange and other
movements £m
Acquisitions £m
Recognised in income
£m
Recognised in other
comprehensive income
£m
As at 31 December
2014 £m
Property, plant and equipment 13 – (11) 4 – 6Intangible assets (33) (3) (222) 8 – (250)Retirement benefits (12) – 35 (5) 11 29Derivative financial instruments – – (2) – – (2)Provisions 46 2 84 (2) – 130Employee share schemes 3 – – (2) – 1Other items (5) – (6) 2 – (9)Tax losses carried forward 3 – 28 11 – 42Tax credits carried forward – – − 1 – 1
15 (1) (94) 17 11 (52)
The deferred tax credit of £22m (2014: £17m) recognised in income consists of a credit of £22m (2014: £16m) relating to continuing operations and a £nil credit (2014: £1m) in respect of discontinued operations.

134 Amec Foster Wheeler Annual report and accounts 2015
15 Deferred tax assets and liabilities continued
Factors affecting the tax charge in future yearsThere are a number of factors that may affect the Group’s future tax charge including the resolution of open issues with tax authorities, corporate acquisitions and disposals, the use of brought-forward losses and changes in tax legislation and tax rates.
Unrecognised deferred tax assetsDeferred tax assets have not been recognised in respect of the following items:
31 December 2015
£m
31 December 2014
£m
Deductible temporary differences 322 326Tax losses 128 121
450 447
During the year the Group withdrew claims made to HM Revenue & Customs (HMRC) to offset German tax losses of approximately £79m against UK taxable profits. This follows a further change to HMRC’s view of the conditions that need to be satisfied for a valid claim, based on a ruling in the Court of Justice of the European Union. The point at issue concerns the date on which there is certainty that the losses could not be utilised in the country in which they originated. HMRC’s position was that it would be necessary to litigate in order to pursue the claims. As the net UK tax benefit of the claims was no more than £10m, the decision to withdraw the claim was taken on the basis that there was no longer clear legal precedent on the point at issue and the costs of pursuing the claim would be substantial, with no certainty of success.
As at 31 December 2015 the expiry dates of unrecognised deferred tax assets carried forward are as follows:
Tax losses £m
Deductible temporary differences
£mTotal
£m
Expiring within 5 years 3 37 40Expiring within 6-10 years 10 80 90Expiring within 11-20 years 46 − 46Unlimited 69 205 274
128 322 450
Deferred tax assets have not been recognised in respect of these items because it is not probable that future taxable profits will be available against which the Group can utilise these assets.
Unrecognised deferred tax liabilitiesNo deferred tax liability has been recognised in respect of £1,323m (2014: £1,440m) of unremitted earnings of subsidiaries and joint ventures because the Group is in a position to control the timing of the reversal of the temporary difference and it is not probable that such differences will reverse in the foreseeable future.
The amount of unrecognised deferred tax liabilities in respect of these unremitted earnings is estimated to be £28m (2014: £29m).
16 Inventories
31 December 2015
£m
31 December 2014
£m
Raw materials 13 14
13 14
Notes to the consolidated accounts continued

135Amec Foster Wheeler Annual report and accounts 2015
Fina
ncia
lsG
over
nanc
eS
trat
egic
rep
ort
Ad
dit
iona
l inf
orm
atio
n
17 Current trade and other receivables
31 December 2015
£m
31 December 2014
(restated)£m
Amounts expected to be recovered within one yearGross amounts due from customers 552 542Trade receivables 717 758Amounts owed by joint ventures 13 10Other receivables 63 60Prepayments and accrued income 72 76Asbestos related insurance recovery debtor (note 21) 14 13
1,431 1,459
Amounts expected to be recovered after more than one yearGross amounts due from customers 2 –Trade receivables 7 5Amounts owed by joint ventures 1 1Other receivables 14 4
24 10
1,455 1,469
Trade receivables expected to be recovered within one year include retentions of £34m (2014: £47m) relating to contracts in progress. Trade receivables expected to be recovered after more than one year include retentions of £7m (2014: £4m) net of £1m impairment (2014: £nil) relating to contracts in progress.
The aggregate amount of costs incurred plus recognised profits (less recognised losses) for all long-term contracts in progress for continuing businesses at the balance sheet date was £6,428m.
Trade receivables, amounts owed by joint ventures and other receivables are classified as loans and receivables.
18 Current trade and other payables
31 December 2015
£m
31 December 2014
(restated)£m
Amounts expected to be settled within one yearTrade payables 584 543Gross amounts due to customers 328 361Other taxation and social security costs 50 42Other payables 225 190Accruals 198 235
1,385 1,371
Amounts expected to be settled after more than one yearTrade payables 1 2Gross amounts due to customers 5 5Other taxation and social security costs 17 19Other payables 47 40Accruals 4 1
74 67
1,459 1,438
Gross amounts due to customers include advances received of £5m (2014: £nil).
Trade payables, other payables and accruals are classified as other financial liabilities.

136 Amec Foster Wheeler Annual report and accounts 2015
19 Capital and financial risk management
Capital management The objective of the Group’s capital management is to ensure that it has a strong financial position from which to grow the business and to maximise shareholder value. The appropriate capital structure for the Group comprises of a mix of debt and equity. The mix is determined by considering business profile and strategy, financial policies and availability and cost of funding.
Following the acquisition of Foster Wheeler, the Group is currently in a net debt position. The long-term net debt is targeted to be no more than two times trading profit. The Group may exceed this operating parameter should the business profile require it. However, it is expected that any increases would be temporary given the net operational cash flows of the Group.
At 31 December 2015, the Group had committed banking facilities of £1,768m (2014: £1,863m). This consists of a £27m project debt and a £377m multi-currency revolving facility that was taken out on 18 July 2012. The facility is committed for five years and is available for general corporate purposes. The Group has additional facilities totalling $2,010m (£1,363m). This comprises of the following:
X$830m (£563m) bridge facility maturing August 2016 with a further six month extension at the Company’s option
X$830m (£563m) term loan maturing in equal instalments in 2017, 2018 and 2019
X$350m (£237m) revolving credit facility maturing May 2016
As at 31 December 2015, £1,264m (2014: £1,267m) of the loans and facilities were utilised by way of debt and £62m (2014: £156m) was utilised by way of Letter of Credit. As at 31 December 2015, the undrawn portion of the Group’s committed facilities was £442m.
In November 2014, as part of the acquisition of Foster Wheeler AG, the Group issued 85 million of ordinary shares. This increased share capital by £42m and generated a share premium of £877m, which is recorded on the balance sheet within the merger reserve.
On 1 March 2016, the Group entered into a new syndicated facility comprising of three tranches; a three-year £650m term loan, a five-year £650m term loan and a five-year £400m revolving credit facility. This new facility replaces the company’s existing £377m revolving credit facility and the Foster Wheeler acquisition facility of $2.26bn.
Financial risk managementThe principal financial risks to which the Group is exposed are: foreign currency exchange risk; funding and liquidity risk; counterparty credit risk; and interest rate risk. The board has approved policies for the management of these risks which are reviewed annually.
The Group’s treasury department manages funding, liquidity, credit risk and risks arising from movements in interest and foreign currency rates within a framework of policies and guidelines approved by the board, most recently in December 2015. The treasury department does not operate as a profit centre and the undertaking of speculative transactions is not permitted.
Notes to the consolidated accounts continued

137Amec Foster Wheeler Annual report and accounts 2015
Fina
ncia
lsG
over
nanc
eS
trat
egic
rep
ort
Ad
dit
iona
l inf
orm
atio
n
19 Capital and financial risk management continued
Foreign currency exchange riskThe Group publishes its consolidated accounts in Sterling. The majority of the Group’s trading income is denominated in the local currency of the business operations which provides a natural hedge against the currency of its cost base. Where commercial contracts are undertaken which are denominated in foreign currencies, the Group seeks to mitigate the foreign exchange risk, when the cash flow giving rise to such exposure becomes certain or highly probable. This is achieved through the use of forward currency arrangements, which may include the purchase of currency options. There are currently no material transactional exposures which have been identified and remain unhedged. The Group has no reason to believe that any outstanding forward contract will not be able to be settled from the underlying commercial transactions.
A significant portion of the Group’s earnings is generated in non-Sterling currencies. Such overseas profits are translated into Sterling at the average exchange rate prevailing throughout the year. There is currently no hedging in place for profits generated in non-Sterling currencies but the impact on Group profits is monitored on an ongoing basis. In addition, the Group has various assets denominated in foreign currencies, principally US Dollars, Canadian Dollars and Euros. With the introduction of the acquisition facilities detailed above the Group hedges translation exposure, wherever possible, by matching the currency of its borrowing (either directly or via derivatives) to the currency of its net assets and future free cash flow. As a result, the Group has designated a series of derivatives and financial instruments as hedging instruments in net investment hedge relationships. In specific circumstances, for example the planned repatriation of foreign assets, the Group may from time to time enter into additional net investment hedges to manage foreign exchange risks. The Group applies hedge accounting in respect of transactions entered into to manage the cash flow exposures of its borrowings. Forward foreign exchange contracts and cross currency interest rate swap contracts are held to manage the cash flow exposures of a portion of borrowings denominated in foreign currencies and are designated as cash flow hedges.
Based on the Group’s net debt as at 31 December 2015, if Sterling were to weaken against all other currencies by 10%, the Group’s net debt would increase by £46m (2014: £44m). This represents a £130m increase in foreign currency borrowings (2014: £134m), a £50m increase in derivative assets designated as cash flow hedges of Group borrowings (2014: £47m) and a £34m increase in foreign currency cash and cash equivalents (2014: £43m).
If Sterling were to weaken against all other currencies by 10%, then the fair value of forward foreign exchange contracts and cross currency interest rate swaps, other than those designated as cash flow hedges of foreign currency borrowings, as at 31 December 2015 would decrease by £51m (2014: £57m).
Movements in the fair value of forward foreign exchange contracts and cross currency interest rate swaps would be recognised in other comprehensive income and accumulated in the hedging reserve or translation reserve.
Hedging of foreign currency exchange risk – cash flow hedgesThe Group looks to mitigate the foreign exchange risk arising on foreign currency borrowings and where contracts are awarded in, or involve costs in, non-local currency. Forward foreign exchange contracts and foreign exchange swaps are used for this purpose and are designated as cash flow hedges. The notional contract amount, carrying amount and fair values of forward contracts and swaps designated as cash flow hedges are as follows:
2015 Notional contract amount
£m
2014 Notional contract amount
£m
2015 Carrying
amount and fair value
£m
2014 Carrying
amount and fair value
£m
Non current assets – cash flow hedges of foreign currency borrowings 105 105 6 –
Total non current assets 105 105 6 –
Current assets – cash flow hedges of contracts in foreign currencies 57 15 1 –Current assets – cash flow hedges of foreign currency borrowings 328 318 8 1
Total current assets 385 333 9 1
Current liabilities – cash flow hedges of contracts in foreign currencies 191 44 (9) (1)
Total current liabilities 191 44 (9) (1)
681 482 6 –

138 Amec Foster Wheeler Annual report and accounts 2015
19 Capital and financial risk management continued
There was no charge for ineffectiveness recognised in either 2015 or 2014. A net foreign exchange loss for the year of £2m was recognised in the hedging reserve as a result of fair value movements on derivative financial instruments designated as cash flow hedging instruments (£1m) and amounts recycled to the income statement in line with underlying cash flows (£1m).
Hedging of foreign currency exchange risk – fair value through income statementCertain forward foreign exchange contracts and foreign exchange swaps are not designated as cash flow hedges and changes in their fair value are recognised through the income statement. The notional contract amount, carrying amount and fair values of these forward contracts and swaps are as follows:
2015 Notional contract amount
£m
2014 Notional contract amount
£m
2015 Carrying
amount and fair value
£m
2014 Carrying
amount and fair value
£m
Derivative financial instrumentsCurrent assets 241 229 5 2Current liabilities 388 422 (5) (12)
629 651 – (10)
Hedging of foreign currency exchange risk – net investment hedgesThe Group has forward foreign exchange contracts which have been designated as hedges of the net investments in core subsidiaries in Canada, the US and Europe. The notional contract amount, carrying amount and fair values of swaps designated as net investment hedges are as follows:
2015 Notional contract amount
£m
2014 Notional contract amount
£m
2015 Carrying
amount and fair value
£m
2014 Carrying
amount and fair value
£m
Derivative financial instrumentsNon current assets 105 105 12 2Current assets 111 318 2 8Current liabilities 168 − (7) −
384 423 7 10
A net foreign exchange loss for the year of £3m (2014: £4m) was recognised in the translation reserve in respect of forward foreign exchange contracts, currency interest rate swaps and borrowings designated as net investment hedging instruments.
Other financial derivative assets and liabilitiesThe Group has other financial derivative assets of £nil (2014: £1m) and financial derivative liabilities of £4m (2014: £6m).
The following tables indicate the periods in which the cash flows associated with the derivative financial instruments are expected to occur and the periods in which they are expected to impact profit or loss:
2015
Carrying amount
£m
Expected cash flows
£m
12 months or less
£m
1 to 2 years
£m
2 to 5 years
£m
Derivative financial instrumentsAssets 34 948 726 12 210Liabilities (25) 963 739 16 208
9 1,911 1,465 28 418
2014
Carrying amount
£m
Expected cash flows
£m
12 months or less
£m
1 to 2 years
£m
2 to 5 years
£m
Derivative financial instrumentsAssets 14 1,090 877 2 211Liabilities (19) 648 361 102 185
(5) 1,738 1,238 104 396
Notes to the consolidated accounts continued

139Amec Foster Wheeler Annual report and accounts 2015
Fina
ncia
lsG
over
nanc
eS
trat
egic
rep
ort
Ad
dit
iona
l inf
orm
atio
n
19 Capital and financial risk management continued
Funding and liquidity riskThe Group’s policy aims to ensure the constant availability of an appropriate amount of funding to meet both current and future forecast requirements consistent with the Group’s budget and strategic plans. The Group will finance operations and growth from its existing cash resources and the £442m undrawn portion of the Group’s committed banking facilities as at 31 December 2015. The requirement to enter into additional external facilities has been kept under review during the year. This includes discussions with the Group’s main relationship banks to ensure additional bilateral lending capacity is available.
Appropriate facilities will be maintained to meet ongoing requirements for bank guarantees and letters of credit.
Counterparty credit riskThe Group is exposed to credit risk to the extent of non-payment by either its customers or the counterparties of its financial instruments. The effective monitoring and controlling of credit risk is a key component of the Group’s risk management activities.
The maximum credit risk exposure on derivatives at 31 December 2015 was £35m, being the total net debit fair values per derivative counterparty on forward foreign exchange contracts, currency swaps and interest rate swaps. The Group performs a Credit Value Adjustment (CVA) and Debit Value Adjustment (DVA) analysis to establish the credit risk inherent in the closing derivative portfolio. As at 31 December 2015, the result of this adjustment has no impact on the Group’s income statement. In 2014, a similar analysis of a 60 basis point deterioration in the credit quality of the Group’s derivative counterparties had nil impact on the Group’s income statement. Credit risks arising from treasury activities are managed by a central treasury function in accordance with the board approved treasury policy. The objective of the policy is to diversify and minimise the Group’s exposure to credit risk from its treasury activities by ensuring that surplus funds are placed with a diversified range of 25 to 30 mainstream banks and with each counterparty up to a pre-approved limit. These limits are set at prudent levels by the board and are based primarily on publicly available credit ratings of counterparties. Credit ratings are monitored continually by the Group treasury department.
The maximum credit risk exposure on cash and cash equivalents and bank deposits (more than three months) at 31 December 2015 was £363m (2014: £516m). The Group treasury department monitors counterparty exposure on a global basis to avoid an over-concentration of exposure to any one counterparty.
The credit risk associated with customers is considered as part of each tender review process and is addressed initially through contract payment terms. Where appropriate, payment security is sought. Credit control practices are applied thereafter during the project execution phase. A right to interest and suspension is normally sought in all contracts.
The ageing of trade receivables at the year-end was:
Gross receivables
31 December 2015
£m
Impairment 31 December
2015 £m
Gross receivables
31 December 2014
£m
Impairment 31 December
2014 £m
Not past due 357 − 402 –Past due 0 to 30 days 216 − 163 –Past due 31 to 120 days 90 (3) 99 –Past due 121 to 365 days 40 (18) 47 (6)More than one year 88 (86) 100 (93)
791 (107) 811 (99)
The above analysis excludes retentions relating to contracts in progress of £34m (2014: £47m) expected to be recovered within one year and £7m (2014: £4m) net of £1m impairment (2014: £nil) expected to be recovered after one year. Net receivables as at 31 December 2015 include £2m (2014: £7m) in respect of amounts overdue by more than one year.

140 Amec Foster Wheeler Annual report and accounts 2015
19 Capital and financial risk management continued
Counterparty credit risk continuedThe movement in the allowance for impairment in respect of trade receivables during the year was as follows:
2015 £m
2014 £m
As at 1 January (99) (16)Exchange movements (1) –Increase in impairment allowance (23) (86)Decrease in impairment allowance 16 3
As at 31 December (107) (99)
Based on past experience, the Group believes that no material impairment allowance is necessary in respect of trade receivables not past due.
Trade receivable exposures are typically with large companies and government-backed organisations and the credit ratings of these organisations are monitored. Credit risks are minimised through the use of letters of credit, parent company guarantees, insurance instruments and forward funding where achievable.
The Group’s most significant customer in 2015 accounted for around 8% (2014: 8%) of continuing revenues, and around 2% (2014: 4%) of current trade and other receivables. The revenue was generated in both the Americas and AMEASE.
Interest rate risk The £377m multi-currency revolving credit facility is subject to an interest rate of LIBOR plus a margin depending on leverage.
The $830m (£563m) bridge facility is subject to an interest rate of LIBOR plus a margin which increases over time.
The $830m (£563m) term loan is subject to an interest rate of LIBOR plus a margin depending on leverage.
The $350m (£237m) revolving credit facility is subject to an interest rate of LIBOR plus a margin.
The €35m (£26m) project debt is subject to an interest rate of EURIBOR plus a margin.
The Group is exposed to interest rate risk on cash and borrowings. Cash is viewed as temporary with any longer term surplus used to repay credit facilities.
When required the Group uses interest rate swaps and cross currency interest rate swaps to meet its objective of protecting borrowing costs within parameters set by the Board. The Group’s policy is to keep between 30% and 70% of its borrowings at fixed rates of interest. Movements in the fair value of interest rates swaps and cross currency interest rate swaps that are designated as cash flow hedges of the Group’s borrowings resulting from changes in market interest rates are recognised in other comprehensive income and accumulated in the hedging reserve with the fair value recorded in the balance sheet. At 31 December 2015, after taking into account the effect of interest rate swaps and cross currency interest rate swaps, approximately 28% of the Group’s borrowings are at a fixed rate of interest (2014: 23%). The year-end position was below the lower threshold due to the ongoing refinancing activity in 2015. This will be rectified in Q1 2016 following the completion of the refinancing activity.
Based on the Group’s gross borrowings as at 31 December 2015, if interest rates were to increase by 100 basis points in all currencies then the annual net interest charge would increase by £9m (2014: £9m). A decrease in interest rates by 100 basis points in all currencies would have an equal but opposite effect.
Notes to the consolidated accounts continued

141Amec Foster Wheeler Annual report and accounts 2015
Fina
ncia
lsG
over
nanc
eS
trat
egic
rep
ort
Ad
dit
iona
l inf
orm
atio
n
19 Capital and financial risk management continued
Interest rate risk – contractual maturity and effective interest ratesIn respect of interest-earning financial assets and interest-bearing financial liabilities, the following table indicates their effective interest rates at the balance sheet date and the periods in which they mature:
2015
Effective interest rate
per centTotal
£m
Less than 1 year
£m
1 to 2 years
£m
2 to 5 years
£m
Over 5 years
£m
Bank deposits (more than three months) 0.47 23 14 4 5 −Cash and cash equivalents (excluding bank overdrafts) 3.00 340 340 − − −Bank loans 3.28 (1,264) (679) (192) (386) (7)Finance leases 6.84 (59) (4) (18) (24) (13)Derivatives classified as bank loans − 14 8 – 6 −
(946) (321) (206) (399) (20)
2014
Effective interest rate
per centTotal
£m
Less than 1 year
£m
1 to 2 years
£m
2 to 5 years
£m
Over 5 years
£m
Bank deposits (more than three months) 0.80 21 18 2 1 –Cash and cash equivalents (excluding bank overdrafts) 1.24 495 495 – – –Fees capitalised against bank facilities – 9 5 2 2 –Bank loans 1.49 (1,267) (706) (5) (545) (11)Finance leases 6.54 (61) (9) (9) (26) (17)
(803) (197) (10) (568) (28)
Interest payments of £16m are expected to be paid within one year, £15m between one and two years, £16m between two and five years and £nil over five years.
Group borrowingThe Group had no overdrafts as at the end of 2015 or 2014. The bank loans are denominated in Sterling and US Dollars (2014: Sterling and US Dollars).
All covenants attached to borrowings have been complied with throughout the current and prior years.
Fair valuesFair values are determined using observable market prices (level 2 as defined by IFRS 13 ‘Fair Value Measurement’) as follows:
XThe fair value of forward foreign exchange contracts is estimated by discounting the difference between the contractual forward price and the current forward price for the residual maturity of the contract using a risk-free interest rate
XThe fair value of interest rate swaps and cross currency interest rate swaps are estimated by discounting estimated future cash flows based on the terms and maturity of each contract and using market rates
All derivative fair values are verified by comparison to valuations provided by the derivative counterparty banks. There are no material credit valuation adjustments (CVA) or debit valuation adjustments (DVA) required on the derivatives outstanding at 31 December 2015.

142 Amec Foster Wheeler Annual report and accounts 2015
20 Other non-current receivables and payables
Other non-current receivables
2015 £m
2014 (restated)
£m
Asbestos related insurance recovery debtor (note 21) 104 108Indemnities receivable 16 13Insurance receivables 4 4Lease incentives 17 28Other non-current receivables 4 14
145 167
Other non-current payables
2015 £m
2014 (restated)
£m
Deferred consideration on acquisition − 2Unfavourable leases 84 65Lease incentives 8 7Other payables 20 26Other post employment benefits 9 11
121 111
21 Provisions
Asbestos-related
litigation £m
Project andenvironmental
litigation £m
Obligations relating to
disposed businesses
£m
Property related
provisions £m
Other £m
Total £m
As at 1 January 2015 (restated) 400 217 86 19 34 756Exchange and other movements 18 6 (1) 1 (2) 22Reclassification 1 (3) 2 2 (2) −Transfer out to trade payables − (47) − (2) 2 (47)Utilised (35) (22) (2) (4) (1) (64)Provided 1 10 12 3 7 33Released (9) (7) (19) − (3) (38)Change in discount rate (5) − − − − (5)Unwinding of discount 7 − − − − 7
As at 31 December 2015 378 154 78 19 35 664
The balance as at 1 January 2015 has been restated following the finalisation of the purchase price allocation of the Foster Wheeler acquisition.
Notes to the consolidated accounts continued

143Amec Foster Wheeler Annual report and accounts 2015
Fina
ncia
lsG
over
nanc
eS
trat
egic
rep
ort
Ad
dit
iona
l inf
orm
atio
n
21 Provisions continued
Asbestos-related litigation Certain of the Company’s subsidiaries in the US and the UK are defendants in numerous asbestos-related lawsuits and out-of-court informal claims pending in the US and the UK. Plaintiffs claim damages for personal injury alleged to have arisen from exposure to asbestos primarily in connection with equipment allegedly manufactured by certain of our subsidiaries during the 1970s or earlier. We expect that these subsidiaries will be named as defendants in additional and/or similar suits and that new claims will be filed in the future. Whilst some of these claims have been and are expected to be made in the UK, the overwhelming majority have been and are expected to be made in the US.
We assumed the majority of our asbestos-related liabilities when we acquired Foster Wheeler in November 2014. Management worked with independent asbestos valuation experts, to measure the asbestos-related liabilities assumed. Asbestos-related liabilities recognised by the Group include estimates of indemnity amounts and defence costs expected to be incurred in each year in the period to 2050, beyond which time management expects that there will no longer be a significant number of open claims. Management’s estimates were based on the following information and/or assumptions: the number of open claims, the forecasted number of future claims, the estimated average cost per claim by disease type – mesothelioma, lung cancer and non-malignancies, claim filings which result in no monetary payments (the ‘zero pay rate’), as well as other factors.
Over the last several years, certain of our subsidiaries have entered into settlement agreements calling for insurers to make lump-sum payments, as well as payments over time, for use by our subsidiaries to fund asbestos-related indemnity and defence costs, and, in certain cases, for reimbursement for portions of out-of-pocket costs incurred. Asbestos-related insurance recoveries under executed settlement agreements are recognised in trade and other receivables together with our best estimate of actual and probable insurance recoveries relating to our liability for pending and estimated future asbestos claims in the period to 2050. Our actual insurance recoveries may be limited by future insolvencies among our insurers. We do not recognise insurance recoveries due from currently insolvent insurers unless they are subject to court-approved settlement in liquidation proceedings.
We have discounted the expected future cash flows with respect to the asbestos-related liabilities and the expected insurance recoveries using discount rates determined by reference to appropriate risk-free market interest rates.
Asbestos-related liabilities and assets recognised on the Group’s balance sheet were as follows:
2015 2014
US £m
UK £m
Total £m
US £m
UK £m
Total £m
Asbestos-related provisionGross provision 432 56 488 454 57 511Effect of discounting (74) – (74) (76) – (76)
Net provision1 358 56 414 378 57 435
Insurance recoveriesGross recoveries (68) (54) (122) (71) (54) (125)Effect of discounting 4 – 4 4 – 4
Net recoveries (64) (54) (118) (67) (54) (121)
Net asbestos-related liabilities 294 2 296 311 3 314
1 The net asbestos provision of £414m (2014: £435m) is made up of £378m included in provisions (2014: £400m) and £36m (2014: £35m) in respect of asbestos provisions included in trade and other payables.
Estimation of asbestos-related liabilities and insurance recoveries is subject to a number of uncertainties that may result in significant changes in the current estimates. Among these are uncertainties as to the ultimate number and type of claims filed, the amounts of claim costs, the impact of bankruptcies of other companies with asbestos claims, uncertainties surrounding the litigation process from jurisdiction to jurisdiction and from case to case, as well as potential legislative changes.
Fluctuations in market interest rates could cause significant changes in the discounted amount of the asbestos-related liabilities and insurance recoveries.

144 Amec Foster Wheeler Annual report and accounts 2015
21 Provisions continued
Project litigationAs described in note 26, the Group is party to litigation involving clients and sub-contractors arising out of project contracts.
Management has taken internal and external legal advice in considering known or reasonably likely legal claims and actions by and against the Group. Where a known or likely claim or action is identified, management carefully assesses the likelihood of success of the claim or action. Generally, a provision is recognised only in respect of those claims or actions that management considers are probable of success. Additionally, however, the Group recognises provisions for known or likely claims against an acquired business if, at the acquisition date, it is possible that the claim or action will be successful and its amount can be reliably estimated.
Provision is made for management’s best estimate of the future legal costs to be incurred in defending each claim or action and of the likely settlement costs and/or damages to be awarded for those claims and actions that management considers are likely to be successful. Due to the inherent commercial, legal and technical uncertainties underlying the estimation of our project claims, the amounts ultimately paid or realised by the Group could differ materially from the amounts, if any, that are recognised in the financial statements.
As at 31 December 2015, there were two significant ongoing disputes. Both of these disputes involve Foster Wheeler and were ongoing at the acquisition date. Accordingly, in measuring Foster Wheeler’s identifiable assets and liabilities at the acquisition date, management established provisions in respect of these disputes and made appropriate reductions to the carrying amount of the related receivables.
Power Plant Arbitration – USFoster Wheeler has been involved in arbitration arising from its role in the construction of a power plant in West Virginia, US. Foster Wheeler contracted with its client, Longview Power LLC (‘Longview’), the owner of the power plant, to supply the steam generation equipment. Separate contracts existed between Longview and Siemens Energy, Inc. (‘Siemens’) for the supply of the turbine, electricity generator and other plant equipment and with Kvaerner North American Construction Inc. (Kvaerner) for the erection of the plant.
Beginning in 2011, various claims and counterclaims were made between Foster Wheeler, Kvaerner, Siemens and Longview. In February 2014, Foster Wheeler reached a partial settlement with Longview. In December 2014, various settlement agreements were entered into involving the parties, leaving the claims between Foster Wheeler and Kvaerner the only claims to be resolved. Kvaerner’s total claims against Foster Wheeler amounted to approximately US$190m in relation to compensation for alleged delays, disruptions, inefficiencies and extra work associated with the construction of the plant allegedly caused by Foster Wheeler’s performance under its steam generation equipment supply contract. Foster Wheeler claimed approximately US$26m from Kvaerner in relation to claims for extra work, delays, scope disputes, and improperly assessed delay liquidated damages, as well as the cost to perform certain ongoing rehabilitation work on the steam generation equipment due to erection failures by Kvaerner. Pursuant to the settlement agreements reached in December 2014, Foster Wheeler and Kvaerner exchanged parent guarantees, securing their respective claims against each other. Foster Wheeler’s parent guarantee was capped at US$58m. The arbitration hearing of the dispute between Foster Wheeler and Kvaerner, conducted by the American Arbitration Association, occurred in early 2015. In October 2015, the three-arbitrator tribunal rejected Foster Wheeler’s claims in their entirety and awarded Kvaerner US$74m, including interest and arbitration costs. Kvaerner commenced an action in New York state court to confirm the award. We opposed the action, seeking an order to vacate the award in whole or in part on various grounds. In early March 2016, the parties settled their dispute. We are to pay Kvaerner US$70m in full and final settlement of the claims. The parties will exchange releases and the court action will be dismissed.
Refinery Project Arbitration – IndiaIn November 2012, Foster Wheeler commenced arbitration in India against its client seeking collection of unpaid invoices arising from services performed on a reimbursable basis in connection with the construction of an oil refinery plant in north-eastern India. Our client rejected the claims and has submitted counterclaims totalling approximately 70 billion Indian rupees (approximately £740m) for damages, including claims for revenue loss and loss of tax benefits due to delay in the execution of the project. Our client has also withheld payment of our invoices on account of delay liquidated damages.
We strongly dispute our client’s claims. Any liability for delay liquidated damages is capped under the contract at a specified percentage of the contract value, currently equivalent to approximately £12m, an amount already retained by our client. Moreover, the contract also excludes liability for special damages and consequential damages, including lost profits or product, and contains an overall cap on liability for claims in the aggregate of up to a specified percentage of the contract value, currently equivalent to approximately £29m.
Notes to the consolidated accounts continued

145Amec Foster Wheeler Annual report and accounts 2015
Fina
ncia
lsG
over
nanc
eS
trat
egic
rep
ort
Ad
dit
iona
l inf
orm
atio
n
21 Provisions continued
Refinery Project Arbitration – India continuedAn arbitration panel was formed in 2013 and divided the parties’ claims and counterclaims into two tracks. A number of hearings were held on the Track 1 claims during 2014. A first partial award was made to Amec Foster Wheeler in March 2014, but our client has petitioned the Delhi court for its annulment, which petition is still pending. In September 2015, the panel issued a further partial award on the Track 1 claims, awarding Amec Foster Wheeler approximately £54m on its invoice claims and dismissing our client’s counterclaim allocated to the Track 1 proceedings. In February 2016, our client petitioned the Delhi court to set aside this award as well. The petition is pending.
The hearing on the Track 2 claims, which include our client’s main counterclaims, was held in February 2015. The panel’s decision on these remaining claims is likewise pending. Limited further proceedings in the arbitration remain pending with respect to continuing invoice claim amounts in the Track 1 proceedings as well as for interest and the costs of arbitration. We will continue to defend strenuously the claims made by our client and pursue the collection of unpaid invoices and enforcement of the awards made in our favour. As the project is nearing completion but still remained in execution as of the end of 2015, the unpaid amount that we are seeking to collect has increased to the equivalent of approximately £56m and may increase further should our client continue to withhold amounts from our invoices. Management have made appropriate allowances against these receivables.
Environmental risksCertain of the jurisdictions in which the Group operates, in particular the US and the EU, have environmental laws under which current and past owners or operators of property may be jointly and severally liable for the costs of removal or remediation of toxic or hazardous substances on or under their property, regardless of whether such materials were released in violation of law and whether the operator or owner knew of, or was responsible for, the presence of such substances. Largely as a consequence of the acquisition of Foster Wheeler, the Group currently owns and operates, or owned and operated, industrial facilities. It is likely that, as a result of the Group’s current or former operations, hazardous substances have affected the property on which those facilities are or were situated. The Group have also received and may continue to receive claims pursuant to indemnity obligations from the present owners of facilities we have transferred, which claims may require us to incur costs for investigation and/or remediation. As at 31 December 2015, the Group held provisions totalling £44m (2014: £33m ) for the estimated future environmental clean-up costs in relation to industrial facilities that it no longer operates. Whilst the timing of the related cash flows is typically uncertain, the Group expects that certain of its remediation obligations may continue for up to 60 years.
Indemnities and retained obligationsAs described in note 26, the Group agreed to indemnify certain third parties relating to businesses and/or assets that were previously owned by the Group and were sold to them. As at 31 December 2015, we recognised indemnity provisions totalling £78m (2014: £86m). Indemnity provisions principally relate to the indemnification of the purchasers of SPIE in 2006, and the Built Environment and other peripheral businesses that were sold in 2007. During 2015, the Group recognised additional indemnity provisions of £12m in relation to businesses sold in previous years and released provisions of £19m that were no longer required following settlement of the underlying issues.
Property-related provisionsProperty-related provisions related to dilapidations of leasehold buildings.
Other provisionsOther provisions include £7m (2014: £2m) in respect of the Group’s legal and constructive obligations to fund loss-making joint ventures and to meet its share of certain of their obligations, and insurance provisions of £28m (2014: £28m) relating to the potential liabilities in the Group’s captive insurance entity and provisions in relation to risks associated with insurance claims. These potential liabilities and risks relate predominantly to industrial disease of former employees. These are expected to unwind over the next 20 years.
146 Amec Foster Wheeler Annual report and accounts 2015
22 Share capital and reserves
Movements in share capital and reserves are shown in the consolidated statement of changes in equity on pages 99 to 101.
Share capitalThe share capital of the company comprises ordinary shares of 50 pence each. All the ordinary shares rank pari passu in all respects. To the company’s knowledge and belief, there are no restrictions on the transfer of shares in the company or on voting rights between holders of shares.
The movement in issued share capital during the year was as follows:
Number £m
As at 1 January 2014 303,822,854 152Issued during the year 85,052,989 42
As at 31 December 2014 388,875,843 194Issued during the year 4,255,970 3
As at 31 December 2015 393,131,813 197
ReservesAs at 1 January 2015, there were 5,431,314 shares held in treasury (2014: 6,186,965), during the year 2,273,004 shares were transferred to share scheme participants (2014: 755,651) leaving a balance held in treasury as at 31 December 2015 of 3,158,310 (2014: 5,431,314). £35m (2014: £57m) has been deducted from equity in respect of these shares.
The hedging reserve comprises the effective portion of the cumulative net change in the fair value of cash flow hedging instruments related to hedged transactions that have not yet occurred.
The translation reserve comprises all foreign exchange differences arising from the translation of the accounts of foreign operations, as well as from the translation of liabilities and the cumulative net change in the fair value of instruments that hedge the company’s net investment in foreign subsidiaries, that have arisen since 1 January 2004, being the date of transition to adopted IFRS.
Share-based paymentsOffers are made periodically in certain countries under the UK and International Savings-related Share Option Schemes which are open to all employees in those countries who meet minimum service criteria. Grants of share options are made to participating employees that entitle them to buy shares in the company normally after three years at up to 20% discount to the market price of the shares at the time of offer. In the US, to conform with the relevant tax rules, options are granted at a maximum discount of 15% to the share price at the time of grant and are normally exercisable after two years.
Under the new Long-Term Incentive Plan, annual awards are made to directors and selected senior employees of nil-cost options or restricted shares. Below board level awards are split between a performance based element (half of which is based on a total shareholder return related performance condition and the other half on an earnings per share related performance condition) and a non-performance element. Awards are made in the form of nil-cost options other than in certain countries where they are made in the form of restricted shares. Awards to Executive Directors are as described in the Directors’ remuneration report on pages 67 to 80.
Under the Performance Share Plan, annual awards were made to directors and selected senior employees of restricted shares that are subject to both market and non-market based conditions calculated over a three-year period.
Under the Restricted Share Plan, awards were made to selected employees as restricted shares which vest in full after three years provided the employee has remained in continuous employment.
Prior to the acquisition, Foster Wheeler’s Compensation and Executive Development Committee administered the Foster Wheeler AG Omnibus Incentive Plan for Foster Wheeler’s employees, non-employee directors and third-party service providers.
Under the terms of the Implementation Agreement, equivalent awards of AMEC shares were granted by AMEC in replacement of Foster Wheeler awards and the terms of those replacement awards are equivalent in all material respects to the terms of the Foster Wheeler Omnibus Plan. All employees of Foster Wheeler and its subsidiaries and/or affiliates, its non-employee directors, and certain of its third-party service providers were eligible to participate in the Foster Wheeler Omnibus Plan. As at the date of acquisition, only Foster Wheeler options, Foster Wheeler RSUs and Foster Wheeler PRSUs were outstanding under the Foster Wheeler Omnibus Plan.
The share-based payment arrangements operated by the Group are predominantly equity settled and, other than in defined good leaver circumstances, require participants to be still in employment with the Group at the time of vesting.
Our current practice is to satisfy awards vesting or options being exercised under the executive plans with market-purchased shares held in the Amec Foster Wheeler Employee Share Trust and to satisfy Sharesave options being exercised by the transfer of shares held in treasury.
Notes to the consolidated accounts continued

147Amec Foster Wheeler Annual report and accounts 2015
Fina
ncia
lsG
over
nanc
eS
trat
egic
rep
ort
Ad
dit
iona
l inf
orm
atio
n
22 Share capital and reserves continued
Share-based payments continuedThe number and weighted average exercise price of share options under the Savings-related Share Option Scheme are as follows:
Weighted average
exercise price 2015
pence
Number of options
2015
Weighted average
exercise price 2014
pence
Number of options
2014
Outstanding on 1 January 819 7,711,995 794 6,691,883Lapsed/cancelled 850 (1,920,215) 822 (777,995)Exercised 675 (2,295,911) 777 (765,267)Granted 683 4,674,510 874 2,563,374
Outstanding on 31 December 775 8,170,379 819 7,711,995
Exercisable on 31 December 863 373,627 902 200,948
Options were exercised on a regular basis during the year and the average share price for the year was 780 pence (2014: 1,102 pence).
Options outstanding on 31 December 2015 have weighted average remaining contractual lives as follows:
Weighted average
remaining contractual life
2015 years
Number of options
2015
Weighted average
remaining contractual life
2014 years
Number of options
2014
600.00 pence to 699.99 pence 3.0 3,965,570 – 2,391,513700.00 pence to 799.99 pence 2.0 467,796 – –800.00 pence to 899.99 pence 1.3 2,710,501 1.1 3,807,935Over 900.00 pence − 1,026,512 0.2 1,512,547
8,170,379 7,711,995
The numbers of shares held under the Performance Share Plan and Restricted Share Plan are as follows:
Number of shares
2015
Number of shares
2014
As at 1 January 6,717,237 4,194,248Lapsed (1,361,021) (1,110,559)Vested (1,674,001) (250,328)Granted 2,510,707 3,883,876
As at 31 December 6,192,922 6,717,237

148 Amec Foster Wheeler Annual report and accounts 2015
22 Share capital and reserves continued
Share-based payments continuedThe fair value of services received in return for share options granted and shares awarded are measured by reference to the fair value of those instruments. For grants in either the current or preceding years, the pricing models used and inputs (on a weighted average basis where appropriate) into those models are as follows:
Savings-related Share Option Scheme (Black-Scholes model)
Long-Term Incentive Plan
(Monte Carlo model)Performance Share Plan
(Monte Carlo model)Restricted Share Plan(Monte Carlo model)
Foster Wheeler
Omnibus plan
2015 2014 2013 2015 2014 2013 2014 2013 2014
Weighted average fair value at measurement date 149p 198p 217p 789p 1,006p 948p 949p 960p 1,027pWeighted average share price at measurement date 769p 1,014p 1,061p 938p 1,105p 1,060p 1,082p 1,070p 1,081pExercise price 683p 874p 866p n/a n/a n/a n/a n/a n/aExpected share price volatility 28% 27% 27% 27% 26% 28% n/a n/a n/aOption life 3.3
years3.3
years3.3
years2.7
years3.1
years2.8
years2.7
years2.7
yearsn/a
Expected dividend yield 3.6% 3.5% 4.0% n/a n/a n/a 3.5% 3.0% 3.5%Risk-free interest rate 1.2% 1.0% 1.0% n/a n/a n/a n/a n/a n/aComparator share price volatility n/a n/a n/a 32% 32% 33% n/a n/a n/aCorrelation between two companies in comparator group n/a n/a n/a 40% 50% 50% n/a n/a n/a
The expected share price volatility is based on the historical volatility of the company’s share price.
The performance conditions attaching to the new Long-Term Incentive Plan and the Performance Share Plan involve a comparison of the total shareholder return of the company with that of its comparators and achievement of targeted earnings per share growth. The former is a market based test and as such is incorporated into the grant date fair value of the award. There are no performance conditions attached to the Restricted Share Plan.
Prior to the acquisition, Foster Wheeler had issued shares awards to employees, non-employee directors and certain third parties under the Foster Wheeler AG Omnibus Incentive Plan. Under the terms of the Implementation Agreement, equivalent awards of Amec Foster Wheeler shares were granted in replacement of these Foster Wheeler awards. On acquisition awards of 2,400,766 Amec Foster Wheeler shares were granted. There are no performance conditions attached to these awards.
DividendsThe directors are proposing a final dividend in respect of the financial year ended 31 December 2015 of 14.2 pence per share, which will absorb an estimated £54m of equity. Subject to approval, it will be paid on 4 July 2016 to shareholders on the register of members on 27 May 2016. This dividend has not been provided for and there are no income tax consequences for the company. This final dividend together with the interim dividend of 14.8 pence (2014: 14.8 pence; 2013: 13.5 pence) per share results in a total dividend for the year of 29.0 pence per share (2014: 43.3 pence; 2013: 42.0 pence).
Dividend cover for 2015 is 2.3 times (2014: 1.8 times) based on adjusted diluted EPS from continuing operations.
As announced in November 2015, it is the current intention of the Board that ordinary dividends in 2016 will be approximately half that declared in 2014, with approximately one-third paid at the interim, and two-thirds as a final dividend.
2015 £m
2014 £m
2013 £m
Dividends charged to reserves and paidInterim dividend in respect of 2014 of 14.8 pence (2014: interim dividend in respect of 2013 of 13.5 pence; 2013: interim dividend in respect of 2012 of 11.7 pence) per share 56 40 36Final dividend in respect of 2014 of 28.5 pence (2014: final dividend in respect of 2013 of 28.5 pence; 2013: final dividend in respect of 2013 of 24.8 pence) per share 111 84 72
167 124 108
The amount waived by trustees of the Employee Share Trust in respect of the interim and final dividends was £1m (2014: £1m; 2013: £1m).
Notes to the consolidated accounts continued

149Amec Foster Wheeler Annual report and accounts 2015
Fina
ncia
lsG
over
nanc
eS
trat
egic
rep
ort
Ad
dit
iona
l inf
orm
atio
n
23 Analysis of net (debt)/cash
As at 1 January
2015 £m
Cash flow £m
Exchange and other non-cash
movements £m
As at 31 December
2015 £m
Cash at bank and in hand 377 (46) (24) 307Bank deposits (less than three months) 118 (85) − 33
Cash and cash equivalents (excluding bank overdrafts) 495 (131) (24) 340Bank overdrafts − − − −
Cash and cash equivalents 495 (131) (24) 340Bank deposits (more than three months) 21 2 − 23Bank loans (1,267) 64 (61) (1,264)Fees capitalised against bank facilities 9 3 (12) –Finance leases (61) 11 (9) (59)Derivatives classified as net debt − (12) 26 14
Net debt as at the end of the year (803) (63) (80) (946)
As at 1 January
2014 £m
Acquisition £m
Cash flow £m
Exchange and other non-cash
movements £m
As at 31 December
2014 £m
Cash at bank and in hand 153 239 (9) (6) 377Bank deposits (less than three months) 79 29 10 – 118
Cash and cash equivalents (excluding bank overdrafts) 232 268 1 (6) 495Bank overdrafts (9) – 9 – –
Cash and cash equivalents 223 268 10 (6) 495Bank deposits (more than three months) 18 – 3 – 21Bank loans (120) (39) (1,102) (6) (1,267)Fees capitalised against bank facilities − – 13 (4) 9Finance leases − (32) 4 (33) (61)
Net cash/(debt) as at the end of the year 121 197 (1,072) (49) (803)
The fair value of bank loans is £1,264m (2014: £1,268m) compared to a carrying value of £1,264m (2014: £1,267m). The fair value of finance leases is £59m (2014: £66m) compared to a carrying value of £59m (2014: £61m).
Cash and cash equivalents as at 31 December 2015 includes £47m (2014: £60m) that is held in countries from which prior approval is required to transfer funds abroad. There are restrictions on the use of £9m (2014: £7m) of cash held on behalf of joint venture arrangements and £17m (2014: £28m) held on behalf of customers and collateral against bank guarantees. In addition, there are restrictions on the use of a further £16m (2014: £16m) of cash and cash equivalents in respect of commitments of the Group’s captive insurance subsidiary to certain insurers.

150 Amec Foster Wheeler Annual report and accounts 2015
24 Acquisitions and disposals
Acquisitions in 2015On 5 October 2015, the Group acquired the remaining 49.9% shareholding in KROMAV Engenharia Ltda, a company incorporated in Brazil for a consideration of £3m. As a result of the transaction, the non-controlling interest released was £1m resulting in a charge of £4m recognised in the consolidated statement of changes in equity.
Mandatory purchase of minority Foster Wheeler shareholders On 19 January 2015, Amec Foster Wheeler plc completed the squeeze-out merger under Swiss law (the ‘Squeeze-Out Merger’) of Foster Wheeler AG (‘Foster Wheeler’) through its wholly owned subsidiaries AMEC International Investments BV and A-FW International Investments GmbH.
All remaining Foster Wheeler shareholders received, for each Foster Wheeler share held, a combination of $16.00 in cash and either (i) 0.8998 Amec Foster Wheeler shares, if the shareholder’s address on the books and records of Foster Wheeler was outside the United States or (ii) 0.8998 Amec Foster Wheeler American depositary shares (‘ADSs’), if the shareholder’s address on the books and records of Foster Wheeler was in the United States.
The cash portion of the consideration was increased by $0.225 for each Amec Foster Wheeler share or Amec Foster Wheeler ADS received, in lieu of the Amec Foster Wheeler dividend of £0.148 (announced on 7 August 2014). This was calculated by converting the dividend amount to US$ (at the European Central Bank’s 5 January 2015 exchange rate of $1.5223 per £1.00).
In aggregate, Amec Foster Wheeler paid as consideration in the Squeeze-Out Merger £51m ($77m) in cash and issued 4,255,970 Amec Foster Wheeler shares.
The purchase consideration was allocated as follows:
Recognised value
£m
Assets acquired −Liabilities assumed −
Net identifiable assets and liabilities −
Amount recognised in the consolidated statement of changes in equity 75Non-controlling interest acquired 10
85
ConsiderationShares issued 34Cash paid on completion 51
85
Acquisitions in 2014Foster Wheeler BackgroundOn 6 October 2014, the Group launched a public tender offer to acquire the entire issued share capital of Foster Wheeler AG, the ultimate parent company of Foster Wheeler. Pursuant to the tender offer, which closed on 13 November 2014 (the acquisition date), the Group acquired 95.3 per cent of the issued share capital of Foster Wheeler AG.
Consideration payable for the interests in Foster Wheeler acquired by the Group amounted to £1,915m (measured at fair value at the acquisition date), of which £979m was settled in cash, £919m was settled by the issue of ordinary shares and ADSs and £17m was settled by the grant of replacement share options and awards to Foster Wheeler employees.
Due to the relatively short period of time that elapsed between the acquisition date and the completion of the 2014 financial statements, management had not finalised its assessment of the fair values at the acquisition date of certain of Foster Wheeler’s property, plant and equipment, equity-accounted investments, and property-related, legal and environmental obligations and a provisional allocation was reported in the 2014 financial statements. The fair value assessment was completed during 2015.
Notes to the consolidated accounts continued

151Amec Foster Wheeler Annual report and accounts 2015
Fina
ncia
lsG
over
nanc
eS
trat
egic
rep
ort
Ad
dit
iona
l inf
orm
atio
n
24 Acquisitions and disposals continued
Acquisitions in 2014 continuedThe purchase consideration has been allocated as follows:
£m
Identifiable assets acquiredProperty, plant and equipment 111Identifiable intangible assets 742Interests in joint ventures 73Current tax receivable 13Deferred tax assets 27Inventories 11Trade and other receivables 751
– Gross contractual amounts receivable 818– Allowance for doubtful debts (67)
Derivative financial instruments (12)Cash and cash equivalents 265Liabilities assumedBank loans (39)Finance lease obligations (32)Trade and other payables (856)Current tax (65)Retirement benefit liabilities (72)Deferred tax liabilities (113)Provisions (592)
Net identifiable assets acquired 212
Non-controlling interests (23)Goodwill 1,726
Consideration 1,915
Non-controlling interests in Foster Wheeler were measured at their proportionate share of Foster Wheeler’s identifiable assets and liabilities at the acquisition date.
Goodwill of £1,726m has been recognised on the acquisition of Foster Wheeler. Management considers that the goodwill is attributable to the future strategic growth opportunities arising from the acquisition, Foster Wheeler’s highly skilled, customer-oriented and collaborative assembled workforce, the significant cost synergies that are expected to result from the integration of Foster Wheeler with the Group’s existing operations, and the potential for tax synergies. None of the goodwill is expected to be deductible for tax purposes.
Acquisition-related costs relating to the acquisition of Foster Wheeler totalling £33m were recognised within administrative expenses during 2014 .
In the period from its acquisition to 31 December 2014, Foster Wheeler contributed £274m to the Group’s revenue and £1m to the Group’s trading profit. After amortisation, exceptional items and net asbestos related items, Foster Wheeler generated a loss of £44m in the period from acquisition to 31 December 2014.
Management estimated that if Foster Wheeler had been acquired on 1 January 2014, the Group’s revenue for the year would have been £1,814m higher than reported at £5,800m. Management was unable to estimate reliably what the Group’s profit or loss for the year would have been on this basis, principally because it is not practicable to retrospectively apply the significant purchase accounting adjustments that were made to the carrying amounts of the assets and liabilities of Foster Wheeler at its acquisition date and the tax effects of those adjustments.
Changes to the provisional fair value allocationAs discussed above, during 2015 management completed its assessment of the fair values of Foster Wheeler’s assets and liabilities as at the acquisition date resulting in the recognition of an additional goodwill of $245m. The most significant updates were as follows:

152 Amec Foster Wheeler Annual report and accounts 2015
24 Acquisitions and disposals continued
Acquisitions in 2014 continuedLongviewAs previously disclosed, during 2015, the arbitration panel awarded Kvaerner approximately $74m (approximately £48m) in respect of the arbitration with Kvaerner North American Construction Inc arising from GPG’s role in the construction of the Longview power plant in West Virginia, US in 2011. As the contract was complete prior to the acquisition, this award has been fully reflected in the purchase price allocation.
Refinery project arbitration – IndiaAs disclosed in the 2014 financial statements, Foster Wheeler commenced arbitration in India against its client seeking collection of unpaid invoices in connection with the construction of an oil refinery plant in north-eastern India. Its client rejected the claim and submitted significant counterclaims. The provisional purchase price allocation included an allowance against the outstanding debts but, due to the ongoing risks and the passage of time, a further charge of £16m has been made. This represents full provision against the outstanding receivables.
Other project litigationA provision of £33m has been established against costs expected to be disallowed and a potential alleged breach of warranty claim in respect of design work undertaken on a design, build and construct project based in the Southern US.
Management has performed a detailed review of the contracts in the GPG business and made provisions for defect rectification and damages claims totalling £19m across a number of contracts.
A number of smaller provisions (totalling £21m) have been established against specific contact risks.
Receivables and payablesProvision has been made against receivables and unbilled work in progress on a number of contracts (including £10m on one contract) that were outstanding as at the acquisition date and remained uncollected at the end of the hindsight period.
Provision has also been made against an employment tax risk associated with a permanent establishment overseas.
Uncertain tax positionsManagement has reviewed the ongoing tax positions of Foster Wheeler and increased the provisions for uncertain tax positions in a number of jurisdictions. The most significant increases withholding tax on potential deemed distributions.
Property, plant and equipmentThe carrying value of property, plant and equipment has been reviewed resulting in a £9m write down of two properties to their expected market value.
Deferred taxDeferred tax liabilities reduced by £23m. This movement includes a potential tax liability on the future unwind of an overseas branch, as well as the deferred tax impact of the additional adjustments to the purchase price offset by the impact of the finalisation of the intangible asset allocation. The recognition of deferred tax on the purchase price allocation is restricted as a result of uncertainty over future profits and capacity constraints.
RestatementIn addition to the above, the acquisition balance sheet as presented on page 151 has been restated to present liabilities of £65m in respect of onerous leases within trade and other payables. These liabilities had previously been presented within provisions. As part of the finalisation of the acquisition accounting, the acquired intangible assets have been allocated to the relevant jurisdictions resulting in a foreign exchange movement between the acquisition date and 31 December 2014. This is reflected in the restated consolidated statement of changes in equity for 2014.
ScopusOn 15 December 2014, the Group acquired the entire issued share capital of Scopus Group (Holdings) Limited (Scopus) for £68m with £67m paid on completion and £1m deferred for one year. Headquartered in Aberdeen, UK, with bases in international oil and gas hubs, Scopus has around 200 employees who provide specialist engineering services to the global oil and gas, petrochemical and nuclear industries.
Due to the relatively short period of time that had elapsed between the acquisition date and completion of the 2014 financial statements, management had not yet finalised its assessment of the fair values at the acquisition date of 15 December 2014 at the time that the 2014 financial statements were completed. The fair value assessment was completed during 2015, with only minor adjustments to the provisional assessment.
Goodwill of £35m has been recognised on the acquisition which management considers is principally attributable to its skilled workforce which did not meet the criteria for recognition as an intangible asset at the date of acquisition. This specialist expertise will complement Amec Foster Wheeler’s existing project delivery capability across the lifecycle of a project.
Notes to the consolidated accounts continued

153Amec Foster Wheeler Annual report and accounts 2015
Fina
ncia
lsG
over
nanc
eS
trat
egic
rep
ort
Ad
dit
iona
l inf
orm
atio
n
24 Acquisitions and disposals continued
Acquisitions in 2014 continuedSummary of financial effectPurchase consideration was provisionally allocated as follows:
£m
Intangible assets 31Tangible assets 1Trade and other receivables 7Cash and cash equivalents 3Trade and other payables (3)Deferred tax liability (6)
Net identifiable assets and liabilities 33Goodwill on acquisition 35
68Consideration Cash – paid on completion 67
– deferred 1
68
Scopus did not make a material contribution to the Group’s results for the year and would not have done so even if it had been acquired on 1 January 2014.
Acquisitions in 2013 Automated Engineering Services Corp.On 15 November 2013, the Group acquired all of the shares in Automated Engineering Services Corp. (AES) for up to US$35m, of which US$29m (£18m) was paid on completion and up to $6m (£4m) will be paid after three years dependent on the achievement of certain performance targets.
AES is a professional design engineering nuclear services firm based in Naperville, Illinois, US. It provides plant design/modification engineering, engineering analysis, safety, licensing and regulatory services, and engineering programme support to existing nuclear utilities, primarily in the US. We acquired AES to build on the Group’s position in the nuclear industry in the US, allowing us to better serve our clients and providing a strong platform from which to achieve further growth in nuclear services. Goodwill of £12m was recognised on the acquisition of AES.
Purchase consideration was allocated as follows:
£m
Intangible assets 6Trade and other receivables 6Trade and other payables (2)
Net identifiable assets and liabilities 10Goodwill 12
Consideration 22

154 Amec Foster Wheeler Annual report and accounts 2015
25 Commitments
Operating lease commitmentsThe total obligations under non-cancellable operating lease rentals for continuing operations are as follows:
31 December 2015
£m
31 December 2014
£m
In one year or less 86 99Between one and five years 224 249Over five years 75 124
385 472
Amec Foster Wheeler enters into the following types of lease: short-term plant hires; leases for motor vehicles and office equipment with lease periods of two to five years; and longer-term property leases. None of the leases include any contingent rentals.
Finance lease and hire purchase commitmentsThe Group has finance leases and hire purchase contracts for various items of property and deferred payment arrangements which are similar to finance leases for software. These leases have terms of renewal, but no purchase options and escalation clauses. Renewals are at the option of the specific entity that holds the lease. Future minimum lease payments under finance leases and hire purchase contracts together with the present value of the net minimum lease payments are, as follows:
2015 2014
Minimum payments
£m
Present value of payments
£m
Minimum payments
£m
Present value of payments
£m
In one year or less 6 4 12 9Between one and five years 49 42 47 35Over five years 15 13 20 17
Total minimum lease payments 70 59 79 61Less amounts representing finance charges (11) − (18) –
Present value of minimum lease payments 59 59 61 61
26 Contingent liabilities
Legal claims and actionsFrom time to time, the Group is party to litigation involving clients and sub-contractors arising out of project contracts. Such litigation includes claims or actions by and against the Group for cancelled contracts, for additional costs incurred in excess of contract provisions, as well as for back charges for alleged breaches of warranty and other contract commitments. We have recognised provisions for certain known or reasonably likely legal claims or actions against the Group. We do not expect known and reasonably likely legal claims or actions for which a provision has not been established to have a material impact on the Group’s financial position, results of operations or cash flows.
Indemnities and retained obligationsWe have agreed to indemnify certain third parties relating to businesses and/or assets that were previously owned by the Group and were sold to them. Such indemnifications relate primarily to breach of covenants, breach of representations and warranties, as well as potential exposure for retained liabilities, environmental matters and third party claims for activities conducted by the Group prior to the sale of such businesses and/or asset. We have established provisions for those indemnities in respect of which we consider it probable that there will be a successful claim. We do not expect indemnities or retained obligations for which a provision has not been established to have a material impact on the Group’s financial position, results of operations or cash flows.
GuaranteesThe Group has guaranteed certain performance obligations in respect of a refinery/electric power generation plant located in Chile in which we hold a non-controlling interest.
Notes to the consolidated accounts continued

155Amec Foster Wheeler Annual report and accounts 2015
Fina
ncia
lsG
over
nanc
eS
trat
egic
rep
ort
Ad
dit
iona
l inf
orm
atio
n
26 Contingent liabilities continued
Mount PolleyThe Mount Polley mine is owned and operated by Mount Polley Mining Corporation, a subsidiary of Imperial Metals Corporation, and is located near the town of Likely, British Columbia, Canada. On 4 August 2014, a tailings pond facility at the mine failed releasing large quantities of water and mine tailings into the local environment. The dam was in the process of being raised at the time of the failure. One of our subsidiaries, along with other parties, had various design and quality assurance responsibilities associated with the expansion of this facility. Our subsidiary was providing engineering services at the time of the breach, but did not perform the original design.
An Independent Review Panel issued a report on 30 January 2015 concluding that the cause of failure was shearing along a zone containing a weak soil layer along with other contributory factors. On December 17, 2015, the Chief Inspector of Mines for B.C. issued a report that for the most part agrees with the conclusions of the Independent Review Panel. At this time, litigation has been threatened by the Owner of the Mine and its parent company, Imperial Metals Corporation, but no litigation has yet been commenced against the Group. Management’s opinion is that its employees performed in a professional manner consistent with the standard of care for a competent engineer on a project of this nature. In addition, the contract between our subsidiary and Mount Polley Mining Corporation contains limitations of liability provisions that exclude claims for consequential damages and limit the subsidiary’s liability to the amount of professional fees charged, which were less than CDN$1m.
Amec Foster Wheeler is taking external legal advice on this matter. In light of both internal and external advice, and given the early stages of this matter, it is considered possible but not probable that there will be an outflow in respect of this issue.
Tax planningThe Group undertakes tax planning which is compliant with current legislation and accepted practice. Recent changes to the tax environment, including the OECD’s project around Base Erosion and Profit Shifting have brought into question the legitimacy of tax planning previously undertaken by multinational entities. There have been several recent high profile tax cases against tax authorities and large groups. The European Commission has opened formal investigations to examine whether decisions by the tax authorities in certain European countries comply with European Union rules. We are monitoring the outcome of these cases in order to understand whether there is any risk to the Group. Based on the Group’s current assessment of such issues, it is too early to speculate on any areas of challenge and potential liabilities, and as a result, it is not currently considered probable that there will be an outflow in respect of these issues.
27 Related party transactions
During 2015 there were a number of transactions with the senior management group, joint venture entities and subsidiary companies.
Transactions with the senior management groupFollowing the acquisition of Foster Wheeler in late 2014, the senior management group now consists of Amec Foster Wheeler plc board members and the presidents of the Americas, Northern Europe and CIS, Asia Middle East, Africa and Southern Europe, and the Global Power Group.
The senior management group and relatives controlled 0.7% of the voting rights of the company as at 31 December 2015.
In addition to their salaries, the company also provides non-cash benefits to executive directors and other senior managers and they receive share awards under the Performance Share Plan. The company also contributes to a defined benefit plan on behalf of certain executive directors. Details of their compensation are as follows:
2015 £m
2014 £m
Short-term employee benefits 5 5Pension costs – –Equity-settled share-based payments – 1
5 6

156 Amec Foster Wheeler Annual report and accounts 2015
27 Related party transactions continued
Transactions and related balances outstanding with joint venturesThe transactions and related balances outstanding with joint venture entities are as follows:
Value of transactions in the year
Outstanding balance as at 31 December
2015 £m
2014 (restated)
£m 2015
£m
2014 (restated)
£m
Services received 1 − − –Services rendered 28 29 12 12Provision of finance − 9 17 25
The 2014 restatement reflects changes to classifications of related party transactions.
In September 2012, the UK government’s Department for Business, Innovation and Skills announced a change to UK legislation with respect to the requirement for a UK company to be subject to annual audit. An additional audit exemption has been introduced, such that for a subsidiary of a parent established in a European Economic Area state, that subsidiary can be exempt from annual audit if certain conditions are met. The principal conditions are the requirement for the subsidiary’s shareholders to agree to the exemption and a guarantee to be issued to the subsidiary by the parent undertaking, guaranteeing all of the subsidiary’s outstanding liabilities at the year end, until they are satisfied in full.
The Group will be exempting the following companies from an audit in 2015 under Section 479A of the Companies Act 2006, all of which are fully consolidated in these accounts:
Amec Foster Wheeler Finance Asia Limited (Registered number: 6205760)
AMEC Hedge Co 1 Limited (Registered number: 07870120)
AMEC Kazakhstan Holdings Limited (Registered number: 4530056)
Amec Foster Wheeler Property and Overseas Investments Limited (Registered number: 1580678)
AMEC USA Finance Limited (Registered number: 5299446)
AMEC USA Holdings Limited (Registered number: 4041261)
AMEC USA Limited (Registered number: 4044800)
AMEC Wind Developments Limited (Registered number: 8781332)
Ard Ghaoth Wind Farm Limited (Registered number: 7625013)
Auld Clay Wind Farm Limited (Registered number: 7285550)
Castlecary Wind Farm Limited (Registered number: 7611293)
Hilton Wind Farm Limited (Registered number: 7767187)
PI Energy & Emissions Limited (Registered number: SC209704)
Sandiway Solutions (No 3) Limited (Registered number: 5318249)
Sigma Financial Facilities Limited (Registered number: 3863449)
28 Post balance sheet events
RefinancingOn 1 March 2016 the Group completed a refinancing of its main debt facilities by entering into a new facility with a syndicate of 20 banks. The new facility, which has three tranches – a three-year £650m term loan, a five-year £650m term loan and a five-year £400m revolving credit facility – replaces the company’s existing revolving credit facility and the Foster Wheeler acquisition facility.
LongviewIn early March 2016, the Group settled its dispute with Kvaerner as described in note 24. We have agreed to pay Kvaerner $70m in full and final settlement of the claims.
Notes to the consolidated accounts continued

157Amec Foster Wheeler Annual report and accounts 2015
Fina
ncia
lsG
over
nanc
eS
trat
egic
rep
ort
Ad
dit
iona
l inf
orm
atio
n
Note2015 £m
2014 £m
Fixed assetsIntangible assets 2 33 31Tangible assets 3 1 1Investment in subsidiaries 4 4,219 4,480
4,253 4,512
Current assetsDebtors: including amounts falling due after one year of £1,310 m (2014: £1,102 m) 5 1,378 1,149Cash at bank and in hand 41 93
1,419 1,242Current liabilitiesCreditors: amounts falling due within one year 6 (1,661) (2,026)
Net current liabilities (242) (784)
Total assets less current liabilities 4,011 3,728Creditors: amounts falling due after one year 7 (2,091) (1,324)
Net assets 1,920 2,404
Capital and reservesCalled up share capital 8, 9 197 194Share premium account 9 133 101Capital redemption reserve 9 34 34Merger reserve 9 540 877Profit and loss account 9 1,016 1,198
Equity shareholders’ funds 1,920 2,404
The accounts on pages 157 to 165 were approved by the board of directors on 10 March 2016 and were signed on its behalf by:
Ian McHoulChief Financial Officer and interim CEO
Company balance sheetAs at 31 December 2015

158 Amec Foster Wheeler Annual report and accounts 2015
For the year ended 31 December 2015
Share capital
£m
Share premium
£m
Merger reserve
£m
Capital redemption
reserve £m
Profit and loss account
£mTotal
£m
As at 1 January 2015 (restated) 194 101 877 34 1,198 2,404
Loss for the year − − − − (368) (368)
Total comprehensive income for the year − − − − (368) (368)Transfer of losses from the retained earnings to the merger reserve − − (337) − 337 –Dividend − − − − (167) (167)Equity-settled share-based payments − − − − 1 1Utilisation of treasury shares − − − − 15 15Shares issued 3 32 − − − 35
As at 31 December 2015 197 133 540 34 1,016 1,920
For the year ended 31 December 2014
Share capital
£m
Share premium
£m
Merger reserve
£m
Capital redemption
reserve £m
Profit and loss account
£mTotal
£m
As at 1 January 2014 152 101 − 34 1,294 1,581
Loss for the year − − − − (3) (3)
Total comprehensive income for the year − − − − (3) (3)Dividend − − − − (124) (124)Equity-settled share-based payments − − − − 25 25Utilisation of treasury shares − − − − 6 6Shares issued 42 877 − − − 919Transfer to merger reserve − (877) 877 − − −
As at 31 December 2014 (restated) 194 101 877 34 1,198 2,404
Company statement of changes in equity

159Amec Foster Wheeler Annual report and accounts 2015
Fina
ncia
lsG
over
nanc
eS
trat
egic
rep
ort
Ad
dit
iona
l inf
orm
atio
n
1 Accounting policies
Basis of preparationThe accounts have been prepared in accordance with Financial Reporting Standard 101 Reduced Disclosure Framework (FRS 101) and under the historical cost convention, except that derivative financial instruments are stated at fair value, in accordance with applicable accounting standards and the Companies Act 2006.
The company has not presented its own profit and loss account, as permitted by Section 408 of the Companies Act 2006.
The results of Amec Foster Wheeler plc are included in the consolidated accounts of Amec Foster Wheeler plc which are available from Booths Park, Chelford Road, Knutsford, Cheshire, WA16 8QZ.
The accounts are presented in Sterling, rounded to the nearest million.
As the acquisition of Foster Wheeler AG in November 2014 resulted in the Group securing more than 90% of Foster Wheeler’s issued share capital, the acquisition qualifies for merger relief under section 612 of the Companies Act 2006 from crediting the share premium account. As a result the balance sheet at 31 December 2014 has been restated to present the excess of the nominal value of the shares issued of £877m, as a merger reserve.
The company has transitioned to FRS 101 from previously issued UK Generally Accepted Accounting Practice for all periods presented. Transition tables showing all material adjustments are disclosed in note 12. The accounting policies which follow set out those policies which apply in preparing the financial statements for the year ended 31 December 2015.
The company has taken advantage of the following disclosure exemptions under FRS 101:
X the requirements of paragraphs 45(b) and 46-52 of IFRS 2 ‘Share-based Payment’ (details of the number and weighted-average exercise prices of share options, and how the fair value of services received was determined)
X the requirements of IFRS 7 ‘Financial Instruments: Disclosures’
X the requirements of paragraphs 91-99 of IFRS 13 ‘Fair Value Measurement’
X the requirement in paragraph 38 of IAS 1 ‘Presentation of Financial Statements’ to present comparative information in respect of:
– paragraph 79(a)(iv) of IAS 1
– paragraph 73(e) of IAS 16 ‘Property, Plant and Equipment’
– paragraph 118(e) of IAS 38 ‘Intangible Assets’
X the requirements of the following paragraphs of IAS 1 ‘Presentation of Financial Statements’:
– 10(d) (statement of cashflows)
– 10(f) (a statement of financial position as at the beginning of the preceding period when an entity applies an accounting policy retrospectively or makes a retrospective statement of items in its financial statements, or when it reclassifies items in its financial statements)
– 16 (statement of compliance with all IFRSs)
– 38A (requirement for minimum of two primary statements, including cash flow statements)
– 38B-D (additional comparative information)
– 40A-D (requirements for a third statement of financial position)
– 111 (cash flow statement information)
– 134-136 (capital management disclosures
X the requirements of IAS 7 ‘Statement of Cash Flows’
X the requirements of paragraphs 30 and 31 of IAS 8 ‘Accounting Policies, Changes in Accounting Estimates and Errors’ (requirement for the disclosure of information when an entity has not applied a new IFRS that has been issued but is not yet effective)
X the requirements of paragraph 17 of IAS 24 ‘Related Party Disclosures’ (key management compensation)
X the requirements in IAS 24 ‘Related Party Disclosures’ to disclose related party transactions entered into between two or more members of a group, provided that any subsidiary which is a party to the transaction is wholly owned by such a member
Notes to the company accounts

160 Amec Foster Wheeler Annual report and accounts 2015
1 Accounting policies continued
The preparation of accounts in accordance with generally accepted accounting principles requires management to make judgements, estimates and assumptions that affect the application of policies and reported amounts of assets and liabilities, income and expenses. The estimates and associated assumptions are based on historical experience and various other factors that are believed to be reasonable under the circumstances, the results of which form the basis of making judgements about carrying values of assets and liabilities that are not readily apparent from other sources. Actual results may differ from these estimates.
The estimates and underlying assumptions are reviewed on an ongoing basis. Revisions to accounting estimates are recognised in the period in which the estimate is revised if the revision affects only that period, or in the period of the revision and future periods if the revision affects both current and future periods.
Amec Foster Wheeler believe some of these policies require a high level of judgement, and the most critical accounting policies and significant areas of judgement and estimation arise from:
Impairment of investments in subsidiaries.
Determining whether the company’s investments in subsidiaries have been impaired requires estimations of the investments’ values in use. The value in use calculations require the entity to estimate the future cash flows expected to arise from the investments and suitable discount rates in order to calculate present values. The carrying amount of investments in subsidiaries at the balance sheet date was £4,219m (2014: £4,480m) with an impairment loss of £351m recognised in 2015 (2014: £nil).
Dividend incomeDividend income is recognised when the right to receive payment is established.
Financial instrumentsFinancial instruments are initially recorded at fair value. Subsequent valuation depends on the designation of the instrument and is as described in note 1 to the consolidated financial statements.
Foreign currenciesTransactions in a currency other than Sterling are translated to Sterling at the exchange rate ruling at the date of the transaction. Monetary assets and liabilities denominated in foreign currencies are translated into Sterling at rates of exchange ruling at the balance sheet date and exchange differences are taken to the profit and loss account in the year. Non-monetary assets and liabilities are measured in terms of historical cost and are translated using the exchange rate at the date of the transaction.
Intangible assetsIntangible assets are measured at cost less accumulated amortisation and impairment losses.
Amortisation is charged to the income statement on a straight line basis over the estimated useful lives of intangible assets, from the date they are available for use. The estimated useful lives of intangible assets held at 31 December 2015 are as follows:
Software Three to seven years
InterestInterest is recognised in profit or loss on an accruals basis using the effective interest method.
InvestmentsInvestments are stated at cost less impairment losses. Where equity-settled share-based payments are granted to the employees of subsidiary companies, the fair value of the award is treated as a capital contribution by the company and the investments in subsidiaries are adjusted to reflect this capital contribution.
PensionsThe company participates in the Amec Staff and Executive defined benefit pension schemes. The assets of these schemes are held separately from those of the company. As there is no contractual agreement or stated policy for charging the net defined benefit cost to individual Group entities, the company has recognised a cost equal to the contributions payable to the schemes in respect of the accounting period.
Details of the defined benefit schemes can be found in note 14 of the consolidated accounts.
Contributions to the defined contribution schemes are recognised in profit or loss in the period in which they become payable.
Tangible assetsProperty, plant and equipment is measured at cost less accumulated depreciation and impairment losses.
Depreciation is provided on all property, plant and equipment at rates calculated to write off the cost, less estimated residual value, of each asset on a straight line basis over its estimated useful life. The estimated useful lives as at 31 December 2015 are as follows:
Plant and equipment Three to five years
Notes to the company accounts continued

161Amec Foster Wheeler Annual report and accounts 2015
Fina
ncia
lsG
over
nanc
eS
trat
egic
rep
ort
Ad
dit
iona
l inf
orm
atio
n
1 Accounting policies continued
Remuneration of auditorsThe detailed information concerning auditors’ remuneration is shown in note 4 of the consolidated accounts.
Share-based paymentsThere are share-based payment arrangements which allow Amec Foster Wheeler employees to acquire Amec Foster Wheeler shares; these awards are granted by Amec Foster Wheeler. The fair value of awards granted is recognised as a cost of employment with a corresponding increase in equity. The fair value is measured at grant date and spread over the period during which the employees become unconditionally entitled to the award. The fair value of the award is measured using a valuation model, taking into account the terms and conditions upon which the awards were granted. The amount recognised as a cost is adjusted to reflect the actual number of shares that vest except where non-vesting is due to share prices not achieving the threshold for vesting.
TaxationThe charge for taxation is based on the results for the year and takes into account taxation deferred because of temporary differences between the treatment of certain items for taxation and accounting purposes.
Deferred tax is recognised, without discounting, in respect of all temporary differences between the treatment of certain items for taxation and accounting purposes which have arisen but not reversed by the balance sheet date, except as otherwise required by IAS 12 ‘Income Taxes’.
2 Intangible assets
Software £m
CostAs at 1 January 2015 41Additions 9
As at 31 December 2015 50
AmortisationAs at 1 January 2015 10Provided during the year 7
As at 31 December 2015 17
Net book valueAs at 31 December 2015 33
As at 1 January 2015 31
3 Tangible assets
Plant and equipment
£m
CostAs at 1 January 2015 4Additions −
As at 31 December 2015 4
DepreciationAs at 1 January 2015 3Provided during the year −
As at 31 December 2015 3
Net book valueAs at 31 December 2015 1
As at 1 January 2015 1

162 Amec Foster Wheeler Annual report and accounts 2015
4 Investments (non-current)
Shares in subsidiaries
£m
Amounts owed by
subsidiaries £m
Total investment in
subsidiaries £m
CostAs at 1 January 2015 4,062 464 4,526Additions 90 − 90
As at 31 December 2015 4,152 464 4,616
ProvisionsAs at 1 January 2015 46 − 46Additions 351 − 351
As at 31 December 2015 397 – 397
Net book valueAs at 31 December 2015 3,755 464 4,219
As at 1 January 2015 4,016 464 4,480
Group companies are listed on pages 194 to 201.
5 Debtors
31 December 2015
£m
31 December 2014
£m
Debtors: amounts falling due within one yearAmounts owed by subsidiaries 6 5Derivative financial instruments 33 13Corporation tax 21 24Prepayments and accrued income 8 5
68 47Debtors: amounts falling due after one yearDerivative financial instruments 19 2Amounts owed by subsidiaries 1,291 1,100
1,378 1,149
The deferred tax balance is analysed as follows:
31 December 2015
£m
31 December 2014
£m
Difference between accumulated depreciation and capital allowances (1) (1)Tax losses 1 –Share-based schemes − 1
– –
In his budget speech on 8 July 2015, the UK Chancellor of the Exchequer announced reductions in the rate of UK corporation tax from 20% to 19% on 1 April 2017 and 18% on 1 April 2020.
As at 31 December 2015, the reductions in the rate of corporation tax to 19% and 18% had been substantively enacted.
Notes to the company accounts continued

163Amec Foster Wheeler Annual report and accounts 2015
Fina
ncia
lsG
over
nanc
eS
trat
egic
rep
ort
Ad
dit
iona
l inf
orm
atio
n
6 Creditors: amounts falling due within one year
31 December 2015
£m
31 December 2014
£m
Bank overdrafts 12 8Bank and other loans 673 693Trade creditors 42 37Derivative financial instruments 33 12Amounts owed to subsidiaries 901 1,276
1,661 2,026
The company has committed banking facilities of £1,741m (2014: £1,826m). This consists of a £377m multi-currency revolving facility that was taken out on 18 July 2012. The facility is committed for five years and is available for general corporate purposes. In addition on 13 February 2014 the company entered into acquisition facilities totalling $2,260m (£1,449m). This comprises of the following:
X$830m (£563m) bridge facility which matures 5 August 2016 with a further six month extension at the company’s option
X$830m (£563m) term loan maturing in equal instalments in 2017, 2018 and 2019
X$350m (£237m) revolving credit facility maturing May 2016
As at 31 December 2015, £1,236m (2014: £1,230m) of the loans and facilities were utilised by way of debt and £62m (2014: £159m) was utilised by way of Letter of Credit.
On 1 March 2016, the Company entered into a new syndicated facility comprising of three tranches; a three-year £650m term loan, a five-year £650m term loan and a five-year £400m revolving credit facility. The new facility replaces the Company’s existing £377m revolving credit facility and the Foster Wheeler acquistion facility of $2.26bn.
7 Creditors: amounts falling due after one year
31 December 2015
£m
31 December 2014
£m
Amounts owed to subsidiaries 1,509 794Bank and other loans 563 528Derivative financial instruments 19 2
2,091 1,324
8 Share capital
The share capital of the company comprises ordinary shares of 50 pence each. All the ordinary shares rank pari passu in all respects. To the company’s knowledge and belief, there are no restrictions on the transfer of shares in the company or on voting rights between holders of shares.
31 December 2015
£m
31 December 2014
£m
Allotted, called up and fully paid ordinary shares of 50 pence each 197 194
The movement in issued share capital during the year was as follows:
Number £m
As at 1 January 2015 388,875,843 194Shares issued 4,255,970 3
As at 31 December 2015 393,131,813 197
Share-based paymentDetails of share-based payment schemes operated by the company are provided in note 22 to the consolidated accounts.

164 Amec Foster Wheeler Annual report and accounts 2015
9 Reserves
Movements in reserves are shown in the company statement of changes in equity on page 158.
Details of dividends approved by the company and paid during the year are disclosed in note 22 to the consolidated accounts.
During 2012 Amec Foster Wheeler plc generated a significant profit from an internal restructuring. This becomes distributable as qualifying consideration is passed to Amec Foster Wheeler plc. As at 31 December 2015, £564m of reserves are considered to be distributable.
The company’s loss for the year in 2015 was £368m.
10 Contingent liabilities
Guarantees and indemnitiesGuarantees given by the company in respect of borrowings of subsidiaries amounted to £nil as at 31 December 2015 (2014: £nil).
In addition, the company is party to cross-guarantee arrangements relating to overdrafts for certain Group companies. The maximum gross exposure as at 31 December 2015 was £79m (2014: £94m).
The company will guarantee the debts and liabilities of the following UK subsidiaries in accordance with Section 479C of the Companies Act 2006:
Amec Foster Wheeler Finance Asia Limited (Registered number: 6205760)
Amec Foster Wheeler Property And Overseas Investments Limited (Registered number: 1580678)
AMEC Hedge Co 1 Limited (Registered number: 07870120)
AMEC Kazakhstan Holdings Limited (Registered number: 4530056)
AMEC USA Finance Limited (Registered number: 5299446)
AMEC USA Holdings Limited (Registered number: 4041261)
AMEC USA Limited (Registered number: 4044800)
AMEC Wind Developments Limited (Registered number: 8781332)
Ard Ghaoth Wind Farm Limited (Registered number: 7625013)
Auld Clay Wind Farm Limited (Registered number: 7285550)
Castlecary Wind Farm Limited (Registered number: 7611293)
Hilton Wind Farm Limited (Registered number: 7767187)
PI Energy Emissions Limited (Registered number: SC209704)
Sandiway Solutions (No 3) Limited (Registered number: 5318249)
Sigma Financial Facilities Limited (Registered number: 3863449)
The company has assessed the probability of loss under these guarantees as remote.
Notes to the company accounts continued

165Amec Foster Wheeler Annual report and accounts 2015
Fina
ncia
lsG
over
nanc
eS
trat
egic
rep
ort
Ad
dit
iona
l inf
orm
atio
n
11 Related party transactions
During the year the only related party transactions for which disclosure is required under IAS 24 ‘Related Party Disclosures’ were with the senior management group. As allowed by IAS 24 transactions with wholly owned subsidiary undertakings are not disclosed.
Transactions with the senior management groupThe senior management group of the company consists of Amec Foster Wheeler plc board members.
The senior management group of the company and their immediate relatives controlled 0.65% of the voting rights of the company as at 31 December 2015.
Details of directors’ remuneration are provided in the Directors’ remuneration report on pages 67 to 80.
12 Transition to FRS 101
For all years up to the year ended 31 December 2014, the company prepared its accounts in accordance with previously issued United Kingdom generally accepted accounting practice (UK GAAP). For the year ended 31 December 2015, the company has transitioned to FRS 101.
In preparing these accounts, the company has started from an opening balance sheet as at 1 January 2014, the company’s date of transition to FRS 101, and made those changes in accounting policies and other restatements required for the first-time adoption of FRS 101. This note explains the principal adjustments made by the company in restating its balance sheet as at 1 January 2014 prepared under previously issued UK GAAP and its previously published UK GAAP accounts for the year ended 31 December 2014.
On transition to FRS 101, the company has applied the requirements of paragraphs 6-33 of IFRS 1 ‘First time adoption of International Financial Reporting Standards’.
Restatements required on transition from UK GAAP to FRS 101Reclassification of software assetsPreviously under UK GAAP, software development costs were capitalised as tangible assets. Under FRS 101, these costs meet the criteria for capitalisation as intangible assets under IAS 38 ‘Intangible Assets’ and as such have been reclassified from tangible assets to intangible assets in the balance sheets as at 1 January 2014 (£26m) and 31 December 2014 (£31m).