independent auditor's report - do it best do it best... · independent auditor's report...
TRANSCRIPT
INDEPENDENT AUDITOR'S REPORT
To the Board of Directors and Member-ShareholdersDo it Best Corp.Fort Wayne, Indiana
REPORT ON THE FINANCIAL STATEMENTSWe have audited the accompanying consolidated fi nancial statements of Do it Best Corp., which comprise the consolidated balance sheets as of June 27, 2015 and June 28, 2014, and the related consolidated statements of income, comprehensive income (loss), changes in shareholders’ equity, and cash fl ows for each of the three years in the period ended June 27, 2015, and the related notes to the fi nancial statements.
MANAGEMENT’S RESPONSIBILITY FOR THE FINANCIAL STATEMENTSManagement is responsible for the preparation and fair presentation of these consolidated fi nancial statements in accordance with accounting principles generally accepted in the United States of America; this includes the design, implementation, and maintenance of internal control relevant to the preparation and fair presentation of consolidated fi nancial statements that are free from material misstatement, whether due to fraud or error.
AUDITOR’S RESPONSIBILITYOur responsibility is to express an opinion on these consolidated fi nancial statements based on our audits. We conducted our audits in accordance with auditing standards generally accepted in the United States of America. Those standards require that we plan and perform the audit to obtain reasonable assurance about whether the consolidated fi nancial statements are free from material misstatement.
An audit involves performing procedures to obtain audit evidence about the amounts and disclosures in the consolidated fi nancial statements. The procedures selected depend on the auditor’s judgment, including the assessment of the risks of material misstatement of the consolidated fi nancial statements, whether due to fraud or error. In making those risk assessments, the auditor considers internal control relevant to the entity’s preparation and fair presentation of the consolidated fi nancial statements in order to design audit procedures that are appropriate in the circumstances, but not for the purpose of expressing an opinion on the effectiveness of the entity’s internal control. Accordingly, we express no such opinion. An audit also includes evaluating the appropriateness of accounting policies used and the reasonableness of signifi cant accounting estimates made by management, as well as evaluating the overall presentation of the consolidated fi nancial statements.
We believe that the audit evidence we have obtained is suffi cient and appropriate to provide a basis for our audit opinion.
OPINIONIn our opinion, the consolidated fi nancial statements referred to above present fairly, in all material respects, the fi nancial position of Do it Best Corp. as of June 27, 2015 and June 28, 2014, and the results of its operations and its cash fl ows for each of the three years in the period ended June 27, 2015 in accordance with accounting principles generally accepted in the United States of America.
Crowe Horwath LLPFort Wayne, IndianaSeptember 10, 2015
31
CONSOLIDATEDBALANCE SHEETSSee accompanying notes to the consolidated fi nancial statements
2015 2014
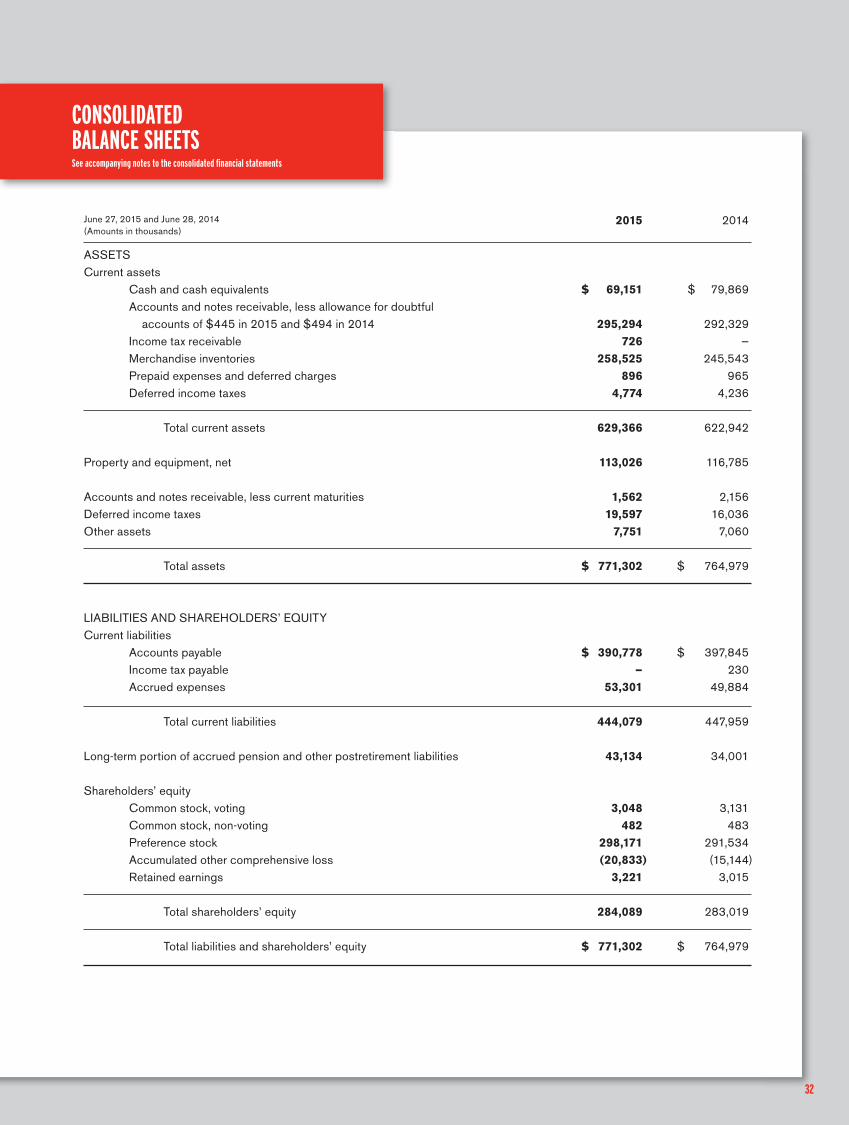
ASSETSCurrent assets Cash and cash equivalents $ 69,151 $ 79,869 Accounts and notes receivable, less allowance for doubtful accounts of $445 in 2015 and $494 in 2014 295,294 292,329 Income tax receivable 726 — Merchandise inventories 258,525 245,543 Prepaid expenses and deferred charges 896 965 Deferred income taxes 4,774 4,236
Total current assets 629,366 622,942
Property and equipment, net 113,026 116,785
Accounts and notes receivable, less current maturities 1,562 2,156Deferred income taxes 19,597 16,036Other assets 7,751 7,060
Total assets $ 771,302 $ 764,979
LIABILITIES AND SHAREHOLDERS’ EQUITYCurrent liabilities Accounts payable $ 390,778 $ 397,845 Income tax payable — 230 Accrued expenses 53,301 49,884
Total current liabilities 444,079 447,959
Long-term portion of accrued pension and other postretirement liabilities 43,134 34,001
Shareholders’ equity Common stock, voting 3,048 3,131 Common stock, non-voting 482 483 Preference stock 298,171 291,534 Accumulated other comprehensive loss (20,833 ) (15,144 ) Retained earnings 3,221 3,015
Total shareholders’ equity 284,089 283,019
Total liabilities and shareholders’ equity $ 771,302 $ 764,979
June 27, 2015 and June 28, 2014(Amounts in thousands)
32
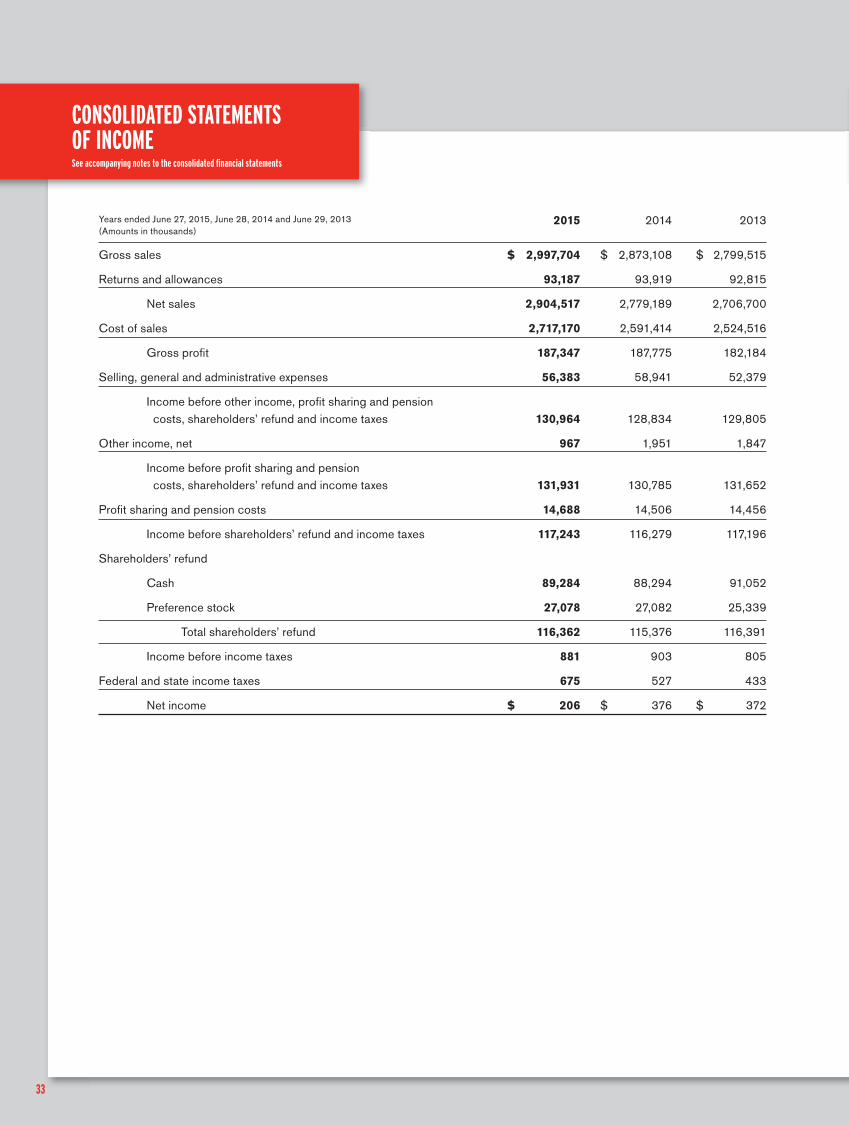
2015 2014 2013
Gross sales $ 2,997,704 $ 2,873,108 $ 2,799,515
Returns and allowances 93,187 93,919 92,815
Net sales 2,904,517 2,779,189 2,706,700
Cost of sales 2,717,170 2,591,414 2,524,516
Gross profi t 187,347 187,775 182,184
Selling, general and administrative expenses 56,383 58,941 52,379
Income before other income, profi t sharing and pension costs, shareholders’ refund and income taxes 130,964 128,834 129,805
Other income, net 967 1,951 1,847
Income before profi t sharing and pension costs, shareholders’ refund and income taxes 131,931 130,785 131,652
Profi t sharing and pension costs 14,688 14,506 14,456
Income before shareholders’ refund and income taxes 117,243 116,279 117,196
Shareholders’ refund
Cash 89,284 88,294 91,052
Preference stock 27,078 27,082 25,339
Total shareholders’ refund 116,362 115,376 116,391
Income before income taxes 881 903 805
Federal and state income taxes 675 527 433
Net income $ 206 $ 376 $ 372
Years ended June 27, 2015, June 28, 2014 and June 29, 2013 (Amounts in thousands)
CONSOLIDATED STATEMENTS OF INCOMESee accompanying notes to the consolidated fi nancial statements
33
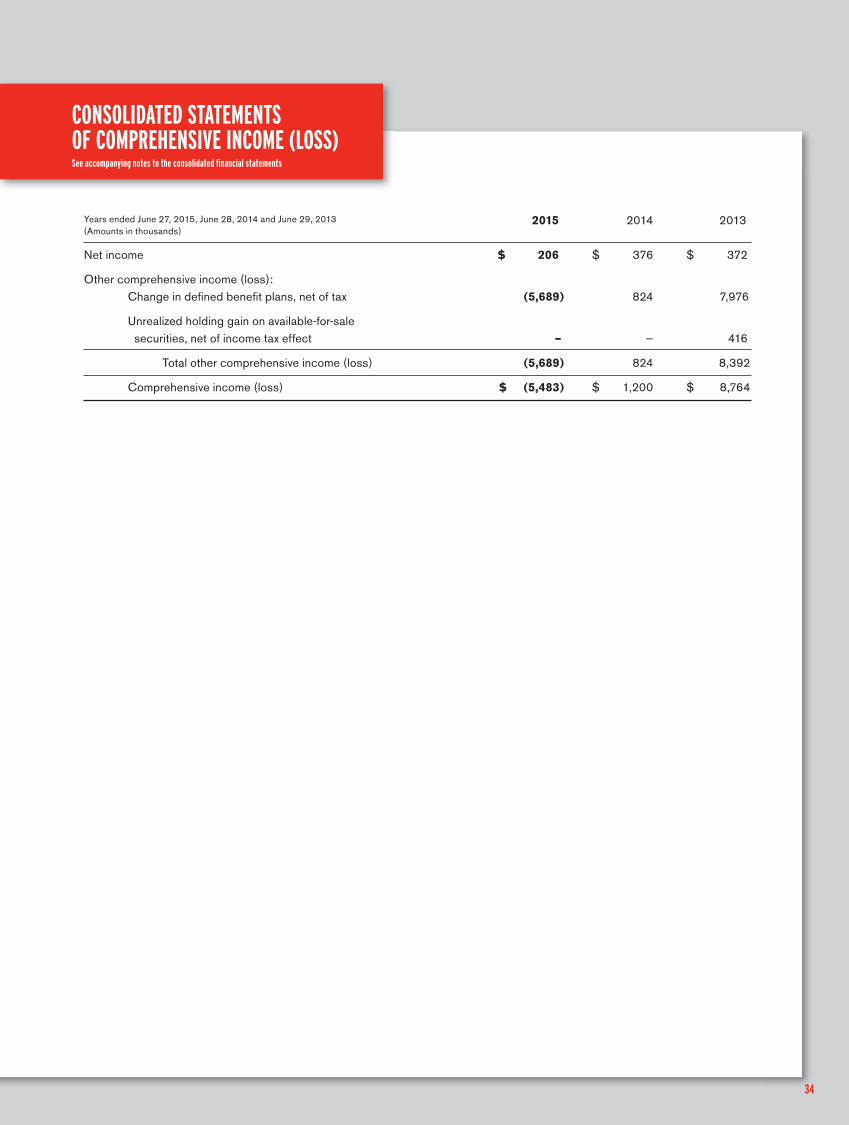
CONSOLIDATED STATEMENTS OF COMPREHENSIVE INCOME (LOSS)See accompanying notes to the consolidated fi nancial statements
2015 2014 2013
Net income $ 206 $ 376 $ 372
Other comprehensive income (loss): Change in defi ned benefi t plans, net of tax (5,689) 824 7,976
Unrealized holding gain on available-for-sale securities, net of income tax effect – — 416
Total other comprehensive income (loss) (5,689) 824 8,392
Comprehensive income (loss) $ (5,483) $ 1,200 $ 8,764
Years ended June 27, 2015, June 28, 2014 and June 29, 2013 (Amounts in thousands)
34
35
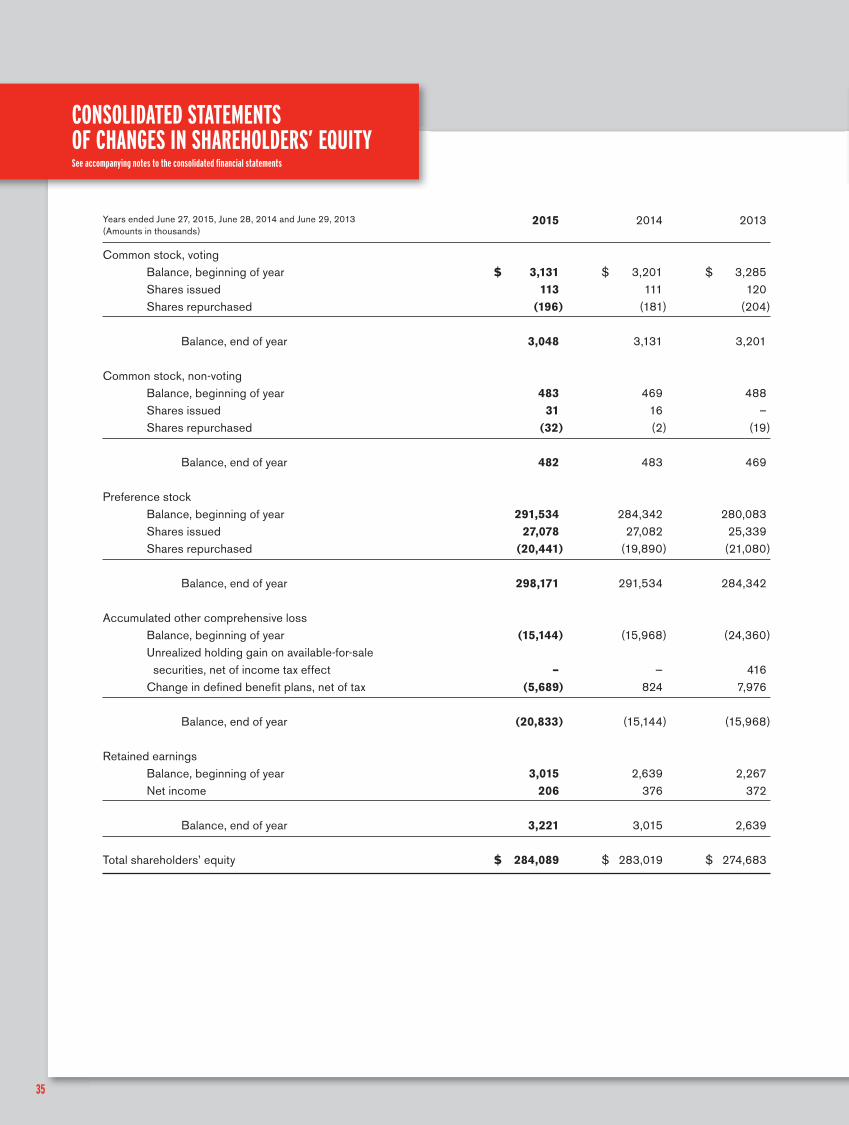
CONSOLIDATED STATEMENTS OF CHANGES IN SHAREHOLDERS’ EQUITYSee accompanying notes to the consolidated fi nancial statements
2015 2014 2013
Common stock, voting Balance, beginning of year $ 3,131 $ 3,201 $ 3,285 Shares issued 113 111 120 Shares repurchased (196) (181) (204)
Balance, end of year 3,048 3,131 3,201
Common stock, non-voting Balance, beginning of year 483 469 488 Shares issued 31 16 – Shares repurchased (32) (2) (19)
Balance, end of year 482 483 469
Preference stock Balance, beginning of year 291,534 284,342 280,083 Shares issued 27,078 27,082 25,339 Shares repurchased (20,441) (19,890) (21,080)
Balance, end of year 298,171 291,534 284,342
Accumulated other comprehensive loss Balance, beginning of year (15,144) (15,968) (24,360) Unrealized holding gain on available-for-sale securities, net of income tax effect – — 416 Change in defi ned benefi t plans, net of tax (5,689 ) 824 7,976
Balance, end of year (20,833) (15,144) (15,968)
Retained earnings Balance, beginning of year 3,015 2,639 2,267 Net income 206 376 372
Balance, end of year 3,221 3,015 2,639
Total shareholders’ equity $ 284,089 $ 283,019 $ 274,683
Years ended June 27, 2015, June 28, 2014 and June 29, 2013 (Amounts in thousands)
36
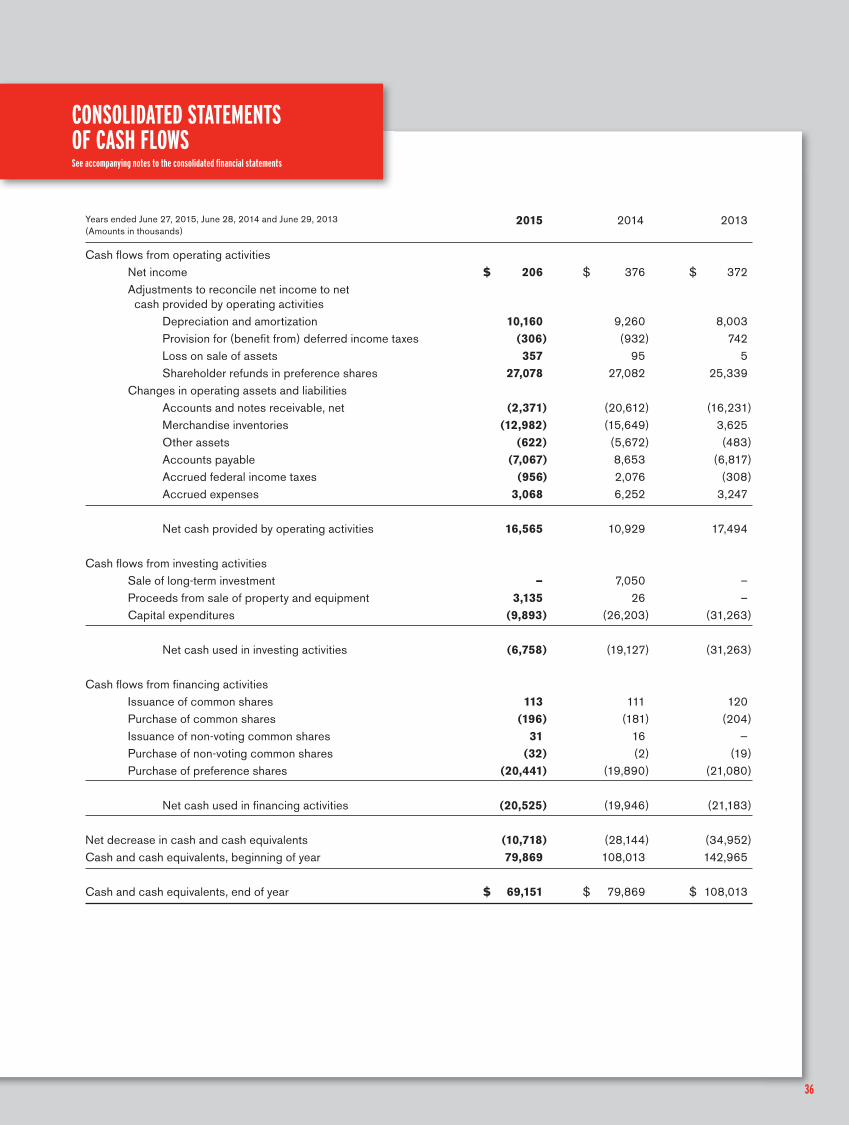
CONSOLIDATED STATEMENTS OF CASH FLOWSSee accompanying notes to the consolidated fi nancial statements
2015 2014 2013
Cash fl ows from operating activities Net income $ 206 $ 376 $ 372 Adjustments to reconcile net income to net cash provided by operating activities Depreciation and amortization 10,160 9,260 8,003 Provision for (benefi t from) deferred income taxes (306) (932 ) 742 Loss on sale of assets 357 95 5 Shareholder refunds in preference shares 27,078 27,082 25,339 Changes in operating assets and liabilities Accounts and notes receivable, net (2,371) (20,612) (16,231 ) Merchandise inventories (12,982) (15,649 ) 3,625 Other assets (622) (5,672) (483) Accounts payable (7,067 ) 8,653 (6,817 ) Accrued federal income taxes (956 ) 2,076 (308) Accrued expenses 3,068 6,252 3,247
Net cash provided by operating activities 16,565 10,929 17,494
Cash fl ows from investing activities Sale of long-term investment — 7,050 – Proceeds from sale of property and equipment 3,135 26 – Capital expenditures (9,893) (26,203) (31,263)
Net cash used in investing activities (6,758) (19,127) (31,263)
Cash fl ows from fi nancing activities Issuance of common shares 113 111 120 Purchase of common shares (196) (181) (204) Issuance of non-voting common shares 31 16 — Purchase of non-voting common shares (32) (2) (19) Purchase of preference shares (20,441) (19,890) (21,080)
Net cash used in fi nancing activities (20,525) (19,946) (21,183)
Net decrease in cash and cash equivalents (10,718) (28,144) (34,952 )Cash and cash equivalents, beginning of year 79,869 108,013 142,965
Cash and cash equivalents, end of year $ 69,151 $ 79,869 $ 108,013
Years ended June 27, 2015, June 28, 2014 and June 29, 2013 (Amounts in thousands)
37
NOTES TO THE CONSOLIDATED FINANCIAL STATEMENTS
NOTE 1SUMMARY OF SIGNIFICANT ACCOUNTING POLICIES
Principles of consolidation: The consolidated fi nancial statements include the accounts of Do it Best Corp. and its wholly-owned subsidiaries (the “Company” or “Do it Best”). All signifi cant intercompany accounts and transactions have been eliminated in consolidation.
Nature of operations: Do it Best is a member-owned wholesaler of hardware, lumber, builder supplies and related products, operating as a wholesaler cooperative. Members are located principally in the United States, with some member locations abroad. Only dealers in hardware, lumber, builder supplies and related products are eligible to hold shares in the Company. Nearly all of the Company’s sales are to dealer-members, each of whom is required to purchase twenty voting common shares at $50 per share on becoming a member and, in some cases, shares of non-voting common stock.
Fiscal year: The Company’s fi scal year consists of 52 or 53 weeks ending on the last Saturday in June. A fi fty-third week will be added every fi ve or six years. All references to “2015”, “2014” and “2013” relate to the fi scal years ended June 27, 2015, June 28, 2014 and June 29, 2013, respectively.
Capital structure: The Company’s capital is primarily derived from the issuance of voting common shares together with the preference shares issued in connection with the Company’s annual shareholders’ refund. The Articles of Incorporation require that each member shareholder accept preference shares in payment of refunds, under requirements of the formula set forth in the By-Laws, and the payment of at least twenty percent in cash.
Upon a member’s termination of membership with the Company and demand for repurchase, the Company will repurchase the voting and/or non-voting common shares held by such shareholder at the lesser of cost or book value. After a holder of voting or non-voting common shares requests repurchase of those shares concurrently with termination of their relationship with the Company as a member-shareholder, the Board of Directors may also authorize repurchase of the preference shares held by such shareholder, subject to statutory and By-Law restrictions, in sequence of termination, at the discretion of the Board of Directors.
Upon request of a shareholder, the Company may redeem part of a shareholder’s preference shares where such shareholder has experienced a substantial uninsured fi nancial loss through catastrophe, or where the member presents a plan for a new retail business. Any request is subject to standards and limitations imposed by the Board of Directors or the Company.
Upon liquidation of the Company for any reason, the holders of the preference shares shall be entitled to receive out of the assets of the Company the sum of $100 per share before any distribution is made to the holders of voting and non-voting common shares.
Shareholder refund: At the end of each fi scal year, the Company is obligated to refund to its member-shareholders the gross profi t on sales of merchandise to the member-shareholders, less all operating expenses. Refunds are required to be made to each member-shareholder in the proportion of the gross profi t on purchases to the total gross profi t on purchases made by all member-shareholders, adjusted for participation in the Enhanced Rebate program. Total cash shareholder refunds to be paid approximated $89,300, $88,300 and $91,100 in 2015, 2014 and in 2013, respectively. These amounts are currently included in accounts payable. The Company also issued preference stock shareholder refunds of approximately $27,100, $27,100 and $25,300 in 2015, 2014 and in 2013, respectively. These amounts are included in equity.
Use of estimates: Preparation of the consolidated fi nancial statements in conformity with accounting principles generally accepted in the United States of America requires management to make estimates and assumptions that affect the reported amounts of assets and liabilities and disclosure of contingent assets and liabilities at the date of the consolidated fi nancial statements and the reported amounts of revenues and expenses during the reporting period. Actual results could differ from these estimates, making it reasonably possible that a change in certain of these estimates could occur in the near term. Certain signifi cant estimates and assumptions used in the preparation of the Company’s consolidated fi nancial statements include those used for: pension and postretirement benefi t plans; allowances for doubtful accounts; and inventory valuation.
Years ended June 27, 2015, June 28, 2014 and June 29, 2013 (Amounts in thousands, except share data)
38
NOTES TO THE CONSOLIDATED FINANCIAL STATEMENTS
NOTE 1: Continued
Income taxes and uncertain tax positions: The Company accounts for income taxes under the asset and liability method. The Company’s taxable income is determined after deducting refunds to member-shareholders. Deferred tax assets and liabilities are recognized for operating loss and tax credit carryforwards and for the estimated future tax consequences attributable to differences between consolidated fi nancial statement reporting basis of existing assets and liabilities and their respective income tax basis. Deferred tax assets and liabilities are measured using enacted tax rates anticipated to be in effect for the year in which those temporary differences are expected to be recovered or settled. The measurement of deferred tax assets is adjusted by a valuation allowance, if necessary, to recognize, based on available evidence, the future tax benefi ts that will more likely than not be realized.
The Company accounts for uncertainty in income taxes under the provisions of Accounting Standards Codifi cation (“ASC”) 740. A tax position is recognized as a benefi t only if it is “more likely than not” that the tax position would be sustained in a tax examination, with a tax examination being presumed to occur. The amount recognized is the largest amount of tax benefi t that is greater than 50% likely of being realized on examination. For tax positions not meeting the “more likely than not” test, no tax benefi t is recorded. Management is not aware of any uncertain tax positions. The Company is no longer subject to examination by taxing authorities for years before June 30, 2012.
The Company is subject to U.S. federal income tax, as well as various state income taxes. The Company does not expect the total amount of unrecognized tax benefi ts to signifi cantly change in the next 12 months. The Company recognizes interest and/or penalties related to income tax matters in income tax expense. The Company did not have any amounts accrued for interest and penalties at June 27, 2015 and June 28, 2014, respectively.
Inventory valuation: Merchandise inventories are valued at the lower of cost or market, with cost determined on a fi rst-in, fi rst-out (FIFO) basis. Do it Best enters into various purchase rebate programs with vendors, pursuant to binding arrangements. Where the rebate or incentive is probable and estimable, it is recognized as a reduction to cost of each underlying transaction. If a rebate is not probable or reasonably estimable, such rebates are recognized on their achievement.
Shipping and handling fees and costs: The Company includes shipping and handling fees billed to members in gross sales. Shipping and handling costs associated with inbound freight are included in cost of sales.
Comprehensive income (loss): Comprehensive income (loss) is a more inclusive measurement of results, including items that are not recognized in the measurement of net income (loss). Comprehensive income (loss) represents the change in the Company’s defi ned pension plans and the change in unrealized gains and losses on securities available for sale.
Accounts receivable and revenue recognition: Do it Best sells to members using credit terms customary in its industry. The Company determines delinquent accounts in accordance with sales terms. When an invoice becomes delinquent, it is generally subject to interest at 1.5% per month. Approximately $3,751 and $4,140 of recorded trade receivables, past due by 90 days, were accruing interest in 2015 and 2014, respectively. Management establishes a reserve for losses on its accounts based on historic loss experience and current economic conditions. Losses are charged against the reserve when management deems further collection efforts will not produce additional recoveries. Do it Best has the right to set off amounts owing by the Company to its members against indebtedness owed the Company by its members.
Revenues from the sale of warehoused merchandise to members are generally recognized when goods are shipped. Sales revenues for goods acquired and sold to members under drop-ship arrangements with vendors are generally recognized in accordance with vendor terms as to title and risk of loss passage. The Company provides cooperative advertising, among other services, to its members. Revenues for such services are recognized when the services are rendered.
Years ended June 27, 2015, June 28, 2014 and June 29, 2013 (Amounts in thousands, except share data)

39
NOTE 1: Continued
Fair value of fi nancial instruments: The Company follows guidance in ASC 820 which defi nes fair value, establishes a framework for measuring fair value and expands disclosures about fair value measurements. This requirement establishes a fair value hierarchy regarding the assumptions used to measure fair value and clarifi es assumptions about risk and the effect of a restriction on the sale or use of an asset. This fair value hierarchy requires an entity to maximize the use of observable inputs and minimize the use of unobservable inputs when measuring fair value. The requirement describes three levels of inputs that may be used to measure fair value. See Notes 8 and 10 for further discussion.
The fair value of cash and cash equivalents, accounts and notes receivable and accounts payable approximates carrying value because of the short-term maturities of these fi nancial instruments, or underlying interest rates, where applicable, approximate market for the same or similar issues.
Cash and cash equivalents: The Company considers all highly liquid investments purchased with an initial maturity of three months or less to be cash equivalents. The Company places its cash with high credit quality fi nancial institutions. Cash balances generally exceed insurance provided on such deposits.
Property and equipment: Property and equipment are stated at cost. Upon retirement or sale of assets, the cost of the disposed assets and related accumulated depreciation are removed from the accounts, and any resulting gain or loss is credited or charged to income, respectively. Major additions and improvements are capitalized, while minor items, maintenance and repairs are expensed currently. Depreciation and amortization are calculated using straight-line methods. Estimated useful lives range from fi fteen to forty years for building and improvements, and from three to ten years for equipment and fi xtures.
Included in property and equipment is the capitalized cost of internal-use software. The Company capitalizes costs incurred during the application development stage of internal-use software and amortizes these costs over its estimated useful life. Costs incurred related to design or maintenance of internal-use software are expensed as incurred. For 2015 and 2014, the Company capitalized approximately $5,175 and $2,083, respectively, of software development costs which consisted of both internally developed and purchased software costs. Amortization expense for these capitalized amounts were $2,745 and $2,277 for 2015 and 2014, respectively.
The Company evaluates long-lived assets, such as property and equipment, for impairment whenever events or changes in circumstances indicate that the carrying amount of an asset may not be recoverable. Recoverability of assets to be held and used is measured by a comparison of the carrying amount of an asset to estimated undiscounted future cash fl ows expected to be generated by the asset. If the carrying amount of an asset exceeds its estimated future cash fl ows, an impairment charge is recognized in the amount by which the carrying amount of the asset exceeds its fair value. The Company has not incurred any impairment of long-lived assets during 2015 or 2014.
Advertising and promotion costs: Costs associated with advertising and promotions are charged to operations in the period incurred. The Company participates in cooperative advertising arrangements with its vendors. Reimbursements received under cooperative advertising arrangements with vendors are recognized as a reduction of associated advertising costs. Advertising and promotion costs charged to operations in 2015, 2014 and 2013 were $16,399, $16,806 and $18,511, respectively.
NOTES TO THE CONSOLIDATED FINANCIAL STATEMENTS
Years ended June 27, 2015, June 28, 2014 and June 29, 2013 (Amounts in thousands, except share data)
40
NOTES TO THE CONSOLIDATED FINANCIAL STATEMENTS
Years ended June 27, 2015, June 28, 2014 and June 29, 2013 (Amounts in thousands, except share data)
NOTE 1: Continued
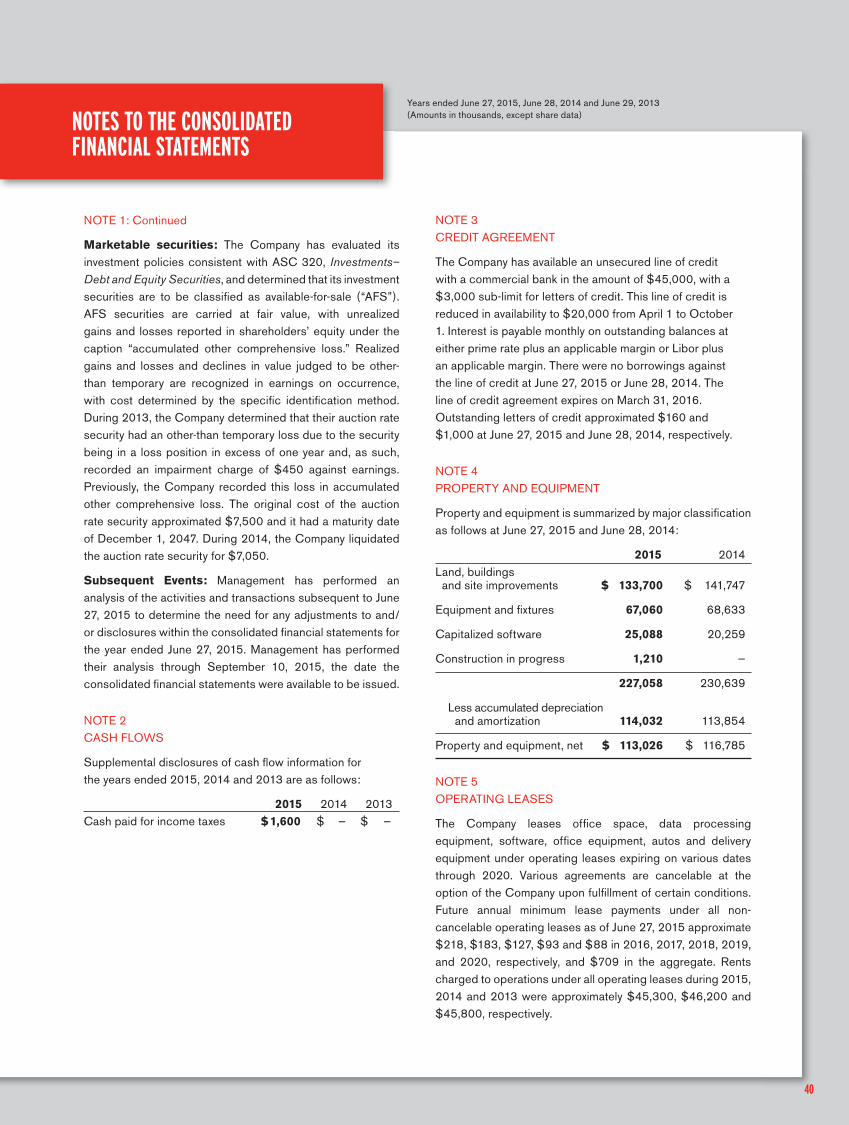
Marketable securities: The Company has evaluated its investment policies consistent with ASC 320, Investments–Debt and Equity Securities, and determined that its investment securities are to be classifi ed as available-for-sale (“AFS”). AFS securities are carried at fair value, with unrealized gains and losses reported in shareholders’ equity under the caption “accumulated other comprehensive loss.” Realized gains and losses and declines in value judged to be other-than temporary are recognized in earnings on occurrence, with cost determined by the specifi c identifi cation method. During 2013, the Company determined that their auction rate security had an other-than temporary loss due to the security being in a loss position in excess of one year and, as such, recorded an impairment charge of $450 against earnings. Previously, the Company recorded this loss in accumulated other comprehensive loss. The original cost of the auction rate security approximated $7,500 and it had a maturity date of December 1, 2047. During 2014, the Company liquidated the auction rate security for $7,050.
Subsequent Events: Management has performed an analysis of the activities and transactions subsequent to June 27, 2015 to determine the need for any adjustments to and/or disclosures within the consolidated fi nancial statements for the year ended June 27, 2015. Management has performed their analysis through September 10, 2015, the date the consolidated fi nancial statements were available to be issued.
NOTE 2CASH FLOWS
Supplemental disclosures of cash fl ow information for the years ended 2015, 2014 and 2013 are as follows:
2015 2014 2013Cash paid for income taxes $ 1,600 $ — $ —
NOTE 3CREDIT AGREEMENT
The Company has available an unsecured line of credit with a commercial bank in the amount of $45,000, with a $3,000 sub-limit for letters of credit. This line of credit is reduced in availability to $20,000 from April 1 to October 1. Interest is payable monthly on outstanding balances at either prime rate plus an applicable margin or Libor plus an applicable margin. There were no borrowings against the line of credit at June 27, 2015 or June 28, 2014. The line of credit agreement expires on March 31, 2016. Outstanding letters of credit approximated $160 and $1,000 at June 27, 2015 and June 28, 2014, respectively.
NOTE 4PROPERTY AND EQUIPMENT
Property and equipment is summarized by major classifi cation as follows at June 27, 2015 and June 28, 2014:
2015 2014Land, buildings and site improvements $ 133,700 $ 141,747
Equipment and fi xtures 67,060 68,633
Capitalized software 25,088 20,259
Construction in progress 1,210 —
227,058 230,639
Less accumulated depreciation and amortization 114,032 113,854
Property and equipment, net $ 113,026 $ 116,785
NOTE 5OPERATING LEASES
The Company leases offi ce space, data processing equipment, software, offi ce equipment, autos and delivery equipment under operating leases expiring on various dates through 2020. Various agreements are cancelable at the option of the Company upon fulfi llment of certain conditions. Future annual minimum lease payments under all non-cancelable operating leases as of June 27, 2015 approximate $218, $183, $127, $93 and $88 in 2016, 2017, 2018, 2019, and 2020, respectively, and $709 in the aggregate. Rents charged to operations under all operating leases during 2015, 2014 and 2013 were approximately $45,300, $46,200 and $45,800, respectively.

41
NOTES TO THE CONSOLIDATED FINANCIAL STATEMENTS
Years ended June 27, 2015, June 28, 2014 and June 29, 2013 (Amounts in thousands, except share data)
NOTE 6CAPITAL STOCK SHARE DATA
Share data relevant to amounts reported in the consolidated statements of shareholders’ equity is as follows:
2015 2014 2013
Common stock, voting $50 par value, 990,000 shares authorized: Shares outstanding, beginning of year 62,620 64,020 65,700 Shares issued 2,260 2,220 2,400 Shares repurchased (3,920 ) (3,620 ) (4,080 )
Shares outstanding, end of year 60,960 62,620 64,020
Common stock, non-voting $50 par value, 100,000 shares authorized: Shares outstanding, beginning of year 9,650 9,370 9,750 Shares issued 620 310 — Shares repurchased (640 ) (30 ) (380 )
Shares outstanding, end of year 9,630 9,650 9,370
Preference shares, $100 par value, 4,000,000 shares authorized: Shares outstanding, beginning of year 2,915,335 2,843,422 2,800,829 Shares issued 270,776 270,818 253,389 Shares repurchased (204,402 ) (198,905 ) (210,796 )
Shares outstanding, end of year 2,981,709 2,915,335 2,843,422
NOTE 7TRANSACTIONS WITH UNCONSOLIDATED EQUITY AFFILIATE
Do it Best is a 50% stakeholder in Alliance International, LLC (“the Alliance”), a hardware and related products purchasing consortium consisting of Do it Best and an unrelated party engaged in the distribution and sale of hardware and related products. The Alliance procures vendor purchase contracts to enable vendor pricing on a larger scale than that which would be available to the individual companies. Virtually all purchases made by Do it Best are transacted through the Alliance.
Do it Best provides certain management services, including accounting assistance to the Alliance, for which the Alliance reimburses Do it Best in accordance with the management services arrangement. The parties share in the expenses of the Alliance proportionate to their benefi t received. During 2015, 2014 and 2013, Do it Best was charged $231, $167 and $150, respectively, by the Alliance for administrative costs. Do it Best was paid $39, $37 and $35, respectively, in 2015, 2014 and 2013 for management services rendered to the Alliance.
42
NOTES TO THE CONSOLIDATED FINANCIAL STATEMENTS
Years ended June 27, 2015, June 28, 2014 and June 29, 2013 (Amounts in thousands, except share data)
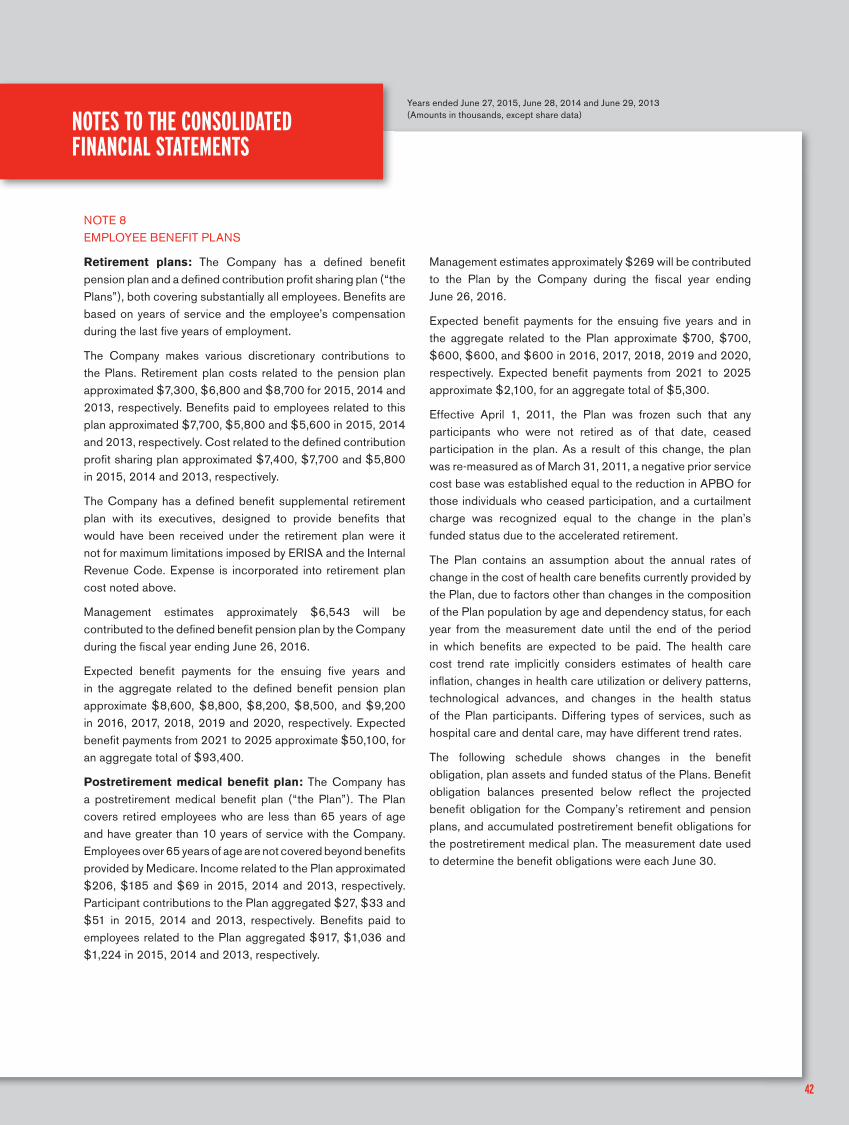
NOTE 8EMPLOYEE BENEFIT PLANS
Retirement plans: The Company has a defi ned benefi t pension plan and a defi ned contribution profi t sharing plan (“the Plans”), both covering substantially all employees. Benefi ts are based on years of service and the employee’s compensation during the last fi ve years of employment.
The Company makes various discretionary contributions to the Plans. Retirement plan costs related to the pension plan approximated $7,300, $6,800 and $8,700 for 2015, 2014 and 2013, respectively. Benefi ts paid to employees related to this plan approximated $7,700, $5,800 and $5,600 in 2015, 2014 and 2013, respectively. Cost related to the defi ned contribution profi t sharing plan approximated $7,400, $7,700 and $5,800 in 2015, 2014 and 2013, respectively.
The Company has a defi ned benefi t supplemental retirement plan with its executives, designed to provide benefi ts that would have been received under the retirement plan were it not for maximum limitations imposed by ERISA and the Internal Revenue Code. Expense is incorporated into retirement plan cost noted above.
Management estimates approximately $6,543 will be contributed to the defi ned benefi t pension plan by the Company during the fi scal year ending June 26, 2016.
Expected benefi t payments for the ensuing fi ve years and in the aggregate related to the defi ned benefi t pension plan approximate $8,600, $8,800, $8,200, $8,500, and $9,200 in 2016, 2017, 2018, 2019 and 2020, respectively. Expected benefi t payments from 2021 to 2025 approximate $50,100, for an aggregate total of $93,400.
Postretirement medical benefi t plan: The Company has a postretirement medical benefi t plan (“the Plan”). The Plan covers retired employees who are less than 65 years of age and have greater than 10 years of service with the Company. Employees over 65 years of age are not covered beyond benefi ts provided by Medicare. Income related to the Plan approximated $206, $185 and $69 in 2015, 2014 and 2013, respectively. Participant contributions to the Plan aggregated $27, $33 and $51 in 2015, 2014 and 2013, respectively. Benefi ts paid to employees related to the Plan aggregated $917, $1,036 and $1,224 in 2015, 2014 and 2013, respectively.
Management estimates approximately $269 will be contributed to the Plan by the Company during the fi scal year ending June 26, 2016.
Expected benefi t payments for the ensuing fi ve years and in the aggregate related to the Plan approximate $700, $700, $600, $600, and $600 in 2016, 2017, 2018, 2019 and 2020, respectively. Expected benefi t payments from 2021 to 2025 approximate $2,100, for an aggregate total of $5,300.
Effective April 1, 2011, the Plan was frozen such that any participants who were not retired as of that date, ceased participation in the plan. As a result of this change, the plan was re-measured as of March 31, 2011, a negative prior service cost base was established equal to the reduction in APBO for those individuals who ceased participation, and a curtailment charge was recognized equal to the change in the plan’s funded status due to the accelerated retirement.
The Plan contains an assumption about the annual rates of change in the cost of health care benefi ts currently provided by the Plan, due to factors other than changes in the composition of the Plan population by age and dependency status, for each year from the measurement date until the end of the period in which benefi ts are expected to be paid. The health care cost trend rate implicitly considers estimates of health care infl ation, changes in health care utilization or delivery patterns, technological advances, and changes in the health status of the Plan participants. Differing types of services, such as hospital care and dental care, may have different trend rates.
The following schedule shows changes in the benefi t obligation, plan assets and funded status of the Plans. Benefi t obligation balances presented below refl ect the projected benefi t obligation for the Company’s retirement and pension plans, and accumulated postretirement benefi t obligations for the postretirement medical plan. The measurement date used to determine the benefi t obligations were each June 30.

43
NOTES TO THE CONSOLIDATED FINANCIAL STATEMENTS
Years ended June 27, 2015, June 28, 2014 and June 29, 2013 (Amounts in thousands, except share data)
NOTE 8: Continued
Retirement and Pension Plan Postretirement Medical Plan
2015 2014 2013 2015 2014 2013
Change in benefi t obligation: Beginning balance $ 108,314 $ 98,386 $ 101,221 $ 5,861 $ 6,863 $ 8,120
Service cost 6,623 5,880 6,222 – – –
Interest cost 4,837 4,530 4,242 240 279 301
Plan participants’ contributions – – – 27 33 51
Actuarial (gain)/loss 5,211 5,275 (7,695 ) 327 (278 ) (385 )
Benefi ts paid (7,719 ) (5,757 ) (5,604 ) (917 ) (1,036 ) (1,224 )
Ending balance $ 117,266 $ 108,314 $ 98,386 $ 5,538 $ 5,861 $ 6,863
Change in plan assets:
Beginning balance at fair value $ 77,507 $ 65,405 $ 61,744 $ 1,720 $ 2,055 $ 2,074
Actual return on plan assets 566 10,129 7,153 72 286 215
Company contributions 6,967 7,730 2,112 173 382 939
Plan participants’ contributions – – – 27 33 51
Benefi ts paid (7,719 ) (5,757 ) (5,604 ) (917 ) (1,036 ) (1,224 )
Ending balance at fair value $ 77,321 $ 77,507 $ 65,405 $ 1,075 $ 1,720 $ 2,055
Under funded status $ (39,945 ) $ (30,807 ) $ (32,981 ) $ (4,463 ) $ (4,141 ) $ (4,808 )
Amounts recognized in statement of fi nancial position consist of:
Current liabilities $ (1,005 ) $ (667 ) $ (792 ) $ (269 ) $ (280 ) $ (314 )
Non-current liabilities (38,940 ) (30,140 ) (32,189 ) (4,194 ) (3,861 ) (4,494 )
Net liability recognized in balance sheet $ (39,945 ) $ (30,807 ) $ (32,981 ) $ (4,463 ) $ (4,141 ) $ (4,808 )
44
NOTES TO THE CONSOLIDATED FINANCIAL STATEMENTS
Years ended June 27, 2015, June 28, 2014 and June 29, 2013 (Amounts in thousands, except share data)
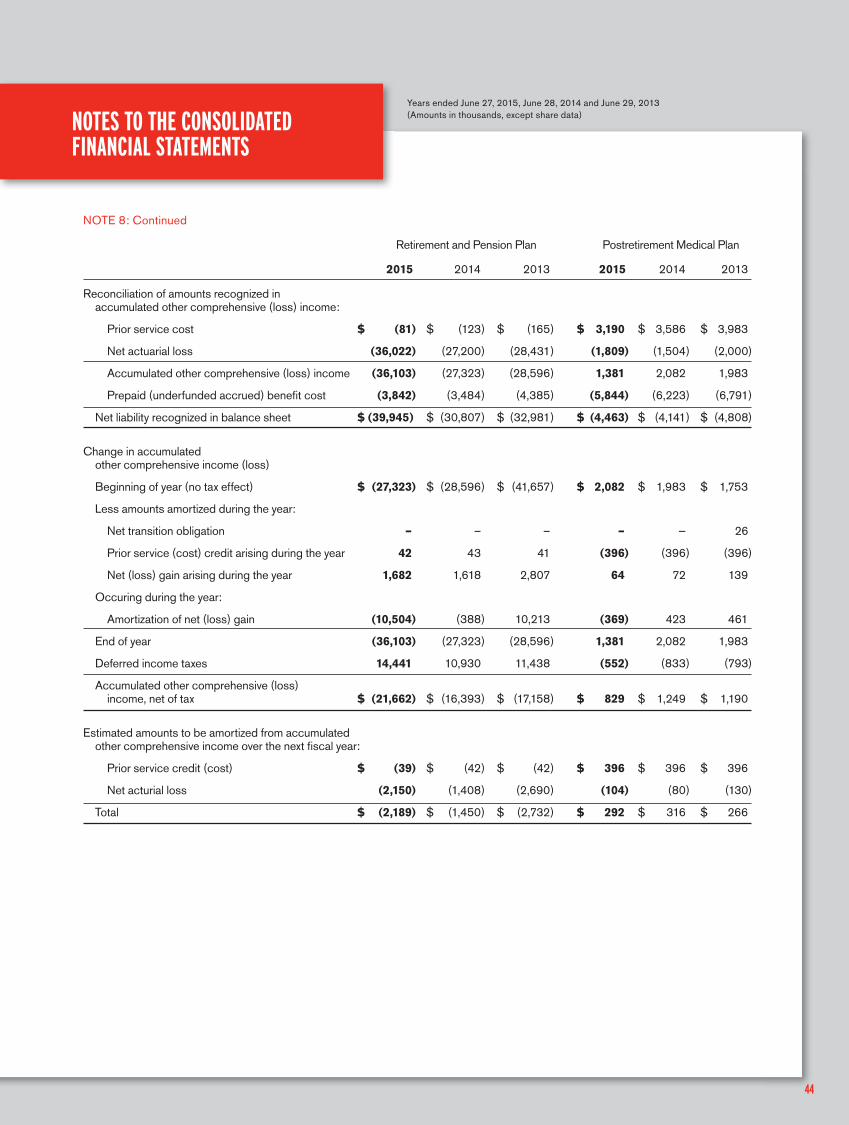
NOTE 8: Continued
Retirement and Pension Plan Postretirement Medical Plan
2015 2014 2013 2015 2014 2013
Reconciliation of amounts recognized in accumulated other comprehensive (loss) income:
Prior service cost $ (81 ) $ (123 ) $ (165 ) $ 3,190 $ 3,586 $ 3,983
Net actuarial loss (36,022 ) (27,200 ) (28,431 ) (1,809 ) (1,504 ) (2,000 )
Accumulated other comprehensive (loss) income (36,103 ) (27,323 ) (28,596 ) 1,381 2,082 1,983
Prepaid (underfunded accrued) benefi t cost (3,842 ) (3,484 ) (4,385 ) (5,844 ) (6,223 ) (6,791 )
Net liability recognized in balance sheet $ (39,945) $ (30,807 ) $ (32,981 ) $ (4,463 ) $ (4,141 ) $ (4,808 )
Change in accumulated other comprehensive income (loss)
Beginning of year (no tax effect) $ (27,323 ) $ (28,596 ) $ (41,657 ) $ 2,082 $ 1,983 $ 1,753
Less amounts amortized during the year:
Net transition obligation – – – – — 26
Prior service (cost) credit arising during the year 42 43 41 (396 ) (396 ) (396 )
Net (loss) gain arising during the year 1,682 1,618 2,807 64 72 139
Occuring during the year:
Amortization of net (loss) gain (10,504 ) (388 ) 10,213 (369 ) 423 461
End of year (36,103 ) (27,323 ) (28,596 ) 1,381 2,082 1,983
Deferred income taxes 14,441 10,930 11,438 (552 ) (833 ) (793 )
Accumulated other comprehensive (loss) income, net of tax $ (21,662 ) $ (16,393 ) $ (17,158 ) $ 829 $ 1,249 $ 1,190
Estimated amounts to be amortized from accumulated other comprehensive income over the next fi scal year:
Prior service credit (cost) $ (39 ) $ (42 ) $ (42 ) $ 396 $ 396 $ 396
Net acturial loss (2,150 ) (1,408 ) (2,690 ) (104 ) (80 ) (130 )
Total $ (2,189 ) $ (1,450 ) $ (2,732 ) $ 292 $ 316 $ 266
45
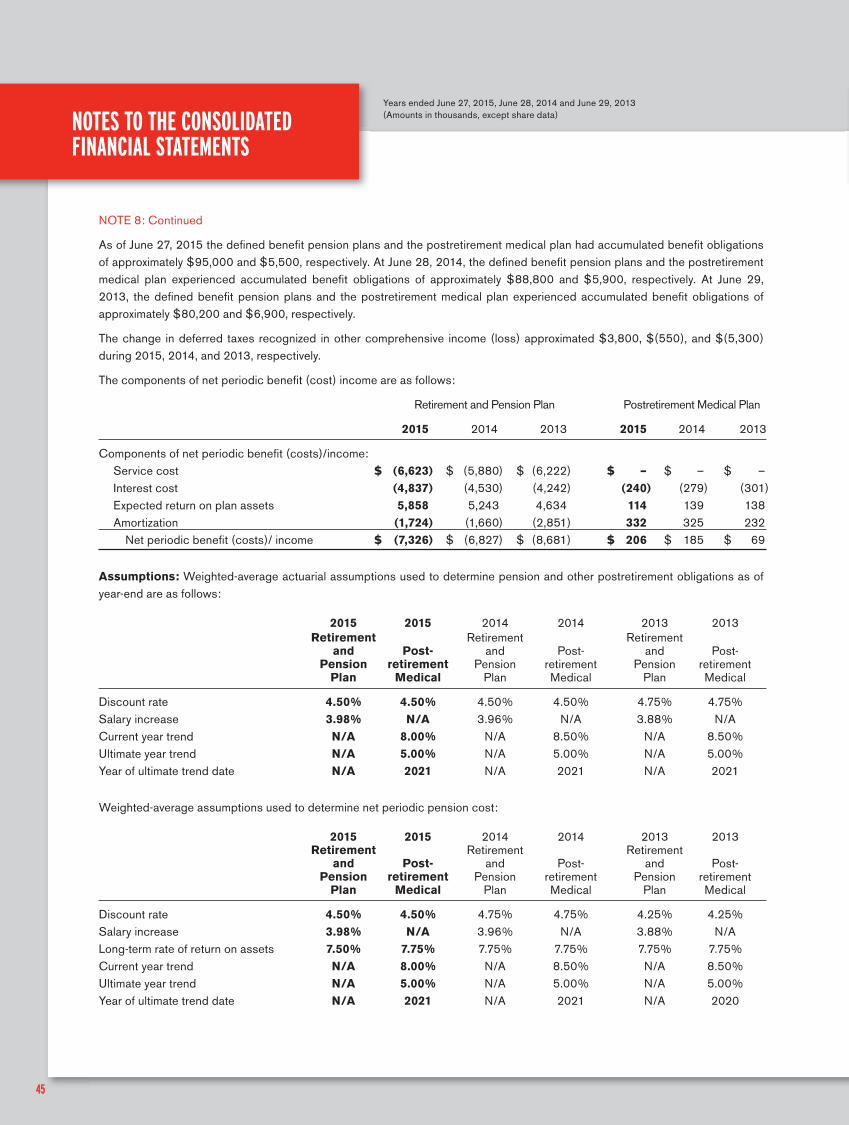
NOTE 8: Continued
As of June 27, 2015 the defi ned benefi t pension plans and the postretirement medical plan had accumulated benefi t obligations of approximately $95,000 and $5,500, respectively. At June 28, 2014, the defi ned benefi t pension plans and the postretirement medical plan experienced accumulated benefi t obligations of approximately $88,800 and $5,900, respectively. At June 29, 2013, the defi ned benefi t pension plans and the postretirement medical plan experienced accumulated benefi t obligations of approximately $80,200 and $6,900, respectively.
The change in deferred taxes recognized in other comprehensive income (loss) approximated $3,800, $(550), and $(5,300) during 2015, 2014, and 2013, respectively.
The components of net periodic benefi t (cost) income are as follows:
Retirement and Pension Plan Postretirement Medical Plan
2015 2014 2013 2015 2014 2013
Components of net periodic benefi t (costs)/income: Service cost $ (6,623 ) $ (5,880 ) $ (6,222 ) $ – $ – $ – Interest cost (4,837 ) (4,530 ) (4,242 ) (240 ) (279 ) (301 ) Expected return on plan assets 5,858 5,243 4,634 114 139 138 Amortization (1,724 ) (1,660 ) (2,851 ) 332 325 232 Net periodic benefi t (costs)/ income $ (7,326 ) $ (6,827 ) $ (8,681 ) $ 206 $ 185 $ 69
Assumptions: Weighted-average actuarial assumptions used to determine pension and other postretirement obligations as of year-end are as follows:
2015 2015 2014 2014 2013 2013 Retirement Retirement Retirement and Post- and Post- and Post- Pension retirement Pension retirement Pension retirement Plan Medical Plan Medical Plan Medical
Discount rate 4.50% 4.50% 4.50% 4.50% 4.75% 4.75%Salary increase 3.98% N/A 3.96% N/A 3.88% N/ACurrent year trend N/A 8.00% N/A 8.50% N/A 8.50%Ultimate year trend N/A 5.00% N/A 5.00% N/A 5.00%Year of ultimate trend date N/A 2021 N/A 2021 N/A 2021
Weighted-average assumptions used to determine net periodic pension cost:
2015 2015 2014 2014 2013 2013 Retirement Retirement Retirement and Post- and Post- and Post- Pension retirement Pension retirement Pension retirement Plan Medical Plan Medical Plan Medical
Discount rate 4.50% 4.50% 4.75% 4.75% 4.25% 4.25%Salary increase 3.98% N/A 3.96% N/A 3.88% N/ALong-term rate of return on assets 7.50% 7.75% 7.75% 7.75% 7.75% 7.75%Current year trend N/A 8.00% N/A 8.50% N/A 8.50%Ultimate year trend N/A 5.00% N/A 5.00% N/A 5.00%Year of ultimate trend date N/A 2021 N/A 2021 N/A 2020
NOTES TO THE CONSOLIDATED FINANCIAL STATEMENTS
Years ended June 27, 2015, June 28, 2014 and June 29, 2013 (Amounts in thousands, except share data)

46
NOTE 8: Continued
Plan Assets: The investment policy and strategy is to invest plan assets in order to provide income and capital growth consistent with reasonable risk tolerance. In determining pension expense, the Company, as fi duciary of the Plan, utilizes an expected long-term rate of return that, over time, should approximate the actual long-term rate of return earned on plan assets, based upon historical returns of plan assets and similar asset classes. The assumed rate for the long-term return on plan assets was determined based upon target asset allocations and expected long-term rates of return by asset class. Plan fi duciaries set investment policies and strategies for the trust. Long-term strategic investment objectives include preserving the funded status of the plan and balancing risk and return. The plan fi duciaries oversee the investment allocation process, which includes selecting investment managers, setting long-term strategic targets and monitoring asset allocations. Target allocation ranges are guidelines, not limitations, and occasionally plan fi duciaries will approve allocations above or below a target range.
All Plans’ assets are composed primarily of corporate equity and debt securities and U.S. government securities and, depending on the plan, are directed either by the employer (the defi ned benefi t pension plan and the postretirement medical benefi t plan) or employee (the defi ned contribution profi t sharing plan). The defi ned benefi t pension plan and the postretirement medical benefi t plan assets held consisted of the following at June 27, 2015, and June 28, 2014:
2015 2014
Retirement Post- Retirement Post- and retirement and retirement Target Allocation: Pension Plan Medical Target Allocation: Pension Plan Medical
Equity securities 58% 62% 62% 58% 70% 56%Debt securities 34% 31% 31% 34% 23% 31%Other 8% 7% 7% 8% 7% 13%Total 100% 100% 100% 100% 100% 100%
Financial Accounting Standards Board (“FASB”) ASC 820-10, Fair Value Measurements and Disclosures, establishes a framework and provides guidance on measuring the fair value of assets in a pension plan and how an employer should disclose the same. The framework establishes a fair value hierarchy that prioritizes the inputs to the valuation techniques used to measure fair value.
The three levels of fair value hierarchy are described as follows:
Level 1: Quoted prices (unadjusted) or identical assets or liabilities in active markets that the entity has the ability to access as of the measurement date.
Level 2: Signifi cant other observable inputs other than Level 1 prices such as quoted prices for similar assets or liabilities; quoted prices in markets that are not active; or other inputs that are observable or can be corroborated by observable market data.
Level 3: Signifi cant unobservable inputs that refl ect a company’s own assumptions about the assumptions that market participants would use in pricing an asset or liability.
NOTES TO THE CONSOLIDATED FINANCIAL STATEMENTS
Years ended June 27, 2015, June 28, 2014 and June 29, 2013 (Amounts in thousands, except share data)
47
NOTES TO THE CONSOLIDATED FINANCIAL STATEMENTS
Years ended June 27, 2015, June 28, 2014 and June 29, 2013 (Amounts in thousands, except share data)
NOTE 8: Continued
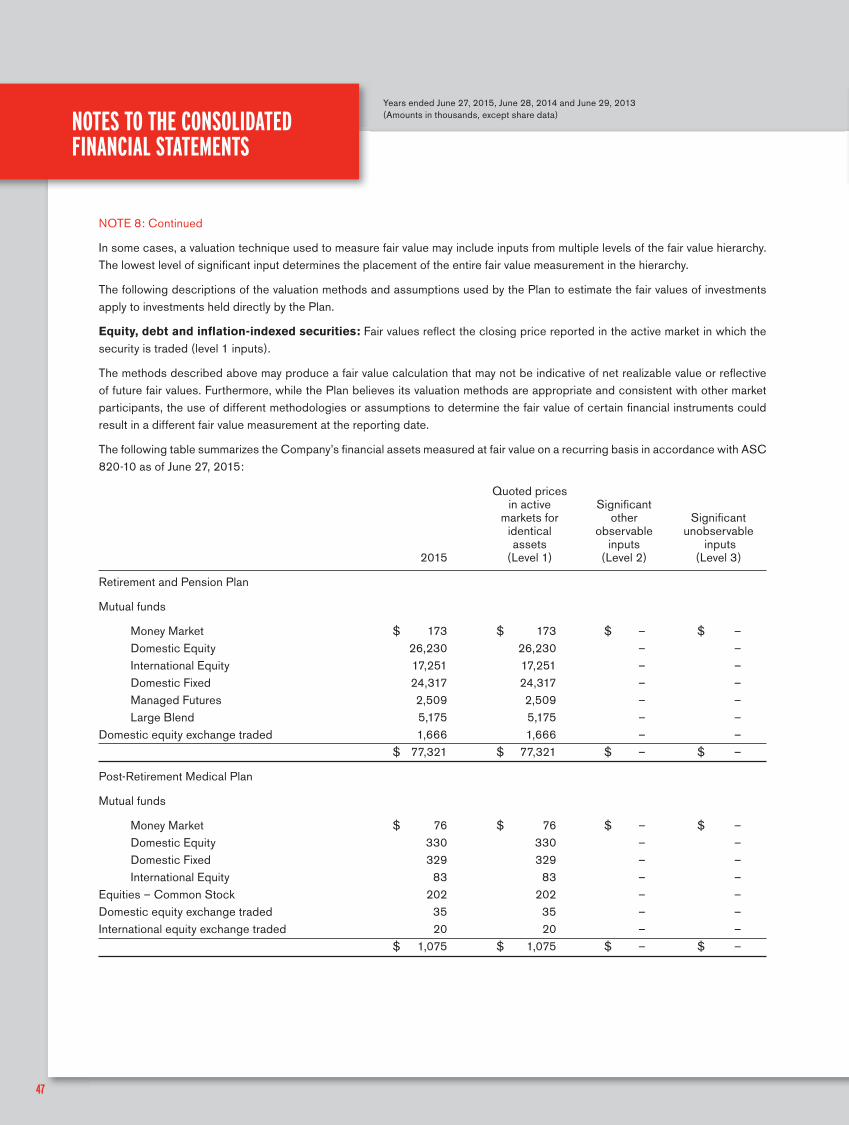
In some cases, a valuation technique used to measure fair value may include inputs from multiple levels of the fair value hierarchy. The lowest level of signifi cant input determines the placement of the entire fair value measurement in the hierarchy.
The following descriptions of the valuation methods and assumptions used by the Plan to estimate the fair values of investments apply to investments held directly by the Plan.
Equity, debt and infl ation-indexed securities: Fair values refl ect the closing price reported in the active market in which the security is traded (level 1 inputs).
The methods described above may produce a fair value calculation that may not be indicative of net realizable value or refl ective of future fair values. Furthermore, while the Plan believes its valuation methods are appropriate and consistent with other market participants, the use of different methodologies or assumptions to determine the fair value of certain fi nancial instruments could result in a different fair value measurement at the reporting date.
The following table summarizes the Company’s fi nancial assets measured at fair value on a recurring basis in accordance with ASC 820-10 as of June 27, 2015:
Quoted prices in active Signifi cant markets for other Signifi cant identical observable unobservable assets inputs inputs 2015 (Level 1) (Level 2) (Level 3)
Retirement and Pension Plan
Mutual funds
Money Market $ 173 $ 173 $ – $ – Domestic Equity 26,230 26,230 – – International Equity 17,251 17,251 – – Domestic Fixed 24,317 24,317 – – Managed Futures 2,509 2,509 – – Large Blend 5,175 5,175 – –Domestic equity exchange traded 1,666 1,666 – – $ 77,321 $ 77,321 $ – $ –
Post-Retirement Medical Plan
Mutual funds
Money Market $ 76 $ 76 $ – $ – Domestic Equity 330 330 – – Domestic Fixed 329 329 – – International Equity 83 83 – –Equities – Common Stock 202 202 – –Domestic equity exchange traded 35 35 – –International equity exchange traded 20 20 – – $ 1,075 $ 1,075 $ – $ –

48
NOTES TO THE CONSOLIDATED FINANCIAL STATEMENTS
Years ended June 27, 2015, June 28, 2014 and June 29, 2013 (Amounts in thousands, except share data)
NOTE 8: Continued
The following table summarizes the Company’s fi nancial assets measured at fair value on a recurring basis in accordance with ASC 820-10 as of June 28, 2014:
Quoted prices in active Signifi cant markets for other Signifi cant identical observable unobservable assets inputs inputs 2014 (Level 1) (Level 2) (Level 3)
Retirement and Pension Plan
Mutual funds
Money Market $ 173 $ 173 $ – $ – Domestic Equity 28,893 28,893 – – International Equity 20,328 20,328 – – Domestic Fixed 13,987 13,987 – – Managed Futures 2,755 2,755 – – Large Blend 5,685 5,685 – – Unconstrained Bond 3,461 3,461 – –Domestic equity exchange traded 2,225 2,225 – – $ 77,507 $ 77,507 $ – $ –
Post-Retirement Medical Plan
Mutual funds
Money Market $ 231 $ 231 $ – $ – Domestic Equity 526 526 – – Domestic Fixed 529 529 – – International Equity 146 146 – –Equities – Common Stock 197 197 – –Domestic equity exchange traded 53 53 – –International equity exchange traded 38 38 – – $ 1,720 $ 1,720 $ – $ –
49
NOTES TO THE CONSOLIDATED FINANCIAL STATEMENTS
Years ended June 27, 2015, June 28, 2014 and June 29, 2013 (Amounts in thousands, except share data)
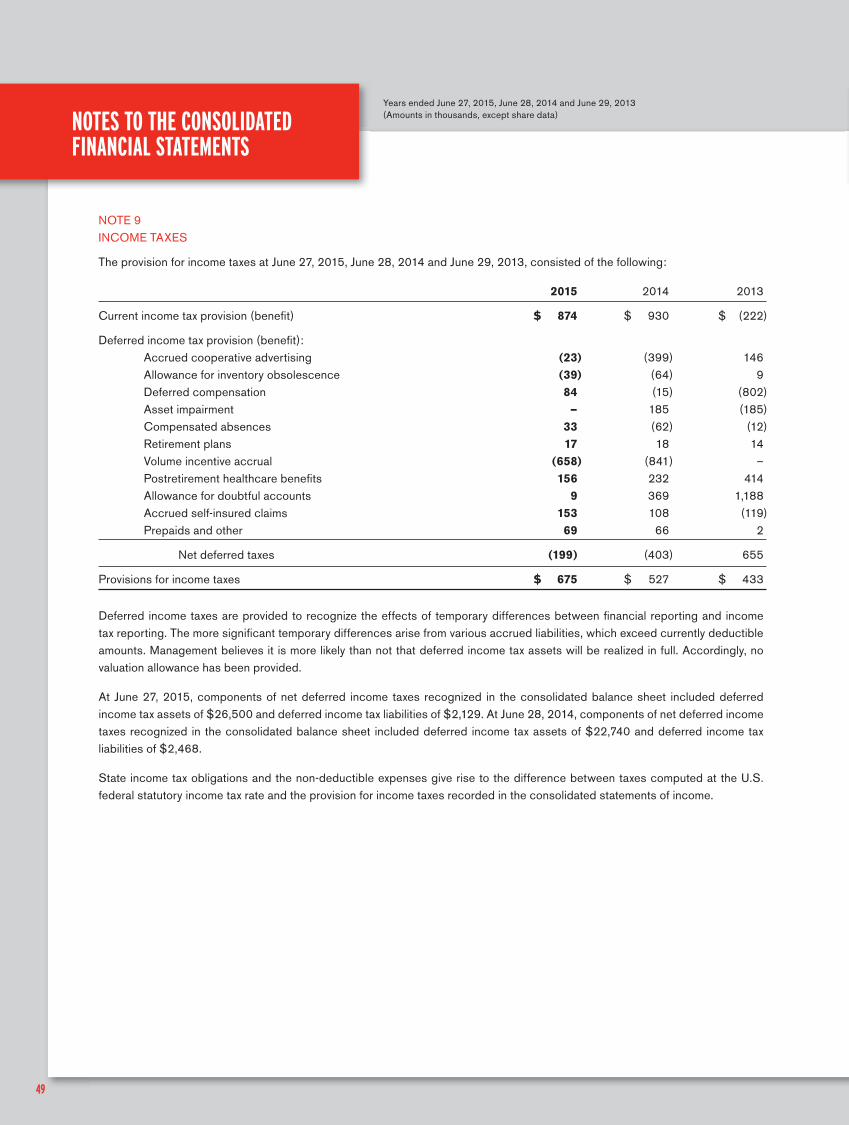
NOTE 9INCOME TAXES
The provision for income taxes at June 27, 2015, June 28, 2014 and June 29, 2013, consisted of the following:
2015 2014 2013
Current income tax provision (benefi t) $ 874 $ 930 $ (222 )
Deferred income tax provision (benefi t): Accrued cooperative advertising (23 ) (399 ) 146 Allowance for inventory obsolescence (39 ) (64 ) 9 Deferred compensation 84 (15 ) (802 ) Asset impairment — 185 (185 ) Compensated absences 33 (62 ) (12 ) Retirement plans 17 18 14 Volume incentive accrual (658 ) (841 ) – Postretirement healthcare benefi ts 156 232 414 Allowance for doubtful accounts 9 369 1,188 Accrued self-insured claims 153 108 (119 ) Prepaids and other 69 66 2
Net deferred taxes (199) (403 ) 655
Provisions for income taxes $ 675 $ 527 $ 433
Deferred income taxes are provided to recognize the effects of temporary differences between fi nancial reporting and income tax reporting. The more signifi cant temporary differences arise from various accrued liabilities, which exceed currently deductible amounts. Management believes it is more likely than not that deferred income tax assets will be realized in full. Accordingly, no valuation allowance has been provided.
At June 27, 2015, components of net deferred income taxes recognized in the consolidated balance sheet included deferred income tax assets of $26,500 and deferred income tax liabilities of $2,129. At June 28, 2014, components of net deferred income taxes recognized in the consolidated balance sheet included deferred income tax assets of $22,740 and deferred income tax liabilities of $2,468.
State income tax obligations and the non-deductible expenses give rise to the difference between taxes computed at the U.S. federal statutory income tax rate and the provision for income taxes recorded in the consolidated statements of income.

50
NOTES TO THE CONSOLIDATED FINANCIAL STATEMENTS
Years ended June 27, 2015, June 28, 2014 and June 29, 2013 (Amounts in thousands, except share data)
NOTE 10FAIR VALUE
The following table summarizes the Company’s fi nancial assets measured at fair value on a recurring basis in accordance with ASC 820-10 as of June 27, 2015:
2015 Level 1 Level 2 Level 3
Cash equivalents $ 19,935 $ 19,935 $ – $ – $ 19,935 $ 19,935 $ – $ –
The following table summarizes the Company’s fi nancial assets measured at fair value on a recurring basis in accordance with ASC 820-10 as of June 28, 2014:
2014 Level 1 Level 2 Level 3
Cash equivalents $ 20,318 $ 20,318 $ – $ – $ 20,318 $ 20,318 $ – $ –
For the Company’s cash equivalents (money market accounts), fair value was determined using quoted market prices based on the closing price as of the balance sheet date.
NOTE 11COMMITMENTS AND CONTINGENCIES
The Company was contingently liable at June 27, 2015 and June 28, 2014, under a loan guarantee program, which has a maximum borrowing capacity of $12 million at June 27, 2015 and $5 million at June 28, 2014, with a Commercial Bank. Under the terms of the loan agreement in order to participate the Borrowers must be both, Members of and approved by, the Company in order to participate in the program.
Under the terms of the program the Bank will provide a Member loan in the form of a term loan to be paid and amortized either over 84 equal monthly installments with any unpaid balance due at maturity or paid in 7 equal annual principal installments on a straight line basis plus interest due monthly.
Interest on the loans will be payable at a fi xed rate to be determined by the Bank at the time of funding and will be at the prime rate minus 1%, fi xed for a period of 7 years. At June 27, 2015 and June 28, 2014, interest rates on the loans were 2.25%.
The risk of loss under these agreements is spread over many Members and is the estimated fair value considering both the contingent loss due to default and the value of the Company’s guarantee. The Company believes that any potential loss under the agreements in effect at June 27, 2015 and June 28, 2014 will not be material to its fi nancial position or results of operations.
The Company, in the ordinary course of business, is the subject of or party to various pending or threatened litigation. While it is not possible to predict with certainty the outcome of these matters, management of the Company does not believe that they will materially affect the fi nancial position, or operating results or cash fl ows of the Company.