increasing efficiency of laser fluorescence diagnostics of microbial diseases
TRANSCRIPT

1416
ISSN 1054-660X, Laser Physics, 2007, Vol. 17, No. 12, pp. 1416–1423.
© MAIK “Nauka /Interperiodica” (Russia), 2007.Original Text © Astro, Ltd., 2007.
INTRODUCTION
Laser fluorescence diagnostics (LFD) of biologicalmacromolecules exhibit certain advantages and possi-bilities in population screening with respect to micro-bial diseases. The LFD advantages are related to theexpress character of the method (the measurement pro-cedure takes minimal time and allows real-time diag-nostics), a relatively high sensitivity (low concentra-tions of fluorescing substances can be detected), andcheapness. The LFD is based on the fact that manyorganic molecules of the biological substrate understudy exhibit fluorescence upon visible or UV excita-tion. This makes it possible to identify human patholog-ical states and a normal homeostasis state based on theemission signal [1]. The application of lasers at theLFD excitation sources makes it possible to increasethe excitation efficiency and, hence, to increase the sen-sitivity and selectivity in comparison with systemsbased on conventional excitation sources. In addition tothe LFD medical application, the method is promisingin industry and food technologies [2].
The existing procedures of microbial diagnostics inliquids based on the LFD of biological substrates pre-dominantly involve the application of specific fluores-cence indicators [3] that allow the components of mix-tures to be determined based on the indicator fluores-cence. Such indicators can be both fluorescentmolecular probes and quantum dots bound to antibod-
ies that can be selectively attached to the surface of spe-cific microbes.
Nearly the same efficiency can be attained using theself-fluorescence of biological substrates (fluorescencein the absence of markers) [1, 2]. For example, theapplication of a fiber-optic catheter for the excitationand measurement of the endogenous fluorescence ofthe inner-arterial wall allows for the early diagnosis ofatherosclerosis [4]. A relatively high efficiency is dem-onstrated in precancer and early cancer diagnostics,since tumor tissue absorbs and accumulates porphyrin-based molecules, which exhibit developed fluorescence[5]. Wide prospects in the medical differential diagnos-tics of infectious diseases can be related to the LFDexpress indication of microbes in biological substrates.The existing results make it possible to detect microbialsubstances in the samples of diseased patients. It isdemonstrated that the application of He–Ne laser radi-ation (red spectral range) allows the predominant exci-tation of the porphyrins of respiratory enzymes and themicrobial metabolic products, which serve as the mainfeature that indicates the presence of microbes and theirconcentration in biological liquid. The fluorescencespectra of the porphyrins that take part in respiratoryprocesses in the presence and in the absence of oxygenare qualitatively different [2].
The specific fluorescence features of microbe-con-taining suspensions are weakly manifested and arepoorly studied. The purpose of this work is to develop
LASER METHODS IN CHEMISTRY,BIOLOGY, AND MEDICINE
Increasing Efficiency of Laser Fluorescence Diagnostics of Microbial Diseases
M. T. Alexandrov
a
, O. G. Gaponenko
b
, M. A. Ivanova
a
, V. A. Khomenko
c
, G. P. Kuzmin
d
, M. V. Makarova
e
, E. P. Pashkov
a
, G. M. Sorokoumova
f
, and E. N. Vasiliev
d
a
Sechenov Medical Academy, Moscow, RussiaLtd. Scientific–Industrial Center of Medical and Industrial Technologies “Spectrolux”
c Central Scientific Research Institute of Tuberculosis, Yauzskaya alley 2, Moscow, 107564 Russia
d
Prokhorov General Physics Institute, Russian Academy of Sciences, ul. Vavilova 38, Moscow, 119991 Russia
e
Scientific and Clinical Antituberculosis Center, ul. Stromynka 10, Moscow, 107014 Russia
f
Lomonosov State Academy of Fine Chemical Technology, Moscow, Russia
*e-mail: [email protected] June 7, 2007
Abstract
—The laser-induced fluorescence spectra of five types of mycobacteria are studied in various associ-ations. The results obtained are used to demonstrate the possibility of a diagnostic system for the differentialdiagnostics of microbial diseases. The method employed for the specific analysis of microbial species in thesubstrate that contain various associations is based on a regression of the spectral characteristics of the fluores-cence intensity to the principal components. The diagnostic efficiency is increased when the fluorescence spec-tra are reconstructed with regard to the optical characteristics of the medium. The detergent effect on the param-eters of microbial fluorescence diagnostics is studied.
PACS numbers: 40.
DOI:
10.1134/S1054660X07120122

LASER PHYSICS
Vol. 17
No. 12
2007
INCREASING EFFICIENCY OF LASER FLUORESCENCE DIAGNOSTICS 1417
the method and devices for the objective estimation ofthe fluorescence specificity of the native biological sub-strates (microbes) and their mixtures in microbe-con-taining liquids. To solve the problem, we accumulatesets of fluorescence spectra of several microbial speciesat various concentrations and propose a concept, algo-rithm, and software for the differential microbial diag-nostics in composite systems along with methods forthe improvement of the diagnostic quality of the dataobtained using a detergent for an increase in the relativefluorescence intensity and taking into account the effectof the optical characteristics of the medium on the flu-orescence spectra.
CONCEPT OF MEASUREMENT AND PROCESSING OF THE RESULTS
OBTAINED
The problem of LFD-based specific diagnosticsinvolves the computational methods that make it possi-ble to analyze the biological species’ composition ofmicrobial suspensions based on fluorescence spectraldata. The corresponding methods can be realized as thePC software that processes the spectral data. The soft-ware must be able to determine the concentrations ofvarious microbial species in suspensions in both purecultures and mixtures. The importance of the last con-dition is related to the fact that real living systems (e.g.,microbe-containing biological substrates) representassociations of several biological species. To realize aspecies' (differential) fluorescence diagnostics, weemploy a laser fluorescence system for the measure-ment of suspensions and propose a computationalmodel for the recognition of species and the concentra-tion composition of arbitrary suspensions with dataprocessing.
All unicellular and multicellular organisms exhibitfluorescence upon excitation in the red spectral range[2]. As the initial composition of the microbial mixtureis arbitrary, the desired method for the calculation ofthe concentrations of microbial species must yield themicrobial concentrations that are independent of theconcentrations of other species and the content of fluo-rescing mixtures in liquid. Thus, the proposed systemmust be able to recognize fluorescing components ofthe suspensions. To interpret the principles of differen-tial LFD, we present the general formulation of the rec-ognition problem.
In the recognition problem, the initial informationon objects
S
j
(
j
= 1, …,
n
) represents attributes
x
i
(
i
= 1,…,
J
) that characterize various properties of objects
S
j
.A set of attributes forms vector
(1)
Each object
S
j
that belongs to the set of objects
S
exhib-its the main feature (also known as intrinsic character-
x S j( ) x1 S j( ) x2 S j( ) … xJ S j( ), , , .=
istic)
y
(
S
j
). For a part of the objects
S
'
(2)
this property is assumed known. The variable thatdescribes this feature takes on a known numerical orlogical value. For the remaining part of objects
S
\
S
'from
S
(3)
the main feature is unknown.The recognition procedure involves a learning (ref-
erence) sample that contains set
S
' and the set of thecorresponding attributes
y
(
S
1
),
y
(
S
2
), …,
y
(
S
m
). To solvethe recognition problem means to determine the valueof feature
y
(
S
j
) for object
S
j
from set
S
\
S
' with the max-imum statistical significance based on the informationfrom the reference or learning sample.
In spectral fluorescence diagnostics, the attributesthat characterize the properties of the objects understudy are the discrete spectral intensities of the laser-induced fluorescence corresponding to the signals ofthe spectrometer pixels. The pixel signals are amplifiedwith an electronic amplifier, are digitized with an ADC,and are delivered to the PC interface where they caneasily be used as initial attributes. The concentrationsof various microbial species serve as the main attributes
y
(
S
j
). Thus, to solve the recognition problem, we needto choose easily measurable physical quantities thatserve as the attributes of objects and the reference sam-ples for which we know the species and concentrationcharacteristics of the samples. For the proposed techni-cal variant, microbial suspensions in pure cultures atvarious concentrations serve as such samples. A groupof samples with microbial mixtures is used as the testsample. Below, we demonstrate that the model for theconcentration calculation that is based on such samplescan also yield correct results for mixtures.
To find feature
y
(
S
j
), we employ the linear regres-sion of information on the microbial concentration orthe main attributes of the objects from the learning sam-ple to the statistical principal components of the dis-crete fluorescence characteristics or the intensities ofthe laser-induced fluorescence. The details of theregression to principal components can be found in theAppendix. Here, we briefly present the principle of thisstatistical method. The method is based on a linearmodel of the concentrations under study as a certaindesired linear dependence on the spectral intensitiesand employs the principle of an increase in the qualityof the calculated diagnostic data owing to the involve-ment of the maximum number of independent proper-ties (intensities at the spectrally resolved spectrometerwavelengths). The last principle makes it possible tosolve the problem inherent in the conventional analyti-
S ' S j m n<( ),j = 1
m
Y=
S \S ' S j m j n≤<( ),j
Y=
1418
LASER PHYSICS
Vol. 17
No. 12
2007
ALEXANDROV et al.
cal methods and lying in a relatively low spectral spec-ificity of the fluorescence of the biological substrate inan aqueous medium due to the fluorescence uniformitywith respect to the spectral components related to mul-tiple mechanisms for the broadening of the molecularenergy levels.
MATERIALS AND METHODS
We employ microbial suspensions in pure culturesprepared using washing from nutrient media for thegrowth of microbial colonies. The suspensions arediluted at various concentrations in an aqueous solutionof salt with a concentration of 0.08 mol/l. We study fivespecies of mycobacteria:
Myc. avium
,
Myc. vaccae
,
Myc. tuberculosis
(H37Rv),
Myc. intracellulare
, and
Myc. kansasii
. The microbial concentrations in thesamples with pure cultures correspond to the twofold,fourfold, and eightfold dilutions of the stock suspen-sion with a concentration of 5
×
10
9
CFU/ml. Theresulting suspensions are diluted and placed in standardvials for the measurement of the laser-induced fluores-cence. In addition, we employ the same procedure toprepare the mixed-microbial systems using the mixingof the washes of several pure microbial cultures in asingle solution. The microbial concentrations in themixtures are two, three, and four times lower than theconcentration of the stock suspension. A part of thesamples is additionally processed with detergent(alaminol). The samples are studied using the spectralmethod with laser-induced fluorescence. The accumu-lated spectral data are processed using statistical proce-dures and the results obtained are used to constructmodels for quantitative calculations of the contents ofmicrobial species in an arbitrary sample based on themeasurement of the fluorescence spectra and the fluo-rescence–transmission measurements aimed at increas-ing the diagnostic quality.
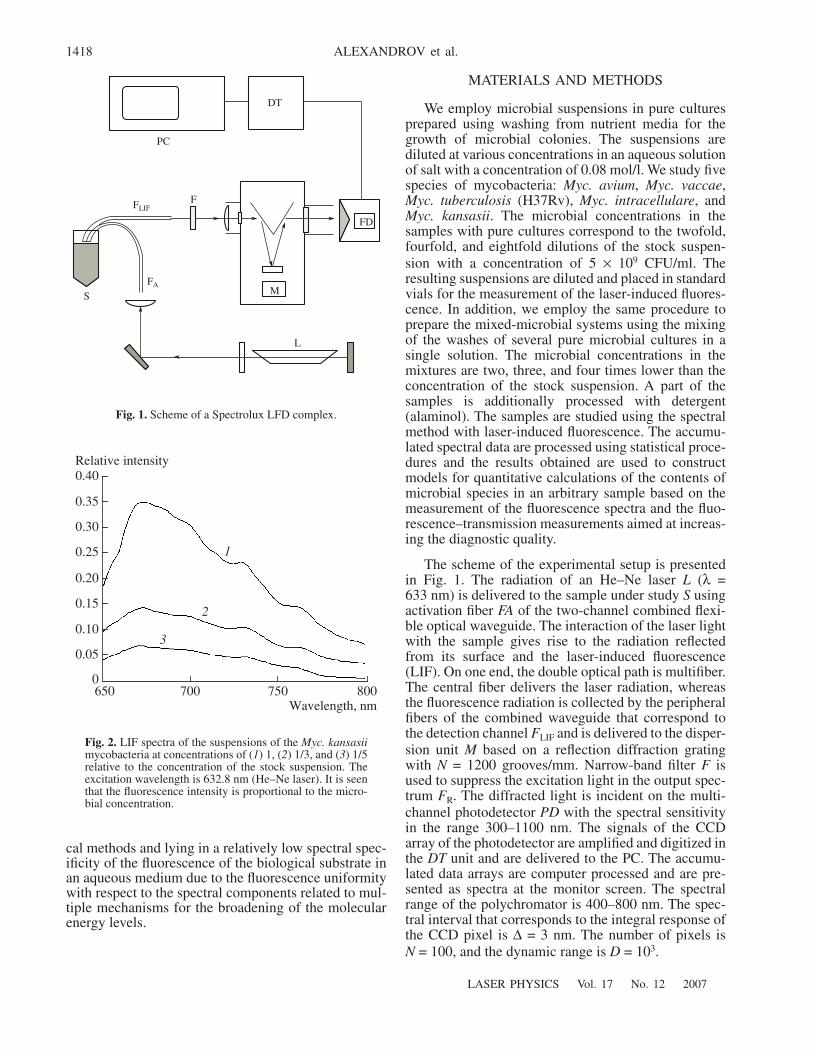
The scheme of the experimental setup is presentedin Fig. 1. The radiation of an He–Ne laser
L
(
λ
=633 nm) is delivered to the sample under study
S
usingactivation fiber
FA
of the two-channel combined flexi-ble optical waveguide. The interaction of the laser lightwith the sample gives rise to the radiation reflectedfrom its surface and the laser-induced fluorescence(LIF). On one end, the double optical path is multifiber.The central fiber delivers the laser radiation, whereasthe fluorescence radiation is collected by the peripheralfibers of the combined waveguide that correspond tothe detection channel
F
LIF
and is delivered to the disper-sion unit
M
based on a reflection diffraction gratingwith
N
= 1200 grooves/mm. Narrow-band filter
F
isused to suppress the excitation light in the output spec-trum
F
R
. The diffracted light is incident on the multi-channel photodetector
PD
with the spectral sensitivityin the range 300–1100 nm. The signals of the CCDarray of the photodetector are amplified and digitized inthe
DT
unit and are delivered to the PC. The accumu-lated data arrays are computer processed and are pre-sented as spectra at the monitor screen. The spectralrange of the polychromator is 400–800 nm. The spec-tral interval that corresponds to the integral response ofthe CCD pixel is
∆
= 3 nm. The number of pixels is
N
= 100, and the dynamic range is
D
= 10
3
.
DT
PC
FF
LIF
FD
MF
A
S
L
Fig. 1.
Scheme of a Spectrolux LFD complex.
0.05
650 750
Relative intensity
Wavelength, nm
0.10
700 8000
0.15
0.25
0.35
0.20
0.30
0.40
1
2
3
Fig. 2. LIF spectra of the suspensions of the Myc. kansasiimycobacteria at concentrations of (1) 1, (2) 1/3, and (3) 1/5relative to the concentration of the stock suspension. Theexcitation wavelength is 632.8 nm (He–Ne laser). It is seenthat the fluorescence intensity is proportional to the micro-bial concentration.

LASER PHYSICS Vol. 17 No. 12 2007
INCREASING EFFICIENCY OF LASER FLUORESCENCE DIAGNOSTICS 1419
FLUORESCENCE CHARACTERISTICS OF THE MICROBIAL SUSPENSIONS
Figure 2 demonstrates the fluorescence spectra ofthe Myc. kansasii solutions at several concentrations.The spectra represent mutually overlapping diffusepeaks. Figure 3 shows the fluorescence spectra of theMyc. tuberculosis samples at various concentrations. Acomparison of the spectra presented in Figs. 2 and 3
shows that the spectra of different species have similarshapes. The comparison of the spectra of a certainmicrobial species shows that the spectral shape is var-ied with a decrease in the microbial concentration in thesample: the spectrum becomes broader and the spectralfeatures can be observed. This is due to the fact that thesample contains a fluorescing impurity whose fluores-cence becomes detectable when the microbial concen-tration decreases. This can be the fluorescence of liquid(saline) that contains additional organic substances notrelated to microbes. Below, we demonstrate that theproposed method enables one to subtract the impuritycontribution from the diagnostic data.
ANALYSIS OF THE FLUORESCENCE SPECTRA OF NATIVE MICROBES
The measured spectra of the microbial samples inpure cultures are used to construct the concentrationmodel and to calculate the calibration matrix, which areverified with respect to the accuracy of the prediction ofthe microbial concentration using the fluorescencespectra of the mixtures by comparing the set of the cal-culated microbial species with the set of species that isused for the preparation of the samples using mixtures.The analysis yields the following results. For brevity,we denote the above microbial species (Myc. avium,Myc. vaccae, Myc. tuberculosis (H37Rv), Myc. intrac-ellulare, and Myc. kansasii) with numbers 1–5, respec-tively. Figure 4 shows the histograms of the calculatedconcentrations for the five microbial species in twosamples with native bacteria (live bacteria in theabsence of detergent). In the samples, we use the fol-lowing combinations of the microbial species: the first
0.5
650 750
Relative intensity
Wavelength, nm
1.0
700 8000
1.5
2.0
2.5
1
2
3
Fig. 3. LIF spectra of the suspensions of the Myc. tubercu-losis (H37Rv) mycobacteria at concentrations of (1) 1,(2) 1/3, and (3) 1/5 relative to the concentration of the stocksuspension. The excitation wavelength is 632.8 nm (He–Nelaser). In contrast to the spectra presented in Fig. 2, the flu-orescence spectra of this species at higher concentrationsexhibit less-developed long-wavelength peaks.
2000
1
s2
1000
2 3 4 5
400600800
2000
s1
1000
400600800
–200–400
Fig. 4. Histograms of the calculated concentrations for fivemicrobial species in two samples with mixtures (see text fordetails).
181614121086420–2Prepared concentrations, rel. units
16
14
12
10
8
4
2
0
–2
–4
6
Calculated value
Myc. intracellulare
Myc. vaccae
Fig. 5. One-dimensional plot that illustrates the dependenceof the predicted microbial concentration (two microbialspecies) on the microbial concentration in the original sam-ple: (circles) Myc. intracellulare and (squares) Myc. vaccae.The curves are bent downwards at high concentrations.
1 23
45

1420
LASER PHYSICS Vol. 17 No. 12 2007
ALEXANDROV et al.
sample contains species 2 and 4 and the second samplecontains species 1, 4, and 5. The calculations show thatthe first sample contains species 2 and 4 and the secondsample contains species 1, 2, 4, and 5. The resultobtained is in agreement with the reference data by 70–80%. Thus, the calculations yield a diagnostic effi-ciency of 70–80%. Figure 5 demonstrates the depen-dence of the calculated concentrations of two microbialspecies at the initial concentration. It is seen that, at
high concentrations, the ascending concentration serieslies below the proportionality straight line (dashedline). A possible reason is a significant effect of theoptical characteristics of the substrate on the integral(bulk) fluorescence.
EFFECT OF EXTINCTION CHARACTERISTICS ON THE FLUORESCENCE SPECTRA
A medium can absorb and scatter radiation due tothe presence of chromophores and optically large parti-cles. For simplicity, we represent the excitation config-uration as the end of an optical fiber placed at distanced from the plane surface of the medium.
The intensity of the fluorescence signal collectedfrom the input window of the fiber equals the volumeintegral of the product of the fluorescence excitationcoefficient per unit length, the excitation intensity, andthe angular visibility of the input fiber window from anarbitrary point with regard to the path that the photonbeam emitted at this point passes inside the mediumwith attenuation (Fig. 6). The approximate formula forthe dependence of the spectral detector signal on theparameters of the medium and laser source can be writ-ten as
(4)
Here, Ifl(λ) are the output spectral intensities of thespectral detector in relative units, α(r, θ, ϕ, λ) is thecoefficient that is proportional to the spectral efficiencyof the excitation conversion, Ω+(θ, ϕ) is the angularcoefficient that corresponds to the fraction of the exci-tation power concentrated in a unit solid angle in thedirection (θ, ϕ), Ω–(θ, ϕ) is the angular coefficientequal to the visibility solid angle of the input windowof the signal fiber from the point with coordinates (r, θ,ϕ), β(λ) is the spectral extinction ratio, and λl is thelaser wavelength. In expression (4), the integral is cal-culated across the entire volume of the cell and the ori-gin of the coordinate frame coincides with the center ofthe output fiber window.
To take into account a correction related to the prop-erties of the medium, we must determine the functionof the factor that takes into account the effect of the spa-tially uniform extinction (transmission) coefficient onthe spectrum. This factor equals the inverse fraction ofthe integral resulting from taking out of the integral thecoefficient α. We assume that α is independent of thecoordinates inside the cell:
(5)
Here, L is the optical path length inside the cell.Using additional measurements of the transmission
spectra, we correct the fluorescence spectra of themicrobial samples. The simulation based on such spec-
Ifl λ( ) 1/4π( ) α r θ ϕ λ, , ,( )I lΩ+ θ ϕ,( )∫=
× Ω– θ ϕ,( ) eβ λl( ) β λ( )+( )r–
/r4( )r
2 θ( )drdϕdθ.sin
α λ( ) CIfl λ( )/ 1/d 1/L–( ) β λ( ) L/d( )ln+( ).=
r
d
Fig. 6. Configuration of the laser excitation and the collec-tion of the substrate fluorescence. The end surface of thefiber is placed at distance d relative to the substrate in thecell (right-hand region).
2000
s1
400600800
–200–400
1 2 3 4 5
2000
400600800
–200–400
s2
Corrected
Initial
Fig. 7. Histograms of the calculated concentrations for fivemicrobial species in two samples with mixtures (left-handcolumn in each pair) with regard to the correction for theextinction characteristics of the medium and (right-handcolumn in each pair) with neglect of these corrections. Thefirst (second) sample is prepared using microbial species 1,3, and 4 (1, 2, and 5). The microbial concentrations are cal-culated more correctly when the corrections are taken intoaccount.

LASER PHYSICS Vol. 17 No. 12 2007
INCREASING EFFICIENCY OF LASER FLUORESCENCE DIAGNOSTICS 1421
tral data yields an improved prediction of the microbialspecies and concentrations in samples with mixtures.Figure 7 shows the calculated concentrations of the fivemicrobial species in the two samples where the speciesare correctly identified. The diagnostic efficiencyreaches to 80–90%.
APPLICATION OF DETERGENTS FOR AN INCREASE IN THE DIAGNOSTIC
SENSITIVITY AND ACCURACY
To increase the fluorescence signal and the sensitiv-ity of the method, we additionally process samplesusing substances that dissolve the cytoplasm of micro-bial cells in an aqueous medium and liberate the fluoro-phore molecules whose fluorescence is quenched bythe oxygen-containing substances inside the cytoplasmand is decreased due to concentration quenching.Detergents can serve as such substances. In an aqueoussolution, the micelles of detergent molecules approachthe cellular membrane of microbes and penetrate insideit forming holes. This leads to membrane damage andthe dissolving of the cytoplasm content in the substrate.The cytoplasm is not dissolved at a relatively low deter-gent concentration. When the concentration is exces-sively high, the detergent exhibits a coagulating actionpresumably due to the fact that the detergent micellesclose up all of the holes and clefts in the cellular mem-brane. Based on the measurements of an increase in thefluorescence signal in the presence of an aliminoldetergent, we choose an optimal concentration of0.025 mol/l. We verify the concentration model for themicrobial diagnostics based on the spectral data of thesamples with pure cultures in the presence of the deter-gent. Using this approach with regard to the opticalcharacteristics, we reach a diagnostic efficiency of 75–90%.
CONCLUSIONS
We briefly discuss the results obtained based on theproposed concept. The positive effect results from theimprovement of the methods and devices of the newmedical and biological diagnostics. In particular, theapplication of regression analysis makes it possible toimplement differential diagnostics of microbial mediabased on LFD measurements. We also determine theconcentration dependences of an increase in the sensi-tivity of the differential LFD method upon the homog-enization of the microbial suspensions in the presenceof a detergent (alaminol). An objective procedure isdeveloped for the differential diagnostics of the tuber-culosis mycobacteria in mixed systems based on fluo-rescence measurements with allowance for the opticalcharacteristics (extinction) of the microbial substrate.This makes it possible to realize the high-efficiency(80–90%) differential LFD of microbial species.
The following conclusions can be drawn.
(i) The application of the multidimensional statisti-cal analysis in the study of the fluorescence spectra ofthe microbial biological substrates enables one to per-form differential microbial diagnostics and the diag-nostics of corresponding diseases with an efficiency of80–90%.
(ii) The efficiency of the diagnostic complex can beincreased due to the application of methods for the pro-cessing of diagnostic data obtained with alternativedevices (e.g., fluorescence microscope).
(iii) Real-time diagnostics can be implementedusing the clinical realization of the system based on theproposed method.
ACKNOWLEDGMENTS
We are grateful to N.N. Kononov for helpful discus-sions.
APPENDIX
The method is based on the phenomenologicalmodel of spectral fluorescence characteristics as a sumof the spectral characteristics of the fluorophore com-ponents. In accordance with this model, the samples ofa biological substrate contain several fluorophore mol-ecules that are common for all of the samples. Nor-mally, porphyrins serve as such fluorophores in the caseof excitation in the red spectral range. We assume that,in the first approximation, the fluorescence spectrum ofthe sample represents a sum of the spectra of the com-ponents. The analysis of the fluorescence spectra yieldsa discrete set of fluorescence intensities at variouswavelengths. We assume that any spectrum is a convo-lution of several spectra corresponding to different flu-orescing components in the sample under study. Then,in accordance with the model, any intensity for eachsample of this set is a sum of the spectral intensities ofthe fluorescing components multiplied by the concen-tration coefficients:
(6)
where xsj is the discrete spectral intensity of the sthsample at the jth wavelength, ykj is the discrete intensityof the kth component at the jth wavelength, and csk isthe concentration coefficient that is proportional to thequantitative measure of the presence of the kth compo-nent in the Sth sample.
A single molecule and a biological cell (e.g., micro-bial cell) can be the component. In terms of the linearalgebra, the spectral intensities of the samples representcoordinates of the vectors that correspond to these sam-ples in a multidimensional space whose dimensiondepends on the quantization step in the original spectraldata. For such a representation of the spectral data, thediscrete spectral intensities of the components ykj deter-
xsj ykjcsk,k 1=
K
∑=

1422
LASER PHYSICS Vol. 17 No. 12 2007
ALEXANDROV et al.
mine the base vectors that are used to expand the vec-tors of the sample characteristics. This base feature isrelated to the fact that a set of the sample vectors is con-tained in the linear envelope of the vectors of compo-nent ykj , since vectors ykj have the same dimension asvectors xsj have and they completely exhaust all of thevariants for the construction of the total fluorescencespectra on the assumption that the components arepresent in all of the samples and that only these compo-nents are present.
For the stability and universality of the model, thebase vectors are found for the space of parameters witha lower dimension rather than the original space of thespectral characteristics whose dimension is relativelyhigh. The low-dimensional space is found using the sta-tistical factor analysis or the principal componentsanalysis of the spectral fluorescence intensities for acertain relatively large number of samples with aknown content. This preliminary data transformation isneeded, since the problem of the search for the basebecomes more complicated owing to the calculations inthe near-singularity numerical range due to the signifi-cant similarity of the fluorescence spectra. This behav-ior of the spectral characteristics does not allow us todetermine the directions of the base vectors that are sta-ble against noise related to the contributions of theapparatus noise of the spectrometer in the pixels of theCCD array. The problem can be solved using statisti-cally stable fluorescence parameters (e.g., principalfactors of the characteristics) instead of the space of thenoisy spectral intensities. For further interpretation ofthe principles of the model for the component concen-trations, we briefly present the basic model of factoranalysis (FA) in the variant of the linear normal model.
In general, the FA formalism represents a mathe-matical and statistical procedure for a decrease in thedimension of space of the multidimensional attributevectors x = (x1, x2, …, xJ) based on the study of the cor-relation between components xj and xj ' ( j, j ' = 1, 2, …,J). The final model describes phenomena in the spaceof the principal components and the corresponding fac-tors f = ( f1, f2, …, fP), where P J. We employ the lin-ear normal model of the FA with the mutually orthogo-nal common factors f and uncorrelated residuals e:
(7)
The splitting of the attribute vector to the factor andrandom components is the final result of a cyclic itera-tive procedure that decomposes the data matrix at eachcalculation cycle to the structural part and noise:
(8)
Here, X is the data matrix, F is the matrix that sets theobject factors in the principal component base, Q is the(J × P) transposed loading matrix, and E is the residual
x j q jp f p e j, j+p 1=
P
∑ 1 2 … J ,, , ,= =
p 1 2 … P., , ,=
X FQ E.+=
matrix. Note that the algorithm assumes that the origi-nal set of attributes is centered, so that the origin of thecoordinates in the space of attributes is at the center ofthe statistical spread. We assume that the residual vec-tor e = (e1, e2, …, eK) satisfies the p-dimensional normaldistribution with the zero-mean vector and diagonalcovariance matrix Ve.
For the FA of the concentration model, the coordi-nate system is preliminarily centered with the transmis-sion of the origin to the point determined by theattribute vector averaged over all samples and the prin-cipal component analysis is performed. Then, theresulting factors are used to find the regression coeffi-cients on the concentration scales upon the least-squares regression for the experimental points that cor-respond to the objects of the reference sample. Thismeans that the model
(9)
is used to find coefficients r0i and rpi (the regressioncoefficients for the ith biological component (microbialspecies)) using known coefficients csi and fsp based onthe best approximation for the objects of the referencesample using the minimization of the rms deviation.
The result of the regression to the principal compo-nents as the purpose of the statistical study is the cali-bration matrix that can be used for the projection of thevector of features (a discrete set of spectral fluores-cence intensities) along the scales of the microbial con-centrations. The matrix is determined upon the regres-sion of the principal factors on the matrix of the com-ponent concentrations of these samples (i.e., microbes):
(10)
where W is the J × I calibration matrix and C is the S ×I concentration matrix, whose elements are the concen-trations of the microbial species with numbers i in theobjects with numbers s from the reference sample. Theprocedure for the regression of the principal factors onthe concentration scales makes it possible to find thecalibration matrix and to use it for the calculation (orprediction) of the microbial concentrations using thefollowing formula:
(11)
Here, ci is the concentration of the ith component(microbial species), w0i are the values of the zero-regression coefficients, and mj are the values of thecomponents of the vector that transform the values ofthe components of attribute vector xj for the sampleunder study to the centered coordinate system of theattributes. The mathematical problem of recognition asthe realization of the regression to the principal compo-
csi r0i rpi f sp, Ip 1=
P
∑+ 1 2 … I, , ,= =
W Q FFT( )1–FTC,=
ci w0i x j m j–( )w ji.j 1=
J
∑+=

LASER PHYSICS Vol. 17 No. 12 2007
INCREASING EFFICIENCY OF LASER FLUORESCENCE DIAGNOSTICS 1423
nents is solved in two stages: (i) the space of the linearcharacteristics (factors) of the original attributes (spec-tra) with a maximum level of statistical significancefound and (ii) the vectors that correspond to the inde-pendent contributions of the analytical components tothese characteristics are found inside this space. Thecalculation of the quantitative measure of the contribu-tion for each analytical component (concentration of amicrobial species) is found as the projection of the vec-tor of the linear statistical fluorescence characteristicsalong the vector of a given analytical component in thelow-dimensional space.
The above mathematical formulation of the solutionto the problem of the recognition of microbial concen-trations can be used for calculations in alternative diag-nostic procedures (e.g., IR optical spectroscopy). Suchmethods of multidimensional statistical analysis aredeveloped in chemometrics [6].
REFERENCES
1. J. Lakowiczh, Fluorescence Spectroscopy (Wiley, NewYork, 1982).
2. M. Alexandrov, A. Vorobjev, E. Pashkov, M. Philotov,et al., “The Laser Fluorescent Diagnostics in Medicine,Food, Industry, Ecology,” Electronics: NTB 3, 43(2003).
3. J. A. Kloefer, R. E. Mielke, M. S. Wong, et al., “QuantumDots as Strain- and Metabolism-Specific Microbiologi-cal Labels,” Appl. Environ. Microbiol. 69, 4205 (2003).
4. A. Lucas, M. Perk, Y. Wen, and C. Smith, “FluorescenceSpectroscopic Detection of Early Injury-Induced Ath-erosclerosis,” Proc. SPIE 1642, 183 (1992).
5. V. V. Sokolov, E. V. Filonenko, L. V. Telegina, et al.,Quantum Electron. 32, 963 (2002).
6. T. Naes and H. Martens, Multivariate Calibration.