increasing community college completion rates … community college completion rates among...
TRANSCRIPT

*** DO NOT CIRCULATE ***
Increasing Community College Completion Rates among Low-Income Students: Evidence from a Randomized Controlled Trial Evaluation
June 16, 2017
William N. Evans University of Notre Dame and NBER
Melissa S. Kearney University of Maryland and NBER
Brendan Perry University of Notre Dame
James X. Sullivan University of Notre Dame
Abstract Recent trends in college dropout rates have resulted in what some scholars call a “completion crisis” (Deming, 2017). Identifying successful approaches to raising college completion rates among low-income students is of paramount interest to both policy makers and researchers. Much of the existing policy and research attention to this issue has focused on addressing academic and financial barriers to completion. However, there is ample reason to think that non-academic obstacles – such as housing, transportation, childcare, and other family issues – might be a key driver of dropout rates for students living with the burden of poverty. This study examines the impact of a case management intervention that is designed specifically to help low-income students overcome “life barriers” that threaten their persistence in community college. We evaluate the impact of this intervention through a randomized controlled trial evaluation (RCT) conducted between 2013 and 2016 in Fort Worth, Texas. Eligible students were randomly assigned to a treatment group that was offered case management and emergency financial assistance (EFA), a separate treatment group offered only EFA, or a control group. We use administrative records to track student academic outcomes for three years post random assignment. The results indicate that the program significantly increased persistence and degree completion through six semesters, especially for female students. We find no difference in outcomes between the EFA-only treatment arm and the control group. A back-of-the-envelope calculation using average earnings gains associated with community college completion implies that program benefits exceed program costs after only 4.25 years in the workforce post schooling. Acknowledgements: We are indebted to Erin Byrne and Luke Horvath for their project and research support and we gratefully acknowledge the research assistance of Fernando Saltiel. We have also benefitted from comments from Jonathon Guryan and Brad Hershbein and seminar participants at the University of Notre Dame and at the APPAM Fall Research Conference. We are grateful to our research partners at Catholic Charities Fort Worth and Tarrant County College. This research was financially supported by funding from the Wilson Sheehan Lab for Economic Opportunities at Notre Dame, the Fischer Family Foundation, the Abdul Latif Jameel Poverty Action Lab, and NIH Grant #1R21HD081399-01A1.
1
I. INTRODUCTION
Community college is a crucial component of our nation’s education system, offering students
an inexpensive way to achieve higher levels of education and ultimately earnings. Average earnings are
32 percent higher and unemployment rates are 39 percent lower for those with an associate’s degree
compared to those with a regular high school degree.1 College enrollment rates in general have risen,
but dropout rates are very high at community colleges, especially among low-income students. Data
from the U.S. department of education indicate that six years after first enrolling, nearly 50 percent of
community college students have dropped out (Radford et al, 2010). Furthermore, only about 30
percent of first-time, full-time community college students earn a certificate or associate degree within
three years (Aud et al., 2013). Over the past few decades, community college completion rates have
been falling and time to degree has been rising (U.S. Department of Education, 2016; Bound,
Lovenheim, and Turner, 2010, 2012; Turner 2004). These trends have led education scholars to
describe a “completion crisis,” emphasizing that the key policy issue is college completion rather than
college attendance (Deming, 2017). Figuring out ways to better realize the potential of the community
college investment, both for the students themselves and for society more generally, is of great
economic and policy importance.2
There are a number of potential explanations for the high rate of non-completion among low-
income students. Perhaps the most obvious is financial costs. Although the sticker price for community
college can be high, many low-income community college students receive grants, which keeps out-of-
pocket tuition costs low. The federal government spends billions of dollars a year subsidizing
1 Authors’ calculations from the 2015 five-year American Community Survey (Ruggles et al. 2015). We calculate these from an OLS regression model for individuals age 25 to 50 controlling for year of age, race and gender effects. We acknowledge that these simple OLS estimates do not adjust for selection effects; we use them merely to make the point that there are sizable earnings differences, though how much of that wage premium is causal is difficult to pin down. 2 Policy makers appear to be quite aware of this challenge. For instance, improving persistence in community college was an explicit priority of the Obama administration, which launched the American Graduation Initiative with a goal of producing 5 million more community college graduates by 2020. http://www.whitehouse.gov/blog/Investing-in-Education-The-American-Graduation-Initiative
2
community college attendance. In 2015, the Pell Grant program provided $30 billion in aid for low-
income individuals to attend college and more than a third of Pell recipients attend community college
(Baime and Mullin, 2011). States and local governments often provide financial aid and need-based
scholarships as well. Nevertheless, low-income students still face financial burdens due to lost earnings
while in school. There is also reason to believe that many students arrive at community colleges
academically unprepared, which requires them to take many remedial classes. Both the under-
preparation itself and the requirement of having to spend the time and money to take remedial classes
can lead to elevated rates of dropout.
This paper focuses on the role of other types of challenges that have received less policy and
research attention to date, specifically, the non-academic challenges facing many poor and near-poor
students. Survey evidence from Johnson et al. (2011) shows that the two leading reasons that students
self-report about why they do not return to college are a need to work full time (56 percent) and family
reasons (53 percent). In fact, the survey results suggest that factors outside the classroom eclipse tuition
cost and academic factors. Given that community college students tend to be older and more likely to
have children, it is not surprising that life and family issues often arise, making it difficult for many
students, low-income students in particular, to complete their degree. Although these students might
not face high tuition costs due to subsidies, school still imposes a significant financial burden through
the opportunity cost of lower work hours and earnings. Issues with bills, child care, and transportation
also pose problems for many low-income students (Geckeler et al., 2008). Other personal barriers are
not so much logistical or financial, but rather issues related to self-efficacy. Students may lack the
necessary commitment and/or planning and time management skills necessary to set out a path to
graduation and stay committed to that plan. Students who lack clear goals and a genuine understanding
of why college is important often become derailed by relatively minor challenges and setbacks (Grubb,
2006).
3
Many students report having trouble navigating the complex community college system,
particularly first generation college students and new immigrants who may have limited knowledge
about how colleges function (Bailey, Jenkins, and Leinbach, 2005; Scott-Clayton, 2011). This suggests
that for many vulnerable community colleges students, small negative shocks like a family emergency, a
necessary vehicle repair, or a missed rent payment can sometimes have lasting impacts on academic
outcomes. It is widely recognized in other contexts that vulnerability is an important dimension of
poverty and many low-income families live perpetually on the brink of crisis and deep hardship (Barr
and Blank 2011; Shipler 2005). Bertrand et al., (2004) describe this aspect of poverty in terms of some
families having “narrow margins for error.”
The Stay the Course intervention (STC) is designed to lessen the impact that non-academic
challenges have on community college completion rates for low-income students. The program
provides students with two primary services: comprehensive case management and emergency financial
assistance. Each STC student is paired with a Navigator, a trained social worker who works with
students to help them overcome personal barriers to academic progress. Together with their Navigator,
students develop a service plan detailing their academic goals, personal financial or logistical challenges,
and the steps necessary to overcome them. Navigators work with students throughout their time at
TCC, helping them with their individual barriers to degree attainment such as finding affordable child
care, selecting courses that keep them on track towards graduation, making decisions about transferring
to four-year colleges, and locating social services in the Fort Worth, TX area.
This paper presents the results of a randomized controlled trial (RCT) evaluation of STC. In fall
2013, eligible students at Tarrant County College (TCC) in Fort Worth, Texas were randomly assigned
either to a treatment group that was offered coaching, mentoring, and EFA, to a separate treatment
group that was offered only EFA, or to a control group that received no special services. Using
administrative records, we tracked academic outcomes for study participants for three years post
random assignment. The results indicate that the program significantly increased persistence and degree
4
completion through six semesters, especially for female students. We find no difference in outcomes
between the EFA-only treatment arm and the control group. Using average earnings for high school
graduates and those who attend or complete community college, we estimate that the program becomes
cost-beneficial in just over four years.
II. PREVIOUS RESEARCH ON COMMUNITY COLLEGE INTERVENTIONS
There has been substantial research and policy attention to the issue of academic under-
preparation of entering community college students. About 60 percent of students entering community
college are referred to at least one remedial education class (Bailey, 2009; Attewell et al., 2006).
Community colleges devote upwards of $2 billion annually towards these developmental education
programs (Strong American Schools, 2008). Despite these efforts, students who enroll in remedial
courses are 38 percent less likely to complete their degree than other students (Attewell et al., 2006),
although much of this difference is likely driven by selection into these remedial courses.
Community colleges have experimented with interventions aimed at improving academic
success including learning communities, enhanced student services, and financial incentives. MDRC’s
“Opening Doors” demonstration project provides some experimental evidence that learning
communities encourage persistence (Scrivener et al., 2008). The impact of enhanced student services
within the college, such as lowering student-to-counselor ratios and increasing funding to career
guidance, were found to be modest at best and dissipated in later semesters (Scrivener and Weiss,
2009). Another MDRC Opening Doors demonstration that provided financial incentives to persist in
school found modest but positive impacts on persistence (Richburg-Hayes et al., 2009).
There is some limited evidence of the impact of coaching and mentoring-type interventions on
college persistence and degree completion. Bettinger and Baker (2014) reports the results of a random
assignment evaluation of InsideTrack, a telephone-based coaching service that helps two- and four-year
college students overcome academic and “real-life” barriers to a college degree and to help students
5
become advocates for themselves. They found that assignment to InsideTrack increased both
persistence and degree completion rates. Van der Steeg, van Elk and Webbink (2015) report the results
of an experiment that used coaching for students aged 16-20 enrolled in vocational programs in the
Netherlands. Their work showed that the coaching reduced dropout rates by 40 percent and the effects
were largest for those most likely to drop out.
Perhaps the most promising community college intervention studied to date has been The City
University of New York’s (CUNY) Accelerated Study in Associates Program (ASAP). This multifaceted
intervention offers financial assistance, developmental courses, block-scheduling, career services and
academic advisement from advisers with relatively low caseloads ranging from 60:1 to 80:1. MDRC’s
random-assignment evaluation of the program found that it nearly doubled community college
completion rates. The community college intervention studied in this paper differs from these and
other existing interventions in several important ways, as we describe in the next section.
III. THE “STAY THE COURSE” INTERVENTION
Stay the Course is a comprehensive, individualized intervention that was designed by Catholic
Charities Fort Worth (CCFW) to help low-income community college students address personal
obstacles so they can persist in school and complete their intended degree. CCFW is a large nonprofit
social service provider with a mission to improve outcomes for low-income families and individuals.
They provide services to over 100,000 unduplicated clients each year.
Under STC, each student is assigned a trained social worker (called a Navigator) that will work
as their case manager. There are two components to the STC intervention: wrap-around case
management and emergency financial assistance. There are three essential features to the case
management component of the program. First, upon a student’s enrollment in the program, the STC
Navigator meets with the student to conduct a client assessment that identifies the client’s needs, likely
barriers, and their strengths and weaknesses. Based on this assessment, the student and navigator

6
collaboratively develop and implement a comprehensive service plan that sets out the steps necessary
for the student to accomplish their educational goals. The service plan is tailored to 1) address these
specific needs and barriers through a range of available services, 2) devise intermediate goals for the
student to accomplish along the way, and 3) discuss the action steps necessary to accomplish these
goals within established timeframes. Action steps are developed for each specified goal in the service
plan. For example, if a participant has a goal of earning a grade of at least a “B” in a specific course the
action steps for that goal might include attending all classes for the course, meeting once a week with a
tutor, and/or performing well on an upcoming exam. The service plan is reviewed and updated every
90 days. Navigators work with students to make the necessary arrangements so that their life is set up
to accommodate class attendance and studying.
Part of the goal of this component of case management is for the Navigators to develop a
personal relationship with each of their student clients. This sort of personal relationship is different
from the typical relationship that academic advisors at community colleges have with their students, as
these advisors tend to have much larger caseloads, and most of the advice they provide is academic in
nature. This relationship is important for the second component of case management which is ongoing
meetings between the Navigator and the student to work on resolving unforeseen problems that crop
up that might threaten the ability of student to complete their degree. Students might encounter
situations along many dimensions that could derail their education, such as problems with housing,
child-care arrangements, transportation, or work schedules. Students are encouraged from the outset to
meet with their Navigator for help addressing such circumstances. The thought behind the
implementing agency’s approach is that because many of the problems are very personal, e.g., domestic
violence, substance abuse, mental illness, etc., the students are more likely to engage the Navigator for
help if they have a trusted relationship with the social worker. As explained by the implementing
agency, part of the goal of developing the service plan is for the clients to become more comfortable
with the Navigator so they will use their services when problems arise.
7
The third aspect of STC case management is assistance navigating the community college
system. Navigators remind students to register for the necessary and appropriate classes. Depending
on student need, Navigators may also assist students in finding campus-provided tutors and help
students avail themselves of campus-provided services. STC’s coaching and mentoring services are
much more comprehensive and intensive than those typically available at community colleges. Each
Navigator is assigned a caseload of roughly 34 students, which, as discussed below, is much smaller
than other, lighter-touch community college programs, such as those that promote persistence through
lower student-to-counselor ratios.
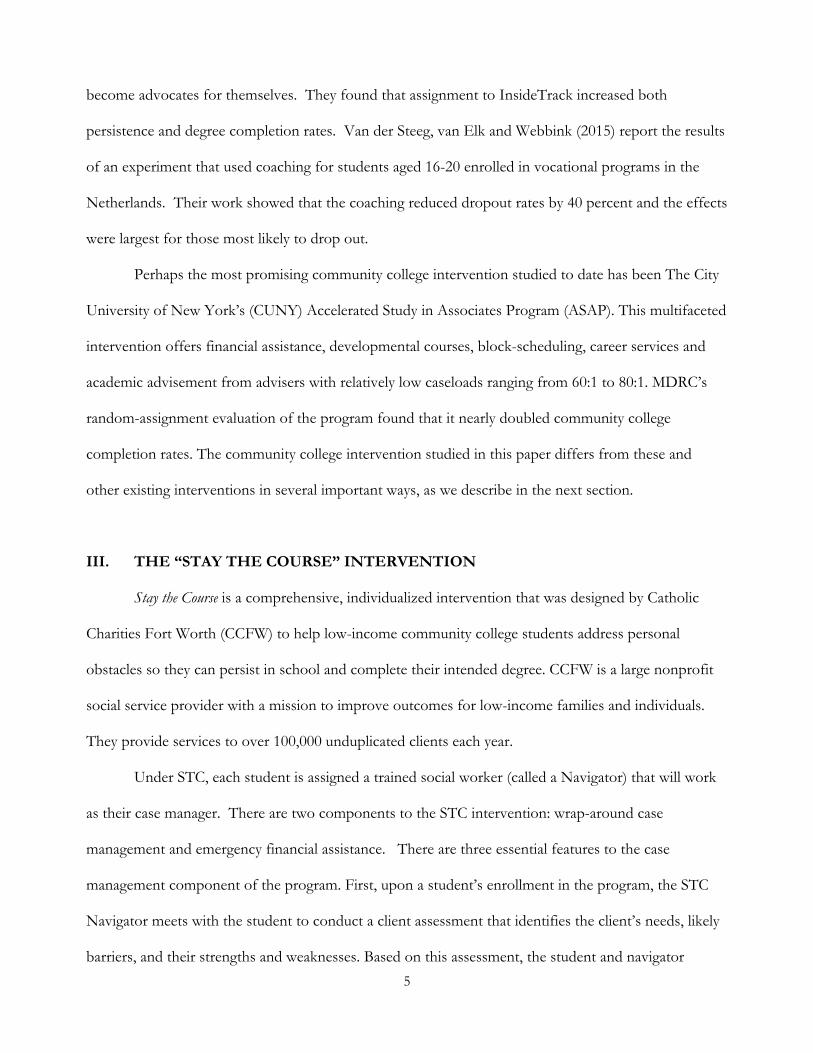
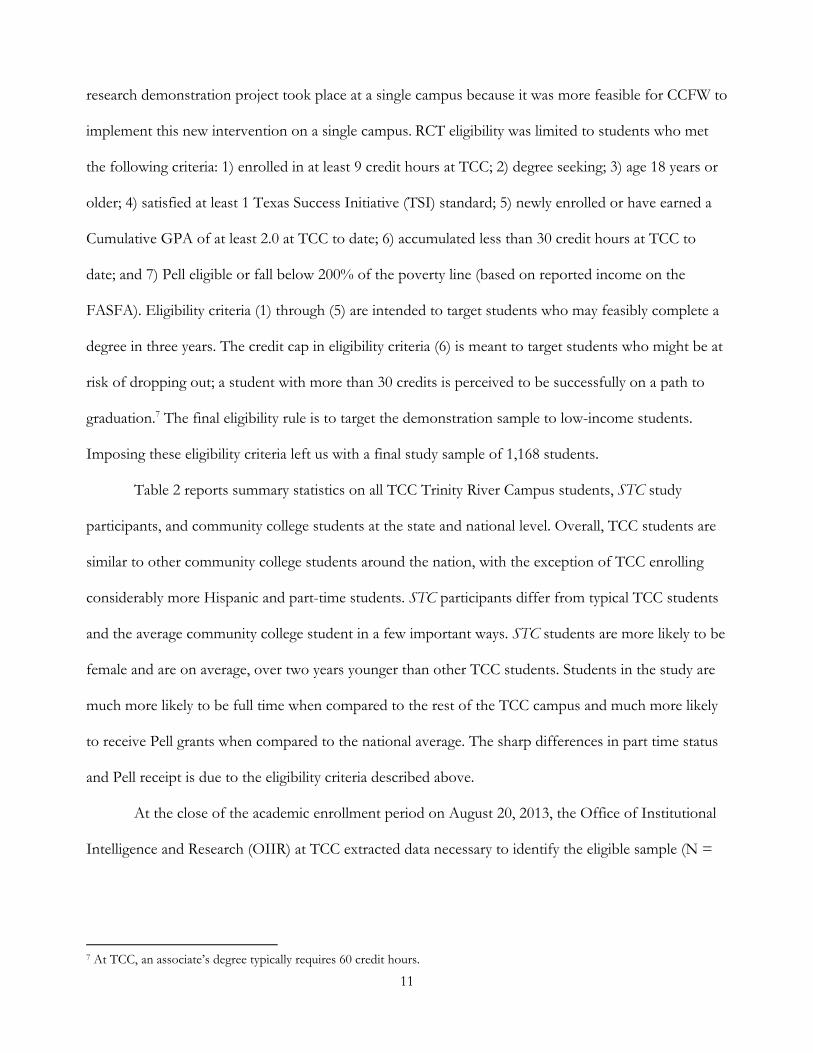
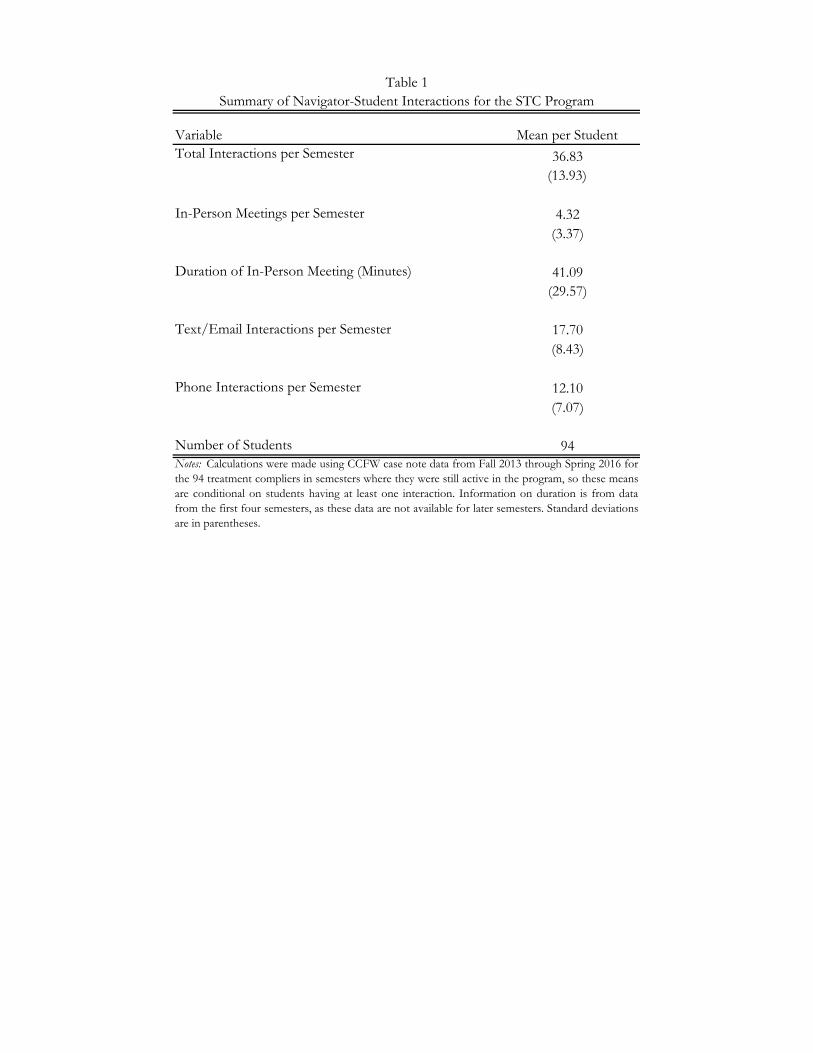
Program guidelines recommend that navigators and students meet in person at least once per
month. However, as described below, during the implementation we evaluated, frequency of in-person
interactions varied widely. To get a sense of the frequency and nature of Navigator-student interactions,
we collected information from Navigator case notes. Table 1 reports summary statistics of all
Navigator-student interactions according to CCFW’s administrative data from fall 2013 through spring
2016 for students enrolled in the study in fall 2013. On average, Navigators interacted with their clients
about 37 times each semester. About half of these interactions were via text or email. About a third of
these interactions were over the phone and just over 10 percent of interactions were in person. When
students did interact in person, meetings lasted a little over 40 minutes. Figure 1 shows the frequency of
discussion topics covered during Navigator-student interactions based on these case notes. We include
as Navigator-student interactions in-person meetings, phone calls, or individualized emails/texts, but
not mass communication such as group emails or administrative reminders. Academic discussion topics
such as class registration and gaining access to tutors were the most popular topics; they were discussed
in over 25 percent of Navigator-student interactions. Work/employment issues were discussed in more
than 12 percent of interactions, which is consistent with the evidence that this issue is one that often
leads low-income students to drop out of community college (Johnson et al., 2011). Almost 9 percent

8
of interactions resulted in referral to other specialized service programs. Housing, finances, and
transportation were each mentioned in at least 5 percent of interactions.
The second main component of the STC program is emergency financial assistance (EFA).
Students in the STC program are eligible to apply for EFA for non-academic expenses or income
shortfalls that could negatively impact a student’s persistence in college. EFA is not meant to constitute
an academic grant or scholarship, but rather to provide the buffer resources that a low-income student
might need to stay in school. To receive EFA, students must successfully demonstrate both that they
have an imminent financial need and that not meeting this need would be detrimental to their academic
progress. Additional factors that determine whether the event would qualify for assistance include the
extent to which the event is foreseeable, controllable, and temporary. Examples of qualified costs
include a car repair, rent and utilities, a bus pass, or emergency medical care. Eligibility for EFA is
restricted to those students with a cumulative GPA of a 2.0 or higher at TCC (unless they are in their
first semester) and who are enrolled in at least 9 credits the semester in which they apply. An individual
student could apply to receive up to $500 per semester, capped at $1,500 total over a three-year period.
A program Funds Coordinator makes determinations for all EFA applications, subject to a supervisor’s
review. Navigators may assist clients in completing the financial assistance application, but they do not
attend the student’s meeting with the Funds Coordinator nor do they intercede with the Funds
Coordinator on behalf of the student. This separation is designed to keep Navigators from having to
deny financial assistance from their own clients.
Based on Funds Coordinator records, over a three-year period, students enrolled into the STC
treatment group (N = 94) submitted 126 requests for EFA. 101 of those requests (82 percent) were
approved, with an average payout of $276. As shown in Figure 2, 35 percent of the funds were granted
for transportation needs, 33 percent for housing, 21 percent for utilities, and 11 percent for other
(school supplies, child care, etc.). About half of the students in the program never applied for any
9
funds, and less than 10 percent of students collected more than $1,001 over the three-year period. After
six semesters, only one STC student had collected the max amount of $1,500.
STC differs from existing interventions in several important ways. First, the wrap-around case
management services are more comprehensive and intensive than those typically available at
community colleges. Navigators worked with each student to address their unique social, financial,
academic, and personal impediments to college success. While other college programs, such as the City
University of New York’s Accelerated Study in Associate Programs (ASAP) and Mesa Community
College’s Connect 4 Success program have some coaching/mentoring associated with the program, this
is not a major focus of these interventions (Scrivener et al., 2015; Felton and Moore, 2013). Second,
the case management services provided by STC are provided by a professional social worker working
for a non-profit agency outside the community college system. These social workers are specifically
trained to deal with personal, non-academic issues for a low-income population.
A third important difference is that the caseloads for STC Navigators are much lower than
those of the typical community college guidance counselor, and are even considerably smaller than
recent experiments aimed at promoting persistence through lower student-to-counselor ratios. The
ASAP intervention boasted a student to advisor ratio between 60:1 and 80:1 (Scrivener et al., 2015), as
compared to a STC student-Navigator ratio of 34:1. A fourth difference, is that the STC case
management services are offered in conjunction with emergency financial assistance.4 The financial
supports provided in ASAP are limited to metro cards, textbooks, and tuition waivers (received by 3-11
percent of students), whereas STC offers a more flexible financial safety net of up to $1,500 dollars for
any negative shock that might affect persistence in school.
The Emergency Financial Assistance (EFA) component of Stay the Course (STC) – in particular
the stand-alone EFA treatment arm – is most comparable to the “Dreamkeepers” program created by
4 Ultimately, our results suggest that providing EFA alone does not improve academic outcomes. However, this evidence does not imply that EFA, offered in conjunction with case management, is ineffective.
10
Scholarship America.5 That program provides monetary assistance to students who face short-term
financial emergencies. A descriptive review conducted by MDRC examined the outcomes of recipients
of Dreamkeepers funds from 11 different schools in the 2004-2006 period and found that recipients
have “disproportionate need” and were “more academically challenged” than the average student, but
their reenrollment rates were roughly comparable to other students (Geckeler et al., 2008). Though the
findings of that report are consistent with the notion that limited financial assistance can promote
persistence, the MDRC study was not an RCT, and the comparisons reported should not be interpreted
as indicative of a causal effect of the program.
IV. THE RANDOMIZED CONTROL TRIAL
The Research Design
To determine the impact of this comprehensive case management program on persistence and
degree completion in community college, we implemented a randomized controlled trial (RCT)
evaluation at Tarrant County College (TCC), a large community college in Fort Worth, Texas enrolling
more than 50,000 students in associate degree and technical programs across five campuses. TCC
students typically come from disadvantaged backgrounds and have very high dropout rates. Among
first-time, degree-seeking students who entered in fall 2011, only 14.8 percent earned a degree in four
years and only 2.6 percent graduated in two years. The leadership at TCC is aware of this challenge and
readily agreed to partner with the research team and service provider to experiment with an
intervention focused on improving persistence and completion. TCC provided dedicated space for the
Navigators to meet privately with students.
The study sample was randomly selected in the fall semester of 2013. The universe for the
sample consisted of the 8,849 students currently enrolled at the Trinity River campus of TCC. The
5 For program details see: https://scholarshipamerica.org/dreamkeepers/
11
research demonstration project took place at a single campus because it was more feasible for CCFW to
implement this new intervention on a single campus. RCT eligibility was limited to students who met
the following criteria: 1) enrolled in at least 9 credit hours at TCC; 2) degree seeking; 3) age 18 years or
older; 4) satisfied at least 1 Texas Success Initiative (TSI) standard; 5) newly enrolled or have earned a
Cumulative GPA of at least 2.0 at TCC to date; 6) accumulated less than 30 credit hours at TCC to
date; and 7) Pell eligible or fall below 200% of the poverty line (based on reported income on the
FASFA). Eligibility criteria (1) through (5) are intended to target students who may feasibly complete a
degree in three years. The credit cap in eligibility criteria (6) is meant to target students who might be at
risk of dropping out; a student with more than 30 credits is perceived to be successfully on a path to
graduation.7 The final eligibility rule is to target the demonstration sample to low-income students.
Imposing these eligibility criteria left us with a final study sample of 1,168 students.
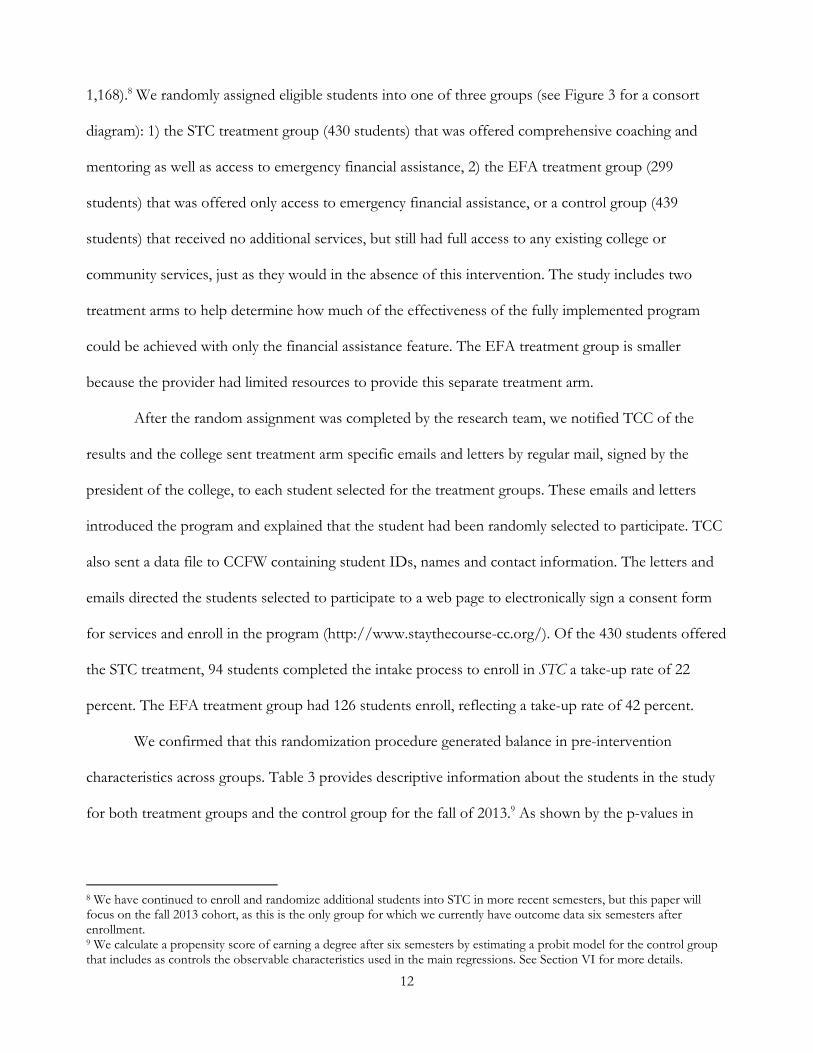
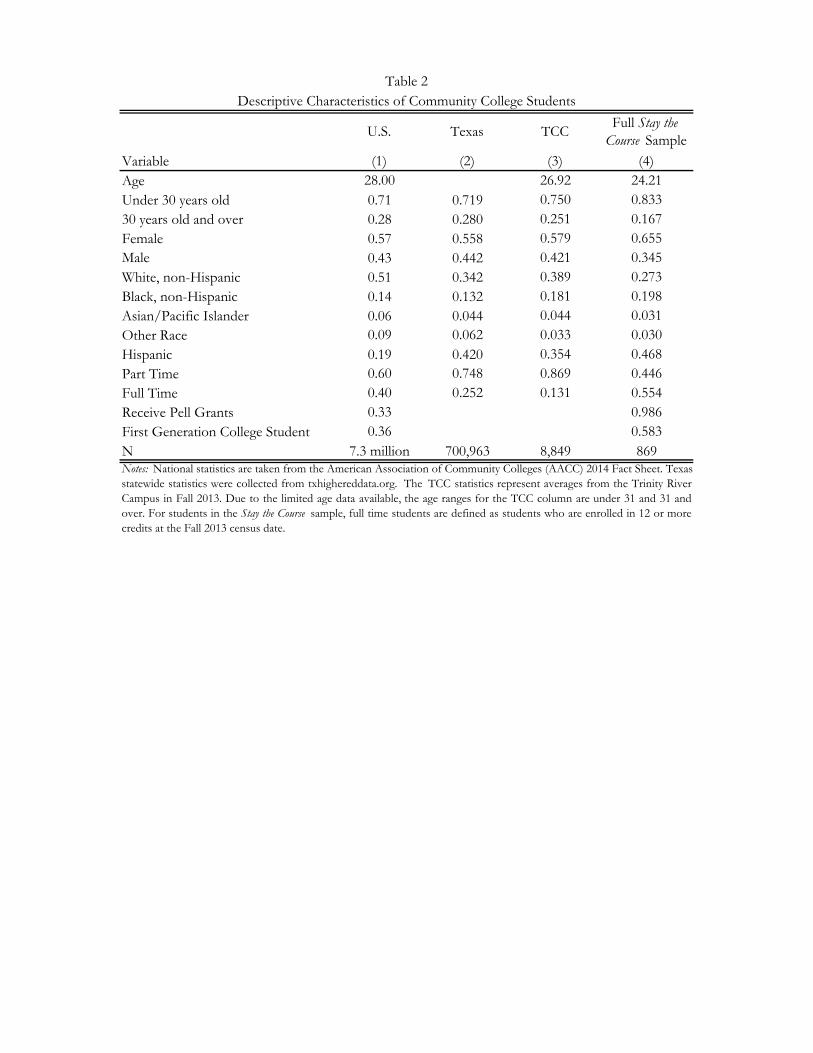
Table 2 reports summary statistics on all TCC Trinity River Campus students, STC study
participants, and community college students at the state and national level. Overall, TCC students are
similar to other community college students around the nation, with the exception of TCC enrolling
considerably more Hispanic and part-time students. STC participants differ from typical TCC students
and the average community college student in a few important ways. STC students are more likely to be
female and are on average, over two years younger than other TCC students. Students in the study are
much more likely to be full time when compared to the rest of the TCC campus and much more likely
to receive Pell grants when compared to the national average. The sharp differences in part time status
and Pell receipt is due to the eligibility criteria described above.
At the close of the academic enrollment period on August 20, 2013, the Office of Institutional
Intelligence and Research (OIIR) at TCC extracted data necessary to identify the eligible sample (N =
7 At TCC, an associate’s degree typically requires 60 credit hours.
12
1,168).8 We randomly assigned eligible students into one of three groups (see Figure 3 for a consort
diagram): 1) the STC treatment group (430 students) that was offered comprehensive coaching and
mentoring as well as access to emergency financial assistance, 2) the EFA treatment group (299
students) that was offered only access to emergency financial assistance, or a control group (439
students) that received no additional services, but still had full access to any existing college or
community services, just as they would in the absence of this intervention. The study includes two
treatment arms to help determine how much of the effectiveness of the fully implemented program
could be achieved with only the financial assistance feature. The EFA treatment group is smaller
because the provider had limited resources to provide this separate treatment arm.
After the random assignment was completed by the research team, we notified TCC of the
results and the college sent treatment arm specific emails and letters by regular mail, signed by the
president of the college, to each student selected for the treatment groups. These emails and letters
introduced the program and explained that the student had been randomly selected to participate. TCC
also sent a data file to CCFW containing student IDs, names and contact information. The letters and
emails directed the students selected to participate to a web page to electronically sign a consent form
for services and enroll in the program (http://www.staythecourse-cc.org/). Of the 430 students offered
the STC treatment, 94 students completed the intake process to enroll in STC a take-up rate of 22
percent. The EFA treatment group had 126 students enroll, reflecting a take-up rate of 42 percent.
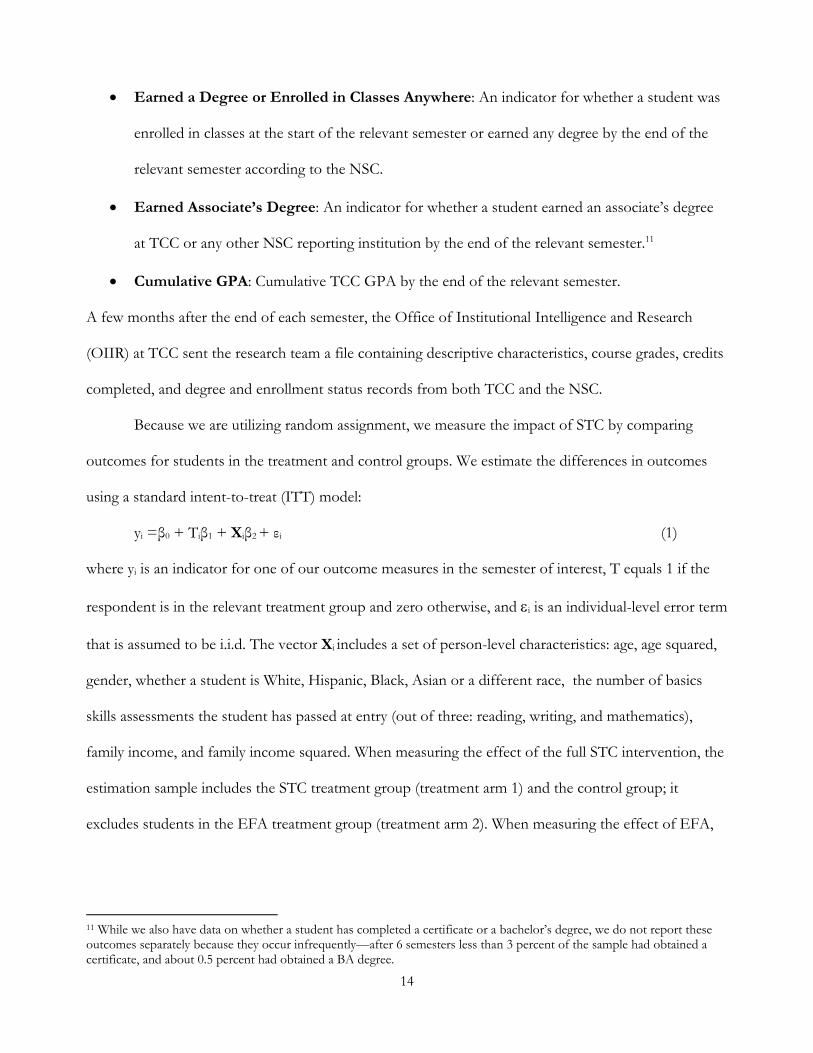
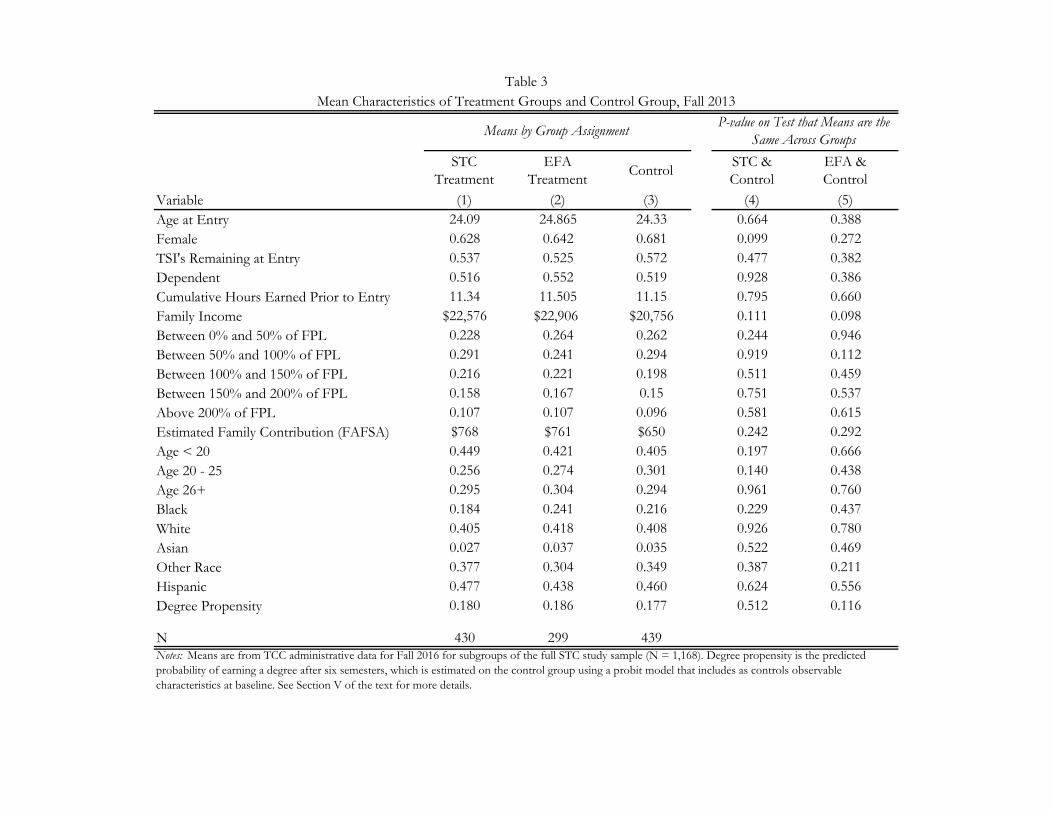
We confirmed that this randomization procedure generated balance in pre-intervention
characteristics across groups. Table 3 provides descriptive information about the students in the study
for both treatment groups and the control group for the fall of 2013.9 As shown by the p-values in
8 We have continued to enroll and randomize additional students into STC in more recent semesters, but this paper will focus on the fall 2013 cohort, as this is the only group for which we currently have outcome data six semesters after enrollment. 9 We calculate a propensity score of earning a degree after six semesters by estimating a probit model for the control group that includes as controls the observable characteristics used in the main regressions. See Section VI for more details.

13
column 4, in all cases the data fail to reject the hypothesis that the mean characteristics are the same
across the STC treatment group and the control group, indicating that the randomization procedure
generated appropriate balance across groups. We find similar evidence of balance when comparing the
EFA treatment group to the control group.
Data and Methods
Our empirical analysis relies on student level administrative school records provided to us from
TCC. These data include the student baseline characteristics that were used to determine eligibility,
additional characteristics used in the analyses, and academic outcomes. Through TCC we were able to
link these records to data from the National Student Clearinghouse (NSC), which allows us to observe
whether a student transfers to a two- or four-year college and completes a degree at another post-
secondary institution.10
The outcomes we consider include:
Enrolled in Classes at TCC: An indicator for whether a student was enrolled in classes at
TCC in the relevant semester, which is defined as spring 2016 in six semester results, spring
2015 in four semester results, and spring 2014 in two semester results.
Enrolled in Classes Anywhere: An indicator for whether a student was enrolled in classes at
TCC or any other NSC reporting institution at the start of the relevant semester.
Earned a Degree Anywhere: An indicator for whether a student earned a degree (certificate,
associate’s, or bachelor’s) at TCC or any other NSC reporting institution by the end of the
relevant semester.
10 Founded in 1993 by the higher education community, the National Student Clearinghouse is a nonprofit and nongovernmental organization that works with more than 3,600 colleges and universities to provide accurate longitudinal data on student outcomes. The NSC participating colleges enroll 98% of all students in public and private U.S. institutions.
14
Earned a Degree or Enrolled in Classes Anywhere: An indicator for whether a student was
enrolled in classes at the start of the relevant semester or earned any degree by the end of the
relevant semester according to the NSC.
Earned Associate’s Degree: An indicator for whether a student earned an associate’s degree
at TCC or any other NSC reporting institution by the end of the relevant semester.11
Cumulative GPA: Cumulative TCC GPA by the end of the relevant semester.
A few months after the end of each semester, the Office of Institutional Intelligence and Research
(OIIR) at TCC sent the research team a file containing descriptive characteristics, course grades, credits
completed, and degree and enrollment status records from both TCC and the NSC.
Because we are utilizing random assignment, we measure the impact of STC by comparing
outcomes for students in the treatment and control groups. We estimate the differences in outcomes
using a standard intent-to-treat (ITT) model:
yi =β0 + Tiβ1 + Xiβ2 + εi (1)
where yi is an indicator for one of our outcome measures in the semester of interest, T equals 1 if the
respondent is in the relevant treatment group and zero otherwise, and i is an individual-level error term
that is assumed to be i.i.d. The vector Xi includes a set of person-level characteristics: age, age squared,
gender, whether a student is White, Hispanic, Black, Asian or a different race, the number of basics
skills assessments the student has passed at entry (out of three: reading, writing, and mathematics),
family income, and family income squared. When measuring the effect of the full STC intervention, the
estimation sample includes the STC treatment group (treatment arm 1) and the control group; it
excludes students in the EFA treatment group (treatment arm 2). When measuring the effect of EFA,
11 While we also have data on whether a student has completed a certificate or a bachelor’s degree, we do not report these outcomes separately because they occur infrequently—after 6 semesters less than 3 percent of the sample had obtained a certificate, and about 0.5 percent had obtained a BA degree.
15
the estimation sample includes the EFA treatment group and the control group; it excludes students in
treatment arm 1.
Our main results focus on outcome measures six semesters after enrollment in the study, but to
examine how any impact of the intervention changes over time, we also report some shorter-term
results. Because many students assigned to the treatment groups do not participate in services (the take-
up rate was 22 percent for the STC treatment group and 42 percent for the EFA treatment group), we
also estimate the effect of the intervention for those who participate, or the treatment-on-the-treated
(TOT) effect. Specifically, we estimate:
yi =γ0 + Pγ1 + Xiγ2 + ηi (2)
where Pi is an indicator for participation in the program. We estimate these effects via an instrumental
variable (IV) model, using assignment to treatment (Ti) as an instrument for participation in the
program (Pi). Program participation (or take-up) is defined as attending the intake meeting and
completing an intake form.
V. SIX SEMESTER RESULTS
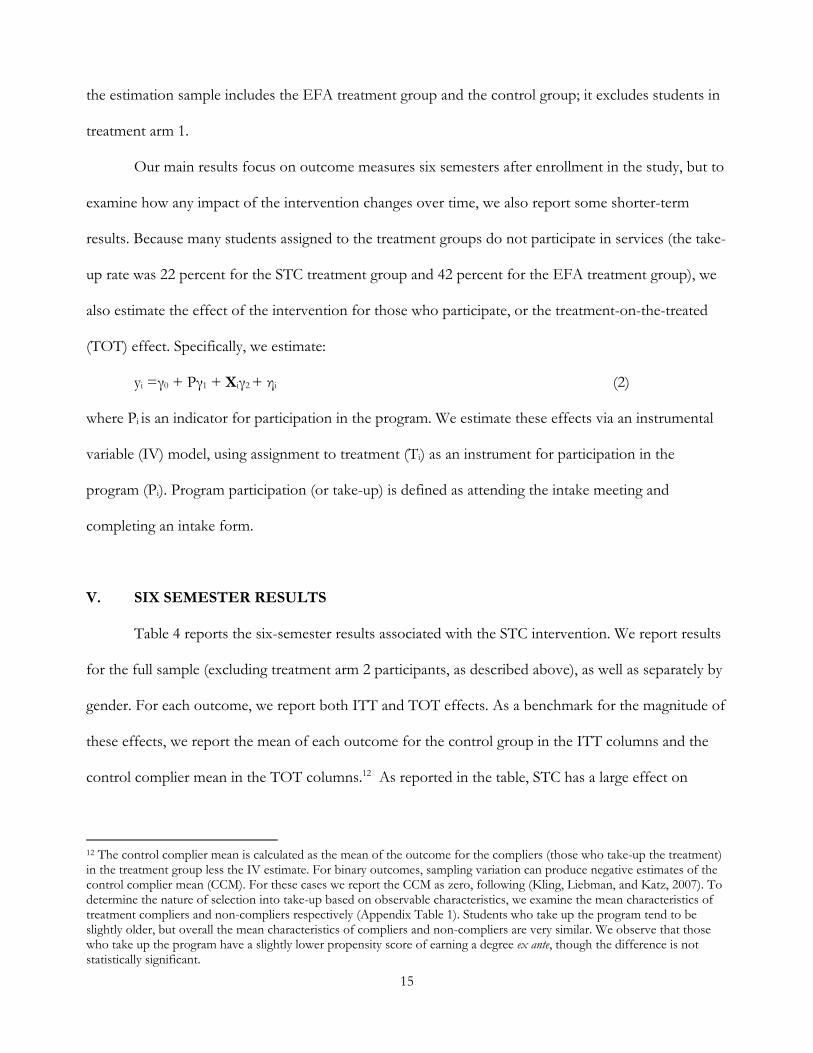
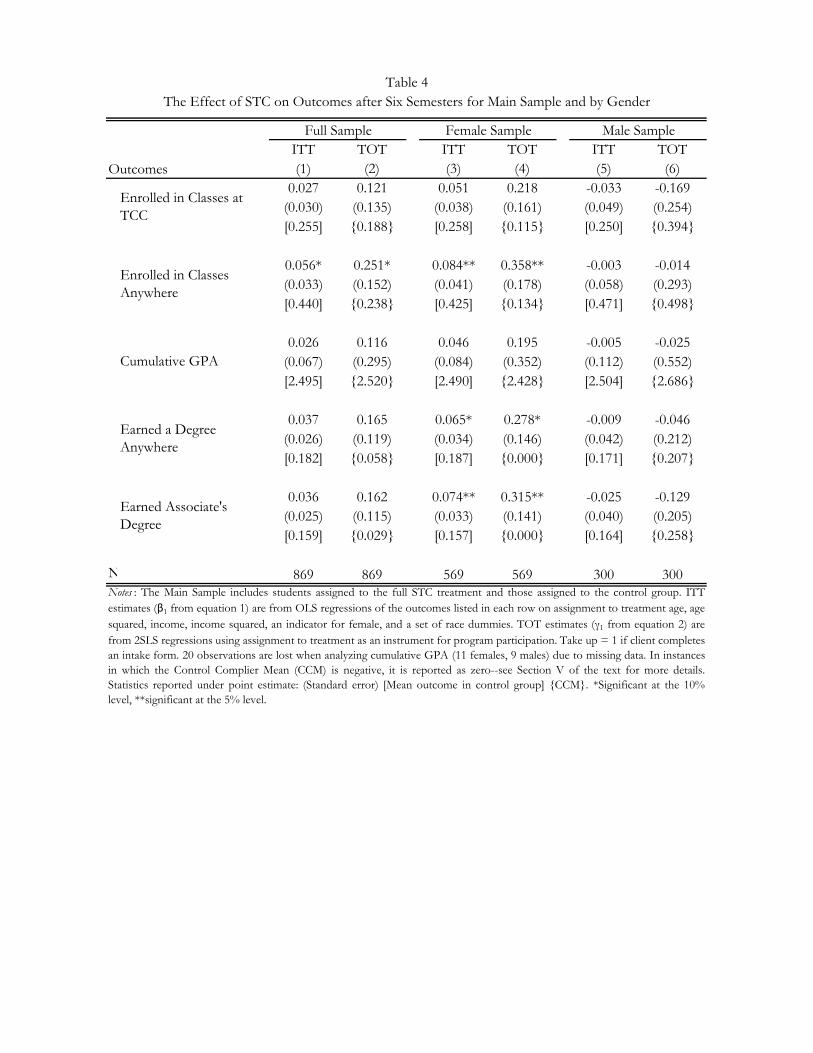
Table 4 reports the six-semester results associated with the STC intervention. We report results
for the full sample (excluding treatment arm 2 participants, as described above), as well as separately by
gender. For each outcome, we report both ITT and TOT effects. As a benchmark for the magnitude of
these effects, we report the mean of each outcome for the control group in the ITT columns and the
control complier mean in the TOT columns.12 As reported in the table, STC has a large effect on
12 The control complier mean is calculated as the mean of the outcome for the compliers (those who take-up the treatment) in the treatment group less the IV estimate. For binary outcomes, sampling variation can produce negative estimates of the control complier mean (CCM). For these cases we report the CCM as zero, following (Kling, Liebman, and Katz, 2007). To determine the nature of selection into take-up based on observable characteristics, we examine the mean characteristics of treatment compliers and non-compliers respectively (Appendix Table 1). Students who take up the program tend to be slightly older, but overall the mean characteristics of compliers and non-compliers are very similar. We observe that those who take up the program have a slightly lower propensity score of earning a degree ex ante, though the difference is not statistically significant.
16
persistence in school after six semesters, but the estimate is only marginally significant at the 10 percent
level. The point estimate indicates that students in the treatment group are 5.6 percentage points more
likely to be enrolled in school after six semesters. Adjusting for incomplete take-up, the TOT estimate
indicates that those who participate in STC are 25.1 percentage points more likely to persist, more than
double the rate for the control group. For the full sample, all the other estimates are positive, indicating
improved outcomes for the treatment group, put none of these estimates are statistically significant.
The positive effect of STC is particularly noticeable for females. Females assigned to the STC
treatment group are 8.4 percentage points more likely to still be enrolled in college after six semesters
than females in the control group, and this difference is statistically significant. The TOT estimate
(0.358) indicates that female program participants were nearly three times more likely to persist in
college relative to the CCM. While the effect for completing any degree is only marginally significant,
there is a large and statistically significant effect on completing an associate’s degree for females. Three
years after enrollment in the study, females in the treatment group are 7.4 percentage points more likely
to have completed an associate’s degree than females in the control group, corresponding to a TOT
effect of 35.8 percentage points. There is little evidence of a positive effect of STC participation for
male students.
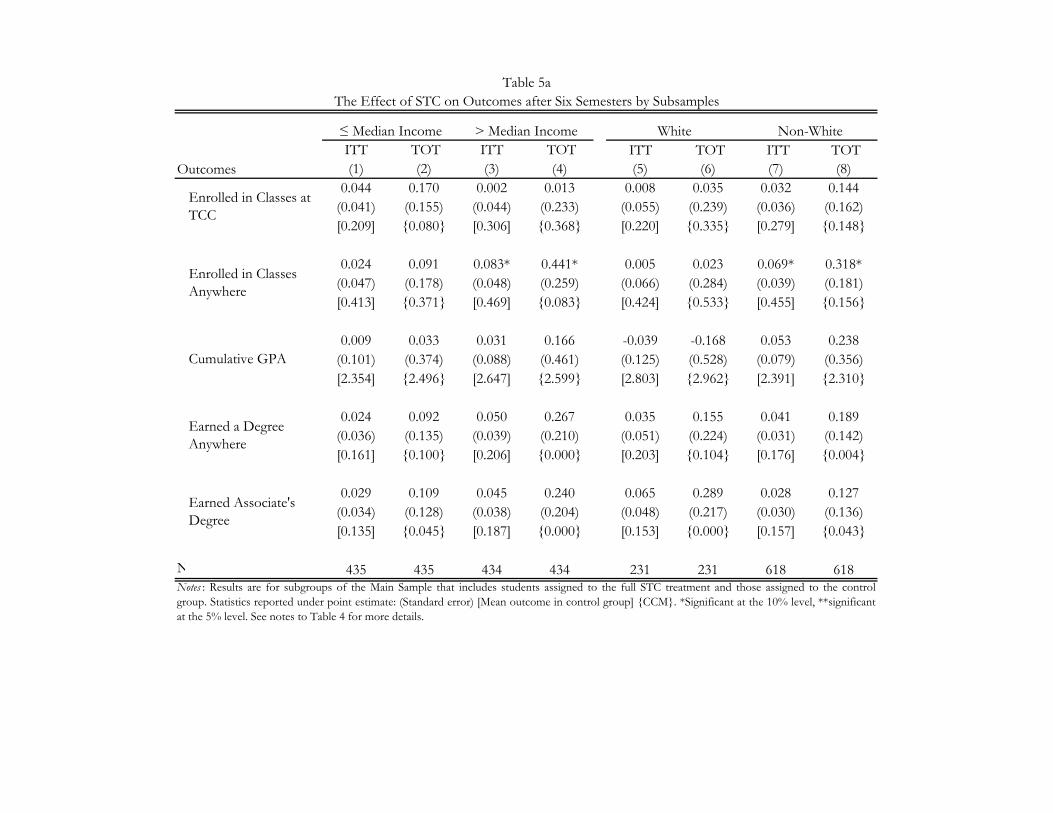
We also investigate whether there are heterogeneous treatment effects by other key student
characteristics. The data do not reveal any meaningful statistical differences along obvious cuts of the
sample. Table 5a reports results separately for white and non-white students and separately for those
with family income above and below the STC sample median. Those in the STC treatment group with
family income greater than the median family income of the study sample are 8.3 percentage points
(standard error 4.8) more likely to stay enrolled in classes through their sixth semester (Table 5a,
column 3), which implies a TOT effect of 44.1 percentage points. The ITT estimate for students with
lower levels of family income implies a much smaller, 2.4 percentage point increase (standard error 4.7).
Given the standard errors, we cannot reject similar effects across income groups.
17
In terms of a comparison between white and non-white students, recall that the STC sample is
majority non-white (more than 70 percent). Accordingly, the estimated effects for non-white students
are generally quite similar to what we report for the full sample in Table 4. The estimated TOT effect
for non-white students implies a 31.8 percentage point increase in the likelihood of being enrolled in
college after six semesters (standard error 18.1). However, when we limit the sample to whites, the
estimated TOT estimate is very small (0.023) but has a large standard error (0.284). Given the large
standard error associated with that estimate, we cannot reject similar effects by race.
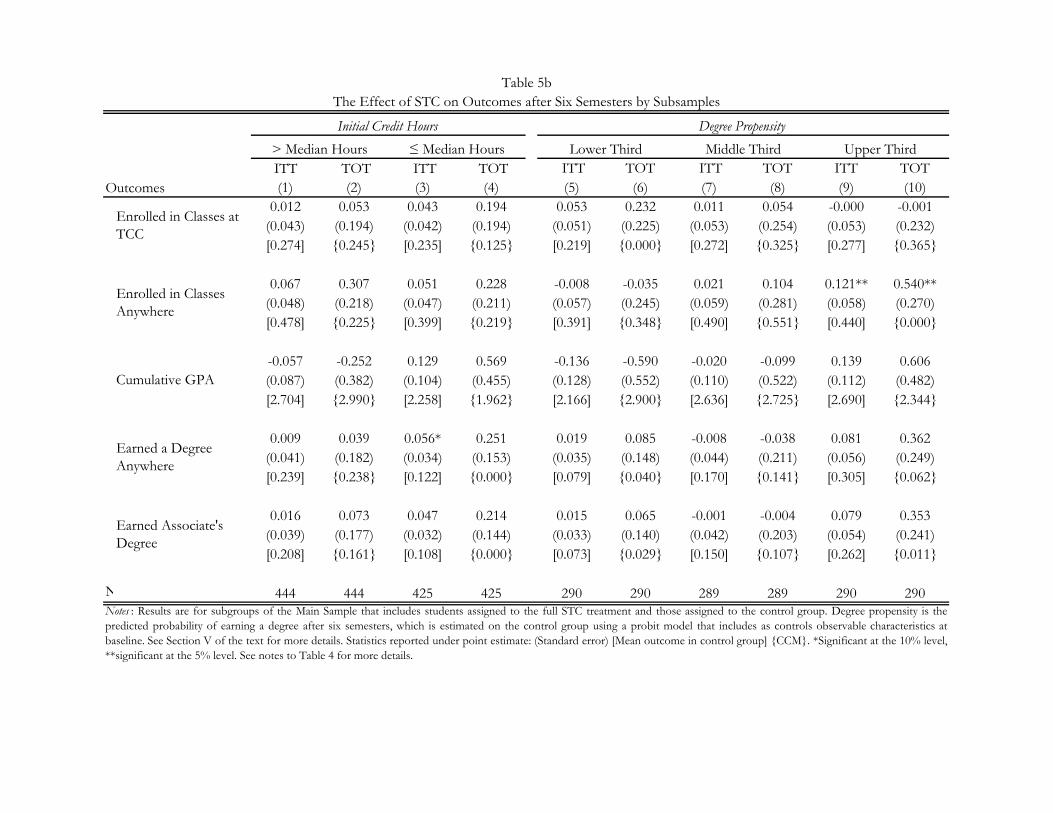
Table 5b reports estimates separately for students with more or fewer initial credit hours than
the median and by “degree propensity,” or the estimated propensity to earn a degree based on baseline
characteristics. Our motivation for looking separately by credit hours was to observe whether students
who appeared ex ante better prepared demonstrated larger (or smaller) treatment effects. The data do
not indicate statistical differences across students based on this simple cut of the data. To investigate
this possibility more formally, we estimate a baseline probability of degree completion based on a full
set of initial characteristics. To estimate this degree propensity, we use the sample from the control
group and estimate a probit as a function of the observed characteristics at the time of randomization.
We then use the estimated coefficients to predict the probability of completing a degree for everyone in
the sample. We then divided the study sample into three subsamples based on the students’ predicted
probability of completing a degree. Results for these subsamples show that STC was most effective for
students in the upper third of propensity scores. The results suggest that STC increases enrollment in
classes anywhere across the lower, middle and upper third of the degree propensity distribution by -3.5,
10.4, and 54.0 percentage points, respectively, with this last result being statistically significant. The
estimated TOT impact for the group in the middle third of the propensity score is a large relative size
(10.4 percentage points on a base of 55 percent) but the standard errors on the coefficient is too large
to make any meaningful conclusion about the results for this group. The point estimates also indicate
that those in the top third of propensity scores were more likely to earn a degree, but this difference is
18
not statistically significant. Similarly, the effect of STC on GPA is also the largest for those in the top
third, but the estimate is not significant. The results for those in the bottom third indicate that STC had
little effect on academic outcomes for this group (Table 5b, column 5). The point estimates for this
group are all small, not statistically significant, and occasionally have the wrong sign.
All of the analysis discussed up to this point has focused on the differences in outcomes
between the STC treatment group, which was offered comprehensive case management and access to
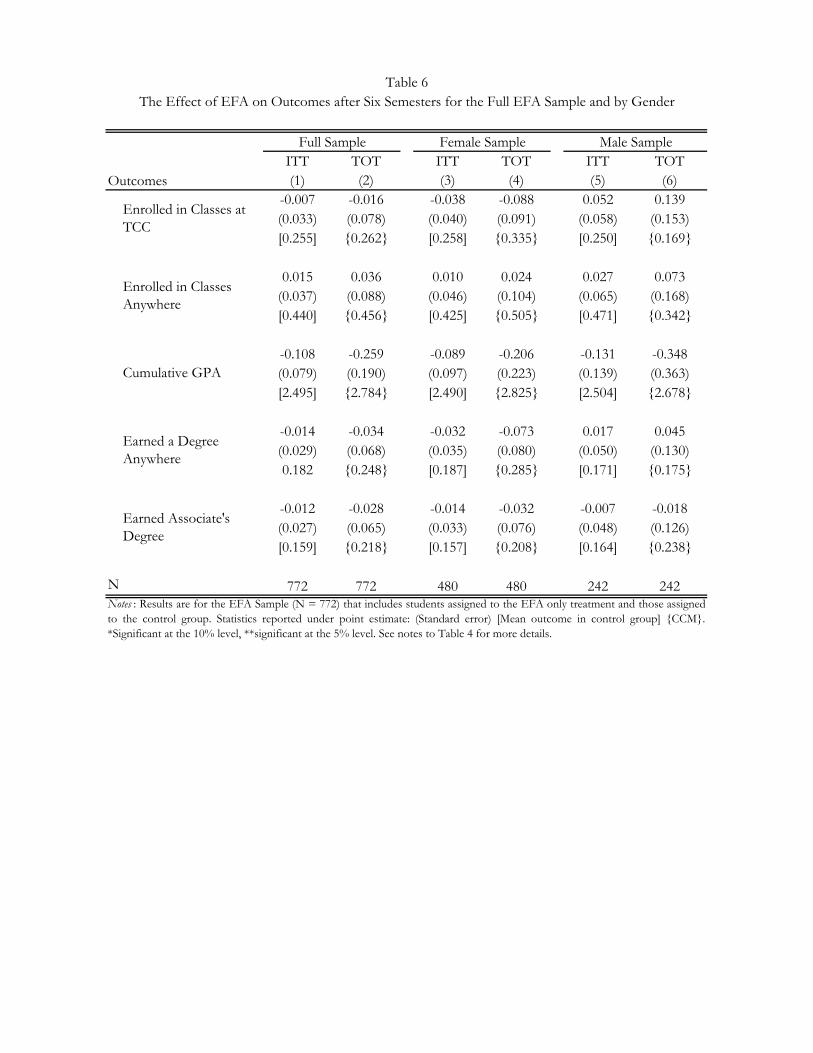
emergency financial assistance, and the control group. Our research design also allows us to directly
estimate the effect of providing only emergency financial assistance, by comparing the EFA treatment
group to the control group. We report these results in Table 6 for the same outcomes reported above.
After six semesters, those who had access to emergency financial assistance earned degrees and
remained enrolled in classes at remarkably similar rates to the control group. We find no statistically
significant differences in outcomes in the overall sample or for the male and female subsamples. In
nearly all cases the point estimates are small, and in many cases they are negative. However, given the
fairly large standard errors we are unable to reject the hypothesis of small positive effects. Although this
evidence suggests that EFA, offered by itself, does not have a sizeable impact on persistence and degree
completion in community college, this does not mean that EFA is not effective when offered in
conjunction with other services as is the case with the full STC intervention.
VI. TWO- AND FOUR-SEMESTER RESULTS
Because we have received outcome data from TCC each semester, we are able to examine how
the impact of STC evolves over time. Comparing short and medium-term outcomes helps us
understand whether the intervention has an immediate impact or whether effects appear more
gradually. In particular, many community college students drop out after just one or two semesters, so
an intervention like STC has the potential to affect outcomes nearly immediately. In our study sample,
about 20 percent of students drop out by the end of the second semester.
19
Table 7a reports two semester results for the same six outcomes as reported after six semesters
in Table 4, plus the additional outcome of total credits earned. We do not report this outcome with the
six-semester results because we only observe credits earned at TCC and by six semesters after
enrollment in the study only about a quarter of the study sample is still enrolled at TCC. After just two-
semesters, however, more than three-quarters of the study sample is still enrolled at TCC, so we
observe total credits for most of the sample. We impute credits for students who are no longer enrolled
at TCC, but are classified in the NSC data as enrolled in classes somewhere. For these groups we
impute credits earned for semesters where these data are missing using information on credits earned in
the most recent semester for which credits are observed for that student.
The data indicate that after just two semesters, not enough time has passed for students to
obtain a degree—only 0.7 percent of the control group has completed a degree by this point. It is thus
not surprising that we find no effect on degree completion for the full sample or for the female and
male subsamples. However, the data indicate that two semesters is enough time to observe an effect on
intermediate outcomes. The TOT estimate for enrolled in classes at TCC indicates that STC
participation leads to a 28.9 percentage point increase (standard error 12.1). In terms of gender
comparisons, the data already start to show some indication that the effect is stronger for females.
When looking at whether the student is enrolled anywhere, however, we do not see a noticeable
difference between the treatment and control groups after two-semesters. It appears that after only two
semesters, STC is effective at keeping kids from transferring from TCC, but not necessarily at
increasing overall persistence in community college. We also find that the treatment group has
accumulated more credits. STC participants have nearly 5 more credit hours (the equivalent of 1.66
additional classes), but this difference is marginally significant.
Table 7b reports four-semester results, which includes the summer between years one and two.
The summer between the first and second year is a time during which many community college
students drop out. This is evident in our four-semester results, by which point more than half the
20
sample is no longer at TCC, and only about three-fifths of the sample is still enrolled in school. After
four semesters, we still see the positive effect on credit hours that was evident after two semesters, and
the effect is statistically significant for females. However, we still see no effect of STC on degree
completion or enrollment at any college, and we no longer see an effect of STC on enrollment at TCC.
Together, our results after two, four, and six semesters indicate that the intervention did not
have a meaningful impact on enrollment in college or degree completion until after six semesters. This
suggests that the STC intervention is more effective at keeping students in school after they have been
enrolled for several semesters than it is at preventing dropouts in the short-run. Perhaps this is because
it takes time for the Navigators and students to develop the relationship that allows comprehensive
coaching and mentoring to have a substantive impact on persistence and completion, so the impact of
these efforts on success in school is not evident until after a few years.
Another possible explanation is related to the implementation of the program. Throughout the
course of this intervention, the provider, CCFW, has been monitoring what services the Navigators
provide and how they provide it in an effort to ensure fidelity of implementation. In the Spring 2015
semester, the provider re-emphasized to the Navigators the importance of regular, direct interaction
with their students, and case notes indicate a rise in student-Navigator interactions after this point. This
increased engagement may have contributed to the impact of the program after six semesters.
VII. DISCUSSION OF RESULTS
Estimated benefit-to-cost ratio
The Stay the Course (STC) intervention is a “heavy touch” intervention with relatively high per
student costs. It is thus important to consider the positive effects of the program alongside the costs.
The total cost per student for three years of STC case management (including access to EFA) is $5,640,
or $1,880 per year. This cost includes STC staff salary (manager, Navigators, and an EFA coordinator),
fringe benefits, training, and EFA payouts. To measure program benefits, we plan to follow the

21
students in this RCT demonstration project for additional years and link their student records to
administrative earnings records. We will then compare the causal impact on earnings to the program
costs. However, until enough time has elapsed to permit such an earnings evaluation, we cannot
calculate a benefit to cost ratio based on realized earnings. Instead, we conduct a back-of-the-envelope
calculation using average earnings differences observed in national survey data.
Our main IV point estimate for the full sample indicates that for each additional student who
takes up services, the number of associate’s degrees increases by 0.16 (TOT estimate in Table 4). Data
from the 2015 five-year ACS for individuals age 25-39 indicate that those with an associate’s degree
earn about $7,050/year more than people with less than a year of college education.[1] In addition, the
IV point estimate for the full sample suggests that STC participation increases enrollment in school
after six semesters by 25 percentage points (TOT estimate in Table 4 for “enrolled in classes
anywhere”). Some of this increase is the result of students who persist in order to obtain a degree, so
we net out the additional persistence that comes from degree completion (i.e. 0.25 – 0.16 = 0.09), and
assume greater persistence means enrolling in college beyond one year. This implies that for each
additional treated student who does not earn an associate’s degree, 0.09 more students persist in school
beyond one year. ACS data show that individuals with at least a year of college (without an associate’s
degree) earn about $2,200 more than people with less than a full year of college.
Combining these estimated returns to community college with our estimates from the full
sample indicates that treating an additional student increases annual earnings by 0.16*7050 + 0.09*2200
= $1,326. Comparing this benefit to the total three-year program cost of $5,640, indicates that program
costs are offset by increased earnings in about 4.25 years. This estimate overstates the pay-back period
as it does not allow for the possibility that those with an associate’s degree eventually earn a bachelor’s
degree.
22
Additional interpretation issues
The estimated results raise three critical questions. First, why did the program appear to help
females but not males? Second, why did the EFA program not yield any discernible benefits? Third, are
these results replicable? We will pursue further answers to these questions in future research, but offer
some speculative observations here.
On the issue of the female-specific benefits, we note that all case managers in the program were
female. This was not by design, but rather a consequence of the social work profession, from which
STC navigators are drawn, being overwhelmingly dominated by females. Perhaps a program that so
heavily relies on personal connection is more effective when the mentor/mentee pair is of the same
gender. Future implementations of the program would benefit from the recruitment of male
caseworkers to the Navigator role so that this hypothesis could be explored. A second possibility is that
many of the females in the program sample are single mothers who would have previous familiarity
with a case management relationship through engagement with safety net programs. The research team
is in collaboration with a researcher with a PhD in social work who has experience studying the
implementation of programs. We anticipate that this collaboration and the associated implementation
report(s) will yield insight into the reasons for this gender difference in treatment effects.
As described above, we also investigated the implementation of a low cost alternative to the full
STC program: access to emergency financial assistance (EFA) without associated case management.
This treatment arm yielded no measurable benefits, and in some cases, the data indicated that the
program might lead to a worsening of outcomes. Note that this does not necessarily imply that EFA is
not an important component of the full intervention that also includes comprehensive coaching and
mentoring, as there might be important interactions between the two components of STC. It would
seem that giving students access to cash aid without the requirement or benefit of having a case
manager to help address the causes of the underlying financial distress is not sufficient for this very
low-income population. Perhaps with a less disadvantaged population, a one-time infusion of cash
23
could help. But for students in our sample, who all have family income less than 200 percent of the
FPL, we found no evidence that enrollment persistence is increased simply by having access to up to
$1,500 to cover non-tuition financial shocks.
With regard to replicability, we emphasize that this RCT implementation of Stay the Course was
designed with the goal of subsequent replication. The research team has worked closely with our
implementing partners over the past three years to avoid “mission drift” and to keep the program
elements focused and measurable. We are now collaborating with the implementing agency partner,
CCFW, to roll out the program in an RCT context on other college campuses in Fort Worth. In
addition, we are in the process of working with other social service agencies outside of Fort Worth to
implement the program with an RCT research design on other campuses. It will be instructive to
investigate whether the results are reproduced with a different implementing agency and set of social
workers, with a different student population, and in a different community college setting.
A related replication question is whether it is fundamental to the effectiveness of the
intervention that the program is implemented by a third-party non-profit rather than community
college counselors. This too is something worth directly testing in future implementations. We offer the
observation that the implementing agency, CCFW, considers individualized case management to be
their “bread and butter,” or as we might say, it is perhaps appropriately considered their comparative
advantage. To the best of our understanding, this tends not to be the particular focus or training of
community college counselors. Perhaps that dedicated focus is what makes this application of the
program so effective. If individuals without a background in social work, or with a different
background in social work, were to serve as Navigators, the results might be different. Again, this
points to a need for replication to learn under what contexts specifically such a program can be
expected to generate beneficial effects for students.
That said, the general lesson of this paper extends beyond the particular application of this case
management program. The main finding is that a program that focuses on addressing the individual set
24
of barriers that arise to threaten a low-income student’s persistence in community college can be an
effective way to improve educational outcomes and increase degree completion rates. This supports the
notion that low-income students face obstacles that extend beyond academic under-preparation that
they often cannot overcome without the help of a dedicated case manager.
VIII. CONCLUSION
This paper has investigated whether a case-management intervention could increase the rates of
enrollment persistence and degree completion among low-income community college students. To
study this question, we conducted an RCT evaluation of the Stay the Course intervention. The main
elements of this program are comprehensive case management conducted by a trained social worker
with a caseload of no more than 34 students at a time, along with access to limited emergency financial
assistance for non-tuition needs. The paper has described an RCT evaluation of this program
implemented by the research team in partnership with a local social service agency at a community
college campus in Fort Worth, Texas.
The results indicate that female students randomly assigned to the case management program
showed significant increases in school persistence and degree completion through six semesters.
Intention-to-treat estimates based on regression-adjusted differences between females randomly
assigned to case management services and those randomly assigned to a control group show a 7.4
percentage point increase in the likelihood of earning an associate’s degree (standard error of 3.3), off a
control group mean of 15.7 percent. This translates into a treatment-on-the-treated effect of 31.5
percentage points (standard error of 14.1).
Point estimates for the full sample of females and males combined are positive, but not
statistically significant. We report a back-of-the-envelope calculation that takes as program benefits the
point estimates for the full sample combined with projected earnings increases. This calculation
suggests that the benefits of the program, as captured by increased earnings, exceeds the per-student
25
costs ($5,640 total for three years of enrollment) after only 4.25 years in the workforce post schooling.
There is no evidence of a positive effect of a limited version of the program that only offered access to
emergency financial assistance (EFA) without associated case management services. We offer
speculative explanations above for why the program was particularly effective for females and why the
EFA-only treatment did not lead to positive outcomes.
This paper contributes to multiple literatures. First, it contributes to the literature on college
completion, in particular, the sets of studies focusing on ways to increase college completion rates
among low-income students. As noted in the introduction, income gaps in college completion have
widened despite expansions to the Pell Grant program that have made financial aid more generous for
low-income families (Demming, 2016). Research and policy attention to this challenge has tended to
focus on interventions run through community colleges themselves, in particular, academic programs
and enhanced school counseling. The research demonstration project studied in this paper is novel in
that it is an intensive case-management program run by a third party non-profit with a particular
expertise in case management.
The paper contributes more generally to the literature on anti-poverty strategies and ways to
effectively help individuals achieve economic self-sufficiency. There is increasing interest in the role of
case management in helping individuals who live with the associated challenges of poverty. Case
management takes a holistic approach to helping individuals and families address a range of barriers,
including help with physical and mental health limitations, the need for housing, transportation, and
childcare support, and other potential barriers. This paper has demonstrated that case management can
be a cost-effective way to increase rates of educational persistence and degree completion among poor
and near poor students. Future work will follow these same students to investigate longer term effects
on earnings. A supplementary project being conducted by a subset of the research team is investigating
the effectiveness of case management in improving a wide variety of economic outcomes for a non-
student population in the same community. Together, this body of research will contribute to our

26
collective knowledge about the types of barriers facing low-income individuals and the most cost-
effective ways of helping them achieve economic security.
27
References
Angrist, Joshua, Daniel Lang, and Phil Oreopoulos. 2009. “Incentives and Services for College Achievement: Evidence from a Randomized Trial.” 1(1): 136-163.
Aud, Susan, et al. 2013. "The Condition of Education 2013. NCES 2013-037." National Center for Education Statistics.
Bailey, Thomas, Davis Jenkins, and Timothy Leinbach. 2015. "What We Know About Community College Low-Income and Minority Student Outcomes: Descriptive Statistics from National Surveys." Columbia University, Teachers College, Community College Research Center.
Bailey, Thomas. 2009. "Challenge and Opportunity: Rethinking the Role and Function of Developmental Education in Community College." New Directions for Community Colleges 2009(145): 11-30.
Barr, Michael and Rebecca Blank. 2009. Insufficient Funds: Savings, Assets, Credit, and Banking Among Low-Income Households. New Rork: Russell Sage Foundation.
Baum, Sandy, and Judith Scott-Clayton. 2013. "Redesigning the Pell Grant Program for the Twenty-First Century." The Hamilton Project, Discussion Paper 2013-04.
Bean, John, and Barbara Metzner. 1985. "A Conceptual Model of Nontraditional Undergraduate Student Attrition." Review of Educational Research 55(4): 485-540.
Bertrand, Marianne, Sendhil Mullainathan, and Eldar Shafir. 2004. "A Behavioral-Economics View of Poverty." American Economic Review 94(2): 419-423.
Bettinger, Eric P., and Rachel B. Baker. 2014. “The Effects of Student Coaching: An Evaluation of a Randomized Experiment in Student Advising.” Educational Evaluation and Policy Analysis 36(1): 3-19.
Community College Research Center, “http://ccrc.tc.columbia.edu/.”
U.S Department of Education, "http://www.ed.gov/."
"Diploma to Nowhere." Strong American Schools. (2008).
Felton, Janet, and Jennifer M. Moore. "Connect 4 Success. Developmental Education and Mentoring." Mesa Community College. http://www.compact.org/wp-content/uploads/2013/03/C2C-MCC-FINAL.pdf
Geckeler, Christian, Carrie Beach, Michael Pih, and Leo Yan. 2008. "Helping Community College Students Cope with Financial Emergencies: Lessons from the Dreamkeepers and Angel Fund Emergency Financial Aid Programs." DMRC.
Goldrick-Rab, Sara. 2010. "Challenges and Opportunities for Improving Community College Student Success." Review of Educational Research 80(3): 437-469.
Grubb, W. Norton. 2006. “’Like, what do I do now?’: The Dilemmas of Guidance Counseling.” In T. Bailey and V. Morest (Eds.), Defending the Community College Equity Agenda. Baltimore, MD: Johns Hopkins University Press, 195-222.
Haskins, Ron, and Cecilia Elena Rouse. 2008. "Education and Economic Mobility." Brookings Institution: Economic Mobility Project.
Johnson, Jean, Jon Rochkind, Amber Ott, and Samantha DuPont. 2011. "With Their Whole Lives Ahead of Them: Myths and Realities About Why So Many Students Fail to Finish College." Public Agenda. http://files.eric.ed.gov/fulltext/ED507432.pdf
28
Kane, Thomas, and Cecilia Rouse. 1995. "Labor-Market Returns to Two and Four-Year College." American Economic Review 1983(3): 11-30.
Kling, Jeffrey R., Jeffrey B. Liebman, and Lawrence F. Katz. 2007. "Experimental Analysis of Neighborhood Effects." Econometrica 75(1): 83-119.
Radford, Alexandria, Lutz Berkner, Sara Wheeless, and Bryan Shepherd. 2010. "Persistence and Attainment of 2003-04 Beginning Postsecondary Students: After 6 Years." U.S. Department of Education. Washington, DC: National Center for Education Statistics.
Richburg-Hayes, Lashawn, et al. "Rewarding persistence: Effects of a performance-based scholarship program for low-income parents." (2009).
Scott-Clayton, Judith. 2011. "The Shapeless River: Does a Lack of Structure Inhibit Students' Progress at Community Colleges." Columbia University, Teachers College, Community College Research Center Working Paper No. 25.
Scrivener, Susan, Michael J. Weiss, Alyssa Ratledge, Timothy Rudd, Colleen Sommo and Hannah Freaques. 2015. "Doubling graduation rates: Three-year effects of CUNY's Accelerated Study in Associate Programs (ASAP) for Developmental Education Students."
Scrivener, Susan, and Michael J. Weiss. "More Guidance, Better Results?: Three-Year Effects of an Enhanced Student Services Program at Two Community Colleges." New York: MDRC.
van der Steeg, Marc, Roel van Elk, Dinand Webbink. 2015. “Does Intensive Coaching Reduce School Dropout? Evidence from a Randomized Experiment.” Economics of Education Review 48(October): 184-197.
Variable Mean per Student
36.83(13.93)
4.32(3.37)
41.09(29.57)
17.70(8.43)
12.10(7.07)
Number of Students 94Notes: Calculations were made using CCFW case note data from Fall 2013 through Spring 2016 forthe 94 treatment compliers in semesters where they were still active in the program, so these meansare conditional on students having at least one interaction. Information on duration is from datafrom the first four semesters, as these data are not available for later semesters. Standard deviationsare in parentheses.
Table 1
Duration of In-Person Meeting (Minutes)
In-Person Meetings per Semester
Text/Email Interactions per Semester
Phone Interactions per Semester
Summary of Navigator-Student Interactions for the STC Program
Total Interactions per Semester
U.S. Texas TCCFull Stay the
Course Sample
Variable (1) (2) (3) (4)Age 28.00 26.92 24.21Under 30 years old 0.71 0.719 0.750 0.83330 years old and over 0.28 0.280 0.251 0.167Female 0.57 0.558 0.579 0.655Male 0.43 0.442 0.421 0.345White, non-Hispanic 0.51 0.342 0.389 0.273Black, non-Hispanic 0.14 0.132 0.181 0.198Asian/Pacific Islander 0.06 0.044 0.044 0.031Other Race 0.09 0.062 0.033 0.030Hispanic 0.19 0.420 0.354 0.468Part Time 0.60 0.748 0.869 0.446Full Time 0.40 0.252 0.131 0.554Receive Pell Grants 0.33 0.986First Generation College Student 0.36 0.583N 7.3 million 700,963 8,849 869
Table 2Descriptive Characteristics of Community College Students
Notes: National statistics are taken from the American Association of Community Colleges (AACC) 2014 Fact Sheet. Texas statewide statistics were collected from txhighereddata.org. The TCC statistics represent averages from the Trinity RiverCampus in Fall 2013. Due to the limited age data available, the age ranges for the TCC column are under 31 and 31 andover. For students in the Stay the Course sample, full time students are defined as students who are enrolled in 12 or morecredits at the Fall 2013 census date.
STC Treatment
EFA Treatment
ControlSTC & Control
EFA & Control
Variable (1) (2) (3) (4) (5)Age at Entry 24.09 24.865 24.33 0.664 0.388Female 0.628 0.642 0.681 0.099 0.272TSI's Remaining at Entry 0.537 0.525 0.572 0.477 0.382Dependent 0.516 0.552 0.519 0.928 0.386Cumulative Hours Earned Prior to Entry 11.34 11.505 11.15 0.795 0.660Family Income $22,576 $22,906 $20,756 0.111 0.098Between 0% and 50% of FPL 0.228 0.264 0.262 0.244 0.946Between 50% and 100% of FPL 0.291 0.241 0.294 0.919 0.112Between 100% and 150% of FPL 0.216 0.221 0.198 0.511 0.459Between 150% and 200% of FPL 0.158 0.167 0.15 0.751 0.537Above 200% of FPL 0.107 0.107 0.096 0.581 0.615Estimated Family Contribution (FAFSA) $768 $761 $650 0.242 0.292Age < 20 0.449 0.421 0.405 0.197 0.666Age 20 - 25 0.256 0.274 0.301 0.140 0.438Age 26+ 0.295 0.304 0.294 0.961 0.760Black 0.184 0.241 0.216 0.229 0.437White 0.405 0.418 0.408 0.926 0.780Asian 0.027 0.037 0.035 0.522 0.469Other Race 0.377 0.304 0.349 0.387 0.211Hispanic 0.477 0.438 0.460 0.624 0.556Degree Propensity 0.180 0.186 0.177 0.512 0.116
N 430 299 439
Table 3Mean Characteristics of Treatment Groups and Control Group, Fall 2013
Means by Group AssignmentP-value on Test that Means are the
Same Across Groups
Notes: Means are from TCC administrative data for Fall 2016 for subgroups of the full STC study sample (N = 1,168). Degree propensity is the predicted probability of earning a degree after six semesters, which is estimated on the control group using a probit model that includes as controls observable characteristics at baseline. See Section V of the text for more details.
ITT TOT ITT TOT ITT TOT(1) (2) (3) (4) (5) (6)
0.027 0.121 0.051 0.218 -0.033 -0.169(0.030) (0.135) (0.038) (0.161) (0.049) (0.254)[0.255] {0.188} [0.258] {0.115} [0.250] {0.394}
0.056* 0.251* 0.084** 0.358** -0.003 -0.014(0.033) (0.152) (0.041) (0.178) (0.058) (0.293)[0.440] {0.238} [0.425] {0.134} [0.471] {0.498}
0.026 0.116 0.046 0.195 -0.005 -0.025(0.067) (0.295) (0.084) (0.352) (0.112) (0.552)[2.495] {2.520} [2.490] {2.428} [2.504] {2.686}
0.037 0.165 0.065* 0.278* -0.009 -0.046(0.026) (0.119) (0.034) (0.146) (0.042) (0.212)[0.182] {0.058} [0.187] {0.000} [0.171] {0.207}
0.036 0.162 0.074** 0.315** -0.025 -0.129(0.025) (0.115) (0.033) (0.141) (0.040) (0.205)[0.159] {0.029} [0.157] {0.000} [0.164] {0.258}
N 869 869 569 569 300 300
Cumulative GPA
Enrolled in Classes at TCC
Enrolled in Classes Anywhere
Earned a Degree Anywhere
Full Sample Female Sample Male Sample
Notes : The Main Sample includes students assigned to the full STC treatment and those assigned to the control group. ITTestimates (β1 from equation 1) are from OLS regressions of the outcomes listed in each row on assignment to treatment age, agesquared, income, income squared, an indicator for female, and a set of race dummies. TOT estimates (γ1 from equation 2) arefrom 2SLS regressions using assignment to treatment as an instrument for program participation. Take up = 1 if client completesan intake form. 20 observations are lost when analyzing cumulative GPA (11 females, 9 males) due to missing data. In instancesin which the Control Complier Mean (CCM) is negative, it is reported as zero--see Section V of the text for more details.Statistics reported under point estimate: (Standard error) [Mean outcome in control group] {CCM}. *Significant at the 10%level, **significant at the 5% level.
Table 4The Effect of STC on Outcomes after Six Semesters for Main Sample and by Gender
Outcomes
Earned Associate's Degree
ITT TOT ITT TOT ITT TOT ITT TOT(1) (2) (3) (4) (5) (6) (7) (8)
0.044 0.170 0.002 0.013 0.008 0.035 0.032 0.144(0.041) (0.155) (0.044) (0.233) (0.055) (0.239) (0.036) (0.162)[0.209] {0.080} [0.306] {0.368} [0.220] {0.335} [0.279] {0.148}
0.024 0.091 0.083* 0.441* 0.005 0.023 0.069* 0.318*(0.047) (0.178) (0.048) (0.259) (0.066) (0.284) (0.039) (0.181)[0.413] {0.371} [0.469] {0.083} [0.424] {0.533} [0.455] {0.156}
0.009 0.033 0.031 0.166 -0.039 -0.168 0.053 0.238(0.101) (0.374) (0.088) (0.461) (0.125) (0.528) (0.079) (0.356)[2.354] {2.496} [2.647] {2.599} [2.803] {2.962} [2.391] {2.310}
0.024 0.092 0.050 0.267 0.035 0.155 0.041 0.189(0.036) (0.135) (0.039) (0.210) (0.051) (0.224) (0.031) (0.142)[0.161] {0.100} [0.206] {0.000} [0.203] {0.104} [0.176] {0.004}
0.029 0.109 0.045 0.240 0.065 0.289 0.028 0.127(0.034) (0.128) (0.038) (0.204) (0.048) (0.217) (0.030) (0.136)[0.135] {0.045} [0.187] {0.000} [0.153] {0.000} [0.157] {0.043}
N 435 435 434 434 231 231 618 618
Earned Associate's Degree
White Non-White
Cumulative GPA
≤ Median Income > Median Income
Table 5aThe Effect of STC on Outcomes after Six Semesters by Subsamples
Outcomes
Enrolled in Classes at TCC
Notes : Results are for subgroups of the Main Sample that includes students assigned to the full STC treatment and those assigned to the controlgroup. Statistics reported under point estimate: (Standard error) [Mean outcome in control group] {CCM}. *Significant at the 10% level, **significantat the 5% level. See notes to Table 4 for more details.
Enrolled in Classes Anywhere
Earned a Degree Anywhere
Initial Credit Hours
ITT TOT ITT TOT ITT TOT ITT TOT ITT TOT(1) (2) (3) (4) (5) (6) (7) (8) (9) (10)
0.012 0.053 0.043 0.194 0.053 0.232 0.011 0.054 -0.000 -0.001(0.043) (0.194) (0.042) (0.194) (0.051) (0.225) (0.053) (0.254) (0.053) (0.232)[0.274] {0.245} [0.235] {0.125} [0.219] {0.000} [0.272] {0.325} [0.277] {0.365}
0.067 0.307 0.051 0.228 -0.008 -0.035 0.021 0.104 0.121** 0.540**(0.048) (0.218) (0.047) (0.211) (0.057) (0.245) (0.059) (0.281) (0.058) (0.270)[0.478] {0.225} [0.399] {0.219} [0.391] {0.348} [0.490] {0.551} [0.440] {0.000}
-0.057 -0.252 0.129 0.569 -0.136 -0.590 -0.020 -0.099 0.139 0.606(0.087) (0.382) (0.104) (0.455) (0.128) (0.552) (0.110) (0.522) (0.112) (0.482)[2.704] {2.990} [2.258] {1.962} [2.166] {2.900} [2.636] {2.725} [2.690] {2.344}
0.009 0.039 0.056* 0.251 0.019 0.085 -0.008 -0.038 0.081 0.362(0.041) (0.182) (0.034) (0.153) (0.035) (0.148) (0.044) (0.211) (0.056) (0.249)[0.239] {0.238} [0.122] {0.000} [0.079] {0.040} [0.170] {0.141} [0.305] {0.062}
0.016 0.073 0.047 0.214 0.015 0.065 -0.001 -0.004 0.079 0.353(0.039) (0.177) (0.032) (0.144) (0.033) (0.140) (0.042) (0.203) (0.054) (0.241)[0.208] {0.161} [0.108] {0.000} [0.073] {0.029} [0.150] {0.107} [0.262] {0.011}
N 444 444 425 425 290 290 289 289 290 290
Earned Associate's Degree
Outcomes
Table 5bThe Effect of STC on Outcomes after Six Semesters by Subsamples
Degree Propensity
> Median Hours ≤ Median Hours Lower Third Middle Third Upper Third
Cumulative GPA
Notes : Results are for subgroups of the Main Sample that includes students assigned to the full STC treatment and those assigned to the control group. Degree propensity is thepredicted probability of earning a degree after six semesters, which is estimated on the control group using a probit model that includes as controls observable characteristics atbaseline. See Section V of the text for more details. Statistics reported under point estimate: (Standard error) [Mean outcome in control group] {CCM}. *Significant at the 10% level,**significant at the 5% level. See notes to Table 4 for more details.
Enrolled in Classes at TCC
Enrolled in Classes Anywhere
Earned a Degree Anywhere
ITT TOT ITT TOT ITT TOT(1) (2) (3) (4) (5) (6)
-0.007 -0.016 -0.038 -0.088 0.052 0.139(0.033) (0.078) (0.040) (0.091) (0.058) (0.153)[0.255] {0.262} [0.258] {0.335} [0.250] {0.169}
0.015 0.036 0.010 0.024 0.027 0.073(0.037) (0.088) (0.046) (0.104) (0.065) (0.168)[0.440] {0.456} [0.425] {0.505} [0.471] {0.342}
-0.108 -0.259 -0.089 -0.206 -0.131 -0.348(0.079) (0.190) (0.097) (0.223) (0.139) (0.363)[2.495] {2.784} [2.490] {2.825} [2.504] {2.678}
-0.014 -0.034 -0.032 -0.073 0.017 0.045(0.029) (0.068) (0.035) (0.080) (0.050) (0.130)0.182 {0.248} [0.187] {0.285} [0.171] {0.175}
-0.012 -0.028 -0.014 -0.032 -0.007 -0.018(0.027) (0.065) (0.033) (0.076) (0.048) (0.126)[0.159] {0.218} [0.157] {0.208} [0.164] {0.238}
N 772 772 480 480 242 242
Earned Associate's Degree
Table 6The Effect of EFA on Outcomes after Six Semesters for the Full EFA Sample and by Gender
Full Sample Female Sample Male Sample
Cumulative GPA
Notes : Results are for the EFA Sample (N = 772) that includes students assigned to the EFA only treatment and those assignedto the control group. Statistics reported under point estimate: (Standard error) [Mean outcome in control group] {CCM}.*Significant at the 10% level, **significant at the 5% level. See notes to Table 4 for more details.
Outcomes
Enrolled in Classes at TCC
Enrolled in Classes Anywhere
Earned a Degree Anywhere

ITT TOT ITT TOT ITT TOT(1) (2) (3) (4) (5) (6)
0.064** 0.289** 0.075** 0.319** 0.040 0.206(0.027) (0.121) (0.034) (0.143) (0.045) (0.225)[0.759] {0.544} [0.749] {0.586} [0.779] {0.625}
0.016 0.072 0.036 0.153 -0.027 -0.140(0.026) (0.117) (0.033) (0.140) (0.042) (0.218)[0.797] {0.811} [0.783] {0.720} [0.829] {1.043}
1.050* 4.739* 1.299* 5.519* 0.568 2.948(0.553) (2.484) (0.691) (2.920) (0.938) (4.768)[13.934] {11.793} [13.715] {11.148} [14.402] {13.310}
0.055 0.243 0.063 0.266 0.054 0.271(0.070) (0.309) (0.088) (0.369) (0.118) (0.577)[2.468] {2.442} [2.469] {2.365} [2.465] {2.522}
0.012 0.054 0.011 0.011 0.012 0.064(0.008) (0.035) (0.010) (0.010) (0.013) (0.069)[0.007] {0.000} [0.007] {0.005} [0.007] {0.000}
0.008 0.035 0.009 0.038 0.006 0.029(0.006) (0.029) (0.008) (0.033) (0.012) (0.059)[0.005] {0.000} [0.003] {0.000} [0.007] {0.000}
N 869 869 569 569 300 300
Earned Associate's Degree
Total Credits Earned
Cumulative GPA
Table 7aThe Effect of STC on Outcomes after Two Semesters for Main Sample and by Gender
Notes : Results are for the Main Sample that includes students assigned to the full STC treatment and those assigned to the controlgroup. Statistics reported under point estimate: (Standard error) [Mean outcome in control group] {CCM}. *Significant at the 10%level, **significant at the 5% level. See notes to Table 4 for more details.
Full Sample Female Sample Male Sample
Outcomes
Enrolled in Classes at TCC
Enrolled in Classes Anywhere
Earned a Degree Anywhere
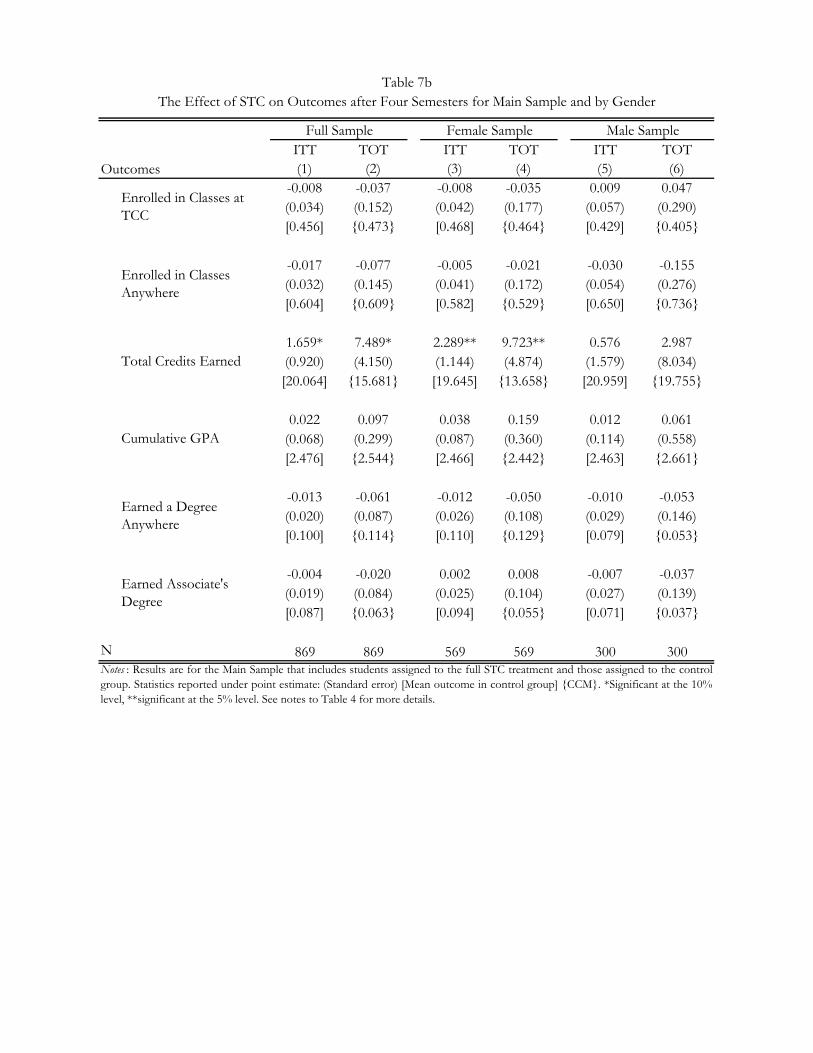
ITT TOT ITT TOT ITT TOT(1) (2) (3) (4) (5) (6)
-0.008 -0.037 -0.008 -0.035 0.009 0.047(0.034) (0.152) (0.042) (0.177) (0.057) (0.290)[0.456] {0.473} [0.468] {0.464} [0.429] {0.405}
-0.017 -0.077 -0.005 -0.021 -0.030 -0.155(0.032) (0.145) (0.041) (0.172) (0.054) (0.276)[0.604] {0.609} [0.582] {0.529} [0.650] {0.736}
1.659* 7.489* 2.289** 9.723** 0.576 2.987(0.920) (4.150) (1.144) (4.874) (1.579) (8.034)[20.064] {15.681} [19.645] {13.658} [20.959] {19.755}
0.022 0.097 0.038 0.159 0.012 0.061(0.068) (0.299) (0.087) (0.360) (0.114) (0.558)[2.476] {2.544} [2.466] {2.442} [2.463] {2.661}
-0.013 -0.061 -0.012 -0.050 -0.010 -0.053(0.020) (0.087) (0.026) (0.108) (0.029) (0.146)[0.100] {0.114} [0.110] {0.129} [0.079] {0.053}
-0.004 -0.020 0.002 0.008 -0.007 -0.037(0.019) (0.084) (0.025) (0.104) (0.027) (0.139)[0.087] {0.063} [0.094] {0.055} [0.071] {0.037}
N 869 869 569 569 300 300
Earned Associate's Degree
Male Sample
Table 7bThe Effect of STC on Outcomes after Four Semesters for Main Sample and by Gender
Enrolled in Classes at TCC
Notes : Results are for the Main Sample that includes students assigned to the full STC treatment and those assigned to the controlgroup. Statistics reported under point estimate: (Standard error) [Mean outcome in control group] {CCM}. *Significant at the 10%level, **significant at the 5% level. See notes to Table 4 for more details.
Enrolled in Classes Anywhere
Earned a Degree Anywhere
Total Credits Earned
Cumulative GPA
Full Sample Female Sample
Outcomes
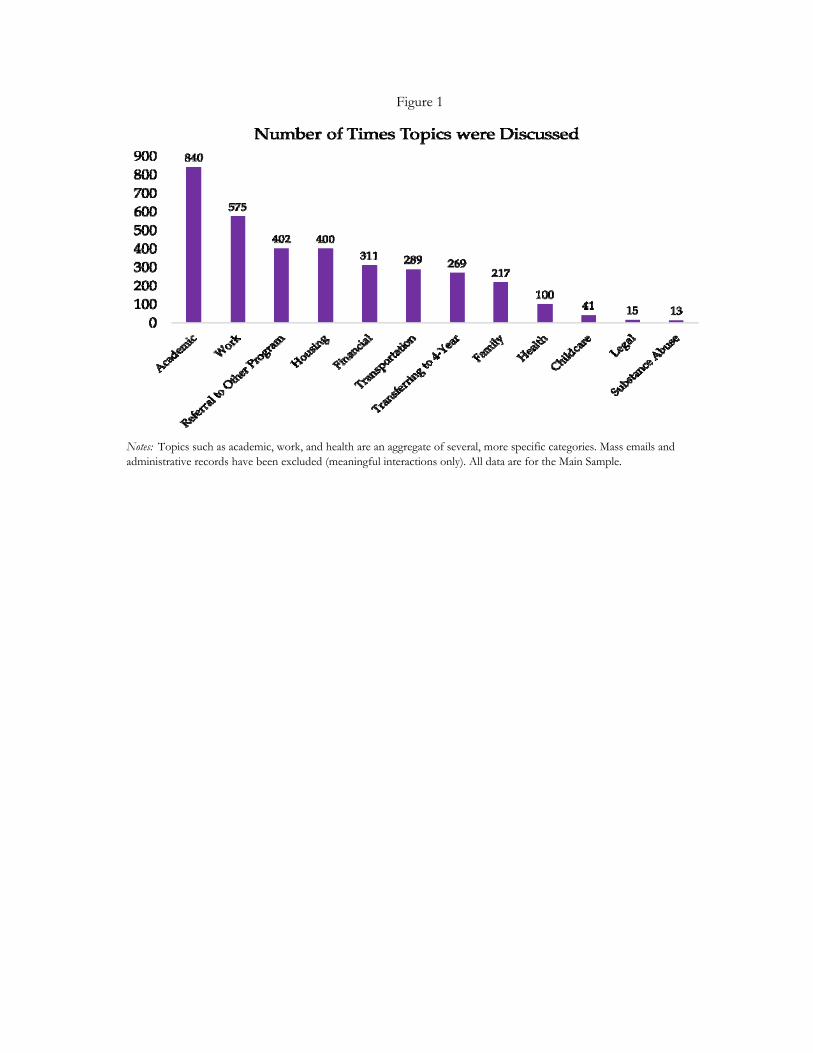
Figure 1
Notes: Topics such as academic, work, and health are an aggregate of several, more specific categories. Mass emails and administrative records have been excluded (meaningful interactions only). All data are for the Main Sample.
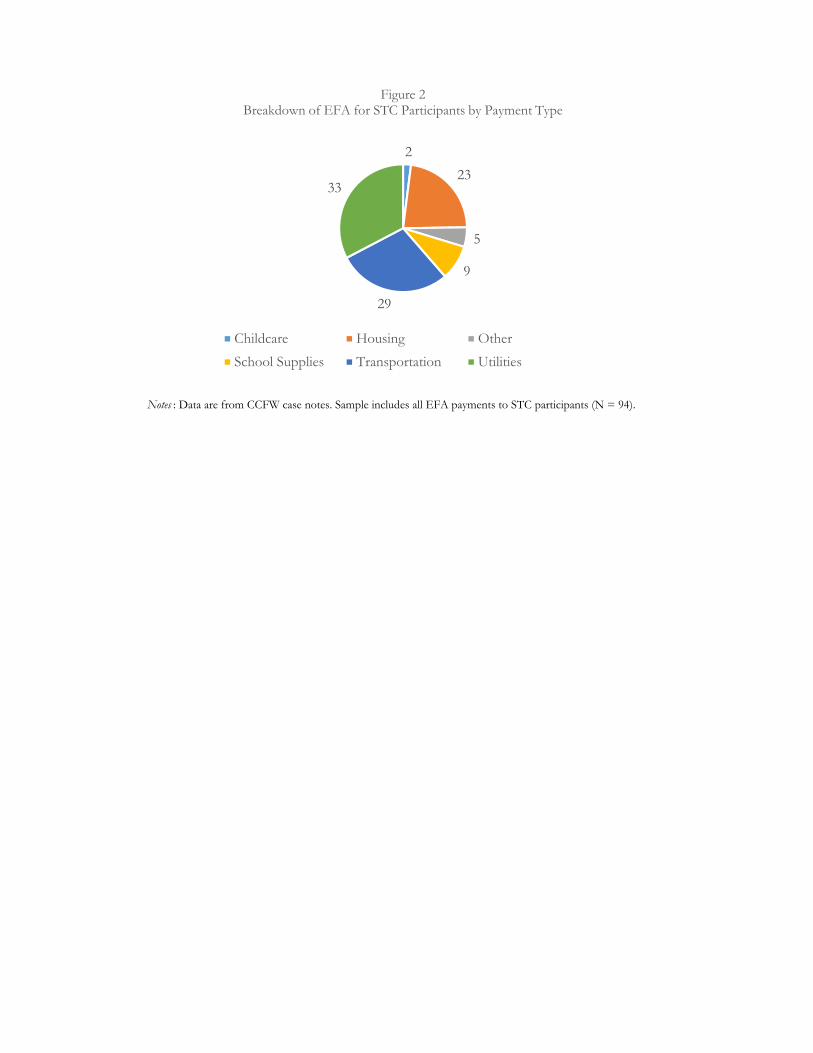
Notes : Data are from CCFW case notes. Sample includes all EFA payments to STC participants (N = 94).
2
23
5
9
29
33
Figure 2Breakdown of EFA for STC Participants by Payment Type
Childcare Housing Other
School Supplies Transportation Utilities
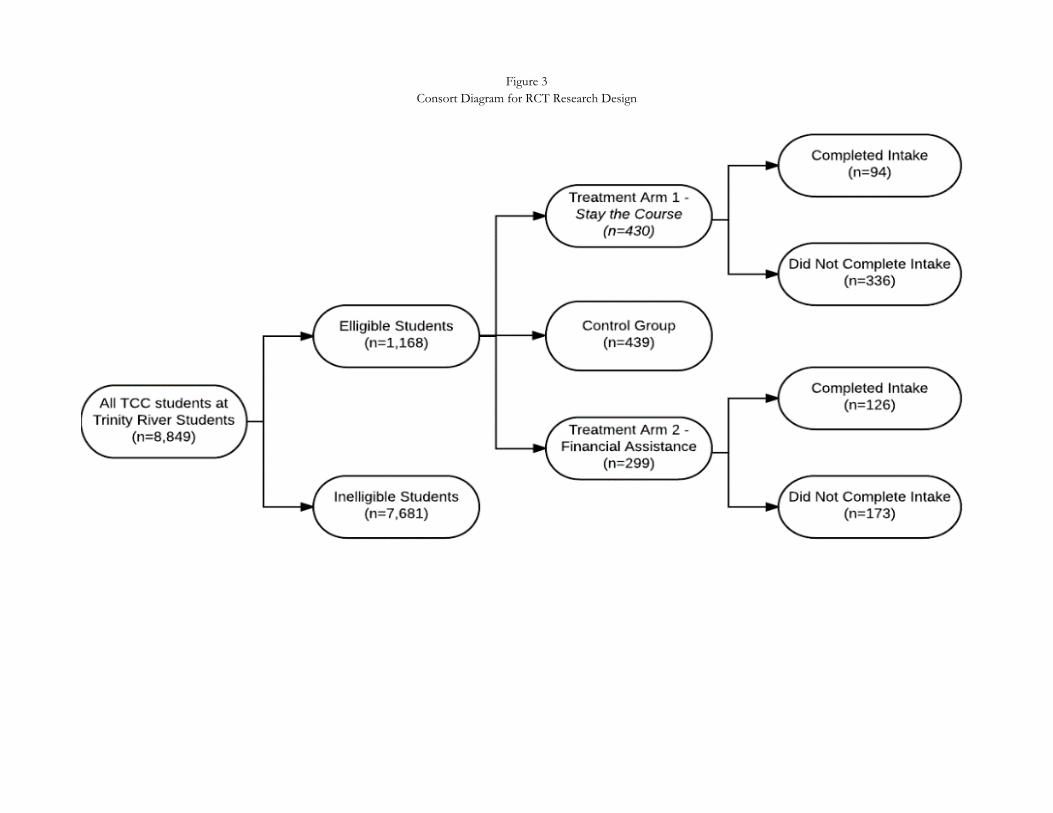
Figure 3Consort Diagram for RCT Research Design