increased and accelerated age-related complications in hiv
TRANSCRIPT
Increased and accelerated
age-related complications in
HIV-infected patients
Giovanni Guaraldi Università di Modena
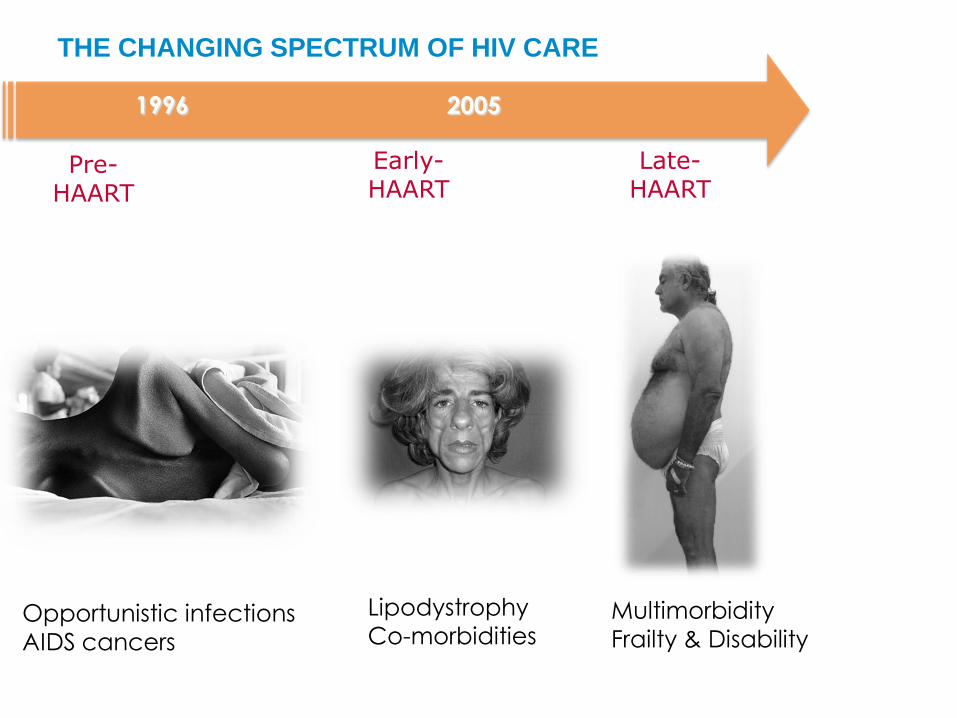
THE CHANGING SPECTRUM OF HIV CARE
1996
Pre-HAART
Early-HAART
Late-HAART
2005
Opportunistic infections
AIDS cancers
Multimorbidity
Frailty & Disability
Lipodystrophy
Co-morbidities

High prevalence of Co-morbidities (HANA) and
Polypatholiogy in HIV infected aging cohorts
Guaraldi G, CID 2011 Dec;53(11):1120-6 Schouten J, XIX International AIDS Conference
In Modena cohort Pp on the 50’s was 20% in the AgeHIV cohort was 35%
Pp prevalence was higher in cases than controls in all age strata

Accentuated Aging: cancer (and
geriatric syndroms ) occurs at the same ages but more often among HIV-
infected participants than among HIV-
uninfected comparators.
This configure a Premature aging
process.
Accelerated Aging and
accentuated aging: cancer (and
geriatric syndroms ) occurs earlier among HIV-infected participants
compared with HIV-uninfected
comparators and there are more
cancer events.
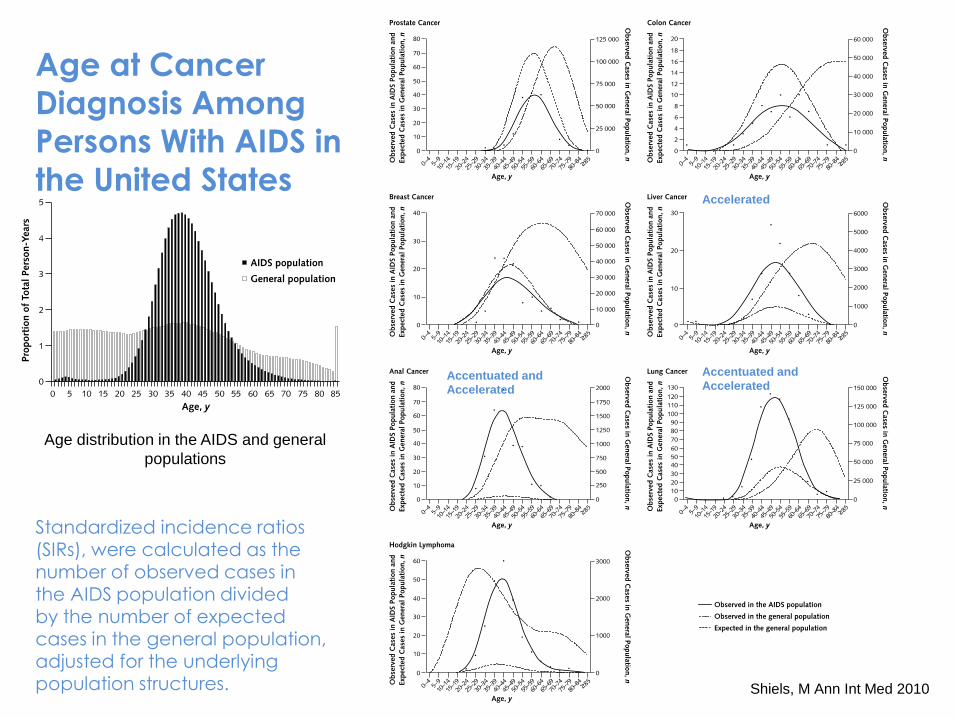
Shiels, M Ann Int Med 2010
Age at Cancer
Diagnosis Among
Persons With AIDS in
the United States
Age distribution in the AIDS and general
populations
Accentuated and
Accelerated
Accentuated and
Accelerated
Accelerated
Standardized incidence ratios
(SIRs), were calculated as the number of observed cases in the AIDS population divided by the number of expected cases in the general population, adjusted for the underlying population structures.
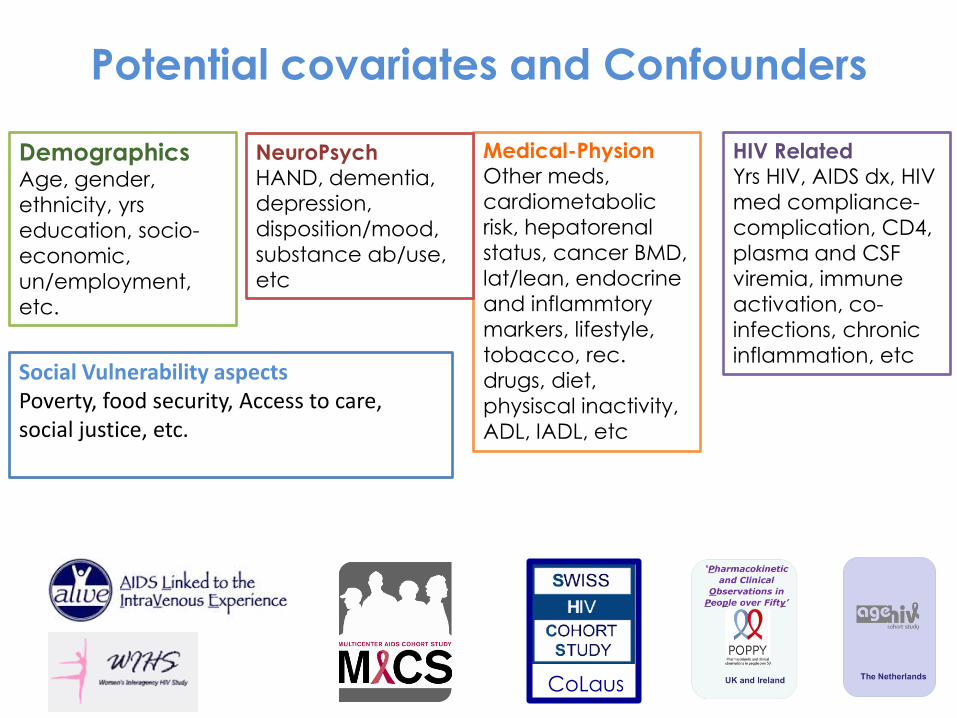
Potential covariates and Confounders
Demographics Age, gender,
ethnicity, yrs
education, socio-
economic,
un/employment,
etc.
CoLaus
Medical-Physion Other meds,
cardiometabolic
risk, hepatorenal
status, cancer BMD,
lat/lean, endocrine
and inflammtory
markers, lifestyle,
tobacco, rec.
drugs, diet,
physiscal inactivity,
ADL, IADL, etc
NeuroPsych HAND, dementia,
depression,
disposition/mood,
substance ab/use,
etc
HIV Related Yrs HIV, AIDS dx, HIV
med compliance-
complication, CD4,
plasma and CSF
viremia, immune
activation, co-
infections, chronic
inflammation, etc Social Vulnerability aspects Poverty, food security, Access to care, social justice, etc.

Aging vs aged patients: Prevalence and probability for
multimorbidities increases with HIV duration
Guaraldi G, et alPLoS One. 2015 Apr 13;10(4):e0118531
At any age, long-term infected people (ageing patients) had a 5-fold
accentuated risk of multimorbidity than HIV-negative controls, while more
recently infected people (aged patients) had an intermediate risk compared
with the control group
Pro
ba
bil
ity o
f m
ult
imo
rbid
ity
0.6
0.4
0.2
0
20 30 40 50 60 70
Age
HIV aged HIV ageing HIV negative
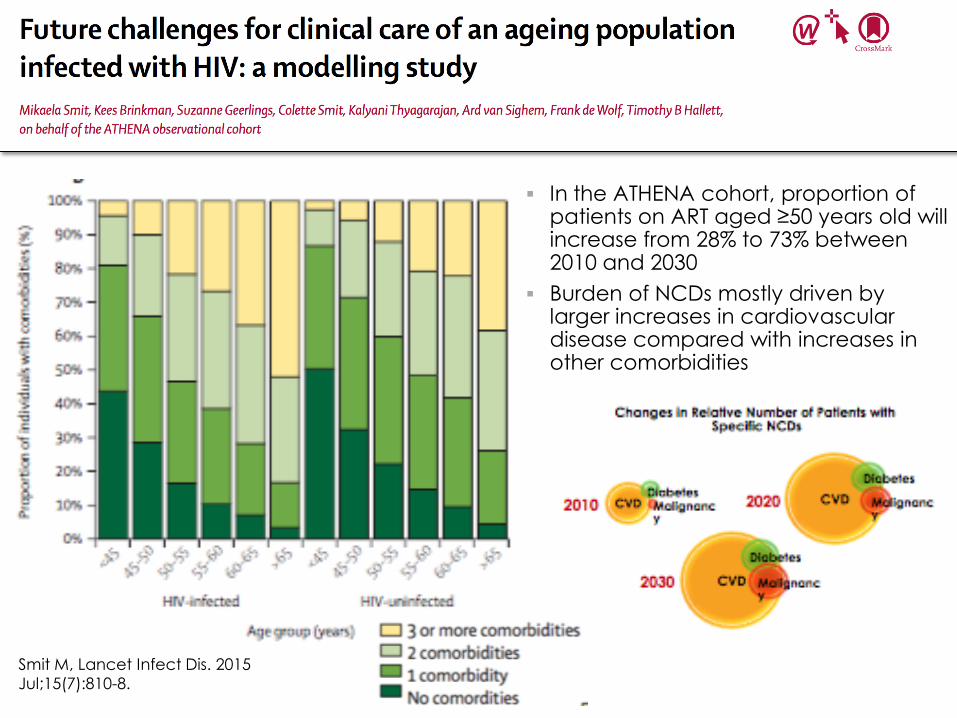
Smit M, Lancet Infect Dis. 2015
Jul;15(7):810-8.
In the ATHENA cohort, proportion of patients on ART aged ≥50 years old will increase from 28% to 73% between 2010 and 2030
Burden of NCDs mostly driven by larger increases in cardiovascular disease compared with increases in other comorbidities
Torino Clinica Univeristaria e
Divisione A
Milano I e III Divisione Sacco e
HSR Università di Modena
Università di
Catania
Perugia Clinica di Mal Inf
Padova Unità di Mal Inf
Università di Brescia
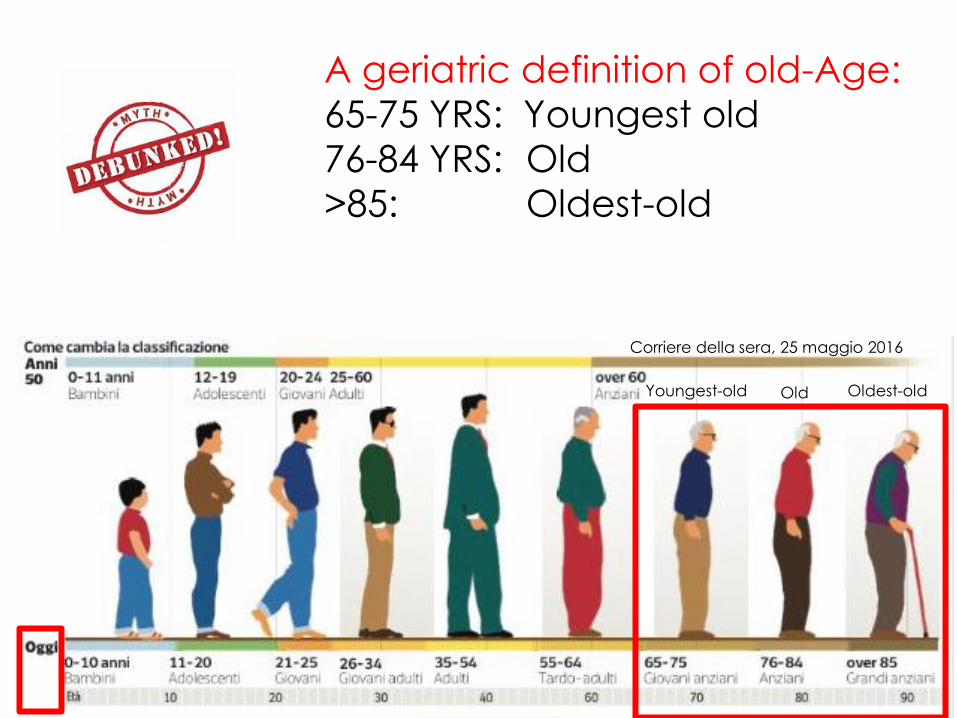
Corriere della sera, 25 maggio 2016
Youngest-old Old Oldest-old
A geriatric definition of old-Age:
65-75 YRS: Youngest old
76-84 YRS: Old
>85: Oldest-old

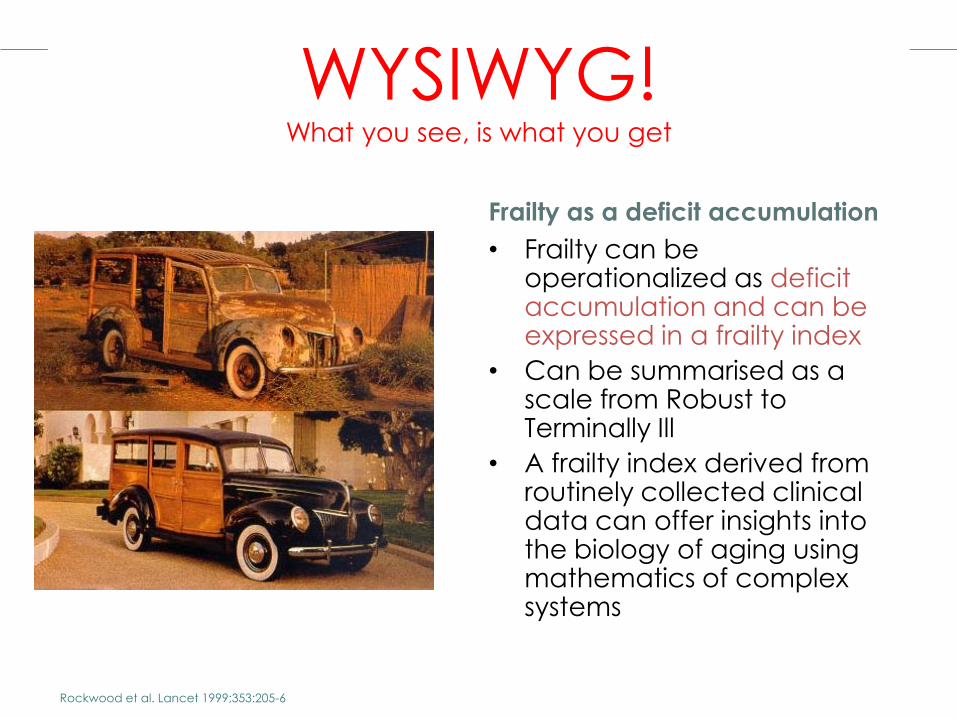
WYSIWYG! What you see, is what you get
Frailty as a deficit accumulation
• Frailty can be operationalized as deficit accumulation and can be expressed in a frailty index
• Can be summarised as a scale from Robust to Terminally Ill
• A frailty index derived from routinely collected clinical data can offer insights into the biology of aging using mathematics of complex systems
Rockwood et al. Lancet 1999;353:205-6
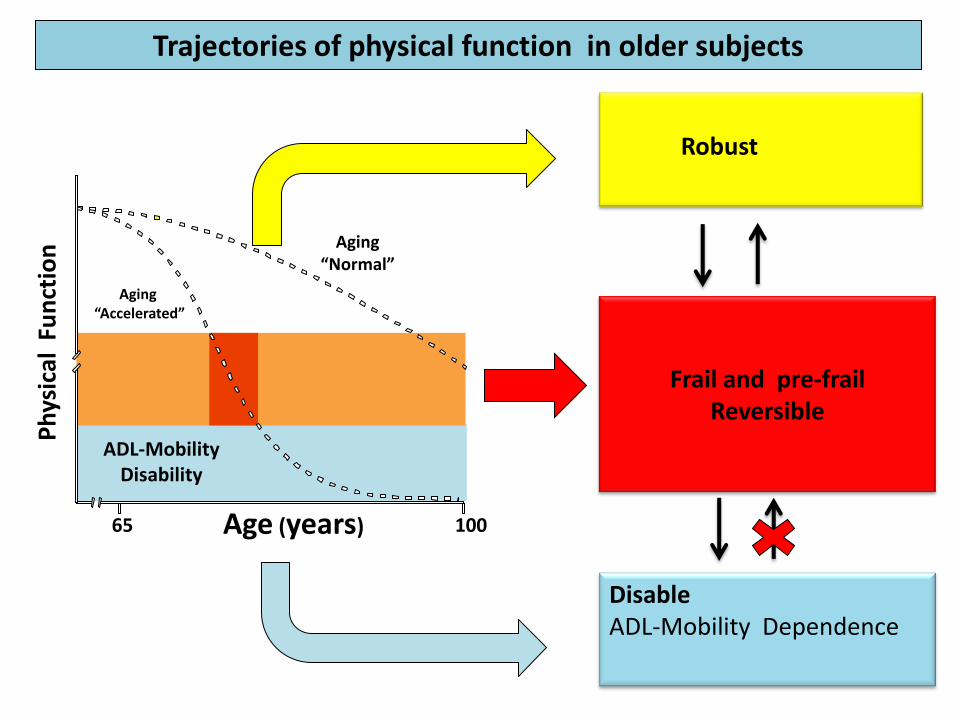
Age (years)
ADL-Mobility Disability
Aging “Accelerated”
65 100
Ph
ysic
al F
un
ctio
n
Robust
Frail and pre-frail Reversible
Disable ADL-Mobility Dependence
Aging “Normal”
Trajectories of physical function in older subjects
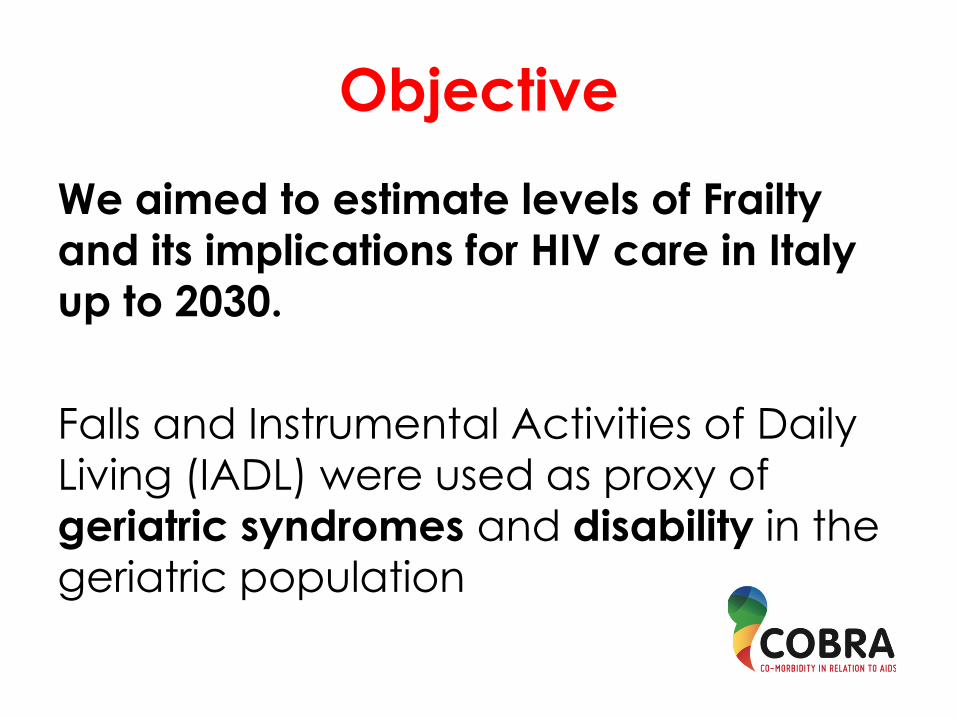
Objective
We aimed to estimate levels of Frailty
and its implications for HIV care in Italy
up to 2030.
Falls and Instrumental Activities of Daily
Living (IADL) were used as proxy of
geriatric syndromes and disability in the
geriatric population
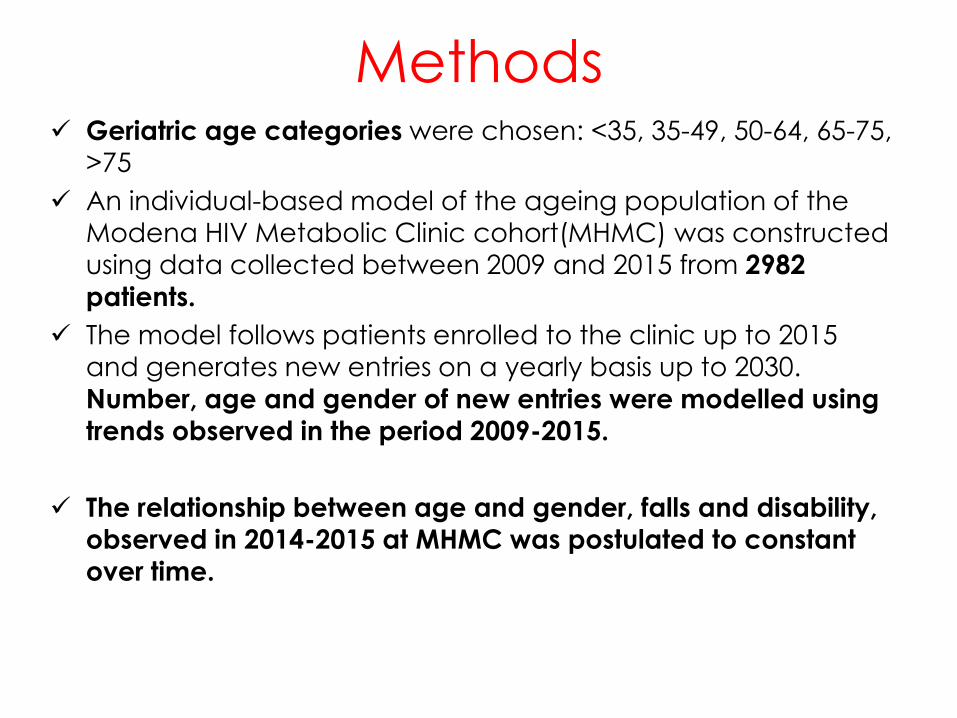
Methods Geriatric age categories were chosen: <35, 35-49, 50-64, 65-75,
>75
An individual-based model of the ageing population of the
Modena HIV Metabolic Clinic cohort(MHMC) was constructed
using data collected between 2009 and 2015 from 2982
patients.
The model follows patients enrolled to the clinic up to 2015
and generates new entries on a yearly basis up to 2030.
Number, age and gender of new entries were modelled using
trends observed in the period 2009-2015.
The relationship between age and gender, falls and disability,
observed in 2014-2015 at MHMC was postulated to constant
over time.
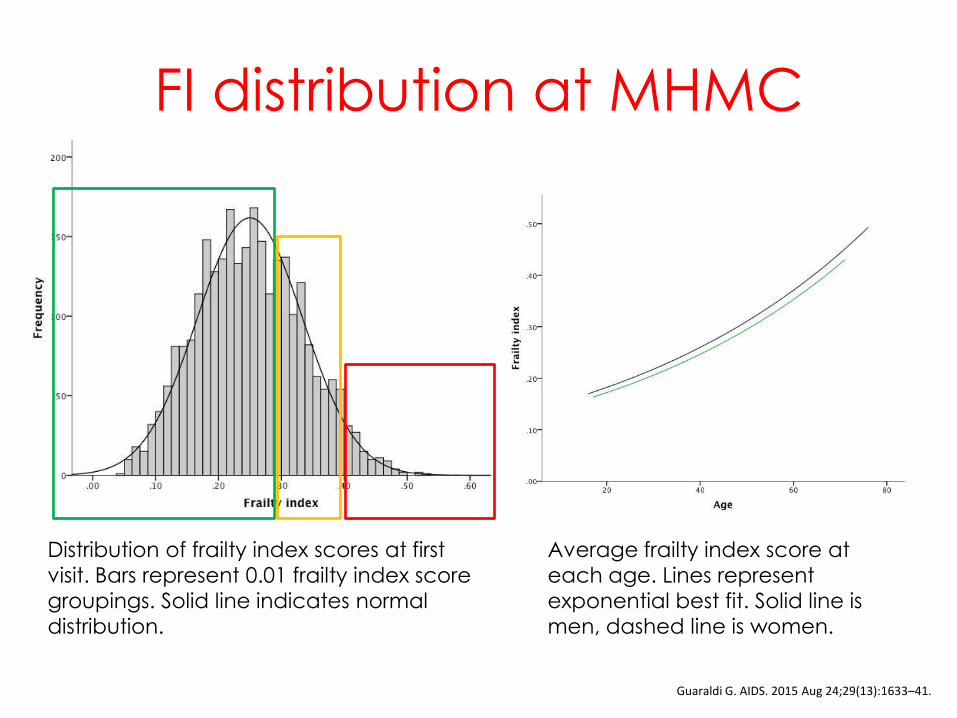
FI distribution at MHMC
Guaraldi G. AIDS. 2015 Aug 24;29(13):1633–41.
Distribution of frailty index scores at first
visit. Bars represent 0.01 frailty index score
groupings. Solid line indicates normal
distribution.
Average frailty index score at
each age. Lines represent
exponential best fit. Solid line is
men, dashed line is women.
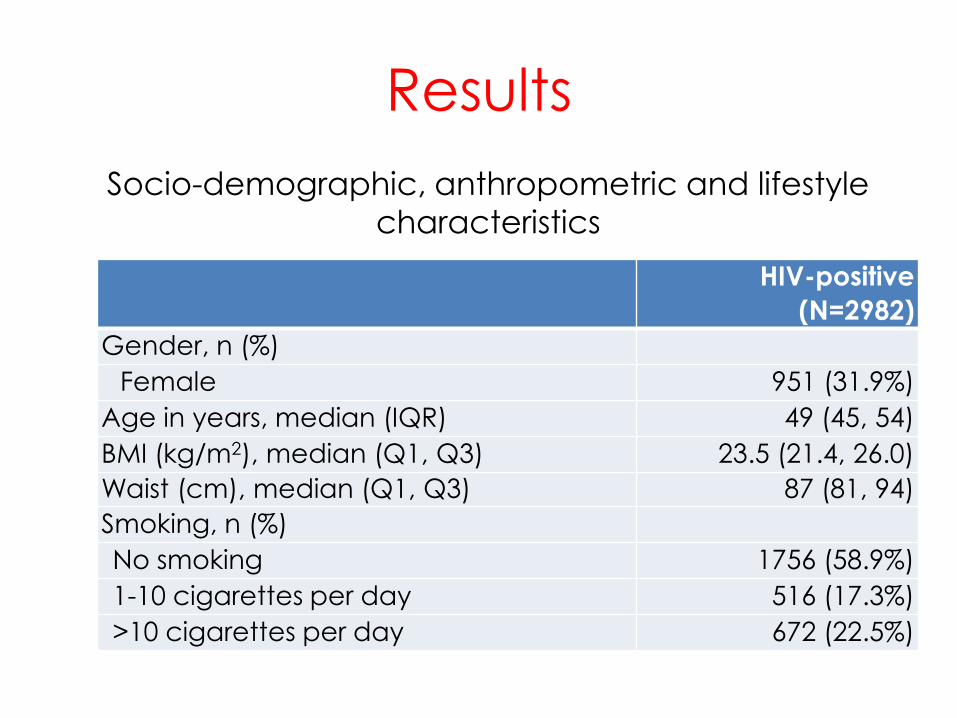
Results
Socio-demographic, anthropometric and lifestyle
characteristics
HIV-positive
(N=2982)
Gender, n (%)
Female 951 (31.9%)
Age in years, median (IQR) 49 (45, 54)
BMI (kg/m2), median (Q1, Q3) 23.5 (21.4, 26.0)
Waist (cm), median (Q1, Q3) 87 (81, 94)
Smoking, n (%)
No smoking 1756 (58.9%)
1-10 cigarettes per day 516 (17.3%)
>10 cigarettes per day 672 (22.5%)
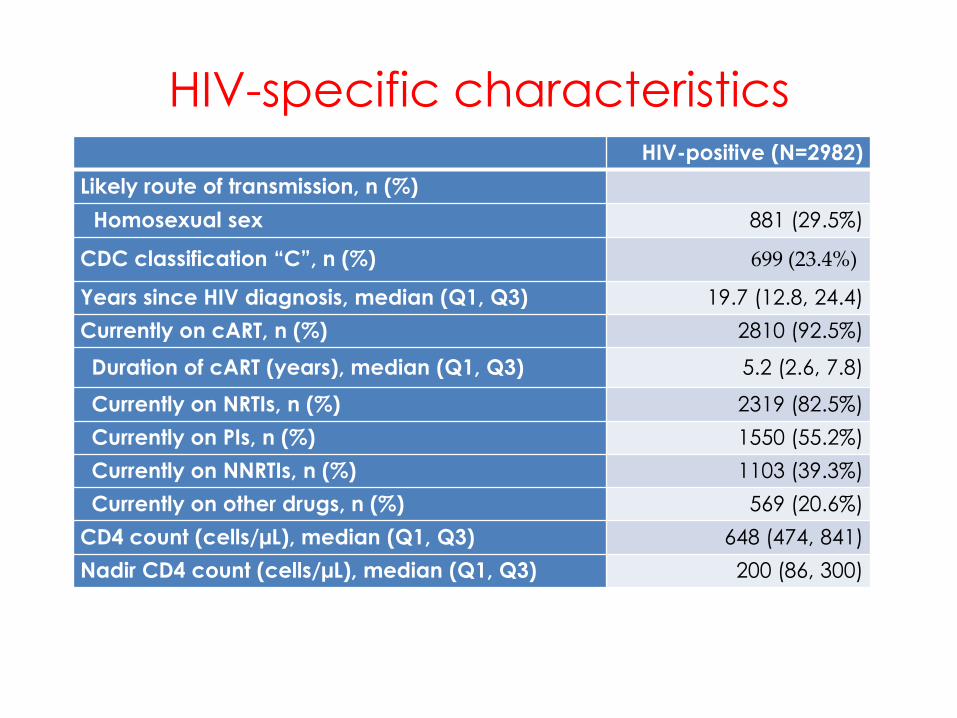
HIV-specific characteristics HIV-positive (N=2982)
Likely route of transmission, n (%)
Homosexual sex 881 (29.5%)
CDC classification “C”, n (%) 699 (23.4%)
Years since HIV diagnosis, median (Q1, Q3) 19.7 (12.8, 24.4)
Currently on cART, n (%) 2810 (92.5%)
Duration of cART (years), median (Q1, Q3) 5.2 (2.6, 7.8)
Currently on NRTIs, n (%) 2319 (82.5%)
Currently on PIs, n (%) 1550 (55.2%)
Currently on NNRTIs, n (%) 1103 (39.3%)
Currently on other drugs, n (%) 569 (20.6%)
CD4 count (cells/µL), median (Q1, Q3) 648 (474, 841)
Nadir CD4 count (cells/µL), median (Q1, Q3) 200 (86, 300)
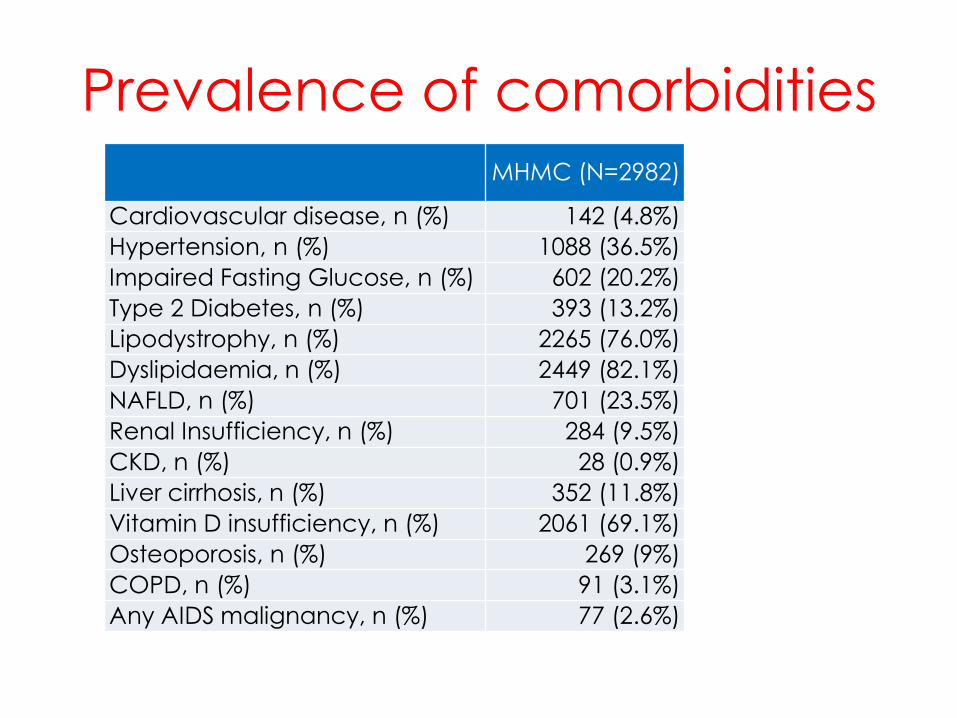
Prevalence of comorbidities
MHMC (N=2982)
Cardiovascular disease, n (%) 142 (4.8%)
Hypertension, n (%) 1088 (36.5%)
Impaired Fasting Glucose, n (%) 602 (20.2%)
Type 2 Diabetes, n (%) 393 (13.2%)
Lipodystrophy, n (%) 2265 (76.0%)
Dyslipidaemia, n (%) 2449 (82.1%)
NAFLD, n (%) 701 (23.5%)
Renal Insufficiency, n (%) 284 (9.5%)
CKD, n (%) 28 (0.9%)
Liver cirrhosis, n (%) 352 (11.8%)
Vitamin D insufficiency, n (%) 2061 (69.1%)
Osteoporosis, n (%) 269 (9%)
COPD, n (%) 91 (3.1%)
Any AIDS malignancy, n (%) 77 (2.6%)
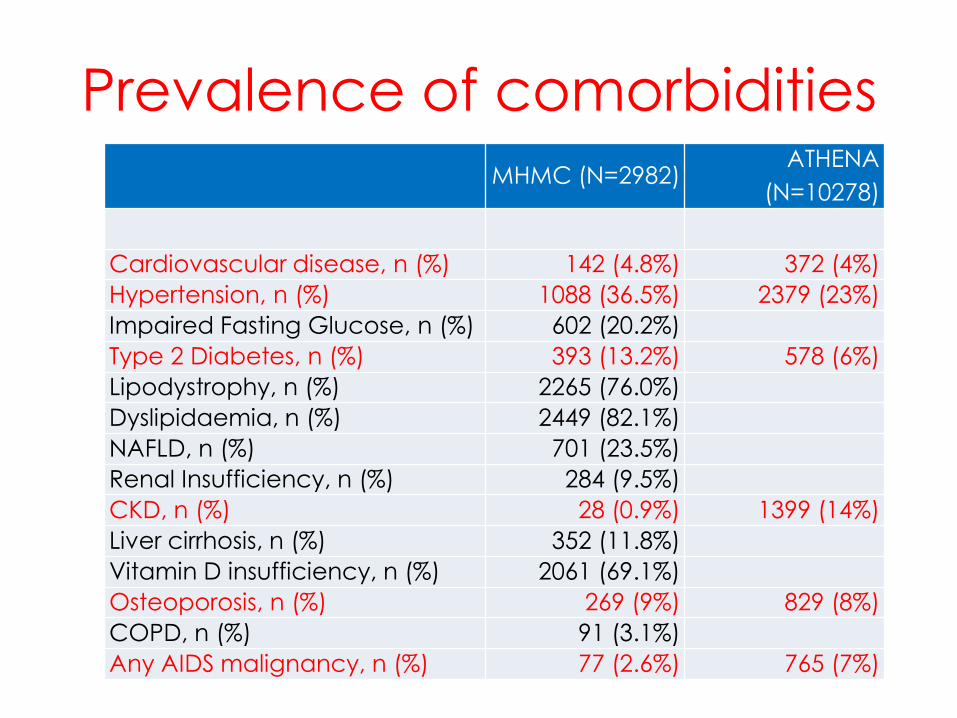
Prevalence of comorbidities
MHMC (N=2982) ATHENA
(N=10278)
Cardiovascular disease, n (%) 142 (4.8%) 372 (4%)
Hypertension, n (%) 1088 (36.5%) 2379 (23%)
Impaired Fasting Glucose, n (%) 602 (20.2%)
Type 2 Diabetes, n (%) 393 (13.2%) 578 (6%)
Lipodystrophy, n (%) 2265 (76.0%)
Dyslipidaemia, n (%) 2449 (82.1%)
NAFLD, n (%) 701 (23.5%)
Renal Insufficiency, n (%) 284 (9.5%)
CKD, n (%) 28 (0.9%) 1399 (14%)
Liver cirrhosis, n (%) 352 (11.8%)
Vitamin D insufficiency, n (%) 2061 (69.1%)
Osteoporosis, n (%) 269 (9%) 829 (8%)
COPD, n (%) 91 (3.1%)
Any AIDS malignancy, n (%) 77 (2.6%) 765 (7%)

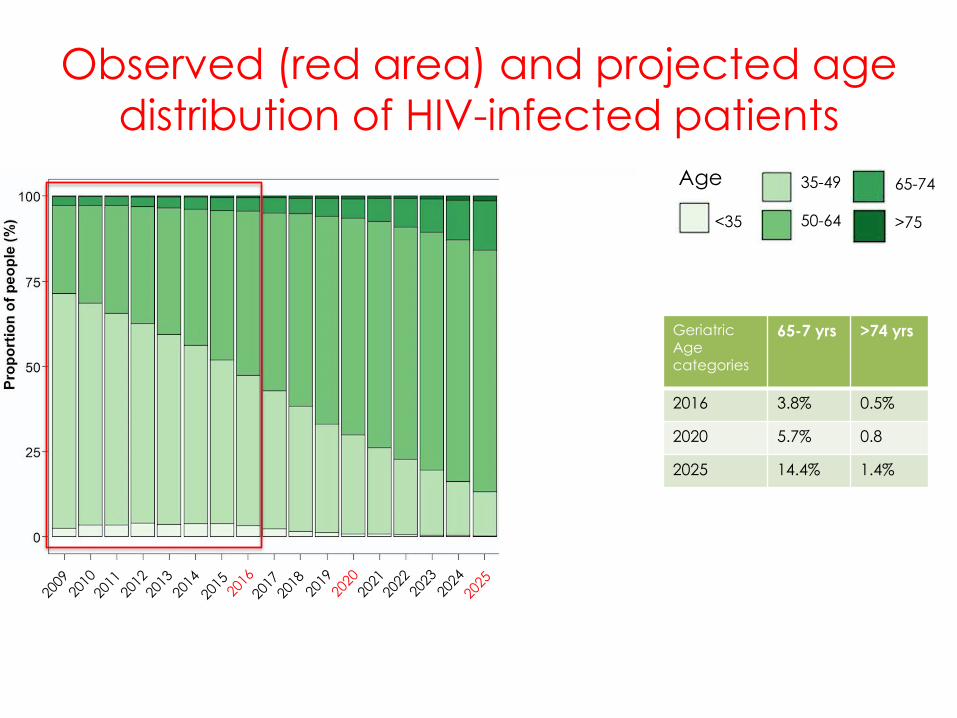
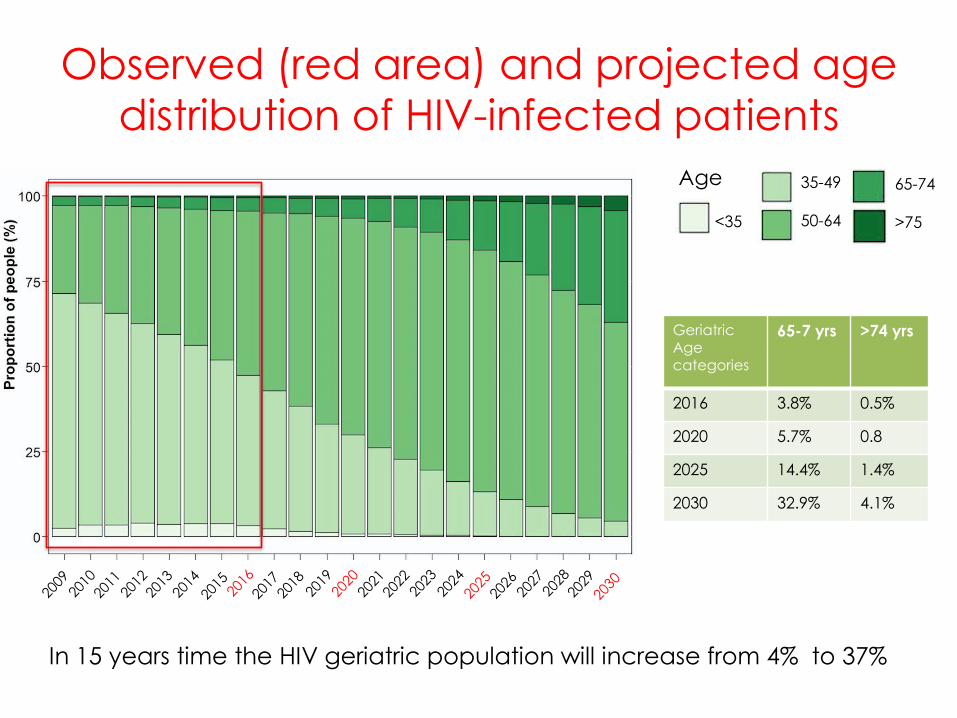
Observed (red area) and projected age
distribution of HIV-infected patients
Geriatric Age categories
65-7 yrs >74 yrs
2016 3.8% 0.5%
Age
<35
35-49
50-64
65-74
>75

Observed (red area) and projected age
distribution of HIV-infected patients
Geriatric Age categories
65-7 yrs >74 yrs
2016 3.8% 0.5%
2020 5.7% 0.8
Age
<35
35-49
50-64
65-74
>75
Observed (red area) and projected age
distribution of HIV-infected patients
Geriatric Age categories
65-7 yrs >74 yrs
2016 3.8% 0.5%
2020 5.7% 0.8
2025 14.4% 1.4%
Age
<35
35-49
50-64
65-74
>75
Observed (red area) and projected age
distribution of HIV-infected patients
Geriatric Age categories
65-7 yrs >74 yrs
2016 3.8% 0.5%
2020 5.7% 0.8
2025 14.4% 1.4%
2030 32.9% 4.1%
Age
<35
35-49
50-64
65-74
>75
In 15 years time the HIV geriatric population will increase from 4% to 37%
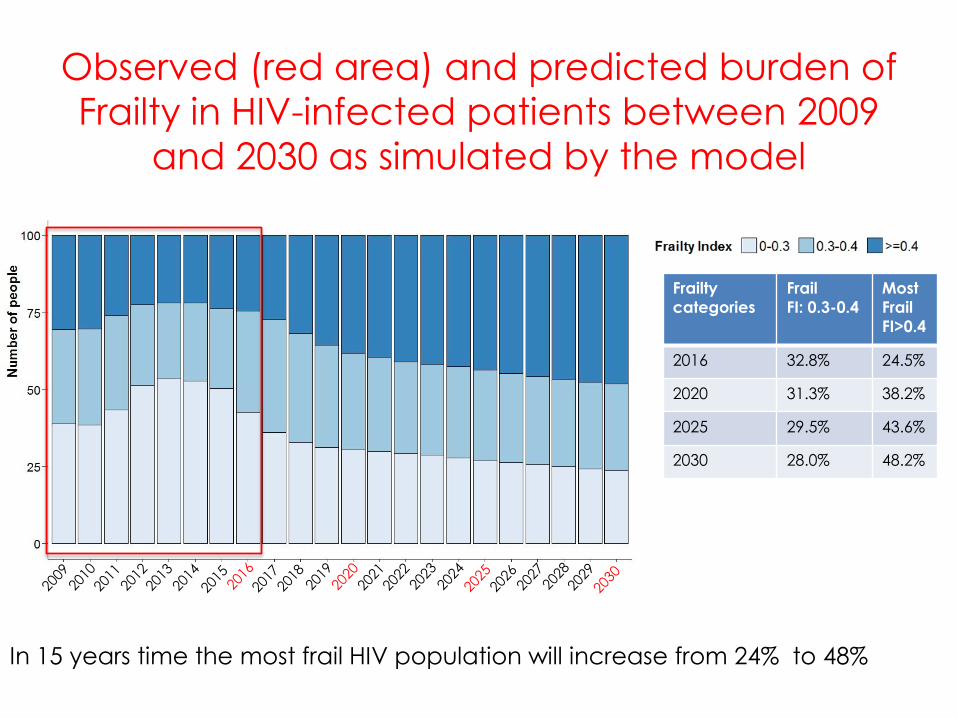
Observed (red area) and predicted burden of
Frailty in HIV-infected patients between 2009
and 2030 as simulated by the model
Frailty
categories
Frail
FI: 0.3-0.4
Most
Frail
FI>0.4
2016 32.8% 24.5%
2020 31.3% 38.2%
2025 29.5% 43.6%
2030 28.0% 48.2%
In 15 years time the most frail HIV population will increase from 24% to 48%

Male ω 2002
39 yrs 2015
50 yrs
2016
51 yrs
CD4=477 cells/µL HIV1-RNA<40 copies/mL
TDF+FTC+NEV
CD4=715 cells/µL HIV1-RNA<40 copies/mL
TDF+FTC+NEV
CD4=357 cells/µL HIV1-RNAnon detectable
RAL+NEV

2000 2005 2010
Drug toxicities Co-morbidities Multi-morbidities
PATIENT AGEING TRAJECTORY
Frailty
2015
Disability
2016
Erlandson, K. M.,et al. Current HIV/AIDS Reports, 11(3), 279–290.
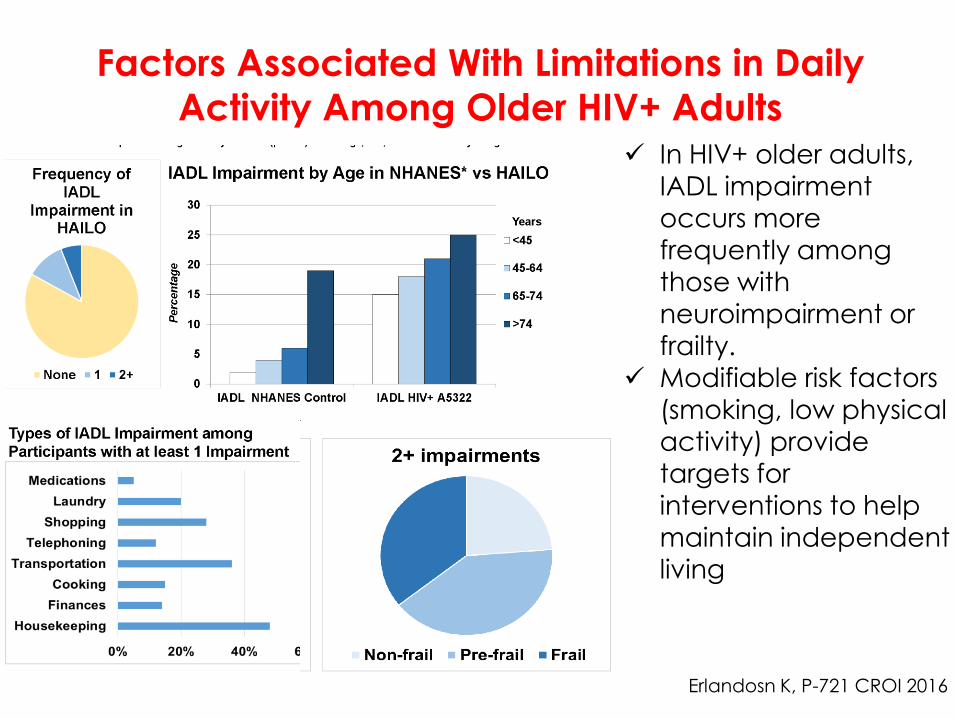
Factors Associated With Limitations in Daily Activity Among Older HIV+ Adults
Erlandosn K, P-721 CROI 2016
In HIV+ older adults,
IADL impairment
occurs more
frequently among
those with
neuroimpairment or frailty.
Modifiable risk factors
(smoking, low physical
activity) provide
targets for interventions to help
maintain independent
living
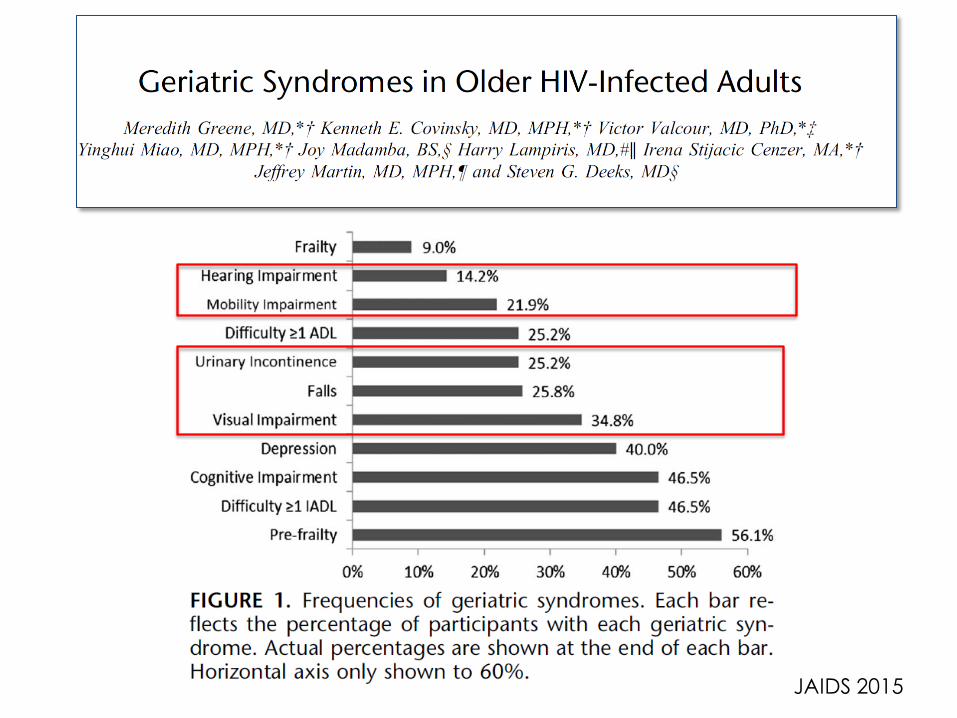
JAIDS 2015
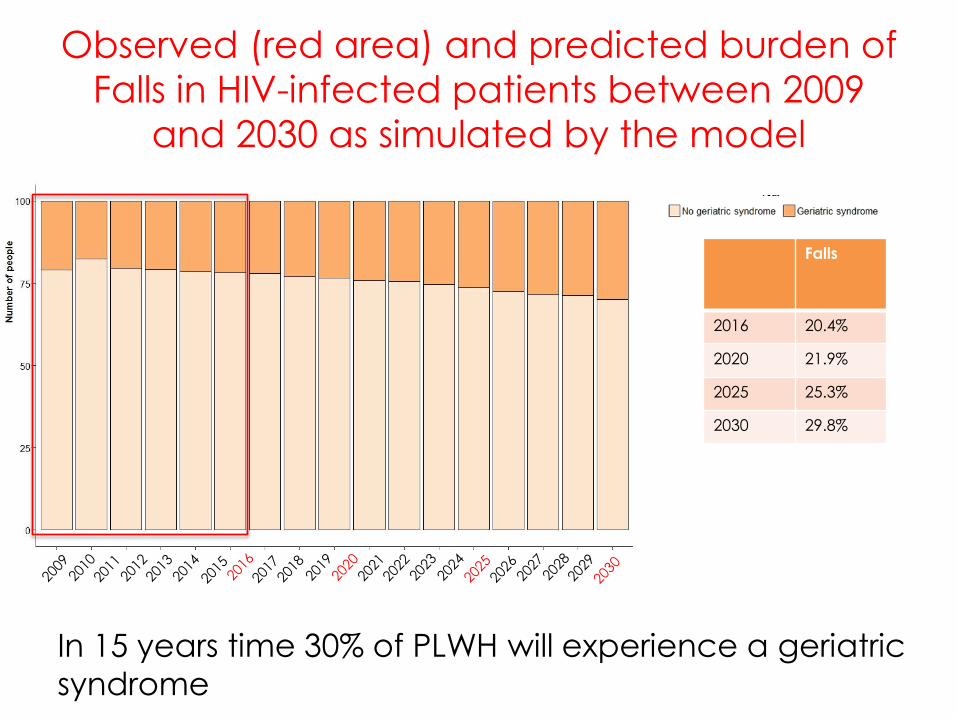
Observed (red area) and predicted burden of
Falls in HIV-infected patients between 2009
and 2030 as simulated by the model
Falls
2016 20.4%
2020 21.9%
2025 25.3%
2030 29.8%
In 15 years time 30% of PLWH will experience a geriatric
syndrome
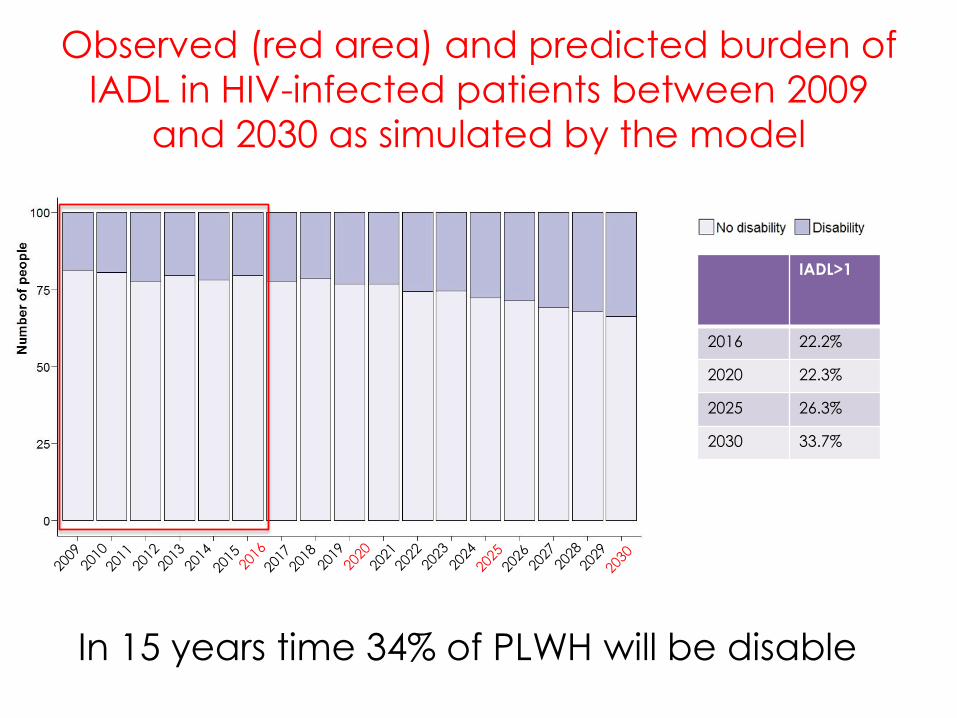
Observed (red area) and predicted burden of
IADL in HIV-infected patients between 2009
and 2030 as simulated by the model
IADL>1
2016 22.2%
2020 22.3%
2025 26.3%
2030 33.7%
In 15 years time 34% of PLWH will be disable

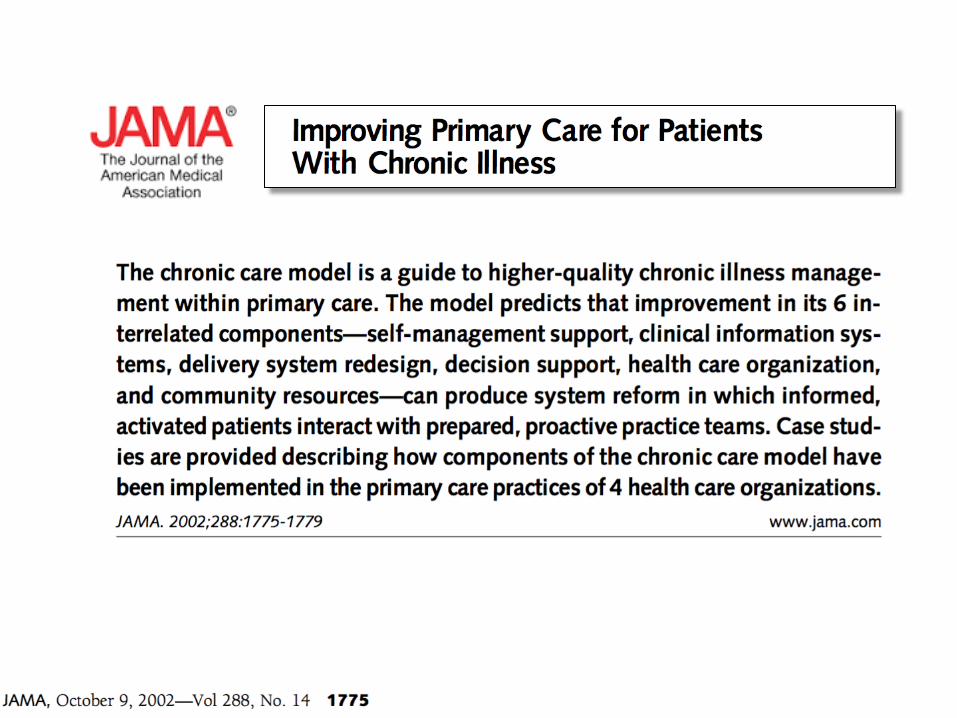
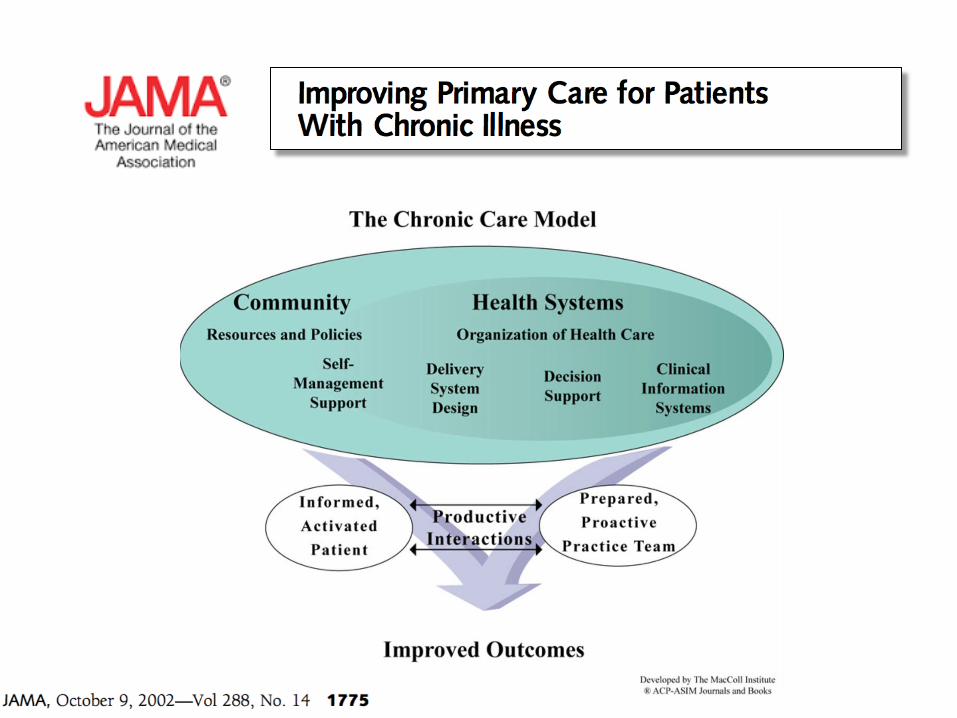
How to manage HIV as a
chronic condition
1.The HIV and Aging Consensus Project: Recommended Treatment Strategies for Clinicians Managing Older
Patients with HIV 2011.
Available at http://www.aahivm.org/hivandagingforum Accessed April 2012;
Managing HIV as a chronic
condition
2. Fitch K,et al. AIDS. 2006;20:1843-1850; 3. Petoumenos K, et al. HIV Med 2011; 12:412-421; 4. Lindau ST, et al. NEJM. 2007;357:762-774.
*if plasma HIV RNA levels > 50,000 copies/ml, greater than 100-point decline in CD4 count in prior 12 months, or risk factors for CVD.
Social support & Promote lifestyle changes2-4
Detection and screening for HIV in older adults1
Functional status assessment
Reduce risks of polypharmacy1
Obtain undetectable VL
Screening for co-morbidities & risk factors1
Toxicity Drug-drug interactions
Adherence issues1
Consider co-morbidities in choosing ART1
Opt-out HIV screening in all adults, regardless of age or
individual factors?1
Healthy diet Smoking cessation
Increase physical activity Sexual health counseling2-4
Self reported and performance based morbidity assessment

Life expectancy vs healthy life expectancy
www.thelancet.com Vol385 February7,2015 563
Healthy life expectancy is a measure that
combines mortality and morbidity
information in one index, expressing the
number of healthy years of life lost
because of poor health, and
incorporating a range of severities to
quantify poor health
Data from the Global Burden of Disease
2010 show that from 1990 to 2010, as life
expectancy rose 20 years healthy life
expectancy increased more slowly (0·75
years for each year of increase in life
expectancy).
Chronic diseases
Special population
Multymorbidity
Complex cases
Ageing
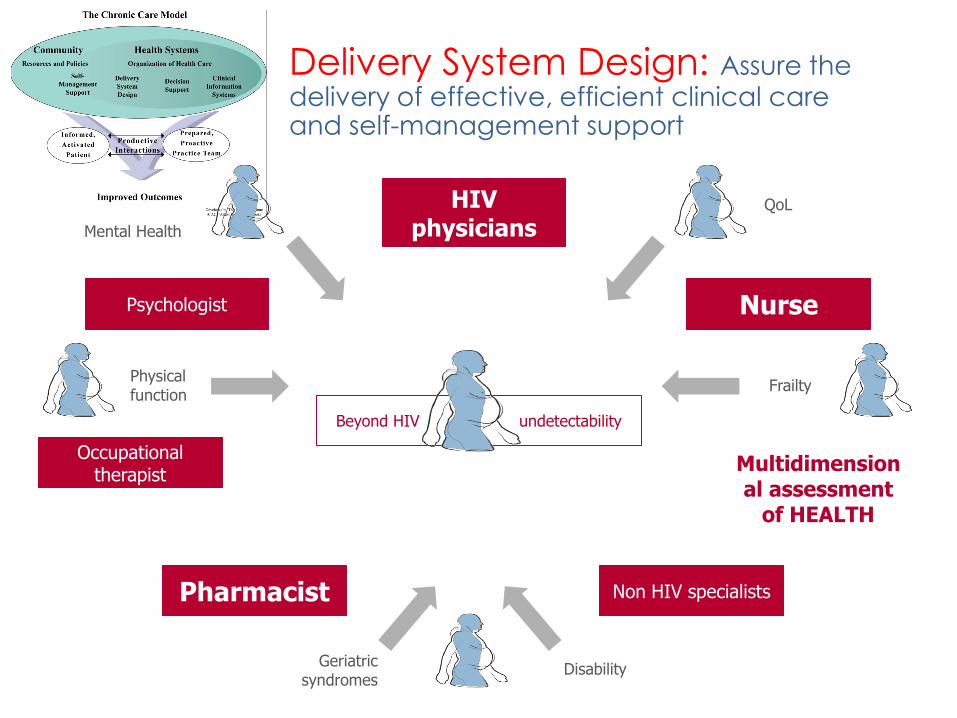
Delivery System Design: Assure the delivery of effective, efficient clinical care and self-management support
Multidimensional assessment
of HEALTH
Beyond HIV undetectability
HIV physicians
Occupational therapist
Pharmacist
Psychologist Nurse
Geriatric syndromes
Non HIV specialists
Disability
QoL
Mental Health
Physical function
Frailty

Insert footnotes here
CLINICAL MANAGEMENT: Health care organization & Delivery system design

Decision Support: Promote clinical care that is consistent with scientific evidence and patient preferences
HIV & hepatitis drug interactions
• http://www.hiv-druginteractions.org
• http://www.hep-druginteractions.org
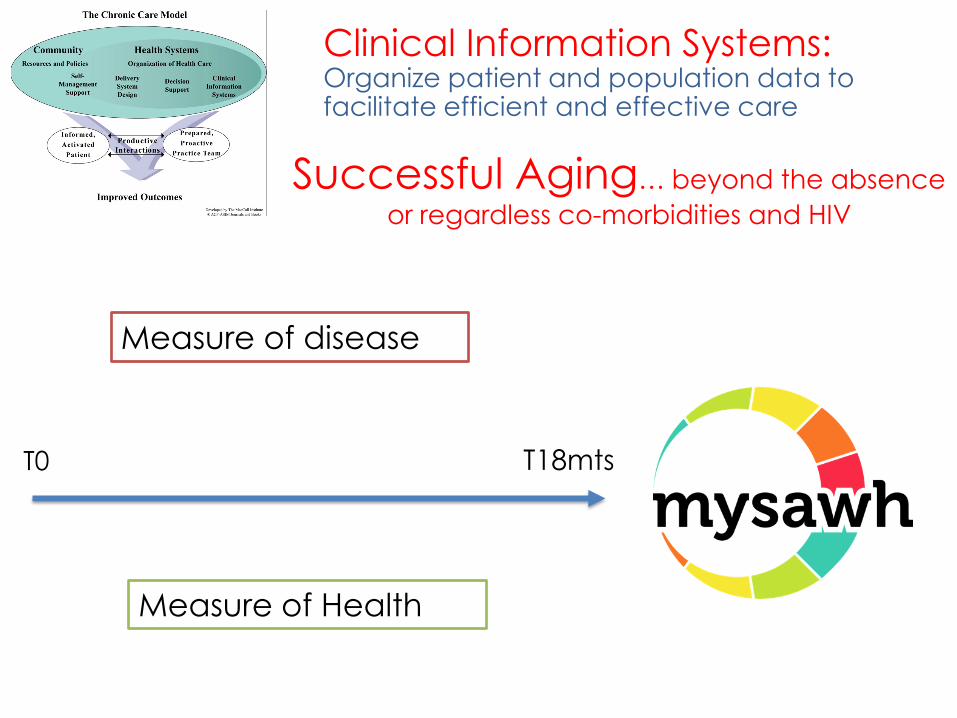
Clinical Information Systems: Organize patient and population data to facilitate efficient and effective care
Successful Aging… beyond the absence
or regardless co-morbidities and HIV
T0 T18mts
Measure of disease
Measure of Health
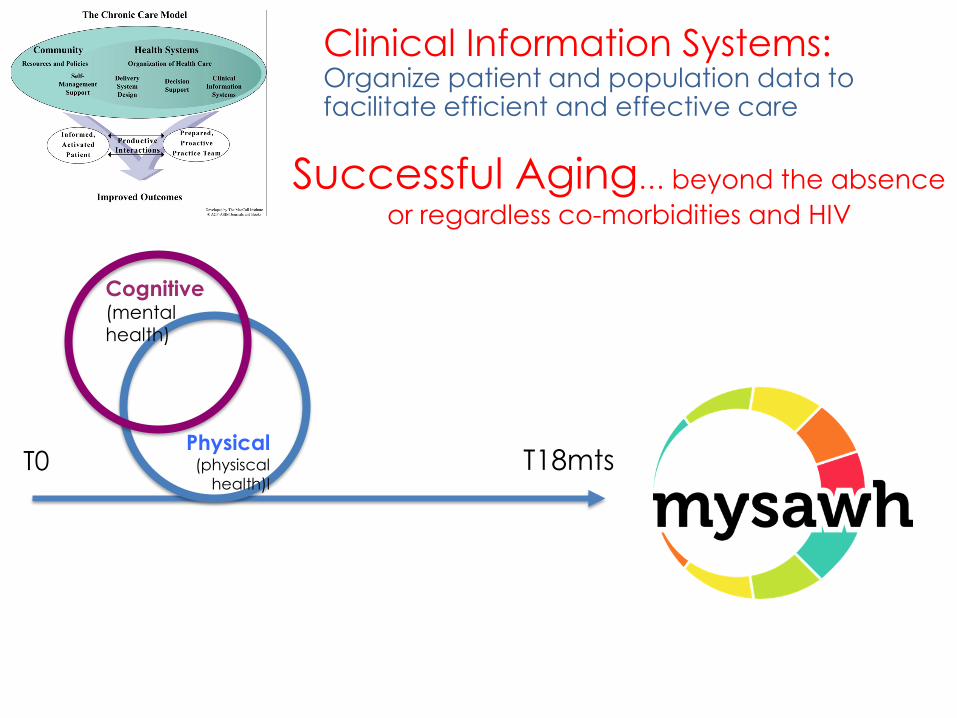
Clinical Information Systems: Organize patient and population data to facilitate efficient and effective care
Successful Aging… beyond the absence
or regardless co-morbidities and HIV
T0 T18mts Physical
(physiscal
health)l
Cognitive (mental health)

Clinical Information Systems: Organize patient and population data to facilitate efficient and effective care
Successful Aging… beyond the absence
or regardless co-morbidities and HIV
Frailty
Index T0 T18mts
Measure of disease

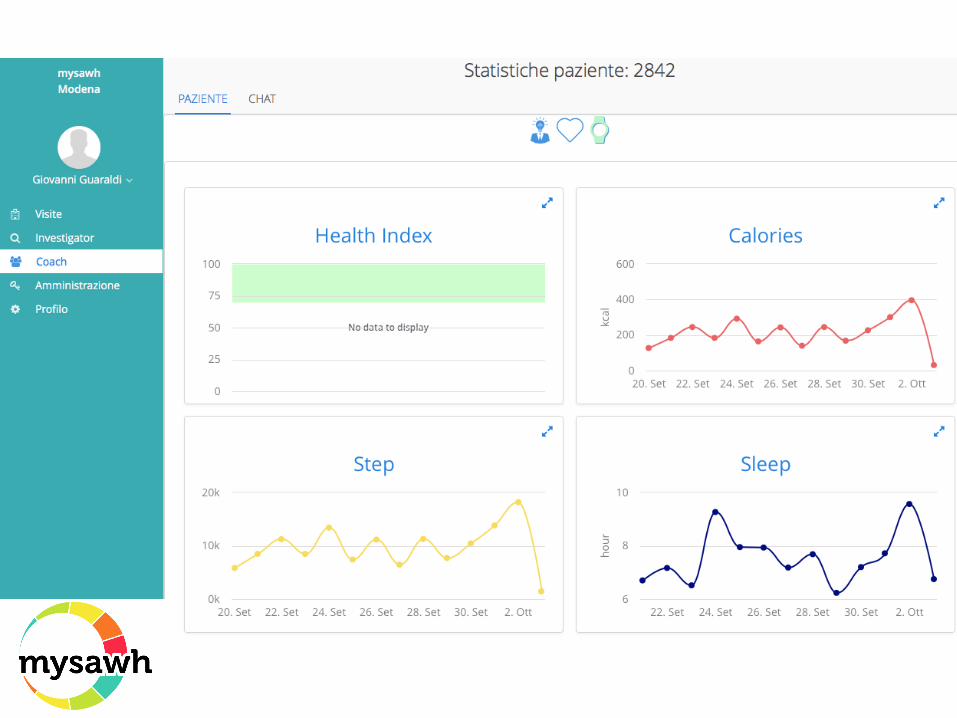
Clinical Information Systems: Organize patient and population data to facilitate efficient and effective care
Successful Aging… beyond the absence
or regardless co-morbidities and HIV
T0 T18mts
Physiologic
al data (steps, sleep,
calories

Clinical Information Systems: Organize patient and population data to facilitate efficient and effective care
Successful Aging… beyond the absence
or regardless co-morbidities and HIV
T0 T18mts
Physiologic
al data (steps, sleep,
calories
Emotional & Spiritual (Ecological Momentary
Assessment
Mood
Socialization Smoke Spiritual Eating behaviour ….

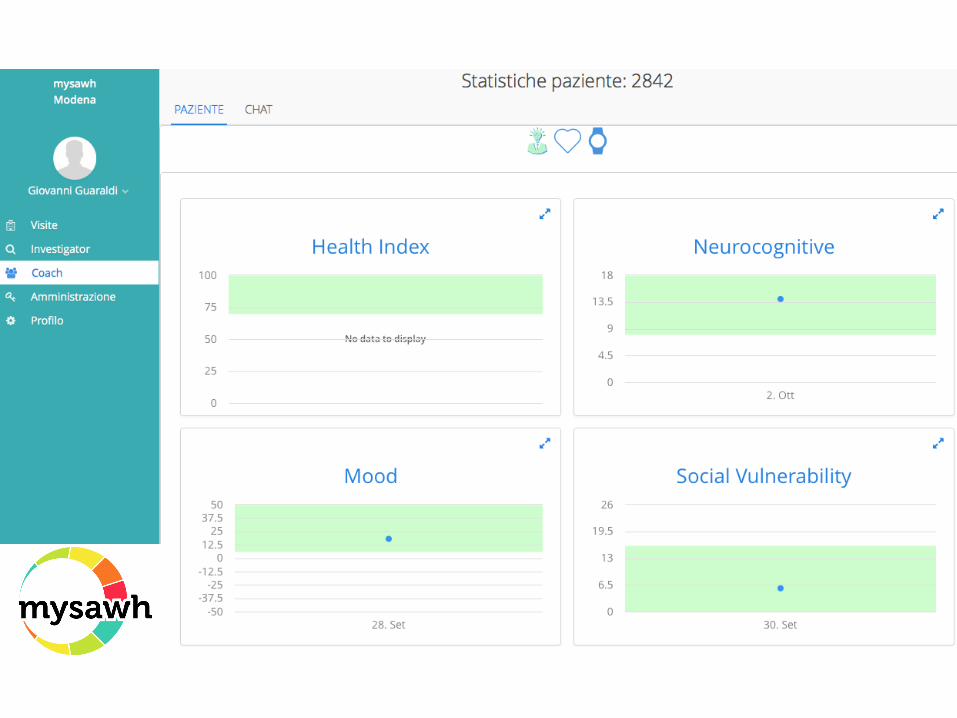
Clinical Information Systems: Organize patient and population data to facilitate efficient and effective care
Successful Aging… beyond the absence
or regardless co-morbidities and HIV
Frailty
Index
Health
Index
T0 T18mts
Measure of disease
Measure of Health
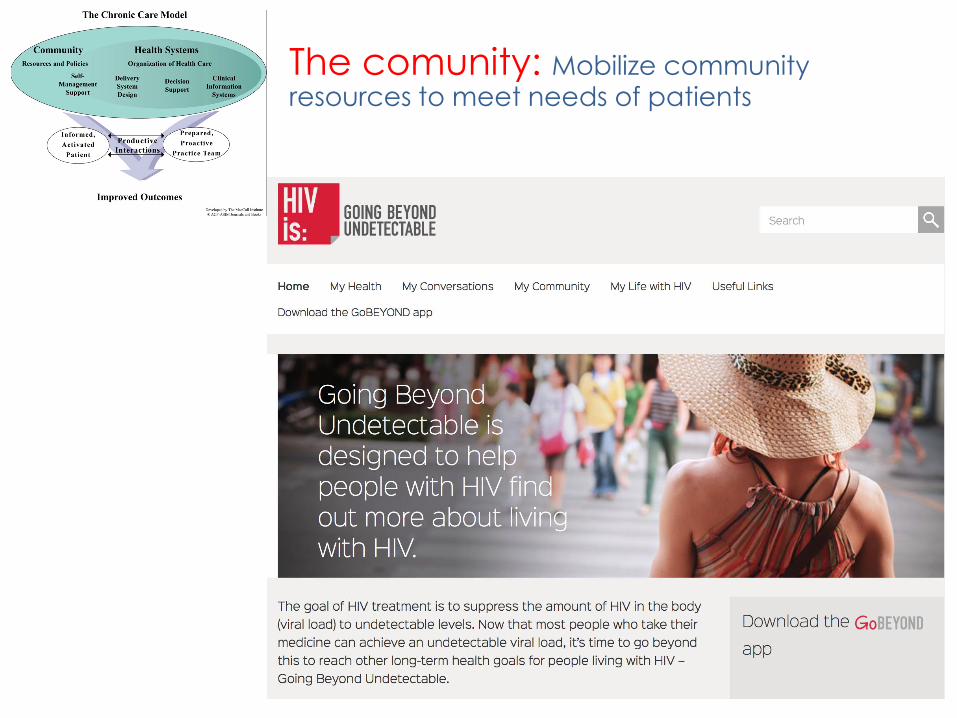
The comunity: Mobilize community resources to meet needs of patients

Slater LZ et al JOURNAL OF THE ASSOCIATION OF NURSES IN AIDS CARE, Vol. 26, No. 1, January/February 2015, 24-35
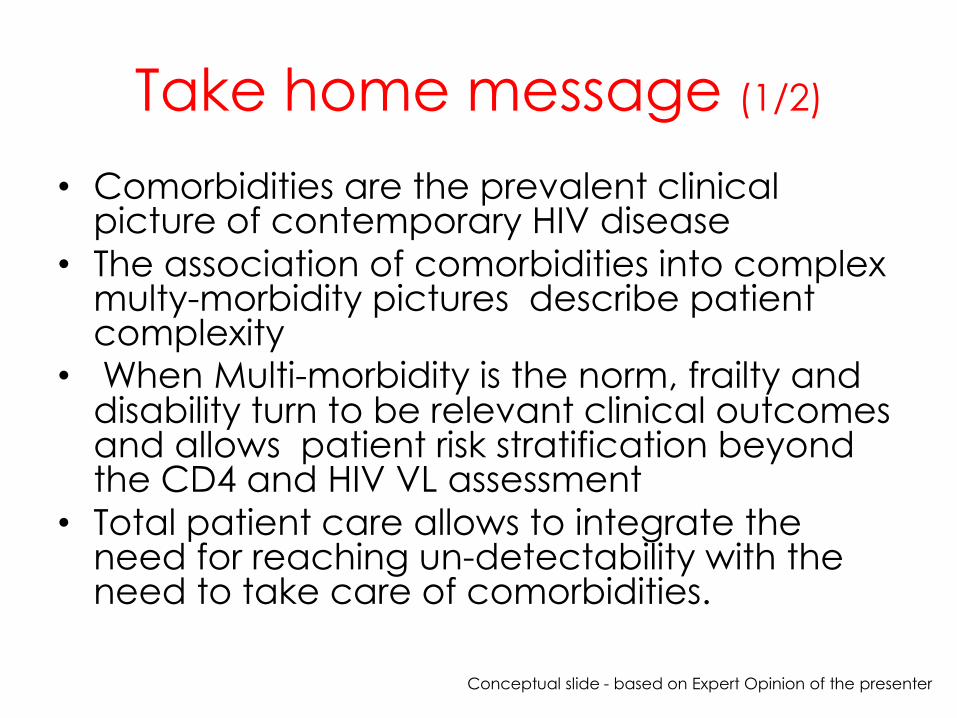
Take home message (1/2)
• Comorbidities are the prevalent clinical picture of contemporary HIV disease
• The association of comorbidities into complex multy-morbidity pictures describe patient complexity
• When Multi-morbidity is the norm, frailty and disability turn to be relevant clinical outcomes and allows patient risk stratification beyond the CD4 and HIV VL assessment
• Total patient care allows to integrate the need for reaching un-detectability with the need to take care of comorbidities.
Conceptual slide - based on Expert Opinion of the presenter
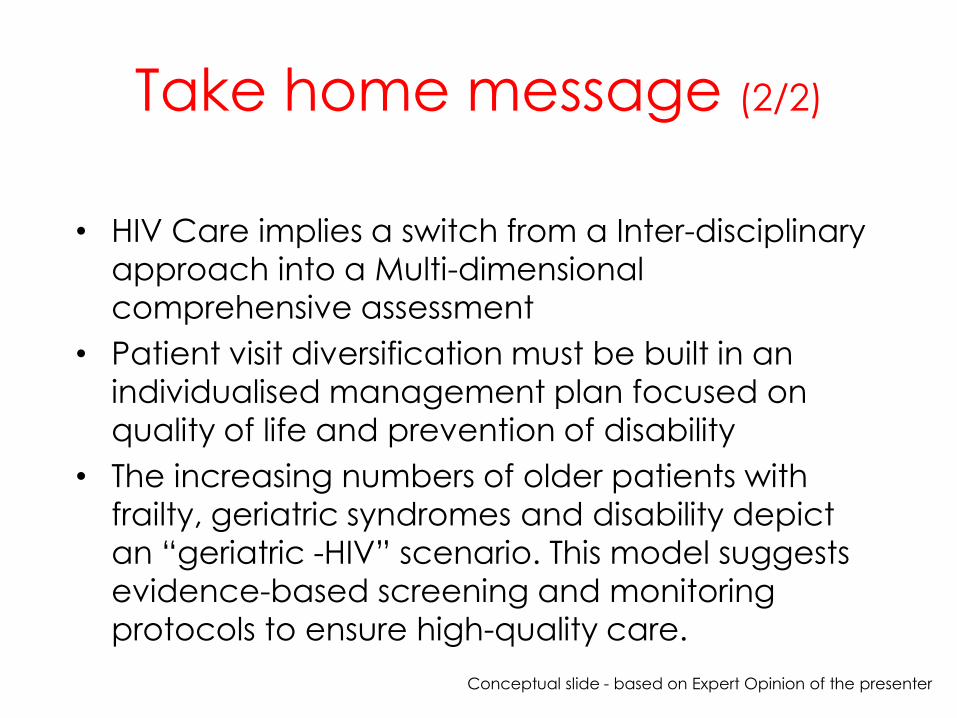
Take home message (2/2)
• HIV Care implies a switch from a Inter-disciplinary
approach into a Multi-dimensional
comprehensive assessment
• Patient visit diversification must be built in an
individualised management plan focused on
quality of life and prevention of disability
• The increasing numbers of older patients with
frailty, geriatric syndromes and disability depict
an “geriatric -HIV” scenario. This model suggests
evidence-based screening and monitoring
protocols to ensure high-quality care.
Conceptual slide - based on Expert Opinion of the presenter
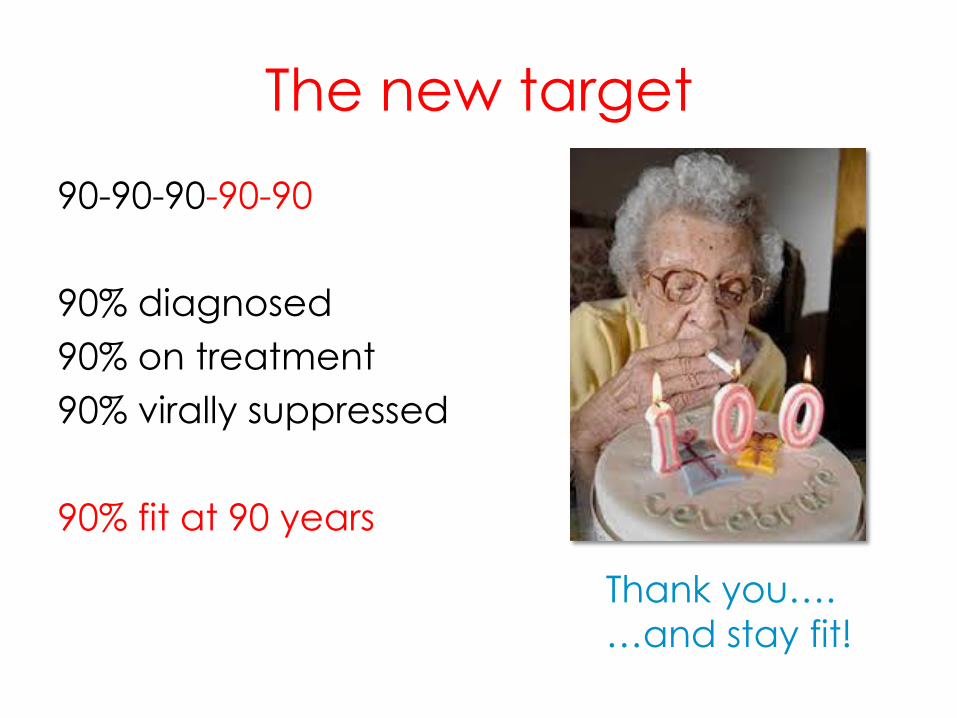
The new target
90-90-90-90-90
90% diagnosed
90% on treatment
90% virally suppressed
90% fit at 90 years
Thank you….
…and stay fit!