incorporation of water into glasses and its influence on ... · profiles for case a: sodium...
TRANSCRIPT

CORNELL 1
Incorporation of Water into Glasses
and its Influence on the Diffusion of
Cations, Including the Creation of
Diffusion Barriers
Rüdiger Dieckmann
Department of Materials Science and Engineering,
Bard Hall, Cornell University, Ithaca, NY 14853-1501
CORNELL 2
Water in Silicate Glasses I
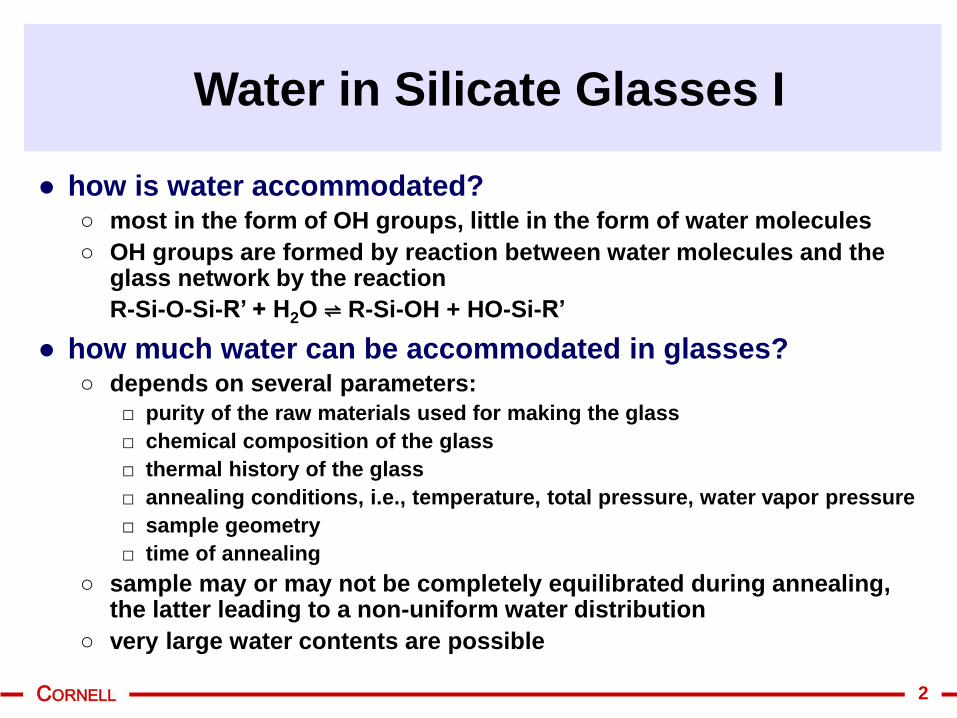
● how is water accommodated?○ most in the form of OH groups, little in the form of water molecules
○ OH groups are formed by reaction between water molecules and the glass network by the reaction
R-Si-O-Si-R’ + H2O ⇌ R-Si-OH + HO-Si-R’
● how much water can be accommodated in glasses?○ depends on several parameters:
□ purity of the raw materials used for making the glass
□ chemical composition of the glass
□ thermal history of the glass
□ annealing conditions, i.e., temperature, total pressure, water vapor pressure
□ sample geometry
□ time of annealing
○ sample may or may not be completely equilibrated during annealing, the latter leading to a non-uniform water distribution
○ very large water contents are possible
CORNELL 3
Water in Silicate Glasses II
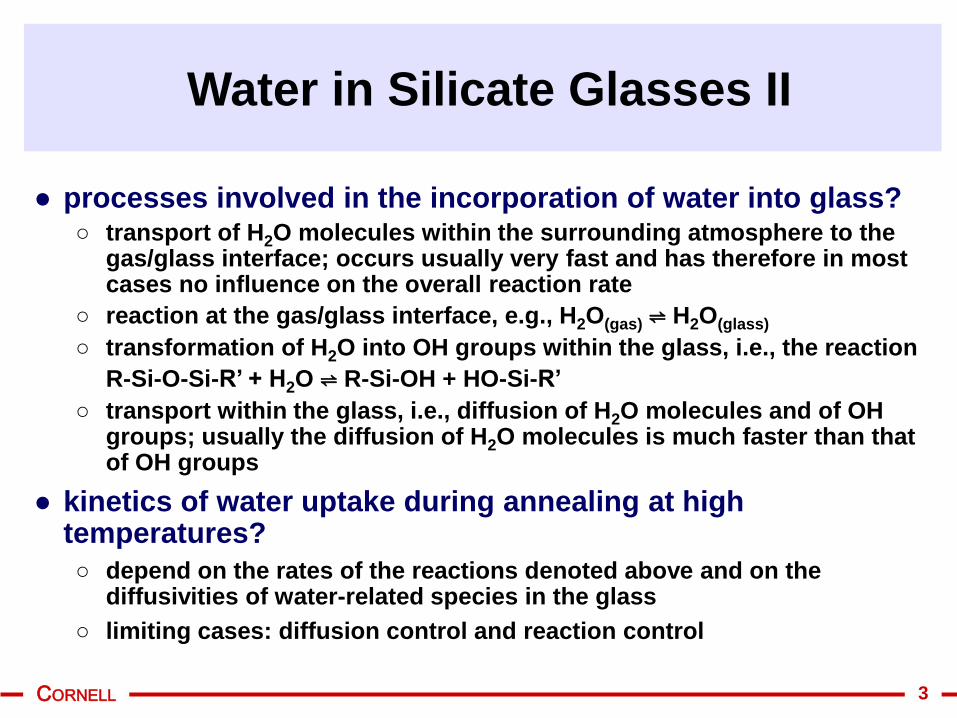
● processes involved in the incorporation of water into glass?○ transport of H2O molecules within the surrounding atmosphere to the
gas/glass interface; occurs usually very fast and has therefore in most cases no influence on the overall reaction rate
○ reaction at the gas/glass interface, e.g., H2O(gas) ⇌ H2O(glass)
○ transformation of H2O into OH groups within the glass, i.e., the reaction
R-Si-O-Si-R’ + H2O ⇌ R-Si-OH + HO-Si-R’
○ transport within the glass, i.e., diffusion of H2O molecules and of OH groups; usually the diffusion of H2O molecules is much faster than that of OH groups
● kinetics of water uptake during annealing at high temperatures?
○ depend on the rates of the reactions denoted above and on the diffusivities of water-related species in the glass
○ limiting cases: diffusion control and reaction control

CORNELL 4
How to Measure the Water Content of
Glasses?
● cOH » cH2O; therefore measure only cOH
● IR absorption due to OH stretching vibration at a wavenumber of about 3600 cm―1
● intensity of this absorption is related to the concentration of OH and to the overall water concentration
● absorption due to OH groups is described by the Beer-Lambert law:
● relation between the absorbance Ag
and the concentration of OH groups:
ggmΟΗΟΗ
gmΟΗΟΗ
Α
0
cε
0
cα
0
10Ι10Ι Ι
eΙ Ι
OH
ggOHOH
OH
ggOHOH
OH
ggOHOH
0g
2
22
2
2 M
ρεc
M
ρεc2
M
ρεc
I
IlogA
○ εOH = molar absorption coefficient related
to the overall concentration of OH groups
present in the glass (ℓ/(molOHcm))
○ ℓg = thickness of glass sample (cm)
○ cOH = molar concentration of OH
○Ag = absorbance
○ cOH, cH2O = mass fractions of OH, H2O
○MOH, MH2O = molar masses of OH, H2O
○ g = density of the glass (g/cm3)
○ I/I0 = ratio between transmitted and initial
IR signal
○ εH2O = molar absorption coefficient
related to the overall concentration of
H2O in the glass (ℓ/(molH2Ocm) = 2 εOH
m

CORNELL 5
FTIR Measurement of the OH-Content
of Glasses
● from the Beer-Lambert law:
with
● reorganization of the equation for cH2O:
● change in the H2O concentration after annealing for the time t:
g
OH
gOH
g
glass
OH
OHρ
M
ε
A
2
1
m
Mc 22
2
010g
I
IlogA
g
OH
g
gOHOH
ρ
MA
2
1εc 2
2
0)(tc(t)cΔc OHOHOH 222
○ εOH = molar absorption coefficient related
to the overall concentration of OH
groups present in the glass (ℓ/(molOHcm))
○ ℓg = thickness of glass sample (cm)
○ cH2O = mass fraction of H2O
○MH2O = molar mass of H2O (= 18 g/mol)
○ g = density of the glass (g/cm3)
○ I/I0 = ratio between transmitted and initial
IR signal
CORNELL 6
Structural Changes Upon the Uptake of
Water — Structural Relaxation
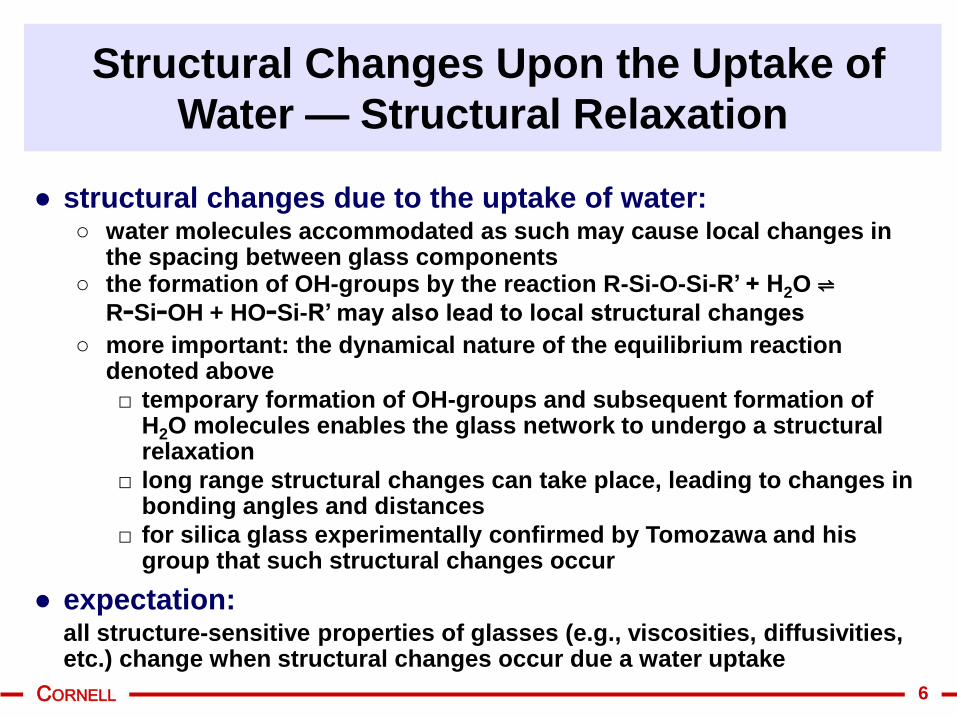
● structural changes due to the uptake of water:○ water molecules accommodated as such may cause local changes in
the spacing between glass components○ the formation of OH-groups by the reaction R-Si-O-Si-R’ + H2O ⇌
R-Si-OH + HO-Si-R’ may also lead to local structural changes
○ more important: the dynamical nature of the equilibrium reaction denoted above
□ temporary formation of OH-groups and subsequent formation of H2O molecules enables the glass network to undergo a structural relaxation
□ long range structural changes can take place, leading to changes in bonding angles and distances
□ for silica glass experimentally confirmed by Tomozawa and his group that such structural changes occur
● expectation:all structure-sensitive properties of glasses (e.g., viscosities, diffusivities, etc.) change when structural changes occur due a water uptake

CORNELL 7
Opportunity for Generating Functionally
Graded Glass?
● if the uptake of water leads to useful property changes, water incorporation can be used to generate glass with properties changing as a function of the distance from the surface
○ low tech approach
○ low cost
● by annealing glass in a moist atmosphere at high temperature the properties of the near-surface region may be changed while the rest of the glass remains unchanged
● example of interest here:
○ modification of the diffusivity of ions by the incorporation of water
○ can be used to generate a diffusion barrier if the diffusivity of interest in the water uptake-influenced region is significantly smaller than in the rest of the sample

CORNELL 8
Silicate Glasses of Interest
● Type I silica (Heraeus Infrasil 302)○ fused quartz made by melting of natural quartz crystals
○ average concentration of metallic impurities: about 40 ppm by weight◇ most abundant: Al (about 30 ppmw)
◇ Ti, Fe and Na present at the one ppmw level
◇ OH content less than 8 ppmw
○ strain point: 1075 °C
● Corning Code 1737 glass○ alkaline earth boroaluminosilicate glass
○ composition (in mol %): SiO2 69.0 %, Al2O3 11.5 %, B2O3 7.3 % CaO 5.0 %, BaO 4.4 %, MgO 1.4 %, SrO 1.2 % and As2O3 0.2 %, Na impurity level 600 ppma; OH about 500 ppmw
○ fusion drawn substrate glass for flat panel display applications
○ strain point 666 °C
● model glasses of the type (CaO∙Al2O3)1x(2 SiO2)x
CORNELL 9
Topics of Interest
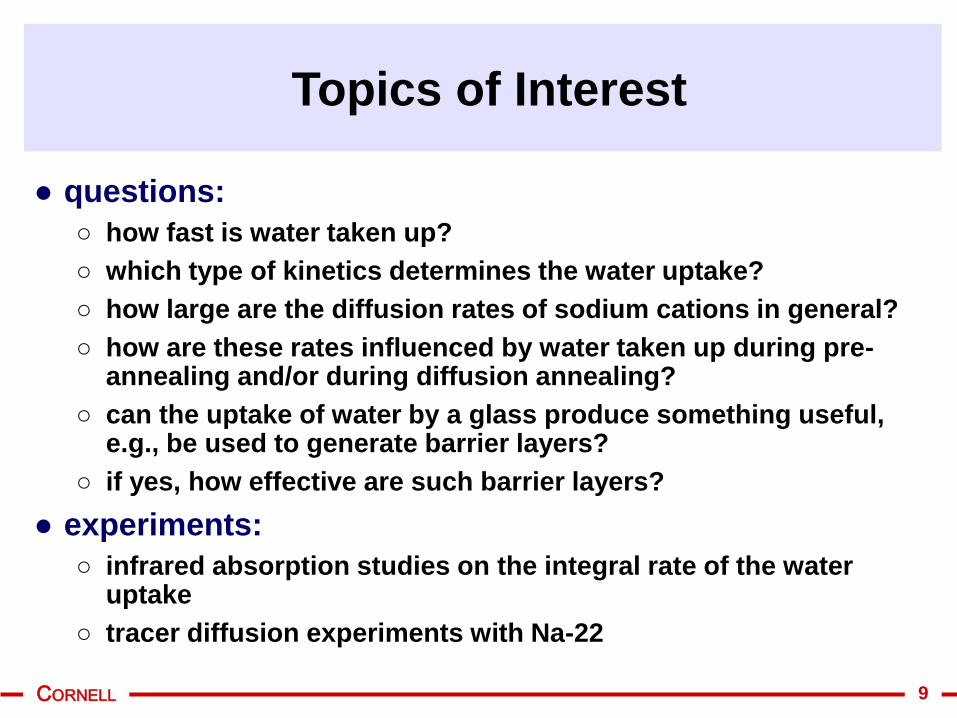
● questions:
○ how fast is water taken up?
○ which type of kinetics determines the water uptake?
○ how large are the diffusion rates of sodium cations in general?
○ how are these rates influenced by water taken up during pre-annealing and/or during diffusion annealing?
○ can the uptake of water by a glass produce something useful, e.g., be used to generate barrier layers?
○ if yes, how effective are such barrier layers?
● experiments:
○ infrared absorption studies on the integral rate of the water uptake
○ tracer diffusion experiments with Na-22

CORNELL 10
Water Uptake by
Corning Code 1737 Glass I
● experiments:○ annealing of glass samples for
different times in wet air (air saturated with water at 80 °C) at 650, 700 and 800 °C
○ measurement of the absorbance related to OH groups
● results:○ analysis of the time dependence
of the absorbance shows that it increases with the square root of the annealing time
○ indicates that the uptake of water is a diffusion-controlled process

CORNELL 11
Water Uptake by
Corning Code 1737 Glass II
● water content:○ absorbance observed at t = 0
corresponds to an OH concen-tration of about 500 ppm by weight
○ estimated that the OH concentra-tions at the glass surface could be about 20 times higher at 650, 700 and 800 °C in wet air
● kinetics:○ time dependence of absorbance:
Ag(t) = Ag(t=0) + (kabs·t)1/2
○ kabs obtained from the slopes in the plot shown before
○ T-dependence of kabs: activation energy = 139.5 (± 34.5) kJ/mol; to be attributed to the diffusion of H2O
CORNELL 12
Water Uptake by
Type I Silica Glass (Infrasil 302) I
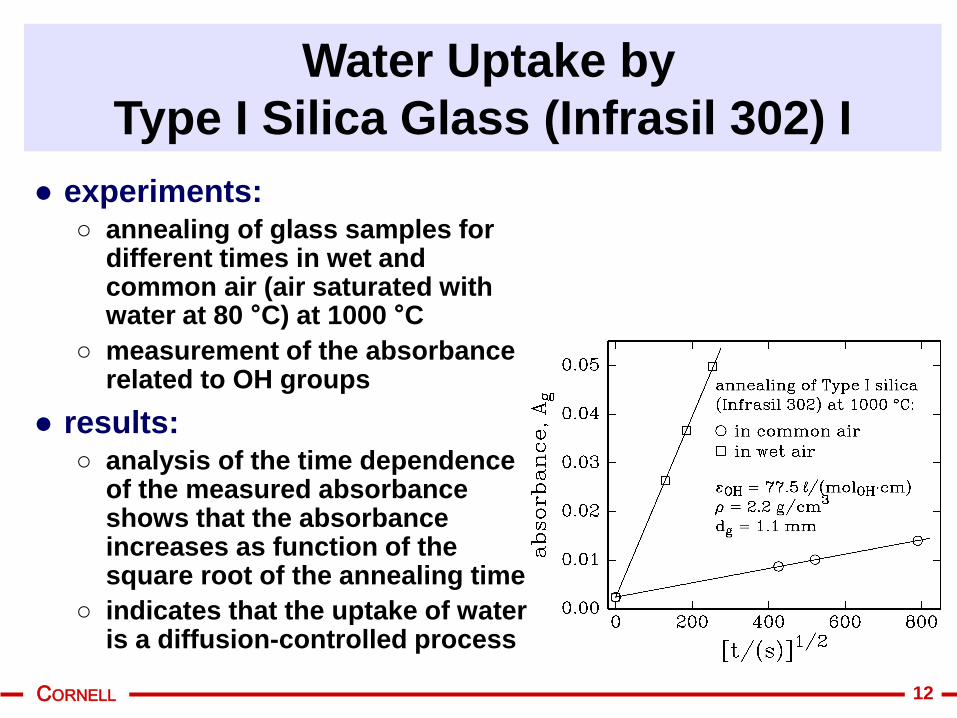
● experiments:○ annealing of glass samples for
different times in wet and common air (air saturated with water at 80 °C) at 1000 °C
○ measurement of the absorbance related to OH groups
● results:○ analysis of the time dependence
of the measured absorbance shows that the absorbance increases as function of the square root of the annealing time
○ indicates that the uptake of water is a diffusion-controlled process
CORNELL 13
Water Uptake by
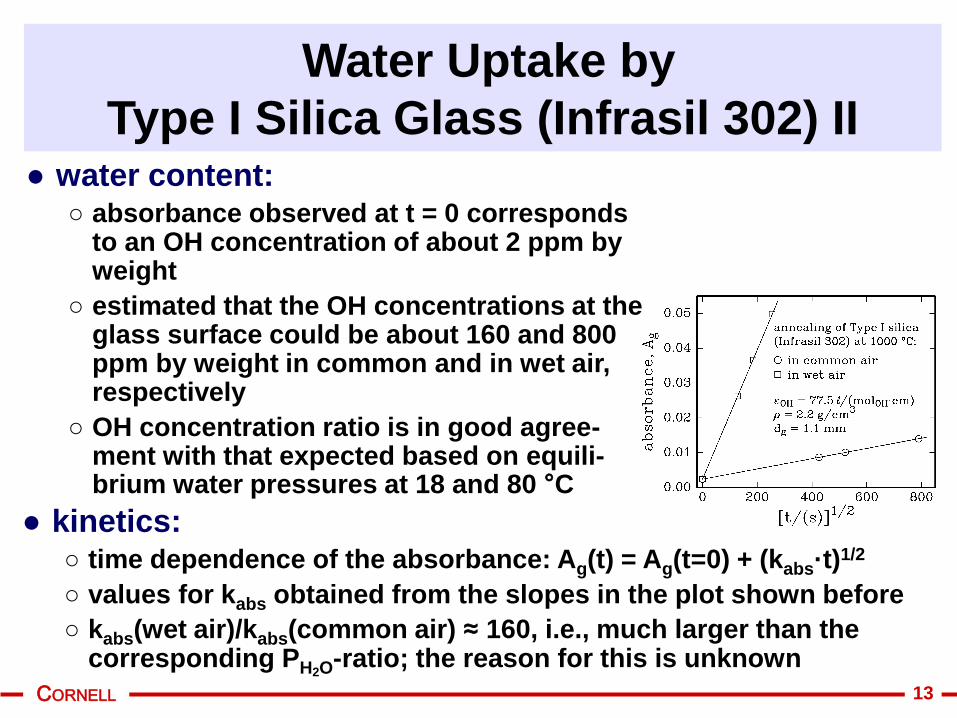
Type I Silica Glass (Infrasil 302) II● water content:
○ absorbance observed at t = 0 corresponds to an OH concentration of about 2 ppm by weight
○ estimated that the OH concentrations at the glass surface could be about 160 and 800 ppm by weight in common and in wet air, respectively
○ OH concentration ratio is in good agree-ment with that expected based on equili-brium water pressures at 18 and 80 °C
● kinetics:○ time dependence of the absorbance: Ag(t) = Ag(t=0) + (kabs·t)
1/2
○ values for kabs obtained from the slopes in the plot shown before
○ kabs(wet air)/kabs(common air) ≈ 160, i.e., much larger than the corresponding PH2O
-ratio; the reason for this is unknown
CORNELL 14
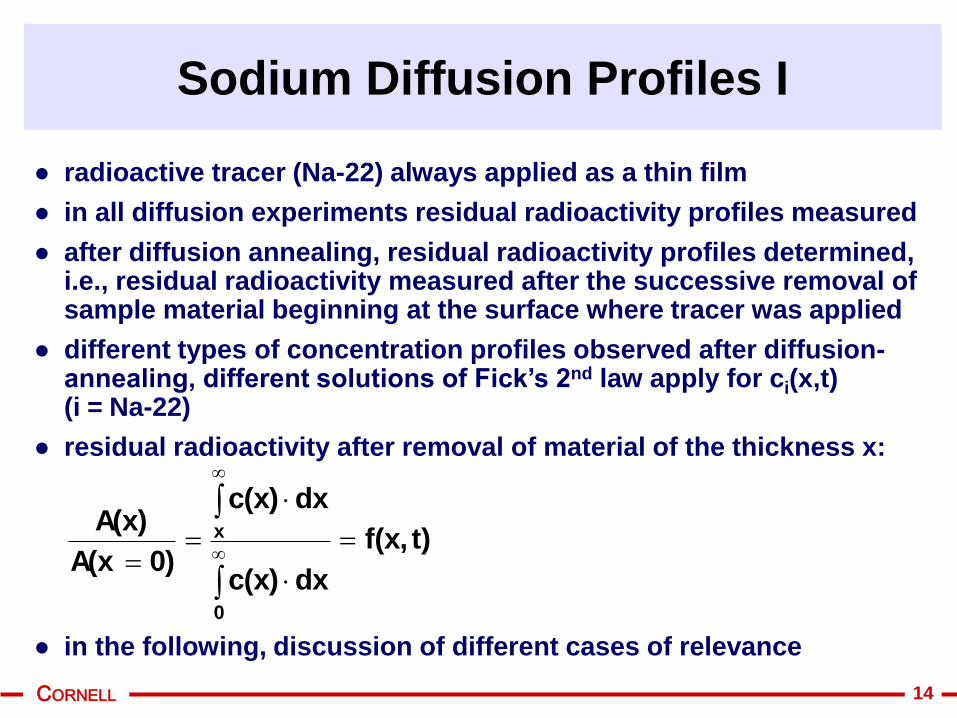
● radioactive tracer (Na-22) always applied as a thin film
● in all diffusion experiments residual radioactivity profiles measured
● after diffusion annealing, residual radioactivity profiles determined, i.e., residual radioactivity measured after the successive removal of sample material beginning at the surface where tracer was applied
● different types of concentration profiles observed after diffusion-annealing, different solutions of Fick’s 2nd law apply for ci(x,t) (i = Na-22)
● residual radioactivity after removal of material of the thickness x:
● in the following, discussion of different cases of relevance
Sodium Diffusion Profiles I
t)f(x,
dxc(x)
dxc(x)
0)A(x
A(x)
0
x

CORNELL 15
● profiles for Case A:
Sodium Diffusion Profiles II
● profiles for Case B: ● profiles for Case C:
CORNELL 16
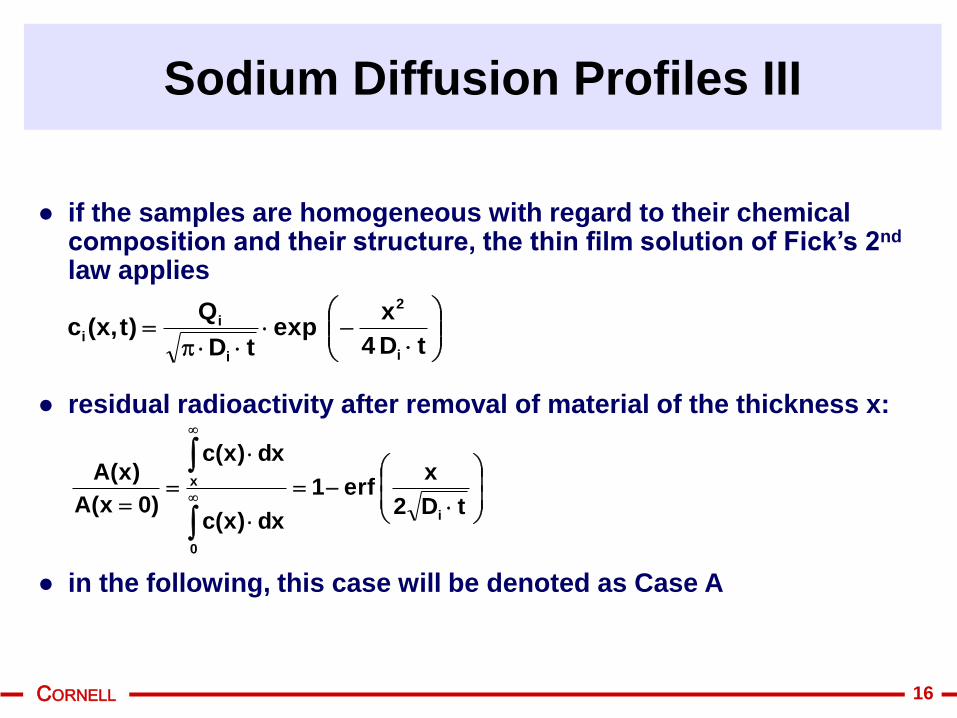
● if the samples are homogeneous with regard to their chemical composition and their structure, the thin film solution of Fick’s 2nd
law applies
● residual radioactivity after removal of material of the thickness x:
● in the following, this case will be denoted as Case A
Sodium Diffusion Profiles III
tD 4
x exp
tD
Q)t,x(c
i
2
i
ii
tD2
x erf1
dx)x(c
dx)x(c
)0x(A
)x(A
i
0
x

CORNELL 17
● if the samples are inhomogeneous, different solutions of Fick’s 2nd law need to be applied
● considered are samples with a near-surface region, in which the diffusion rate is different from that in the bulk, i.e., Di(ns) ≠ Di(bu)
● two cases of interest:
○ Case B: thickness of the near-surface region, ℓ, changes with the diffusion-annealing time, ℓ = (kp(da)·tda)
1/2
○ Case C: thickness of the near-surface region, ℓ, does not change with the diffusion-annealing time (but with the time of pre-annealing at a significantly higher temperature than that of the diffusion anneal, i.e., ℓ = (kp(pa)·tpa)
1/2)
● different solutions for x < ℓ and for x > ℓ
Sodium Diffusion Profiles IV
CORNELL 18
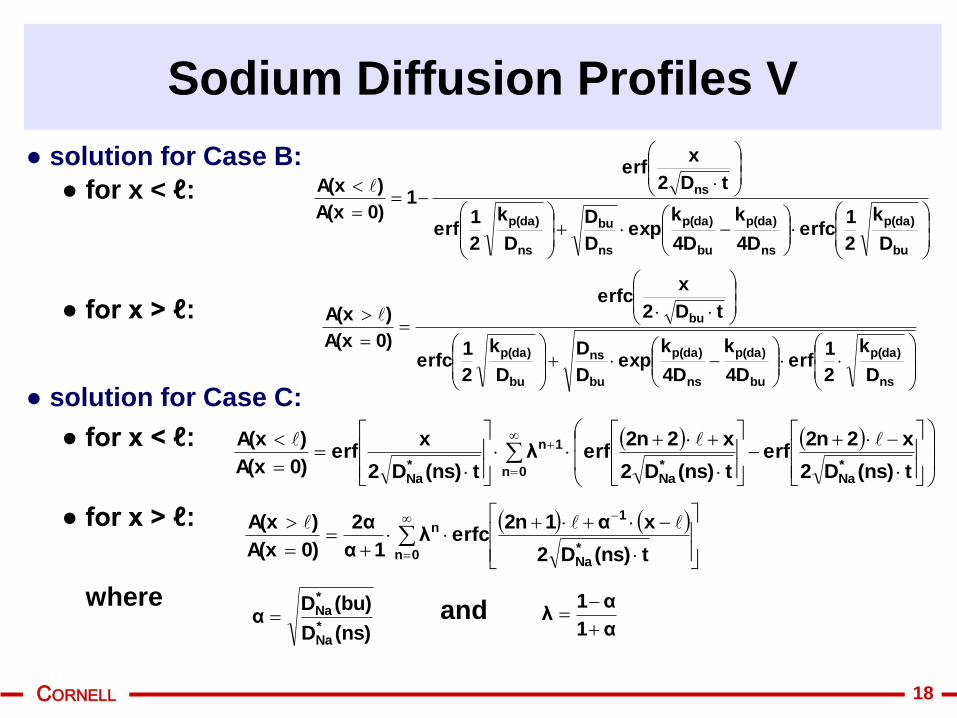
● solution for Case B:
● for x < ℓ:
● for x > ℓ:
● solution for Case C:
● for x < ℓ:
● for x > ℓ:
where
Sodium Diffusion Profiles V
bu
p(da)
ns
p(da)
bu
p(da)
ns
bu
ns
p(da)
ns
D
k
2
1erfc
4D
k
4D
kexp
D
D
D
k
2
1erf
tD2
xerf
10)A(x
)A(x
ns
p(da)
bu
p(da)
ns
p(da)
bu
ns
bu
p(da)
bu
D
k
2
1erf
4D
k
4D
kexp
D
D
D
k
2
1erfc
tD2
xerfc
0)A(x
)A(x
t(ns)D2
x22nerf
t(ns)D2
x22nerfλ
t(ns)D2
xerf
0)A(x
)A(x
*Na
*Na
0n
1n
*Na
t(ns)D2
xα12nerfcλ
1α
2α
0)A(x
)A(x
*Na
1
0n
n
(ns)D
(bu)Dα
*Na
*Na
α1
α1λ
and
CORNELL 19
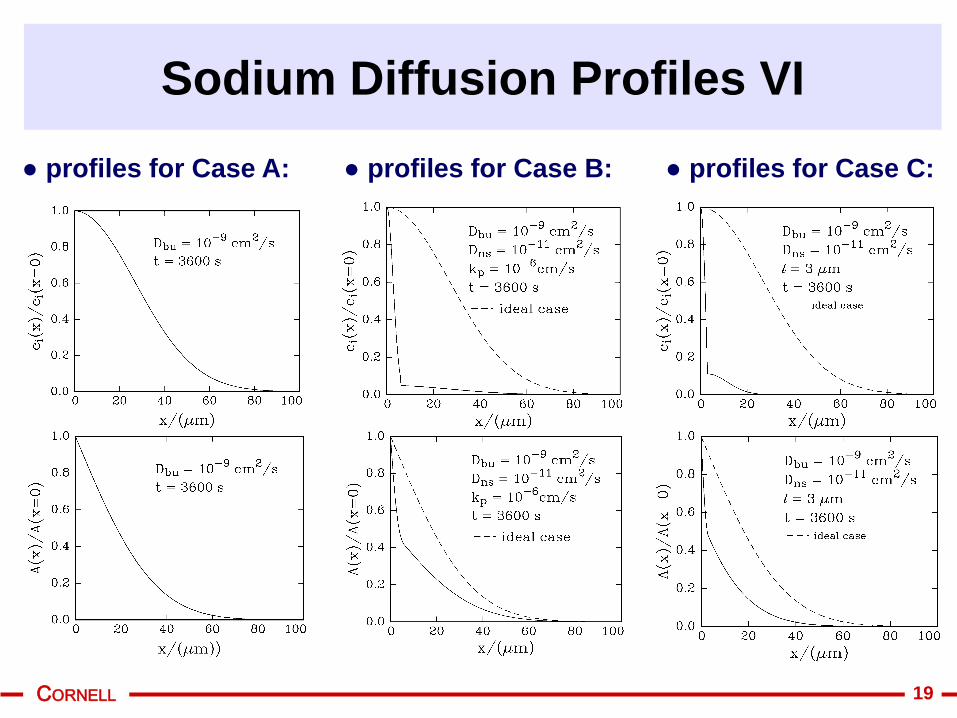
● profiles for Case A:
Sodium Diffusion Profiles VI
● profiles for Case B: ● profiles for Case C:

CORNELL 20
● diffusion-annealing of as-received samples in dry and in common air leads to type A profiles, i.e., to profiles that can be described by a single diffusion coefficient
● type B profiles with kinks are observed after diffusion-annealing of as-received samples in wet air (i.e., air saturated with H2O at 80 °C)
● the location of the kink changes with the diffusion-annealing time
● the kink displacement with the diffusion-annealing time follows a parabolic rate law, as assumed for type B profiles
● the presence of sharp kinks justifies the assumption that DNa(ns) is constant
Diffusion of Na in 1737 Glass I

CORNELL 21
● type A profiles are observed in Na-22 diffusion experiments in common and wet air at lower temperatures with as-received samples of Infrasil 302
● if the samples are pre-annealed at higher temperatures (900 - 1100 °C) in common or wet air, kinks are observed in tracer diffusion profiles generated at much lower temperature (650 °C), i.e., type C profiles are obtained
● the location of the kink, ℓ, as a function of the pre-annealing time follows a parabolic rate law
Na Diffusion in Type I Silica Glass I
CORNELL 22
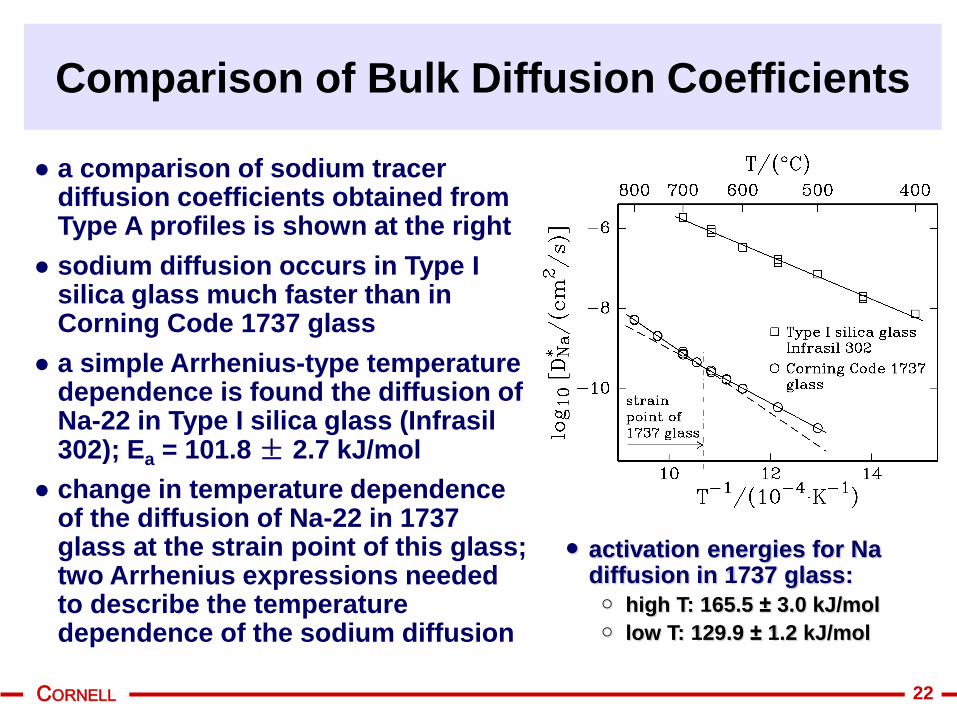
● a comparison of sodium tracer diffusion coefficients obtained from Type A profiles is shown at the right
● sodium diffusion occurs in Type I silica glass much faster than in Corning Code 1737 glass
● a simple Arrhenius-type temperature dependence is found the diffusion of Na-22 in Type I silica glass (Infrasil 302); Ea = 101.8 ± 2.7 kJ/mol
● change in temperature dependence of the diffusion of Na-22 in 1737 glass at the strain point of this glass; two Arrhenius expressions needed to describe the temperature dependence of the sodium diffusion
Comparison of Bulk Diffusion Coefficients
● activation energies for Na diffusion in 1737 glass:
○ high T: 165.5 ± 3.0 kJ/mol
○ low T: 129.9 ± 1.2 kJ/mol
CORNELL 23
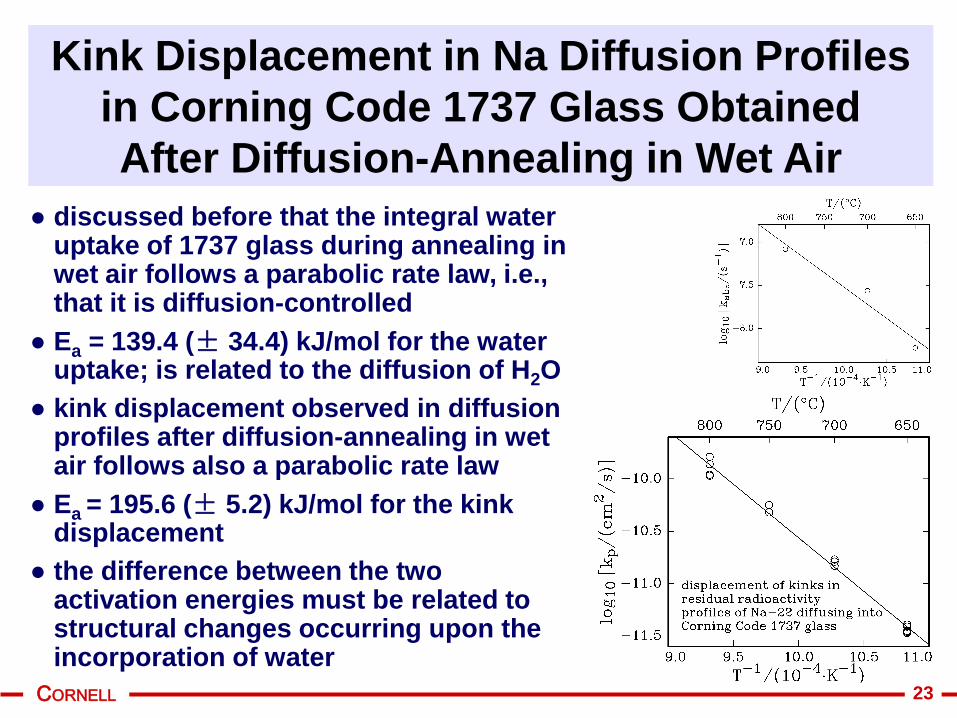
● discussed before that the integral water uptake of 1737 glass during annealing in wet air follows a parabolic rate law, i.e., that it is diffusion-controlled
● Ea = 139.4 (± 34.4) kJ/mol for the water uptake; is related to the diffusion of H2O
● kink displacement observed in diffusion profiles after diffusion-annealing in wet air follows also a parabolic rate law
● Ea = 195.6 (± 5.2) kJ/mol for the kink displacement
● the difference between the two activation energies must be related to structural changes occurring upon the incorporation of water
Kink Displacement in Na Diffusion Profiles
in Corning Code 1737 Glass Obtained
After Diffusion-Annealing in Wet Air

CORNELL 24
● reduction of the Na+ diffusion rate near the surface due to the uptake of water
● DNa(ns) 100 to 1000 times smaller than DNa(bu) (ns = near the surface, bu = bulk)
● only little scatter in the ratio DNa(ns)/DNa(bu)
● no time dependence of the ratio DNa(ns)/DNa(bu), i.e., structural changes upon the uptake of water must occur relatively fast
Comparison Between the Diffusion Rate of
Na in the Near-Surface Region and in the
Bulk of 1737 Glass

CORNELL 25
● occurrence of kinks can be linked to an uptake of water by the silica glass (Infrasil 302) during pre-annealing
● water uptake at high temperatures can be described by a parabolic rate law
● as stated before, the location of the kink in type C profiles changes with the pre-annealing time following a parabolic rate law, see the figure at the right
● activation energies for kink displacements:○ in wet air: 156.9 ± 7.0 kJ/mol
○ in common air: 183.4 ± 6.3 kJ/mol
Kinks in Na Diffusion Profiles Observed in Type I
Silica Glass Pre-Annealed at High Temperatures I

CORNELL 26
● conclusions:○ water is responsible for changes in sodium
tracer diffusion coefficients near the surface
○ following ideas by Tomozawa, a structural relaxation occurs upon the incorporation of water into silica glass, leading to changes of structure-sensitive properties, including the diffusion of Na
● activation energy for the diffusion of water in silica 76 kJ/mol, i.e., much smaller than that observed for the kink displacement
● activation energy differences to be attribu-ted to structural relaxation processes occurring upon the incorporation of water
● good agreement with data obtained by Tomozawa for structural relaxation in the form of a relaxation diffusion coefficient, D
Kinks in Na Diffusion Profiles Observed in Type I
Silica Glass Pre-Annealed at High Temperatures II

CORNELL 27
● DNa(ns)/DNa(bu) about 1/300 to 1/100
● values for the ratio DNa(ns)/DNa(bu) scatter very strongly
● the amount of water incorporated seems not to have any significant influence
● surprise when plotting the ratios obtained for different pre-annealing temperatures as a function of the pre-annealing time: the ratio seems to increase as a function of the annealing time
● reasons behind not yet understood; may be related to different processes involved in structural changes occurring upon the uptake of water during pre-annealing
● need additional data for shorter and longer pre-annealing times
Comparison Between the Diffusion Rate of Na in
the Near-Surface Region and in the Bulk of Type I
Silica Glass

CORNELL 28
● majority impurity: Al (about 30 ppma); expected to be located to a very large extent on Si sites
● Na present at a level of 1 ppma
● estimate on the spacing between Al in [AlO4]
groups (= “traps”) assuming a uniform distribution: 26 nm
● trapping of Na+ at [AlO4] groups,
which carry a negative excess charge, expected
● migration of Na+ then from trap to trap through “interstitial sites” in silica glass at a very high rate
Mechanism of the Diffusion of Na
in Infrasil 302 Type I Silica Glass

CORNELL 29
● the reduction in the sodium diffusivity in near-surface region after pre-annealing in moist atmospheres is attributed to a structural relaxation
● reaction between water incorporated into glass
● equilibrium is dynamic and allows for a “water-assisted” relaxation processes
● to explain the observed time-dependence of DNa(ns)/DNa(bu) two relaxation processes must be present; speculation:
● fast relaxation around [AlO4] units, leading to
a very significant reduction of DNa(ns)/DNa(bu)
● slow relaxation in the rest of the glass, leading to an increase of DNa(ns)/DNa(bu)
Structural Relaxation in Type I Silica Glass
HOR'HOROHR'OR 2

CORNELL 30
Characterization of the Effectiveness of
Diffusion Barrier Layers
● sandwich of two samples with a “barrier layer” between them used
● first: generation of a tracer diffusion profile in Sample 1 by diffusion annealing at high temperature
● then generation of a “barrier layer” at the surface of Sample 2, e.g., by deposition, annealing in wet air, etc.
● then diffusion anneal of the sandwich, leading to a redistribution of the tracer
● after that, analysis of the resulting tracer distribution, e.g., by measuring a residual radioactivity profile
● diffusion mathematics needed for the data analysis worked out for different tracer distributions in Sample 1 before annealing the sandwich; the math is relatively complex

CORNELL 31
Principles of Diffusion Mathematics
● equations governing the diffusion in Sample 1 and in Sample 2
● regions x > 0 and x < 0 connected by the condition of continuity of flux at x = 0, i.e.,
● ki is a rate constant for the transfer of the diffusing species across the “barrier layer”
● diffusion equations to be solved taking into account the initial tracer distribution in Sample 1, g(x), e.g., given by the thin film solution of Fick’s second law, i.e.,
● t0 is the diffusion time of the first anneal with Sample 1 only
0xx
cD
t
cand0x
x
cD
t
c22
2*2
221
2*1
1
0x20x1i
0x
2*2
0x
1*1 cck
x
cD
x
cD
0*1
2
0*1
1tD4
xexp
tDπ
q0)t0,(xcg(x)

CORNELL 32
Equations for Concentration Profile
● equation for the concentration in Sample 1 (x < 0) as a function of x and t:
t
0*1
*1
2
0*1
2
0*1
1 dtDπ
tD4
xexp
ttD4
xexp
ttDπ
qt)(x,c
t
0*2
2
2 dtDπ
tD4
xexp
t)(x,c
*2
T'dT't
t
D
tk
D
D1erfc
T't
t
D
tk
D
D1exp
T'1
1
D
tk
D
D1
tt
tsin
Dπ
k
D
D12
tt
1
D
qk
0*1
0i*
2
*1
0*1
02i
2
*2
*1
t/t
0*1
02i
2
*2
*1
0
1
*1
i*2
*1
0
*1
i0
● numerical solution of integrals of theses functions used for calculating residual radioactivity profiles and also for data fitting
● equation for the concentration in Sample 2 (x > 0) as a function of x and t:
● equation for the function ():

CORNELL 33
Concentration and Residual Radioactivity
Profiles
● profiles calculated for D1 = D2 = 1010
cm2/s and different values of ki
● t0 = 90,000 s, t = 90,000 s
● top figure: initial profile after diffusion anneal of Sample 1 only and profiles after annealing sandwiches
● bottom figure: residual radioactivity profiles corresponding to the concentration profiles shown in the top figure
● experiments: measured residual radioactivities and derived data for ki
and for D1 = D2 from fits
● values of ki give information on the efficiency of a barrier

CORNELL 34
Experimental Observations 23.6 h
● annealing of Sample 1 at 650 °C in common air for about 1 day for generating the initial tracer concentration profile
● annealing of Sample 2 in wet air for 23.6 hours in wet air for modification of the near-surface layer
● then diffusion anneal of sandwich for about 1 day
● top figure: overall residual radioactivity profile
● bottom figure: magnified part of the same figure in the region x > 0
● solid lines: from fit of the equation dis-cussed before to the experimental data
CORNELL 35
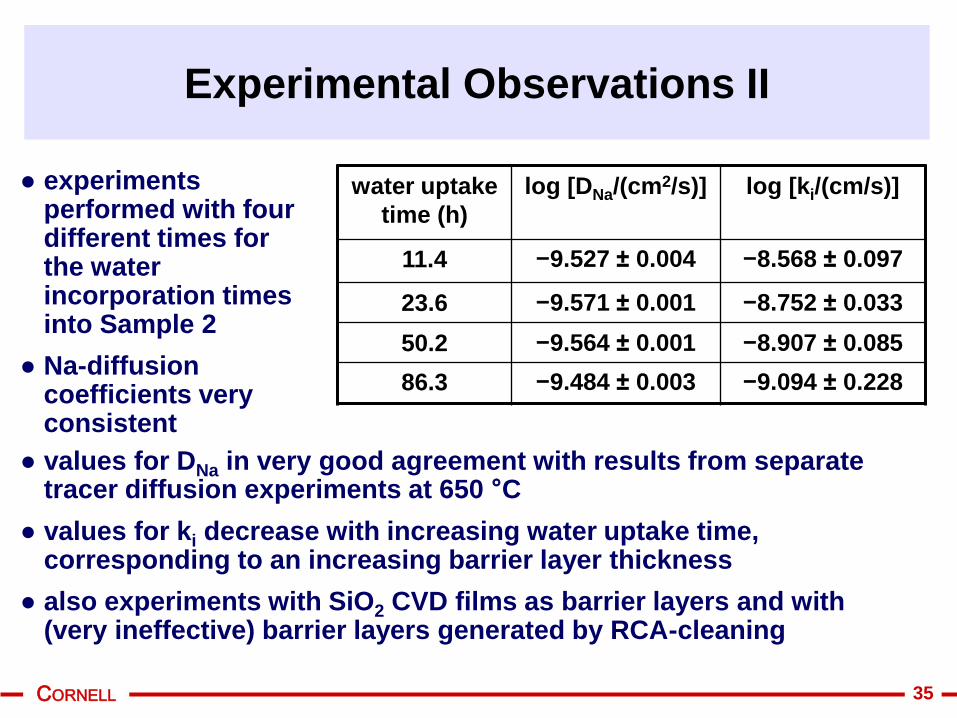
Experimental Observations II
● experiments performed with four different times for the water incorporation times into Sample 2
● Na-diffusion coefficients very consistent
water uptake
time (h)
log [DNa/(cm2/s)] log [ki/(cm/s)]
11.4 −9.527 ± 0.004 −8.568 ± 0.097
23.6 −9.571 ± 0.001 −8.752 ± 0.033
50.2 −9.564 ± 0.001 −8.907 ± 0.085
86.3 −9.484 ± 0.003 −9.094 ± 0.228
● values for DNa in very good agreement with results from separate tracer diffusion experiments at 650 °C
● values for ki decrease with increasing water uptake time, corresponding to an increasing barrier layer thickness
● also experiments with SiO2 CVD films as barrier layers and with (very ineffective) barrier layers generated by RCA-cleaning
CORNELL 36
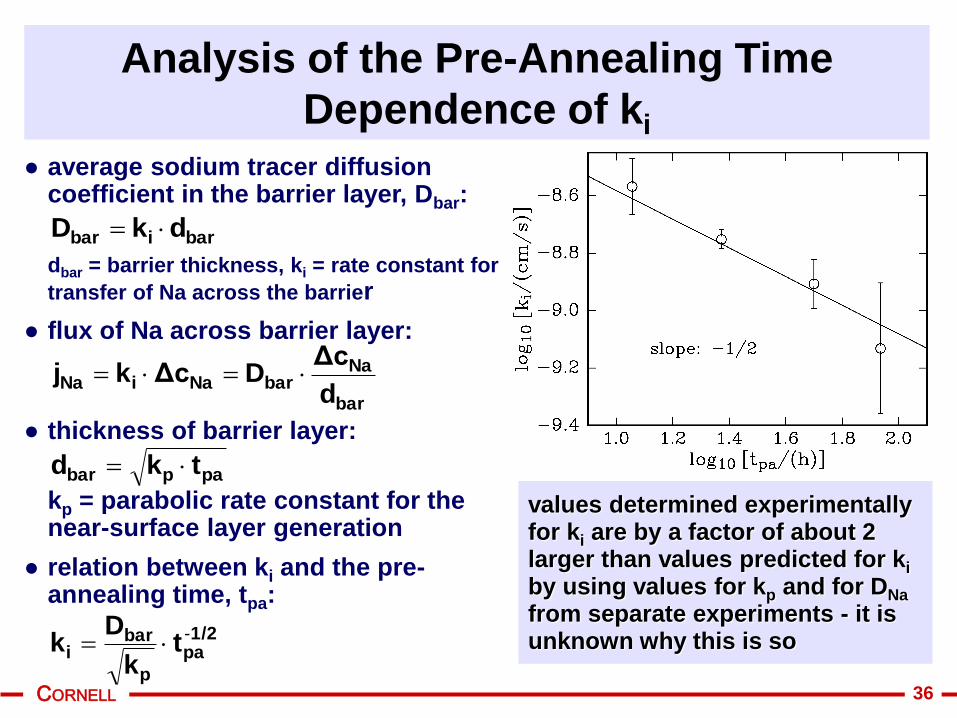
Analysis of the Pre-Annealing Time
Dependence of ki
● average sodium tracer diffusion coefficient in the barrier layer, Dbar:
dbar = barrier thickness, ki = rate constant for
transfer of Na across the barrier
● flux of Na across barrier layer:
● thickness of barrier layer:
kp = parabolic rate constant for the near-surface layer generation
● relation between ki and the pre-annealing time, tpa:
baribar dkD
bar
NabarNaiNa
d
ΔcDΔckj
papbar tkd
1/2pa
p
bari t
k
Dk -
values determined experimentally for ki are by a factor of about 2 larger than values predicted for ki
by using values for kp and for DNa
from separate experiments - it is unknown why this is so
CORNELL 37
CONCLUSIONS
● silicate glasses (e.g., Infrasil 302 and Corning Code 1737 glass) may take up water from the environment during high temperature annealing in air containing some water, i.e., they are “thirsty”
● the water uptake follows a parabolic rate law, i.e., it is to a large extent diffusion controlled
● water-assisted structural changes are believed to occur as a result of the water uptake
○ leads to a modification of glass properties near the surface
○ causes a decrease in the mobility of sodium ions in the near-surface region
● opens the possibility to make “functionally graded” glass
● example: generation of a sodium diffusion barrier layer on Corning Code 1737 glass

CORNELL 38
ACKNOWLEDEMENTS
● diffusion work
○ Hongxia Lu, Lei Tian (graduate students)
○ Eric Chalfin, Eric Hoke, Timothy Lau, Rojana Pornprasertsuk, Marissa Sweeney (undergraduates)
● IR-studies
○ Greg Couillard (Corning Inc.)
○ Hongxia Lu (graduate student)
● diffusion mathematitics:
○ Chung-Yuen Hui, Michael O. Thompson (Cornell faculty)
○ Yu-Yun Lin (graduate student)
● glass samples
○ Adam Ellison (Corning Inc.)
● funding:
○ NSF via the Cornell Center for Materials Research (CCMR)