incorporating safety into the transportation planning process 62 nd illinois traffic engineering and...
TRANSCRIPT

Incorporating Safety into the Transportation
Planning Process
62nd Illinois Traffic Engineering and Safety Conference
October 23, 2013

• Traffic safety is one of the most important characteristics of transportation system performance. Therefore, one would expect that safety is well integrated into all aspects of an agency’s planning and decision-making processes. However, in many instances, such is not the case.
• A comprehensive and effective consideration of safety in transportation-planning would result in traffic safety improvements for the region.
Traffic Safety

CUUATS Integration of Safety into the Planning
Process• The purpose of this presentation is to
provide overall direction on how safety is integrated into the CUUATS transportation-planning process.

CUUATS’ Safety Approach• Integrate safety into all aspects of the
transportation planning process. • Identify safety as a major LRTP goal and be
committed to safety. • Define specific objectives & performance
measures & strategies to achieve safety goals.
• As an MPO, assist local member agencies addressing their highway safety problems & needs.

CUUATS’ Safety Approach• Use current technologies (e.g., GIS) to
provide timely & accurate information, especially in the areas of data collection and analysis.
• Develop community-based traffic safety programs.
• Create a safety committee. This committee helps to ensure the timeliness, accuracy, and linkage of data and help to avoid duplication of efforts.
• Develop a comprehensive safety program that includes a range of strategies & actions & involves different agencies & groups.

CUUATS Transportation Planning Process (Safety)
LRTP Mission
LRTP Goals LRTP Objectives
Performance Measures Data Analysis
Crash Analysis, Network
Screening, etc.
Geometric Features
IDOT Crash Records
Traffic Counts
Proposed Strategies
TIP
Preferred Scenario
Long Term Safety
Recommendations
Engineering
Education
Enforcement
EMS
Evaluation
HSIP
Implementation
Planning
Operations

Long Range Transportation Plan 2035:
Mission Statement• LRTP 2035 Mission:
– To provide a safe, efficient, and economical transportation system that makes the best use of existing infrastructure, optimizes mobility, promotes environmental sensitivity, sustainability, accessibility, economic development, and enhances quality of life for all users.
Long Range Transportation Plan 2035:Goals
• SAFETEA-LU/MAP-21 Planning Factor #2– Increase the safety of the transportation
system for motorized and non-motorized users
• Goal 3: – Transportation modes and facilities in
the urbanized area will be safe for all users

Long Range Transportation Plan 2035:
Objectives & Performance Measures• Objective:
– Reduce the total number of crashes in Champaign-Urbana by 5% by 2014
• Performance Measure: – Total Crashes per 100M VMT
• Objective: – Reduce the total number of fatalities and severe
injuries in Champaign-Urbana by 25% between 2009 and 2014
• Performance Measures: – Total Fatalities per 100M VMT– Total Severe Injuries per 100M VMT

Long Range Transportation Plan 2035:
Objectives & Performance Measures• Objective:
– Reduce the total number of crashes involving bicyclists and pedestrians in Champaign-Urbana by 15% by 2014
• Performance Measures:– Total Pedestrian Crashes– Total Bicycle Crashes

Suggestions for deciding about performance
measures• Review safety-related performance measures used by similar agencies in the U.S.
• Prepare a list of typical safety-related performance measures that reflect the goals & objectives defined in your planning effort.
• Discuss the proposed performance measures with those in the agency responsible for collecting the data to ensure feasibility of collection and data accuracy.

Data Analysis
• Effective data analysis relies on the availability and use of accurate/reliable data.
• Data analysis is also important for identifying “hot spots” for traffic safety.
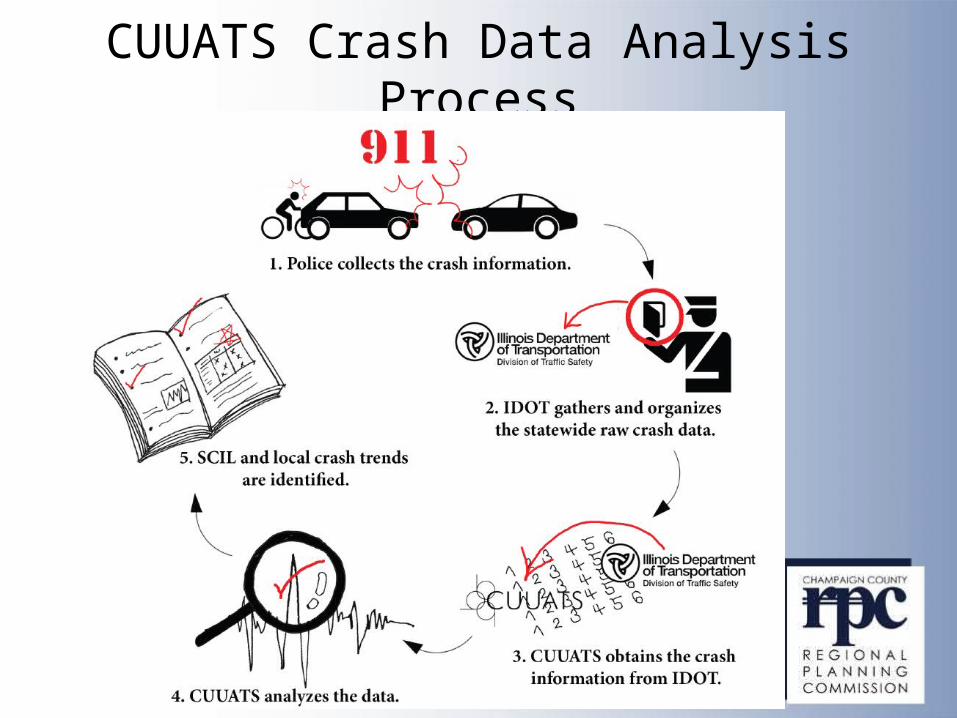
CUUATS Crash Data Analysis Process
Tools for Data Analysis
• Inventory the types of safety analysis tools that exist in the state or metropolitan area’s safety-related agencies.
• Develop a long term and coordinated data-collection and safety analysis strategy for the metropolitan area.
• Use crash reduction factors and their associated reductions in crashes & fatalities for different types of safety improvements.
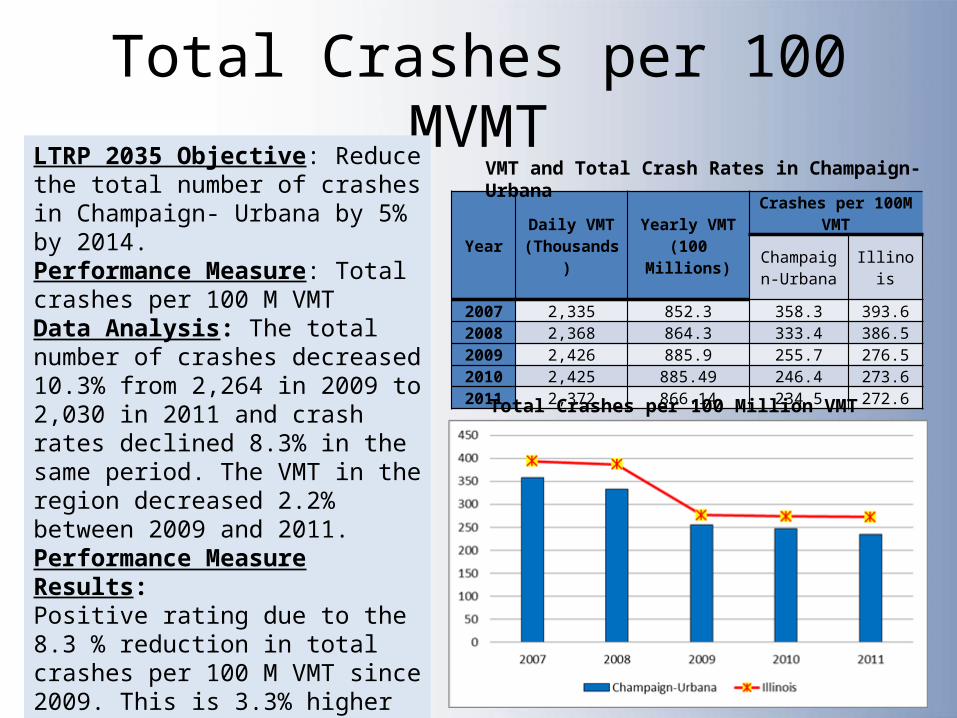
Total Crashes per 100 MVMT
YearDaily VMT (Thousand
s)
Yearly VMT (100
Millions)
Crashes per 100M VMT
Champaign-Urbana
Illinois
2007 2,335 852.3 358.3 393.62008 2,368 864.3 333.4 386.52009 2,426 885.9 255.7 276.52010 2,425 885.49 246.4 273.62011 2,372 866.14 234.5 272.6
LTRP 2035 Objective: Reduce the total number of crashes in Champaign- Urbana by 5% by 2014. Performance Measure: Total crashes per 100 M VMT Data Analysis: The total number of crashes decreased 10.3% from 2,264 in 2009 to 2,030 in 2011 and crash rates declined 8.3% in the same period. The VMT in the region decreased 2.2% between 2009 and 2011. Performance Measure Results: Positive rating due to the 8.3 % reduction in total crashes per 100 M VMT since 2009. This is 3.3% higher than the target of 5% decrease in crashes in the urbanized area by 2014.
VMT and Total Crash Rates in Champaign-Urbana
Total Crashes per 100 Million VMT

Fatalities per 100 Million VMT
LRTP 2035 Objective: Reduce the number of fatalities in Champaign-Urbana by 25% between 2009 and 2014. Performance Measure: Total fatalities per 100 M VMT. Data Analysis: Number of fatalities in the urbanized area dropped from 8 in 2008 to 4 in 2009 but increase back to 6 in 2011.Performance Measure Results: Negative rating for year 2011 because the fatalities per 100 M VMT increased from 0.45 in 2009 to 0.69 in 2011.
Traffic Fatalities in Champaign-Urbana Traffic Fatalities per 100 Million VMT
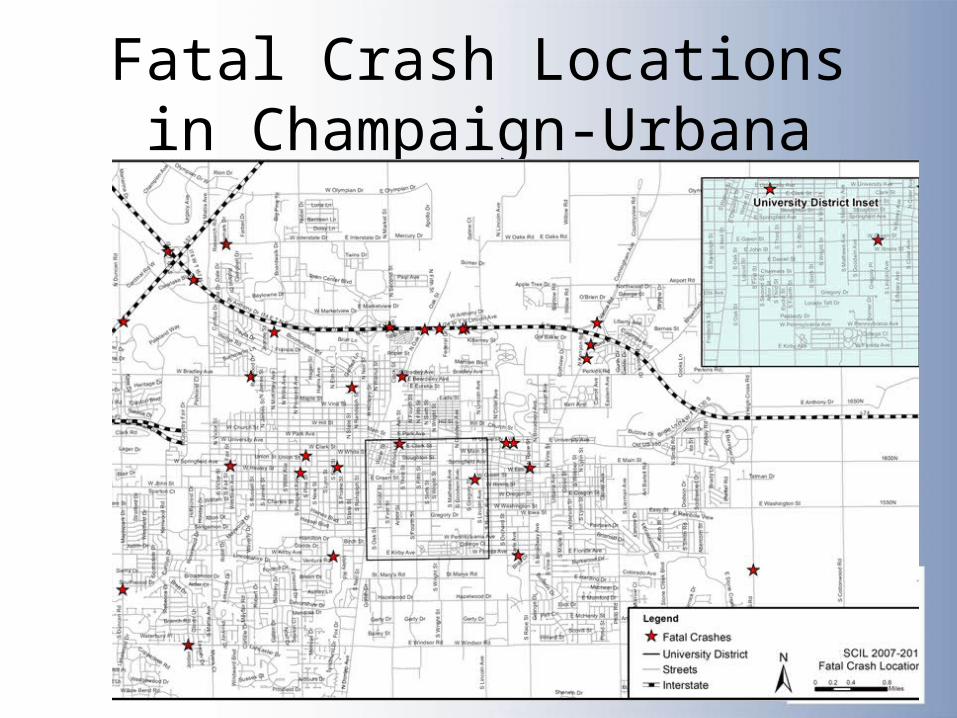
Fatal Crash Locations in Champaign-Urbana

Corridor Analysis
RoadwayCrashe
sFataliti
esTotal
Injuries
A-Injury Crashe
s
B-Injury Crashe
s
C-Injury Crashe
s
East-West Corridor
Bradley Ave 673 2 241 46 61 60
University Ave 1,110 3 355 67 112 78
Springfield Ave 938 2 280 49 82 79
Kirby Ave/Florida Ave 707 2 227 42 68 56
Windsor Rd 355 1 150 21 47 37
North-South Corridor
Mattis Ave 833 1 296 47 84 58
Prospect Ave 1,094 1 307 42 79 102
Neil St 944 0 291 39 99 60
Lincoln Ave 676 0 185 32 72 47
Cunningham Ave/Vine St 592 1 188 31 78 38
High Cross Road/IL 130 86 1 39 10 12 5
Total 8,008 14 2,559 426 794 620
Crashes along Major Corridors in Champaign-Urbana
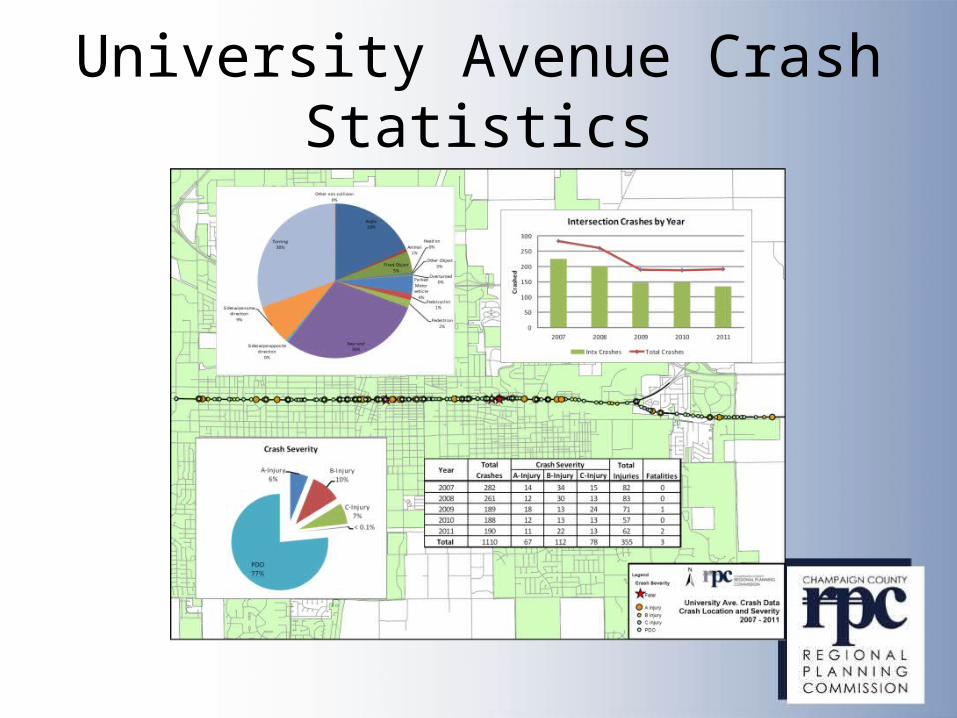
University Avenue Crash Statistics

Fatal and Severe Crashes along Major Corridors

Tools for Data Analysis• For non-infrastructure or non-traffic
operations strategies, such as safety education, marketing campaigns, & emergency management services, work closely with safety partner organizations to determine a methodology for assessing the effectiveness of such strategies. This might include targeted before and after studies on selected programs.

Evaluation
• Most safety-related evaluation efforts use one of three methods:
1. Listing the evaluation criteria and show how the alternatives compare
2. Assigning weights or scores to the evaluation factors
3. Conducting cost-benefit analysis
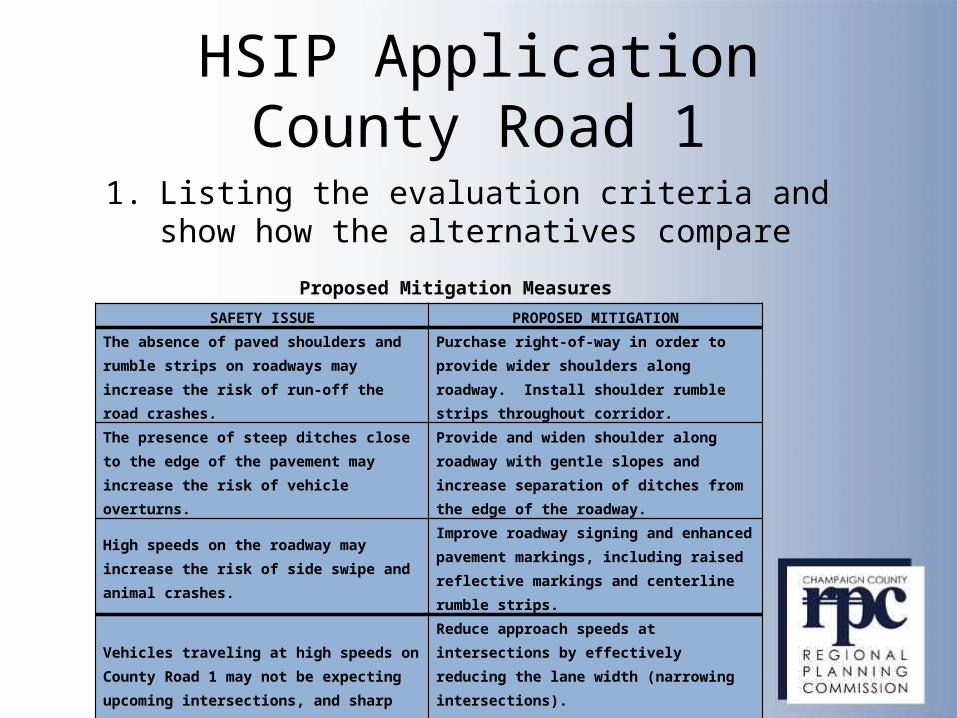
HSIP ApplicationCounty Road 1
SAFETY ISSUE PROPOSED MITIGATIONThe absence of paved shoulders and rumble strips on roadways may increase the risk of run-off the road crashes.
Purchase right-of-way in order to provide wider shoulders along roadway. Install shoulder rumble strips throughout corridor.
The presence of steep ditches close to the edge of the pavement may increase the risk of vehicle overturns.
Provide and widen shoulder along roadway with gentle slopes and increase separation of ditches from the edge of the roadway.
High speeds on the roadway may increase the risk of side swipe and animal crashes.
Improve roadway signing and enhanced pavement markings, including raised reflective markings and centerline rumble strips.
Vehicles traveling at high speeds on County Road 1 may not be expecting upcoming intersections, and sharp horizontal curves increasing the risk of angle crashes.
Reduce approach speeds at intersections by effectively reducing the lane width (narrowing intersections).Improve warning signs along corridor. Provide chevrons along the curves.
Proposed Mitigation Measures
1. Listing the evaluation criteria and show how the alternatives compare

CUUATS Project Assessment Guidelines for TIP
Safety Improvements (*)
Definition and Goals
SAFETEA-LU and the LRTP both place emphasis on ensuring the safety of all transportation system users. Because CUUATS believes that safety is one of the greatest concerns to be considered when planning the region’s transportation system, it is included as a project evaluation criterion.
Criteria and Requirements
This criterion is consistent with the procedure used to select crash intersection locations (SCIL) in the urbanized area. Therefore, all the variables considered to determine the priority rating for those locations will be used to assign points under this criterion. (See Appendix 1 for SCIL methodology). Highest score if project has significant immediate public safety benefit as identified in the Safety Analysis. The performance measure is the "Priority Level” according to SCIL methodology. A project can match only one category and can earn a maximum score of 10.
Project Score Category
10 Project site has a very high average crash frequency, very high average crash rate and high average crash severity. The project has safety improvement as its prime objective
8 Project site has a high average crash frequency, very high average crash rate and high average crash severity. The project has safety improvement as its prime objective
6 Project site has a high average crash frequency, high average crash rate and moderate average crash severity. The project has safety improvement as its prime objective
4 Project site has an above mean average crash frequency and above mean average crash rate. The project has safety improvement as a prime objective
2 Provides some improvement to road user safety. Safety improvement is stated in the objectives
2. Assigning weights or scores to the evaluation factors

HSIP ApplicationCounty Road 1
Project: Prepared by: Rita Morocoima-Black
District: 5 County: Champaign City: Date 2/28/2013 The combined effect of multiple countermeasures is limited to 0.60 or the smallest CMF.
Key Route: Marked Route: MilePost: Current AADT: 3850 2.1.9.S1.1 - Pavement Treatments - Rumble Strips (Centerline) AADT is not within HSM limits
Location Description: 2.1.9.S1.1 - Pavement Treatments - Rumble Strips (Centerline) AADT is not within HSM limits
10.75
Crash data: 5 Years 1.0%
From 2007 to 2011 4.0%
Peer Group: Peer Group 1 - Rural Two-Lane Highway
Cra
sh T
ype
All
Cra
shes
Ang
le
Ani
mal
Fix
ed O
bjec
t
Hea
d O
n
Left
Tur
n
Oth
er N
onco
llisi
on
Oth
er O
bjec
t
Ove
rtur
ned
Ped
estr
ian
Ped
alcy
clis
t
Par
ked
Veh
icle
Rea
r E
nd
Rig
ht T
urn
Sid
esw
ipe
Sam
e D
irect
ion
Sid
esw
ipe
Opp
osite
Dire
ctio
n
Tur
ning
Tra
in
Nig
ht T
ime
Wet
Pav
emen
t
Tot
al
Crash Severity ALL AG AN FO HO LT OtherNC OtherO OVT PD PDC PKV RE RT SSD SOD T TR NGT WP TOTFatal Crashes 1 1A-Injury Crashes 1 1 2 4B-Injury Crashes 4 7 4 1 2 1 19C-Injury Crashes 1 1 1 3PDO Crashes 2 5 14 4 7 5 2 1 1 41
CMF * Unit Cost Quantity Units Total Cost Service Life Present worth EUAC **
0.67 $15,000 10 Miles $150,000 12 $150,000 $13,491
0.78 $7,000 21.5 Miles $150,500 8 $260,469 $23,427
0.97 $40,000 10.75 Miles $430,000 15 $430,000 $38,675
0.80 $20,000 4 Unit Qnty $80,000 3 $320,520 $28,828
$838,995 $104,421
8.00 ANNUAL NUMBER OF FATALITIES POTENTIALLY PREVENTED 0.08
* CMF = Crash Modification Factor
** EUAC = Estimated Uniform Annual Cost
PROJECT DESCRIPTION - PROJECT DATA INPUT (SEGMENTS)
County Road 1 between Champaign city limits and US136
SEGMENTS BENEFIT COST ANALYSISCOUNTERMEASURE COST CALCULATIONS
SEGMENTS CRASH SEVERITY DISTRIBUTION BY CRASH TYPE FOR ANALYSIS PERIOD
Traffic Growth factor
Interest rate
Length (miles):
BENEFIT CALCULATIONS
County Road 1 Messages
TOTAL COSTTOTAL BENEFIT
COUNTERMEASURE Crash Type affected by this improvement
BENEFIT/ COST
All
All
FO, OVT
ROR, FO, HO, OVT, SOD, SSD
B/C 8.00
3. Conducting cost-benefit analysis

Plan and Program Development
Strategies included in the LRTP and UTWP • Produce the Selected Crash Intersection
Locations (SCIL) report every two years• Evaluate intersections that have
problematic or crash-inducing patterns and identify solutions
• Improve visibility for all roadway users through improved lighting, striping, signage, visibility triangles, and access control

Plan and Program Development
• Continue educational programs for CUUATS member agencies as well as law enforcement officers about safety issues
• Continue educational programs for grades K-12 including driver’s education and safety programs such as Operation Cool
• Continue educational safety programs for the community including drivers, bicyclists & pedestrians
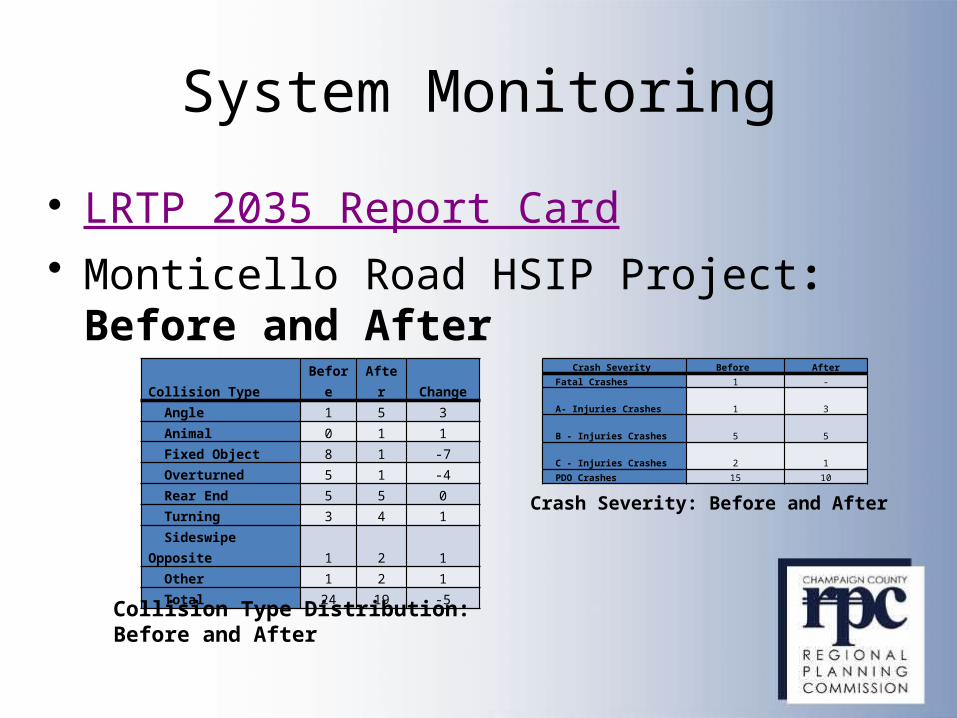
System Monitoring
• LRTP 2035 Report Card• Monticello Road HSIP Project: Before
and AfterCollision Type
Before
After Change
Angle 1 5 3 Animal 0 1 1 Fixed Object 8 1 -7 Overturned 5 1 -4 Rear End 5 5 0 Turning 3 4 1
Sideswipe Opposite 1 2 1 Other 1 2 1 Total 24 19 -5
Crash Severity Before After
Fatal Crashes 1 -
A- Injuries Crashes 1 3
B - Injuries Crashes 5 5
C - Injuries Crashes 2 1
PDO Crashes 15 10
Crash Severity: Before and After
Collision Type Distribution: Before and After

Thanks!
Questions?