incorporating organic soil into a global climate...
TRANSCRIPT
Incorporating organic soil into a global climate model
David M. Lawrence Æ Andrew G. Slater
Received: 8 December 2006 / Accepted: 24 May 2007 / Published online: 26 June 2007! Springer-Verlag 2007
Abstract Organic matter significantly alters a soil’s
thermal and hydraulic properties but is not typically in-cluded in land-surface schemes used in global climate
models. This omission has consequences for ground ther-
mal and moisture regimes, particularly in the high-latitudeswhere soil carbon content is generally high. Global soil
carbon data is used to build a geographically distributed,
profiled soil carbon density dataset for the CommunityLand Model (CLM). CLM parameterizations for soil
thermal and hydraulic properties are modified to accom-
modate both mineral and organic soil matter. Offline sim-ulations including organic soil are characterized by cooler
annual mean soil temperatures (up to ~2.5"C cooler for
regions of high soil carbon content). Cooling is strong insummer due to modulation of early and mid-summer soil
heat flux. Winter temperatures are slightly warmer as or-
ganic soils do not cool as efficiently during fall and winter.High porosity and hydraulic conductivity of organic soil
leads to a wetter soil column but with comparatively low
surface layer saturation levels and correspondingly low soilevaporation. When CLM is coupled to the Community
Atmosphere Model, the reduced latent heat flux drives
deeper boundary layers, associated reductions in low cloudfraction, and warmer summer air temperatures in the
Arctic. Lastly, the insulative properties of organic soil re-
duce interannual soil temperature variability, but only
marginally. This result suggests that, although the mean
soil temperature cooling will delay the simulated date atwhich frozen soil begins to thaw, organic matter may
provide only limited insulation from surface warming.
Keywords Soil carbon ! Soil temperature ! Land-surface
scheme ! Permafrost ! Climate modeling
1 Introduction
Organic material is prevalent in soils in most vegetated
regions of the world. It is found in varying amounts in
different regions and accumulates (or decays) at varyingrates according to the balance between the accumulation
and decomposition of dead vegetation. In the Arctic, where
cold temperatures inhibit decomposition of dead vegeta-tion, soil organic material can build up over time forming
peat deposits. The thermal and hydraulic properties of or-
ganic soil differ significantly from those of mineral soil.Organic material acts as an insulator, with its low thermal
conductivity and relatively high heat capacity modulating
the transfer of energy down into the soil during spring andsummer and out of the soil during fall and winter, typically
leading to cooler soil temperatures (Bonan and Shugart
1989). Partly as a consequence of this, permafrost, definedas soil or rock that remains below 0"C for two or more
consecutive years, is present at warmer annual mean air
temperatures when below organic soils than would be thecase under mineral soil alone. An additional fundamental
characteristic of organic or peat soil is its high porosity,
much higher than that of mineral soils, and its corre-spondingly high hydraulic conductivity and weak suction.
These characteristics generate soil conditions in peatlands
that are typified by saturated sub-surface soils with shallow
D. M. Lawrence (&)National Center for Atmospheric Research,P.O. Box 3000, Boulder, CO 80307-3000, USAe-mail: [email protected]
A. G. SlaterCooperative Institute for Research in Environmental Sciences,Boulder, CO, USA
123
Clim Dyn (2008) 30:145–160
DOI 10.1007/s00382-007-0278-1

depths to the water table but highly variable surface soil
wetness (Hinzman et al. 1991).Prior modeling studies have shown that inclusion of the
thermal and hydraulic effects of organic soil can have a
significant impact on surface energy fluxes, air temperature(Peters-Lidard et al. 1998), soil temperature (Beringer et al.
2001; Molders and Romanovsky 2006; Yi et al. 2006;
Nicolsky et al. 2007) and soil moisture (Letts et al. 2000).Despite its importance to the surface energy and hydrologic
budgets, organic material is not typically included in sur-face datasets and parameterizations for land surface
schemes used in global climate models (GCMs). Normally,
model soil thermal and hydraulic properties are defined viamineral soil parameterizations that are dependent on soil
texture (e.g. after the work of Clapp and Hornberger 1978;
Cosby et al. 1984). Soil sand, clay, and silt percentages areprovided as a model input dataset to characterize soil
texture. Across much of the world, neglecting soil organic
material is a reasonable simplification as it accounts foronly a small fraction of total soil mass. In the Arctic and
boreal zones, however, low vegetation decomposition rates
have led to the accumulation of large quantities of soilorganic matter. It is in precisely these regions that warming
associated with rising greenhouse gas concentrations is
being realized most acutely (Serreze et al. 2000; Hollandand Bitz 2003; Hinzman et al. 2005).
Among the many transformations being observed in the
Arctic is widespread permafrost warming and thawing (Ca-mill 2005; Smith et al. 2005b; Jorgenson et al. 2006;
Osterkamp and Jorgenson 2006). Permafrost thaw is pro-
jected to continue and maybe even accelerate in the comingdecades (Stendel and Christensen 2002; Lawrence and Slater
2005) although the rate at which it will thaw remains highly
uncertain (Burn and Nelson 2006; Lawrence and Slater2006). If large-scale thawing of near-surface permafrost oc-
curs, it is likely to invoke a number of feedbacks in the Arctic
and global climate system (McGuire et al. 2006). Forexample, permafrost thaw alters soil structural and hydro-
logic properties with potential knock-on effects on the spatial
extent of lakes and wetlands (Smith et al. 2005a), freshwaterfluxes to the Arctic Ocean, ecosystem functioning and
structure (Payette et al. 2004; McGuire et al. 2006), and the
surface energy balance. Warming of the soil is also expectedto enhance decomposition of soil organic matter, possibly
producing vast quantities of carbon dioxide and/or methane
that could be released to the atmosphere (Walter et al. 2006;Zimov et al. 2006) and at the same time releasing nitrogen
which, in nutrient limited Arctic ecosystems, may prompt
shrub growth (Sturm et al. 2001; Sturm et al. 2005; Tapeet al. 2006). Expansion of shrub cover has its own positive
albedo feedback on climate (Chapin et al. 2005).
Improved understanding, simulation, and prediction ofthe rich complexity and interrelationships between climate-
change-induced thawing of permafrost and the global car-
bon and hydrologic cycle is a challenging problem that willrequire investigation with a hierarchy of models, including
GCMs which can represent, through parameterizations, the
broad changes in climate, hydrology, and vegetation thatcan occur with climate change. Progress towards better
understanding and simulation of these feedbacks depends
critically upon land-surface scheme simulation of soiltemperature and soil moisture and their response to
warming. As a step towards improved representation ofhigh-latitude ground climate, we describe in this paper the
incorporation of the thermal and hydraulic properties of
organic soil into the Community Land Model (CLM),which is the land-surface scheme used in the NCAR
Community Climate System Model (CCSM). In Sect. 2,
we introduce a global soil carbon profile dataset for CLMthat is based on global estimates of soil carbon content.
Also in Sect. 2, we describe modifications to CLM soil
thermal and hydraulic property parameterizations to reflectproperties of organic soil material. In Sect. 3, results from
offline and land–atmosphere coupled simulations both with
and without soil organic matter are presented. Theemphasis of the sensitivity analysis is on the influence of
organic soil on soil temperature, soil moisture, and the
surface energy balance. In Sect. 4, we discuss the impli-cations for transient climate change simulations and review
further potential improvements to the model. We conclude
with a summary in Sect. 5.
2 Model description
2.1 CLM and CAM
We use the Community Land Model version 3 (CLM3,Oleson et al. 2004) in both offline mode and coupled to the
Community Atmosphere Model version 3 (CAM3, Collins
et al. 2006). CLM3 includes a 5-layer snow model that sitsatop a 3.43 m-deep soil layer with ten layers of exponentially
increasing depth. The thermal and hydrologic properties of
the soil are functions of soil liquid and ice water content, soiltexture, and soil temperature (further details in Sect. 2.3).
The effects of phase change are included. Snow processes
include accumulation, melt, compaction, and water transferacross layers. Sub-grid scale surface heterogeneity is repre-
sented through satellite-derived fractional coverage of lakes,
wetland, bare soil, glacier, and up to four plant functionaltypes in each grid box (dataset derived from MODIS, Law-
rence and Chase 2007). Fluxes of energy and moisture are
modeled independently for each surface type and aggregatedbefore being passed to the atmosphere model.
The released version of CLM3 suffers from poor parti-
tioning of evapotranspiration into its components (tran-
146 D. M. Lawrence, A. G. Slater: Incorporating organic soil into a global climate model
123

spiration, soil evaporation, and canopy evaporation) and
generally dry and unvarying deep soil moisture (Lawrenceet al. 2007). These deficiencies have largely been elimi-
nated through a series of modifications to the released
version and include a revised surface dataset (Lawrenceand Chase 2007), reductions in canopy interception and
incorporation of a two-leaf model (Thornton and Zimm-
erman 2006), and a reworking of the soil hydrology scheme(Niu et al. 2007). Of direct relevance to this paper is the
inclusion of a freezing-point depression expression thatpermits liquid water to coexist with ice at temperatures
below 0"C and enhances permeability through partially ice-
filled soil (Niu and Yang 2006).
2.2 Global soil carbon content profile dataset
Global information on soil carbon density has been com-
piled by the Global Soil Data Task (2000) under the aus-pices of the International Satellite Land-Surface
Climatology Project II (ISLSCP II). The soil carbon den-
sity dataset is an outgrowth of an initial effort by Zinkeet al. (1986) to gather and compile soil carbon content
measurements. This data is used to derive a gridded soil
carbon content of the upper 150 cm of soil at 1" · 1"resolution. Soil carbon content is high throughout much of
the northern circumpolar region, with values exceeding
50 kg m–2 found in Siberia, Canada, and the Nordiccountries (see map, Fig. 1a). Outside of the northern high-
latitudes, soil carbon content in vegetated areas typically
ranges between 10 and 20 kg m–2 while semi-arid or aridregions are characterized by soil carbon contents of less
than 10 kg m–2. We regrid the source data to the relevant
CLM resolution (2.8" longitude by 2.8" latitude for this
study) and distribute the soil carbon across the top sevenCLM soil layers (surface to 1.38 m depth) according to
typical soil carbon profiles shown in Zinke et al. (1986).
The profiles differ according to ecozone with carbon con-tent concentrated towards the surface in boreal and polar
soils and more evenly distributed throughout the upper soil
column in tropical and temperate soils (Fig. 1b). A checkin the vertical distribution calculation requires that the
carbon density in any individual soil layer does not exceedthe bulk density of peat (130 kg m–3, Farouki 1981). The
result is a new surface dataset for CLM that provides
carbon density (kg m–3) for each soil layer for each landgrid location. Sample carbon density profiles are shown in
Fig. 1c.
A revised estimate of high-latitude soil carbon content isbeing derived as part of the International Permafrost
Association Carbon Pools in Permafrost (CAPP) project.
This new dataset, known as the Northern Circumpolar SoilCarbon Database, may provide an improved estimate of
soil carbon content in the northern high-latitudes at some
point in the near future (C. Tarnocai, personal communi-cation).
2.3 Thermal and hydraulic parameterizations
for organic and mineral soil
In order to incorporate the impacts of organic material on
soil thermal and hydraulic properties, we assume that each
soil layer is made up of a combination of organic material,as provided by the dataset described in Sect. 2.2, and
mineral material, as given in the standard CLM soil dataset
Fig. 1 a Global Soil Data Task(2000) soil carbon contentregridded onto CLM 2.8" · 2.8"grid. b Cumulative carbonstorage with depth for the twomajor classes of soils identifiedin Zinke et al. (1986). Theseprofiles are used to determinevertical soil carbon distributionin new CLM soil carbon dataset.c Sample derived soil carbonprofiles for Siberian peatlands(60"–70"N, 70"–80"E), Alaska(60"–70"N, 140"–160"W), andTropical Africa (Eq–10"N, 25"–35"E). Note that depth refers tothe depth of the bottomboundary of each individual soillayer (solid circles in b)
D. M. Lawrence, A. G. Slater: Incorporating organic soil into a global climate model 147
123

which contains information on the mineral soil texture as
percentage sand and clay contents for each of the ten modelsoil layers. We define the soil carbon or organic fraction for
a particular soil layer as
fsc;i ¼ qsc;i=qsc;max ð1Þ
where qsc,i is the soil carbon density for soil layer i and
qsc,max = 130 kg m–3 is the maximum soil carbon density(equivalent to a standard bulk density of peat; Farouki
1981). Physical properties of the soil are assumed to be a
weighted combination of values for mineral soil and valuesfor pure organic soil. For example, the volumetric water
content at saturation (porosity) for mineral soil, Qsat,min, is
defined in CLM as
Hsat;min;i ¼ 0:489% 0:00126ð%sandÞi ð2Þ
after Clapp and Hornberger (1978) and Cosby et al. (1984).The porosity of organic material is much higher than that of
mineral soil with typical values ranging between 0.8 and
0.95 (Hinzman et al. 1991; Letts et al. 2000). Incorporatingorganic soil, the equation for Qsat becomes
Hsat;i ¼ ð1% fsc;iÞHsat;min;i þ fsc;iHsat;sc ð3Þ
where Qsat,sc is assumed to be 0.9. Hence, for low soilcarbon density, porosity is similar to that of pure mineral
soil whereas for high soil carbon density porosity ap-
proaches that of pure organic soil or peat. For mid-rangecarbon densities, porosity is a weighted combination of
mineral and organic values. Note that thermal and
hydraulic properties of organic material depend on the stateof decomposition of the organic material (Letts et al. 2000;
Quinton et al. 2000). For the sake of simplicity and because
we do not have information on the extent of decompositionof the soil carbon material, the parameters used in this
model and listed in Table 1 are standard literature values
for undecomposed organic material (also known as fibricpeat).
This strategy for implementation of organic soil differs
somewhat from some previous approaches wherein organicsoil has been incorporated by assuming that one or more
layers of pure organic soil overly mineral soil layers at
depth (e.g. Letts et al. 2000; Beringer et al. 2001). Theadvantage of our weighted combination approach is that it
is more general in that it can be applied at all locations,
even those without high soil carbon contents. Furthermore,it can be implemented straightforwardly within the existing
CLM framework and it can be used when the model is run
with an active terrestrial carbon cycle with prognostic soilcarbon pools (Thornton and Rosenbloom 2005). For loca-
tions with high soil carbon content, e.g. much of the
northern high-latitudes, the first 0.1–0.5 m (1–4 layers) of
soil are 100% organic and therefore approximate theimplementations of Letts et al. (2000) and Beringer et al.
(2001) except with a more smoothly varying transition
from organic to mineral soil at mid-level soil layers. Ourassumption that the thermal and hydraulic properties of
coexisting mineral and organic soil material can be
approximated as a weighted combination of the separatemineral soil and organic soil properties is difficult to val-
idate or refute as measured properties for coexisting min-eral and organic soils are not readily found in the literature,
either because mineral and organic soils do not tend to
coexist or because measurements have simply not beentaken because there was not a perceived need for such
information. Further details on the new parameterizations
are given in the remainder of this section.
2.3.1 Thermal conductivity
Soil organic material significantly alters heat conduction
into and through the soil due to its low thermal conduc-tivity and relatively high heat capacity. Soil heat conduc-
tion is solved numerically in CLM via the diffusion
equation,
coT
ot¼ o
ozks
oT
oz
! "; ð4Þ
where c is the volumetric soil heat capacity (J m–3 K–1), kis soil thermal conductivity (W m–1 K–1), T is temperature(K), t is time (s) and z is depth (m). The CLM thermal
conductivity parameterizations are predicated on the work
of Johansen (1975) and Farouki (1981). Soil thermalconductivity is calculated as a combination of the dry kdry
and saturated ksat thermal conductivities weighted by a
normalized thermal conductivity (Ke, the Kersten number):
ki ¼ Ke;iksat;i þ ð1% Ke;iÞkdry;i: ð5Þ
The dry and saturated thermal conductivities aredependent on the type of soil material, e.g. sand, clay,
loam, or organic. Dry thermal conductivity for mineral
soils, kdry,min, is given by the following empirical equationderived by Johansen:
kdry;min;i ¼0:135qd;i þ 64:7
2700% 0:947qd;i
ð6Þ
where qd,i = 2700(1-Qsat,min,i) is the bulk density of
mineral soil. Farouki calculates that a typical dry thermal
conductivity of organic soil, kdry,sc, is 0.05 W m–1 K–1.The dry thermal conductivity for the combination of
mineral and organic soil is then:
148 D. M. Lawrence, A. G. Slater: Incorporating organic soil into a global climate model
123

kdry;i ¼ ð1% fsc;iÞkdry;min;i þ fsc;ikdry;sc: ð7Þ
The saturated thermal conductivity is given by
ksat;i ¼ k1%Hsai;i
s;i kHsat;i
liq kHsat;i%Hliq;i
ice ð8Þ
where kliq and kice are the liquid water and ice thermalconductivities, Qliq,i is the volumetric liquid water content,
and ks,i is the soil solid thermal conductivity which is
derived from the following equations:
ks;min;i ¼8:80ð%sandÞi þ 2:92ð%clayÞið%sandÞi þ ð%clayÞi
ð9Þ
ks;i ¼ ð1% fsc;iÞks;min;i þ fsc;iks;sc: ð10Þ
where ks,sc = 0.25 W m–1 K–1 is the thermal conductivity
of organic soil solid (Farouki 1981) and ks,min,i is theempirically derived thermal conductivity of mineral soil
solid.
The Kersten number Ke,i is a function of the degree ofsaturation Sr and phase of water, for unfrozen soils,
Ke;i ¼ logðSr;iÞ þ 1; ð11Þ
and for frozen soils,
Ke;i ¼ Sr: ð12Þ
The resulting soil thermal conductivity values for frozen
and unfrozen soil are shown in Fig. 2 as a function of soilcarbon fraction and percent saturation.
2.3.2 Heat capacity
Heat capacities of organic soil are typically higher than inmineral soils. Soil heat capacity is a function of the heat
capacities of the soil solid, liquid water, and ice constituents
ci ¼ cs;ið1%Hsat;iÞ þ wliq;iCliq þ wice;iCice ð13Þ
where wliq,i and wice,i are the liquid water and ice contents
(kg m–3) for a layer and Cliq and Cice and are specific heatcapacities (J kg–1 K–1) of liquid water and ice,
respectively, and cs,i is given by
cs;i ¼ ð1% fsc;iÞcs;min;i þ fsc;ics;sc ð14Þ
with
cs;min;i ¼2:128ð%sandÞi þ 2:385ð%clayÞi
ð%sandÞi þ ð%clayÞi
# $' 106 ð15Þ
and the heat capacity of organic soil, cs,sc, equal to2.5 · 106 J m–3 K–1 (Farouki 1981).
2.3.3 Saturated hydraulic conductivity
The soil hydraulic characteristics are also affected by theorganic content. The saturated hydraulic conductivity of
peat is considerably higher than that of mineral soil. In the
new model, saturated hydraulic conductivity ksat is
ksat;i ¼ ð1% fsc;iÞksat;min;i þ fsc;iksat;sc ð16Þ
with ksat,min obtained from Clapp and Hornberger (1978)
and Cosby et al. (1984) and given by
ksat;min;i ¼ 0:0070556' 10%0:884þ0:0153ð%sandÞi : ð17Þ
As noted in Letts et al. (2000), literature values for peat
saturated hydraulic conductivity vary by several orders of
magnitude. A median value for undecomposed peat is2.8 · 10–4 m s–1. Initial tests of the new model were
conducted with ksat,sc values of 2.8 · 10–4 m s–1 but this
introduced numeric instabilities so we settled on a slightlylower value (ksat,sc = 1.0 · 10–4 m s–1). Importantly, this
Table 1 Soil parameters used in CLM for two representative mineral soil texture classes, sand and clay, and the equivalent soil parameters fororganic soil that are used in the new model
Soil type ks
(W m–1 K–1)ksat
(W m–1 K–1)kdry
(W m–1 K–1)cs
(J m–3 K–1 · 106)Qsat ksat
(m s–1 · 10–3)Wsat (mm) b
Sand (92% sand,5% silt, 3% clay)
8.61 3.12 0.27 2.14 0.37 0.023 –47.3 3.4
Clay (22% sand,20% silt, 58% clay)
4.54 1.78 0.20 2.31 0.46 0.002 –633.0 12.1
Peat (100% soil carbon) 0.25a 0.55 0.05a 2.5a 0.9a,b 0.100b –10.3b 2.7b
The soil parameters are ks is the thermal conductivity of soil solids, ksat is the unfrozen saturated thermal conductivity, kdry is the dry soil thermalconductivity, cs is the soil solid heat capacity, Qsat is the saturated volumetric water content (porosity), ksat is the saturate hydraulic conductivity,Wsat is the saturated matric potential, and b is the Clapp and Hornberger parametera Farouki (1981)b Letts et al. (2000)
D. M. Lawrence, A. G. Slater: Incorporating organic soil into a global climate model 149
123

value remains about an order of magnitude larger than thatof typical mineral soil.
2.3.4 Soil water retention
CLM follows the Campbell (1974) parameterization for soilwater retention curves for mineral soils. In this parameter-
ization, the soil matric potential (suction) (mm) is given by
Wi ¼ Wsat;iHliq;i
Hsat;i
# $%bi
ð18Þ
where the saturated soil matric potential for mineral soil is
Wsat;min;i ¼ %10:0' 101:88%0:0131ð%sandÞi
and the exponent b is the Clapp and Hornberger exponent.
Letts et al. (2000) derive parameters for Wsat,sc (10.3 mm)and bsc (2.7) for undecomposed peat that generate a
Campbell soil water retention curve that fits available water
retention data for peat. Incorporating the Letts parametersinto our combined organic/mineral soil model, the
equations for saturated matric potential and the bparameter become
Wsat;i ¼ ð1% fsc;iÞWsat;min;i þ fsc;iWsat;sc ð19Þ
bi ¼ ð1% fsc;iÞbmin;i þ fsc;ibsc ð20Þ
where bmin,i = 2.91 + 0.159(%clay)i. The large pore spaces
in organic soils lead to weak suction and freely drainingsoil over a wide range of moisture contents. The soil water
retention curve (suction versus soil wetness) for peat is
similar to that for sandy soil (Fig. 3).
3 Results
3.1 Offline simulations
Analysis of the new model is conducted first in offlinemode, where CLM is forced with observed precipitation,
temperature, downward solar and longwave radiation,
surface wind speed, specific humidity, and air pressurefrom a historical forcing dataset (Qian et al. 2006). Two
35-year (1970–2004) simulations are performed, a control
simulation (CONTROLofln) and a simulation incorporatingthe new soil carbon dataset and parameterizations (SOIL-
CARBofln). The deepest soil layer moisture and tempera-
ture fields reach equilibrium within the first 10–15 years ofboth simulations. The remaining 20 years are used to form
climatological averages of soil temperature, soil moisture,
and the surface energy balance.
3.1.1 Soil temperature
The most prominent impact of organic soil is a reduction in
mean annual soil temperature. Reduced temperatures scaleapproximately linearly with increasing grid box soil carbon
content although there is considerable spread due to the
influence of local climatological and hydrological condi-tions (Fig. 4). The impact on soil temperature, however, is
not uniform throughout the year. While strongly cooler soil
Fig. 2 Soil thermalconductivity as a function ofpercent saturation and soilcarbon fraction. Base mineralsoil is a sandy soil (92% sand,5% silt, 3% clay). Thermalconductivities for unfrozen andfrozen soil are shown. For thesecalculations, it is assumed thatall soil water is either liquid orice even though CLM retains asmall fraction of liquid water attemperatures below 0"C
Fig. 3 Soil water retention curves for organic, sand, and clay soils
150 D. M. Lawrence, A. G. Slater: Incorporating organic soil into a global climate model
123

temperatures are seen during summer, the soils are often
actually warmer in SOILCARBofln during winter. Thereasons for the seasonal differences in the impact of soil
carbon on soil temperature are addressed later in this sec-
tion. The relationships between soil carbon and soil tem-perature simulated by CLM are consistent with
relationships reported in Harden et al. (2006). In that study,
Harden et al. use soil temperature data collected from sitesclose to Delta Junction, Alaska that span a range of organic
layer thicknesses to show that daily minimum July soiltemperatures decrease roughly linearly with organic layer
thickness (approximately –0.5"C cm–1 of organic mat
thickness at 5 cm depth). Winter soil temperature was notcollected, but data from the shoulder seasons (May and
September) show a much weaker relationship between
organic layer thickness and soil temperature, a result that isconsistent with that seen in CLM (not shown).
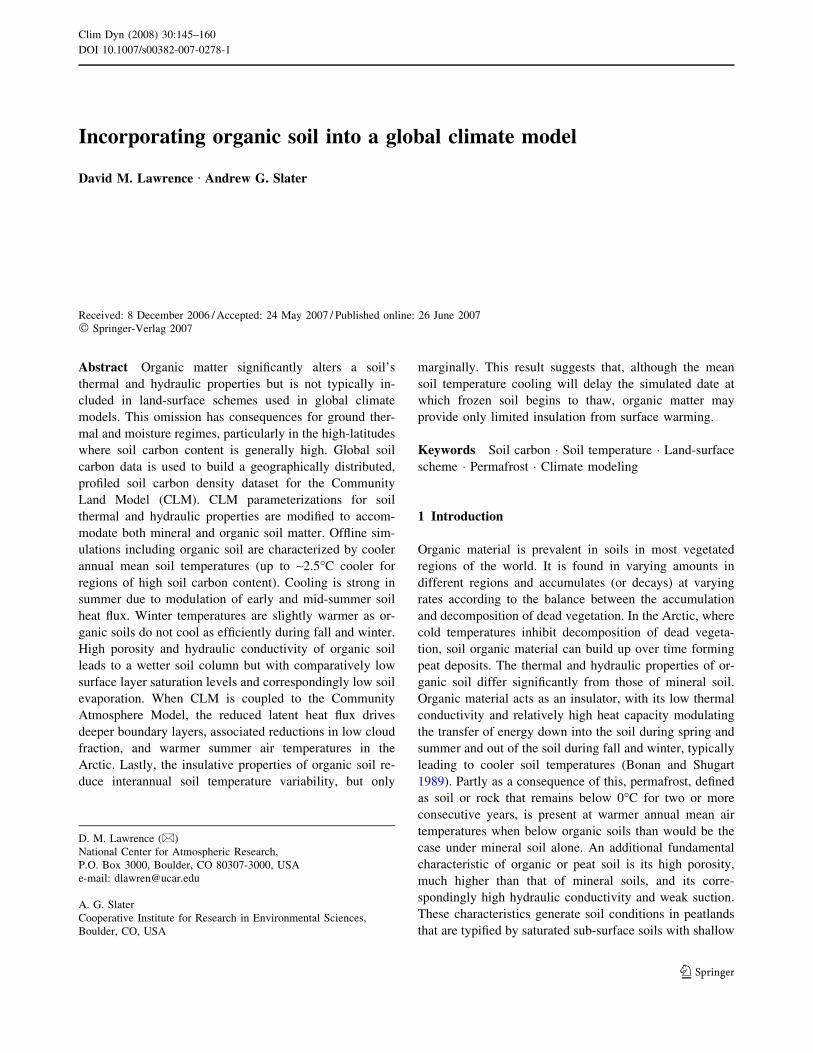
Cooler annual mean soil temperatures in the northern
high-latitudes reduce what appears to be a warm soiltemperature bias in CLM3. We compare simulated soil
temperature to a collection of Russian soil temperature data
obtained from 418 sites spanning most of Siberia (43"–69"N, 30"–180"E, Zhang et al. 2001). Although the Rus-
sian soil temperature data extends back as far as 1891 for a
few locations, we only analyze data from 1985 to the endof the dataset in 2000. Prior to analysis, the data is mapped
onto the model’s latitude–longitude grid. To minimize the
influence of regridding edge effects, we only analyzegridded data from an interior portion of the domain (48"–
64"N, 45"–165"E). Average soil carbon content in this
region is relatively high (27 kg m–2). The annual mean soiltemperature bias is reduced at soil depths both near the
surface (0.6 m, 0.73 to –0.04"C) and deeper in the soil
(2.9 m, 0.48 to –0.27"C) (see Fig. 5). These improvementsshould be considered within the context that other limita-
tions in CLM, such as the zero flux bottom boundary
condition at the relatively shallow depth of 3.43 m, are alsolikely to affect soil temperature. Extension of the soil
column, and its impact on soil temperature and hydrology,
is being considered as a potential further improvement toCLM (Alexeev et al. 2007; Nicolsky et al. 2007).
The change in soil temperature is not uniform across the
seasons. Representative soil temperature and thermal con-ductivity vertical profiles over a climatological annual
cycle, averaged over a region of high soil carbon content in
north-west Siberia, are shown in Fig. 6. In CONTROLofln,soils warm rapidly to depth after the April to May snow-
melt before cooling off more slowly in late summer-earlyfall. Thermal conductivity, although slightly lower during
the summer because of the lower thermal conductivity of
liquid water relative to ice, stays above 2.0 W m–1 K–1
throughout the year. In contrast, in SOILCARBofln the
insulation provided by the organic content in near-surface
soil layers, prevents the soil from warming as rapidly aftersnowmelt. Additionally, the warming front does not pen-
etrate as deep into the soil column. The low thermal con-
ductivity of the uppermost organic soil layers alters theannual cycle of ground heat flux (Fig. 7). From May to
August, when the uppermost soil layer is warmer than the
layers beneath it, ground heat flux is positive and heat isgained by the soil. The amount of heat gained is lower in
SOILCARBofln compared to CONTROLofln due to the
much lower thermal conductivity of the surface layers(~0.4 W m–1 K–1 compared to ~2.0 W m–1 K–1). During
September and October, air temperatures cool and heat is
efficiently transferred out of the soil column, at least untilsnow begins to accumulate and insulate the soil from the
cold atmospheric air. The same insulative properties of
organic soil that prevent soil temperatures from warmingduring early summer restrict the extent of soil cooling in
early fall. During winter, the highly insulative properties of
snow and the relatively weak vertical soil temperaturegradient limits heat loss from the soil in both experiments.
In many locations (although not for the Siberia region
shown in Figs. 6 and 7), and especially at lower latitudes(e.g. 30"–60"N) where snow cover develops later in the
Fig. 4 Scatter diagram showingsoil carbon content versuschange in simulated columnmean soil temperature(SOILCARBofln–CONTROLofln). Only data fromgrid points north of 45"N areplotted
D. M. Lawrence, A. G. Slater: Incorporating organic soil into a global climate model 151
123
season or does not persist throughout the winter, the ins-
ulative properties of organic soil prevents the soils fromcooling off during fall and winter resulting in warmer mean
wintertime soil temperatures in SOILCARBofln (Fig. 4).
For the period 1985–2004, annual mean ground heat fluxin SOILCARBofln is nearly identical to that in CON-
TROLofln (difference < 0.04 W m–2), yet annual mean soil
temperatures are on average 1.5"C cooler in SOIL-CARBofln. If ground heat fluxes are the same, what explains
the cooler soil in SOILCARBofln? The difference in soiltemperature, it turns out, develops during the first 5–
10 years of the simulation when the effects of soil organic
material restrict the heat gained or lost from the soil as thesimulations come into balance. During this time period,
annual mean heat flux into the ground is roughly 0.5–
1.0 W m–2 lower in SOILCARBofln compared to CON-TROLofln, and soil temperatures in SOILCARBofln steadily
cool relative to CONTROLofln (note that both simulations
start from the same initial conditions). As the simulationsreach equilibrium, annual mean heat flux in the two simu-
lations converges to a value that reflects the energy imbal-
ance forcing due to transient climate change. In experimentsrun with repeated single year forcing annual mean ground
heat flux approaches zero after about 10 years.
3.1.2 Hydrology
The inclusion of soil organic matter also affects the
hydrologic cycle in the form of changes in soil watercontent, runoff, and evaporation. The impact of organic soil
on soil water storage is strongly tied to its impact on soil
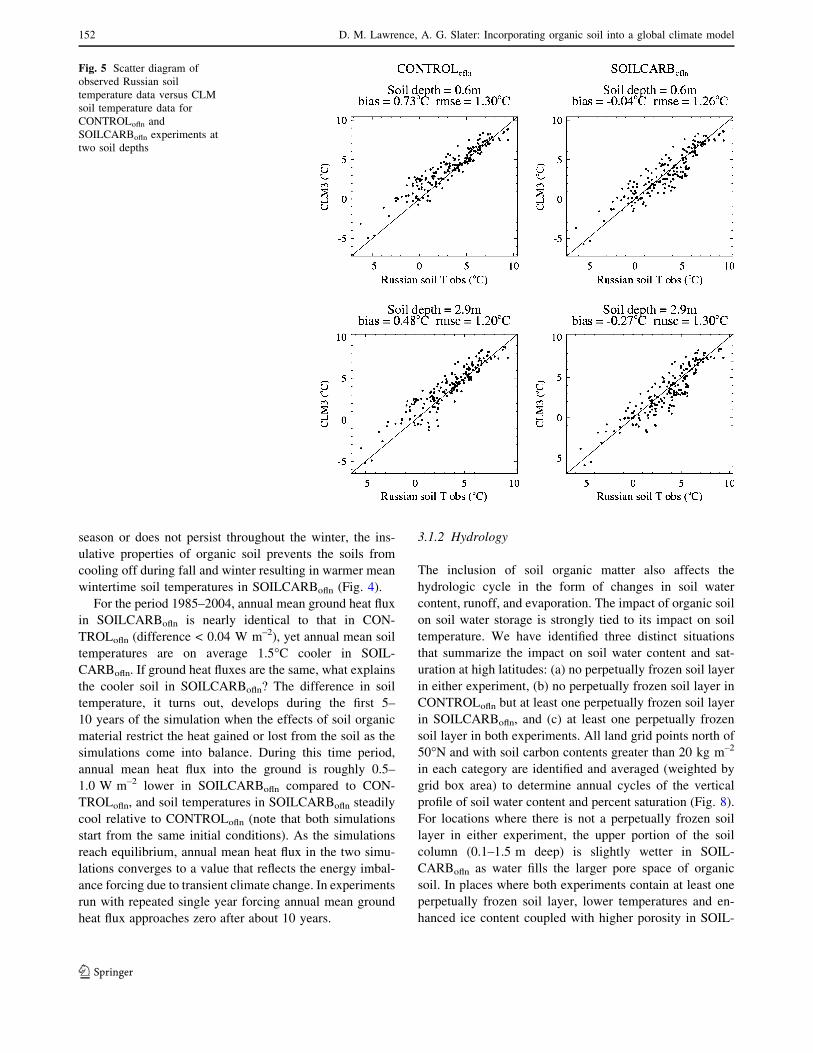
temperature. We have identified three distinct situationsthat summarize the impact on soil water content and sat-
uration at high latitudes: (a) no perpetually frozen soil layer
in either experiment, (b) no perpetually frozen soil layer inCONTROLofln but at least one perpetually frozen soil layer
in SOILCARBofln, and (c) at least one perpetually frozen
soil layer in both experiments. All land grid points north of50"N and with soil carbon contents greater than 20 kg m–2
in each category are identified and averaged (weighted by
grid box area) to determine annual cycles of the verticalprofile of soil water content and percent saturation (Fig. 8).
For locations where there is not a perpetually frozen soil
layer in either experiment, the upper portion of the soilcolumn (0.1–1.5 m deep) is slightly wetter in SOIL-
CARBofln as water fills the larger pore space of organic
soil. In places where both experiments contain at least oneperpetually frozen soil layer, lower temperatures and en-
hanced ice content coupled with higher porosity in SOIL-
Fig. 5 Scatter diagram ofobserved Russian soiltemperature data versus CLMsoil temperature data forCONTROLofln andSOILCARBofln experiments attwo soil depths
152 D. M. Lawrence, A. G. Slater: Incorporating organic soil into a global climate model
123

CARBofln lead to an increase in total soil water content.
Most of the column remains saturated throughout the yearas the high ice content severely restricts movement of
water out of the soil column. The biggest change in soil
water content occurs for points that have new perpetuallyfrozen layers in SOILCARBofln. In this situation the soil
column fills with soil water due to the sharp reduction in
permiability through the new perennially frozen soil layers.Although water content in the interior of the soil column
is broadly higher in SOILCARBofln, at the surface, the
efficient transport of water down into the column due to thehigh hydraulic conductivity and low suction of organic soil
results in a relatively dry surface soil layer. The low sur-
face water content coupled with the high porosity yieldssharply reduced percent saturation values (e.g. for category
(a) above, July saturation levels are 69% for CON-
TROLofln, 27% for SOILCARBofln). In nature, organic soilsare characterized in summer by nearly saturated sub-sur-
face conditions with a drier, highly variable, surface layer
(Hinzman et al. 1991). Strong variations in surface watercontent are a consequence of the observed efficient trans-
port of water down into peatland soil columns (Quinton
and Gray 2003). In the model, reduced surface layer sat-uration levels result in lower soil evaporation and associ-
ated reductions in total latent heat flux (Fig. 9). The
reduction in latent heat flux (LH) is compensated for by a
rise in sensible heat flux (SH) and a corresponding rise in
the Bowen ratio (SH/LH). This impact, and associatedchanges in surface air temperature, has an influence on
climate in coupled atmosphere-land simulations (see
Sect. 3.2). Note that although we show the impact of or-ganic soil on surface hydrology for a particular region, e.g.
the same north-west Siberia region considered previously
and a region that in CLM is predominantly free of per-petually frozen layers (category (a) above), similar char-
acteristics are seen for high soil carbon content locations
throughout the northern high-latitudes.Another interesting impact of organic soil seen in the
model is on surface and sub-surface runoff. In SOIL-
CARBofln there is a distinct increase in surface runoffduring the spring snowmelt season. This increase is driven
by higher surface layer soil ice content that prevents
infiltration in SOILCARBofln. The increase in ice content isa function of higher porosity and cooler soil temperatures
in SOILCARBofln. Once the surface layers have thawed,
surface runoff nearly ends as most water infiltrates into thesoil column. The annual mean increase in surface runoff is
partially compensated for by a decrease in annual mean
sub-surface runoff so that total runoff is relatively unaf-fected. In regions where the insulating properties of the soil
organic matter lead to greater ice contents, the associated
low hydraulic conductivities and deeper diagnosed water
Fig. 6 Climatological mean vertical profiles of soil temperature andthermal conductivity over an annual cycle for CONTROLofln andSOILCARBofln averaged over region of high soil carbon content in
north-west Siberia (60"–80"N, 70"–90"E) where area mean soilcarbon content = 49 kg m–2. Also shown is vertical profile of changein soil temperature (SOILCARBofln–CONTROLofln)
D. M. Lawrence, A. G. Slater: Incorporating organic soil into a global climate model 153
123

table due to the higher ice fraction work together to inhibitsub-surface runoff in SOILCARBofln. In reality, sub-sur-
face runoff through the upper organic layer can be very
efficient due to its high hydraulic conductivity (Hinzmanet al. 1991; Evans et al. 1999). The interactions between
water table depth, sub-surface runoff, and evapotranspira-
tion in peatlands (Fraser et al. 2001; Lafleur et al. 2005)and icy soils (Woo and Winter 1993) are clearly complex
and likely require further consideration in CLM. It is worth
noting, however, that the simulated monthly hydrograph ofmajor high-latitude rivers such as the Yenisey is not sen-
sitive to the inclusion of organic soil (not shown).
Although our focus has been on the high-latitudes wherepeatlands and other regions of characterized by soils with
high organic matter contents tend to be found, including
organic matter also impacts the simulations at middle andlow latitudes where soil carbon content is generally lower.
The impacts on soil hydrology are correspondingly weaker
but, as seen for high latitudes, summertime and/or wetseason soil evaporation (and latent heat flux) is generally
lower in SOILCARBofln. In some locations (e.g. in India,
see Fig. 10), the reduced soil evaporation can lead to en-
hanced soil water accumulation and storage during the wetseason followed by increased soil evaporation during the
dry season.
3.2 Coupled land–atmosphere simulations
To evaluate the impact of soil carbon on climate, we per-
form two AMIP-type CAM–CLM simulations forced with
observed SSTs for the same 1970–2004 time period donefor the offline experiments. Both experiments are initial-
ized with spun-up land states from CONTROLofln. The first15 years are devoted to spin-up of the deep soil states and
the remaining 20 years are analyzed for changes in climate.
As in the offline experiments, annual column mean soiltemperatures are cooler in SOILCARB compared to
CONTROL for soil carbon contents in excess of 40 kg m–2,
although the cooling is not as strong as in the offlineexperiments (Fig. 11). At soil carbon contents below
40 kg m–2, soil temperatures are, on average, actually
warmer in SOILCARB. The warmer soil temperatures aredriven by warmer simulated summertime air temperatures.
In Fig. 12 we present maps of climatological mean JJA
fields for 2 m air temperature, column mean soil temper-ature, evaporative fraction (latent heat flux divided by la-
tent heat flux plus sensible heat flux), boundary layer depth,
low cloud fraction, and net radiation. In CAM3–CLM3, thepresence of soil organic material contributes to warmer
summer air temperatures across the Arctic region. The
warming can be attributed to changes in the surface energybalance that affect the boundary layer, clouds, and the
amount of incident solar radiation. Basically, a reduced
latent heat flux from the moist but unsaturated surface peatlayer (see Sect. 3.2) and associated increased sensible heat
flux lead to a deeper and drier boundary layer and reduced
occurrence of low level clouds. The reduction in low cloudfraction (mid and high cloud fractions are largely un-
changed) permits more solar radiation to reach the earth’s
surface, thereby warming the surface and the near-surfaceair mass. The warmer air temperatures mitigate the sum-
mertime cooling of soil temperature that is induced by the
insulative properties of organic soil material. Impacts onprecipitation are negligible and not statistically significant
(not shown). The changes in mean boreal winter climate
are comparatively small.The significance of these results are not the precise
changes in air temperature but rather that soil organic
material, through its impact on the surface energy balance,can alter the simulated climate. Due to climate models’
differing response to changes in the surface energy balance,
the details of the climate sensitivity to organic soil arelikely to be dependent upon the characteristics of individ-
ual models.
Fig. 7 Climatological annual cycle of 2 m air temperature, snowdepth, ground heat flux, and layer 1, 0.01 m (black) and layer 4,0.12 m (gray) soil temperature averaged over north-west Siberia(60"–80"N, 70"–90"E). Solid lines are CONTROLofln; dashed linesare SOILCARBofln. Note that 2 m air temperature and snow depth arealmost identical in both experiments so only CONTROLofln is shown
154 D. M. Lawrence, A. G. Slater: Incorporating organic soil into a global climate model
123
4 Discussion
Due to the central role that changes in permafrost are
thought to have in the Arctic and global climate system, it
is interesting to consider how the inclusion of organicmaterial will alter the rate of permafrost thaw in transient
climate change simulations. Clearly, the cooler annual
mean soil temperatures will postpone permafrost thawunder Arctic warming as the soils have to warm further to
even reach 0"C. One might anticipate also that the insu-
lative properties of organic soil, coupled with the higherheat capacity of the wetter upper soil column, could to a
certain degree protect permafrost from a transient surface
warming (e.g. see processes described and analyzed inHinkel et al. 2001). A rough analog to transient warming is
the soil temperature response to interannual surface tem-
perature variability. If organic material is insulating the soilfrom interannual surface temperature variations in CLM
then one would expect to see reduced soil temperature
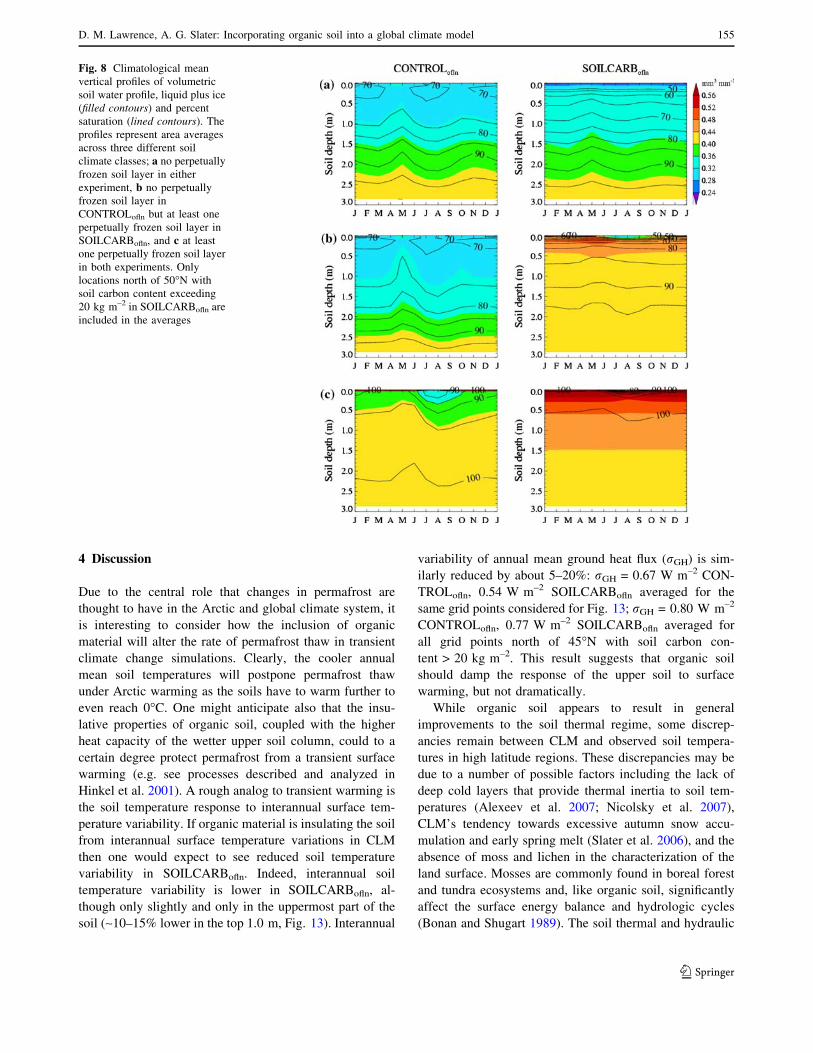
variability in SOILCARBofln. Indeed, interannual soiltemperature variability is lower in SOILCARBofln, al-
though only slightly and only in the uppermost part of the
soil (~10–15% lower in the top 1.0 m, Fig. 13). Interannual
variability of annual mean ground heat flux (rGH) is sim-ilarly reduced by about 5–20%: rGH = 0.67 W m–2 CON-
TROLofln, 0.54 W m–2 SOILCARBofln averaged for the
same grid points considered for Fig. 13; rGH = 0.80 W m–2
CONTROLofln, 0.77 W m–2 SOILCARBofln averaged for
all grid points north of 45"N with soil carbon con-
tent > 20 kg m–2. This result suggests that organic soilshould damp the response of the upper soil to surface
warming, but not dramatically.
While organic soil appears to result in generalimprovements to the soil thermal regime, some discrep-
ancies remain between CLM and observed soil tempera-
tures in high latitude regions. These discrepancies may bedue to a number of possible factors including the lack of
deep cold layers that provide thermal inertia to soil tem-peratures (Alexeev et al. 2007; Nicolsky et al. 2007),
CLM’s tendency towards excessive autumn snow accu-
mulation and early spring melt (Slater et al. 2006), and theabsence of moss and lichen in the characterization of the
land surface. Mosses are commonly found in boreal forest
and tundra ecosystems and, like organic soil, significantlyaffect the surface energy balance and hydrologic cycles
(Bonan and Shugart 1989). The soil thermal and hydraulic
Fig. 8 Climatological meanvertical profiles of volumetricsoil water profile, liquid plus ice(filled contours) and percentsaturation (lined contours). Theprofiles represent area averagesacross three different soilclimate classes; a no perpetuallyfrozen soil layer in eitherexperiment, b no perpetuallyfrozen soil layer inCONTROLofln but at least oneperpetually frozen soil layer inSOILCARBofln, and c at leastone perpetually frozen soil layerin both experiments. Onlylocations north of 50"N withsoil carbon content exceeding20 kg m–2 in SOILCARBofln areincluded in the averages
D. M. Lawrence, A. G. Slater: Incorporating organic soil into a global climate model 155
123

parameters for moss and lichen are similar to those for peat
and could be applied in a similar way to that done here forsoil carbon, with moss thermal and hydrologic parameters
specified for the uppermost soil layers for locations with
extensive moss cover. However, moss also transpires andrespires (and is important in the carbon cycle) and therefore
Fig. 9 Climatological annual cycle plots of selected surface energyand hydrologic cycle fields averaged over same north-west Siberiaregion shown in Figs. 6 and 7. Volumetric liquid and ice water are for
soil layer one. Values in title bar are annual mean quantities for (fromleft to right) CONTROLofln, SOILCARBofln, and SOILCARBofln–CONTROLofln
Fig. 10 Same as Fig. 9 except for Indian subcontinent (10"–25"N, 70"–90"E). Area mean soil carbon content = 14 kg m–2
156 D. M. Lawrence, A. G. Slater: Incorporating organic soil into a global climate model
123

needs to be treated as a plant functional type, which
complicates its inclusion into a GCM land-surface scheme.
Another requirement, before moss and lichen can beincorporated into a global land-surface model, is a dataset
detailing the distribution of moss and lichen around the
world. A final point is that as we move towards higher andhigher resolutions and consider incorporating a true moss/
peatland/wetland ecosystem into the model, the parame-
terization described here may need to be revised to some-thing more like the layered solution proposed in the Letts
et al. (2000) study, at least for locations with thick peat
layers characterized by more decomposed peat typically
found deeper in the soil column. These peatland ecosys-
tems cover only about 6% of the world’s surface butcontain up to a third of the world’s soil carbon.
5 Summary
The impact of soil organic matter on the thermal andhydraulic properties of soil is not typically accounted for in
land surface schemes used in global climate models despite
Fig. 11 Same as Fig. 4, scatterdiagram showing soil carboncontent versus change insimulated column mean soiltemperature, except for CAM3–CLM3 SOILCARB minusCONTROL. Only data for gridpoints north of 45"N are plotted
Fig. 12 Global maps ofdifferences in JJA meansbetween SOILCARB andCONTROL experiments forselected diagnostics. Stipplingindicates that local differencepasses the Student’s t test forstatistical significance at 95%confidence level. Evaporativefraction is latent heat flux overlatent heat flux plus sensibleheat flux
D. M. Lawrence, A. G. Slater: Incorporating organic soil into a global climate model 157
123
its strong influence on these properties. In the high-lati-tudes, where soil carbon content is high, this omission is
not a valid simplification. Global data on soil carbon
content, obtained through the Global Soil Data Task, hasbeen used to derive a new geographically distributed,
profiled CLM surface dataset of soil carbon density. New
parameterizations that incorporate the impact of soil carbonon soil thermal and hydraulic properties are described.
Analysis of offline and coupled simulations with and
without the soil carbon dataset and parameterizations yieldthe following conclusions regarding the sensitivity of soil
temperature, soil moisture, the surface energy balance, and
climate to the inclusion of soil organic matter.
• Cooler annual mean soil temperatures are set up byground heat flux differences during the first 5–10 years
of the simulation. The amplitude of the cooling depends
on column soil carbon content.• The impact on soil temperature is not constant across
the annual cycle. Strongly colder soil temperatures are
seen in summer while somewhat smaller impacts arefound during winter with some locations exhibiting
weak warming and others weak cooling.
• Increases in column soil water content and saturationlevels are seen, except at the surface where efficient
transport of water through the organic layer results in
highly variable and lower mean surface layer saturationlevels and a corresponding decrease in soil evaporation
and latent heat flux.
• Shifts in surface energy balance (lower latent heat flux,
higher sensible heat flux) contribute to changes in high
latitude climate. Summer surface air temperatures arewarmer in most high-latitude locations in response to
deeper boundary layers and associated reduced low
cloud fraction and enhanced incident solar radiation.This amplitude of the surface air–temperature impact is
likely to be model-dependent.
• The insulative properties of organic soil coupled withhigher heat capacity of the wetter upper soil column
combine to mildly interannual variability of soil
temperature and ground heat flux, suggesting thatorganic soil may provide only weak protection of
permafrost from transient surface warming.
Acknowledgments We would like to thank the Global Soil DataTask, the IGBP, ORNL DAAC and ISLSCP Initiative II for providingthe soil carbon data. We would also like to thank Vladimir Roma-novsky, Keith Oleson, and Larry Hinzman for helpful comments andsuggestions as well as constructive comments from two anonymousreviewers. Funding support is provided by U.S. Department of En-ergy, Office of Biological and Environmental Research, cooperativeagreement no. DE-FC03-97ER62402/A010 and National ScienceFoundation grants OPP-0229769 and OPP-0229651 and NASANNG04GJ39G.
References
Alexeev VA, Nicolsky DJ, Romanovsky VE, Lawrence DM (2007)An evaluation of deep soil configurations in the CLM3 forimproved representation of permafrost. Geophys Res Lett 34.doi:10.1029/2007GL029536
Beringer J, Lynch AH, Chapin FS, Mack M, Bonan GB (2001) Therepresentation of arctic soils in the land surface model: theimportance of mosses. J Clim 14:3324–3335
Bonan GB, Shugart HH (1989) Environmental-factors and ecologicalprocesses in boreal forests. Annu Rev Ecol Syst 20:1–28
Burn CN, Nelson FE (2006) Comment on ‘‘A projection of near-surface permafrost degradation during the 21st century’’.Geophys Res Lett 33:L21503. doi:10.1029/2006GL027077
Camill P (2005) Permafrost thaw accelerates in boreal peatlandsduring late-20th century climate warming. Clim Change 68:135–152
Campbell GS (1974) Simple method for determining unsaturatedconductivity from moisture retention data. Soil Sci 117:311–314
Chapin FS, Sturm M, Serreze MC, McFadden JP, Key JR, Lloyd AH,McGuire AD, Rupp TS, Lynch AH, Schimel JP, Beringer J,Chapman WL, Epstein HE, Euskirchen LD, Hinzman LD, Jia G,Ping CL, Tape KD, Thompson CDC, Walker DA, Welker JM(2005) Role of land-surface changes in arctic summer warming.Science. doi:10.1126/science.1117368
Clapp RB, Hornberger GM (1978) Empirical equations for some soilhydraulic-properties. Water Resour Res 14:601–604
Collins WD, Rasch PJ, Boville BA, Hack JJ, McCaa JR, WilliamsonDL, Briegleb BP, Bitz CM, Lin S-J, Zhang M (2006) Theformulation and atmospheric simulation of the communityatmosphere model, version 3 (CAM3). J Clim 19:2144–2161
Cosby BJ, Hornberger GM, Clapp RB, Ginn TR (1984) A statisticalexploration of the relationships of soil-moisture characteristics tothe physical-properties of soils. Water Resour Res 20:682–690
Fig. 13 Interannual variability of maximum annual soil temperaturewith depth for CONTROLofln and SOILCARBofln experiments.Variability represented as standard deviation of 20 years of modeldata. Lines represent average for all grid points poleward of 50"Nwith soil carbon contents greater than 20 kg m–2 and where the maxsoil temperature variations are not damped by the phase changeprocess in either simulation (193 grid points)
158 D. M. Lawrence, A. G. Slater: Incorporating organic soil into a global climate model
123

Evans MG, Burt TP, Holden J, Adamson JK (1999) Runoff generationand water table fluctuations in blanket peat: evidence from UKdata spanning the dry summer of 1995. J Hydrol 221:141–160
Farouki OT (1981) Thermal properties of soils. Report No. Vol. 81,No. 1, CRREL Monograph
Fraser CJD, Roulet NT, Moore TR (2001) Hydrology and dissolvedorganic carbon biogeochemistry in an ombrotrophic bog. HydrolProcesses 15:3151–3166
Global Soil Data Task (2000) Global gridded surfaces of selected soilcharacteristics (IGBPDIS). International Geosphere–BiosphereProgramme—Data and Information Services. Available online[http://www.daac.ornl.gov/] from the ORNL Distributed ActiveArchive Center, Oak Ridge National Laboratory, Oak Ridge,Tennessee, USA
Harden JW, Manies KL, Turetsky MR, Neff JC (2006) Effects ofwildfire and permafrost on soil organic matter and soil climate ininterior Alaska. Glob Change Biol 12:2391–2403
Hinkel KM, Paetzold F, Nelson FE, Bockheim JG (2001) Patterns ofsoil temperature and moisture in the active layer and upperpermafrost at Barrow, Alaska: 1993–1999. Glob Planet Change29:293–309
Hinzman LD, Kane DL, Gieck RE, Everett KR (1991) Hydrologicand thermal-properties of the active layer in the Alaskan Arctic.Cold Reg Sci Technol 19:95–110
Hinzman LD, Bettez ND, Bolton WR, Chapin FS, Dyurgerov MB,Fastie CL, Griffith B, Hollister RD, Hope A, Huntington HP,Jensen AM, Jia GJ, Jorgenson T, Kane DL, Klein DR, KofinasG, Lynch AH, Lloyd AH, McGuire AD, Nelson FE, Oechel WC,Osterkamp TE, Racine CH, Romanovsky VE, Stone RS, StowDA, Sturm M, Tweedie CE, Vourlitis GL, Walker MD, WalkerDA, Webber PJ, Welker JM, Winker K, Yoshikawa K (2005)Evidence and implications of recent climate change in northernAlaska and other arctic regions. Clim Change 72:251–298
Holland MM, Bitz CM (2003) Polar amplification of climate changein coupled models. Clim Dyn 21:221–232
Johanssen O (1975) Thermal conductivity of soils. University ofTrondheim
Jorgenson MT, Shur YL, Pullman ER (2006) Abrupt increase inpermafrost degradation in Arctic Alaska. Geophys Res Lett2:L02503. doi:10:1029/2005GL024960
Lafleur PM, Hember RA, Admiral SW, Roulet NT (2005) Annual andseasonal variability in evapotranspiration and water table at ashrub-covered bog in southern Ontario, Canada. Hydrol Pro-cesses 19:3533–3550
Lawrence PJ, Chase TN (2007) Representing a new MODISconsistent land surface in the Community Land Model(CLM3.0). J Geophys Res 112. doi:10.1029/2006JG000168
Lawrence DM, Slater AG (2005) A projection of severe near-surfacepermafrost degradation during the 21st century. Geophys ResLett 24:L24401. doi:10.1029/2005GL025080
Lawrence DM, Slater AG (2006) Reply to comment by C.R. Burn andF.E. Nelson on ‘‘A projection of near-surface permafrostdegradation during the 21st century’’. Geophys Res Lett33:L21504. doi:10.1029/2006GL027955
Lawrence DM, Thornton PE, Oleson KW, Bonan GB (2007)Partitioning of evaporation into transpiration, soil evaporation,and canopy evaporation in a GCM: impacts on land–atmosphereinteraction. J Hydrometeorol (in press)
Letts MG, Roulet NT, Comer NT, Skarupa MR, Verseghy DL (2000)Parametrization of peatland hydraulic properties for the Cana-dian Land Surface Scheme. Atmos Ocean 38:141–160
McGuire AD, Chapin FS, Walsh JE, Wirth C (2006) Integratedregional changes in Arctic climate feedbacks: implications forthe global climate system. Annu Rev Environ Resour 31:61–91
Molders N, Romanovsky VE (2006) Long-term evaluation of thehydro-thermodynamic soil-vegetation scheme’s frozen ground/
permafrost component using observations at Barrow, Alaska. JGeophys Res D4. doi:10.1029/2005JD005957
Nicolsky DJ, Romanovsky VE, Alexeev VA, Lawrence DM (2007)Improved modeling of permafrost dynamics in Alaska withCLM3. Geophys Res Lett 34. doi:10.1029/2007GL029525
Niu GY, Yang ZL (2006) Effects of frozen soil on snowmelt runoffand soil water storage at a continental scale. J Hydrometeorol7:937–952
Niu GY, Yang ZL, Dickinson RE, Gulden LE, Su H (2007)Development of a simple groundwater model for use in climatemodels and evaluation with GRACE data. J Geophys Res(submitted)
Oleson KW, Dai Y, Bonan G, Dickinson RE, Dirmeyer PA, HoffmanF, Houser P, Levis S, Niu G-Y, Thornton P, Vertenstein M, YangZ-L, Zeng X (2004) Technical description of the CommunityLand Model (CLM). Report No. NCAR Tech. Note TN-461 + STR, National Center for Atmospheric Research, Boulder,CO
Osterkamp TE, Jorgenson JC (2006) Warming of permafrost in theArctic National Wildlife Refuge, Alaska. Permafr Periglac Proc17:65–69
Payette S, Delwaide A, Caccianiga M, Beauchemin M (2004)Accelerated thawing of subarctic peatland permafrost over thelast 50 years. Geophys Res Lett 18:L18208. doi:10.1029/2004GL020358
Peters-Lidard CD, Blackburn E, Liang X, Wood EF (1998) The effectof soil thermal conductivity parameterization on surface energyfluxes and temperatures. J Atmos Sci 55:1209–1224
Qian T, Dai A, Trenberth KE, Oleson KW (2006) Simulation ofglobal land surface conditions from 1948 to 2002: part I: forcingdata and evaluations. J Hydrometeorol 7:953–975
Quinton WL, Gray DM (2003) Subsurface drainage from organicsoils in permafrost terrain: the major factors to be represented ina runoff model. Eighth International Conference on Permafrost,Davos, p 6
Quinton WL, Gray DM, Marsh P (2000) Subsurface drainage fromhummock-covered hillslopes in the Arctic tundra. J Hydrol237:113
Serreze MC, Walsh JE, Chapin FS, Osterkamp T, Dyurgerov M,Romanovsky V, Oechel WC, Morison J, Zhang T, Barry RG(2000) Observational evidence of recent change in the northernhigh-latitude environment. Clim Change 46:159–207
Slater AG, Bohn TJ, McCreight JL, Serreze MC, Lettenmaier DP(2007) A multi-model simulation of Pan-Arctic hydrology. JGeophys Res Biogeosci (submitted)
Smith LC, Sheng Y, MacDonald GM, Hinzman LD (2005a)Disappearing Arctic lakes. Science 308:1429–1429
Smith SL, Burgess MM, Riseborough D, Nixon MF (2005b) Recenttrends from Canadian permafrost thermal monitoring networksites. Permafr Periglac Proc 16:19–30
Stendel M, Christensen JH (2002) Impact of global warming onpermafrost conditions in a coupled GCM. Geophys Res Lett 13.doi:10.1029/2001GL014345
Sturm M, McFadden JP, Liston GE, Chapin FS III, Racine CH,Holmgren J (2001) Snow–Shrub Interactions in Arctic Tundra: ahypothesis with climatic implications. J Clim 14:336–344
Sturm M, Schimel J, Michaelson G, Welker JM, Oberbauer SF,Liston GE, Fahnestock J, Romanovsky VE (2005) Winterbiological processes could help convert arctic tundra to shrub-land. Bioscience 55:17–26
Tape K, Sturm M, Racine C (2006) The evidence for shrub expansionin Northern Alaska and the Pan-Arctic. Glob Change Biol12:686–702
Thornton PE, Rosenbloom NA (2005) Ecosystem model spin-up:Estimating steady state conditions in a coupled terrestrial carbonand nitrogen cycle model. Ecol Modell 189:25–48
D. M. Lawrence, A. G. Slater: Incorporating organic soil into a global climate model 159
123

Thornton PE, Zimmerman N (2007) An improved canopy integrationscheme for a land surface model with prognostic canopystructure. J Clim (submitted)
Walter KM, Zimov SA, Chanton JP, Verbyla D, Chapin FS (2006)Methane bubbling from Siberian thaw lakes as a positivefeedback to climate warming. Nature 443:71
Woo MK, Winter TC (1993) The role of permafrost and seasonal frostin the hydrology of Northern Wetlands in North-America. JHydrol 141:5–31
Yi SH, Arain MA, Woo MK (2006) Modifications of a land surfacescheme for improved simulation of ground freeze-thaw innorthern environments. Geophys Res Lett 33
Zhang T, Barry R, Gilichinsky D (2001) Russian historical soiltemperature data. Digital media. National Snow and Ice DataCenter, Boulder
Zimov SA, Schuur EAG, Chapin FS (2006) Permafrost and the globalcarbon budget. Science 312:1612–1613
Zinke PJ, Stangenberger AG, Post WM, Emanuel WR, Olson JS(1986) Worldwide organic carbon and nitrogen data. ONRL/CDIC-18, Carbon Dioxide Information Centre, Oak Ridge,Tenessee
160 D. M. Lawrence, A. G. Slater: Incorporating organic soil into a global climate model
123