inconsistent regulators: evidence from banking · comparing federal and state regulator supervisory...
TRANSCRIPT

Electronic copy available at: http://ssrn.com/abstract=1978548
INCONSISTENT REGULATORS: EVIDENCE FROM BANKING
Sumit Agarwal (National University of Singapore)
David Lucca (Federal Reserve Bank of New York)
Amit Seru (University of Chicago and NBER)
Francesco Trebbi (University of British Columbia, NBER, and CIFAR)
April, 2013
Abstract
We find that regulators can implement identical rules inconsistently due to differences in their institutional design and incentives and this behavior adversely impacts the effectiveness with which regulation is implemented. We study supervisory decisions of U.S. banking regulators and exploit a legally determined rotation policy that assigns federal and state supervisors to the same bank at exogenously fixed time intervals. Comparing federal and state regulator supervisory ratings within the same bank, we find that federal regulators are systematically tougher, downgrading supervisory ratings almost twice as frequently as state supervisors. State regulators counteract these downgrades to some degree by upgrading more frequently. Under federal regulators, banks report higher fraction of nonperforming loans, more delinquent loans, higher regulatory capital ratios, and lower returns on assets. Leniency of state regulators relative to their federal counterparts is related to costly consequences and likely proxies for delayed corrective actions—more lenient states have higher bank-failure rates, lower repayment rates of government assistance funds, and more costly bank resolutions. Moreover, relative leniency of state regulators at the bank level predicts the bank's subsequent likelihood of severe distress. The discrepancy in regulator behavior arises because of differences in how much regulators care about the local economy as well as differences in human and financial resources involved in implementing the regulation. There is no support for the corruption hypothesis, which includes “revolving doors” as a reason for leniency of state regulators. We conclude by discussing broader applicability of our findings as well as implications of our work for the design of banking regulators in the U.S. and Europe. Keywords: Banking Regulation, Banking Supervision, Dual Banking, CAMELS, Financial
Institutions.
JEL Classification Codes: G21, G28. Acknowledgments: The authors would like to thank Randy Kroszner, Ross Levine, Jesse Shapiro, Andrei Shleifer, and Robert Vishny for detailed comments. We also thank Alberto Alesina, Adam Ashcraft, Gadi Barlevy, Paul Beaudry, Matilde Bombardini, John Cochrane, Richard Crump, Josh Coval, Peter DeMarzo, Doug Diamond, Gene Fama, Mark Flannery, Gary Gorton, Bev Hirtle, Anil Kashyap, Cathy Lemieux, Thomas Lemieux, Christian Leuz, Jamie McAndrews, Anna Paulson, Sam Peltzman, Gordon Phillips, Tomasz Piskorski, Raghuram Rajan, Uday Rajan, Rich Rosen, Philipp Schnabl, and Luigi Zingales, anonymous referees as well as seminar participants at Arizona, Arizona State, Bank of Canada, Berkeley, Brown, Chicago Booth (Finance and Applied Micro), the Chicago Fed, Columbia GSB, Darden, ECB, HBS, Harvard, Insead, Minneapolis Fed, Northwestern, NY Fed, Oregon, Princeton, SFU, UCLA, USC, UBC, and conference participants at AFA, Bocconi CAREFIN, CEPR Summer Symposium, NBER Political Economy, NBER Monetary Economics, Red Rock Conference, and JAR/NY Fed Conference for useful discussions. We are also grateful to Conference of State Bank Supervisors for useful discussions and feedback. Tanya Mann, Jonas Mishara-Blomberger, Justin McPhee, and especially Caitlin Kearns and Allen Zheng provided outstanding research assistance. The views expressed in this paper are those of the authors and do not necessarily reflect the views of the Federal Reserve Bank of New York, or the Federal Reserve System.

Electronic copy available at: http://ssrn.com/abstract=1978548
1
1. Introduction
At least since Pigou (1938), economists have been interested in effective regulatory design. A
critical element of this design involves assessing how regulatory institutions themselves affect
the implementation of regulations. This is a complex question, as it often entails understanding
the interactions among several regulatory agencies with overlapping jurisdictions and differing
incentives, as well as the degree to which they are consistent in implementing the rules. Several
anecdotes suggest that inconsistent oversight by regulators with different incentives could hinder
regulatory effectiveness, none clearer than the demise of Washington Mutual Bank (WaMu), a
$300 billion thrift and the sixth largest U.S. bank at the time of its failure.1 According to a formal
congressional investigation, WaMu’s failure—the largest bank failure in U.S. history—was, to a
large extent, due to delayed corrective action that resulted from inconsistent oversight by its
regulators, the Office of Thrift Supervision (OTS) and the Federal Deposit Insurance
Corporation (FDIC).2 Despite the relevance of this issue, little systematic evidence exists on
whether there is differential implementation of regulation by regulators in banking or other
industries. We fill this gap by positing and empirically demonstrating that regulators can
implement identical rules inconsistently due to differences in their “will”—i.e. their institutional
design and incentives—and that this behavior can adversely impact regulatory effectiveness.
The regulatory structure in U.S. banking provides a convenient laboratory for studying the issue
of consistency across regulators as it involves oversight of institutions by two regulators—state
and federal regulators—with differing institutional design and incentives. Using a natural
experiment to circumvent the issue of banks self-selecting into different regulatory
environments, we provide evidence of inconsistent implementation of identical rules by federal
and state regulators. Importantly, we show that this inconsistency is associated with costs that
potentially hamper the effectiveness of regulation by delaying corrective action. We investigate
the reasons for discrepancy in supervisory behavior and find that it arises due to differences in
how much regulators care about local constituents as well as differences in human and financial
resources involved in implementing the regulation.
Inconsistent implementation of regulation by state and federal regulators relates broadly to the
debate on effectiveness of dual regulatory structure that has taken place in several industries,
including banking (see Scott 1977; Dixon and Weiser 2006). The fallout from the recent
financial crisis has triggered historical reforms in banking regulation (see Brunnermeier et al.
1 More anecdotes on ineffective regulation due to inconsistent supervision by U.S. state and federal banking regulators are available in Committee on Banking, Housing, and Urban Affairs (1994). There are also abundant examples of regulatory impediments due to inconsistencies between state and federal regulators in other industries (see, for example, Lane 2004 for securities regulation, Dixon and Weiser 2006 for telecommunication regulation, and Esworthy 2008 for regulations on pollution control). 2 Absent a deal between the FDIC and JPMorgan Chase to take over WaMu’s assets, this failure would have exhausted the entire Deposit Insurance Fund. More detail on the tussle between the OTS and FDIC in the run up to WaMu’s failure in September 2008 is available in the Office of Inspector General (2010) and the congressional investigation report (Committee on Homeland Security and Governmental Affairs 2011).
Electronic copy available at: http://ssrn.com/abstract=1978548
2
2009). However, most of these reforms have targeted activities that should be regulated, while
the discussion on reforming the current dual structure of supervision in banking has been less
active. This paucity of discussion is not due to the lack of arguments for and against the current
regulatory structure.3 On the one hand, proponents argue that the informational advantage of
state supervisors coupled with the broader perspective of federal supervisors enhances the nature
of decision making. In addition, it is argued that competing supervisors allow for lower political
interference, giving banks the choice of picking the less “tyrannical” regulator and a more
efficient allocation in the sense of Tiebout (1956). On the other hand, critics suggest that such a
complex supervisory structure may produce regulatory inconsistencies and result in a “race to the
bottom” in terms of regulatory laxity (White 2011). It may also create coordination and
informational problems between government agencies.
Empirical evidence validating or refuting these claims has been lacking due to two main
difficulties. First, it is hard to find comparable metrics of behavior across the myriad of
dimensions affected by different regulators overseeing different firms, in particular complex
entities such as banks. To overcome this issue, we rely on the easy-to-compare results of safety
and soundness on-site examinations by regulators, which are a crucial micro-prudential
supervisory tool. These examinations culminate in the assignment of a CAMELS rating, which
summarizes the overall condition of the bank on a numerical scale and forms a critical input in
how the bank is regulated (see Peek, Rosengren, and Tootell 1999 for a comprehensive
discussion on the importance of these ratings). Second, and perhaps more challenging, a bank’s
regulatory setting is determined endogenously through its charter choice, and thus is driven by
observable and unobservable bank characteristics. As a result, it is difficult to infer if a bank
picked the supervisor more suited to actions it intends to undertake, or if the regulator itself
changed the actions taken by a bank.
Our identification strategy exploits a legally determined rotation policy that assigns federal and
state supervisors to the same banks at exogenously predetermined time intervals. This allows us
to circumvent the issue of banks sorting into different regulatory settings. The policy on
alternating examinations was introduced in the Riegle Act of 1994 and subsequent regulatory
provisions with the goal of reducing administrative requirements for insured depository
institutions—that is, eliminating the burden of facing both federal and state examination in the
same year. The law assigns state chartered commercial banks to fixed 12-month or 18-month
rotations between state and federal supervisors. In particular, the rotation involves state
regulators and the FDIC for non-member banks (NMBs) and state regulators and the Federal
Reserve (Fed) for state member banks of the Federal Reserve System (SMBs). SMB and NMB
entities combined cover a substantial portion of the U.S. banking industry, about 80% in terms of
3 See House Committee on Banking and Currency (1965), Scott (1977), and Butler and Macey (1987).
3
the number of commercial banks and 38% in terms of total assets on average over the sample
period (with a maximum share of 45% of total assets).4
The empirical design of this paper is best understood through a simple example. Consider a bank
(B) that can be supervised either by a state regulator (S) or by a federal regulator (F). An ideal
experiment assessing differences in supervisory decisions would assign B to both S and F
simultaneously and consequently track differences in their rating actions. This thought
experiment would circumvent any selection issue since the same bank, B, is assigned to both
regulators concurrently. However, to identify the mean difference in the rating actions of the two
regulators it is sufficient for S and F to be assigned to B independent of B's financial condition,
even if the assignment is not concurrent. Our empirical set up mimics this closely, since
regulators S and F are alternatively assigned to B every t periods, with t predetermined by our
policy instrument. The assignment of regulators is exogenous to the financial conditions of B and
allows us to use within bank variation to identify average difference in supervisory rating
actions. Notably, the time delay between when regulators evaluate B should not statistically
result in S or F confronting B with different financial health systematically. Our set up allows us
to track not only the differences in supervisory ratings but also the consequences of supervisory
decisions on bank B’s operations.
In our main tests we use unique data to assess the difference in supervisory activities of federal
and state regulators. These activities involve examining depository institutions to evaluate safety
and soundness conditions. The process culminates in a compliance report for each bank, whose
assessment is summarized by a CAMELS rating, an acronym for its six components: capital
adequacy, asset quality, management and administration, earnings, liquidity, and sensitivity to
market risk. We identify a systematic effect of supervisor identity on these ratings. Federal
supervisors are systematically more likely to downgrade CAMELS ratings for the same bank
relative to state supervisors. These results are quantitatively large, as federal supervisors appear
twice as likely to downgrade relative to state supervisors. State regulators counteract these
downgrades to some degree by upgrading more frequently. Given the nature of our empirical
design, it is statistically implausible that these patterns occur because the federal regulator is
more likely to confront banks precisely when they are not doing well. We also examine which of
the subcomponents of the rating are responsible for these effects and find that, while the effects
are present for all subcomponents, they are the largest for the component where the potential for
regulatory discretion is likely to be highest (management component, M).
4 In 2011, assets by state-chartered banks reached $3.8 trillion, one-fourth of U.S. GDP that year. The fraction of assets accounted for by state-chartered banks fluctuates over time, as the largest banking organizations, nearly all of which include subsidiaries both with national and state charters, restructure their operations after mergers and regulatory changes (for example, JPMorgan Chase, and its predecessor entity, switched its lead bank from a national to a state charter, and then back again to a national charter during our sample period).
4
Next, we examine if, on average, banks operations respond to the presence of a federal regulator
relative to a state one. We find evidence of significant changes in banking operations following
federal supervision. In particular, banks report higher capital ratios, an increase in expense ratios,
a drop in their profitability, and a worsening of their asset quality, as measured by the ratio of
delinquent and nonperforming loans, in presence of federal regulators. We interpret these results
as reflective of the supervisory authority being used by federal regulators in making a bank take
corrective actions to address the problems highlighted in the examination.5 Interestingly, some of
these effects on balance sheet variables are also detectible as the federal supervisory cycle
approaches. This is reasonable since banks have a strong incentive to maintain good ratings,
because their costs—such as insurance premium on deposits—can go up with lower ratings. Of
course, given the short time horizon between regulatory spells, we find that such behavior is
limited. This evidence suggests that banks engage in some “window-dressing” in anticipation of
tougher federal regulators. Notably, to the extent banks do window-dress for tougher federal
regulators, there is a bias generated against finding any differences in ratings across the two
types of regulators. Thus, our estimates on differences in ratings between federal and state
regulators can be considered a lower bound of the true effect.
Our findings can help inform on the efficiency of the existing structure of dual banking
regulators. In general, one could argue that supervisors of different type regulating a given bank
in rotation might be an efficient and cost-saving arrangement with say a less thorough or skilled
regulator conducting a less extensive exam followed by a more detailed exam by a more rigorous
regulator, or a “nurse/doctor” arrangement. Alternatively, it is possible that federal and state
regulators have an implicit “good cop/bad cop” arrangement that allows for richer information
gathering from banks—federal regulators’ toughness allows for better information to be gathered
by state regulators, which in turn potentially allows for better implementation of regulation.6 The
collage of evidence we uncover suggests that both these interpretations, although intriguing, are
unlikely. Rather, inconsistent behavior of regulators seems to adversely impact the effectiveness
with which regulation is implemented.
To begin with, we show that, while federal regulators are significantly tougher than state
regulators, there is also a counteraction of these downgrades by state regulators who are more
likely to upgrade. This seems hard to rationalize as an efficient arrangement involving a more
thorough regulator examining the banks infrequently, since in a setting of alternating regulators,
the two regulators would not actively counteract each other’s decisions. Secondly, we report that
5 These results are consistent with earlier literature on the informational value of bank examinations in inducing corrective adjustments of a bank’s books (Berger and Davies 1998; Gunther and Moore 2003). 6 It is worth noting that the Riegle Act was predominantly motivated by red tape reduction, and in no part of its text does it appear focused on the creation of an optimal mix of more and less lenient regulators. Our personal discussion of the matter with several supervision and regulation experts also appears to strongly support the view that this is not an aforethought feature of the regulatory structure. In addition, to the best of these practitioners’ knowledge, although inconsistent implementation conforms to their priors, no specific gain (e.g. extra information conceded by the bank) is commonly recognized as originating from such out-of-step behavior of the federal and state regulators.

5
the extent of leniency of state regulators relative to federal regulators accentuates when banks
confront adverse local economic conditions. This is also hard to rationalize by an efficient
arrangement argument since such a system would likely have the thorough regulator supervising
the bank during harsh economic times-- periods when extensive examinations would be needed
the most.
We continue our analysis by showing that a softer stance of state regulators relative to their
federal counterparts has real consequences. States with more lenient local regulators relative to
their federal counterparts have higher bank-failure rates and problem-bank rates, a higher
proportion of banks that have been unable to repay Troubled Asset Relief Program (TARP)
money during the recent crisis, and a higher discount on assets of troubled banks that are
liquidated by the FDIC. Moreover, the federal-state spread is likely a proxy for regulatory delay
at the bank level since a higher difference at the bank level makes it more likely that a given
bank subsequently fails.7 We further reinforce these arguments by providing evidence from the
changes in regulator behavior around the passage of the Riegle Act. At the introduction of the
rotation policy, a bank moves from having simultaneous federal and state oversight every period
to having federal and state supervision in alternation. This setting allows us to demonstrate that
the alternation arrangement, which potentially reduces red-tape costs, is significantly more
lenient in terms of supervision when compared to a regime where a tougher regulator examines
the bank at all times.
We extend our analysis by showing that there is substantial regional heterogeneity in the
leniency of state regulators relative to their federal counterparts and by examining reasons
behind these differences. We find that one main reason why state regulators do not crack down
on banks as much as federal regulators is that they care about the local economy. Notably, local
unemployment has the largest quantitative effect in explaining state regulator leniency across
various alternatives. There is also significant evidence that state regulators are softer in rating
banks because they lack financial and human capital to implement the regulation. Finally, we
find no support for the corruption hypothesis, which includes “revolving doors” as a reason for
leniency of state regulators.
We conclude by discussing implications of our findings for regulatory design of the banking
system. Though our results are estimated on state-chartered banks —an important sector both in
terms of its economic size as well as its impact on financial stability— we discuss their
significance for understanding regulation in the full U.S. banking universe by conducting
analysis on all U.S. banks and regulators. We argue that the movement of banks (including large
7 As we show, inconsistencies between regulators can induce variability in bank operations. Thus, inconsistent implementation may also potentially reduce the transparency of bank balance sheets for agents in the economy who are unaware of the source of this variability, as the exact alternation schedule of regulators for each bank is not known to the public. As shown in Caballero, Hoshi, and Kashyap (2008), lack of timeliness of corrective banking actions as well as opaque balance-sheet information can be costly and can adversely impact real allocations.
6
ones) between national and state charters makes the behavior of regulators inside each of these
systems interdependent. Thus, understanding optimal regulation of large banks in national
charters requires clear inference on the nature of the regulatory environment that exists inside
state charters, like the one presented in our paper. As a validation of this notion, we show that the
choice of banks to enter or relocate in a state is related to the federal-state spread in that state.
More broadly, we discuss the implication of our findings in understanding what might be
expected in regimes where a single regulator drives oversight decisions versus a system where
multiple regulators share oversight. We show that sharing oversight among regulators may also
have costs — similar to what competition among regulators introduces in terms of regulatory
laxity — since the stricter regulator faces dilution of control due to the presence of more lenient
regulators, and especially so when banks face worse economic conditions. We conclude by
discussing the implications of these findings for optimal regulation, including the debate on the
redesign of banking regulation in Europe.
Our work is broadly related to several strands of the economics and finance literature. First, it is
most directly related to work on regulatory design. The issue of the design of regulation spans
from its early public interest roots to the Chicago theory of Stigler (1971) and Peltzman (1976),
who argued that regulation is often captured by the industry it is meant to regulate and is
designed primarily for insiders’ benefit, to the rent-seeking theory of regulation (e.g. Shleifer and
Vishny 1999).8 Most of this work (including in the context of banking) debates the pros and cons
of different regulatory structures, but provides surprisingly little systematic empirical evidence.
Our work contributes to this literature by showing that regulators can be inconsistent and tracing
the reasons and consequences of such behavior. Second, and more relevant to the issue of
regulatory inconsistencies, this paper speaks to the literature in industrial organization that
focuses on regulatory consistency and regulatory uncertainty (see Brennan and Schwartz
1982a,b, Viscusi 1983, Prager 1989, and Teisberg 1993). Not unlike our paper, this literature
also studies some sources of regulatory inconsistencies (e.g. elected versus appointed regulators)
as well as their consequences (e.g. differential firm productivity).
Third, this paper is connected to studies on regulatory arbitrage (Rosen 2003, 2005, Rezende
2011) that suggests that banks actively shop for regulators who are likely to be softer on them
through different channels such as charter changes, mergers with other banks, supervisory
ratings, or changing their location of incorporation. Other work in this area (Kane 2000,
Calomiris 2006, and White 2011) also discusses changes in regulatory standards due to
competition between regulators. In general, this arbitraging behavior by banks may induce a
8 For review of the public interest theory see Laffont and Tirole (1993) which also focuses on a modern take on regulation, encompassing the role of asymmetric information. Also related is the work by Dewatripont and Tirole (1994), Boot and Thakor (1993), and Hellman, Murdock, and Stiglitz (2000), among others. The issue of centralized versus decentralized regulation, often discussing state versus federal regulation in the U.S. context, has received attention in Martimort (1999), Laffont and Martimort (1999), and Laffont and Pouyet (2004), among others.

7
potentially sizeable selection bias in examining the effects of regulatory actions. Our empirical
design circumvents this issue and shows how such bias occurs and provides guidelines on causal
estimates of the influence of regulators.9 Finally, our work complements the empirical literature
on the effects of banking regulation and supervision. Such work encompasses studies on the role
of regulation and supervision in well-established banking and financial sectors of developed
economies (Jayaratne and Strahan 1996, Berger and Hannan 1998, Kroszner and Strahan 1999),
as well as in developing financial sectors across the globe (see Beck et al. 2000, Barth et al.
2004, among others).
The rest of the paper is organized as follows. In Section 2, we discuss the structure of U.S.
banking supervision and the data. In Section 3, we highlight our empirical strategy. Next, in
Section 4, we report our main results. In Section 5 we assess the costs and benefits of
inconsistent regulation. Section 6 explores the likely sources of differences in regulatory
behavior. Section 7 concludes by discussing broader applicability of our findings as well as
implications of our work for design of banking regulators in the U.S. and Europe.
2. U.S. Banking Regulation, Alternating Supervision, and Data
2.1 An Overview of U.S. Banking Regulation
The U.S. banking industry has evolved into a complex and fragmented system that reflects
America's historical tension between centralizing and decentralizing political forces. Since the
National Bank Act of 1863, commercial banks have dealt with a dual regulatory system, under
which they are chartered and supervised by both federal and state-level entities.10 This system
has often been praised by policy makers as playing a key role in financial innovation, as federal
and state regulating bodies compete with one another and thus trim unnecessary rules (Scott
1977). In addition, commentators have argued that state regulators can leverage their local
knowledge to improve their supervisory decisions. At the same time several policy makers and
commentators have criticized the dual system for the resulting fragmentation of the banking
sector and for the risk of a “competition for laxity” generated among bank regulators (for
example, Fed Chairman Arthur Burns, 1974 and discussion in White 2011). This latter issue has
been actively debated in the past—most recently around the Gramm-Leach-Bliley Act of 1999—
and has again resurfaced in the aftermath of the 2008–09 crisis (see Senator Dodd’s speech in
Senate Banking Committee hearing in September 2009).
9 The literature on regulatory shopping and a race to the bottom extends beyond banking. For instance, the literature on international trade provides evidence that firms shop for the least stringent regulator. Similarly, there is a growing literature on shopping of rating agencies by issuers of mortgage-backed securities (e.g. Bolton et al. 2011). 10 Prior to 1863 state commercial banking was the primary form of banking. Commercial banks remain the predominant form of depository institutions in the U.S. and are the focus of this paper. The other main classes of depository institutions are savings banks (known as thrifts), which generally specialize in real estate lending, and credit unions, which are cooperative financial institutions. Other types of depository institutions in the U.S. are the following: Edge corporations and the branches and agencies of foreign banks.

8
In the current system banks can choose between a state and national charter. With a state charter,
they can also decide whether or not to be members of the Federal Reserve System. The three
different types of commercial bank charters correspond to three different primary federal
regulators: the Office of the Comptroller of the Currency (OCC), instituted in 1863; the Federal
Deposit Insurance Corporation (FDIC), instituted in 1933; and the Federal Reserve System (the
Fed), instituted in 1913. Federally chartered banks, also known as national banks (NA), are
primarily supervised (and chartered) by the OCC. State banks are supervised by their chartering
state banking departments, in conjunction with the Federal Reserve, if they are members of the
Federal Reserve System (as we stated before, these banks are called state member banks, SMBs).
Otherwise, state banks are supervised by their respective chartering state banking departments
along with the FDIC, since these banks are not a member of the Federal Reserve System (these
banks are referred to as non-member banks, NMBs). In general, the regulator that is in charge of
regulating and supervising an entity is also a function of its line of business. Figure 1 depicts the
structure of supervision and regulation for U.S. commercial banks and thrifts.
Until recently, different charters implied notable differences in permissible activities as well as
regulatory requirements. For example, through the early 1980s non-member banks were not
subject to reserve requirements (according to the Depository Institutions Deregulation and
Monetary Control Act of 1980), their lending limits could differ significantly across states, their
ability to branch interstate differed, and the list of activities (e.g. providing insurance) that they
were permitted was quite diverse. However, over the years, many of the differences across
requirements and charters have disappeared as regulatory charters have converged. Many
commentators believe that the main drivers of charter choice now are direct regulatory costs and
the bank’s perception of the regulator’s accessibility.11 Small banks tend to prefer state charters,
as applications are streamlined and supervisory fees are lower (Blair and Kushmeider 2006).
Larger banks, especially those that aim at branching inter-state, tend to prefer national charters
(see, e.g. Bierce 2007).12
Banking micro-prudential supervision in the United States relies on two main pillars: off- and
on-site monitoring. Off-site monitoring requires all depository institutions to file quarterly
“Reports of Condition and Income,” or Call Reports. Regulators use Call Reports to monitor a
bank’s financial conditions between on-site examinations. On-site “safety and soundness”
examinations are used to verify the content of Call Reports and to gather additional in-depth
information regarding the safety and soundness of the supervised entity as well as its compliance
with regulations. In an on-site examination, supervisors read additional documents from the
bank, review and evaluate its loan portfolio, and meet with the bank’s management. Supervisors
11 Office of Inspector General (2002). For a cautionary tale concerning the OTS "accessibility," see Cyran (2009) and Office of Inspector General (2010). In our sample for analysis, state banking departments often mention higher "accessibility" among the main advantages of a state charter versus a national one. (See, for example, http://www.banking.state.tx.us/corp/charter/benefits.htm.) 12 See Rosen (2003) for possible determinants of charter changes.

9
comment on areas that must be improved, and depending on the bank’s condition, they also
discuss with management the need for informal or formal supervisory actions. Informal actions
are established through a commitment from the bank to solve the deficiencies identified in the
form of a memorandum of understanding or a bank board resolution. Formal actions are more
severe. They include cease-and-desist orders, suspensions or removals of banks’ senior
management, and terminations of insurance.
These examinations culminate in the assignment by a team of examiners of a CAMELS rating,
which summarizes the conditions of the bank (broken down into six components: capital
adequacy, asset quality, management, earnings, liquidity, and sensitivity to market risk). Ratings
for each of the six components and the final rating are on a scale of 1 to 5, with the lower
numbers indicating fewer/and or lesser regulatory concerns. Banks with a rating of 1 or 2 are
considered to present few (if any) significant regulatory concerns, whereas those with 3, 4, and 5
ratings present moderate to extreme levels of regulatory concerns.
Not only are these ratings a central summary measure of banking supervision that is easily
comparable, they are also relevant for several important policy decisions. In particular,
CAMELS are used to determine how high to set insurance premiums on deposit insurance by the
FDIC, whether to lend credit to financial institutions by the Fed (lender of last resort), whether to
make licensing, branching, and merger approvals, and whether to allow banks to participate in
government programs (like TARP and small business lending programs).
2.2 Alternating U.S. Banking Supervision: Policy and Coverage
Since the Federal Deposit Insurance Corporation Improvement Act of 1991, federal bank
supervisors are required to conduct on-site examinations every 12 months, unless their assets fall
below a minimum threshold, in which case the exams are conducted every 18 months. This
threshold has changed over time and since 2007 stands at $500 million for SMBs and NMBs
(FRB 2008 and FDIC 2002).13 Federal supervisors began coordinating with state banking
departments so that they could share examination results in the 1980s. Section 349 of the Riegle
Community Development and Regulatory Improvement Act of 1994 required the Federal
Financial Institutions Examination Council (FFIEC) to issue guidelines for determining the
acceptability of state examination reports as substitutes for federal examinations.
The aim of these rules was to reduce the regulatory burden on state-chartered banks under a dual
supervision system, substituting a federal examination with a state examination. The rules were
issued in the Federal Financial Institutions Examination Council (1995), and the Federal Reserve
Board and the FDIC made a formal nationwide state/federal supervisory agreement with the
Conference of State Bank Supervisors (CSBS), a national organization of participating state bank
13 See the U.S. Code Title 12, §1820 (d. 3) for an explicit codification.

10
regulators.14 Since the issuance of the Federal Financial Institutions Examination Council (1995),
acceptable state reports became eligible substitutes for federal reports; that is, after the FFIEC
rules were issued, federal and state regulators could take turns every 12 months (or 18 months
for smaller banks) examining state-chartered banks.
As noted previously, the FFIEC rules established that each federal regulator independently
determines whether to accept the state examination results based on the type of reports produced
by the state examiners, as well as measures of minimum state banking department budgets and
the state banking department’s accreditation by the CSBS. The FDIC/Fed cooperative
agreements cover the vast majority of states. By 1995, both federal agencies separately had
already entered into informal and formal arrangements, or working agreements, with most state
banking departments, determining the types of banks that would be examined on an alternating
independent basis or on a joint examination basis, among other matters.15 While our results are
quite insensitive to the choice of the starting period after the FFIEC guidelines of 1995 were
issued, we do lack a precise date on which the policy starts operating. We conservatively allow
for a one-year breaking-in period and begin our analysis as of 1996:Q1 to ensure that
idiosyncrasies in initial program implementation disappear. By 1996:Q1, rotations of supervisors
across the vast majority of states are pervasive in the data. Our sample ends in 2010:Q4.
Alternating examinations are not available for a small subsample of banks. Only banks that at the
most recent examination were assessed to have a composite CAMELS rating of either 1 or 2 are
part of the alternating program. Because of this constraint, in our sample upgrades are from a
rating of 2 to 1 and downgrades may occur from a rating of 1 to 2 or above (3, 4, or 5) or from a
rating of 2 to 3 or above (4 or 5) ratings. Further, only SMBs with an asset size of less than $10
billion are part of the program. In our sample of analysis, we focus on SMBs satisfying these
criteria, since only for such banks the supervisory rotation policy is predetermined. The FDIC
conducts alternating independent exams only for NMBs with an asset size of less than $250
million, representing more than 80% of all NMBs. Bank examinations of larger NMBs are run
on a joint basis with the state examiner—in such cases, a mix of state and FDIC examiners
participates in the on-site visits. However, even in the case of joint NMB examinations, only one
agency is the “lead agency” in assigning the CAMELS. We include such joint examinations in
our sample, but our results are unaffected when excluding NMBs above $250 million.
We further filter the sample by excluding targeted examinations as well as exams where all
subcomponents of the CAMELS rating are not scored or available. We also exclude concurrent 14 These rules are summarized in Federal Deposit Insurance Corporation (2002) and Board of Governors of the Federal Reserve System (2008)—two manuals for commercial bank examinations. 15 According to the Federal Deposit Insurance Corporation (2004), all state banking departments with the exception of seven had signed formal cooperative agreements by 2004, with the number falling to four by 2007. In 2004, the state banking departments without formal agreements with federal regulators were in Alaska, Montana, Nevada, New Hampshire, Rhode Island, South Dakota, and South Carolina. See: http://www.csbs.org/development/accreditation/Pages/default.aspx. See also Rezende (2010) for a discussion.

11
examinations because of their exceptional nature relative to the routine safety and soundness
examinations that are our focus. Even when meeting all the preceding criteria for inclusion in our
alternating supervision sample, we observe a small fraction (about 10%) of banks that do not
display any rotation during our sample period. These banks with no signs of supervision rotation
do not show up systematically within the sample—and they are spread out across states and over
time. These banks appear to be mostly certain types of depository institutions with peculiar
purposes (e.g. Industrial Loan Companies, ILCs) or de novo banks. Because these banks do not
satisfy our condition for identification that requires exogenous rotation of regulators, we exclude
them from our sample. We note, however, that our results are unaffected by including these
specific banks in our analysis.
2.3 Data and Descriptive Statistics on Rotation
We use a unique dataset from the National Information Center of the Federal Reserve System,
covering the time period from 1996 through 2010, of all on-site examination of safety and
soundness conducted by banking regulators. The data contain detailed information about
financial information of depository institutions, regulated and select non-regulated institutions, as
well as other institutions that have a regulatory or reporting relationship with the Federal Reserve
System. The key data for the purposes of this study are unique bank identifiers, the examiner
identity (e.g. the FDIC, the Fed, the states, the OCC, and the OTS), the exam date, and most
importantly the composite CAMELS rating and its components. In contrast to several papers that
have explored the determinants of supervisory ratings at the bank-holding level (e.g. Berger,
Davies, and Flannery 1998), we employ the ratings at the level of the commercial bank, which is
the entity level at which we observe the examiner rotations.
We merge this information with balance-sheet measures of bank profitability, profitability, and
asset quality from Call Reports. Our main Call Reports variables are: Tier1 risk-based capital
ratio, leverage ratio (Tier1 capital as a share of total risk-unweighted assets), efficiency ratio
(Noninterest expense as percent of net operating revenue), return on assets, share of
nonperforming loans to total loans, and the delinquency rate of the loan portfolio. Delinquent
loans include loans that are 30-plus days past due and loans in nonaccrual status, and
nonperforming loans are 90-plus days delinquent and loans in nonaccrual status. In some of our
analysis we also dissect delinquency and nonperforming loans for various asset classes in a
bank’s portfolio (e.g. commercial real estate, residential real estate, and commercial and
industrial loans).
Importantly for our analysis, we define a supervisory spell as the quarters between when a
regulator conducts its on-site examination and when the alternate regulator examines the bank.
As discussed in Section 2.2, these spells are mandated to be either four or six quarters, depending
on the bank’s asset size. In our regressions, we use this definition of supervisory spell to assess
the relationship between changes in supervisor identity and changes in CAMELS ratings and

12
bank operations. Since CAMELS rating rarely changes between on-site exams, we effectively
compare the value of these ratings during a federal regulator spell to its value during a state
regulator spell. In contrast, bank variables can potentially change every quarter. Thus, we
compare the average value of a variable across quarters during a federal regulator spell to its
average across quarters during a state regulator spell. This discussion is illustrated in Figure 2.
Summary statistics for our sample of rotating banks as of 1996:Q1 appear in Table 1. We present
the descriptive statistics on CAMELS ratings, as well as bank balance-sheet measures such as
delinquencies, nonperforming loans, and ROA for both SMBs and NMBs split up by whether
they were assigned to federal or state regulators at the start of our sample. These statistics
provide sample moments that will be useful for interpreting the magnitude of our regression
coefficients.
Figure 3 reports the frequency of the rotation spells graphically, illustrating compliance to the
rotation profiles required by law for SMBs and NMBs. The vast majority of banks display
supervisory rotations between four and eight quarters matching well the rotation restrictions
discussed earlier. In particular, NMBs are subject to less frequent examinations and rotations,
about one every 6 quarters, since NMBs tend to be smaller banks (the mean assets size of NMBs
in our sample in 1996:Q1 is $95 million). Being larger, SMBs are subject to 4-quarter rotations
in most cases (the mean assets size of SMBs in our sample in 1996:Q1 is $160 million).
We investigate the reasons for dispersion around the regulatory spells of four and six quarters
that are implied by Riegle Act. The shorter rotation spells are mostly accounted for by
institutions that exit our sample because of the large wave of bank mergers that occurred over the
past 15 years. The relaxation of intrastate and interstate branching regulation and the Gramm-
Leach-Bliley Act of 1999 were primary facilitators of this wave of mergers and acquisitions, a
trend that we find is unrelated to the identity of the supervisor (federal or state) in charge of the
exams.16 Regulation spells may also be shorter because of banks switching charters or relocating
their operations (Rosen 2005). These instances are fairly limited in the data, and similar to M&A
activity, we find relocations and charter switches to be unrelated to the identity of the supervisor
in charge of the exams. We note that exclusion of shorter spells from our analysis does not
impact the results we present later. We also occasionally find idiosyncratic cases of longer
rotation cycles, and their exclusion also does not affect our results in any way. Discussions with
supervisors suggested that many of these idiosyncrasies might be due to staffing issues, both at
the state and federal levels.17 Often a longer-than-expected rotation time with one regulator is
offset by a subsequent shorter rotation time with the alternating regulator; this tendency to
rebalance the time between rotations is in line with regulatory restriction on spells. 16 Prior research has found this trend due to weakening of small bank special interests vis-à-vis large banks in light of the introduction of new technologies in lending and deposit-taking (see Kroszner and Strahan 1999). 17 Examples include instances when the examiner assigned to a specific bank was on leave/vacation at the predetermined exam time and when the assigned examiner was still involved with exams at another institution.

13
Finally, Table 1 also allows us to investigate the nature of assignment of banks to state versus
federal regulators at the inception of the rotation policy. It reports t-tests for differences in means
across federally and state-regulated banks involved in the rotation process as of the first quarter
of 1996. Broadly, we find that banks assigned to state regulators versus federal look similar in
the cross-section at inception. We fail to reject equality of means in the vast majority of the
controlling variables. Occasionally, Table 1 reports some differences along certain dimensions,
indicating potential deviations from pure random assignment. These cross-sectional differences
are, however, quantitatively small. As we elaborate in the next section, our identification strategy
relies on predetermined within-bank variation of regulators and not on which regulator was
assigned at the inception of the rotation policy. Nevertheless, the quasi-randomized nature of
assignment of initial supervisors across banks lends further support to our empirical design.
3. Identification Strategy
3.1 Empirical Model
We now present our empirical model and describe our identification strategy. Consider a
regulatory outcome variable of interest Yit (e.g. the composite CAMELS rating) to be linearly
determined by a vector of characteristics of bank i at quarter t, Bit, and by the characteristics of
the supervisor Sit at quarter t according to:
,
including bank-specific fixed effects and quarter fixed effects . Let us consider within-
bank/within-quarter deviations from averages to partial out all fixed effects. Representing the
within deviations with lower-case variables and dropping bank-quarter subscripts, it follows:
, (1)
where plays the role of classical measurement error deviations. The vector s may include
regulator-specific characteristics, such as the competence of its team of examiners, the structure
of its budget, the role of assessment fees, and the degree of political pressure on the regulator
(we examine these dimensions in the following sections). However, for simplicity's sake, let us
assume that s is scalar, indicating the change in the identity of the regulator. Vector b may
include variables endogenously set by the bank, such as changes in the bank's ROA, capital
ratios, or shifts in the management’s composition.
To illustrate the bias due to self-selection by banks, let us assume that the decision of choosing
supervisor s by bank with characteristics b is linear:
, (2)
where u represents the idiosyncratic variation in the selection of a regulator. Equation (2)
approximates how banks change their regulatory environment s depending on their

14
characteristics b and the regulatory treatment they will receive (Rosen 2005), which we assume
for starkness that banks can exactly predict.18 The nature of the problem is similar to matching
bias in empirical contract theory, as, for instance, studied by Ackerberg and Botticini (2002).19
By regressing y on b and s, both coefficients would be biased and inconsistently estimated due to
, 0.
Our identification is based on the availability of a policy p guaranteeing that, within a set of
SMBs and NMBs with rotating regulators, equation (2) does not hold. Instead, the assignment of
a new regulator is predetermined by the policy rule:
, (3)
where the following orthogonality condition holds:
| 0 . (4)
The error term accounts for idiosyncratic shocks that may introduce variation in the
implementation of the rotation policy, as discussed in the case of Figure 3. These include random
events, such as conflicting meeting schedules or other factors that lead to temporary
unavailability of examiners. Our sample conditioning in (4) requires that we examine only
depository institutions for which the regulator’s identity is predetermined. Conditional on the
bank being a SMB or NMB, under (3) and (4), fixed-effects panel estimation of the parameter
vector of interest [ , ] in (1) is unbiased and consistently estimated.
In principle, under (3) and (4), it is also possible to identify the effect of supervisor s on bank
behavior itself:
, (5)
where represents idiosyncratic error deviations in bank behavior. can be consistently
estimated, since (3) breaks the simultaneity of b and s implied by (2). Section 4.2 discusses in
detail the effect of s on the bank’s response outcomes.
3.2 Interpretation
We now discuss two important issues that relate to interpretation of estimates obtained using our
identification strategy. First, recall that we exploit only within-bank information and rely on the
predetermined nature of the assignment rule p to obtain consistent estimates of the effect of
changing a regulator. However, this effect includes both the direct effect of a supervisor on
18 An example of equation (2) would be the choice by Countrywide Financial Corp. to become a thrift in 2007. As discussed in the Financial Crisis Inquiry Commission Report (2011, p. 174), Countrywide moved under OTS oversight because of the increased scrutiny on property appraisals under OCC and of adverse views on Option ARMs voiced by the Fed (both OCC and Fed were Countrywide’s previous regulators). 19 A main difference in our paper is our focus on selection issues arising both in changes and in levels, as opposed to selection arising in levels only. This excludes the possibility of using panel variation as a source of identification in our setting, while it is occasionally employed in matching models. See Ackerberg and Botticini (2002).

15
CAMELS rating ( ) and any indirect effect that the supervisor has on CAMELS rating by
altering bank behavior. To see this clearly, replace (5) in (1). The reduced-form regression we
estimate is equivalent to:
. (6)
Here, the total effect of changing a regulator is , and it is consistently estimated in our setting.
The advantage of estimating equation (6) rather than (1) is that we capture in a single estimate all
the channels through which s matters for CAMELS rating: the direct effect and the indirect
effect . More importantly, relative to estimating equation (1), estimating equation (6) does not
suffer from potential misspecification due to the omission of relevant elements of the vector .
We could, however, get some guidance on what this indirect effect in our context is likely to be.
In particular, suppose we believe that—for whatever reason—regulators are different in how
they rate the same bank, with one regulator being systematically tougher than another. As
explained earlier, banks have a strong incentive to maintain good ratings as their costs, such as
insurance premium on deposits, can go substantially up with worse ratings. Thus, to the extent
banks have some flexibility, they may change some elements of in anticipation of the tougher
regulator—i.e., do window-dressing—to get a reasonable rating. Under this scenario, the indirect
effect would create a bias against finding any differences in supervisory ratings across the two
regulators. Of course, as explained in Figure 2, besides changing in anticipation of the tougher
regulator's supervisory spell, a bank can also change during the rotation spell. Consequently,
pinning down the precise nature of indirect effect is difficult. Regardless, in our empirical tests
we will present results both with and without conditioning on a plethora of bank variables to
evaluate the robustness of our findings.
The second issue we want to discuss is that the regressions using our identification strategy could
potentially suffer from the omission of dynamic interactions between regulators, such as
expectations of federal regulators about subsequent behavior of state regulators. For instance,
federal regulators could decide to preemptively downgrade the rating in expectation of a more
lenient future spell under state regulators, even if existing conditions may not warrant it. Under
this scenario, the structural parameter vector of interest [b, s] would be consistently recoverable
from the data only if information on the nature of the dynamic interaction across regulators was
available. Nonetheless, absent such information, the estimated coefficients on b and s still
represent consistent reduced-form equilibrium effects of bank behavior and the supervisor’s
identity. We limit ourselves to such an interpretation here.
4. Empirical Results on Supervisory Ratings and Bank Variables
4.1 Differences in Supervisory Ratings
In this section, we exploit the predetermined assignment of regulators to SMBs and NMBs to
assess the effect of a supervisor’s identity on the rating obtained by a depository institution. We
16
start by investigating the nature of the differences in CAMELS ratings that state and federal
regulators assign by estimating equation (6). As discussed in Figure 2, supervisory ratings can
change only when the exam is conducted and remain fixed across quarters in a supervisory spell.
Consequently, the regressions involving these ratings will only use one observation from each
supervisory spell.
Table 2 reports the results for our sample of SMB and NMB institutions, supervised alternately
by Fed and state regulators. We present results for both the composite CAMELS rating (Table
2A) and for each of its six subcomponents (Table 2B). This allows us to detect possible
deviations across the various dimensions scored, since state supervisors might emphasize
different safety and soundness components relative to their federal counterparts. All our standard
errors are clustered at the state level in order to correct for both between-bank-within-state and
within-bank serial correlation in the error term.
Table 2 presents the results for composite CAMELS ratings and its subcomponents in a fixed-
effects regression. It shows that a dummy variable for the presence of a federal regulator as the
lead agency supervising the bank is positive and statistically significant. These results are
consistent across SMBs and NMBs (Table 2A, columns (1) through (4)), and across CAMELS
rating components, (Table 2B, columns (1) through (6)). Together they show that federal
regulators systematically assign higher CAMELS ratings to a bank. Moreover, while this pattern
is the same across all subcomponents, the difference is the largest for the component where the
potential for regulatory discretion is likely to be highest (management component, M). Recall
that higher CAMELS scores indicate worse assessments of the bank, implying that federal
regulators are unambiguously tougher than state regulators across all safety and soundness
components.
To gauge the economic magnitudes of our findings in the panel regressions presented in Table 2,
we need to account for the high persistence of the CAMELS ratings. CAMELS ratings do not
vary frequently for a bank, and rating changes likely incorporate substantial information. One
sensible approach is to compare our within-bank coefficient estimates around the rotation with
the within-bank standard deviation of the CAMELS rating (or its components) provided in the
tables. As can be observed from columns (1) and (2) in Table 2A, the effects are very large. In
particular, the effect of a switch from a state regulator to the Fed or to the FDIC is about a third
of the within-bank standard deviation. To streamline the presentation of the results we pool
federal regulators together in subsequent analysis. The magnitudes when combining the federal
regulators together are similar—column (3) shows that the effect of a switch from a state
regulator to a federal regulator is about a third of the within-bank standard deviation.
It is worth emphasizing that our results remain largely unchanged even after we condition on
bank balance sheet variables like ROA, Assets and Tier 1 capital ratio (in column 4). This

17
provides validation for our identification design where we asserted that the assignment of
regulators is governed by a predetermined policy instrument, independent of the banks’ financial
condition. Our results are also robust to a number of other tests, such as sub-sampling and
removing outliers, and are unreported for brevity.
There is another, more intuitive, way of displaying the magnitudes of the results in Table 2 in the
form of raw frequencies of changes in CAMELS ratings around the rotation. In other words,
conditional on observing a change in the CAMELS rating—equal to one notch in magnitude in
our data—we can ask which agency is more likely to downgrade (i.e., report a CAMELS
increase) or upgrade (i.e., report a CAMELS drop). The results of this simple tabulation exercise
are reported in Table 3 for both SMBs and NMBs as well as for all banks together. The
difference between state and federal regulators is striking. Both Fed and FDIC are about twice as
likely than their state counterparts to downgrade a commercial bank. For SMBs, 73% of the
downgrades originate from the Fed and only 27% from the state regulator. For NMBs, 60%
percent of the downgrades originate from the FDIC and only 40% from the state regulator. When
considering all the banks in our sample together, we find that 62% of the downgrades originate
from the federal regulator and only 38% from the state regulator. These patterns are accentuated
when we restrict attention to harsher downgrades (i.e., include banks whose CAMELS ratings
increase to 3, 4 or 5) since we now find that 69% of downgrades are originated by federal
regulators.
Notably, the Fed and the FDIC are also less likely to upgrade relative to the average state
regulator (only 35% of SMB upgrades are Fed-originated and only 46% of NMB upgrades are
FDIC-originated). When considering all the banks in our sample together, we find that only 45%
of the upgrades originate from the federal regulator. Thus, the federal regulators are
systematically and unambiguously more stringent than their state counterparts. In addition, state
regulators appear to counteract some of the federal regulator stringency by upgrading more
frequently.
We showed in Table 2 that CAMELS ratings are higher (worse) in federal spells relative to state
ones. Moreover, in Table 3 we found that federal regulators are systematically more likely to
downgrade, while state regulators have a higher tendency to upgrade. We put all these results
together in Figure 4. Specifically, we compute the within-bank cumulative change in the rating
following the most recent examination as well as future exams in the bank's life cycle. We do
this exercise for each bank and exam in our sample. The figure displays the average within-bank
rating evolution when conditioning the first rotation to be a federal spell (red line) or without any
conditioning (green line). The gray vertical bars indicate regulatory spells involving federal-led
exams.

18
As shown by the green line, the average rating increases by about a quarter of a point from the
first to the eighth rotation in a bank life cycle (or about 8 to 12 years, depending on the size of
the bank). As shown by the red line, downgrades occur in federal spells on average, while
upgrades occur in state spells. Because of the alternation between federal and state regulators,
and given the systematic difference in how these regulators rate the banks, implies that the
cumulative rating evolves over time in a saw-tooth pattern. Of course, this is only an average
effect and not necessarily patterns that are realized in every bank. Indeed, from Table 3, the
standard deviation of a rating's change is about one, which implies that following the first exam,
federal regulators are about 7% more likely to downgrade a bank, while state regulators are about
5% more likely to upgrade in the following exam.20
4.2 Do Supervisors Affect Bank Behavior?
In this section we examine if, on average, banks operations respond to the presence of a federal
regulator relative to a state one. One may reasonably conjecture that, in addition to imposing
stricter ratings, federal regulators may impose more stringent capital allocations—that is, higher
capital imposition (such as higher Tier1 RBCR)—and better governance—that is, explicit
booking of past delinquent and nonperforming loans, all at the expense of returns (i.e., resulting
in lower ROA and higher expense ratio).21 We employ information from Call Reports to
formally test this proposition along three main dimensions of bank operations: regulatory capital,
profitability, and asset quality.
Our specification mirrors equation (6), with the dependent variables being bank balance sheet
variables rather than CAMELS ratings. As shown in Figure 2, we define a supervisory spell as
the quarters between when a regulator conducts its on-site examination and when the alternate
regulator examines the bank. Once the regulator in charge gives the CAMELS rating, it remains
fixed across quarters in a supervisor spell. In contrast, bank variables can potentially change
every quarter. Thus, our specification now identifies the average value of a variable across
quarters during a federal regulator spell to its average across quarters during a state regulator
spell.
Table 4 reports empirical evidence that bank behavior is affected in ways consistent with the
earlier conjecture. The rotation from a state regulator to a federal regulator unambiguously
produces an increase in Tier1 RBCR and the regulatory leverage ratio (defined as Tier1 capital 20 To see this, note that we present cumulated CAMELS change from date 0. This change in at 0.07 at t =1 (first Fed) and 0.02 at t=2 (first State). Under the assumption that when a change occurs it is one notch, which is what Table 3 tells us, the change in cumulated mean equals the difference in probability of downgrades minus the upgrades in every spell (recall, higher CAMELS implies downgrades). Thus, on average the Fed is more likely to downgrade a bank with about 7% probability after its first exam. Because the cumulative CAMELS are about 0.02 at during the subsequent state spell, it implies that, on average, CAMELS went down about 0.05 during the state spell. Thus, state regulator must have upgraded on net about 5% of the times. 21 There is a large literature that documents bank discretion in booking losses on its loan portfolio and the factors that influence such behavior. For instance, see Caballero, Hoshi, and Kashyap (2008) for Japanese banks and Kane (1989) and Kroszner and Strahan (1996) for U.S. banks.

19
divided by total risk-unweighted assets). In addition, we find that relative to state spells, federal
regulatory spells see a drop in ROA and an increase in delinquent and nonperforming loans
booked by the depository institution. Consistent with the lower ROA, we also find the expense
ratio, measured as non interest expense over net operating revenues, to be higher in federal
regulator spells. This suggests that during federal regulator spells banks may be more likely to
undertake costly adjustments such as increasing their loan loss provisioning. These results are
consistent with federal regulators enforcing formal or informal corrective actions for problems
that emerge during their examinations. Interestingly, we find no change in loan growth which
suggests that vis-à-vis state regulators, more-stringent federal regulators do not appear to limit
credit supply. The economic magnitudes of the estimates that are statistically significant range
between 3% and 5% of a within-bank standard deviation per extra quarter of federal regulator
oversight.22 These magnitudes appear reasonable, especially given the short time interval
available to banks between rotation spells.
It is, of course, also possible that the effects we find are biased estimates of the true effect of
federal regulators on bank behavior. The reason is the nearly deterministic nature of the rotation
rule, which may allow banks to preemptively respond by “window-dressing” for federal
regulators. To formally see how expectation of future rotation may influence the estimates in
Table 4, consider a simple example. Here, only the identity of the current regulator and the
identity of the regulator in the following examination cycle matter for how bank variable might
change. In particular, let us alter equation (5) to:
, (5')
where the prime represents the next supervisory spell when the new regulator takes over. This
clearly imposes a dynamic structure not captured earlier. Making use of the condition 1, the behavioral response by the bank becomes:
.
Thus, regressing observed bank behavioral variables b on the current regulator’s identity s could
produce biased estimates of the structural parameter of interest x. In the context of our analysis,
this argument would imply that anticipation of future supervisory spell of a tougher regulator
may generate a response from the bank during the current supervisory spell of the lenient
regulator. This could produce downward-biased estimates of the true effect of federal regulators
on bank behavior in Table 4. Of course, this is only one side of the story. While the presence of a
22 We further analyze the nature of a bank’s asset portfolio and components of ROA that are affected by the stricter governance imposed by federal regulators. In particular, we analyzed the nature of delinquencies and nonperforming loans when we break the loan portfolios of banks into real estate loans—commercial and residential—and commercial and industrial loans (C&I). We find that the change in delinquency and nonperforming loans documented in Table 4 is driven mainly by a change in real estate loans (both commercial and residential), while there is only limited variation in C&I loan quality around rotations. In addition, we also examine the components of ROA that contribute to its change in Table 4. We find that increases in the provision for loan loss and non-interest expenses (with salaries being the largest component) largely contribute to this change.
20
tougher regulator may incentivize banks to potentially do window dressing, it may also be hard
to do so, given the time span between regulatory spells is short. Thus, the real extent to which
such window dressing may occur is an empirical question.
In terms of empirical analysis there are two broad ways to proceed. One alternative is to rely on
strong structural assumptions of the type (5') and consistently estimate the structural parameters
(x and c in this case), assuming that the model is correct. It is difficult, however, to find explicit
guidance on the exact nature of the dynamic response of a bank to future supervision, making
results from this exercise model-dependent. An alternative approach, and the one we follow, is to
limit the interpretation of the estimated coefficient on s in equation (5) to the reduced-form
equilibrium effect of the underlying dynamic model and to recognize that we are focusing on a
reduced-form effect, such as x-c, and not on x directly.
Having said that, one can explore the dynamics of potential window dressing around regulator
rotations.23 We find some evidence that is consistent with banks changing their balance sheet
variables in anticipation of a federal regulator. In particular, expense ratio, ROA and non-
performing loans start adjusting in the two quarters before federal regulators arrive for the
exams. There is limited evidence for such behavior on the capital variables. For brevity, we only
discuss these findings without reporting them but note that the nature of these results is
qualitatively similar to those reported in Table 8 of the earlier working version of this paper. As
was discussed before, to the extent that we find some evidence for window-dressing by banks in
anticipation of tougher federal regulators, there is a bias generated against finding any
differences in ratings across the two types of regulators. Thus, our estimates on differences in
ratings between federal and state regulators can be considered a lower bound of the true effect
without such window dressing.
5. Assessing Costs and Benefits of Inconsistent Regulation
We have so far shown that the two types of regulators rate the same bank differently. It is not the
case that one regulator is tougher sometimes and the other regulator is tougher at other times.
Rather, the difference in how they assess a bank and provide their ratings is systematic. Given
the nature of our empirical design, it is statistically implausible that these patterns occur because
the federal regulator is more likely to confront banks precisely when they are not doing well.
However, based on our evidence so far, it is difficult to assess whether federal regulators are
being too tough, thereby imposing some additional costs on the banks, or whether state
regulators are being too lenient, thus delaying implementation of corrective regulatory actions. In
this section we attempt to address this issue. We also discuss whether more lenient behavior
23 We re-estimated specification (6) that includes, as before, a dummy indicator equal to 1 if the lead agency in the (current) quarter t is federal and 0 otherwise. It also includes two additional indicator variables: one that takes a value of 1 if a federal supervisor replaces the current state supervisor at quarter t+1 (and 0 otherwise) and another that takes a value of 1 if a federal supervisor replaces the current state supervisor at t+2 (and 0 otherwise). The coefficients on these additional dummies help capture anticipatory actions on the part of the bank.

21
displayed by state regulators—their lower willingness to initiate downgrades and higher
willingness to initiate upgrades—can be interpreted as a desirable feature.
5.1 Does State Regulator Leniency Have Consequences? In this section we explore the correlation between the strictness of federal regulators relative to
their state counterparts—henceforth, the “federal-state spread”—and various outcome variables
at the state level measuring either costs or benefits of regulatory strictness such as bank failures
and bank lending volume. We start by illustrating that there are significant regional differences
in the federal-state spreads, and therefore a lot to learn by exploiting this variation.
To this end, we extend specification (6) and instead of a single federal-state dummy Sit, which
compares federal regulators with the average state regulator, we estimate fifty different federal-
state contrasts. Figure 5 reports the coefficients on the state dummy variables interactions for the
federal regulators with their 5% confidence intervals. In this figure we plot a dashed line that
illustrates the average state behavior under a specification analogous to column (3) of Table 2A.
It shows that the estimated effects are overwhelmingly above zero for a majority of states—that
is, the federal regulators systematically assign higher CAMELS than specific states' regulators.
However, there is substantial heterogeneity in laxity of state regulators relative to federal
regulators across states—certain states appear less lenient than others—and it is this
heterogeneity we want to understand in our subsequent analysis.24
In Table 5, we study the possible costs and benefits of inconsistent regulation by assessing the
relation between the federal-state spread and bank failures in a given state. Previous research
suggests that such failures hamper the proper functioning of the financial system and can stall
real economic activity (Calomiris and Gorton 1991).25 It is not immediately obvious whether the
relative leniency of a state regulator would manifest itself in a higher bank failure rate in that
state. On the one hand, even if state regulators are lenient, corrective actions by federal
regulators could improve the health of a bank and reduce its chances of failure. On the other
hand, it might be the case that state regulatory laxity slows down corrective actions by the
federal regulators, thereby increasing the chances of a bank failing in that state.
Table 5A presents the results using the baseline specification of Table 2A with composite
CAMELS rating as the dependent variable. In column (1), we augment that specification by
24 Note that this analysis allows us to exclude the possibility that our results in Table 2 may have be driven by a specific subset of states. We also examined the heterogeneity within federal regulators by following an analogous procedure. Both Fed and FDIC prudential supervision activities are in fact organized by geographical divisions—specifically, by twelve regional Federal Reserve Districts and eight FDIC Regions. The specification in this case compared each federal regulator in its different regional districts against the “average” state regulator in that regional jurisdiction. No particular regional district appears to be driving our results (unreported for brevity). 25 While bank failures are an important element in banking supervision and are frequently discussed in the context of banking crises, policy makers also want to ensure that harsh reserve requirements--which would reduce the frequency of such crises--do not end up hampering allocation of credit in the economy.
22
including the interaction of a dummy that indicates federal regulator presence with Failure Rate,
a variable that measures the bank failure rate in the same state as the bank under consideration.
We compute the state-level bank failure rates over our sample period. As can be observed, the
level term is significant, as before, suggesting that federal regulators are stricter than state
regulators. Importantly, we also find that the federal-state spread is larger in states with high
bank-failure rates. In other words, states where bank-failure rates are high are also those where
state regulators appear less willing to apply strict ratings relative to their federal counterparts.
The economic magnitudes suggested by the coefficients are large—a one-standard-deviation
movement in the bank failures in a given state is associated with about a 40% increase in the
federal-state spread in ratings.
In the next column, we repeat this exercise, replacing bank failure rates with the problem-bank
rates. Problem banks capture a wider set of banks, considered by regulators to be in severe
financial distress. Problem bank status is also highly predictive of subsequent failure or other
restructuring under distress.26 Because actual bank failures are rare, policy makers and regulators
frequently rely on problem bank rates to gauge the condition of the banking system in a region.
In column (2), we re-estimate the regression, including the interaction of a dummy that indicates
federal regulator presence with Problem Bank Rate, a variable that measures the problem-bank
failure rate in the same state as the bank under consideration. The results are qualitatively similar
to those in the first column and show that a one-standard-deviation movement in the bank
failures in a given state is associated with about a 65% increase in the federal-state spread in
ratings.
Next, we conduct this exercise using another measure that might capture costs of regulatory
ineffectiveness. We construct a measure called TARP repayment that is the percentage of TARP
bailout funds that commercial banks in a given state had returned as of September 2012. The
notion behind this variable is that difficulty in repaying out TARP funds—which were injected
into the financial system to boost the banking sectors' capitalization levels —may be indicative
of the weakness of banks in a given state. Note that in contrast to the variables in the first two
columns, this variable contains some information outside our sample period. Column (3) presents
results of the baseline CAMELS regression including the interaction of a dummy that indicates
federal regulator presence with TARP Repayment, which measures the TARP funds that were
repaid back across all banks in the same state as the bank under consideration. The federal-state
spread is larger in states with a low TARP repayment rate. In other words, state regulators appear
less willing to apply strict ratings relative to their federal counterparts in states where banks
subsequently faced more difficulty in repaying TARP funds.
26 Problem banks are identified using the criterion employed by regulators—that is, banks that have composite CAMELS ratings of 4 and 5, as defined in the FDIC problem bank list.

23
Finally, in column (4) we construct another measure to capture the potential costs of delayed
regulatory actions. The measure, called Asset Sale Discount, represents the discount on sale of
assets such as loans when FDIC liquidates or restructures troubled deposit-taking financial
institutions. A larger discount potentially captures delayed intervention by regulators, which
could result in reduced value of sold assets on account of fire sales.27 We calculate the discount
in a given state based on the difference between book value of all the assets sold in that state
relative to the sale value of the same assets across the sample period. Column (4) presents
estimates of the baseline CAMELS regression, including the interaction of a dummy that
indicates federal regulator presence with the Asset Sale Discount in the same state as the bank
under consideration. As is evident, the federal-state spread is larger in states with a high discount
on asset sales. In other words, states where bank assets were sold at high discounts relative to
their book value were also ones where state regulators appeared less willing to apply strict
ratings relative to their federal counterparts. In column (5), we present a multivariate version
where we include all the interaction terms together. The qualitative inferences presented earlier
remain unchanged.
Concerning the costs of regulator stringency, it is worth reiterating that we have already
assessed, in a setting similar to Table 5A, if excessive regulatory stringency on the part of federal
regulators is associated with reduction in the credit supply in the economy. As was shown in
column (7) of Table 4, there is no relationship between supervisor identity and a bank’s growth
of new loans. Thus, excessive regulatory stringency by federal regulators is not associated with
reduction in the credit supply in the economy, at least in the short run.
So far we have assessed the relationship between the federal-state spread and various outcome
variables contemporaneously. We now sharpen our analysis by exploring whether the
relationship between the federal-state spread in a given bank and its subsequent performance
holds in a predictive sense. We conduct such an exercise in Table 5B by predicting whether a
given bank becomes a problem bank in a given quarter based on the average degree of
inconsistency between regulator ratings in the past. We focus on problem bank status because of
the limited number of actual bank failure occurrence in the sample. This specification intends to
capture scenarios where a large difference between federal and state ratings for a given bank
results in delayed intervention at the bank level, with the latter proxied by the given bank
becoming a problem-bank. The explanatory variable, Lagged Mean Difference, is the lagged
average difference between federal regulator and state regulator rating for a given bank. In
constructing this variable, we use information from the time a given bank appears in our sample
until the quarter before which we are trying to predict whether a bank becomes a problem bank
or not. As can be observed from column (1), it is indeed the case that banks where federal and 27 This notion behind using this measure and test is similar to the WaMu example we discussed in the introduction. In particular, delayed regulatory intervention was considered to be one important factor that led to a large discount on the value at which the assets of WaMu were eventually sold relative to what policy makers believed was the true value of these assets (reflected somewhat in the book value of assets).
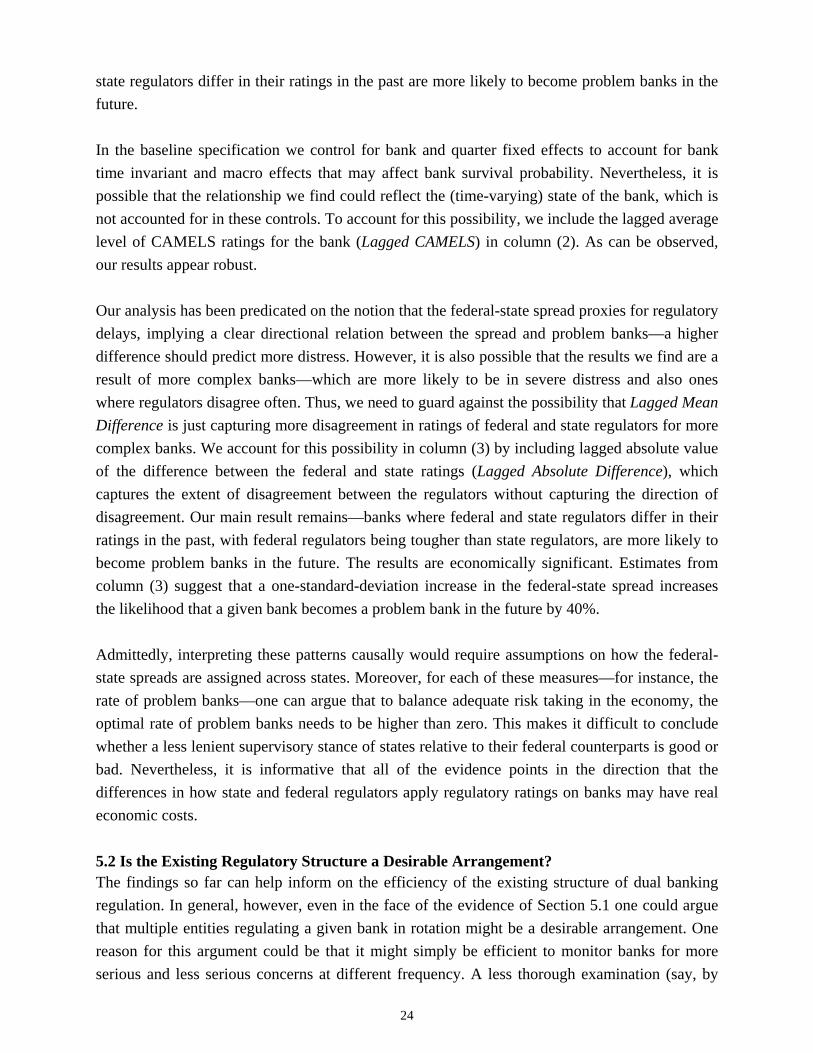
24
state regulators differ in their ratings in the past are more likely to become problem banks in the
future.
In the baseline specification we control for bank and quarter fixed effects to account for bank
time invariant and macro effects that may affect bank survival probability. Nevertheless, it is
possible that the relationship we find could reflect the (time-varying) state of the bank, which is
not accounted for in these controls. To account for this possibility, we include the lagged average
level of CAMELS ratings for the bank (Lagged CAMELS) in column (2). As can be observed,
our results appear robust.
Our analysis has been predicated on the notion that the federal-state spread proxies for regulatory
delays, implying a clear directional relation between the spread and problem banks—a higher
difference should predict more distress. However, it is also possible that the results we find are a
result of more complex banks—which are more likely to be in severe distress and also ones
where regulators disagree often. Thus, we need to guard against the possibility that Lagged Mean
Difference is just capturing more disagreement in ratings of federal and state regulators for more
complex banks. We account for this possibility in column (3) by including lagged absolute value
of the difference between the federal and state ratings (Lagged Absolute Difference), which
captures the extent of disagreement between the regulators without capturing the direction of
disagreement. Our main result remains—banks where federal and state regulators differ in their
ratings in the past, with federal regulators being tougher than state regulators, are more likely to
become problem banks in the future. The results are economically significant. Estimates from
column (3) suggest that a one-standard-deviation increase in the federal-state spread increases
the likelihood that a given bank becomes a problem bank in the future by 40%.
Admittedly, interpreting these patterns causally would require assumptions on how the federal-
state spreads are assigned across states. Moreover, for each of these measures—for instance, the
rate of problem banks—one can argue that to balance adequate risk taking in the economy, the
optimal rate of problem banks needs to be higher than zero. This makes it difficult to conclude
whether a less lenient supervisory stance of states relative to their federal counterparts is good or
bad. Nevertheless, it is informative that all of the evidence points in the direction that the
differences in how state and federal regulators apply regulatory ratings on banks may have real
economic costs.
5.2 Is the Existing Regulatory Structure a Desirable Arrangement? The findings so far can help inform on the efficiency of the existing structure of dual banking
regulation. In general, however, even in the face of the evidence of Section 5.1 one could argue
that multiple entities regulating a given bank in rotation might be a desirable arrangement. One
reason for this argument could be that it might simply be efficient to monitor banks for more
serious and less serious concerns at different frequency. A less thorough examination (say, by

25
state regulators) alternating with a more thorough one (by federal regulators) could likely capture
the majority of relevant concerns every period without the need of constantly focusing on minor
concerns that might arise only under thorough scrutiny. This arrangement could save supervisory
costs and be nearly as effective as having competent regulators examine banks at all times.
Alternatively, it might be the case that federal and state regulators have an implicit “good
cop/bad cop” arrangement allowing for richer information gathering from banks— federal
regulators’ toughness allows for better information to be gathered by state regulators, which in
turn potentially allows for better implementation of regulation.28
On balance the collage of evidence in Section 5.1 suggests that leniency of state regulators relative
to their federal counterparts is related to costly consequences and likely proxies for delayed
corrective actions. This evidence indicates that, both these rationales, although intriguing, are
unlikely to be driving our findings. There are several additional pieces of evidence that reinforce
this conclusion.
First, our analysis in Section 4 provides evidence that the first rationale is not likely. In
particular, we note that Figure 4 shows that while federal regulators are significantly tougher
than state regulators, there is also a counteraction of these downgrades by state regulators who
are more likely to upgrade. This is hard to rationalize as an efficient arrangement involving a
more thorough regulator examining banks infrequently, since in this setting the less thorough
regulator would be unlikely to actively undo decisions of the more through regulator. Moreover,
as we will show in Section 6, the extent of leniency of state regulators relative to federal
regulators accentuates when banks confront adverse local economic conditions. This is hard to
rationalize by the potential efficient arrangements as well. Such an arrangement is not likely to
have a less thorough regulator supervising banks when this regulator is at its most lenient self
and when the banking system needs thorough supervision the most. Moreover, it is also hard to
envision reasonable theoretical arguments for this arrangement where regulatory inconsistencies
would accentuate precisely at a time when the banking system likely needs consistent
supervision.
Second, we are able to provide more evidence that supports our conclusion that the second
rationale is not driving our findings either. In particular, we examine the change in regulatory
behavior around the passage of the Riegle Act of 1994. At the introduction of the rotation policy,
a bank moves from having simultaneous federal and state oversight every period to having
federal and state oversight in alternation. This setting allows us to assess if the alternation
arrangement is as effective as having the tougher, more competent, regulator examine the bank at
all times. In particular, we can trace the changes in regulatory outcomes and bank behavior
28 It is worth reiterating that, as discussed in detail in footnote 6, the good-cop bad cop scenario is unlikely given that the Riegle Act was predominantly motivated by red tape reduction. Nevertheless, to be comprehensive, we entertain this alternative in our discussion and in interpreting our evidence.

26
resulting from the change in regulatory structure. The assumption that is needed when making
this comparison is that when a bank is supervised by both regulators concurrently in the period
before the Riegle Act, the supervision philosophy of the more stringent regulator must dominate.
This assertion is plausible, since in its absence banks would systematically fail examinations by
the stricter regulator, a pattern we do not observe in the data. Under this assumption, the period
around the passage of the Act provides us a setting where a bank moves from having a yearly on-
site examination by the federal regulator to having the federal exam every two years.
Table 5C presents results that evaluate changes in supervisory ratings and bank balance sheet
variables around the regulatory regime change using a difference-in-differences strategy. We
track these outcomes for eight quarters before and after the first rotation following the Riegle
Act.29 The treatment group is composed of state-chartered banks that undergo a change from
simultaneous federal and state oversight to an alternate federal and state oversight. The control
group consists of national banks and thrifts regulated by the OCC and the OTS. These banks
provide a reasonable control group because there was no major change in the structure of their
regulation around the time period of our analysis. However, because national banks are large in
size, we need to make sure that we focus on control banks that are as similar as possible to banks
in the treatment group. We do so by selecting banks in the control group using propensity score
matching. In particular, we construct the nearest neighbor-matched sample of OCC- and OTS-
regulated banks based on the Mahalanobis distance metric. This approach employs a large set of
matching covariates, including bank size, in the eight quarters in the pre-treatment period.30
Thus, the difference-in-differences estimator we employ compares a state-chartered bank before
and after the start of the rotation to its closest match among thrifts and national banks around the
same event.
Our results show that, relative to the control group, state-chartered banks enjoy lower (i.e.,
better) CAMELS ratings after state and federal regulators begin rotating. The treatment banks
marginally reduce their equity relative to assets, enjoy lower red-tape costs as measured by the
lower expense ratio, and have marginally higher ROAs. State-chartered banks also display a
reduction of the share of NPL and delinquencies reported in their balance sheets. Quantitatively,
29 One comment about how we identified the event date is worth discussing. While a fraction of rotations between federal and state regulators for state-chartered banks start after the passage of the Riegle Act of 1994, there is a set of banks that were already undergoing alternate regulatory oversight before 1994. The reason for this alternation is ad hoc agreements between the federal and specific state regulators before the Riegle Act that allowed for rotation. Thus, we cannot rely on a single event date for the treatment in our analysis. Instead we identify the start of the rotation regime from the data, where the start of the alternation is always clearly detectable. We note, however, that we did not encounter any systematic correlation with the type of banks that started rotating before 1994, suggesting that idiosyncratic reasons were likely behind the differential initiation of the rotations. 30 The covariates include including assets, liabilities, equity, and lagged CAMELS scores. Clearly, national banks and thrifts are, on average, very different from state banks. However, the national bank and thrift sample is sufficiently deep that matching a state bank on these covariates is very accurate.
27
the point estimates as well as the direction of the coefficients compares well with those in Table
2A and Table 4 and are generally larger in magnitude.31
This analysis demonstrates that while the alternation arrangement may have saved regulatory
costs for supervisors and banks, it results in a more lenient regulatory regime when compared
with a regime where a tougher, more thorough, regulator examines the bank at all times. As we
have showed earlier in this section, such leniency in supervision seems to have, on balance, real
costs and consequences. In Section 7 we discuss some of the lessons that emerge from this
analysis for the on-going regulatory reform in the EU banking.32
6. Why Do Differences Exist Between Regulators?
Our findings so far have highlighted significant differences in the behavior of state versus federal
regulators and provided evidence that suggests that there may be costs to such behavior. We
have, however, been silent on why differences between state and federal regulators exist in the
first place. In this section we exploit the significant regional heterogeneity and time-series
variation in this behavior to shed light on this issue.
There are several broad factors that may drive a wedge between the behavior of state regulators
and federal regulators. First, it might be the case that state regulators care more about the local
economy—for instance, to preserve jobs both in banking and in the real economy—and as a
result do not want to crack down on banks, especially at times of harsh economic conditions.
Second, it might simply be the case that state regulators are more lax in rating banks because
they lack resources—financial as well as human capital—to implement the regulation. Finally,
state regulators might be lenient because they may be captured, à la Stigler (1971) and Peltzman
(1976), by the banks they supervise. To streamline our discussion we follow the framework of
Shleifer (1996) and refer to these potential reasons for lenient state regulator behavior as
31 Note that the signs in this table are inverted relative to analysis in Tables 2A and Table 4. The reason is that our earlier analysis compared the changes in supervisory and bank outcomes when moving from a (lenient) state regulator to (tougher) federal regulator. In contrast, the analysis in Table 5C, we move from complete federal oversight (tougher) to more lenient oversight with federal regulator supervising the bank only “half” the time. Incidentally, this analysis provides external validation to our findings in Table 2A. The reason is that the variation employed here is different from the quasi-experiment used for identification in Section 4. Yet, we still find that ratings are tougher in a regime when federal regulators supervise the banks all the time relative to a regime where they face dilution of control due to the presence of more lenient local regulators. 32 A final comment regarding the potential “good cop/bad cop” arrangement between federal and state regulators is worth making. Note that the informational gains due to such an arrangement should not hinge specifically on a rotation of good cop with a bad one, but rather should depend on the presence of two types of monitors (a tough and soft one). Recall, though, that at the introduction of the rotation policy around the passage of the Riegle Act of 1994, a state chartered bank moves from having simultaneous federal and state oversight every period to having federal and state oversight in alternation. In other words, the good and bad cop are present both before and after the Riegle Act. Hence, there is no particular reason to think that whatever informational benefits were available after the Riegle Act because of a “good cop/bad cop” rationale were not already present before the act. Thus, our analysis would suggest that, while the informational benefits from the “good cop/bad cop” arrangement did not change significantly around the Riegle Act of 1994, the costs in terms of supervisory laxity widened.

28
“control”, “confusion”, and “corruption.” We now present empirical evidence to explore which
of these plausible alternatives best explains the patterns observed in the data.
Control
We start our analysis by examining if state regulators are softer relative to federal regulators
because they care more about local economy than their federal counterparts. We test this
alternative by exploring if the federal-state spread is accentuated when the local economy is
doing poorly, since these are instances when motives, such as preserving jobs in banking or in
the real economy, should become more important. In particular, state regulators might be softer
on banks during harsh economic times since increased likelihood of a bank closure (or a merger
with a bigger out-of-state bank) may follow higher CAMELS ratings of banks, which could
result in loss of local banking jobs and lending. In contrast, the federal regulators may care more
about systemic stability than about the location of banking jobs or local credit availability.
Table 6A presents evidence from this analysis. We use the baseline CAMELS regression,
including the interaction of a dummy that indicates federal regulator presence with a variable that
captures the state of the local economy. We consider two such variables. The first variable,
employed in columns (1) and (3), is the seasonally adjusted unemployment rate in the state of the
bank under consideration (Local UR). The other variable, used in columns (2) and (3), is the
annual house price growth rate based on the state house price index of the bank under
consideration (Local HPI). In what follows, all controls are standardized, so that the coefficients
indicate the economic impact of one standard deviation increase in the controls.
The estimate on the federal regulator presence dummy variable is positive, which is consistent
with our earlier evidence and suggests that, on average, federal regulators are tougher than state
regulators. More importantly for the purpose of testing the “control” hypothesis, we find that the
interaction term for unemployment rate is positive, while the interaction term for house price
growth is negative. This suggests that the federal-state spread is larger in states where the local
economy is doing poorly. These are economically large magnitudes. In particular, the estimates
in column (3) suggest that, all else equal, a one-standard-deviation increase in local
unemployment results in the state regulators being more lenient relative to their federal
counterparts by around 50%. Similarly, all else equal, a one-standard-deviation decline in local
house price growth results in the state regulators being more lenient relative to federal regulators
by around 20%.
These results reveal that state regulators are more likely to be soft on the banks in their
jurisdiction when the local economy is doing poorly. Given that such periods may require
tougher actions by regulators, the state-chartered regulatory system might be delaying timely
intervention at critical junctures, as local regulators may find it ex post more costly to

29
implement such actions in harsh economic times. We revert to these results when we discuss the
implications of our findings for optimal regulatory design in Section 7.
Confusion
Next, we assess if the softer ratings by state examiners could be due to lack of resources—
financial or human capital—involved in implementing the regulation. It is not immediately
obvious that lack of resources related to supervision in a given state would imply that examiners
in that state are more lenient. For instance, lack of resources in a given state could result in more
noisy, but unbiased, ratings by regulators in that state relative to federal regulators. However, it
is certainly possible that examiners in states that invest less in supervisory resources, and
therefore were less likely to receive signals about the adverse quality of a bank, could be
systematically more lenient relative to their federal counterparts.
Table 6B follows our earlier approach and uses the baseline CAMELS regression, including the
interaction of a dummy that indicates federal regulator presence with a variable that captures
some aspect of the state regulatory system. In columns (1) and (3), we concentrate on four
aspects of each state's supervisory system that are related to resources that state employs in
supervision: (a) the state banking department budget relative to assets under supervision (Budget
Ratio); (b) the ratio of the number of commercial bank examiners relative to the number of
SMBs and NMBs in the state (# Examiner Ratio); (c) the percentage of the state department
budget spent in training the examiners (Training Ratio); and (d) the percentage of commercial
bank examiners with more than five years of experience (% Experienced Examiner). All
information on these variables is obtained from the biannual Profile of State Bank Supervisors
(Conference of State Bank Supervisors) spanning our sample period.
The results show that states with higher expenditure on staff training display less lenient
behavior relative to federal regulators (i.e., state and federal regulators behave more similarly).
This result is consistent with the notion that financial resources invested by a state in training its
examiners are reflected in how the examiners rate the banks. In addition, states with a higher
share of experienced examiners appear less lenient relative to their federal regulators. We
interpret this result as suggesting that teams with a higher number of experienced examiners are
better able to understand bank operations.33 We find no systematic relation between leniency of
state regulators relative to federal counterparts and the number of examiners per bank or the
banking department budget per dollar of assets supervised in that state.
33 This result could also be interpreted as being inconsistent with the "revolving-door" hypothesis—the notion that regulators might be soft on entities they regulate in hope for future career opportunities in such entities. Under the revolving-door argument one would expect more experienced examiners—ones who are more likely to garner future career opportunities at regulated entities—to be more lenient. However, as discussed, we do not find this to be the case. We will discuss this hypothesis in detail when we explore the "corruption" alternative later in this section.

30
In columns (2) and (3), we employ information from alternative sources to construct a measure
that captures the quality of examiners in a given state regulatory agency. We construct this
measure by using information on the career path of state examiners, with the subsequent move
into the private financial sector signifying potentially higher quality of that examiner. To obtain
this information we extract all the curricula vitae (CVs) of individuals who worked as state
examiners during our sample period that are available on the networking website. We then use
these CVs to assess if state examiners subsequently progressed into the private financial sector.
Using this information, we construct a measure Turnover that captures the proportion of
examiners in a given state who were able to find a subsequent job in the financial sector.
Appendix 1 outlines the detailed procedure employed to extract, clean, and construct this
measure. The quality of examiners significantly impacts the leniency of state regulators relative
to their federal counterparts. Specifically, states where examiners are not as mobile into the
financial sector—indicating worse quality of examiners—are also more lenient on banks.
Overall, the results in this section suggest that lack of financial and human resources might be
resulting in more lenient state regulators relative to federal ones. The economic magnitudes of
the finding are large, though smaller than what we obtained when we tested the “control”
alternative. For instance, a one-standard-deviation increase in the quality of examiners, as
measured by Turnover, results in the state regulators being softer than their federal counterparts
by around 25%. Similarly, a one-standard-deviation decrease in expenditure on staff training
display would result in 10% more lenient behavior of state regulators relative to federal
regulators.
Corruption
We now evaluate whether state regulators might be softer on banks because they are potentially
corrupt or captured by banks. In Table 6C, we employ the baseline CAMELS specification
including the interaction of a dummy that indicates federal regulator presence with variables that
proxy for the potential influence of special interest groups on regulators. We start by considering
different measures of corruption and institutional quality that have been used in the previous
literature. In particular, in columns (1) and (3) we use: (a) the measure of Glaeser and Saks
(2006), which employs the federal convictions of government officials for corrupt practices to
capture the propensity for misconduct in various states in the United States (Corruption
Measure); (b) a state ranking of integrity created by the Better Government Association, which
takes into account freedom of information laws, whistleblower protection laws, campaign
finance laws, gifts, trips and honoraria laws, and conflict of interest laws (Integrity Rank); (c) a
state's institutional quality score from Karabegovic and McMahon (2005), which is based on
how secure property rights are, how fair and balanced its judicial system is, how strong contract
enforcement is, and how effective are the limits on government's ability to transfer wealth
through taxation and regulation (Institutional Quality); and (d) the average state and local
expenditures per capita (Expenditure per capita), with Glaeser and Saks arguing that states with

31
poorer fiscal policy, and therefore higher expenditures compared with revenues, may have
environments that are conducive to corrupt practices.
The results in columns (1) and (3) show that a state's corruption index, its integrity rank, and its
institutional quality do not correlate with how lenient the state's examiners are relative to federal
regulators. There is some evidence that states with poorer fiscal policy tend to have more lenient
state bank regulators, though it is hard to conclude from this result that such states are more
captured. In addition, in unreported tests we also experimented with other measures of corruption
that have been used in prior literature (e.g. average tax burden in a state, defined as total state tax
revenues as a percent of personal income). None of these measures explain variation in degree of
leniency of state examiners relative to federal regulators in our sample.
In columns (2) and (3), we employ additional measures related to the organizational design of
local regulators to explore the corruption alternative. First, we use information available from
CSBS to construct measures on the internal governance of banking regulators. Specifically, we
use information on how the funds available for banking regulators in a given state are allocated,
appropriated, and spent. In particular, the authority for these tasks may be shared between the
head of banking regulators in the state (the commissioner), the banking board, and/or determined
based on legislation and/or statutes. For each state we employ four dummy variables that take a
value of 1 if the authority is determined by the banking commissioner (Budget by
Commissioner), the banking board (Budget by Board), through statutes (Budget by Statute), or
legislation (Budget by Legislate) respectively.
Second, we assess the commonly discussed reason for leniency of regulators that relates to the
potential revolving doors between the regulators and entities they regulate. We capture the
possibility of this alternative by using the job turnover measure Turnover that, as explained
earlier, is the proportion of examiners in a given state who were able to find a subsequent job in
the financial sector. Finally, we construct two measures that are related to the organization
structure of the examination team. Here we are motivated by the literature that argues that there
should be a connection between centralized and hierarchical organizations and the extent of
corruption they promote (Shleifer and Vishny 1993). We proxy for the hierarchical structure of
local regulators by using standard measures of organizational span and depth. We construct these
by using information that we obtain from scraping the official websites of individual state
regulatory agencies. As explained in detail in Appendix 2, we use this source to construct top
management span of a state regulator's organization as the average number of examiners per
manager during our sample period (Organization Span). In addition, we construct a measure of
depth of a local regulator's organization as the number of layers between the top manager and the
examiner at the entry level (Organization Depth).

32
The results reveal that states where legislative agency is involved in governance of funds tend to
have more lenient state examiners. This may suggest potential pressure on regulators from banks
through the legislature. However, these effects are moderated in the presence of statutes as well
as a banking board. More importantly, when we consider all the variables together in column (3),
none of these effects survives. In addition, the results also refute the revolving-door hypothesis.
In particular, states with lenient regulators are not the ones where regulators are more likely to
find a career opportunity in the financial sector. Rather, these states had a lower turnover rate
into the financial sector. As explained earlier, this finding potentially supports the notion that
these states have examiners of worse quality. Last, there is some evidence that flatter
organizations — organizations with more top management span and less organization depth —
are less soft on banks. However, these effects are not statistically significant when considered
with other variables in column (3). Overall, the evidence in this section provides no support for
corruption of banking regulators per se as the economic force that drives meaningful
heterogeneity in leniency of state regulators relative to their federal counterparts.
Other Bank-Level Evidence
We end this section by discussing two additional factors that could also explain the behavior of
state regulators relative to federal ones. We discuss this evidence separately because, while
useful, these factors will not help separate the control, confusion, and corruption hypotheses. The
first factor we consider relates to the difference in the nature of payments across state and federal
regulators for their supervision activity. In particular, while states finance their prudential
supervision efforts through the use of assessment fees, the Fed and the FDIC are not funded
through assessment fees and receive no payment from member or nonmember banks for their on-
site examinations. It is worth noting that mere presence of fees for state regulators does not
immediately imply that there should be a leniency on the part of local regulators relative to
federal ones. In particular, reputational effects could provide a strong reason for state regulators
to care about the accuracy of their supervisory activity. Moreover, federal regulators carry out
other activities which interact with their supervisory role and, like fees for local supervisors,
could potentially make them lenient in their supervisory decisions relative to state regulators.34
We assess if such fees might be important in influencing the leniency of state regulators relative
to the federal ones. We do not have information on the exact fees collected by state regulators.
However, we assess if state regulators are more lenient toward larger banks since assessment
fees collected by state regulators for their supervisory activity are proportional to bank assets
(Blair and Kushmeider 2006).
34 See the Federal Reserve Chairmen (Bernanke, 2010; Greenspan, 1997), Peek, Rosengren and Tootell (1999) and White (2011) for discussion on impact of monetary policy decisions of the Fed and its supervisory activities and Goodhart 2001 for FDIC's role in setting premia on deposit insurance and its supervisory activity.

33
In column (1) of Table 6D we estimate the baseline CAMELS specification including the
interaction of a dummy that indicates federal regulator presence with the size of the bank being
supervised (Size). In addition, we also assess if there might be any leniency depending on how
large the lending portfolio of the bank is relative to its assets by including an interaction of the
dummy for federal regulator presence with the loans-to-assets ratio of the bank (Loans/Assets).
While state regulators on average are lenient relative to their federal counterparts, this leniency is
accentuated for larger banks. Specifically, the estimate on the interaction term suggests that,
relative to their federal counterparts, state regulators are lenient by about 30% more when
dealing with banks whose size is larger by one standard deviation. This finding is consistent with
the corruption hypothesis that we outlined earlier because big banks pay more fees to state
regulators.35 However, the evidence is also consistent with the control hypothesis, since big
banks employ and lend more in the aggregate. Moreover, because relocation and charter-
switching costs are largely fixed, large banks are also more likely to escape state regulator
jurisdictions, vis-à-vis smaller banks. Finally, this evidence is potentially consistent with the
confusion hypothesis, since big banks are also more complex entities to understand.
Next, we consider whether ownership of the bank by local constituents impacts its assessment by
state regulators relative to federal ones. In column (2), we use a specification similar to that used
in the first column, with the difference being that here we interact the federal agency indicator
with a dummy for whether the bank is publicly traded or privately held (Public). We find that the
difference in the federal-state spreads for CAMELS ratings is significantly smaller for publicly
traded entities than for private banks. This finding is consistent with the control hypothesis since
private banks are likely to be funded by constituents within state boundaries. However, this is not
the only explanation for these results. This evidence also supports the confusion hypothesis since
publicly traded banks might be easier to evaluate, given that other signals about their quality—
such as market prices, equity, and bond ratings—are available to regulators.
Overall, we find support for the control and confusion hypotheses as driving a large part of state
regulator behavior when compared with the federal ones. In particular, we find that state
regulators care about the local economy and as a result do not crack down on banks as much as
federal regulators. Notably, local unemployment has the largest economic effect when explaining
state regulator behavior across the various alternatives we explored. There is also significant
evidence that state regulators are softer in rating banks because they lack financial as well as
human capital to implement the regulation. Finally, we are able to show that there is no support
for the corruption hypothesis, which includes “revolving doors” as a reason for leniency of state
regulators.
35 Even if state regulators charge for exams, such resources may not be necessarily earmarked for bank supervision and may accrue to a general fund. However, state regulators may still care about the size and relevance of the entities overseen, for instance to justify budgetary and personnel appropriations.

34
7. Broader Applicability and Implications for Optimal Regulatory Design
7.1 How Broadly Applicable Are Our Findings? Analysis Including All Banks and Thrifts Our analysis so far makes inferences based on the quality of supervision under state and federal
regulators for state chartered banks. It is natural to ask how our inferences would change if we
were to include bank movements into and out of state charter. Moreover, we have not discussed
the external validity of our estimates—that is, how our results would apply to an average bank in
the economy. This analysis requires considering a wider sample of banks potentially facing a set
of regulators outside state charter (i.e. the OCC and the OTS). We now undertake this task.
We begin by considering the sample of all state and federally chartered banks and thrifts that are
available in the Fed’s NIC universe. In Table 7A we regress the CAMELS ratings for these
institutions on dummies indicating the identity of each regulator. As in our main regression
(Table 2A), state regulators are the omitted category, but federal regulators now also include the
OCC and OTS, which oversee federally chartered banks and thrifts, respectively. The
coefficients on Fed, FDIC, OCC, and OTS in the regressions represent the average rating of
these regulators relative to the average state regulator. As previously noted, banks can select into
different regulatory environments through their charter choice. Thus, the estimates on regulator
variables from this (naïve) regression may reflect differences in regulator behavior or
heterogeneity in the set of banks supervised by different regulators. We attempt to account for
some of this heterogeneity by including a variety of bank observables that measure a bank’s
regulatory capital adequacy, profitability, loan book quality, growth, and size. Specifically, we
include Tier1 and leverage ratios, ROA, expense ratio, delinquency and nonperforming loan
rates, loan growth, and the logarithm of assets. In addition, we also include bank and time fixed
effects. Bank fixed effects allow us to account for any time invariant bank specific factors that
may be driving certain type of banks into selecting a particular type of regulator. By focusing on
within-bank variation, bank fixed effects de facto identify the coefficients of regulator dummies
based on switches of the same bank in and out of a specific regulator’s jurisdiction. This would
typically be the case for the state chartered banks due to the rotation policy, but in our expanded
sample could also be driven, for instance, by national banks becoming thrifts or state chartered
banks becoming national banks. Time fixed effects account for the fact that regulators may be
supervising a different part of the bank universe at different points in time.
Column (1) presents regression estimates from a pooled regression that shows that CAMELS
ratings in exams by the Fed and the FDIC are once again higher (that is, worse) than exams by
state regulators. Interestingly, the ratings are also higher after OCC and OTS exams, indicating
that ratings assigned by federal regulators are higher than those given by state regulators in the
universe of all exams and all banking institutions. As mentioned earlier, this finding may indicate
that state banking departments tend to be more lenient than their federal counterparts. However,
it may also be the case that the pool of banks that state regulators face is simply different. Indeed,
while we account for bank observables in the regression, we find that the point estimates for the

35
Fed and the FDIC are larger than those in Table 2A. Given the tight identification used earlier,
the difference in estimates across federal and state regulators may partly reflect bank
heterogeneity.
Next, in columns (2) through (4), we exploit within-quarter and within-bank variation to make
the pooled analysis progressively more comparable to the one conducted in Table 2A. In
particular, note that the federal regulators we analyzed earlier (the Fed and the FDIC) still appear
to be tougher than state regulators. By column (4), which includes both bank and quarter fixed
effects, the magnitudes of the estimates of the strictness of the Fed and the FDIC relative to state
regulators are similar and statistically indistinguishable when compared to those in Table 2A
(discussed in Section 4.1). Notice that the difference between the sample used in this section and
that used in Section 4.1 is that here we allow the bank movements in and out of state charter (to
thrift or federal charter). This implies that the nature of unobservable factors that drive the bank
sorting decision into and from the state charter during our sample might be time-invariant. The
reason is that if such movements did depend on time-varying unobservable factors, the estimates
on the Fed and the FDIC would likely differ significantly between Table 2A and column (4) of
Table 7A because the latter would also reflect variation from charter switchers.36
This analysis offers an insight that is relevant for the literature on regulatory shopping and bank
sorting. Specifically, it shows that inclusion of bank and quarter fixed effects may be a sufficient
correction to account for charter shopping. Notably, this conclusion was possible only because
our earlier results provided a well-identified causal benchmark for the behavior of regulators
when faced with state-chartered banks.
Although our analysis suggests that selection of banks into and out of state charters is accounted
for by bank and quarter fixed effects, we have not discussed the external validity of our
estimates. In other words, how would our results apply to an average bank in the economy? This
is a difficult question to answer because it requires knowing how the quality of banks in the
state-chartered system—on both observables and unobservables—compares to the quality of an
average bank in the economy. The estimates we obtained in Table 2A could be lower for an
average bank in the economy, were it the case that weaker banks chose state charters. The reason
is that weaker banks would be more likely to be rated harshly by the tougher federal regulators—
thus accentuating the rating difference relative to what an average bank might receive. In
contrast, if weaker banks selected national charters, the estimates for an average bank in the
economy could be higher than what we found in Table 2A.
36 The coefficients on the OCC and OTS change with bank and quarter fixed effects and become insignificant. We are cautious in not making any conclusions based on these estimates since we do not have a benchmark, well identified, estimate similar to one in Table 2A that we can compare these results to.
36
While we cannot definitively know how the quality of banks in state charter compares to the
quality of banks in the average population, we do find evidence that the differences in regulator
behavior across states impact a bank's charter choice. In particular, in Table 7B we assess if there
is a relation between entry of banks in a state and the extent of leniency of local regulators in that
state relative to federal ones. We conduct this analysis using our baseline CAMELS regression.
We include the interaction of a dummy that indicates federal regulator presence with a variable
that captures number of new SMB/NMB—either through new charters or relocations—in the
same state as the bank under consideration, averaged over our sample period (SMB/NMB Entry).
We also account for the size of the banking sector by including the average number of existing
banks over the sample period in the same state as the bank under consideration (# SMB/NMB).
As is evident from both columns in Table 7B, states with significantly more new bank entries are
also the ones where local regulators are softer relative to federal ones. Thus, the choice of banks
across various states is related to the regulatory rating environment inside that state. We will
revert to this finding when we discuss the implications for optimal regulation next.
7.2 Implications for Optimal Regulation
This paper shows large and significant differences in how regulators implement identical rules
due to differences in their “will”—i.e. their institutional design and incentives. Our identification
strategy allows us to conclude that these differences in regulatory outcomes reflect regulators’
views and incentives rather than bank heterogeneity. We show that the differences in regulatory
behavior are important because banks respond to them. Moreover, real consequences are related
to differences in regulator behavior. States with more lenient local regulators relative to their
federal counterparts experience higher likelihood of bank failures and costs of bank distress. In
addition, a greater difference between local and federal regulator ratings for a given bank likely
proxies for regulatory delays, since it makes it more likely that a given bank subsequently ends
in problem bank status. We investigate the reasons for this discrepancy in regulator behavior and
find that one main reason why state regulators do not crack down on banks as much as federal
regulators is that they put more weight on the local economy. There is also significant evidence
that some state regulators are softer in rating banks because they lack financial as well as human
resources in supervision. There is no support for the corruption hypothesis, which includes the
commonly discussed revolving doors as a reason for leniency of regulators.
Our main analysis is conducted on state-chartered banks. As mentioned earlier, these banks
account for the vast majority of depository institutions in the U.S. and a very large fraction of
overall bank assets. In addition, state charters remain the most common chartering type for de
novo banks today, accounting for about 85% of all new banks in 2010. Episodes of systemic risk
have historically been associated with either failure of one or more very large financial
institutions (e.g. the U.S. in 2008) or troubles with a large number of smaller institutions (e.g. the
U.S. savings and loan crisis during the 1980s, or cajas des arrojo in Spain in 2011). Thus, the
37
results of this paper are directly applicable to the part of the banking sector that is important both
in terms of its economic size as well as in terms of its impact on financial stability.
At the same time, our results have implications for banking regulation of banks outside state
charters. In particular, because in a dual banking system banks can pick their charter,
understanding the optimal regulation of large banks in national charters cannot be done in a
vacuum without understanding regulation inside state charters. In general, large banks tend to
choose federal charters in order to avoid dealing with different state regulators when operating
across state borders; in contrast, smaller banks tend to choose state charters because they are
cheaper to maintain and local regulators are more easily accessible (e.g. Bierce 2007 and Blair-
Kushmeider 2006). Nonetheless, the U.S. banking system has experienced a continuous osmosis
of banks, both large and small, from one charter to another. For example, among the largest
institutions, Chase Manhattan Bank switched to a state charter in 1995, and its successor,
JPMorgan Chase Bank, returned to a national charter in 2004. Similarly, a large number of small
banks have switched from federal to state charters, reportedly following the merger of the OTS
and OCC in October 2011. The movement of banks between national and state charters makes
the behavior of regulators inside each of these systems interdependent. Our paper takes the first
step in this direction by demonstrating that in state charters, banks face a tougher regulator only
half the time. This suggests that banks that remain in the national charter must be garnering
benefits that are large enough to offset the lenient supervisory treatment they might otherwise
obtain in the state charter. Understanding and quantifying these benefits remains a fruitful area of
future research.
Our findings cannot directly speak to whether having competing regulators in a banking system
is optimal. However, the difference-in-difference experiment in Table 5C does come close to
replicating a scenario where we move from a regime with a single regulator to a regime where
multiple heterogeneous regulators share oversight. After the Riegle Act of 1994, the stricter
arm's length regulator faces pressure on its supervisory decisions not only due to potential
charter shopping decisions of banks, but also due to dilution of control from the presence of
more lenient local regulators. Thus, sharing oversight among regulators may also have costs,
similar to what competition among regulators introduces via a “race to the bottom” in terms of
regulatory laxity.
More broadly, our findings speak to the current debate on the redesign of banking regulation in
Europe.37 Based on current proposals of a supernational banking union, the European regulatory
system could acquire very similar features to state charter banking in the U.S., with state
supervisors continuing to act as the sole chartering authority and a dual supervisory system 37 Our findings could also speak to similar issues in other regulated industries, such as insurance. While insurance is currently regulated solely at the state level, Congress has on several occasions introduced proposals for a “federal charter” for insurance companies. Our results on inconsistent regulatory oversight—with more stringent federal regulators—could be informative on the potential consequences of such reforms.
38
composed of national and a single supranational, or “federal,” European authority. As discussed
by Garicano (2012), the impetus for this redesign follows the European banking crisis that
resulted in a loss in reputation of national supervisors, who appeared unwilling to take prompt
corrective actions at key junctures of the European banking crisis. Our findings can help
understand the tradeoffs involved in the allocation of supervisory powers and responsibilities in
this new redesigned dual system. It is reasonable to assume that national regulators in Europe,
who have been the sole supervisors for many years, have an informational advantage relative to
federal supervisory authority. However, our findings highlight that regulators’ “will” is critical in
determining its behavior. In particular, local regulators are more likely to overweight local
constituents, and particularly so in tough economic conditions. These patterns are likely to be
binding for larger banks that may be “too big to fail” for their local economies. An optimal dual
regulatory arrangement for Europe will need to efficiently trade off the experience of local
(national) supervisors with the local regulator bias which makes it softer toward local banks.
Thus, if prompt corrective intervention is an important goal of banking regulation, our findings
suggest that the new regulatory design should bake in tripwires to allow for intervention by
arm’s-length regulators, especially in tough times and for larger institutions.
References
Ackerberg, Daniel and Maristella Botticini, 2002. “Endogenous Matching and the Empirical Determinants of Contract Form”. Journal of Political Economy 110(3), pp. 564-91.
American Bankers Association, 2009. “Charter Shopping? Not Likely”, mimeo ABA.
Barth, James, Gerard Caprio, and Ross Levine, 2004, “Bank Regulation and Supervision: What Works Best?” Journal of Financial Intermediation 13, 205-248.
Beck, Thorsten, Loayza, N. and Ross Levine (2000), “Financial intermediation and growth: causality and causes.” Journal of Monetary Economics 46, 31–77.
Beck, Thorsten, Demirguic-Kunt Asli and Ross Levine (2003), ''Bank Supervision and Corporate Finance'', The World Bank Working Paper
Berger, Allen N., and Timothy H. Hannan, 1998, “The efficiency cost of market power in the banking industry: A test of the ‘quiet life’ and related hypotheses,” Review of Economics and Statistics, Vol. 80, No. 3, August, pp. 454–465.
Berger, Allen N. and Sally M. Davies. 1998. “The Informational Content of Bank Examinations” Journal of Financial Services Research Vol. 14 no. 2, 117-144.
Berger, Allen N., Sally M. Davies, and M. J. Flannery. 1998. “Comparing Market and Supervisory Assessment of Bank Performance: Who Knows What When?” Board of Governors of the Federal Reserve System Finance and Economics Discussion Series Paper no. 1998-32.
Besley, Tim and Stephen Coate, 2003. “Elected Versus Appointed Regulators: Theory and Evidence” Journal of the European Economic Association, 5(9), pp 1176-1206.
Bierce, M. 2007. “Charter Smarter”. SNL De Novo Digest. (April)
39
Blair, C., and R. Kushmeider. 2006. “Challenges to the Dual Banking System: The Funding of Bank Supervision”. FDIC Banking Review, 18, 1–20.
Board of Governors of the Federal Reserve System, 1996. SR Letter 96-33, Board of Governors of the Federal Reserve System, Washington, DC.
Board of Governors of the Federal Reserve System, 2008. Commercial Bank Examination Manual, Board of Governors of the Federal Reserve System, Washington, DC.
Bolton, Patrick, Xavier Freixas and Joel Shapiro, 2011, “The Credit Ratings Game,” forthcoming, Journal of Finance.
Boot, A.W.A., Thakor, A.V., 1993. “Self-interested bank regulation”. American Economic Review 83, 206–211.
Brennan Michael J. and Eduardo S. Schwartz, 1982a “Consistent Regulatory Policy under Uncertainty” The Bell Journal of Economics Vol. 13, No. 2 (Autumn), pp. 506-521
Brennan Michael J. and Eduardo S. Schwartz, 1982b “Regulation and Corporate Investment Policy” Journal of Finance Vol. 37, No. 2, pp. 289-300
Brunnermeier, Markus, Andrew Crockett, Charles Goodhart, Avi Persaud and Hyun Shin, 2009. The Fundamental Principles of Financial Regulation, 11th Geneva Report on the World Economy.
Burns, Arthur 1974. “Maintaining the Soundness of Our Banking System”, American Bankers Association Convention, Honolulu, Hawaii (pp. 18-19. Oct. 21, 1974).
Butler, Henry N., Macey, Jonathan R 1987. “Myth of Competition in the Dual Banking System” 73 Cornell Law Review 677
Caballero, Ricardo, Takeo Hoshi and Kashyap, Anil. 2008 “Zombie Lending and Depressed Restructuring in Japan” American Economic Review, Vol. 98, No. 5, pp. 1943-1977
Calomiris, Charles and Gorton, Gary 1991, "The Origins of Banking Panics: Models, Facts, and Bank Regulation", NBER Publication on Financial Markets and Financial Crises, University of Chicago Press
Calomiris, Charles W., 2006, “The Regulatory Record of the Greenspan Fed,” American Economic Review Papers and Proceedings, Vol. 96, No. 2, May, pp. 170‐173.
Committee on Banking, Housing, and Urban Affairs. 1994. “The Need for Major Consolidation and Overhaul of the Bank Regulatory Agencies into New and Independent Banking Structure.” Hearings before the Committee on Banking, Housing, and Urban Affairs. U.S. Senate, 103rd Cong., XX Session, March 1,2,3,4 and 9.
House Committee on Banking and Currency.(1965) “Consolidation of Bank Examining and Supervisory Functions: Hearings on HR 107 and HR 6885 Before the Subcommittee on Bank Supervision and Insurance of the House Committee on Banking and Currency.” US House, 89th Congress
Committee on Homeland Security and Governmental Affairs. 2010. “Wall Street and the Financial Crisis: Anatomy of a Financial Collapse.” Report prepared by the U.S. Senate

40
Permanent Subcommittee on Investigations, Section IV C. (4), “OTS Turf War Against FDIC,” p. 196.
Conference of State Bank Supervisors, 1996, 1998, 2000, 2002, 2004 “Profile of State Chartered Banking,”
Cyran, Robert. 2009. "Downfall of a Regulator." New York Times (9 April): p. B2
Dewatripont, M., Tirole, J., 1994. The Prudential Regulation of Banks. MIT Press, Cambridge.
Diamond, Douglas W. and Philip H. Dybvig, 1983. “Bank Runs, Deposit Insurance, and Liquidity” Journal of Political Economy, 91(3), 401-419.
Dixon, Kyle and Philip Weiser, 2006, “A Digital Age Communications Act Paradigm for Federal-State Relations”, Journal of Telecommunications and High Technology Law 4, pp 321-364.
Esworthy, Robert, 2008, "Federal Pollution Control Laws: How Are They Enforced?", Congressional Research Services Report, November 26, 2008.
Federal Deposit Insurance Corporation, 2002, Manual of Examination Policies, February, Federal Deposit Insurance Corporation, Washington, DC.
Federal Deposit Insurance Corporation, 2004, “FDIC’s Reliance on State Safety and Soundness Examinations,” March 26, Audit Report No. 04-013, Federal Deposit Insurance Corporation, Washington, DC.
Flannery, Mark J., 1983, “Can State Bank Examinations Data Replace FDIC Examination Visits?,” Journal of Bank Research, Vol. 13, No. 4, winter, pp. 312-316.
Garicano, Luis 2012: http://www.voxeu.org/article/five-lessons-spanish-cajas-debacle-new-euro-wide-supervisor.
Glaeser, Edward and Raven Saks, 2006, "Corruption In America," Journal of Public Economics, 1053-72.
Gunther, Jeffrey and Robert R Moore, 2003, “Loss underreporting and the auditing role of bank exams” Journal of Financial Intermediation Vol. 12, no. 2, 153-177.
Hellman, T., K. Murdock, and J. Stiglitz. 2000. “Liberalization, Moral Hazard in Banking, and Prudential Regulation: Are Capital Requirements Enough?” American Economic Review Vol. 90(1), pp. 147-165.
Jayaratne, Jith, and Philip E. Strahan, 1996. “The Finance-Growth Nexus: Evidence from Bank Branch Deregulation,” Quarterly Journal of Economics, Vol. 111, No. 3, August, pp. 639-70.
Kane, Edward J., 1989. The S&L Insurance Mess. How Did it Happen?, The Urban Institute Press: Washington DC.
Kane, Edward J., 2000. “Ethical Foundations of Financial Regulation,” Journal of Financial Services Research, Vol. 12, No. 1, August, pp. 51-74.
Kroszner, Randall and Philip Strahan, 1996. “Regulatory incentives and the thrift crisis: dividends, mutual-to-stock conversions, and financial distress” Journal of Finance 51, 1285-19.

41
Kroszner, Randall S., and Philip E. Strahan, 1999. “What Drives Deregulation? Economics and Politics of the Relaxation of Bank Branching Restrictions,” Quarterly Journal of Economics, Vol. 114, No. 4, November, pp. 1437-1467.
Laffont Jean-Jacques and D. Martimort, 1999. “Separation of regulators against collusive behavior”. RAND Journal of Economics, 30, 2, pp. 232–262.
Laffont, Jean-Jacques, Pouyet, J., 2004. “The Subsidiarity Bias in Regulation” Journal of Public Economics, 88, 1-2, pp. 255–283.
Laffont, Jean-Jacques and Jean Tirole, 1993. A Theory of Incentives in Procurement and Regulation. MIT Press, Cambridge.
Lane C., “Halting the March Toward Preemption: Resolving Conflicts Between State and Federal Securities Regulators”, New England Law Review 39, pp 317-350
Martimort, D. 1999. “Renegotiation design with multiple regulators”. Journal of Economic Theory, 88, 2, pp. 261–293.
Obama, Barack, 2009, “Remarks on Financial Regulation on Wall Street,” Federal Hall, New York, NY, September 14, http://projects.washingtonpost.com/obama‐speeches/speech/68/.
Offices of Inspector General 2002. “Joint Examination of the Federal Financial Institutions Examination Council”. Banking Agency Offices of Inspector General, Washington, DC. Available at http://www.fdicoig.gov/evaluations/02-003E.pdf
Office of Inspector General 2010. “Evaluation of Federal Regulatory Oversight of Washington Mutual Bank”. Banking Agency Offices of Inspector General, Washington, DC. Available at http://www.fdicoig.gov/reports10/10-002EV.pdf
Peek, Joe, Eric Rosengren and Geoffrey M. B. Tootell 1999, “Is Bank Supervision Central to Central Banking?,” The Quarterly Journal of Economics, 114, 629-653.
Peltzman, Sam, 1976, “Toward a More General Theory of Regulation,” Journal of Law and Economics, 19, pp. 211–40.
Pigou, Arthur C. 1938, The Economics of Welfare, 4th ed. London: Macmillan and Co.
Prager Robin A. 1989 “The Effects of Regulatory Policies on the Cost of Debt for Electric Utilities: An Empirical Investigation” The Journal of Business, Vol. 62, No. 1, pp. 33-53
Rezende, Marcelo, 2010. “How Do Joint Supervisors Examine Financial Institutions? The Case of State Banks” Paolo Baffi Centre Research Paper No. 2010-68.
Rezende, Marcelo, 2011. “The Effects of Bank Regulator Switching on Supervisory Ratings” Working Paper.
Rosen, Richard J., 2003. “Is Three a Crowd? Competition Among Regulators in Banking,” Journal of Money Credit and Banking, Vol. 35, No. 6 , pp. 967–998.
Rosen, Richard J., 2005. “Switching primary federal regulators: Is it beneficial for U.S. banks?,” Federal Reserve Bank of Chicago Economic Perspectives, 3Q. pp. 16-33.
Scott, Kenneth E. 1977. “The Dual Banking System: A Model of Competition in Regulation”, Stanford Law Review 1(13), pp. 1-50.

42
Shleifer, Andrei and Robert W. Vishny 1999. The Grabbing Hand: Government Pathologies and their Cures. Harvard University Press.
Shleifer, Andrei and Robert W. Vishny 1993. "Corruption", Quarterly Journal of Economics
Shleifer, Andrei 1996. "Origins of Bad Policies: Control, Corruption, and Confusion", in Rivista Di Politica Economica.
Stigler, G., 1971. “The Economic Theory of Regulation,” Bell Journal of Economics, 2, pp. 3-21.
Teisberg, Elizabeth Olmsted 1993. “Capital Investment Strategies under Uncertain Regulation” RAND Journal of Economics Vol. 24, No. 4 (Winter), pp. 591-604
Tiebout, Charles, 1956. “A Pure Theory of Local Expenditures,” Journal of Political Economy, 64, pp. 416–24.
U.S. Financial Crisis Inquiry Commission. 2011. “Final Report of the National Commission on the Causes of the Financial and Economic Crisis in the United States”
Viscusi W. Kip 1983. “Frameworks for Analyzing the Effects of Risk and Environmental Regulations on Productivity” American Economic Review Vol. 73, No. 4, pp. 793-80
White Eugene 2011. “To Establish a More Effective Supervision of Banking: How the Birth of the Fed Altered Bank Supervision” Working Paper.
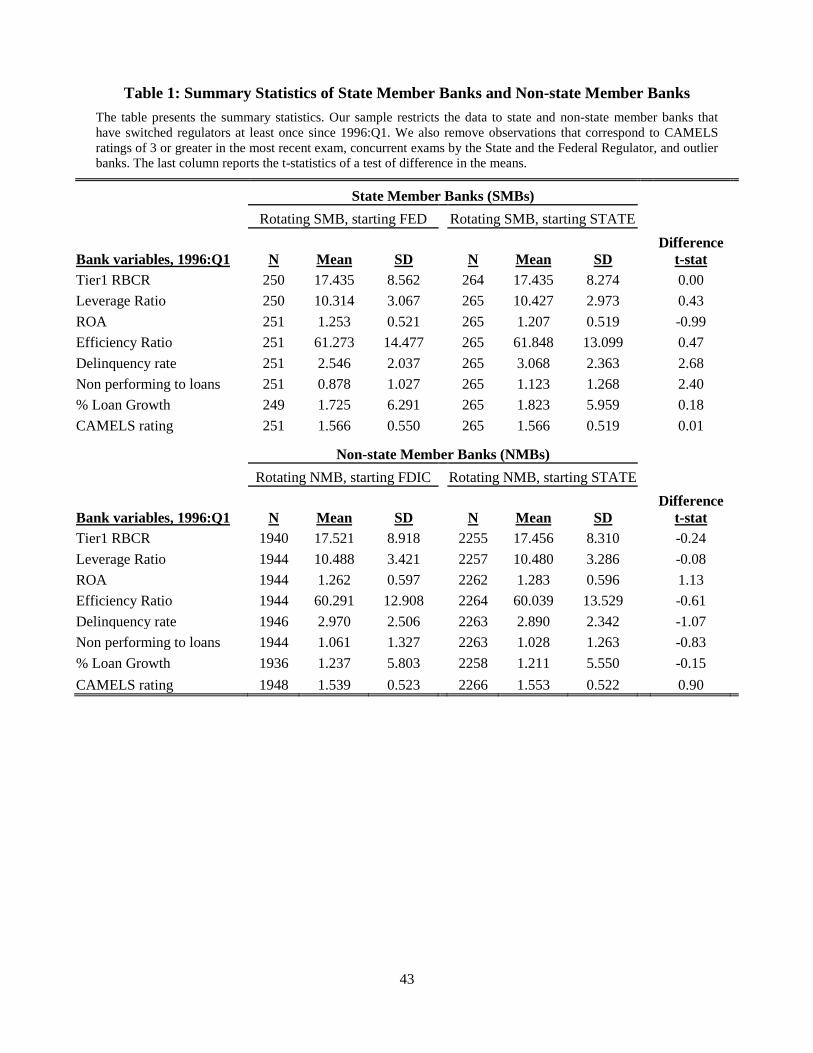
43
Table 1: Summary Statistics of State Member Banks and Non-state Member Banks
The table presents the summary statistics. Our sample restricts the data to state and non-state member banks that have switched regulators at least once since 1996:Q1. We also remove observations that correspond to CAMELS ratings of 3 or greater in the most recent exam, concurrent exams by the State and the Federal Regulator, and outlier banks. The last column reports the t-statistics of a test of difference in the means.
State Member Banks (SMBs)
Rotating SMB, starting FED
Rotating SMB, starting STATE
Bank variables, 1996:Q1 N Mean SD
N Mean SD
Difference t-stat
Tier1 RBCR 250 17.435 8.562
264 17.435 8.274
0.00 Leverage Ratio 250 10.314 3.067
265 10.427 2.973
0.43
ROA 251 1.253 0.521
265 1.207 0.519
-0.99 Efficiency Ratio 251 61.273 14.477
265 61.848 13.099
0.47
Delinquency rate 251 2.546 2.037
265 3.068 2.363
2.68 Non performing to loans 251 0.878 1.027
265 1.123 1.268
2.40
% Loan Growth 249 1.725 6.291
265 1.823 5.959
0.18 CAMELS rating 251 1.566 0.550
265 1.566 0.519
0.01
Non-state Member Banks (NMBs)
Rotating NMB, starting FDIC
Rotating NMB, starting STATE
Bank variables, 1996:Q1 N Mean SD
N Mean SD
Difference t-stat
Tier1 RBCR 1940 17.521 8.918
2255 17.456 8.310
-0.24 Leverage Ratio 1944 10.488 3.421
2257 10.480 3.286
-0.08
ROA 1944 1.262 0.597
2262 1.283 0.596
1.13 Efficiency Ratio 1944 60.291 12.908
2264 60.039 13.529
-0.61
Delinquency rate 1946 2.970 2.506
2263 2.890 2.342
-1.07 Non performing to loans 1944 1.061 1.327
2263 1.028 1.263
-0.83
% Loan Growth 1936 1.237 5.803
2258 1.211 5.550
-0.15 CAMELS rating 1948 1.539 0.523 2266 1.553 0.522 0.90

44
Table 2: Impact of Supervisor Identity on CAMELS Ratings
The table reports the results from an OLS regression that examines the effect of the federal regulator being the lead regulator on supervisory exam on combined CAMELS rating (Panel A) and its subcomponents (Panel B). Our sample restricts the data to state and non-state member banks that have switched regulators at least once since 1996:Q1. We also remove observations that correspond to CAMELS ratings of 3 or greater in the most recent exam, concurrent exams by the State and the Federal Regulator, and outlier banks. We include quarter and bank fixed effects and the errors are clustered at the state level. *** significant at 1% level. ** significant at 5% level. * significant at 10% level. Sample 1996:Q1-2010:Q4.
Panel A: Combined CAMELS Ratings
(1) (2) (3) (4)
Combined CAMELS
Combined CAMELS
Combined CAMELS
Combined CAMELS
Within-bank mean 1.753 1.694 1.700 1.694
Within-bank SD 0.304 0.312 0.311 0.296
FRB 0.096***
[0.016]
FDIC
0.095***
[0.012]
Federal Agency
0.095*** 0.081***
[0.011] [0.009]
Other Controls
Yes
Cluster State State State State
Fixed effects Quarter Quarter Quarter Quarter
Bank ID Bank ID Bank ID Bank ID
Observations 5161 39941 45102 44213
Adjusted R-squared 0.507 0.470 0.474 0.570
# of banks 731 5895 6626 6558
# of clusters 41 50 50 49

45
Table 2: Impact of Supervisor Identity on CAMELS Ratings (contd.)
Panel B: Sub-components of CAMELS Ratings
(1) (2) (3) (4) (5) (6)
Capital rating
Asset rating
Management rating
Earnings rating
Liquidity rating
Sensitivity rating
Within-bank mean 1.501 1.578 1.809 1.899 1.573 1.690
Within-bank SD 0.324 0.373 0.299 0.330 0.298 0.274
Federal Agency 0.074*** 0.083*** 0.119*** 0.078*** 0.057*** 0.083***
[0.010] [0.016] [0.010] [0.011] [0.009] [0.008]
Cluster State State State State State State
Fixed effects Quarter Quarter Quarter Quarter Quarter Quarter
Bank ID Bank ID Bank ID Bank ID Bank ID Bank ID
Observations 45102 45102 45102 45102 45102 39203
Adjusted R-squared 0.461 0.402 0.432 0.491 0.468 0.405
# of banks 6626 6626 6626 6626 6626 6308
# of clusters 50 50 50 50 50 50
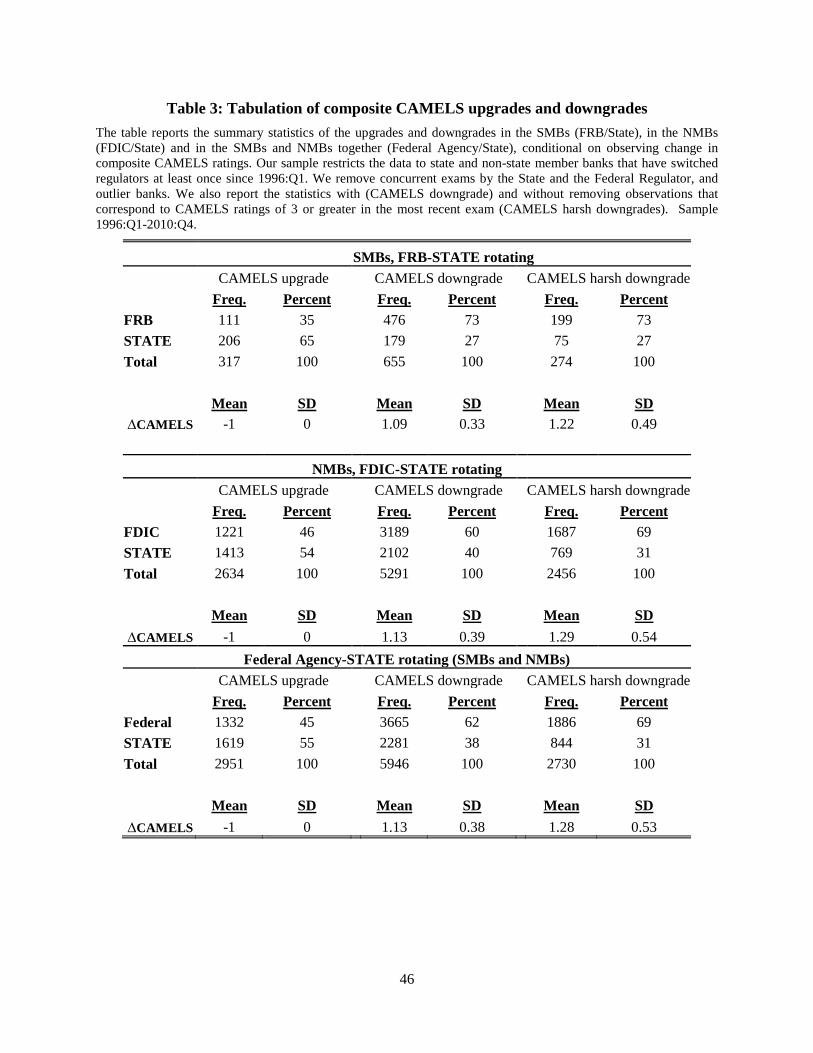
46
Table 3: Tabulation of composite CAMELS upgrades and downgrades
The table reports the summary statistics of the upgrades and downgrades in the SMBs (FRB/State), in the NMBs (FDIC/State) and in the SMBs and NMBs together (Federal Agency/State), conditional on observing change in composite CAMELS ratings. Our sample restricts the data to state and non-state member banks that have switched regulators at least once since 1996:Q1. We remove concurrent exams by the State and the Federal Regulator, and outlier banks. We also report the statistics with (CAMELS downgrade) and without removing observations that correspond to CAMELS ratings of 3 or greater in the most recent exam (CAMELS harsh downgrades). Sample 1996:Q1-2010:Q4.
SMBs, FRB-STATE rotating
CAMELS upgrade
CAMELS downgrade
CAMELS harsh downgrade
Freq. Percent
Freq. Percent
Freq. Percent
FRB 111 35
476 73
199 73
STATE 206 65
179 27
75 27
Total 317 100
655 100
274 100
Mean SD
Mean SD
Mean SD
∆CAMELS -1 0
1.09 0.33
1.22 0.49
NMBs, FDIC-STATE rotating
CAMELS upgrade
CAMELS downgrade
CAMELS harsh downgrade
Freq. Percent
Freq. Percent
Freq. Percent
FDIC 1221 46
3189 60
1687 69
STATE 1413 54
2102 40
769 31
Total 2634 100
5291 100
2456 100
Mean SD
Mean SD
Mean SD
∆CAMELS -1 0 1.13 0.39 1.29 0.54
Federal Agency-STATE rotating (SMBs and NMBs)
CAMELS upgrade
CAMELS downgrade
CAMELS harsh downgrade
Freq. Percent
Freq. Percent
Freq. Percent
Federal 1332 45
3665 62
1886 69
STATE 1619 55
2281 38
844 31
Total 2951 100
5946 100
2730 100
Mean SD
Mean SD
Mean SD
∆CAMELS -1 0 1.13 0.38 1.28 0.53
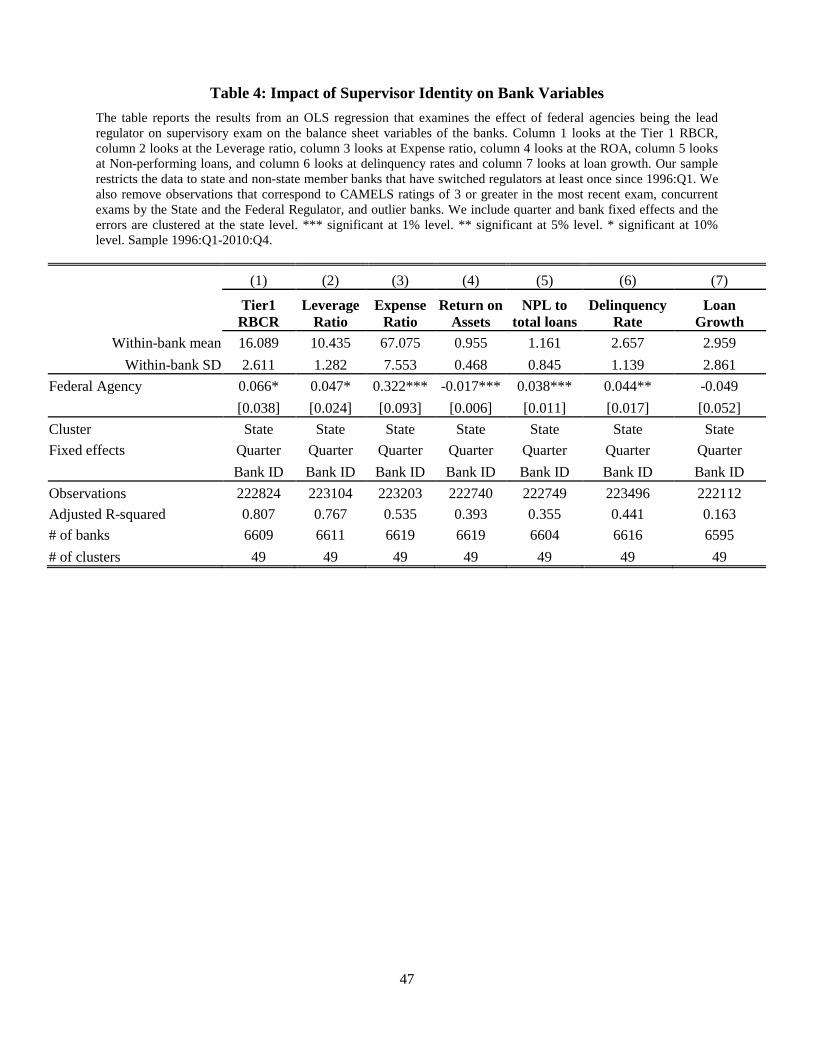
47
Table 4: Impact of Supervisor Identity on Bank Variables
The table reports the results from an OLS regression that examines the effect of federal agencies being the lead regulator on supervisory exam on the balance sheet variables of the banks. Column 1 looks at the Tier 1 RBCR, column 2 looks at the Leverage ratio, column 3 looks at Expense ratio, column 4 looks at the ROA, column 5 looks at Non-performing loans, and column 6 looks at delinquency rates and column 7 looks at loan growth. Our sample restricts the data to state and non-state member banks that have switched regulators at least once since 1996:Q1. We also remove observations that correspond to CAMELS ratings of 3 or greater in the most recent exam, concurrent exams by the State and the Federal Regulator, and outlier banks. We include quarter and bank fixed effects and the errors are clustered at the state level. *** significant at 1% level. ** significant at 5% level. * significant at 10% level. Sample 1996:Q1-2010:Q4.
(1) (2) (3) (4) (5) (6) (7)
Tier1 RBCR
Leverage Ratio
Expense Ratio
Return on Assets
NPL to total loans
Delinquency Rate
Loan Growth
Within-bank mean 16.089 10.435 67.075 0.955 1.161 2.657 2.959
Within-bank SD 2.611 1.282 7.553 0.468 0.845 1.139 2.861
Federal Agency 0.066* 0.047* 0.322*** -0.017*** 0.038*** 0.044** -0.049
[0.038] [0.024] [0.093] [0.006] [0.011] [0.017] [0.052]
Cluster State State State State State State State
Fixed effects Quarter Quarter Quarter Quarter Quarter Quarter Quarter
Bank ID Bank ID Bank ID Bank ID Bank ID Bank ID Bank ID
Observations 222824 223104 223203 222740 222749 223496 222112
Adjusted R-squared 0.807 0.767 0.535 0.393 0.355 0.441 0.163
# of banks 6609 6611 6619 6619 6604 6616 6595
# of clusters 49 49 49 49 49 49 49
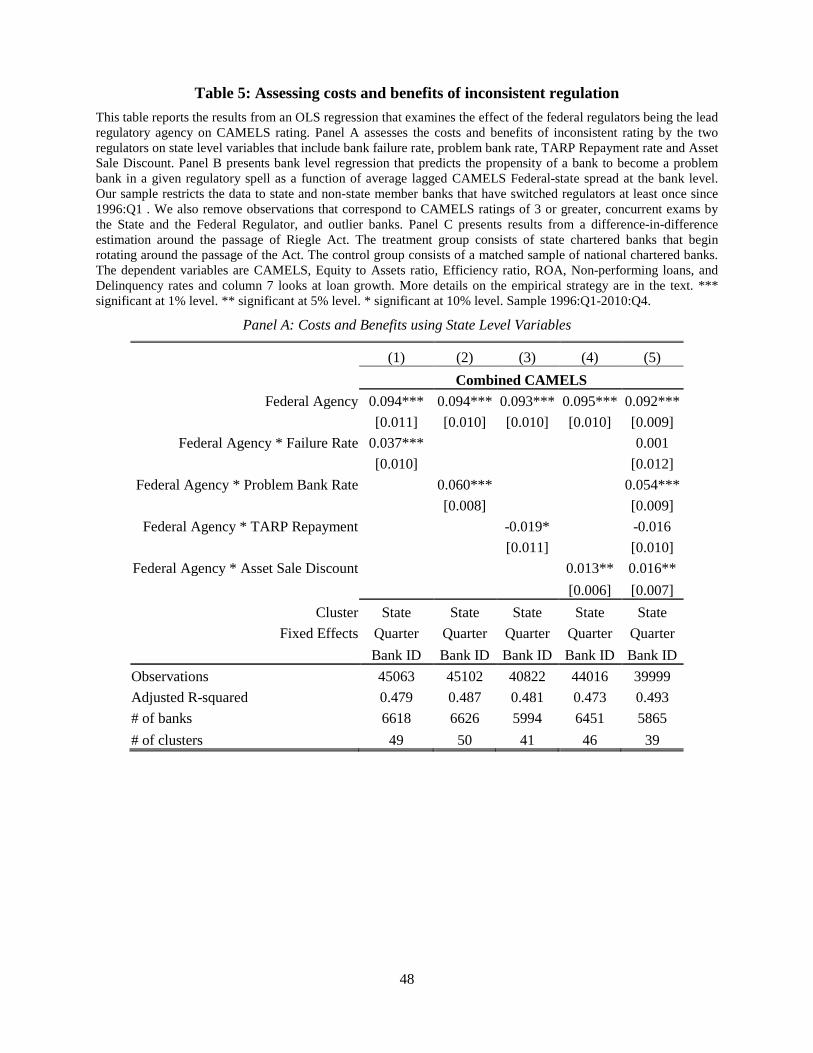
48
Table 5: Assessing costs and benefits of inconsistent regulation
This table reports the results from an OLS regression that examines the effect of the federal regulators being the lead regulatory agency on CAMELS rating. Panel A assesses the costs and benefits of inconsistent rating by the two regulators on state level variables that include bank failure rate, problem bank rate, TARP Repayment rate and Asset Sale Discount. Panel B presents bank level regression that predicts the propensity of a bank to become a problem bank in a given regulatory spell as a function of average lagged CAMELS Federal-state spread at the bank level. Our sample restricts the data to state and non-state member banks that have switched regulators at least once since 1996:Q1 . We also remove observations that correspond to CAMELS ratings of 3 or greater, concurrent exams by the State and the Federal Regulator, and outlier banks. Panel C presents results from a difference-in-difference estimation around the passage of Riegle Act. The treatment group consists of state chartered banks that begin rotating around the passage of the Act. The control group consists of a matched sample of national chartered banks. The dependent variables are CAMELS, Equity to Assets ratio, Efficiency ratio, ROA, Non-performing loans, and Delinquency rates and column 7 looks at loan growth. More details on the empirical strategy are in the text. *** significant at 1% level. ** significant at 5% level. * significant at 10% level. Sample 1996:Q1-2010:Q4.
Panel A: Costs and Benefits using State Level Variables
(1) (2) (3) (4) (5)
Combined CAMELS
Federal Agency 0.094*** 0.094*** 0.093*** 0.095*** 0.092***
[0.011] [0.010] [0.010] [0.010] [0.009]
Federal Agency * Failure Rate 0.037***
0.001
[0.010]
[0.012]
Federal Agency * Problem Bank Rate
0.060***
0.054***
[0.008]
[0.009]
Federal Agency * TARP Repayment
-0.019*
-0.016
[0.011]
[0.010]
Federal Agency * Asset Sale Discount
0.013** 0.016**
[0.006] [0.007]
Cluster State State State State State
Fixed Effects Quarter Quarter Quarter Quarter Quarter
Bank ID Bank ID Bank ID Bank ID Bank ID
Observations 45063 45102 40822 44016 39999
Adjusted R-squared 0.479 0.487 0.481 0.473 0.493
# of banks 6618 6626 5994 6451 5865
# of clusters 49 50 41 46 39

49
Table 5: Assessing costs and benefits of inconsistent regulation (contd.)
Panel B: Costs and Benefits using Bank Level Variables
(1) (2) (3)
Pr(Bank becomes a Problem Bank in a quarter)
Within-bank mean 0.028
Within-bank SD 0.128
Lagged Mean Difference 0.120*** 0.063*** 0.057***
[0.022] [0.014] [0.014]
Lagged CAMELS
0.122*** 0.120***
[0.011] [0.010]
Lagged Absolute Difference
0.036***
[0.009]
Cluster State State State
Fixed Effects Quarter Quarter Quarter
Bank ID Bank ID Bank ID
Observations 160067 160067 160067
Adjusted R-squared 0.265 0.399 0.400
# of banks 4992 4992 4992
# of clusters 48 48 48
Panel C: Costs and Benefits using Difference in Difference around Riegle Act
(1) (2) (3) (4) (5) (6) (7)
Combined CAMELS
Equity to Assets
Expense Ratio
Return on assets
NPL to total loans
Delinquency rate
Loan Growth
Post Riegle Act -0.081*** -0.020 -0.018*** 0.033 -0.151*** -0.181*** 0.098
[0.010] [0.036] [0.003] [0.021] [0.033] [0.048] [0.149] Fixed effects Quarter Quarter Quarter Quarter Quarter Quarter Quarter
Bank ID Bank ID Bank ID Bank ID Bank ID Bank ID Bank ID Observations 13561 13936 13908 13815 13902 13931 13159 Adjusted R-squared 0.004 -0.000 0.002 0.000 0.001 0.001 -0.000
# of banks 1033 1031 1033 1032 1033 1033 1031

50
Table 6: Why do differences exist between regulators?
The table reports the results from an OLS regression that examines the effect of federal regulators being the lead regulator on the supervisory exam on CAMELS ratings. Panels A, B and C test the Control, Confusion and Corruption hypothesis outlined in the text. Panel D presents additional evidence using bank level data. Our sample restricts the data to state and non-state member banks that have switched regulators at least once since 1996:Q1. We also remove observations that correspond to CAMELS ratings of 3 or greater in the most recent exam, concurrent exams by the State and the Federal Regulator, and outlier banks. We include quarter and bank fixed effects and the errors are clustered at the state level. *** significant at 1% level. ** significant at 5% level. * significant at 10% level. Sample 1996:Q1-2010:Q4.
Panel A: Control
(1) (2) (3)
Combined CAMELS
Federal Agency 0.095*** 0.095*** 0.096***
[0.011] [0.011] [0.011]
Federal agency * Local UR 0.065***
0.054***
[0.009]
[0.010]
Federal agency * Local HPI
-0.050*** -0.021**
[0.010] [0.008]
Cluster State State State Fixed Effects Quarter Quarter Quarter
Bank ID Bank ID Bank ID Observations 45063 45063 45063 Adjusted R-squared 0.483 0.480 0.484 # of banks 6618 6618 6618 # of clusters 49 49 49
Panel B: Confusion
(1) (2) (3)
Combined CAMELS
Federal Agency 0.096*** 0.094*** 0.095***
[0.011] [0.010] [0.010]
Federal Agency * Budget Ratio -0.002
-0.003
[0.004]
[0.004]
Federal Agency * # Examiner Ratio 0.007
0.002
[0.006]
[0.004]
Federal Agency * Training Ratio -0.010*
-0.007
[0.006]
[0.007]
Federal Agency * % Experienced Examiner -0.013*
-0.015*
[0.007]
[0.008]
Federal Agency * Turnover
-0.023* -0.026**
[0.012] [0.011]
Cluster State State State Fixed Effects Quarter Quarter Quarter
Bank ID Bank ID Bank ID Observations 43153 43020 41615 Adjusted R-squared 0.474 0.548 0.549 # of banks 6353 6298 6097 # of clusters 45 40 37

51
Table 6: Why do differences exist between regulators? (contd.)
Panel C: Corruption
(1) (2) (3)
Combined CAMELS
Federal Agency 0.090** 0.107*** 0.094***
[0.036] [0.010] [0.023]
Federal Agency * Corruption Measure 0.002
-0.009
[0.009]
[0.010]
Federal Agency * Integrity Rank 0.011
0.009
[0.010]
[0.010]
Federal Agency * Institutional Quality 0.010
0.009
[0.009]
[0.010]
Federal Agency * Expenditure per capita 0.070***
0.059***
[0.010]
[0.012]
Federal Agency * Budget by Commissioner
0.001 0.005
[0.013] [0.011]
Federal Agency * Budget by Board
-0.027** -0.014
[0.012] [0.009]
Federal Agency * Budget by Statue
-0.029** -0.010
[0.014] [0.011]
Federal Agency * Budget by Legislate
0.027** 0.004
[0.012] [0.011]
Federal Agency * Organization Span
-0.020* -0.014
[0.012] [0.012]
Federal Agency * Organization Depth
0.002 0.003
[0.005] [0.003]
Federal Agency * Turnover
-0.022** -0.022*
[0.009] [0.012]
Cluster State State State
Fixed Effects Quarter Quarter Quarter
Bank ID Bank ID Bank ID
Observations 40440 39216 36350
Adjusted R-squared 0.482 0.473 0.479
# of banks 6331 5978 5799
# of clusters 47 39 39

52
Table 6: Why do differences exist between regulators? (contd.)
Panel D: Other Bank Level Evidence
(1) (2) (3)
Combined CAMELS
Within-bank mean
Within-bank SD Federal Agency 0.094*** 0.095*** 0.094***
[0.011] [0.011] [0.011]
Federal agency * Size 0.034***
0.041***
[0.008]
[0.008]
Federal agency * Loans/Assets 0.000
0.002
[0.006]
[0.006]
Federal agency * Public
-0.009* -0.022***
[0.005] [0.005]
Cluster State State State Fixed Effects Quarter Quarter Quarter
Bank ID Bank ID Bank ID
Observations 45034 45102 45034 Adjusted R-squared 0.479 0.474 0.479 # of banks 6615 6626 6615
# of clusters 49 50 49

53
Table 7: Broader Applicability
Panel A reports the results from an OLS regression with CAMELS as the dependent variable and indicator for whether FRB, FDIC, OCC or OTS is the lead regulator as the main explanatory variables (State regulator is the omitted category). Controls include ROA, Tier 1 capital ratio, Log(Assets). Panel B reports the results from an OLS regression that examines the effect of federal regulators being the lead agencies on CAMELS ratings The data includes all banks starting 1996:Q1. Standard errors are clustered at the state level. *** significant at 1% level. ** significant at 5% level. * significant at 10% level. Sample 1996:Q1-2010:Q4.
Panel A: CAMELS of All Regulators
(1) (2) (3) (4)
Combined CAMELS
Combined CAMELS
Combined CAMELS
Combined CAMELS
FRB 0.188*** 0.190*** 0.107*** 0.103***
[0.021] [0.021] [0.015] [0.014]
FDIC 0.108*** 0.101*** 0.071*** 0.065***
[0.017] [0.017] [0.010] [0.010]
OCC 0.130*** 0.135*** -0.012 -0.029
[0.025] [0.026] [0.143] [0.143]
OTS 0.165*** 0.161*** -0.153 -0.150
[0.023] [0.024] [0.149] [0.142]
Other Controls Yes Yes Yes Yes
Fixed effects
Bank Bank
Quarter Quarter
Observations 435886 435886 435886 435886
Adjusted R-squared 0.313 0.324 0.612 0.624
# of banks 11628 11628 11628 11628
# of clusters 50 50 50 50
Panel B: Bank Entry and Regulator Differences
(1) (2)
Combined CAMELS
Combined CAMELS
Federal Agency 0.078*** 0.089***
[0.017] [0.013]
Federal Agency * SMB/NMB Entry 0.016** 0.021*
[0.006] [0.011]
Federal Agency * # SMB/NMB
-0.000
[0.000]
Observations 45102 45102
Adjusted R-squared 0.474 0.474
# of banks 6626 6626
# of clusters 50 50

54
Figure 1: Regulatory Structure for US Commercial Banks and thrifts 1996:Q1-2011:Q1
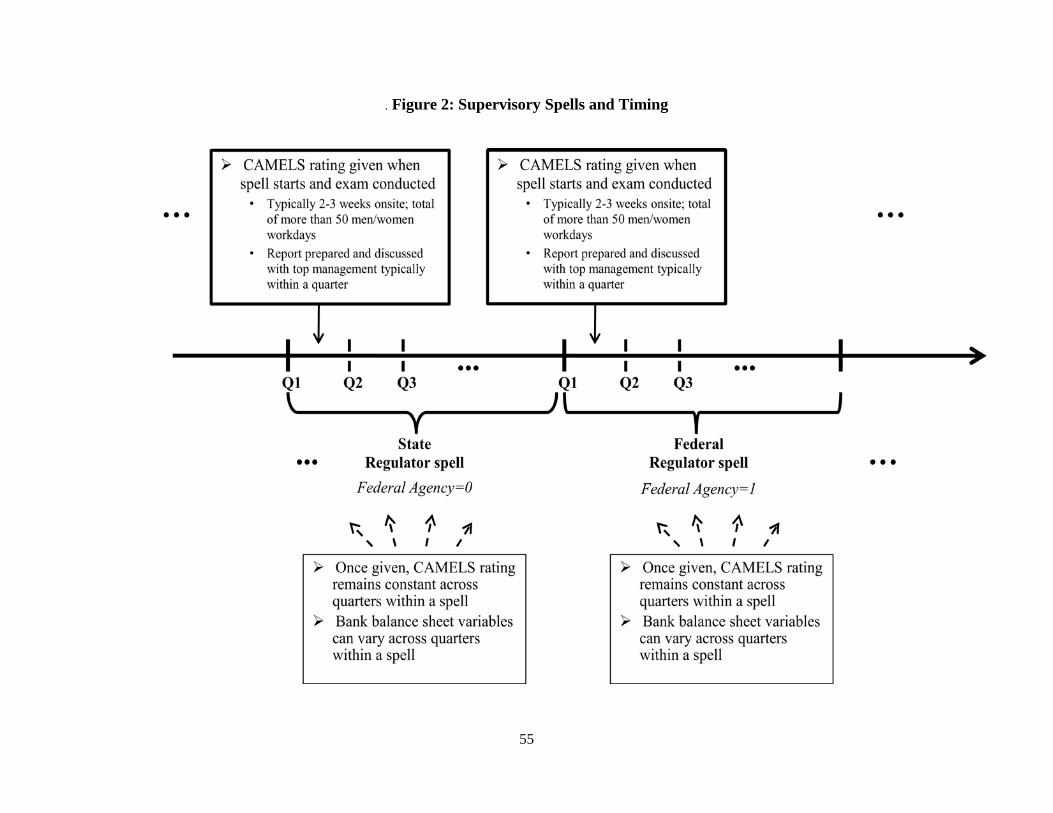
55
. Figure 2: Supervisory Spells and Timing

56
Figure 3: Distribution of Regulator Spells for SMBs and NMBs
0
.1
.2
.3
.4D
ensi
ty
1 2 3 4 5 6 7 8 9 10 11 12+Quarters
Nonmember Banks
0
.1
.2
.3
.4
Den
sity
1 2 3 4 5 6 7 8 9 10 11 12+Quarters
State Member Banks

57
Figure 4: Average Evolution of CAMELS within a Bank
0
.1
.2
.3
.4
Cum
ulat
ive
CA
ME
LS
1st 2nd 3rd 4th 5th 6th 7th 8th
Supervisor Rotations
Conditional on the 1st rotation with a Federal Agency Unconditional
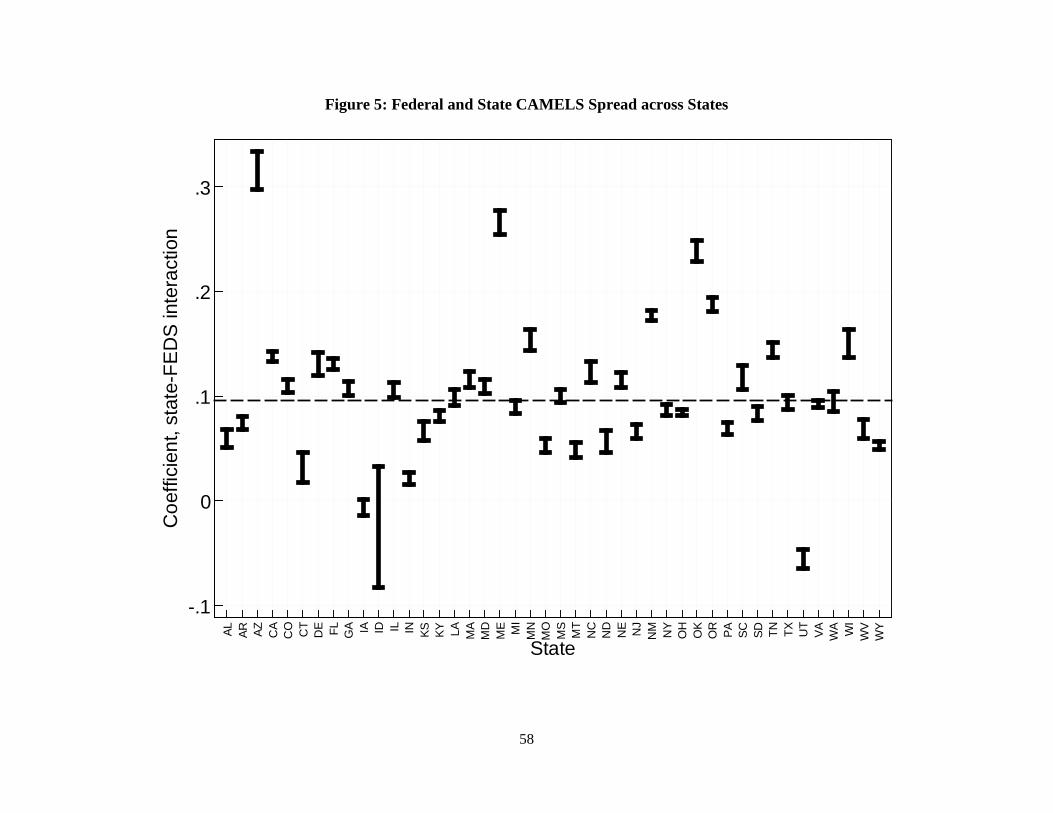
58
Figure 5: Federal and State CAMELS Spread across States
-.1
0
.1
.2
.3C
oeffi
cien
t, st
ate-
FED
S in
tera
ctio
n
AL AR AZ CA
CO CT
DE FL GA IA ID IL IN KS KY LA MA
MD
ME MI
MN
MO
MS
MT
NC
ND
NE NJ
NM NY
OH
OK
OR PA SC SD TN TX UT
VA WA WI
WV
WY
State