incomplete markets, land and fertilizer use in ethiopia workshop on an african green revolution...
Post on 21-Dec-2015
217 views
TRANSCRIPT

Incomplete markets, land and fertilizer use in Ethiopia
Workshop on An African Green Revolution
TokyoDecember 7-8, 2008

Alternative views
Africa needs its Green Revolution and it can’t wait. Africa can feed itself if farmers get the inputs they need – what theory are we waiting for? Jeffrey Sachs, Fertilizer Summit 2006
(T)here may be a role for non-fully rational behavior in explaining production decisions. Duflo, Kremer and Robinson (2008)

Why does it matter
Constraints on productivity Hard to imagine green revolution technologies
without increase in fertilizer use Sources of organic fertilizer is limited Sources of land for fallowing limited
Required for sustained land fertility Can deplete soils to point of no return
Most of Africa’s poor are in rural areas Growth in agriculture productivity often
leads economic growth

Reasons why fertilizer use is low in Africa
Transport and transaction costs Distance from farm to consumer is great and
infrastructure is poor Low output to input price ratio for fertilizer and
complementary inputs Small scale means more middlemen and higher
transaction costs Farmer characteristics
Farming skills and ability to take on risk Education, age, wealth Training, extension services
Farm and plot characteristics Tenure, rental status (fertilizer as an investment) Soil characteristics Heterogeneity of farm characteristics
Extension services less exact Harder to learn from neighbor

Data description
Survey data Two rounds 2004, 2006
Ethiopian Economic Association and World Bank 115 villages stratified by agroecological zones and
regions 2,140 panel households Plot level data (sort of)
Matching problem first round Information on extension history of farmer Information on rental status of plots
Spatial data Infrastructure Climate and weather

Technology choices
All crops
2004 2006Chemical Fertilizer 68.5 63.3Manure 28.1 58.0Improved Seeds 35.6 30.1
Percentage Share of households use of:

Selection model for chemical fertilizer
Standard input demand equation Relative prices Organic fertilizer use Land and capital Seed type Land characteristics Farmer age, education, wealth
Additional layer of factors that determines when fertilizer is applied or not
Ownership of land Additional transaction costs related to isolation Access to credit Membership in organizations that facilitate access to fertilizer Extension services Cattle/oxen for organic fertilizers

Survey Sites
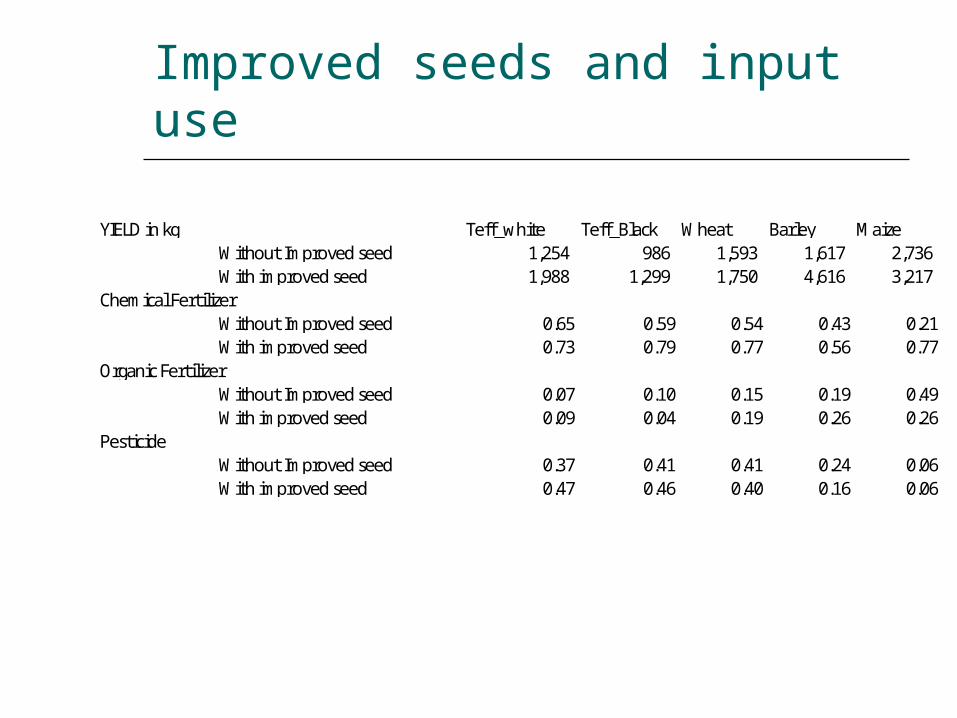
Improved seeds and input use
YIELD in kg Teff_white Teff_Black Wheat Barley MaizeWithout Improved seed 1,254 986 1,593 1,617 2,736 With improved seed 1,988 1,299 1,750 4,616 3,217
Chemical FertilizerWithout Improved seed 0.65 0.59 0.54 0.43 0.21With improved seed 0.73 0.79 0.77 0.56 0.77
Organic FertilizerWithout Improved seed 0.07 0.10 0.15 0.19 0.49With improved seed 0.09 0.04 0.19 0.26 0.26
PesticideWithout Improved seed 0.37 0.41 0.41 0.24 0.06With improved seed 0.47 0.46 0.40 0.16 0.06

EthiopiaRoads, cities and survey sites

Implied travel time to city of 50,000 or more

Regional variation
2004 2006 2004 2006 2004 2006 2004 2006Chemical Fertilizer 45.8 40.7 72.0 64.3 70.4 67.3 71.6 63.9Manure 24.9 52.3 37.3 53.9 23.3 50.2 30.4 86.6Improved Seeds 23.4 21.5 46.8 39.3 34.2 27.2 30.7 30.2
Tigray Amhara Oromia South
Percentage Share of Households use of: Regions

Crop variation
2004 2006Chemical Fertilizer use per hectare 140.1 213.7
By CropWhite Teff 120.4 223.3Black Teff 103.4 239.5Barley 133.5 175.6Wheat 124.6 232.1Maize 102.1 279.9Organic Fertilizer use per hectare 1713.7 1750.2
By CropWhite Teff 2066.2 1094.5Black Teff 1379.1 760.5Barley 1861.8 2321.1Wheat 1990.6 2280.1Maize 1604.8 1678.7
Fertilizer Use By Crop per Hectare

Fertilizer delivery
Tigray Amhara Oromia SouthCash 22.1 17.9 7.7 9.0Credit 33.7 14.5 13.5 4.3Land owner 9.5 1.7 14.4 16.6For free .. 8.9 20.3 1.5Owen animal dung 34.7 56.9 44.1 68.7
Tigray Amhara Oromia SouthCash 37.0 58.7 19.2 62.9Credit 63.0 40.0 80.4 35.7Own (Left over ) .. .. 0.03 0.4Land owner .. .. 0.2 0.1For free .. 1.3 0.2 1.0
Organic Fertilizer
Chemical Fertilizer
Fertilizer Acquisition by Region

Credit
2004 2006 2004 2006 2004 2006 2004 2006Access to Credit (all sources) 65.7 59.8 74.6 83.5 72.6 76.7 64.5 70.0Maximum Obtainable credit in Birr 1445 1570 1392 1944 1648 1960 1069 997
SouthOromiaAmharaTigray Access to Credit (% of households with access) by Region

Credit and extension bundle
2004 2006YES, ONLY ONCE 13.9 16.3YES, MORE THAN ONCE 28.5 9.6EVERY YEAR 11.8 9.1NO 42.5 65.0Denied 3.1 ..
Problem to repay the loan for inputsNot at all 34.9 69.9Once only 23.2 13.2Whenever I received credit 38.9 16.6I did not yet start re-payment 2.7 ..
Reasons for problems to repay loanLow price of output 27.9 34.8Low yield due to rain-related problems 25.1 20.9Low production due to insect, weed , etc 5.2 7.4Low production due to post-harvest loss 2.2 2.1Lack of market for products 2.5 3.5Forced to repay immediately after harvest 35.9 16.5Interest rate is high 0.7 ..Other 0.6 14.7
Credit during participation in the extension

Rental land and fertilizer use
Teff_white Teff_Black Wheat Barley MaizeChemical Fertilizer
Not Rented 0.65 0.60 0.58 0.44 0.35Rented In 0.69 0.59 0.56 0.38 0.71
ManureNot Rented 0.09 0.11 0.18 0.21 0.45Rented In 0.03 0.04 0.02 0.08 0.06
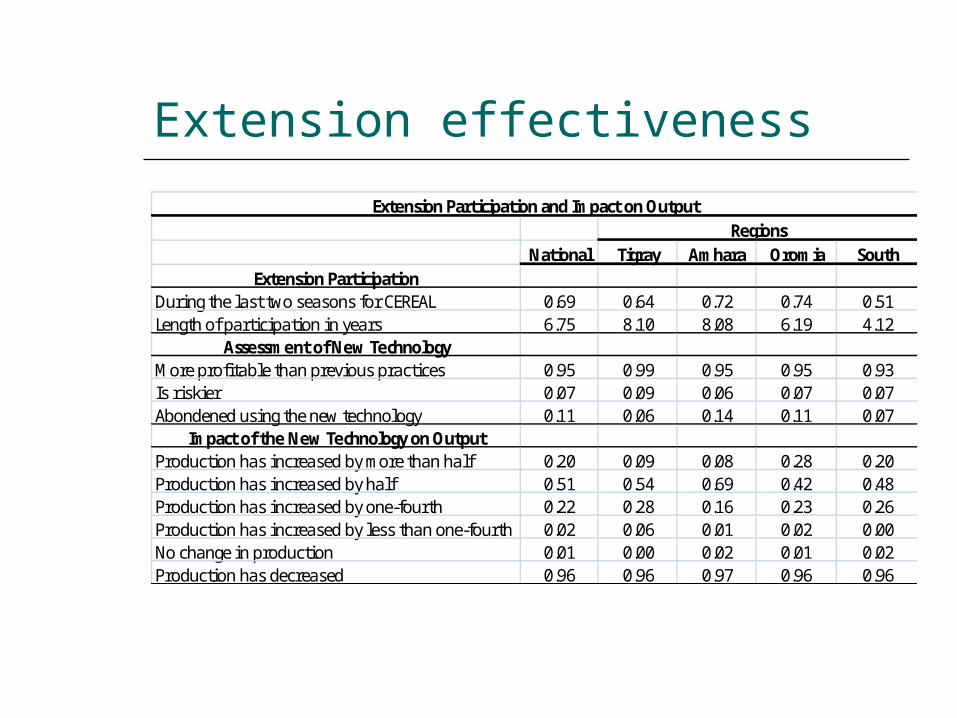
Extension effectiveness
National Tigray Amhara Oromia SouthExtension Participation
During the last two seasons for CEREAL 0.69 0.64 0.72 0.74 0.51Length of participation in years 6.75 8.10 8.08 6.19 4.12
Assessment of New TechnologyMore profitable than previous practices 0.95 0.99 0.95 0.95 0.93Is riskier 0.07 0.09 0.06 0.07 0.07Abondened using the new technology 0.11 0.06 0.14 0.11 0.07
Impact of the New Technology on OutputProduction has increased by more than half 0.20 0.09 0.08 0.28 0.20Production has increased by half 0.51 0.54 0.69 0.42 0.48Production has increased by one-fourth 0.22 0.28 0.16 0.23 0.26Production has increased by less than one-fourth 0.02 0.06 0.01 0.02 0.00No change in production 0.01 0.00 0.02 0.01 0.02Production has decreased 0.96 0.96 0.97 0.96 0.96
RegionsExtension Participation and Impact on Output
Help
Intention is to focus on maize and second round of survey to make use of plot-level data Is there scope for estimating multiple crops
together? Aggregate or disaggregated
If not, how to account for other production choices
How to solve the endogeneity problem Credit, seed type, possibly extension