incomes of the elderly and nonelderly, 1967-92 of the elderly and nonelderly, 1967-92 by daniel b....
TRANSCRIPT

Incomes of the Elderly and Nonelderly, 1967-92
by Daniel B. Radner *
This article examines the money incomes of the elderly and the non- elderly. The economic status of the elderly is put in perspective by discussing changes in real incomes since 1967 and the income of the elderly relative to the incomes of other age groups. Detailed age groups within both the elderly and nonelderly groups are examined. The article finds that the economic status of the elderly in 1992 was substantially better than in 1967, but was about the same as that in 1984. The real median income of the elderly rose during the period from 1967 to 1989, but declined from 1989 to 1992. The ratio of the income of the elderly to that of the nonelderly was higher in 1992 than in 1967, but the 1992 ratio was lower than that in 1984. Large increases in mean Social Security benefits were important in the increase in the total income of the elderly since 1967.
*Division of Economic Research, Office of Research and Statistics, Social Security Administration.
Acknowledgments: The author is greatly indebted to Sharon Johnson, who prepared the estimates, and to Benjamin Bridges, Jr., and Susan Grad for their many helpful comments.
The economic status of theelderly has been an important issue in recent years as the sizes of various Federal Government programs that focus on elderly individuals, such as Social Security and Medicare, have been scrutinized more closely. There is a general perception that the economic status of the elderly has been improving and that at the present time the elderly as a group are at least as well off as the nonelderly population. This perception has served as a rationale for proposed cuts in programs that mainly serve elderly persons (and/or for proposed higher costs borne by the elderly).
This article examines the income of the elderly (defined as aged 65 or older) and that of other age groups using data from the Current Population Survey (CPS). The economic status of the elderly is put into perspective by discussing changes in constant-dollar (“real”) income since 1967, and changes in the income of the elderly relative to the incomesof other age groups. Estimates for 1967-84 (Radner 1987a) and for 1984-89 (Radner 1991) have been published previously.’ Results for the entire 1967-92 period and for several subperiods are shown here.2
It is important to keep in mind that, as noted by many analysts, the aged are not a homogeneous group. For example, the 65-69 age group has a much higher aver-age income than the group aged 85 or older, and aged married couples have a much higher average income than aged single persons do. There is also a wide range of incomes within each of the sub- groups of the aged. In this article, esti- mates are presented for detailed age groups within the overall aged group, as well as for subgroups of the aged based on type of family unit. The nonaged (that is, those under age 65), of course, also are not a homogeneous group; corresponding subgroups are shown for the nonaged.
The choice of the measures of the economic status of the elderly used can affect the results of the comparisons made. In this article, the cash income before taxes of family units (families and unre- lated individuals) is examined.3 Family units are classified by the age of the “head.“4 5 Where it is feasible, median amounts of income, rather than means, are
Social Security Bulletin Vol. 58, No. 4 Winter 1995 l l 82

used. A mean, unlike a median, is affected by extreme values and, there- fore, often is a less satisfactory measure of the economic status of a typical unit. In most of the estimates shown here, income amounts are adjusted to take into account differences in needs associated with differences in the size of family unit and, for units of one and two persons, in the age of the head (aged or nonagedJ6
Narrow defmitions of income, such as the one used here, have been criticized as perhaps providing misleading impres-sions. Taking account of taxes and noncash income could, in fact, affect the results of the comparisons made.’ Un-fortunately, income data that cover taxes or noncash income do not exist for the full time period considered in this ar-ticle. Also, it should be noted that the types of noncash income that should be included in income, the valuations of those income types, and the appropriate adjustment for needs when noncash income is included are very controversial topics about which there is little consen-sus (Radner 1992, 1994).
The major findings of this article are:
The economic status of the aged in 1992, as measured by before-tax money income, was substantially better than in 1967, but was about the same as that in 1984.
From 1967 to 1992, the real me-dian income (adjusted for unit size and age) of elderly family units rose by 69 percent. The median decreased from 1989 to 1992; the 1992 median was slightly below the 1984 value.
The ratio of the median adjusted income of aged family units to the median for the nonaged increased from 0.526 in 1967 to 0.710 in 1992. The 1992 ratio, however, was below the 1984 ratio.
The poverty rate for aged persons fell sharply from 1967 to 1992, while the rate for nonaged persons rose. In each year shown, poverty rates were lowest for middle-age groups and highest for the young- est and oldest groups.
l The increase in total income for the aged from 1967 to 1992 was the result of large increases in mean Social Security benefits, property income, and pensions and other income, and a large decrease in mean earnings. The largest increase was in Social Security benefits.
Overview of the 194 7-92 Period
With regard to the economic status of the aged relative to the nonaged, the 1967-92 period discussed in detail in this article is not representative of the entire post-World War II period. During the 1967-92 period, the real mean income of the aged (unadjusted for unit size and age) rose faster than did the mean in-come of the nonaged-increases of 1.4 percent per year for the aged and 0.5 percent per year for the nonaged (table l).“, 9 The opposite relationship was evident for the aged and nonaged during the 1947-67 period-increases of 1.2 percent and 2.6 percent per year, respec- tively. The average annual percentage change in the real mean income of aged family units was not very different in the two periods; for nonaged family units, however, the difference was large.
Over the entire 1947-92 period, the real mean income of the aged rose slightly more slowly than did that of the nonaged-1.3 percent compared with 1.4 percent. The real mean income of aged units rose 79 percent during this 45year period, while the real mean income of nonaged units rose 90 percent.
There also was substantial variation in income growth in subperiods for both the aged and nonaged. For the sub- periods shown in table 1, the average annual percentage change in real mean income for the aged ranged from a high of 2.7 percent to a low of -0.4 percent. For the nonaged, changes ranged from a high of 3.2 percent to a low of -0.6 per- cent.
It is also useful to compare the levels of the incomes of the aged and nonaged. In addition, the use of more detailed age groups is important. Although more age detail for the aged is not available for the 1947-92 period, 1 O-year age groups for
the nonaged can be used. The ratio of the unadjusted mean income of aged family units to the mean income of the nonaged group as a whole and to the mean of each of five nonaged age groups is shown for selected years in table 2.‘O
The ratio of aged to nonaged mean incomes in 1992 (0.63) was slightly below the 1947 ratio (0.67).” The ratio in 1967 (0.50) was far below the ratios in both of those other years. Thus, as shown by the changes in income pre- sented in table 1, the increases in the income of the elderly relative to the in- come of the nonelderly during 1967-92 were very different from the changes during 1947-67. The low rate of income increase for the nonaged in 1967-92 relative to 1947-67 played an important role in the difference between the two periods.
From 1947 to 1992, the mean income of the elderly declined relative to the mean incomes of the groups aged 35-44, 45-54, and 55-64. During that period, the mean income of the elderly rose relative to that of the 25-34 age group, and rose sharply relative to that of the group under age 25. From 1947 to 1967, the mean income of the elderly decreased relative to the mean income of each of the five nonaged groups. In contrast, from 1967 to 1992, the mean income of the elderly rose relative to the mean income of each of the five nonaged age groups.
In summary, the relative increase in the income of the aged in the 1967-92
Table 1 .-Average annual percentage change in real mean income of family units, by age of unit head, 1947-92
Age
Period All ages Under 6.5 65 or older
1947-57.... 1.7 2.1 -0.4 1957-67.... 3.0 3.2 2.7 1967-77.... .9 .9 1.7 1977-87.... .8 .7 2.0 1987-92.... -.5 -.6 -.2
1947-92.... 1.4 1.4 1.3 1947-67.... 2.4 2.6 1.2 1967-92.... .6 .5 1.4
1. Source, Derived from published Current
Population Survey estimates in various Current Population Reports, Series P-60.
Social Security Bulletin Vol. 58, No. 4 Winter 1995 l l 83

Table 2.-Ratio of mean income of aged family units to mean incomes of nonaged family units, selected years 1947-92
~- ~~ .~~..19571 -~ ~. Age of head 1967 ) 1979 1984 I 1989!19F
-. A-. ..l----d-- -.
Under 65 . . . . . . ..__..... 0.67 0.52 0.50 0.54 0.65 0.63 0.63
Under 25 . . . . .._....... 1.11 .81 .88 1.03 1.45 1.51 1.61 25-34 . . . . . . .._......... .73 .53 .53 .60 .75 .76 .77 35-44 . . . . . . . . . . . . . . . . . .61 .47 .45 .46 .56 .55 .56 45-54 .60 .47 .43 .43 .51 .48 .48 55-64 . . . . . . . . . . . . . . . . . . .67 .58 54 .51 .60 .59 .59
~__..
Source: Radner 1987a, Radner 1991, and tabulations from the March 1993 Current Population Survey.
period, to a great extent, merely offset the relative decline in the income of the aged in the 1947-67 period. The post- World War II era also has been charac- terized by fluctuations in the rates of growth of the income of the aged and the nonaged.
The 1967-92 Period
The data available for the 1967-92 period permit more appropriate and more detailed estimates of changes in the incomes of age groups than is possible for the entire post-World War II era. Reasonably comparable microdata files are available for the 1967-92 period, thus making possible the use of median in- comes, adjustments for differential needs associated with differing size and com- position of unit, and more detailed age groups in this article. More detailed characteristics of the distribution of in- 1 come also are shown. Detailed estimates are presented for 1967, 1979, 1984, 1989, and 1992.12 (See Radner (1987a, 1986) for more detail about technical issues.)‘3, I4
Income adjusted for needs was de- rived by dividing income amounts by equivalence scale values. The resulting amounts can be thought of as income per equivalent adult. The equivalence scale was based on the weighted average pov- erty thresholds. A one-person unit (all ages) was used as the base.15
Overall economic conditions can have an impact on the relative incomes of the aged and nonaged. Generally speaking, the income of the nonaged is more strongly influenced by current economic conditions than is the income
of the aged. Because of this, the com- parison of years of low economic activity with years of high activity can affect estimates of the relationship between the incomes of the aged and nonaged. Al- though none of the 5 years selected for comparison was a recession year, the levels of economic activity did differ; the civilian unemployment rate ranged from 3.8 percent in 1967 to 7.4 percent in 1992 and 7.5 percent in 1984. The 1967-79 and 1979-84 subperiods each contained two recessions, the 1989-92 subperiod contained one, and the 1984- 89 subperiod contained none. Thus, it should be kept in mind that overall eco- nomic conditions in fact differed among the years and the subperiods.
One important change during the 1967-92 period was the shift in the age distribution as the baby boom cohort grew older. The group aged 25-44 in- creased from 37 percent of all family units in 1967 to 44 percent in 1992. In contrast, the 45-64 age group decreased from 36 percent of all family units in 1967 to 29 percent in 1992. The per- centage accounted for by aged units rose only slightly, from 19 percent in 1967 to 20 percent in 1992.16
Another important change during the period was the rise in the labor-force participation of women from 41 percent in 1967 to 58 percent in 1992. The labor-force participation of men fell from 80 percent in 1967 to 76 percent in 1992 (Council of Economic Advisers 1995).
Several types of estimates are shown in this section: real median incomes, changes in real median incomes, relative incomes, relative income shares, poverty
rates, real amounts of income types, the composition of total income,r and real median incomes of several types of units.
Median Total Incomes of Age Groups
As an overview of the general pattern of change over the 1967-92 period, the ratio of the median income of elderly units to the median income of nonelderly units (with both amounts adjusted for unit size and age) is shown for selected years in table 3. Over the entire 1967-92 period, that ratio rose from 0.526 to 0.710, an increase of 35 percent.” The ratio rose sharply from 1967 to 1977 and from 1979 to 1984. From 1984 to 1988, however, the ratio declined. The ratio rose sharply from 1989 to 1990, and then fell from 1990 to 1992.18 The 1992 level, 0.710, is the same as the 1983 level.
These changes result from different rates of change of total income for the elderly and nonelderly in the various subperiods. Different rates of change in amounts of specific types of income affect the rates of change of total income. Differences for both total income and for specific income types will be dis- cussed.
Table 3 .-Ratio of aged to nonaged median incomes of family units, selected years 1967-92
Year ~- [ RatJ Chang~si;~~
1967 . . . . . . . . 1972 ..___....... 1977 . . . . . . . . 1979 . . . . . . . . . 1980 . . . .._._.__...~
0.526 ,572 ,603 ,604 .63 1
(1) (1) (1) (1)
,027 1981....._........ I ,668 ,037 1982 . . . . . ..__... ,699 ,031 1983 . . . . . . . . . . ,710 ,011 1984 . . . . .._.__.. ,727 ,017 1985 . . . . . . . . . . . ...’ ,712 -.015 1986 . . . . . . . . . . ,706 -.006 1987 . . . .._._..... .697 -.009 1988 . . . . . . . . . . . ,693 -.004 1989 . . . .._...__. ,693 0 1990 . . . . . . . . . . ,725 ,032 1991...,...,...... ,720 -.005 1992 . . . . . . . . . , ,710 -.OlO
,
’ Data not available. Note: Income adjusted for unit size and age. Source: Radner 199 1 and tabulations from
various March Current Population Survey tiles.
l lSocial Security Bulletin Vol. 58, No. 4 Winter 1995 84

Median tatal incomes of family units, adult. Estimates are shown for detailed adjusted for unit size and age and classi- age groups: 5-year age groups beginning fied by the age of the head, are shown in with age 20 and ending with an open- 1992 dollars for selected years in table ended group of units aged 85 or older. 4.19 As noted, these dollar amounts can For units with the head aged 65 or be interpreted as income per equivalent older, median adjusted income in con-
Table 4.-Median family unit income in 1992 dollars, by age of unit head, selected years 1967-92
Age ~,-- 1979 ~ 1989 ’ 1992‘!26yJ 1984 ~ ___..-
All ages...... $15,586 $19,590 $19,857 $20,995 $19,777
Under 65 . . . . . . . . 16,994 21,440 21,027 22,462 21,330 65 or older 8,940 12,960 15,300 15,557 15,143
20-24 . .._._.__..... 13,738 15,392 12,669 13,255 11,265 25-29 .._ 16,365 20,338 19,464 19,734 18,036 30-34 . . . . . . . . . ’ 15,457 21,471 20,656 21,363 19,930 35-39 15,531 21,555 22,494 22,998 21,404 40-44 . . . . . . . . . . ~ 17,109 22,622 23,445 25,717 23,956 45-49 I’ 19,346 25,187 25,854 28,588 27,513 50-54 . . . . . . . . . ~ 20,546 25,796 26,25 1 29,328 27,844 S-59 19,539 26,029 25,030 26,371 26,483 60-64 . . . . . . . . . . . 17,168 21,135 20,999 23,137 21,937 65-69 . . . . . . . . . . . 11,547 15,868 18,633 19,436 18,848 70-74 9,423 13,481 15,752 16,875 16,129 75-79 . . . . . . . . . . . . 7,524 11,653 13,620 13,661 14,358 80-84 . . . . . . . . . . . . 6,714 10,585 11,720 12,102 11,869 85 or older ~! .._... 5,974 9,593 11,109 11,230 10,815
Note: The group under age 65 and the all ages group include unit heads aged 15-19. Income adjusted for unit size and age.
Source: Derived from estimates in Radner 1987a, Radner 1991, and tabulations from the March 1993 Current Population Survey.
Chart 1 .-Median adjusted family unit income in 1992 dollars, by age of unit head, 1967 and 1992
(Median income in thousands)
“-
20-24 25-29 30-34 35-39 40-44 45-49 50-54 55-59 60-64 65-69 70-74 75-79 60-84 65 or older
Age
stant dollars rose from $8,940 in 1967 to $15,143 in 1992, an increase of 69 per- cent. Median income for the nonaged rose from $16,994 to $2 1,330, a rise of 26 percent. Median income rose from 1967 to 1992 for each detailed age group except the 20-24 age group; for almost all age groups the rise was substantial (chart 1).
The median income of the aged rose in each subperiod from 1967 to 1989. The median for that group decreased by almost 3 percent from 1989 to 1992; the 1992 figure was 1 percent below the 1984 amount. The median income of the nonaged increased from 1967 to 1979 and from 1984 to 1989, and decreased from 1979 to 1984 and also from 1989 to 1992. The decline from 1989 to 1992 was 5 percent. For the nonaged, the 1992 figure was slightly above the 1984 value, but was slightly below the 1979 value.
The average annual rate of change in real median income is shown for the entire period and for several subperiods in table 5. For the entire period, real median income rose 2.1 percent per year for the aged and only 0.9 percent per year for the nonaged.
In both subperiods from 1967 to 1984, median income grew faster for the aged than for the nonaged (during the 1979-84 subperiod, median income de- clined for the nonaged). During the 1984-89 subperiod, median income grew faster for the nonaged than for the aged. During the 1989-92 subperiod, median income dropped for both the aged and the nonaged, but the decline was larger for the nonaged (chart 2).
The average annual rate of change from 1967 to 1992 was higher for each detailed aged group (ranging from 2.6 to 2.0 percent per year) than it was for each detailed nonaged group (ranging from 1.4 to -0.8 percent per year). When subperiods are examined, this strong relationship in income change by age of head holds only for the 1979-84 subperiod. The relationship also holds for the four oldest detailed age groups in the 1967-79 subperiod.
The income changes described above produced changes in the relative median incomes of age groups.*’ Those relative
Social Security Bulletin Vol. 58, No. 4 Winter 1995 l l 85
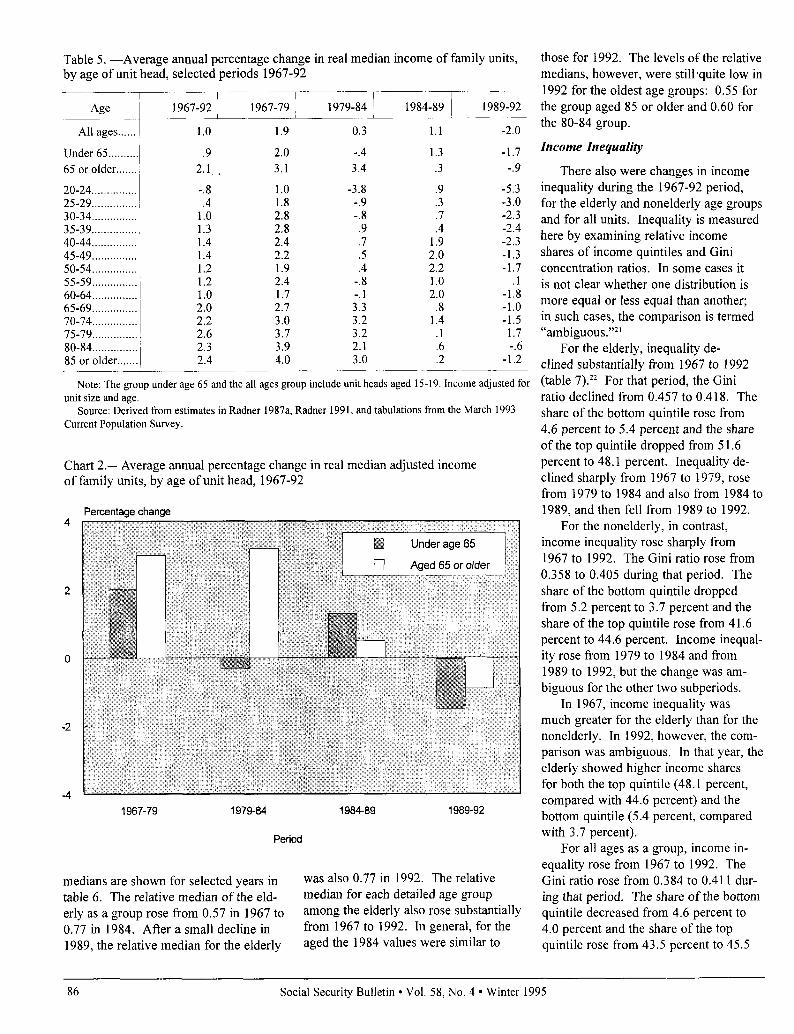
Table 5. -Average annual percentage change in real median income of family units, those for 1992. The levels of the relative by age of unit head, selected periods 1967-92 medians, however, were still,quite low in
1992 for the oldest age groups: 0.55 for ~~,:~--~~~~~~~-~~4~~198U~ the group aged 85 or older and 0.60 for
the 80-84 group.
Under 65.. ......... .9 2.0 4 1.3 -1.7 Income Inequality
65 or older.. ..... 2.1 . 3.1 ;:4 .3 -. 9 There also were changes in income
20-24.. ............. -. 8 1.0 -3.8 .9 -5.3 inequality during the 1967-92 period, 25-29.. ............. .4 1.8 -. 9 .3 -3.0 for the elderly and nonelderly age groups 30-34.. ............. 1.0 2.8 -. 8 .7 -2.3 and for all units. Inequality is measured 35-39.. .............. 1.3 2.8 .9 .4 -2.4 40-44.. ............. 1.4 2.4 .7 1.9 -2.3 here by examining relative income
45-49.. ............. ~ 1.4 2.2 .5 2.0 -1.3 shares of income quintiles and Gini 50-54 ................ 1.2 1.9 .4 2.2 -1.7 concentration ratios. In some cases it 55-59.. ............. 1.2 2.4 -. 8 1.0 .l is not clear whether one distribution is 60-64 ............... 1.0 1.7 1 2.0 -1.8
2.7 ;:3 .8 -1.0 more equal or less equal than another; 65-69.. ............. 2.0 70-74.. ............. 2.2 3.0 3.2 1.4 -1.5 in such cases, the comparison is termed 75-79.. ............. 2.6 3.7 3.2 .l 1.7 i‘ambiguous.“21 80-84.. ............. 2.3 3.9 2.1 .6 6 For the elderly, inequality de- 85 or older ....... 2.4 4.0 3.0 .2 -;:2 clined substantially from 1967 to 1992 ~___
Note: The group under age 65 and the all ages group include unit heads aged 15-19. Income adjusted fat (table 7).‘* For that period, the Gini unit size and age. ratio declined from 0.457 to 0.418. The
Source: Derived from estimates in Radner 1987a, Radner 1991, and tabulations from the March 1993 share of the bottom quintile rose from Current Population Survey. 4.6 percent to 5.4 percent and the share
of the top quintile dropped from 5 1.6
Chart 2.-Average annual percentage change in real median adjusted income percent to 48.1 percent. Inequality de-
of family units, by age of unit head, 1967-92 clined sharply from 1967 to 1979, rose from 1979 to 1984 and also from 1984 to
Percentaqe change 1989, and then fell from 1989 to 1992. For the nonelderly, in contrast,
income inequality rose sharply from 1967 to 1992. The Gini ratio rose from 0.358 to 0.405 during that period. The share of the bottom quintile dropped from 5.2 percent to 3.7 percent and the share of the top quintile rose from 4 1.6 percent to 44.6 percent. Income inequal- ity rose from 1979 to 1984 and from 1989 to 1992, but the change was am- biguous for the other two subperiods.
In 1967, income inequality was much greater for the elderly than for the nonelderly. In 1992, however, the com- parison was ambiguous. In that year, the elderly showed higher income shares for both the top quintile (48.1 percent, compared with 44.6 percent) and the
1967-79 1979-64 1984-89 1989-92 bottom quintile (5.4 percent, compared with 3.7 percent). Period
For all ages as a group, income in- equality rose from 1967 to 1992. The
medians are shown for selected years in was also 0.77 in 1992. The relative Gini ratio rose from 0.384 to 0.411 dur- table 6. The relative median of the eld- median for each detailed age group ing that period. The share of the bottom erly as a group rose from 0.57 in 1967 to among the elderly also rose substantially quintile decreased from 4.6 percent to 0.77 in 1984. After a small decline in from 1967 to 1992. In general, for the 4.0 percent and the share of the top 1989, the relative median for the elderly aged the 1984 values were similar to quintile rose from 43.5 percent to 45.5
86 Social Security Bulletin Vol. 58, No. 4 Winter 1995l l

Table 6.i-Relative median incomes of family units, by age of unit head, selected years 1967-92
Age 1967 1979 1984 1989 1992
All ages ...... 1 .oo 1.00 1.00 1 .oo 1.00
Under 65 ......... 1.09 1.09 1.06 1.07 1.08 65 or older ....... .57 .66 .77 .74 .77
20-24., ............ .88 .79 .64 .63 .57 25-29 .............. 1.05 1.04 .98 .94 .91 30-34 .............. .99 1.10 1.04 1.02 1.01 35-39 .............. 1 .oo 1.10 1.13 1.10 1.08 40-44 .............. 1.10 1.15 1.18 1.22 1.21 45-49 .............. 1.24 1.29 1.30 1.36 1.39 50-54 .............. 1.32 1.32 1.32 1.40 1.41 55-59 .............. 1.25 1.33 1.26 1.26 1.34 60-64 .............. 1.10 1.08 1.06 1.10 1.11 65-69.. ............ .74 .81 .94 .93 .95 70-74 .............. .60 .69 .79 .80 .82 75-79 .............. .48 .59 .69 .65 .73 80-84. ............. .43 .54 .59 .58 .60 85 or older ....... .38 .49 .56 .53 .55
Note: The group under age 65 and the all ages group include unit heads aged 15-19. Income adjusted for unit size and age.
Source: Radner 1987a, Radner 1991, andtabulationskomthe March 1993 Current Population Survey.
Table 7.-Relative income shares of income quintiles of family units, by age of unit head, selected years 1967-92
Age and quintile 1967 1979 1984 1989 1992
All ages
1 ........................... 4.6 4.8 4.2 4.2 4.0 2 ........................... 11.0 11.0 10.3 10.1 10.0 3 ........................... 16.9 17.0, 16.4 16.2 16.2 4. .......................... 24.1 24.5 24.1 24.0 24.2 5 ........................... 43.5 42.7 45.1 45.5 45.5
Gini ratio .............. .384 ,376 ,404 ,408 ,411
Under 65 1 ........................... 5.2 4.8 3.9 4.0 3.7 2 ........................... 12.0 11.8 10.7 10.6 10.3 3 ........................... 17.3 17.6 16.8 16.7 16.8 4 ........................... 23.9 24.6 24.4 24.2 24.6 5 ........................... 41.6 41.3 44.1 44.4 44.6
Gini ratio .............. ,358 ,362 ,397 ,399 ,405
65 or older
1 ........................... 4.6 5.9 5.6 5.4 5.4 2 ........................... 8.8 10.1 9.5 9.4 9.8 3 ........................... 13.3 14.8 14.5 14.3 14.7 4. .......................... 21.6 22.1 22.2 22.0 22.1 5 ........................... 51.6 47.1 48.1 48.9 48.1
Gini ratio.. ............ ,457 ,402 ,416 ,426 ,418
Note: Income adjusted for unit size and age. Source: Radner 19874 Radner 199 1. and tabulations from the March 1993 Current Population Survey.
percent. Inequality dropped from 1967 to 1979, then rose in the other three subperiods.
Another way to examine changes in income inequality is to compare changes in the incomes of income quintiles. Changes in the real mean incomes of income quintiles are shown for the eld- erly, the nonelderly, and for all ages in table 8. It is important to note that these changes are for portions of the distribu- tions, rather than for specific family units. That is, units are ranked by the specific year’s income, not by their in- come in an earlier year. Unlike the rela- tive share comparisons discussed earlier, these estimates show sizes of income changes, as well as relative changes.
For the elderly, real mean income adjusted for unit size and age rose 2.4 percent per year for the bottom income quintile and only 1.4 percent per year for the top quintile from 1967 to 1992. The higher the income quintile, the lower the rate of increase in income.
The rates of income change for the nonelderly, however, showed the oppo- site pattern. The top quintile had the highest increase (1.3 percent per year), while the bottom quintile had a decrease (-0.3 percent per year) tirn 1967 to 1992.
The increase in income for each elderly quintile was greater than the increase (or decrease) for any nonelderly quintile from 1967 to 1992. When the bottom quintiles in the two age groups are compared, the mean income of the elderly rose by 2.4 percent per year, while the mean income of the nonelderly dropped by 0.3 percent per year. For the top quintiles the difference was very small-the mean income of the elderly rose 1.4 percent per year, while the mean income of the nonelderly rose 1.3 percent per year.
For the 1989-92 subperiod, all quintiles of both age groups showed decreases in mean income. For the eld- erly, the largest decline (-2.5 percent per year) was in the top quintile, while the smallest decline (-0.6 percent per year) was in the second quintile. For the nonelderly, the largest drop (-4.2 percent per year) was in the bottom quintile, while the smallest decrease (- 1.4 percent per year) was in the fourth quintile.
Social Security Bulletin Vol. 58, No. 4 Winter 1995l l 87

For the elderly, in the 1967-79 Table 8.-Average annual percentage change in real mean incomes of income subperiod, the increase was larger for quintiles of family units, by age of unit head, selected periods 1967-92
lower quintiles than for higher quintiles. In the 1979-84 and 1984-89 subperiods, Period -.-however, the opposite was true. For the Age and quintile 1967-92 1967-79 1979-84 , 1984-89 1989-92 nonelderly, increases generally were higher for the higher quintiles in the
All ages I
1967-79 and 1979-84 subperiods; in the Total.. ........... 1.1 1.9 1.0 1.3 -1.9
1984-89 subperiod, increases were high- 1 ......................... .5 2.1 -1.5 1.2 -3.5
est in the lowest and highest quintiles. 2 .......................... .8 1.9 -_ 4 1.1 -2.2 3 ......................... 1.0 2.0 .2 1.1 -1.8
In summary, from 1967 to 1992 4. ........................ 1.2 2.0 .7 1.2 -1.6 income inequality declined for the 5 ......................... 1.3 1.7 2.1 1.5 -1.8 elderly and rose for the nonelderly.
Under 65Inequality was much greater for the elderly than for the nonelderly in 1967; Total ............. 1.0 1.8 .5 1.4 -1.9
the comparison was ambiguous in 1992. 1 ......................... -. 3 1.1 -3.3 1.7 -4.2 2. ........................ .4 1.7 -1.4 1.3 -2.7 3 ......................... .9 1.9 -_ 3 1.3 -1.8
Poverty 4. ........................ 1.2 2.1 .4 1.3 -1.4 5 ......................... 1.3 1.8 1.9 1.6 -1.8
Poverty rates refer to the lower part of the income distribution, using a par- 65 or older
ticular set of income thresholds to define Total .............. 1.7 2.2 3.7 .8 -1.9
that section of the distribution. As has 1 ......................... 2.4 4.3 2.7 -. 1 -1.7
been well documented, the official pov- 2. ........................ 2.2 3.4 2.6 .5 -.6 3 ......................... 2.1 3.2 3.3 .5 -1.1
erty rate for elderly persons declined 4. ........................ 1.8 2.4 3.7 .6 -1.8 sharply during the past several decades. 5 ......................... 1.4 1.5 4.1 1.2 -2.5 From 1967 to 1992, the poverty rate for
Note: Income adjusted for unit size and age. aged persons decreased from about 27.9 Source: Derived from estimates in Radner 1987a, Radner 1991, and tabulations from the March 1993 percent to 12.9 percent (table 9).23 In Current Population Survey. contrast, during that period the rate for nonaged persons rose from 11.8 percent to 14.7 percent. Table 9. -Percentage of persons in poverty, by age of person, selected years 1967-92
All detailed age groups 55 or older showed declines in their poverty rates from 1967 to 1992 (table 9). In contrast, all detailed age groups under age 5.5 11.5 14.4 12.8 14.5
showed increases in their poverty rates Under 65 .......... 11.1 14.7 13.0 14.7 during that period. The rises were small 65 or older ....... 15.1 12.4 11.4 12.9 for the 40-54 age groups.
The poverty rate for each detailed age Under 5 ............ 17.9 23.9 22.6 26.1 5-9.. ................. 16.9 22.6 20.3 22.4
group was higher in 1992 than in 1989 10-14.. ............. 15.6 20.1 18.1 19.2 (table 9). Thus, the rates for the elderly 15-19.. ............. 13.3 18.0 15.6 18.2 age groups declined even more from 20-24.. ............. 1 10.5 10.8 16.0 14.8 17.5 1967 to 1989 than from 1967 to 1992. 25-29.. .............. 8.0 8.5 12.5 11.3 14.2
The rate for the elderly was slightly 30-34.. .............. 8.9 7.6 11.4 10.8 12.4 35-39.. ............. 8.2 7.6 10.0 8.9 10.7
higher in 1992 than in 1984. 40-44.. ............. 8.0 7.1 9.6 7.2 8.7 In each of the 5 years shown, poverty 45-49.. ............. 7.0 7.1 9.4 7.2 7.5
rates were lowest for the middle age 50-54.. ............. 7.6 7.5 9.4 7.7 8.4 groups and highest for the youngest and 55-59.. ............. ~ 11.1 8.3 9.9 9.7 10.0
oldest groups. In 1967, the oldest age 60-64.. ............. 15.4 10.8 10.9 9.5 10.6 65-69.. ............. 21.8 12.2 9.4 8.2 10.4
groups had by far the highest rates of any 70-74.. ............. 25.8 13.4 11.5 9.6 10.9 age group. In 1992, however, the young- 75-79.. ............. 33.3 17.9 13.7 13.5 13.7 est groups had the highest rates.24 80-84.. ............. 37.7 19.4 17.7 16.7 17.6
It is also important to consider the 85 or older.. .... .I 38.0 22.7 18.4 18.4 19.8 -
percentage of each age group that is not Note: The 1967 and 1979 estimates shown utilize the poverty definitions in effect at those times. very far above the poverty threshold. Source: Radner 1991 and tabulations from various March Current Population Survey files.
88 Social Security Bulletin Vol. 58, No. 4 Winter 1995l l

Although in 1992 the percentage of Table lo.--Mean incomes of family units in 1992 dollars, by type of income and age of persons below the poverty threshold was lower for the aged (12.9 percent) than for the nonaged (14.7 percent), the opposite was true for the percentages below 125 percent and 150 percent of the threshold. For the aged, 20.4 percent were below 125 percent of the threshold and 27.6 percent were below 1.50 percent of the threshold; the corresponding figures for the nonaged were 19.2 percent and 23.6 percent, respectively.
Although the youngest age groups had the highest poverty rates in 1992, the group aged 85 or older had the high- est percentages below 125 percent of the threshold (32.8 percent), and below 150 percent of the threshold (42.1 percent). The oldest age group had the highest percentage between the threshold and 150 percent of the threshold, 22.3 per- cent of the age group. The youngest group had 11 .O percent in that range.
Changes in Income Types
In this subsection, changes in the real amounts of specific income types (ad- justed for unit size and age) are exam- ined in order to shed more light on the causes of changes in total income. The income types examined are: earnings, which includes wage and salary income and nonfarm and farm self-employment income; Social Security, which includes Old-Age, Survivors, and Disability In-surance (OASDI) benefits and Railroad Retirement benefits; property income, which includes interest, dividends, rent, and income from estates and trusts; pen-sions, which includes private pensions, annuities, and government pensions, both civilian and military; and other, which includes Supplemental Security Income (SSI), Aid to Families with De-pendent Children (AFDC), unemploy-ment compensation, worker’s compensa-tion, veterans’ payments, alimony, child support, regular contributions from out-side the household, and other regularly received cash income. These income types sum to total cash income.25
Table 10 shows mean income in 1992 dollars adjusted for unit size and
unit head, selected years 1967-92
Type of income
Total Social Pensions,
Age and year ~ income Earnings -,-...-.A
Security Property and other Pensions Other
All ages
1961.. ............................ $18,501 $15,952 $948 $822 $779 (1) (1) 1979 ........ ..................... 23,129 18,303 1,616 1,527 1,623 838 785
1984.. ................... ........ 24,312 18,366 1,880 2,261 1,807 1,007 199
1989.. ............................ 25,963 19,906 1,895 2,148 2,013 1,198 815 1992.. ............................ 24,530 18,711 1,935 1,673 2,211 1,239 972
Under 65
1961.............................. 19,696 18,375 264 527 531 (1) (1) 1919.. ............................ 24,468 21,721 441 998 1,300 483 817
1984.. ........... ..... .......... 25,106 21,913 431 1,375 1,386 542 845
1989.. ............................ 26,97 I 23,735 419 1,339 1,477 619 858
1992.. ........... .......... ..... 25.492 22,370 433 1,049 1,640 595 1,045
65 or older
1961... .......................... 13,506 5,841 3,807 2,049 1,805 (1) (1) 1979.. ............................ . 17,632 4,269 6,720 3,694 2,949 2,297 653
1984.. ............................. 21,130 4,149 7,682 5,814 3,486 2,870 616
1989 ......... ... ................ 22,004 4,869 7,693 5,326 4,115 3,470 645
1992.. ............................ 20,755 4,353 7,828 4,120 4,454 3,768 686
Under 25
1967 ... ... ...................... 13,809 13,242 51 110 405 (1) (1)
1979.. ............................ 16,104 14,722 105 212 1,063 19 1,044 1984.. ............................. 13,825 12,337 52 271 1,166 19 1,146
1989.. ............................ i 14,198 12,753 60 224 1,161 31 1,130
1992.. .......... ....... ..... 12,456 10,708 60 236 1,452 18 1,434
25-34 1967.. .......... .................. 18,049 17,443 15 169 362 (1) (1) ,979.. ............................ ~ 23,160 21,197 95 401 869 48 821 1984.. ............................ 22,929 21,458 84 507 879 91 788
1989.. ................ ... ..... 23,192 22,364 98 476 854 75 780
1992.. ............................ 22,154 20,679 107 335 1,032 64 968
35-44 1961.............................. 18,882 17,993 177 295 417 (1) (1) 1979 .... ... ..................... 24,933 23,055 244 760 876 170 706
1984.. ............................ 26,429 24,370 198 967 893 134 759
1989.. ............................ 28,056 25,931 203 1,008 912 159 753
1992.. ............. .............. 26,216 24,169 217 720 1,l IO lb1 949
45-54
1967.. .................... ....... 22,630 21,065 291 684 594 (1) (1) 1q19.. ............................ 28,087 24,987 483 1,273 1,342 563 779
1984.. ............................ 29,860 26,248 409 1,723 1,480 586 894
1989.. ............................ 33,463 29,755 372 1,831 1,504 614 890 1992.. ............................ 31,771 28,110 409 1,574 1,619 609 1,070
55-64
1967.. ............................. 21,502 18,898 621 1,160 826 (1) (1) 1979.. ........... .............. 27,740 21,322 1,416 2,436 2,566 1,737 829
1984.. ............................ 28,678 20,543 1,556 3,648 2,930 2,093 836
1989.. ............................ 30,7 18 21,852 1,625 3,531 3,711 2,129 982
1992.. ............................ 29,122 21,094 1,643 2,667 3,718 2,621 1,097
65-74
1967.. ..................... ... 15,111 7,441 3,768 1,998 1,904 (1) (1) 1979 ..................... .I 19,130 5,614 6,683 3,606 3,224 2,596 628 1984.. ........................ ... 23,192 5,668 1,102 5,799 4,024 3,375 649
1989.. .......................... ..’ 24,694 6,865 1,516 5,390 4,922 4,22 I 702 1992.. ............................ 23,284 6,330 7,538 4,181 5,234 4,461 773
75 or older
1967.. ............................ 10,761 3,103 3,878 2,143 1,640 (1) (1) 1919.. ........................ ... 15,228 2,108 6,779 3,831 2,510 1,814 691
1984.. ............................ 18,072 1,896 7,652 5,834 2,691 2,122 569
1989.. ..................... 18,288 2,112 7,938 5,236 3,001 2,434 567
1992.. ............................ 17,456 1,772 8,207 4,040 3,436 2,864 572
age for IO-year age groups, all units, ’ Data not available.
Note: Income adjusted for unit size and ageaged units, and nonaged units, for se- Source: Derived from estimates in Radwzr 1987a, Radner 1991, and tabulations from the March 1993
lected years in the 1967-92 period. Current Population Survey.
Social Security Bulletin Vol. 58, No. 4 Winter 1995l l 89
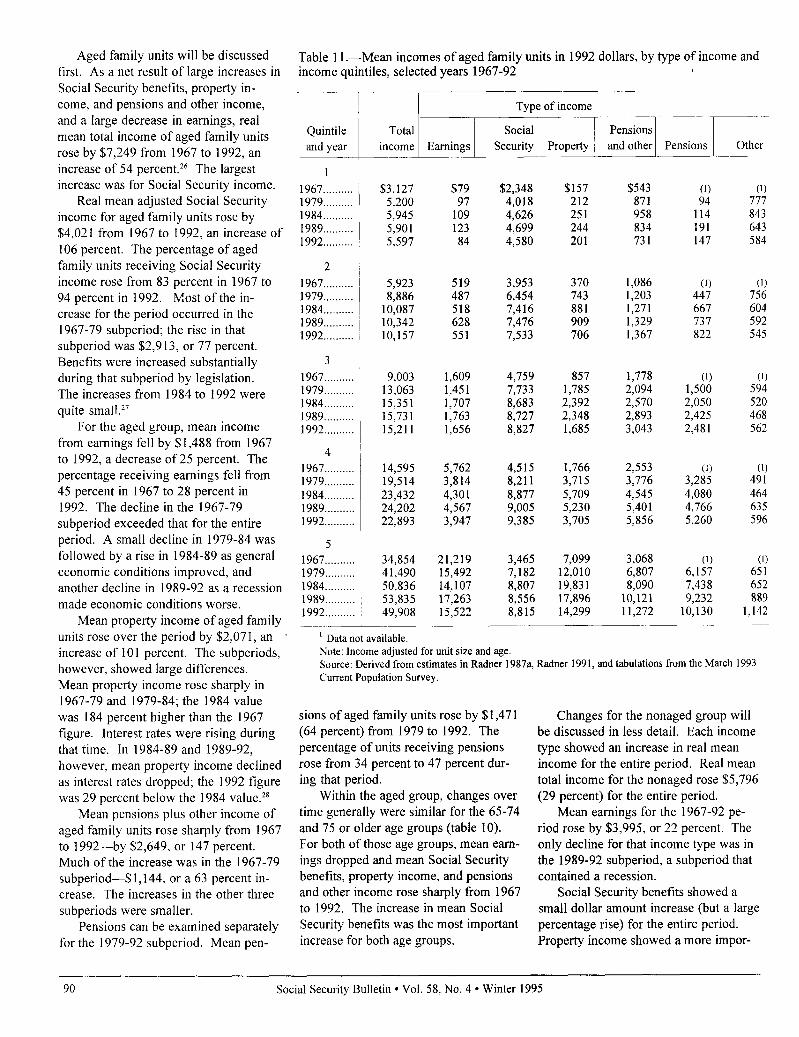
Aged family units will be discussed first. As a net result of large increases in Social Security benefits, property in-come, and pensions and other income, and a large decrease in earnings, real mean total income of aged family units rose by $7,249 from 1967 to 1992, an increase of 54 percent.26 The largest increase was for Social Security income.
Real mean adjusted Social Security income for aged family units rose by $4,021 from 1967 to 1992, an increase of 106 percent. The percentage of aged family units receiving Social Security income rose from 83 percent in 1967 to 94 percent in 1992. Most of the in- crease for the period occurred in the 1967-79 subperiod; the rise in that subperiod was $2,913, or 77 percent. Benefits were increased substantially during that subperiod by legislation. The increases from 1984 to 1992 were quite small.27
For the aged group, mean income from earnings fell by $1,488 from 1967 to 1992, a decrease of 25 percent. The percentage receiving earnings fell from 45 percent in 1967 to 28 percent in 1992. The decline in the 1967-79 subperiod exceeded that for the entire period. A small decline in 1979-84 was followed by a rise in 198489 as general economic conditions improved, and another decline in 1989-92 as a recession made economic conditions worse.
Mean property income of aged family units rose over the period by $2,07 1, an increase of 101 percent. The subperiods, however, showed large differences. Mean property income rose sharply in 1967-79 and 197984; the 1984 value was 184 percent higher than the 1967 figure. Interest rates were rising during that time. In 1984-89 and 1989-92, however, mean property income declined as interest rates dropped; the 1992 figure was 29 percent below the 1984 value.”
Mean pensions plus other income of aged family units rose sharply from 1967 to 1992-by $2,649, or 147 percent. Much of the increase was in the 1967-79 subperiod-$1,144, or a 63 percent in-crease. The increases in the other three subperiods were smaller.
Pensions can be examined separately for the 1979-92 subperiod. Mean pen-
Table 11 .-Mean incomes of aged family units in 1992 dollars, by type of income and income quintiles, selected years 1967-92
Type of income
Quintile Total and year income Earnings -1 Pensions Other
A / 1
1 1967.. ........ $3,127 $79 $2,348 $157 $543 (1) 1979.. ........ 5,200 97 4,018 212 871 777 1984.. ........ 5,945 109 4,626 251 958 843 1989.. ........ 5,901 123 4,699 244 834 643 1992.. ........ 5,597 84 4,580 201 731 584
L
1967.. ........ 5,923 519 3,953 370 1,086 (1) (1)1979.. ........ 8,886 487 6,454 743 1,203 447 756 1984.. ........ 10,087 518 7,416 881 1,271 667 604 1989.. ........ 10,342 628 7,476 909 1,329 737 592 1992.. ........ 10,157 551 7,533 706 1,367 822 545
3 1967.. ........ 9,003 1,609 4,759 857 1,778 (1) (1) 1979.. ........ 13,063 1,451 7,733 1,785 2,094 1,500 594 1984.. ........ 15,351 1,707 8,683 2,392 2,570 2,050 520 1989.. ........ 15,731 1,763 8,727 2,348 2,893 2,425 468 1992 .......... 15.211 1,656 8,827 1,685 3,043 2,481 562
4 1967.. ........ 14,595 5,762 4,515 1,766 2,553 (1) (1)1979 .......... 19,514 3,814 8,211 3,715 3,776 3,285 491 1984.. ........ 23,432 4,301 8,877 5,709 4,545 4,080 464 1989.. ........ 24,202 4,567 9,005 5,230 5,401 4,766 635 1992.. ........ 22,893 3,947 9,385 3,705 5,856 5,260 596
5 1967.. ........ 34,854 21,219 3,465 7,099 3,068 (1) (1) 1979.. ........ 41,490 15,492 7,182 12,010 6,807 6,157 651 1984.. ........ 50,836 14,107 8,807 19,831 8,090 7,438 652 1989.. ........ 53,835 17,263 8,556 17,896 10,121 9,232 889 1992 .......... 49,908 15,522 8,815 14,299 11,272 10,130 1,142
___-’ Data not available Note: Income adjusted for unit size and age. Source: Derived from estimates in Radner 1987a, Radner 1991, and tabulations from the March 1993 Current Population Survey.
sions of aged family units rose by $ I ,47 1 Changes for the nonaged group will (64 percent) from 1979 to 1992. The be discussed in less detail. Each income percentage of units receiving pensions type showed an increase in real mean rose from 34 percent to 47 percent dur- income for the entire period. Real mean ing that period. total income for the nonaged rose $5,796
Within the aged group, changes over (29 percent) for the entire period. time generally were similar for the 65-74 Mean earnings for the 1967-92 pe- and 75 or older age groups (table IO). riod rose by $3,995, or 22 percent. The For both of those age groups, mean eam- only decline for that income type was in ings dropped and mean Social Security the 1989-92 subperiod, a subperiod that benefits, property income, and pensions contained a recession. and other income rose sharply from 1967 Social Security benefits showed a to 1992. The increase in mean Social small dollar amount increase (but a large Security benefits was the most important percentage rise) for the entire period. increase for both age groups. Property income showed a more impor-
Social Security Bulletin Vol. 58, No. 4 Winter 1995l l 90

tant rise, $532 (99 percent) over the Table 12.-Percentage composition of total income of family units, by type of entire period. As in the case of the aged, mean property income decreased from 1984 to 1992 as interest rates declined. Pensions and other income had a large increase from 1967 to 1992 ($1,109, or 209 percent). Most of that increase oc-curred in the first subperiod.
Within the nonaged group, mean earnings rose for all groups except the group aged 2.5 and under, and property income and pensions and other income rose for all age groups from 1967 to 1992. For the 55-64 age group, pensions and other income showed a particularly large increase of $2,892 (350 percent).
The changes in income types, be-cause they are changes in mean amounts, can be influenced strongly by the changes experienced by units with high total income (which tend to have high amounts of specific income types). In order to examine results for “typical” aged units, mean amounts and changes in those amounts are discussed briefly for the middle total income quintile of the aged group.
For the middle income quintile of aged units, mean earnings showed little change, while Social Security benefits, property income, and pensions and other income showed large increases from 1967 to 1992 (table 1 1).29
Real mean Social Security income of the middle income quintile of aged units rose $4,068, or 85 percent, from 1967 to 1992. Most of this increase occurred in the 1967-79 subperiod, and almost all had occurred by 1984. For the entire period, the dollar amount of this increase was by far the largest for any income type for that group.
Mean pensions and other income rose by $1,265, or 71 percent, from 1967 to 1992 for the middle income quintile. Property income rose $828 (97 percent), while income from earnings in 1992 was essentially the same as that in 1967.
When the subperiods are examined, property income showed declines in the 1984-89 and 1989-92 subperiods, and earnings showed declines in the 1967-79 and 1989-92 subperiods.
Mean incomes for the other four income quintiles of aged units are also shown in table 11. Mean Social Security
income and age of unit head, selected years 1967-92
Type of income
Age and year Other
All ages 1967.. ....................... 100.0 86.2 5.1 4.4 4.2 (1) (1)1979. ...................... -1 100.0 79.1 7.2 6.6 7.0 3.6 3.4 1984 ......................... 100.0 75.5 7.7 9.3 7.4 4.1 3.3 1989 ........................ 100.0 76.7 7.3 8.3 7.8 4.6 3.1 1992.. ....................... 100.0 76.3 7.9 6.8 9.0 5.1 4.0
Under 65 1967.. ....................... 100.0 93.3 1.3 2.7 2.7 (1) (1) 1979.. ....................... 100.0 88.8 1.8 4.1 5.3 2.0 3.3 1984.. ....................... i 100.0 87.3 1.7 5.5 5.5 2.2 3.4 1989 ......................... i 100.0 88.0 1.6 5.0 5.5 2.3 3.2 1992 ......................... 100.0 87.8 1.7 4.1 6.4 2.3 4.1
65 or older 1967.. ........... ........... 100.0 43.2 28.2 15.2 13.4 (1) (1) 1979.. ............... ....... ~ 1000 24.2 38.1 21.0 16.7 13.0 3.7 1984.. ......... ......... 100.0 19.6 36.4 27.5 16.5 13.6 2.9 1989.. ............... ....... 100.0 22.1 35.0 24.2 18.7 15.8 2.9 1992.. ................... ... 100.0 21.0 37.7 19.9 21.5 18.2 3.3
Under 25 1967.. ...................... j 100.0 95.9 .4 .8 2.9 (1) (1) 1979. ....................... i 100.0 91.4 .7 1.3 6.6 .l 6.5 1984.. ....................... 100 0 89.2 .4 2.0 8.4 .l 8.3 1989.. ....................... 100.0 89.8 .4 1.6 8.2 .2 8.0 1992 ......................... 100.0 86.0 .5 1.9 11.7 .I 11.5
25-34 1967.. ........ ............ 100.0 96.6 .4 .9 2.0 (1) (1) lY79.. ....................... ~ 100.0 94.1 .4 1.7 3.8 .2 3.5 1984.. ..... ................. 100.0 93.6 .4 2.2 3.x .4 3.4 1989 ......................... 100.0 94.0 .4 2.0 3.6 .3 3.3 1992.. ....................... 100.0 93.3 .5 1.5 4.7 .3 4.4
35-44 1967.. ................... .... 100.0 95.3 .9 1.6 2.2 (1) (1) 1979.. ...................... i 100.0 92.5 1.0 3.0 3.5 .7 2.8 1984 ......................... 100.0 92.2 .7 3.7 3.4 .5 2.9 1989.. ....................... 100.0 92.4 .7 3.6 3.3 .6 2.7 1992.. ....................... 1 100.0 92.2 .8 2.7 4.2 .6 3.6
I 45-54 ~
1967.. ........................ 100.0 93.1 1.3 3.0 2.6 (1) (1) 1979 .......................... 100.0 89.0 1.7 4.5 4.8 2.0 2.8 1984.. ....................... 100.0 87.9 1.4 5.8 5.0 2.0 3.0 1989.. ....................... 100.0 88.9 1.1 5.5 4.5 1.8 2.7 1992.. ......... ...... ...... 100.0 88.5 1.3 5.0 5.3 1.9 3.4
55-64 ~ 1967 ... ................ 100.0 87.9 2.9 5.4 3.8 (1) (1) 1979.. .... .................. 100.0 76.9 5.1 8.8 9.3 6.3 3.0 1984.. ....................... 100.0 71.6 5.4 12.7 10.2 7.3 2.9 1989.. ....................... 100.0 71.1 5.3 11.5 12.1 8.9 3.2 1992.. ....................... 100.0 72.4 5.6 9.2 12.8 9.0 3.8
65-74 1967.. ................... ... 100.0 49.2 24.9 13.2 12.6 (1) (1) 1979 ......................... 100.0 29.3 34.9 18.8 16.9 13.6 3.3 1984.. ....................... 100.0 24.4 33.2 25.0 17.4 14.6 2.8 1989.. ....................... 100.0 27.8 30.4 21.8 19.9 17.1 2.8 1992.. ............ ........ 100.0 27.2 32.4 18.0 22.5 19.2 3.3
75 or older 1967 ......................... 100.0 28.8 36.0 19.9 15.2 (1) (1) 1979 ......................... 100.0 13.8 44.5 25.2 16.5 11.9 4.6 1984.. ....................... 100.0 10.5 42.3 32.3 14.9 11.7 3.1 1989.. .............. ........ 100.0 11.5 43.4 28.6 16.4 13.3 3.1 1992.. .............. ........ ~ 100.0 10.2 47.0 23.1 19.7 16.4 3.3
~1
’ Data not available
Note: Income adjusted for unit sne and age
Source: Radner 1991 and tabulations from various March Current Population Survey tiles.
lSocial Security Bulletin Vol. 58, No. 4 * Winter 1995 91

income rose substantially from 1967 to 1992 for each of the five income quintiles. The rise was $2,232 (95 per- cent) for the bottom quintile, $3,580 (91 percent) for the second quintile, $4,870 (108 percent) for the fourth quintile, and $5,350 (154 percent) for the top quintile. The percentage receiving Social Security income rose for each quintile during that period. The largest increases were in the top quintile (from 70 percent to 90 per- cent) and the bottom quintile (from 80 percent to 92 percent).
As in the case of Social Security income, property income and pensions and other income showed larger dollar amount increases in mean income in higher quintiles. The top quintile showed an increase of $8,204 (267 per- cent) in pensions and other income and an increase of $7,200 (101 percent) in property income from 1967 to 1992. A decrease of $5,697 in earnings for that quintile offset part of the increases in other income types.
Mean total income rose substantially for all five quintiles of aged units from 1967 to 1992. For all except the second quintile, however, 1992 mean total in-come was below the 1984 mean.
Composition of Total Income
Changes in mean amounts of various income types produce changes in the composition of total income. The com-position of total income for age groups is, shown for selected years in table 12. For aged units, from 1967 to 1992, the share of earnings in total income decreased, while the shares of the other income types rose. The share of earnings dropped from 43.2 percent to 2 1 .O per- cent, the share of Social Security income rose from 28.2 percent to 37.7 percent, the share of property income rose from 15.2 percent to 19.9 percent, and the share of pensions and other income rose from 13.4 percent to 21.5 percent. For earnings and Social Security income, most of the change occurred in the 1967- 79 subperiod. The share of property income rose sharply from 1967 to 1984, then dropped. The share of pensions and other income rose in three of the four subperiods.
As in the case of the aged group as a For the 75 and older age’group, the whole, the 65-74 and 75 or older groups share of earnings declined ffbm 28.8 showed decreases in the share of eam- percent to 10.2 percent, the share of ings and increases in the shares of the Social Security income rose from 36.0 other income types. The levels of those percent to 47.0 percent, the share of shares, and, in some cases, the size of the property income rose from 19.9 percent change differed between these two age to 23.1 percent, and the share of pen- groups. For the 65-74 age group, from sions and other income rose from 15.2 1967 to 1992, the share of earnings de- percent to 19.7 percent. clined from 49.2 percent to 27.2 percent, The composition of income also the share of Social Security income rose shifted for the 55-64 age group. The from 24.9 percent to 32.4 percent, the share of earnings dropped from 87.9 share of property income rose from 13.2 percent in 1967 to 72.4 percent in 1992, percent to 18.0 percent, and the share of as more workers in this age group re-pensions and other income rose from tired. (The percentage with earnings 12.6 percent to 22.5 percent. declined from 89 percent in 1967 to 80
Table 13 .-Percentage composition of total income of aged family units, by type of income and income quintiles, selected years 1967-92
Type of income
Quintile ~ Total
and year i income Other
1
1967.. ......... 100.0 2.5 75.1 5.0 17.4 (1) (1) 1979.. ......... 100.0 1.9 77.3 4.1 16.8 1.8 14.9 1984.. ......... 100.0 1.8 77.8 4.2 16.1 1.9 14.2 1989.. ......... 100.0 2.1 79.6 4.1 14.1 3.2 10.9 1992.. ......... 100.0 1.5 81.8 3.6 13.1 2.6 10.4
2
1967.. .......... 100.0 8.8 66.7 6.2 18.3 (1) (1) 1979.. ......... i 100.0 5.5 72.6 8.4 13.5 5.0 8.5 1984.. .......... 100.0 5.1 73.5 8.7 12.6 6.6 6.0 1989.. ......... 100.0 6.1 72.3 8.8 12.9 7.1 5.7 1992. .......... 100.0 5.4 74.2 7.0 13.5 8.1 5.4
3 ~ 1967 ............ 100.0 17.9 52.9 9.5 19.7 (1) (1) 1979.. .......... 100.0 11.1 59.2 13.7 16.0 11.5 4.5 1984.. ....... ..’ 100.0 11.1 56.6 15.6 16.7 13.4 3.4 1989.. ......... 100.0 11.2 55.5 14.9 18.4 15.4 3.0 1992 ........... 100.0 10.9 58.0 11.1 20.0 16.3 3.7
4
1967.. ......... 100.0 39.5 30.9 12.1 17.5 (1) (1) 1979.. ......... 100.0 19.5 42.1 19.0 19.4 16.8 2.5 1984.. ......... 100.0 18.4 37.9 24.4 19.4 17.4 2.0 1989.. ......... 100.0 18.9 37.2 21.6 22.3 19.7 2.6 1992.. ......... 100.0 17.2 41.0 16.2 25.6 23.0 2.6
5
1967.. ......... 100.0 60.9 9.9 20.4 8.8 (1) (1) 1979.. .......... 100.0 37.3 17.3 28.9 16.4 14.8 1.6 1984 ........... 100.0 27.8 17.3 39.0 15.9 14.6 1.3 1989.. ......... 100.0 32.1 15.9 33.2 18.8 17.1 1.7 1992 ........... 100.0 31.1 17.7 28.7 22.6 20.3 2.3
’ Data not available. Note: Income adjusted for unit size and age. Source: Radner 1991 and tabulations from various March Current Population Survey files.
l lSocial Security Bulletin Vol. 58, No. 4 Winter 1995 92

percent in 1992.) The share of pensions and other income rose from 3.8 percent to 12.8 percent, and there were small increases in the shares of Social Security income and property income.
The group under age 25 also showed important shifts. The share of earnings decreased from 95.9 percent in 1967 to 86.0 percent in 1992. The share of pen- sions and other income (which is almost entirely other income for this age group) increased from 2.9 percent to 11.7 percent.
The middle income quintile of the aged group has a different composition of income from the group as a whole (table 13). From 1967 to 1992, the share of earnings dropped from 17.9 percent to 10.9 percent, the share of Social Security income rose from 52.9 percent to 58.0 percent, the share of property income rose from 9.5 percent to 11.1 percent, and the share of pensions and other in-come rose slightly from 19.7 percent to 20.0 percent.
For this particular group, the decline in the share of earnings occurred almost entirely in the 1967-79 subperiod. The share of Social Security benefits rose, then fell, then rose again. The share of property income rose, then fell. The share of pensions rose steadily from 1979 to 1992.
The composition of total income for the other four income quintiles of aged units is also shown in table 13. In each year, Social Security income had its highest share (81.8 percent in 1992) in the bottom quintile and its lowest (17.7 percent in 1992) in the top quintile. In each quintile, the share of Social Security income rose from 1967 to 1992.
In each year, earnings had its highest share (31.1 percent in 1992) in the top quintile and its lowest (1.5 percent in 1992) in the bottom quintile. The share of earnings dropped for every quintile from 1967 to 1992, although the decline was very small for the bottom quintile.
Property income also had its highest share (28.7 percent in 1992) in the top quintile and its lowest (3.6 percent in 1992) in the bottom quintile in each year. The share of property income rose for the top four quintiles from 1967 to 1992.
The pattern for pensions and other Median Total Income by Type of Unit income was less clear. Its highest share (25.6 percent in 1992) was in the fourth Median total incomes of types of
quintile in the last 4 years shown. Its family units are shown for the aged and
lowest share was in the bottom or second for the nonaged in table 14. Families are
quintile in 4 of the 5 years. The shares separated into three mutually exclusive
for the different quintiles were more groups: (1) those with a head who is
similar than for the other income types. married spouse present; (2) those with a
The bottom two quintiles showed a de- male head who is not married spouse
cline in this share from 1967 to 1992, present (“other male”); and (3) those
the middle quintile showed almost no with a female head who is not married
change, and the top two quintiles showed spouse present (“other female”).Jo
a rise. The increase was substantial Unrelated individuals are separated into
(from 8.8 percent to 22.6 percent) for the males and females3’
top quintile. The share of pensions rose For aged units, median income for all
for each quintile from 1979 to 1992. families rose from $11,752 in 1967 to
For each quintile, the fall in the share $19,781 in 1992 (68 percent). The levels
of earnings occurred primarily from and increases for married spouse present
1967 to 1979. For the top four quintiles families and for other male families were
the increase in the share of Social Secu- roughly similar. For other female fami-
rity benefits also occurred mainly in the lies, however, the increase was much
1967-79 subperiod. In most cases, the smaller-from $12,393 to $15,894 (28
top four quintiles showed a steady rise in percent). Male unrelated individuals
the share of pensions from 1979 to 1992. showed an increase from $7,367 to
Table 14.-Median incomes of family units in 1992 dollars, by age of unit head and type of unit, selected years 1967-92
.~-~-
Type of unit
Families I
Unrelated individuals 1.
! Married, I spouse
Age and year Total 1 present__-All ages
1967.. ................. $16,700 $17,569 $17,085 $10,206 $9,313 $12,704 $7.689 1979.. ................ 21,824 23,582 21,675 11,952 14,258 18,739 11,567 1984.. ................ 21,903 24,003 22,030 11,451 15,206 18,472 13,147 1989.. ................ 23,428 25,815 21,375 11,967 16,458 19,398 13,819 1992 .................. 22,541 25,270 18,658 11,323 14,824 17,613 13,209
Under 65
1967.. ................. 17,561 18,194 19,067 9,770 13,471 16,947 11,697 1979.. ................ 22,788 24,733 23,072 11,164 17,811 20,54 1 14,745 1984 .................. 22,280 24,750 22,346 10,524 17,735 20,029 16,062 1989.. ................ 24,005 26,926 21,454 11,050 18,889 20,987 17,176 1992.. ................ 23,173 26,442 18,660 10,408 17,612 18,592 16,161
65 or older
1967.. ................ I 11,752 11,638 11,791 12,393 6,108 7,367 5,754 1979.. ................. 16,906 17,089 16,688 15,933 9,173 10,438 8,953 1984. ................. . 19,806 20,480 19,442 16,335 10,635 11,594 10,368 1989.. ................ 20,945 20,732 17,629 11,115 13,424 10,622 1992 .................. 20,439 18,388 15,894 10,964 13,057 10,339
Note: Income adjusted for unit size and age Source: Derived from estimates in Radner 1987a and tabulations from various March
Current Population Survey ftles.
l lSocial Securitv Bulletin Vol. 58. No. 4 Winter 1995 93

Table 15.-Average annual percentage change in real median incomes of family units, Summary and Conclusiatts by age of unit head and type of unit, selected periods 1967-92
This article examines the money r c Type of unit incomes of the elderly and the .~.. nonelderly. The economic status of the
Families I Unrelated individuals
Age and year Total Total ~ Male Female-
All ages
1967-92 ............. 1.2 1.5 0.4 0.4 1.9 1.3 2.2 1967-79.. ........... 2.3 2.5 2.0 1.3 3.6 3.3 3.5 1979-84 ............. .l .4 .3 -.9 1.3 3 2.6 1984-89 ............. 1.4 1.5 6 .9 1.6 co 1.0 1989-92 ............. -1.3 -.7 -4:4 -1.8 -3.4 -3.2 -1.5
Under 65
1967-92 ............. 1.1 1.5 ;:6 1 1.1.3 1.1 .4 1.3 1967-79 ............. 2.2 2.6 2.4 1.6 1.9 1979-84.. ........... 4 .O -.6 -1.2 1 -. 5 1.7 1984-89.. ........... ;:5 1.7 -4:5 8 -2.01.0 ;:3 .9 1.4 1989-92 ............. -1.2 -.6 -2.3 -4.0 -2.0
65 or older
1967-92.. ........... 2.1 2.3 1.8 1.0 2.4 2.3 2.4 1967-79.. ........... 3.1 3.3 2.9 2.1 3.4 2.9 3.8 1979-84.. ........... 3.2 3.7 3.1 .5 3.0 2.1 3.0 1984-89.. ........... .7 .5 1.3 1.5 .9 3.0 .5 1989-92.. ........... -1.2 -. 8 -3.9 -3.4 -. 5 -. 9 -. 9
Note: Income adjusted for unit size and age. Source: Derived from estimates in Radner 1987a and tabulations from various March
CurrentPopulationSurvey files.
$13,057 (77 percent), while female For aged units, all types of family unrelated individuals showed an units showed increases in income in the increase from $5,754 to $10,339 (80 fust three subperiods and a decrease in percent). the 1989-92 subperiod. For nonaged
All aged types of unit showed a units, all types of family units showed an decline in median income from 1989 to increase in the 1967-79 subperiod and a 1992. For all families and for each of decrease in the 1989-92 subperiod. Most the three family types, median income in types of nonaged units showed a decline 1992 was below the 1984 value, although in 1979-84 and a rise in 1984-89. in some cases the difference was very Relative median incomes for types of small. family units are shown in table 16. For
Increases for nonaged units from each year shown, the all ages-all units 1967 to 1992 generally were somewhat median was used as the base (with a smaller. Other male families showed a value of 1 .OO). For aged units, relative small decline. medians for married spouse present and
Average annual rates of change for other male families showed substantial types of family units are shown in table increases from 1967 to 1992. Other 15. For aged units, for the entire period, female families showed no change. Both the largest increases were for female male and female aged unrelated indi- unrelated individuals (2.4 percent per viduals showed substantial increases. year), male unrelated individuals (2.3 Thus, the relative income gains experi- percent per year), and married spouse enced by the aged that were shown in present families (2.3 percent per year). earlier sections of this article were The smallest increase was for other shared by most types of units within the female families (1 .O percent per year). aged group.
elderly is put in perspective by discuss- ing changes in real incomes since 1967 and the income of the elderly relative to the incomes of other age groups. De- tailed age groups within both the elderly and nonelderly groups are examined. The major findings of this article are summarized below.
The economic status of the aged in 1992, as measured by before-tax money income, was substantially better than in 1967, but was about the same as in 1984.
From 1967 to 1992, the real median income (adjusted for unit size and age) of elderly family units rose 69 percent. The median fell from 1989 to 1992; the 1992 median was slightly below the 1984 value. The real median adjusted income of nonelderly units rose 26 per- cent from 1967 to 1992.
The ratio of the median adjusted income of aged family units to the me- dian for the nonaged rose from 0.526 in 1967 to 0.710 in 1992. The 1992 ratio, however, was below the 1984 ratio. To a great extent, the rise in the agedlnonaged income ratio from 1967 to 1992 offset a decline in that ratio from 1947 to 1967.
Despite substantial increases in in- come during the 1967-92 period, in 1992 the median adjusted income of units aged 85 or older was only 55 percent of the median for units of all ages. The corresponding value for 1967 was 38 percent.
Income inequality for elderly units fell substantially from 1967 to 1992. Inequality rose sharply for the nonelderly during that period.
The poverty rate for aged persons fell sharply from 1967 to 1992, while the rate for nonaged persons rose. The rate for each detailed age group was higher in 1992 than that in 1989. In each year shown, poverty rates were lowest for middle age groups and highest for the youngest and oldest groups. In 1967, the oldest age groups had the highest rates of any group; in 1992, the youngest age groups had the highest rates.
Social Security Bulletin Vol. 58, No. 4 Winter 1995 l l 94

Table 16.-Rezlative median incomes of family units, by age of unit head and type of *Although the estimates presented here
unit, selected years 1967-92 use the same basic data source as the biennial reports on the income of the aged prepared by
Type of unit Grad (1994), there are four important differ-ences between the two sets of estimates.
Families Unrelated individuals First, these estimates include all age groups.
Total
Married, spouse present
Other male
Other female Total r-FemaleMale
1.13 1.20 1.21 1.23 1.28
1.10 1.11 1.11 1.02 .94
0.66 .61 .58 .57 .57
0.60 .73 .77 .78 .75
0.82 .96 .93 .92 .89
0.50 .59 .66 .66 .67
1.13 1.16 1.12 1.14 1.17
1.18 1.26 1.25 1.28 1.34
1.23 1.18 1.13 1.02
.94
.63
.57
.53 .53 .53
.87
.91
.89
.90
.89
1.09 1.05 1.01 1.00
.94
.76
.75
.81
.82
.82
.76
.86 1.00
.98 1.00
.75
.87 1.03 1.00 1.03
.76 .85 .98 .99 .93
.80
.81
.a2
.84
.80
.39
.47
.54
.53
.55
.48
.53
.58
.64
.66
.37
.46
.52
.51
.52
Second, an adjustment for differences in needs is used here. Third, different income recipient units are used here. Fourth, this article emphasizes changes over time; each of Grad’s reports focuses on a single year.
3 See Bureau of the Census (1993a) for definitions of families and unrelated indi-viduals.
4 The term “head” is used here for all years shown. For the years before 1979, the term refers to the head concept that was used in the data; for the years beginning with 1979, the term refers to the householder concept that was used (Bureau of the Census 1981). This change in definitions is very unlikely to have an important effect on the estimates in this article.
5 An important implication of this classifi- cation is that some aged persons are included in nonaged units and some nonaged persons are included in aged units.
“Two important sources of error in the CPS income data should be mentioned. First, those data are known to suffer from under- reporting, which can be substantial for some income types (Bureau of the Census 1993a, table C-l). Research has shown that there are differences in underreporting by age that affect the relative positions of aged and nonaged units (Radner 1982). When adjust-ments for underreporting are made, the ratio of aged to nonaged incomes rises (Radner 1986). It was not feasible to use an adjust- ment for underreporting in this article. Sec-ond, income data from the CPS (and from other household surveys) suffer from nonresponse to the questions on income. About 20 percent of aggregate income in the CPS income data for 1990 resulted from amounts that were imputed to nonrespond- ents (Bureau of the Census 1993a).
‘Taking account of taxes generally raises the income of the elderly relative to the incomes of other age groups.
‘In this article, the Personal Consumption Expenditure (PCE) implicit price deflator from the National Income and Product Accounts is used to convert current dollar amounts to 1992 dollars. Those deflators were obtained from Council of Economic Advisers (1995) for 1967-92 and from U.S. Department of Commerce ( 1993) for 1947-57. Some analysts have used an experimen-
Age and year
All ages 1967 .._............... 1979 ,................. 1984 ,,,,........_._._. 1989 .,._.............. 1992 . . . . . . . . . . . . .
Under 65
1967 ................... 1979 .................. 1 1984 .................. 1989 .................. 1992.. ................
65 or older
1967 .................. 1979.. ................ 1984 .................. 1989 .................. 1992 .................. i
Notes: Income adjusted for unit size and age. All ages all units = 1 .OO for each year.
Source: Radner 1987a and tabulations from various March Current Population Survey tiles.
income growth and income decline, and this pattern can be expected to continue in the future. The relationship between the incomes qf the elderly and the nonelderly in the future is uncertain. That relationship is affected by the economy’s level of activity, as well as by long-run trends. Fluctuations in prop- erty income, resulting primarily from changes in interest rates, can be expected to continue to play an important role in changes in the income of the aged.
Notes
’ The estimates presented here may differ slightly from the earlier estimates as a result of minor modifications to the data and revi- sions in the index used to calculate constant dollar amounts. Also, the estimates pre-sented here are in 1992 dollars, rather than in 1982 dollars. Some estimates for 1990 and for the 1967-90 period were presented in Radner (1993).
The increase in total income for the aged from 1967 to 1992 was the result of large increases in mean Social Security benefits, property income, and pensions and other income, and a large decrease in mean earnings. The largest increase was in Social Security benefits. The composition of total income for the aged shifted in accordance with these changes.
Declines in property income were major factors in the drop in the total income of aged units from 1989 to 1992 and in the slight decrease in the total income of the aged from 1984 to 1992.
All types of aged family units showed increases in real income from 1967 to 1992. All types of aged family units showed decreases in real income from 1989 to 1992.
The results shown in this article illustrate the important point that the incomes of all age groups have fluctuated over time. Both the elderly and nonelderly have experienced periods of
l lSocial Security Bulletin Vol. 58, No. 4 Winter 1995 95

tal Consumer Price Index (CPI-UXl) to calculate constant dollar estimates (Bureau of the Census 1993a). The PCE implicit price deflator rose slightly faster than the CPI-UXl from 1967 to 1992, but using the CPI-UXl would not have had an important effect on the results in this article. The ordinary Con-sumer Price Index (CPI-U) rose faster than either of those other two deflators from 1967 to 1992. Before 1983, the CPI-U contained a treatment of housing costs that, according to many analysts, produced excessive increases in the index. The official poverty thresholds are indexed using the CPI-U.
‘) Although median incomes would have been preferred, mean incomes are used here because medians were not available. In the income estimates presented in this article, each family unit is counted once (aside from sample weighting), regardless of the number of persons in the unit. This method is used for the estimates that use adjusted income, as well as for those that use unadjusted income.
“‘The levels shown in table 2 are only rough approximations of the relative eco-nomic well-being of the groups compared because no adjustment for differential needs of units of different size and age was used and because means, rather than medians, were used. Estimates of change over time are affected somewhat less by these prob- lems. Medians and a satisfactory adjustment for needs could not be used in this table because of data limitations.
‘I Over time, the data collection and esti- mation procedures in the CPS have changed somewhat, so it is appropriate to ignore small differences in estimates, particularly when comparing 1947 and 1992.
I2 Sample sizes differed somewhat among the years. The sample size for all family units was 48,134 for 1967 and 63,307 for 1992. The sample size for aged family units was 9,268 for 1967 and 13,181 for 1992.
I3 The data used for the various years are not strictly comparable in all cases. Among the most important changes in the CPS dur- ing the 1967-92 period are: the introduction of new population controls as newer Decen-nial Census data became available, the revi- sion of the questionnaire to provide more detail on type of income, changes in the imputation of income to nonrespondents, a change from the “head” concept to the “householder” concept, and changes in cod- ing restrictions and the top-coding of high income amounts. See Radner (1987a) and various issues of Current Population Reports, Series P-60, for further detail.
I4 Although data were available for 1993, they are not considered to be sufficiently comparable with the earlier data to be in- cluded in this article, primarily because of changes in data collection procedures. See Bureau of the Census (1995) for a discussion of the differences.
” The equivalence scale used for 1992 had the following values for the specified size of unit and age of head groups: 1 person (under age 65), 1.022; 1 person (aged 65 or older), 0.942; 2 persons (under age 65), 1.322; 2 persons (aged 65 or older), 1.188; 3 per- sons, 1.566; 4 persons, 2.007; 5 persons, 2.373; 6 persons, 2.679; 7 persons, 3.023; 8 persons, 3.367; and 9 persons or more, 4.024. These values were derived from table A-2 in Bureau of the Census (1993b). Esti-mates for 1967 and 1979 were adjusted using the 1979 scale (Bureau of the Census 1981). Estimates for 1984 and 1989 were adjusted using the 1987 scale (Bureau of the Census 1989). The scales for those other years dif- fered only slightly from the 1992 scale. Al-though a one-person unit (all ages) had, as the base unit, an implicit scale value of 1.000, no unit had that all ages value applied to its income.
I6 There also was a shift within the aged group toward the older ages. For example, the group aged 85 or older accounted for 5.5 percent of aged units in 1967 and 9.1 percent in 1992.
I7 The increase in the ratio of means, not adjusted for unit size and age, as shown in table 2, was 26 percent.
18The sharp rise in this ratio in 1990 was associated with the recession that began in that year. The income of the nonaged fell in 1990, while the income of the aged rose.
“The years selected are those shown in the earlier articles, along with 1992, the most recent year for which comparable data were available.
*“A relative median is the median for a subgroup divided by the median for all units.
*’ Inequality is often measured using Lorenz curves and the Gini concentration ratio. A Lorenz curve relates cumulated relative income shares and cumulated per-centages of units, when the units are ranked by size of income (Radner 1987a). The Gini concentration ratio is a measure of inequality that can be interpreted as being based on a Lorenz curve. The lower the ratio, the more equal the distribution; 0 is complete equality and 1 is complete inequality. Some compari-sons of inequality are ambiguous even though
differences exist between Gini concentration ratio values. In this article, a distribution is considered to be more (less) equal than a second distribution if the Lorenz curve for the first distribution lies above (below) the Lorenz curve for the second distribution, with no intersection. If two Lorenz curves cross, the comparison is considered to be ambigu- ous. The Gini concentration ratio has been criticized by many analysts for the lack of desirable properties. There is no general agreement, however, on the single best mea- sure. See Jenkins (1991) for a discussion of the measurement of inequality.
22 Various technical changes over time in the CPS data can affect comparisons of in- equality. Changes, for example in coding limits, that affect high income amounts can have a particularly important impact on the measurement of inequality.
23 The 1967 poverty rates shown here are based on poverty thresholds that did not reflect revisions made in 1969 and 198 1. The 1979 rates shown here are based on thresholds that did not reflect the 1981 revi- sions. The 1969 revisions changed the an- nual adjustment of levels from food prices to the overall CPI-U and raised farm thresholds from 70 percent to 85 percent of nonfarm thresholds. The 1981 revisions eliminated separate farm thresholds, eliminated distinc-tions by sex of householder, and extended the matrix to families with nine persons or more. These revisions would not be expected to have a large impact on the pattern of rates by age. Using the current poverty definition: the poverty rate for 1967 was 29.5 percent for aged persons and 14.2 percent for all persons, and the poverty rate for 1979 was 15.2 per- cent for aged persons and 11.7 percent for all persons (Bureau of the Census 1995). The old definitions are used here for 1967 and 1979 because estimates for the detailed age groups shown in table 9 are not available for those years using the new definition.
24 Estimates from the Survey of Income and Program Participation (SIPP) show gen-erally lower poverty rates than the estimates from the CPS shown here. Although the reasons for this difference in levels are not fully understood at this time, the generally better reporting of income in SIPP probably is an important factor.
25 For 1967, pensions and “other” income are shown together; amounts of pension income could not be separated accurately from amounts of several other income types. For the 1967 estimates, other income in-cluded Old-Age Assistance, Aid to the Blind,
l lSocial Security Bulletin Vol. 58, No. 4 Winter 1995 96

and Aid to the Permanently and Totally Disabled instead of SSI; SSI payments did not begin until 1974.
2”Note that this increase was less than the 69-percent increase in the real median for this period.
*‘See Radner (198713) for a discussion of differences between the automatic adjustment of Social Security benefits for price change and the adjustment for price change applied to income amounts here.
28 Interest income is the dominant type of property income. See Radner (1987b) for a discussion of problems associated with ad-justing nominal interest income for changes
in consumer prices.
29Note that changes in income types over time can affect which units appear in the middle income quintile of an age group.
“‘All three types of family contain fami-lies of different size and composition. A family in any of the types of family may or may not include related children.
)’ There were roughly 105 million family units of all ages in the 1992 data. Married spouse present families were 5 1 percent of all units, other male families were 3 percent, other female families were 11 percent, male unrelated individuals were 16 percent, and female unrelated individuals were 19 per- cent. The distribution of aged units was much different. Of the roughly 21 million aged units in the 1992 data, the married spouse present unit families were 44 percent, other male families were 2 percent, other female families were 7 percent, male unre-lated individuals were 11 percent, and female unrelated individuals were 36 percent. These distributions have changed over time. In the 1967 data, for the all ages group, there were relatively more total families and married spouse present families and relatively fewer male and female unrelated individuals than in 1992. For aged units, the distribution changed less from 1967 to 1992 than for all ages; the largest change was a small shift toward more female unrelated individuals.
References
Bureau of the Census. 198 1. “Characteristics of the Population Below the Poverty Level: 1979,” Current Population Reports (Series P-60, No. 130) Washington, DC: U.S. Government Printing Office.
-. 1989. “Poverty in the United States: 1987,” Current Population Reports (Se-ries P-60, No. 163) Washington, DC: U.S. Government Printing Office.
-. 1993a. “Money Income of House- holds, Families, and Persons in the United States: 1992,” Current Population Reports (Series P-60, No. 184) Washing-ton, DC: U.S. Government Printing Office.
-’ 1993b. “Measuring the Effect of Benefits and Taxes on Income and Pov- erty: 1992,” Current Population Reports (Series P-60, No. 186RD), Washington, DC: U.S. Government Printing Office.
- 1995. “Income, Poverty, and Valuation of Noncash Benefits: 1993,” Current Population Reports (Series P-60, No. 188) Washington, DC: U.S. Govern- ment Printing Office.
Council of Economic Advisers. 1995. Eco- nomic Report of the President, 1995, Washington, DC: U.S. Government Printing Office.
Grad, Susan. 1994. Income of the Popula- tion 55 or Older, 1992, Social Security Administration.
Jenkins, Stephen. 1991. “The Measurement of Income Inequality,” Economic Inequal-ity and Poverty.. International Perspec-tives, Lars Osberg (ed.), Armonk and London: M.E. Sharpe, Inc.
Radner, Daniel B. 1982. “Distribution of Family Income: Improved Estimates,” Social Security Bulletin, Vol. 45, No. 7 (July), pp. 13-21.
-’ 1986. “Changes in the Money Income of the Aged and Nonaged, 1967-1983,” Studies in Income Distribution, No. 14, Social Security Administration.
-’ 1987a. “Money Incomes of Aged , and Nonaged Family Units, 1967-84,”
Social Security Bulletin, Vol. 50: NO. 8 (August), pp. 9-28.
-’ 1987b. ‘Shifts in the Aged- Nonaged Income Relationship, 1979-85,” American Statistical Association 1987 Proceedings of the Social Statistics Section, pp. 312-317.
-. 1991. “Changes in the Incomes of Age Groups, 1984-89,” Social Security Bulletin, Vol. 54, No. 12 (December), pp. 2-18.
- 1992. “The Economic Status of the Aged,” Social Security Bulletin, Vol. 55, No. 3 (Fall), pp. 3-23.
-. 1993. “An Assessment of the Economic Status of the Aged,” Studies in Income Distribution, No. 16, Social Security Administration.
-. 1994. “Noncash Income, Equiva-lence Scales, and the Measurement of Economic Well-Being,” ORS Working Paper Series, No. 63, Social Security Administration.
U.S. Department of Commerce. 1993. NCJ-tional Income and Product Accounts of
the United States, Volume 1, 1929-58, Washington, DC: U.S. Government Printing Office.
Social Security Bulletin Vol. 58, No. 4 Winter 1995l l 97