income tax in scotland: 2017 update - sp-bpr-en-prod … · income tax in scotland: 2017 update ......
TRANSCRIPT
SB 17-84
SPICe BriefingPàipear-ullachaidh SPICe
Income Tax in Scotland: 2017 update
Anouk Berthier and Nicola Hudson
This briefing provides informationon income tax in Scotland,including legislation, recent policydevelopments, and facts andfigures on Scottish taxpayernumbers, their incomes andincome tax liabilities. It alsodiscusses behavioural responsesand includes modelling ofillustrative changes to income taxin 2018-19.
ContentsExecutive Summary _____________________________________________________4
What is income tax? _____________________________________________________6
Scottish income tax: Legislative framework _________________________________7
"Scottish taxpayers" _____________________________________________________8
Facts and figures________________________________________________________9
Scottish income tax policy 2017-18 ________________________________________9
Taxpayers in Scotland in 2017-18 _________________________________________10
Taxpayers by income bracket, 2014-15 _____________________________________13
Gender breakdown ____________________________________________________15
Local authority breakdown_______________________________________________17
Relationship between total income taxpayers and NSND income taxpayers (higherand additional) ________________________________________________________19
Analysis of NSND additional rate taxpayers in Scotland, 2014-15 ________________20
Scottish income tax revenue 2016-17 to 2022-23 _____________________________22
HMRC, auditing and costs of implementation _______________________________25
Interaction with other parts of the UK tax system ____________________________26
Savings and dividends__________________________________________________26
Capital Gains Tax______________________________________________________26
National Insurance Contributions _________________________________________26
Pensions ____________________________________________________________27
Marriage Allowance ____________________________________________________27
Past and potential issues with income tax in Scotland ________________________28
Taxpayer identification __________________________________________________28
Tax avoidance/evasion__________________________________________________28
Behavioural responses__________________________________________________29
Types of responses ____________________________________________________29
Measuring behavioural responses_________________________________________30
The fiscal framework and behavioural responses _____________________________31
Case study: the 50p additional rate ________________________________________32
A 50p additional rate in Scotland? _________________________________________33
Block grant adjustment _________________________________________________34
Adjustment to the block grant in 2016-17 ___________________________________34
The fiscal framework and block grant adjustment _____________________________34
Role of the Scottish Government/Scottish Fiscal Commission and OBR inforecasting Scottish income tax ___________________________________________35
Income Tax in Scotland: 2017 update, SB 17-84
2
Block grant adjustment for 2017-18________________________________________36
How much revenue could alternative proposals raise? _______________________38
The baseline _________________________________________________________38
Modelling revenues ____________________________________________________38
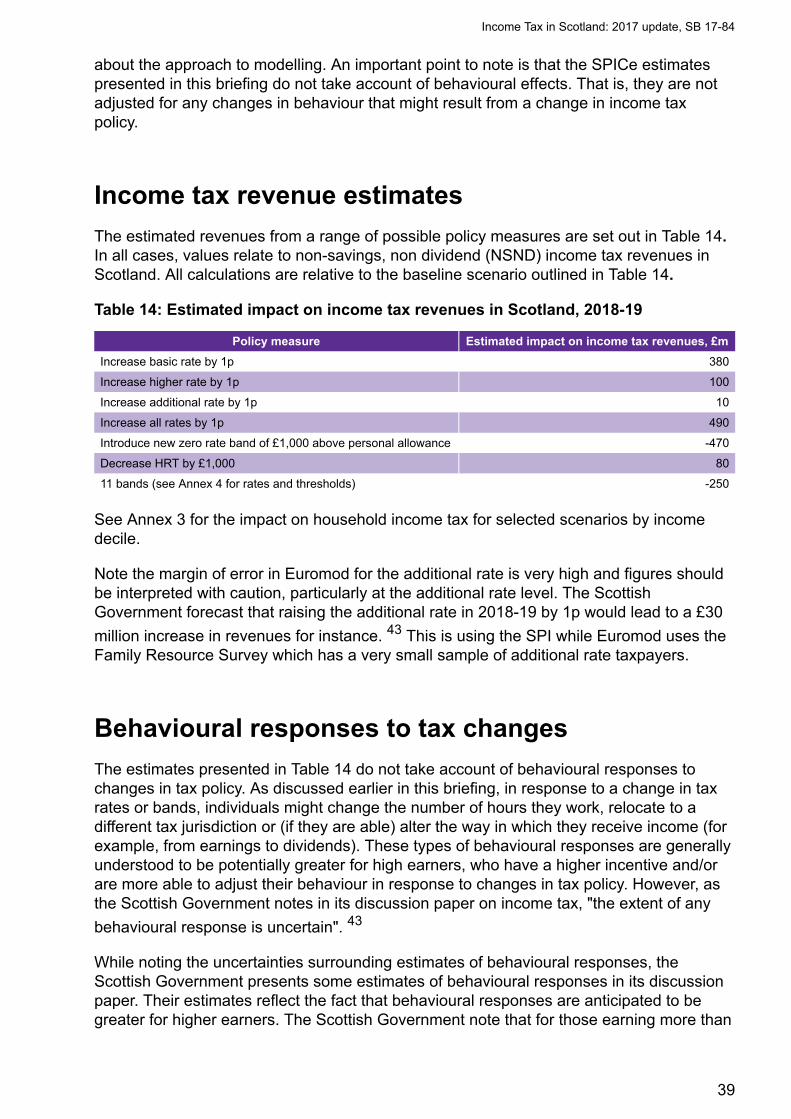
Income tax revenue estimates____________________________________________39
Behavioural responses to tax changes _____________________________________39
Further sources of information ___________________________________________41
Annex 1: Taxable and non-taxable benefits _________________________________42
Annex 2: Case study of behavioural responses: Switzerland __________________44
Annex 3: SPICe approach to modelling income tax revenues __________________45
Annex 4: Impact of selected scenarios on average household income tax byincome decile__________________________________________________________46
Bibliography___________________________________________________________50
Income Tax in Scotland: 2017 update, SB 17-84
3
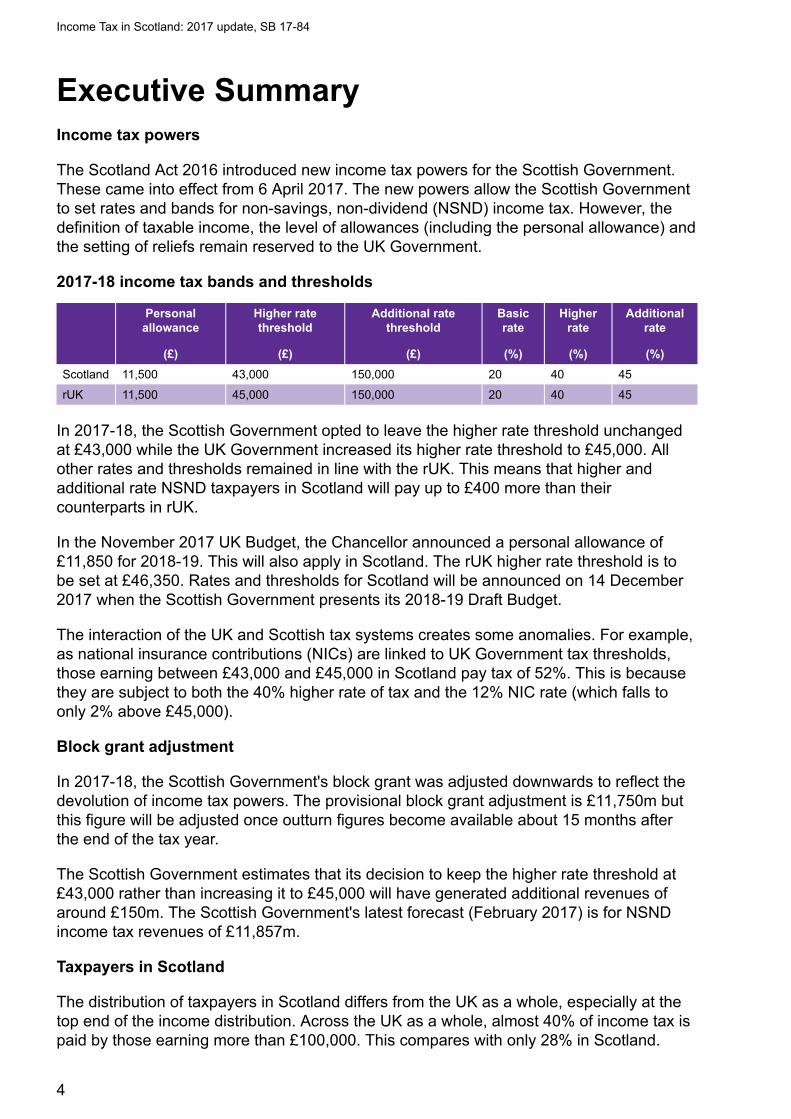
Executive SummaryIncome tax powers
The Scotland Act 2016 introduced new income tax powers for the Scottish Government.These came into effect from 6 April 2017. The new powers allow the Scottish Governmentto set rates and bands for non-savings, non-dividend (NSND) income tax. However, thedefinition of taxable income, the level of allowances (including the personal allowance) andthe setting of reliefs remain reserved to the UK Government.
2017-18 income tax bands and thresholds
Personalallowance
(£)
Higher ratethreshold
(£)
Additional ratethreshold
(£)
Basicrate
(%)
Higherrate
(%)
Additionalrate
(%)
Scotland 11,500 43,000 150,000 20 40 45
rUK 11,500 45,000 150,000 20 40 45
In 2017-18, the Scottish Government opted to leave the higher rate threshold unchangedat £43,000 while the UK Government increased its higher rate threshold to £45,000. Allother rates and thresholds remained in line with the rUK. This means that higher andadditional rate NSND taxpayers in Scotland will pay up to £400 more than theircounterparts in rUK.
In the November 2017 UK Budget, the Chancellor announced a personal allowance of£11,850 for 2018-19. This will also apply in Scotland. The rUK higher rate threshold is tobe set at £46,350. Rates and thresholds for Scotland will be announced on 14 December2017 when the Scottish Government presents its 2018-19 Draft Budget.
The interaction of the UK and Scottish tax systems creates some anomalies. For example,as national insurance contributions (NICs) are linked to UK Government tax thresholds,those earning between £43,000 and £45,000 in Scotland pay tax of 52%. This is becausethey are subject to both the 40% higher rate of tax and the 12% NIC rate (which falls toonly 2% above £45,000).
Block grant adjustment
In 2017-18, the Scottish Government's block grant was adjusted downwards to reflect thedevolution of income tax powers. The provisional block grant adjustment is £11,750m butthis figure will be adjusted once outturn figures become available about 15 months afterthe end of the tax year.
The Scottish Government estimates that its decision to keep the higher rate threshold at£43,000 rather than increasing it to £45,000 will have generated additional revenues ofaround £150m. The Scottish Government's latest forecast (February 2017) is for NSNDincome tax revenues of £11,857m.
Taxpayers in Scotland
The distribution of taxpayers in Scotland differs from the UK as a whole, especially at thetop end of the income distribution. Across the UK as a whole, almost 40% of income tax ispaid by those earning more than £100,000. This compares with only 28% in Scotland.
Income Tax in Scotland: 2017 update, SB 17-84
4
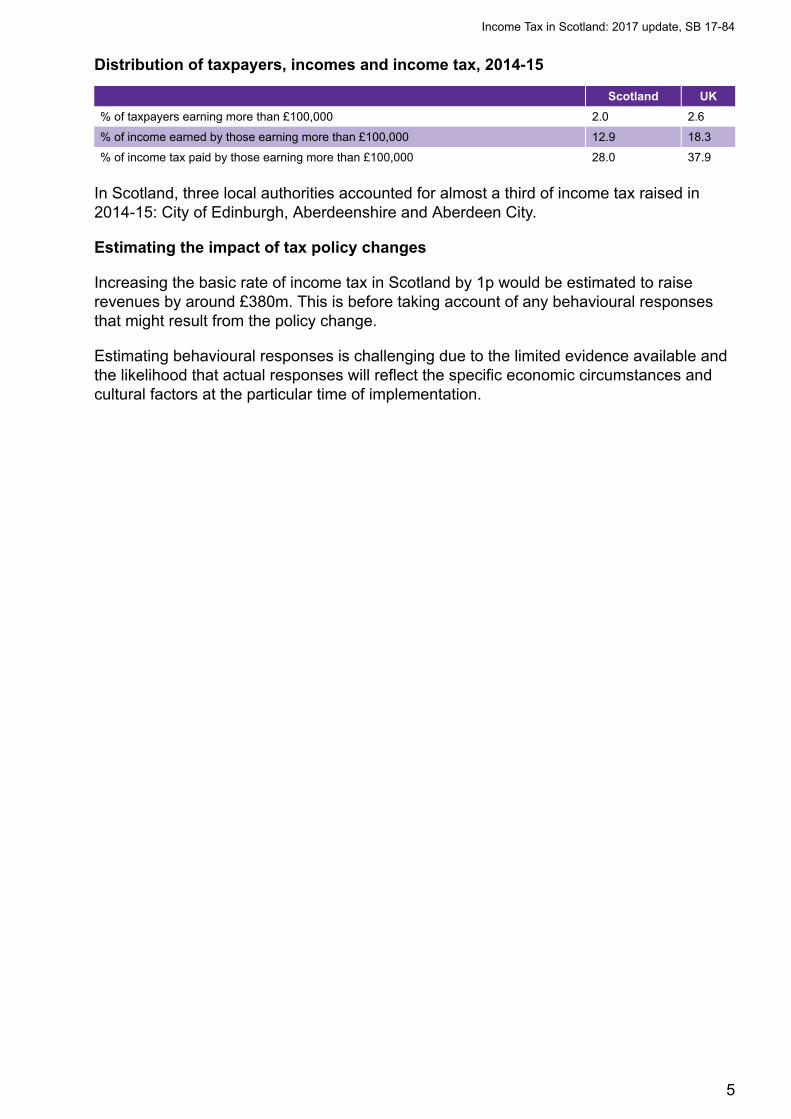
Distribution of taxpayers, incomes and income tax, 2014-15
Scotland UK
% of taxpayers earning more than £100,000 2.0 2.6
% of income earned by those earning more than £100,000 12.9 18.3
% of income tax paid by those earning more than £100,000 28.0 37.9
In Scotland, three local authorities accounted for almost a third of income tax raised in2014-15: City of Edinburgh, Aberdeenshire and Aberdeen City.
Estimating the impact of tax policy changes
Increasing the basic rate of income tax in Scotland by 1p would be estimated to raiserevenues by around £380m. This is before taking account of any behavioural responsesthat might result from the policy change.
Estimating behavioural responses is challenging due to the limited evidence available andthe likelihood that actual responses will reflect the specific economic circumstances andcultural factors at the particular time of implementation.
Income Tax in Scotland: 2017 update, SB 17-84
5
What is income tax?UK income tax is a tax imposed on individuals that varies with the taxable income of thetaxpayer. Taxable income is defined as gross income for income tax purposes less anyallowances and reliefs available at the taxpayer's marginal rate (see Annex 1 for the maintaxable and non-taxable benefits). Income tax is divided into graduated rates and isprogressive, that is to say high income individuals have a higher marginal rate of tax thanlower-income individuals.
UK income tax rates are marginal tax rates. The marginal tax is the percentage taken fromthe next pound of taxable income and is applied to income within each applicable taxbracket. For example the additional rate of income tax is charged only on taxable incomeabove the threshold of £150,000.
The UK has three main rates of income tax: basic, higher and additional.
Some taxpayers qualify for allowances that reduce their tax liability. The standard PersonalAllowance is the amount of tax-free income (£11,500 for 2017-18). This tapers away by £1for every £2 for taxpayers with "adjusted net incomes" over £100,000 (adjusted net incomeis total taxable income before any Personal Allowances and less certain tax reliefs such astrading losses and Gift Aid). This means in 2017-18 the allowance is zero for incomes of£123,000 or above. In 2018-19 Personal Allowance is £11,850 which means it will be zerofor taxpayers with income £123,700 or above. Other allowances include MarriageAllowance and Blind Person's Allowance.
Income Tax is charged on taxable income minus tax-free allowances.
There are three types of income for income tax purposes:
• All income other than savings and dividends. This is often referred to as “earnedincome” and includes pay from employment but also trading profits from self-employment and unincorporated businesses, pensions (state, occupational andpersonal), taxable benefits (e.g. Jobseeker’s Allowance) and income from property.
• Savings income (e.g. bank and building society interest, interest from unit trusts andopen ended investment companies).
• Dividends (income from UK-resident company shares, dividends from unit trusts andopen ended investment companies).
Rates and bands are set for the tax year. The income tax year is from 6 April to the 5 Aprilthe following year. The current tax year is from 6 April 2017 to 5 April 2018, referred to as2017-18. Note when working out income tax per capita values in the financial year2017-18, it is standard to take 75% of the Office for National Statistics' (ONS) population inthe first year (2017 for tax year 2017-18) and 25% of the population in the second year(2018 for tax year 2017-18).
Income Tax in Scotland: 2017 update, SB 17-84
6
Scottish income tax: LegislativeframeworkThe following UK Acts make provision about income tax in the UK as a whole:
• Income Tax (Earnings and Pensions) Act 2003 (which is about charges to tax onemployment income, pension income and social security income)
• Income Tax (Trading and Other Income) Act 2005 (which is about charges to tax ontrading income, property income, savings and investment income and some othermiscellaneous income)
• Income Tax Act 2007 (which contains the other main provisions about income tax).
All income tax powers provided to the Scottish Government are in relation to non-savings,non-dividend (NSND) income only, i.e. earnings. Income tax on dividends and savings isreserved to the UK Government. The definition of the income tax base, and personalallowance also remain reserved.
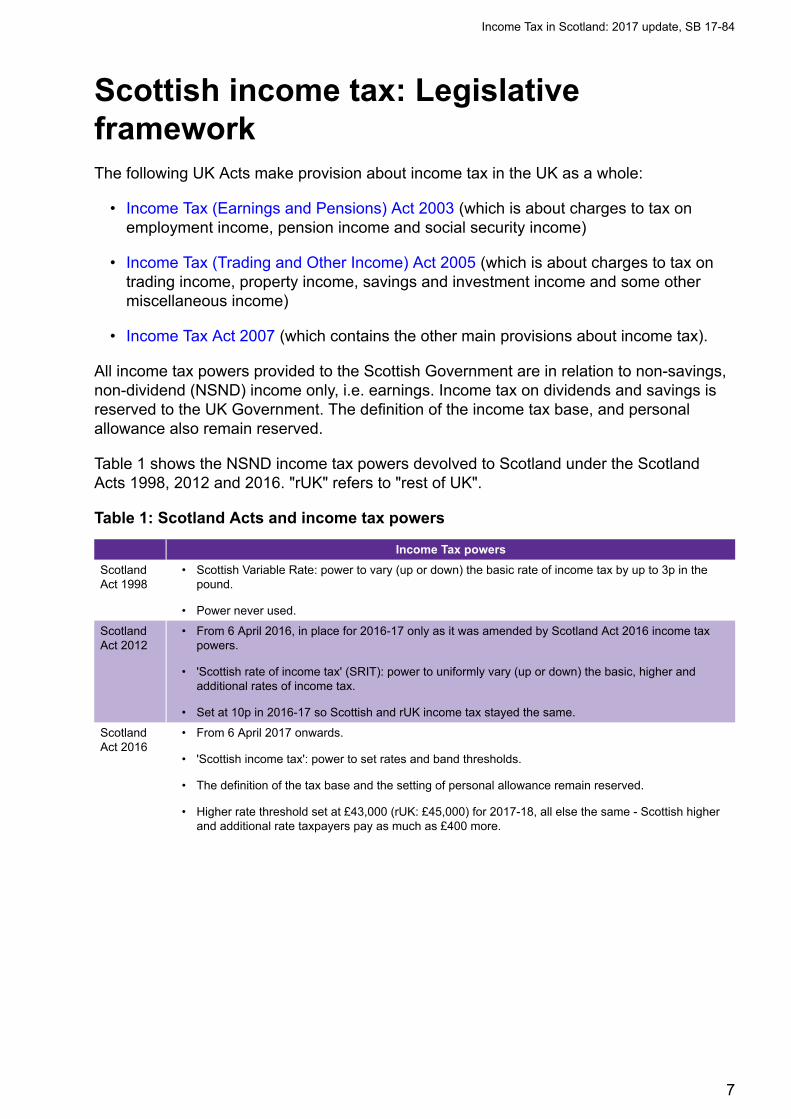
Table 1 shows the NSND income tax powers devolved to Scotland under the ScotlandActs 1998, 2012 and 2016. "rUK" refers to "rest of UK".
Table 1: Scotland Acts and income tax powers
Income Tax powers
ScotlandAct 1998
• Scottish Variable Rate: power to vary (up or down) the basic rate of income tax by up to 3p in thepound.
• Power never used.
ScotlandAct 2012
• From 6 April 2016, in place for 2016-17 only as it was amended by Scotland Act 2016 income taxpowers.
• 'Scottish rate of income tax' (SRIT): power to uniformly vary (up or down) the basic, higher andadditional rates of income tax.
• Set at 10p in 2016-17 so Scottish and rUK income tax stayed the same.
ScotlandAct 2016
• From 6 April 2017 onwards.
• 'Scottish income tax': power to set rates and band thresholds.
• The definition of the tax base and the setting of personal allowance remain reserved.
• Higher rate threshold set at £43,000 (rUK: £45,000) for 2017-18, all else the same - Scottish higherand additional rate taxpayers pay as much as £400 more.
Income Tax in Scotland: 2017 update, SB 17-84
7
"Scottish taxpayers"Section 25 of the Scotland Act 2012 sets out the definition of a 'Scottish taxpayer'. To be aScottish taxpayer, an individual must first be a UK taxpayer. Scotland must be the part ofthe UK with which Scottish taxpayers have the 'closest connection'. In order for this to bethe case one or more of the following conditions must apply:
• they spend at least a part of that year in Scotland; and for at least part of that timespent in Scotland, their principal UK home is located in Scotland and use of it is madeas a place of residence. The times in that year when Scotland is where their principalUK home is located comprise (in aggregate) at least as much of that year as the times(if any) in that year when the location of their principal UK home is not in Scotland;
• the number of days they spend in Scotland in that year is equal or above the numberof days they spend elsewhere in the UK; or
• for the whole or part of the tax year they are an MSP, an MP representing aconstituency in Scotland, or an MEP representing Scotland. This is regardless of thelocation in the UK of their main place of residence.
In most cases the key test for Scottish taxpayer status rests on establishing an individual’splace of residence.
Further guidance is provided by HMRC in Scottish Taxpayer Technical Guidance 1 .
HMRC is responsible for the initial and ongoing determination of whether or not someoneis a Scottish taxpayer and identifies them with an 'S' at the beginning of their tax code.
HMRC reported in its Annual Report and Accounts 2016-17 2 that it had issued tax codesto about 2.5 million Scottish taxpayers.
Income Tax in Scotland: 2017 update, SB 17-84
8
Facts and figures
Scottish income tax policy 2017-18
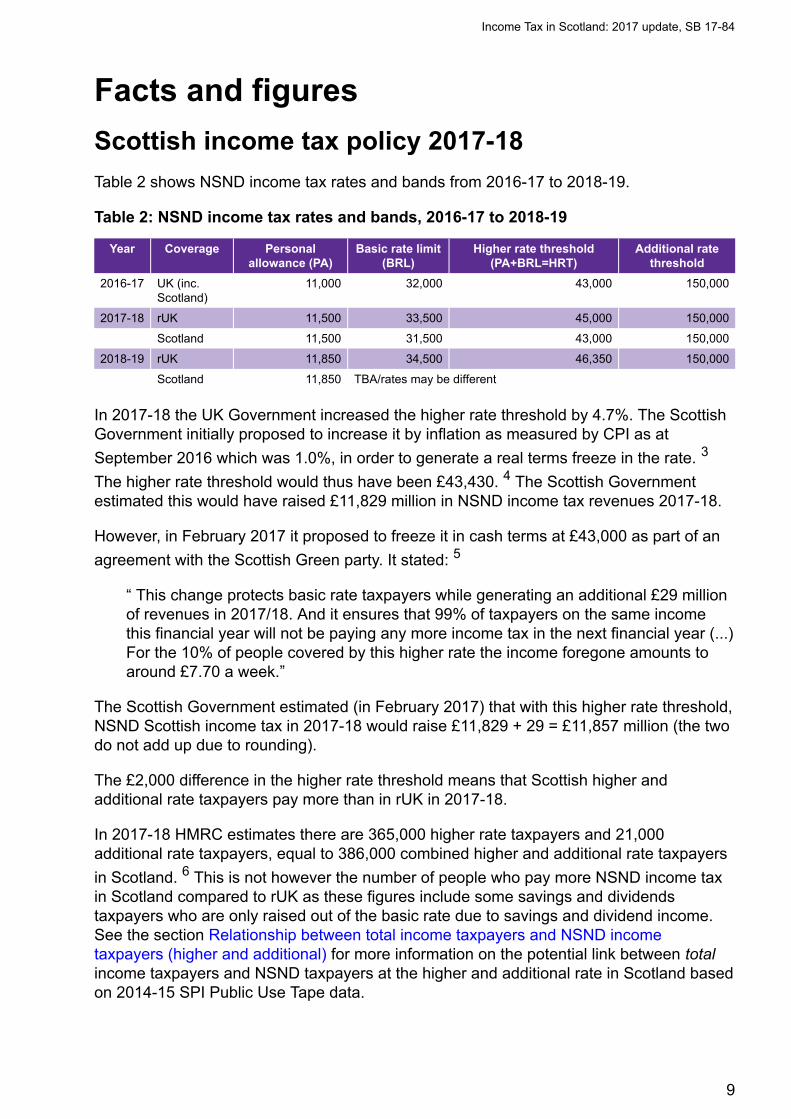
Table 2 shows NSND income tax rates and bands from 2016-17 to 2018-19.
Table 2: NSND income tax rates and bands, 2016-17 to 2018-19
Year Coverage Personalallowance (PA)
Basic rate limit(BRL)
Higher rate threshold(PA+BRL=HRT)
Additional ratethreshold
2016-17 UK (inc.Scotland)
11,000 32,000 43,000 150,000
2017-18 rUK 11,500 33,500 45,000 150,000
Scotland 11,500 31,500 43,000 150,000
2018-19 rUK 11,850 34,500 46,350 150,000
Scotland 11,850 TBA/rates may be different
In 2017-18 the UK Government increased the higher rate threshold by 4.7%. The ScottishGovernment initially proposed to increase it by inflation as measured by CPI as at
September 2016 which was 1.0%, in order to generate a real terms freeze in the rate. 3
The higher rate threshold would thus have been £43,430. 4 The Scottish Governmentestimated this would have raised £11,829 million in NSND income tax revenues 2017-18.
However, in February 2017 it proposed to freeze it in cash terms at £43,000 as part of an
agreement with the Scottish Green party. It stated: 5
The Scottish Government estimated (in February 2017) that with this higher rate threshold,NSND Scottish income tax in 2017-18 would raise £11,829 + 29 = £11,857 million (the twodo not add up due to rounding).
The £2,000 difference in the higher rate threshold means that Scottish higher andadditional rate taxpayers pay more than in rUK in 2017-18.
In 2017-18 HMRC estimates there are 365,000 higher rate taxpayers and 21,000additional rate taxpayers, equal to 386,000 combined higher and additional rate taxpayers
in Scotland. 6 This is not however the number of people who pay more NSND income taxin Scotland compared to rUK as these figures include some savings and dividendstaxpayers who are only raised out of the basic rate due to savings and dividend income.See the section Relationship between total income taxpayers and NSND incometaxpayers (higher and additional) for more information on the potential link between totalincome taxpayers and NSND taxpayers at the higher and additional rate in Scotland basedon 2014-15 SPI Public Use Tape data.
“ This change protects basic rate taxpayers while generating an additional £29 millionof revenues in 2017/18. And it ensures that 99% of taxpayers on the same incomethis financial year will not be paying any more income tax in the next financial year (...)For the 10% of people covered by this higher rate the income foregone amounts toaround £7.70 a week.”
Income Tax in Scotland: 2017 update, SB 17-84
9

The UK Government announced income tax rates and bands as well as allowances in the
Autumn Budget 2017 7 (Table 2). The Scottish Government will set out its income taxproposals for 2018-19 on 14 December 2017, in the Draft Budget 2018-19.
The UK Government is committed to raising the personal allowance to £12,500 and the
higher rate threshold to £50,000 by 2020. 7
Scottish income tax - Illustrative examples for 2017-18
• A taxpayer with £35,000 of taxable income will pay only the basic rate of incometax and will pay tax on £35,000 – £11,500 = £23,500. Their tax is 23,500 * 20% =£4,700. This is equal to 13.4% of their taxable income.
• A taxpayer with £50,000 of taxable income is a “higher rate taxpayer” and istaxed on £50,000 - £11,500 = £38,500. They pay the basic rate on £31,500(equal to £6,300) and the higher rate on £39,400 - £31,500 = £7,000 (equal to£2,800). Altogether they pay £9,100 in tax. This is equal to 18.2% of their taxableincome.
• A taxpayer with £200,000 of taxable income is an "additional rate taxpayer" andhas no personal allowance. They pay the basic rate of tax on £31,500 (£6,300),the higher rate on £150,000 - £31,500 = £188,500 (£47,400) and the additionalrate on £50,000 (£22,500), so in total their tax is £76,200. This is equal to 38.1%of their taxable income.
Savings and dividend income is taxed as the highest part of a person’s total income anddividend income is taken as the highest part of the combined amount if a person has bothsavings and dividend income. Therefore the first slice of a person’s income comprisesearnings, pensions, taxable social security payments, trading profits and income from
property. The next slice is savings income and dividend income is the top slice. 8
The marginal tax rate is the tax rate paid on an additional pound of earned income. This isdifferent from the average tax rate, which is the ratio of income tax liability to total income,where income is measured before deductions, reliefs and allowances. Deductions,allowances and tax credits vary across individuals leading to differences in individualaverage tax rates over and above differences in individual incomes.
The overall average income tax rate in the UK is 16.5% in 2017-18, down from 17.2% in
2015-16 and 17.4% in 2012-13. 9
Taxpayers in Scotland in 2017-18
The following data is taken from the Survey of Personal Incomes (SPI) 2014-15. (SPI), anannual HMRC survey based on a sample of 600,000 individuals drawn from their PAYE,self-assessment and Claims systems. There is also a Public Use Tape of the SPI, currentlyavailable for 2014-15 available in the UK Data Archive. This is however only available witha long time lag - the 2014-15 SPI was released on 7 September 2017.
Income Tax in Scotland: 2017 update, SB 17-84
10
HMRC provides income tax and taxpayer number estimates up to 2017-18 using economicassumptions consistent with the OBR’s March 2017 economic and fiscal outlook.
Note the figures below are for Scottish income taxpayers - this is not the same as ScottishNSND income taxpayers as HMRC include some savings and dividends taxpayers whoare only raised out of the basic rate due to savings and dividend income. These wouldhave to be stripped out to obtain the exact number of taxpayers paying more NSNDincome tax in Scotland compared to rUK.
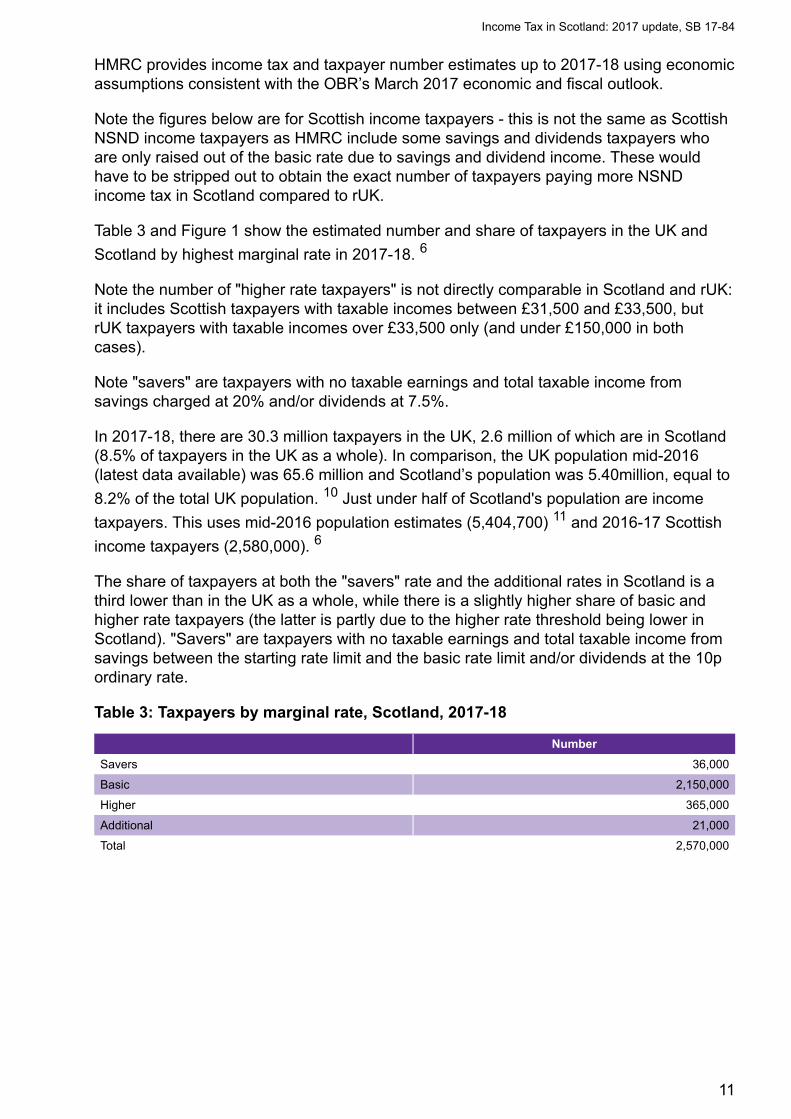
Table 3 and Figure 1 show the estimated number and share of taxpayers in the UK and
Scotland by highest marginal rate in 2017-18. 6
Note the number of "higher rate taxpayers" is not directly comparable in Scotland and rUK:it includes Scottish taxpayers with taxable incomes between £31,500 and £33,500, butrUK taxpayers with taxable incomes over £33,500 only (and under £150,000 in bothcases).
Note "savers" are taxpayers with no taxable earnings and total taxable income fromsavings charged at 20% and/or dividends at 7.5%.
In 2017-18, there are 30.3 million taxpayers in the UK, 2.6 million of which are in Scotland(8.5% of taxpayers in the UK as a whole). In comparison, the UK population mid-2016(latest data available) was 65.6 million and Scotland’s population was 5.40million, equal to
8.2% of the total UK population. 10 Just under half of Scotland's population are income
taxpayers. This uses mid-2016 population estimates (5,404,700) 11 and 2016-17 Scottish
income taxpayers (2,580,000). 6
The share of taxpayers at both the "savers" rate and the additional rates in Scotland is athird lower than in the UK as a whole, while there is a slightly higher share of basic andhigher rate taxpayers (the latter is partly due to the higher rate threshold being lower inScotland). "Savers" are taxpayers with no taxable earnings and total taxable income fromsavings between the starting rate limit and the basic rate limit and/or dividends at the 10pordinary rate.
Table 3: Taxpayers by marginal rate, Scotland, 2017-18
Number
Savers 36,000
Basic 2,150,000
Higher 365,000
Additional 21,000
Total 2,570,000
Income Tax in Scotland: 2017 update, SB 17-84
11
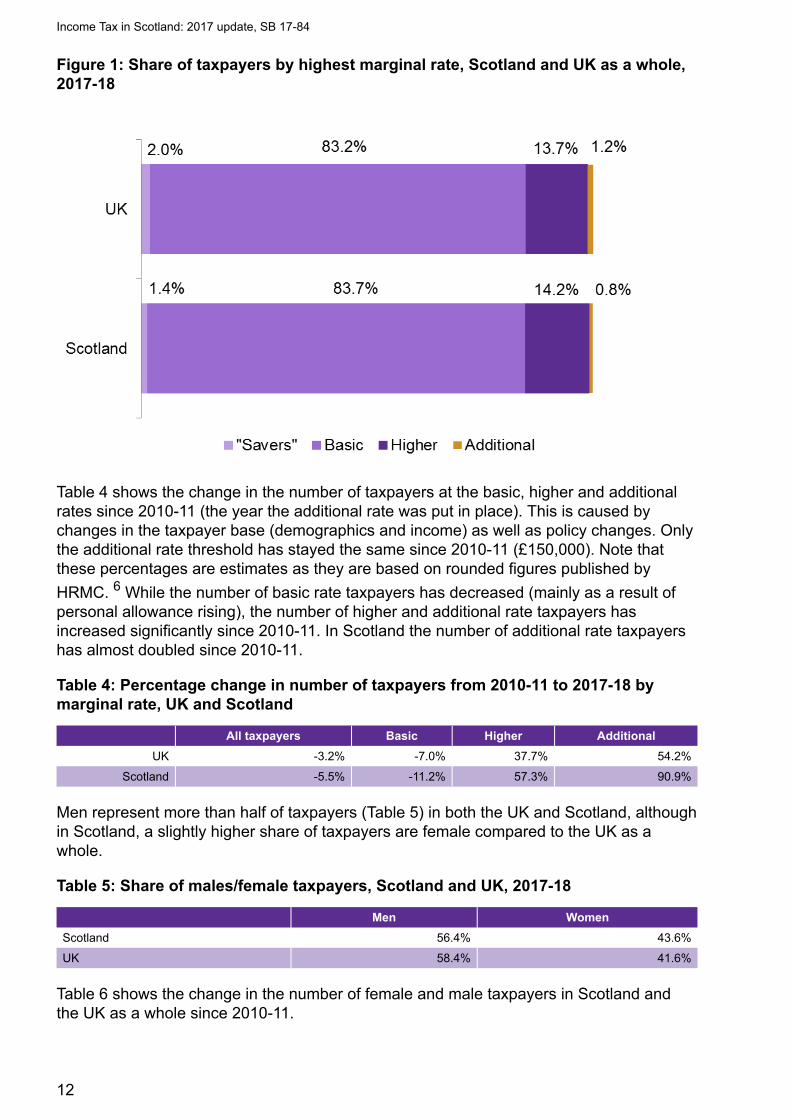
Figure 1: Share of taxpayers by highest marginal rate, Scotland and UK as a whole,2017-18
Table 4 shows the change in the number of taxpayers at the basic, higher and additionalrates since 2010-11 (the year the additional rate was put in place). This is caused bychanges in the taxpayer base (demographics and income) as well as policy changes. Onlythe additional rate threshold has stayed the same since 2010-11 (£150,000). Note thatthese percentages are estimates as they are based on rounded figures published by
HRMC. 6 While the number of basic rate taxpayers has decreased (mainly as a result ofpersonal allowance rising), the number of higher and additional rate taxpayers hasincreased significantly since 2010-11. In Scotland the number of additional rate taxpayershas almost doubled since 2010-11.
Table 4: Percentage change in number of taxpayers from 2010-11 to 2017-18 bymarginal rate, UK and Scotland
All taxpayers Basic Higher Additional
UK -3.2% -7.0% 37.7% 54.2%
Scotland -5.5% -11.2% 57.3% 90.9%
Men represent more than half of taxpayers (Table 5) in both the UK and Scotland, althoughin Scotland, a slightly higher share of taxpayers are female compared to the UK as awhole.
Table 5: Share of males/female taxpayers, Scotland and UK, 2017-18
Men Women
Scotland 56.4% 43.6%
UK 58.4% 41.6%
Table 6 shows the change in the number of female and male taxpayers in Scotland andthe UK as a whole since 2010-11.
Income Tax in Scotland: 2017 update, SB 17-84
12
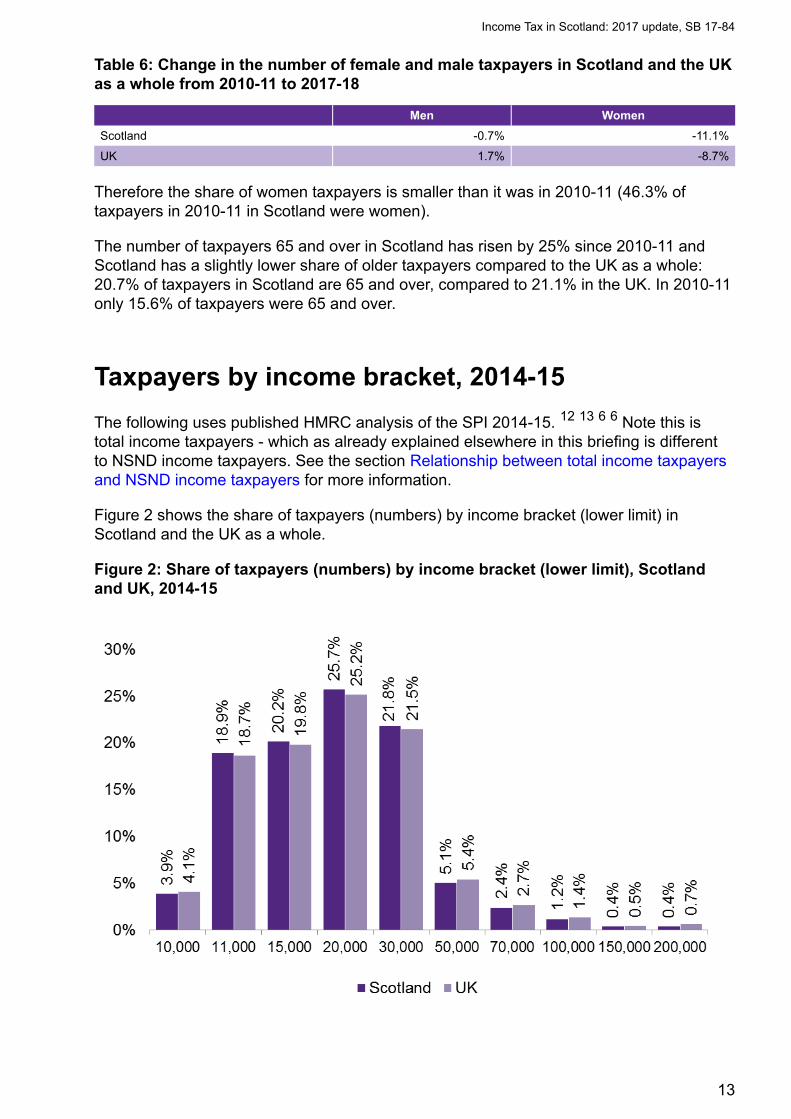
Table 6: Change in the number of female and male taxpayers in Scotland and the UKas a whole from 2010-11 to 2017-18
Men Women
Scotland -0.7% -11.1%
UK 1.7% -8.7%
Therefore the share of women taxpayers is smaller than it was in 2010-11 (46.3% oftaxpayers in 2010-11 in Scotland were women).
The number of taxpayers 65 and over in Scotland has risen by 25% since 2010-11 andScotland has a slightly lower share of older taxpayers compared to the UK as a whole:20.7% of taxpayers in Scotland are 65 and over, compared to 21.1% in the UK. In 2010-11only 15.6% of taxpayers were 65 and over.
Taxpayers by income bracket, 2014-15
The following uses published HMRC analysis of the SPI 2014-15. 12 13 6 6 Note this istotal income taxpayers - which as already explained elsewhere in this briefing is differentto NSND income taxpayers. See the section Relationship between total income taxpayersand NSND income taxpayers for more information.
Figure 2 shows the share of taxpayers (numbers) by income bracket (lower limit) inScotland and the UK as a whole.
Figure 2: Share of taxpayers (numbers) by income bracket (lower limit), Scotlandand UK, 2014-15
Income Tax in Scotland: 2017 update, SB 17-84
13
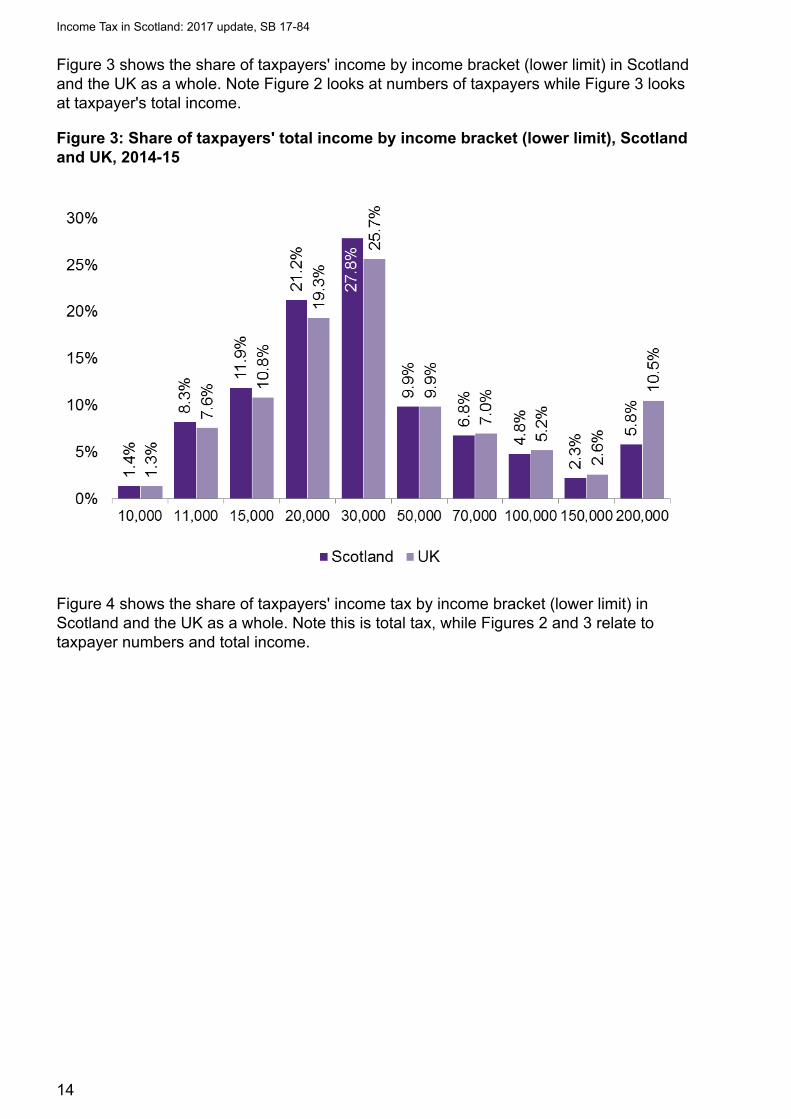
Figure 3 shows the share of taxpayers' income by income bracket (lower limit) in Scotlandand the UK as a whole. Note Figure 2 looks at numbers of taxpayers while Figure 3 looksat taxpayer's total income.
Figure 3: Share of taxpayers' total income by income bracket (lower limit), Scotlandand UK, 2014-15
Figure 4 shows the share of taxpayers' income tax by income bracket (lower limit) inScotland and the UK as a whole. Note this is total tax, while Figures 2 and 3 relate totaxpayer numbers and total income.
Income Tax in Scotland: 2017 update, SB 17-84
14
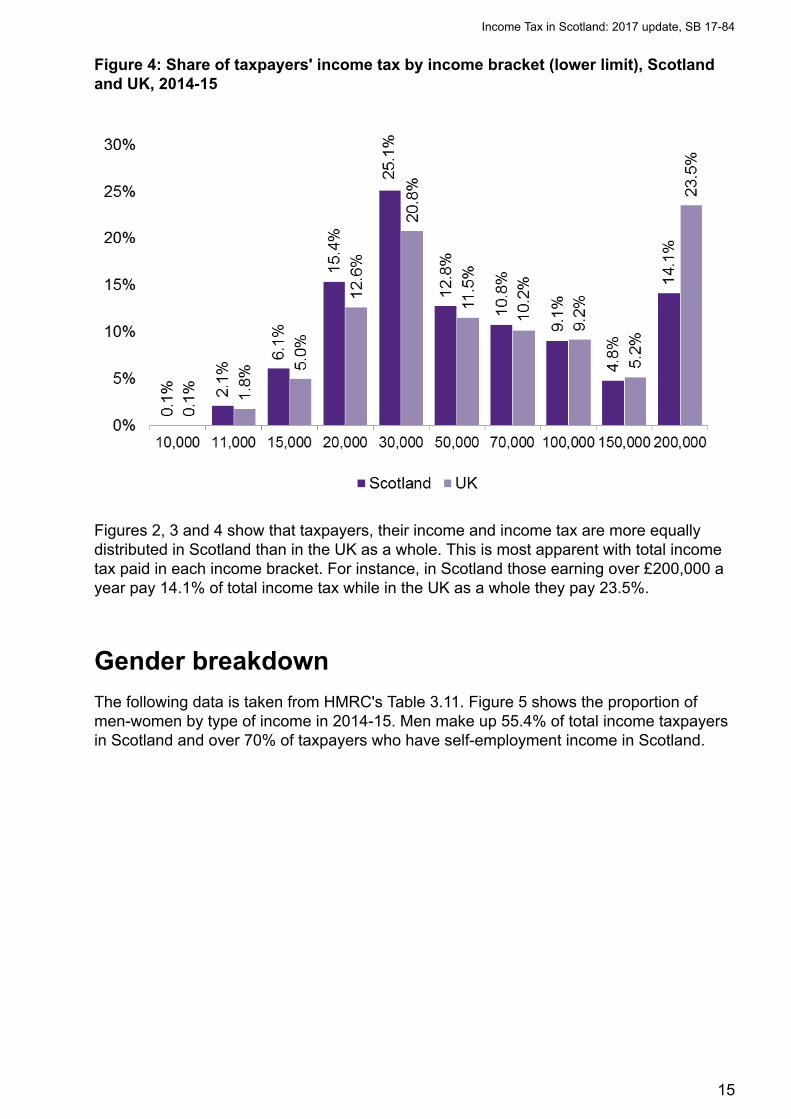
Figure 4: Share of taxpayers' income tax by income bracket (lower limit), Scotlandand UK, 2014-15
Figures 2, 3 and 4 show that taxpayers, their income and income tax are more equallydistributed in Scotland than in the UK as a whole. This is most apparent with total incometax paid in each income bracket. For instance, in Scotland those earning over £200,000 ayear pay 14.1% of total income tax while in the UK as a whole they pay 23.5%.
Gender breakdown
The following data is taken from HMRC's Table 3.11. Figure 5 shows the proportion ofmen-women by type of income in 2014-15. Men make up 55.4% of total income taxpayersin Scotland and over 70% of taxpayers who have self-employment income in Scotland.
Income Tax in Scotland: 2017 update, SB 17-84
15
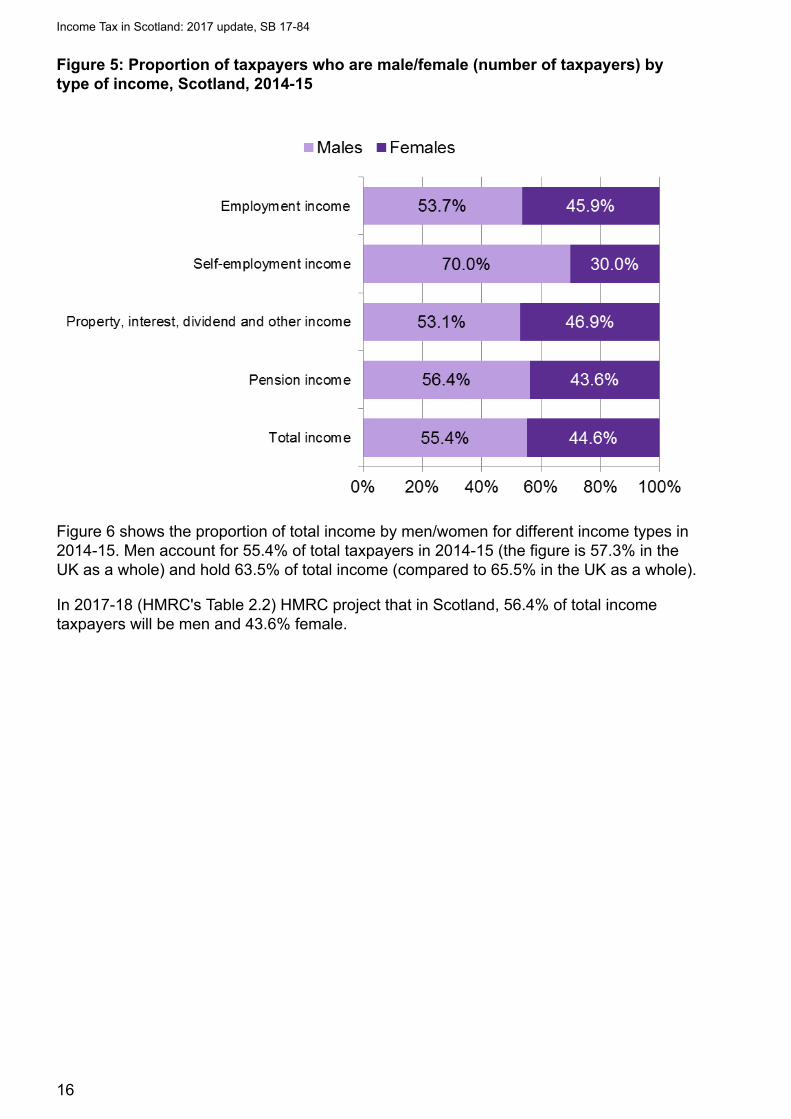
Figure 5: Proportion of taxpayers who are male/female (number of taxpayers) bytype of income, Scotland, 2014-15
Figure 6 shows the proportion of total income by men/women for different income types in2014-15. Men account for 55.4% of total taxpayers in 2014-15 (the figure is 57.3% in theUK as a whole) and hold 63.5% of total income (compared to 65.5% in the UK as a whole).
In 2017-18 (HMRC's Table 2.2) HMRC project that in Scotland, 56.4% of total incometaxpayers will be men and 43.6% female.
Income Tax in Scotland: 2017 update, SB 17-84
16
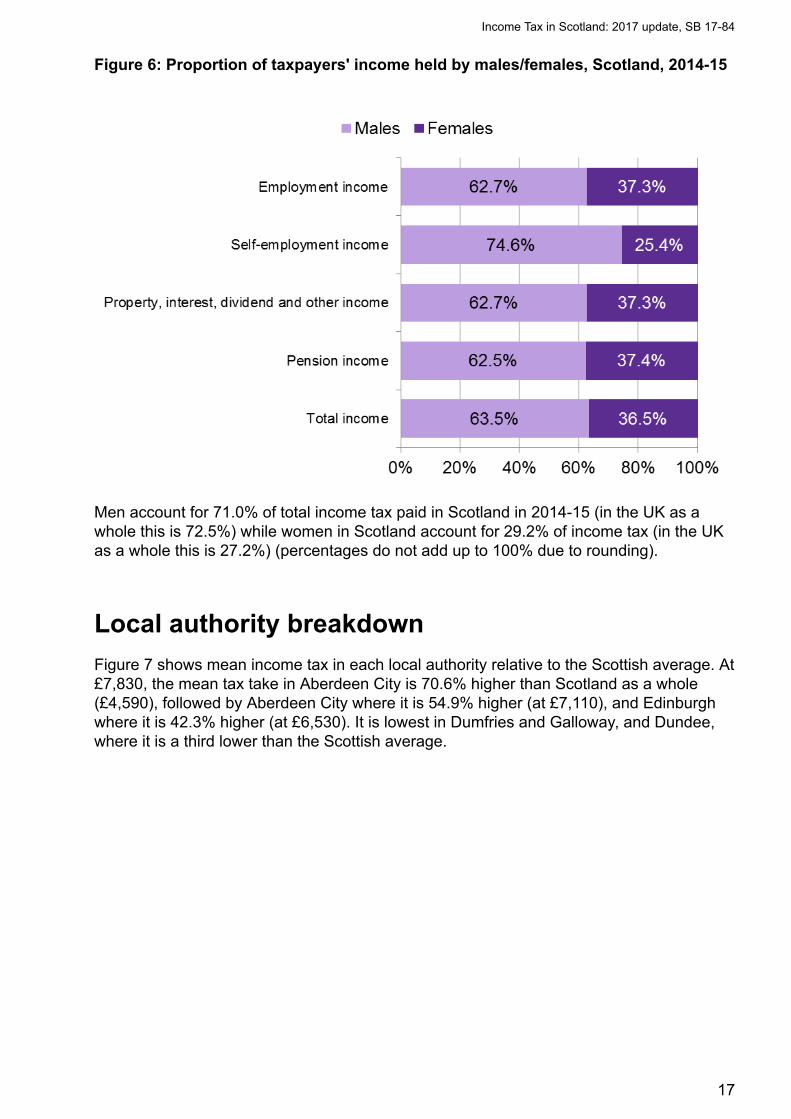
Figure 6: Proportion of taxpayers' income held by males/females, Scotland, 2014-15
Men account for 71.0% of total income tax paid in Scotland in 2014-15 (in the UK as awhole this is 72.5%) while women in Scotland account for 29.2% of income tax (in the UKas a whole this is 27.2%) (percentages do not add up to 100% due to rounding).
Local authority breakdown
Figure 7 shows mean income tax in each local authority relative to the Scottish average. At£7,830, the mean tax take in Aberdeen City is 70.6% higher than Scotland as a whole(£4,590), followed by Aberdeen City where it is 54.9% higher (at £7,110), and Edinburghwhere it is 42.3% higher (at £6,530). It is lowest in Dumfries and Galloway, and Dundee,where it is a third lower than the Scottish average.
Income Tax in Scotland: 2017 update, SB 17-84
17

Figure 7: Mean income tax by local authority relative to Scottish average, 2014-15
Figure 8 shows the share of income tax raised by each local authority in 2014-15.Edinburgh raises the highest share, at 13.9%, followed by Aberdeenshire at 8.7% andAberdeen at 8.1%.
Income Tax in Scotland: 2017 update, SB 17-84
18
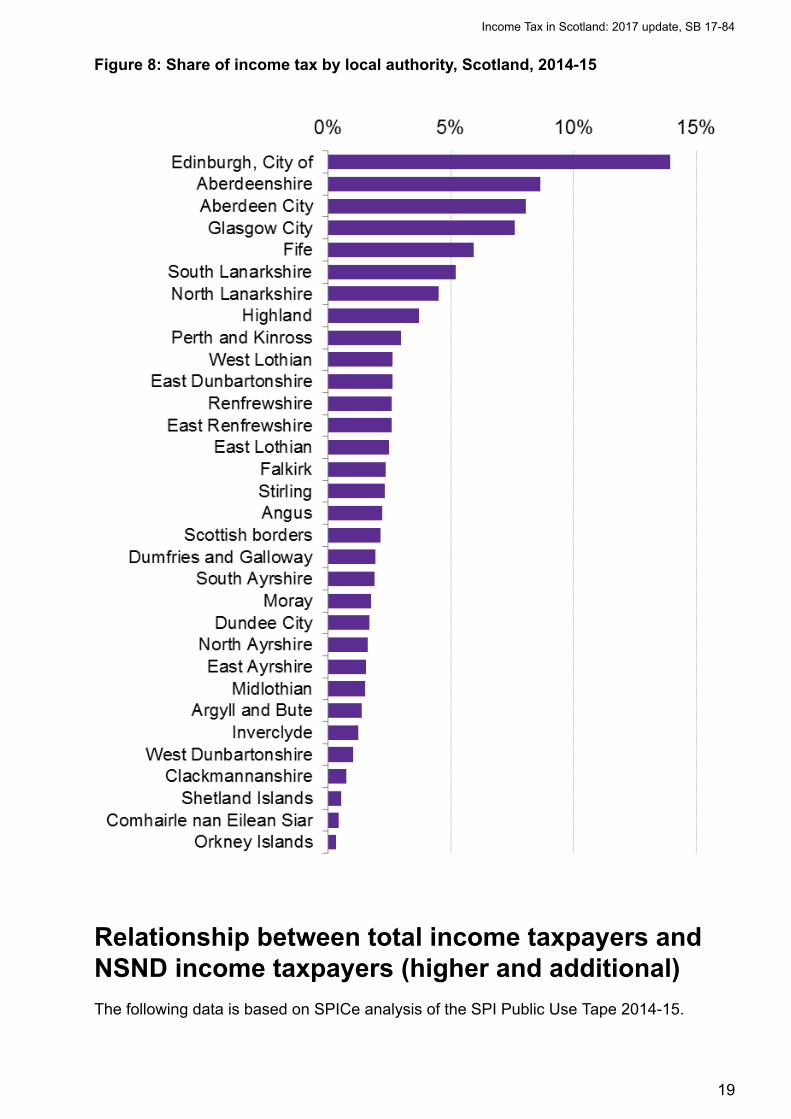
Figure 8: Share of income tax by local authority, Scotland, 2014-15
Relationship between total income taxpayers andNSND income taxpayers (higher and additional)
The following data is based on SPICe analysis of the SPI Public Use Tape 2014-15.
Income Tax in Scotland: 2017 update, SB 17-84
19
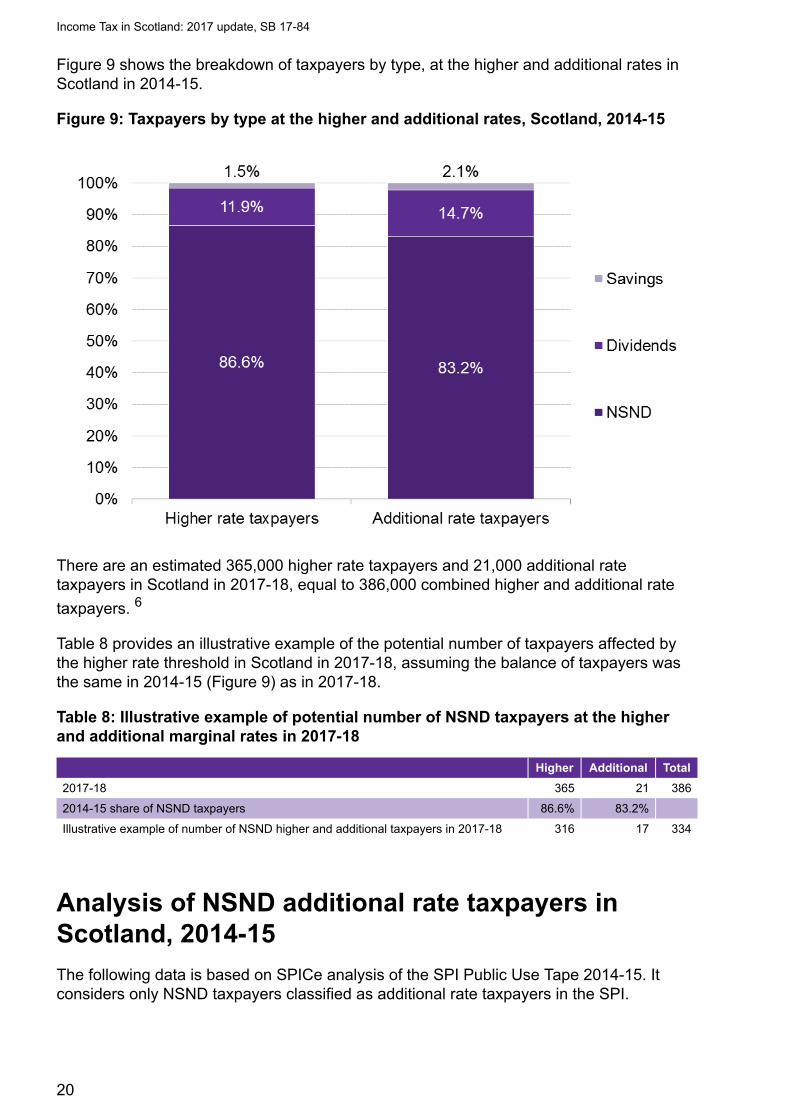
Figure 9 shows the breakdown of taxpayers by type, at the higher and additional rates inScotland in 2014-15.
Figure 9: Taxpayers by type at the higher and additional rates, Scotland, 2014-15
There are an estimated 365,000 higher rate taxpayers and 21,000 additional ratetaxpayers in Scotland in 2017-18, equal to 386,000 combined higher and additional rate
taxpayers. 6
Table 8 provides an illustrative example of the potential number of taxpayers affected bythe higher rate threshold in Scotland in 2017-18, assuming the balance of taxpayers wasthe same in 2014-15 (Figure 9) as in 2017-18.
Table 8: Illustrative example of potential number of NSND taxpayers at the higherand additional marginal rates in 2017-18
Higher Additional Total
2017-18 365 21 386
2014-15 share of NSND taxpayers 86.6% 83.2%
Illustrative example of number of NSND higher and additional taxpayers in 2017-18 316 17 334
Analysis of NSND additional rate taxpayers inScotland, 2014-15
The following data is based on SPICe analysis of the SPI Public Use Tape 2014-15. Itconsiders only NSND taxpayers classified as additional rate taxpayers in the SPI.
Income Tax in Scotland: 2017 update, SB 17-84
20

There were 18,000 additional rate taxpayers in Scotland in 2014-15. This is taxpayers withtotal taxable income above the higher rate limit (£150,000). Of these, 83.2% were NSNDadditional rate taxpayers as shown in Figure 9.
Figure 10 shows the the distribution of NSND additional rate income taxpayers and theirincome tax by industry.
Figure 10: Distribution of NSND additional rate taxpayers (numbers and income tax)by industry, 2014-15
Figure 11 shows the number of NSND additional rate taxpayers by industry type and bygender in 2014-15.
Income Tax in Scotland: 2017 update, SB 17-84
21
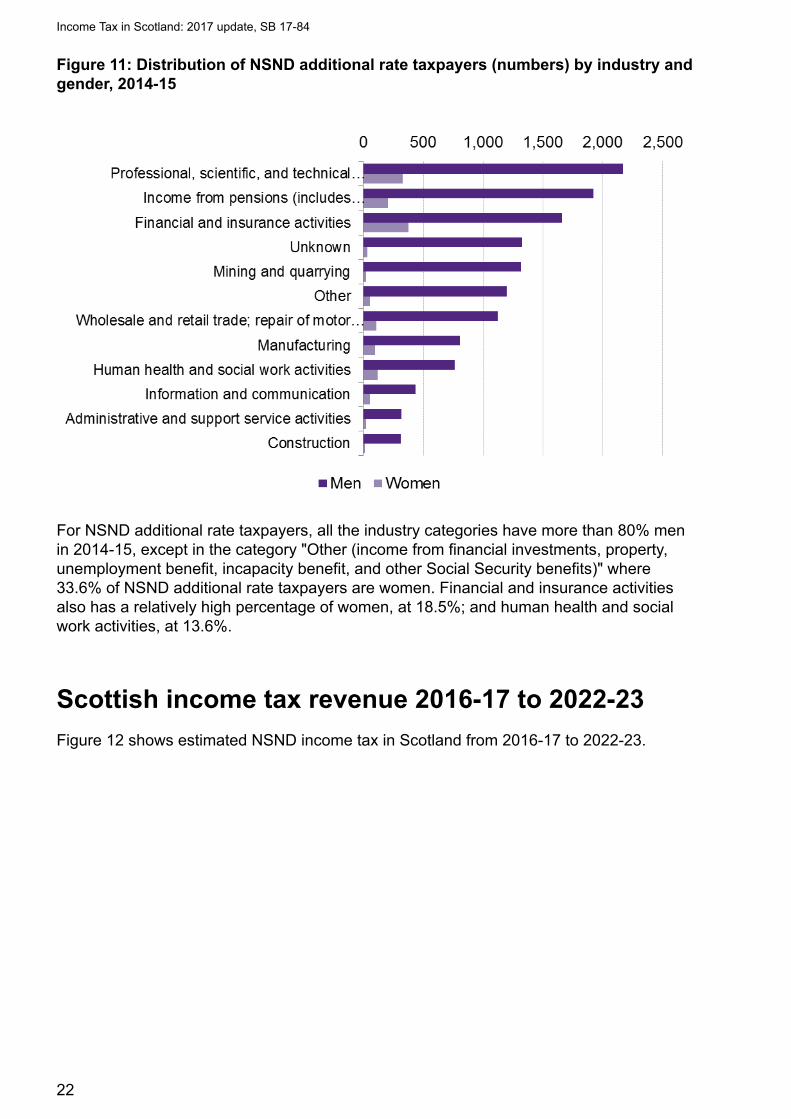
Figure 11: Distribution of NSND additional rate taxpayers (numbers) by industry andgender, 2014-15
For NSND additional rate taxpayers, all the industry categories have more than 80% menin 2014-15, except in the category "Other (income from financial investments, property,unemployment benefit, incapacity benefit, and other Social Security benefits)" where33.6% of NSND additional rate taxpayers are women. Financial and insurance activitiesalso has a relatively high percentage of women, at 18.5%; and human health and socialwork activities, at 13.6%.
Scottish income tax revenue 2016-17 to 2022-23
Figure 12 shows estimated NSND income tax in Scotland from 2016-17 to 2022-23.
Income Tax in Scotland: 2017 update, SB 17-84
22
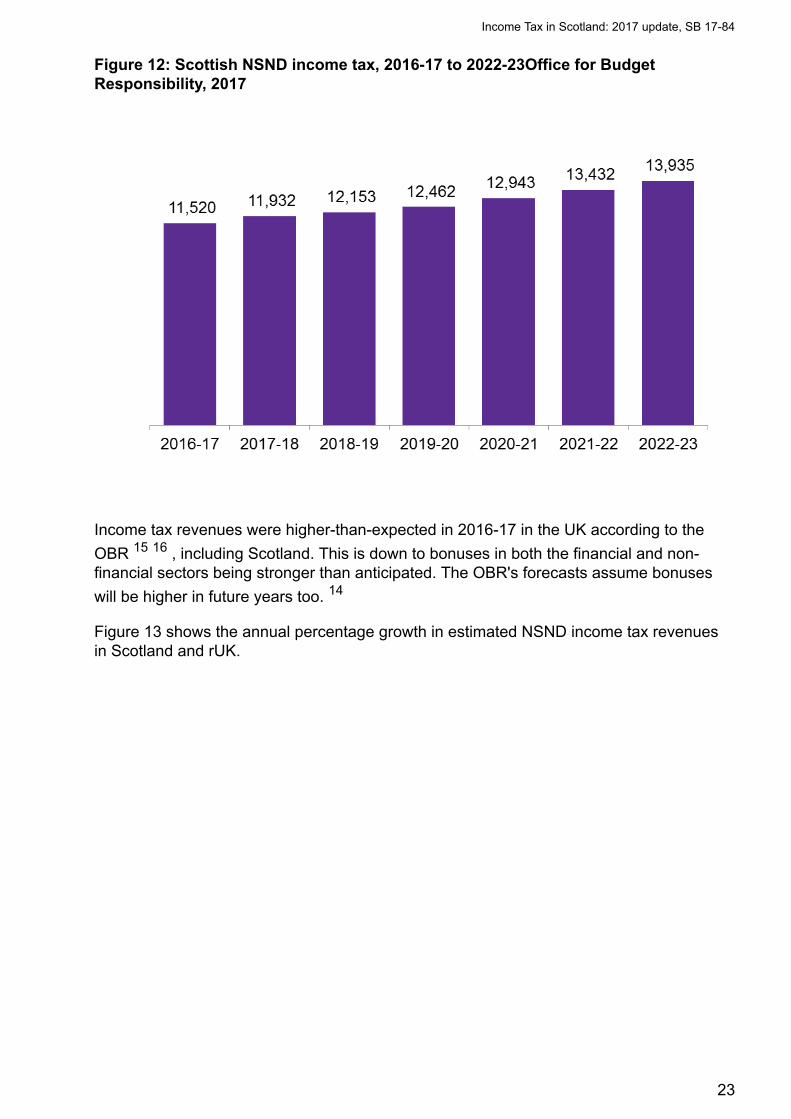
Figure 12: Scottish NSND income tax, 2016-17 to 2022-23Office for BudgetResponsibility, 2017
Income tax revenues were higher-than-expected in 2016-17 in the UK according to the
OBR 15 16 , including Scotland. This is down to bonuses in both the financial and non-financial sectors being stronger than anticipated. The OBR's forecasts assume bonuses
will be higher in future years too. 14
Figure 13 shows the annual percentage growth in estimated NSND income tax revenuesin Scotland and rUK.
Income Tax in Scotland: 2017 update, SB 17-84
23
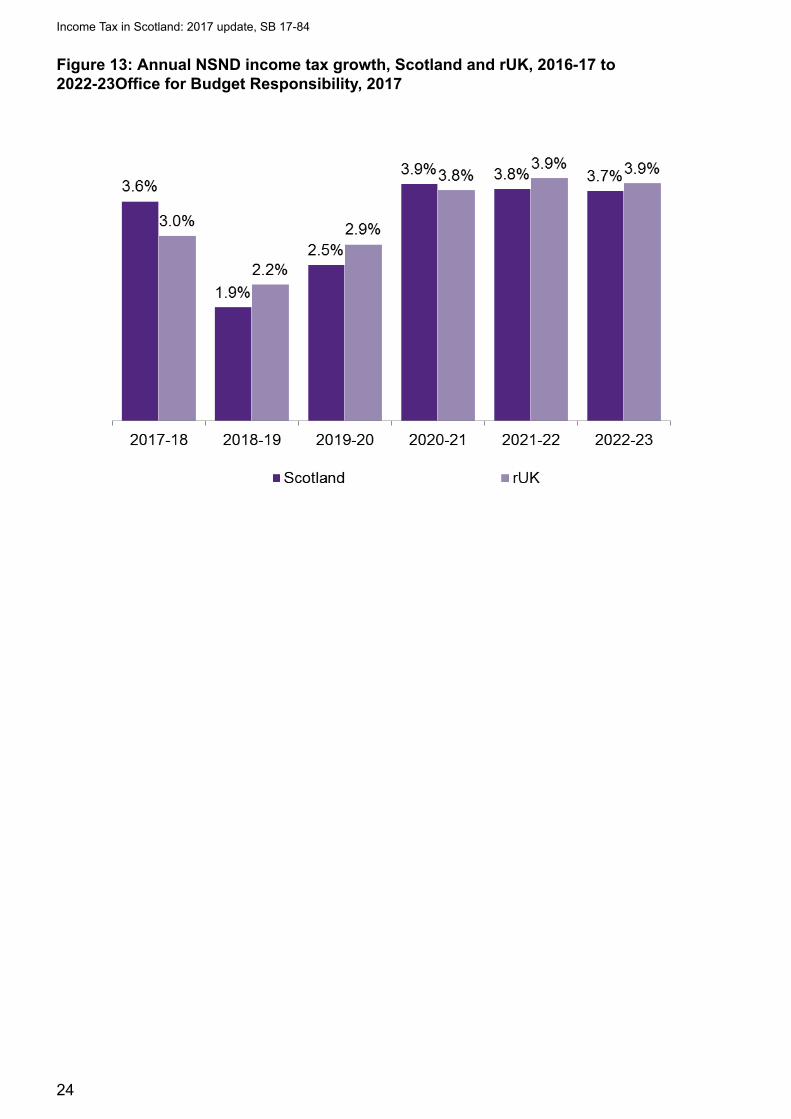
Figure 13: Annual NSND income tax growth, Scotland and rUK, 2016-17 to2022-23Office for Budget Responsibility, 2017
Income Tax in Scotland: 2017 update, SB 17-84
24

HMRC, auditing and costs ofimplementationIncome tax continues to be administered and collected by HMRC across the UK includingScotland.
The Comptroller and Auditor General (C&AG) is required for each financial year to reporton HMRC's administration and collection of Scottish income tax, including reimbursementsfrom the Scottish Government. It has so far published:
• The administration of the Scottish Rate of Income Tax 2014-15 17 (November 2015)
• The administration of the Scottish Rate of Income Tax 2015-16 18 (December 2016)
• The administration of the Scottish Rate of Income Tax 2016-17 19 (December 2017)
The Fiscal Framework specifies that the Scottish Government will reimburse the UKGovernment for costs associated with income tax changes.
Final total costs of implementing Scottish income tax (including SRIT) will be £20-25
million for SRIT, plus an additional £2.6 million for further Scottish income tax. 20
Income Tax in Scotland: 2017 update, SB 17-84
25
Interaction with other parts of the UK taxsystem
Savings and dividends
In 2017-18, Scottish taxpayers with total earnings above the Scottish higher rate threshold(HRT) (£43,000) but below the UK Government’s HRT (£45,000) pay the higher rate ontheir NSND income within this band, whereas savings and dividends income is taxed atthe basic rate because taxation of savings and dividends income is determined by the UKGovernment.
Capital Gains Tax
Taxpayers are treated differently for Capital Gains Tax (CGT) purposes depending onwhich UK income tax band they are in - not Scottish tax band. In 2017-18, higher rateScottish taxpayers with earnings between £43,000 and £45,000 are treated like basic ratetaxpayers for CGT purposes. Higher or additional rate taxpayers (based on UK tax bands)pay 28% on their gains from residential property and 20% on their gains from otherchargeable assets, while the rate for basic rate taxpayers depends on various factors such
as the size of their taxable income and size of the gain from selling the asset. 21
The rules that determine an individual’s principal private residence are different from therules that determine Scottish taxpayer Status.
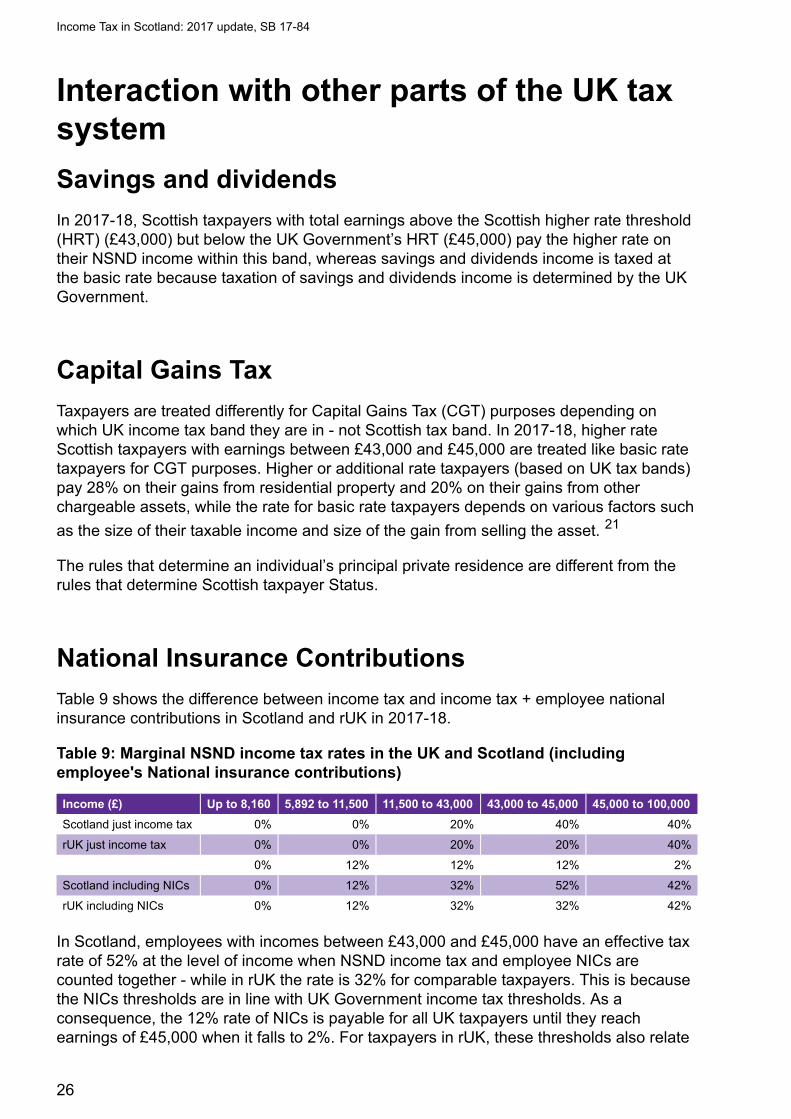
National Insurance Contributions
Table 9 shows the difference between income tax and income tax + employee nationalinsurance contributions in Scotland and rUK in 2017-18.
Table 9: Marginal NSND income tax rates in the UK and Scotland (includingemployee's National insurance contributions)
Income (£) Up to 8,160 5,892 to 11,500 11,500 to 43,000 43,000 to 45,000 45,000 to 100,000
Scotland just income tax 0% 0% 20% 40% 40%
rUK just income tax 0% 0% 20% 20% 40%
0% 12% 12% 12% 2%
Scotland including NICs 0% 12% 32% 52% 42%
rUK including NICs 0% 12% 32% 32% 42%
In Scotland, employees with incomes between £43,000 and £45,000 have an effective taxrate of 52% at the level of income when NSND income tax and employee NICs arecounted together - while in rUK the rate is 32% for comparable taxpayers. This is becausethe NICs thresholds are in line with UK Government income tax thresholds. As aconsequence, the 12% rate of NICs is payable for all UK taxpayers until they reachearnings of £45,000 when it falls to 2%. For taxpayers in rUK, these thresholds also relate
Income Tax in Scotland: 2017 update, SB 17-84
26
to when the higher rate of income tax becomes payable. However, for Scottish taxpayers,due to the difference in the HRT, there is a band between £43,000 and £45,000 whereindividuals will be liable for both the higher rate of income tax and the higher rate of NICs.
Pensions
Tax relief is given for most pension contributions. Personal pension contributions are madeafter tax, and the pension scheme administrator (PSA) claims relief at source (RAS) fromHMRC. Note the RAS is paid at the basic rate.
If Scottish and rUK income tax differs, Scottish and rUK taxpayers will receive a differentrate of relief at source on their personal pension contributions. HMRC must notify pensionproviders of the correct rate of income tax for their scheme members from April 2018 -ministers having agreed to a two-year transitional period (2016-17 and 2017-18) to allow
for the industry to prepare its systems for Scottish income tax. 18 The NAO notes:
Additionally, there are other ways of getting pensions relief, such as Self-Assessment andnet pay.
Marriage Allowance
The Marriage Allowance became available from 2015-16 for basic rate taxpayers. Thisallows the transfer of 10% (£1,150 in 2017-18) of the tax free Personal Allowance betweencouples who are married or in civil partnerships, were born after 6th April 1935 and onepartner has an annual income of £11,500 or less, plus up to £5,000 of tax-free savingsinterest and the other partner's annual income is between £11,501 and £45,000 in rUK and
£43,000 in Scotland. 9
“ The ability to provide an IT solution allowing personal pension providers to claimrelief at source continues to be a significant risk going forward. Similarly, a significantchallenge to HMRC successfully providing the correct taxpayer status is datamatching. HMRC’s estimates suggest that there is a 4% non-matching rate due toerrors in, or omission of, National Insurance numbers on pension provider returns. ”
Income Tax in Scotland: 2017 update, SB 17-84
27

Past and potential issues with income taxin Scotland
Taxpayer identification
There were 2.45 million individuals who were issued with a Scottish taxpayer notification
letter in 2015-16. 18 The National Audit Office subsequently reported that 420,000 Scottishtaxpayers had potentially been excluded from the initial identification, but received aScottish tax code early in 2016-17.
Tax avoidance/evasion
HMRC’s compliance strategy identifies the following ways taxpayers could avoid Scottish
income tax, or pay the incorrect amount: 22
• Failure to maintain address.
• Deliberate manipulation of address.
• Converting income to capital receipts, or incorporating a business.
HMRC's risk strategy currently identifies three taxpayer groups in terms of the tax evasion
risk they pose: 22
• Those with a net worth of £20 million.
• Those earning over £150,000 annually or with a net worth of £1 million.
• All other taxpayers.
Income Tax in Scotland: 2017 update, SB 17-84
28
Behavioural responses
Types of responses
Tax changes have two effects:
• The mechanical effect is the direct effect, all other things being equal. For instance, a5% tax rise leads to a 5% increase in tax revenue if taxpayers do not change theirbehaviour. This effect leads to the pre-behavioural tax yield.
• The behavioural effect is caused by behavioural responses i.e. changes in taxpayers’behaviour in order to minimise their tax burden.
Adding both the mechanical and behavioural effects provides the post-behavioural taxyield. The more people react to a tax change, the greater the difference will be betweenthe pre and post-behavioural tax yield.
Behavioural responses cause income tax receipts to be lower than expected (and alsotheoretically higher). This may have an impact on the Scottish budget not only throughrevenue outturn, but also through BGAs and the differential growth rate of income taxrevenue per head. For instance, if a Scottish tax proposal causes wealthy taxpayers tomove to England, this increases income tax revenue in England, which may in turnincrease the BGA at the very time Scottish income tax revenues are decreasing. This istheoretically more damaging to the Scottish budget than Scottish taxpayers shifting theirincome from earnings to dividends. This would mean they pay dividend tax to the UKGovernment instead of Scottish NSND income tax but has no impact on the BGA.
Behavioural responses include:
• Changes to the labour supply (numbers of hours worked or effort put into work).
• Early or deferred retirement.
• Choosing a career that has a higher/lower remuneration.
• Migration. The labour mobility of highly skilled workers has increased in the last 15 to20 years as the legal impediments and general migration costs have reduced. In a UKsurvey by the Skandia life assurance company in 2011, 31% of respondents cited high
taxation as the most frequently cited reason for considering leaving the UK. 23
• Changes to the nature of income including:
◦ Converting income to capital gains.
◦ Incorporating and converting earnings to dividends.
◦ Increasing contributions to private pensions.
◦ Increasing charitable contributions.
◦ Transferring income between spouses.
Income Tax in Scotland: 2017 update, SB 17-84
29
• Changes to the timing of income: Forestalling (when income is brought forward) ordelaying income
Measuring behavioural responses
Behavioural responses are measured using elasticity. This measures the change in the taxbase (what is being taxed) after a tax change due to behavioural responses.
For income tax, this indicator is called taxable income elasticity (TIE). It measures the
change in taxable income due to behavioural responses. 24 This became a popular way ofassessing behavioural responses in the mid-1990s. With TIE, it is not necessary to
separately measure all the underlying behaviours that influence taxable income. 25
TIE estimates the change in reported income in response to a 1% change in the net-of-taxrate. The net-of-tax-rate is the proportion of each additional pound earned received by theindividual after tax e.g. if the tax rate is 30%, the net-of-tax rate is 70%.
For example, a TIE of 0.4 implies that a 1% change in the net-of-tax rate will lead to a fallin total taxable income of 0.4%. TIE doesn’t just take into account a change in the marginalrate of income tax. It looks at the change in the average rate of tax for a taxpayer – thisincludes all the tax rates they are liable to (e.g. basic and higher for higher rate taxpayers)as well as their national insurance contributions.
High income taxpayers, the self-employed, secondary earners in households, as well astaxpayers in systems where itemized deductions are available (e.g. charitable donations)tend to have the highest TIEs although there is substantial variation in TIEs depending on
the study. 26 While many studies cite TIEs of 0.4 as a reliable estimate for high income
taxpayers 27 other studies point to the difficulties in applying the "correct" TIE in a givensituation.
It is very difficult to estimate behavioural responses.
Behavioural studies look at tax changes in the past including changes to the tax base andto tax revenue, with the aim of isolating the behavioural effect. This means stripping outother factors are also involved such as the state of the labour market, standards of living,etc.
Using these studies to predict future behavioural responses is problematic. Even twoidentical tax changes (for example, setting the 45p additional rate of income tax at 50p) willcause different behavioural responses in different tax jurisdictions or at different points intime. This is because two circumstances are never identical. There may have been:
• Other changes to the rest of the fiscal system. For instance, in 2008 Robert Chote,then director of the IFS, argued that the decision to withdraw personal allowance forpeople on high incomes was as important a change as the proposal to introduce anadditional rate of income tax at 45p (from a higher rate 40p) especially from theperspective of the incentives created by the tax structure for people to change their
behaviour. 28
Income Tax in Scotland: 2017 update, SB 17-84
30
• Changes in the economy and aggregate shocks that cause varying income trendswhich are hard to disentangle from tax-induced behavioural responses.
• Changes to regulations such as anti-avoidance measures (different opportunities fortaxpayers).
• Changes in composition of tax-paying population.
• Differences in cultural factors when comparing different countries.
For instance, when estimating TIEs, HMRC stated in relation to US studies: 23
Permanent changes in behaviour lead to a permanent loss of tax revenue for the tax thathas been changed but also for other taxes. For instance, if a taxpayer migrates, theyreduce some if not all of their spending in the country and this causes a decrease inconsumption taxes.
Temporary changes in behaviour cause a temporary decrease in tax revenue (but can alsocause revenue to be permanently lower). For instance, forestalling involves receivingincome before a tax increase comes into force, therefore increasing the previous year's taxrevenue (and decreasing overall potential tax revenues as the forestalled income is taxedat a lower rate).
Behavioural responses to a tax change can affect the tax yield of that tax, but also that ofother taxes. A sole trader may decide to incorporate to shift self-employment income fromearnings to dividends for instance.
The fiscal framework and behavioural responses
The Smith Commission set out the principle of “no detriment”:
• There should no detriment purely as a result of devolution.
• There should be no detriment to either the UK or the Scottish Government as a resultof the other government’s policy decisions post-devolution. Where either governmentmakes a policy decision that affects the tax receipts or expenditure of the other, thedecision-making government will either reimburse the other if there is an additionalcost, or receive a transfer from the other if there is a saving.
The fiscal framework states: 29
“ While all of these studies suggest a TIE of at least 0.5, they are based on the USincome tax system which is widely considered to have a narrower base than in the UKand greater opportunities for tax planning. This suggests a slightly lower estimate forthe UK with its broader income tax base and disclosure regime.”
“ Behavioural effects that impact tax revenues can be taken into account where, inexceptional circumstances, they are demonstrated to be material and bothgovernments agree that it is appropriate to do so.”
Income Tax in Scotland: 2017 update, SB 17-84
31
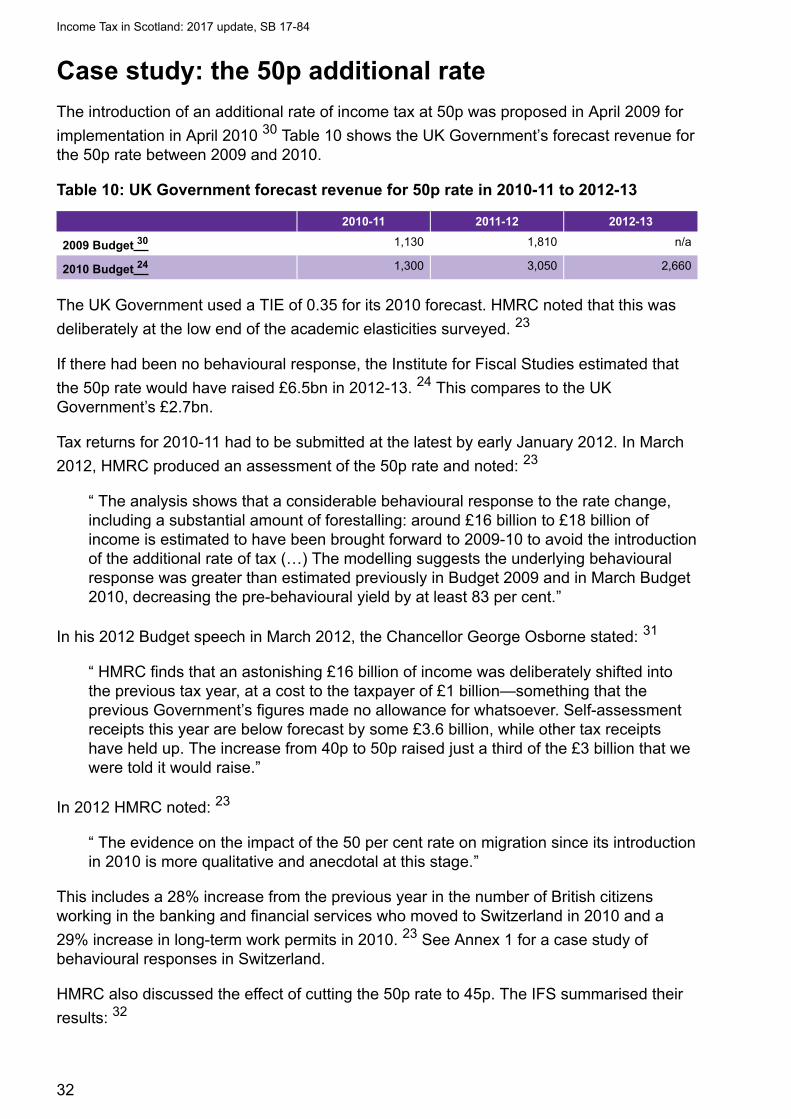
Case study: the 50p additional rate
The introduction of an additional rate of income tax at 50p was proposed in April 2009 for
implementation in April 2010 30 Table 10 shows the UK Government’s forecast revenue forthe 50p rate between 2009 and 2010.
Table 10: UK Government forecast revenue for 50p rate in 2010-11 to 2012-13
2010-11 2011-12 2012-13
2009 Budget 30 1,130 1,810 n/a
2010 Budget 24 1,300 3,050 2,660
The UK Government used a TIE of 0.35 for its 2010 forecast. HMRC noted that this was
deliberately at the low end of the academic elasticities surveyed. 23
If there had been no behavioural response, the Institute for Fiscal Studies estimated that
the 50p rate would have raised £6.5bn in 2012-13. 24 This compares to the UKGovernment’s £2.7bn.
Tax returns for 2010-11 had to be submitted at the latest by early January 2012. In March
2012, HMRC produced an assessment of the 50p rate and noted: 23
In his 2012 Budget speech in March 2012, the Chancellor George Osborne stated: 31
In 2012 HMRC noted: 23
This includes a 28% increase from the previous year in the number of British citizensworking in the banking and financial services who moved to Switzerland in 2010 and a
29% increase in long-term work permits in 2010. 23 See Annex 1 for a case study ofbehavioural responses in Switzerland.
HMRC also discussed the effect of cutting the 50p rate to 45p. The IFS summarised their
results: 32
“ The analysis shows that a considerable behavioural response to the rate change,including a substantial amount of forestalling: around £16 billion to £18 billion ofincome is estimated to have been brought forward to 2009-10 to avoid the introductionof the additional rate of tax (…) The modelling suggests the underlying behaviouralresponse was greater than estimated previously in Budget 2009 and in March Budget2010, decreasing the pre-behavioural yield by at least 83 per cent.”
“ HMRC finds that an astonishing £16 billion of income was deliberately shifted intothe previous tax year, at a cost to the taxpayer of £1 billion—something that theprevious Government’s figures made no allowance for whatsoever. Self-assessmentreceipts this year are below forecast by some £3.6 billion, while other tax receiptshave held up. The increase from 40p to 50p raised just a third of the £3 billion that wewere told it would raise.”
“ The evidence on the impact of the 50 per cent rate on migration since its introductionin 2010 is more qualitative and anecdotal at this stage.”
Income Tax in Scotland: 2017 update, SB 17-84
32
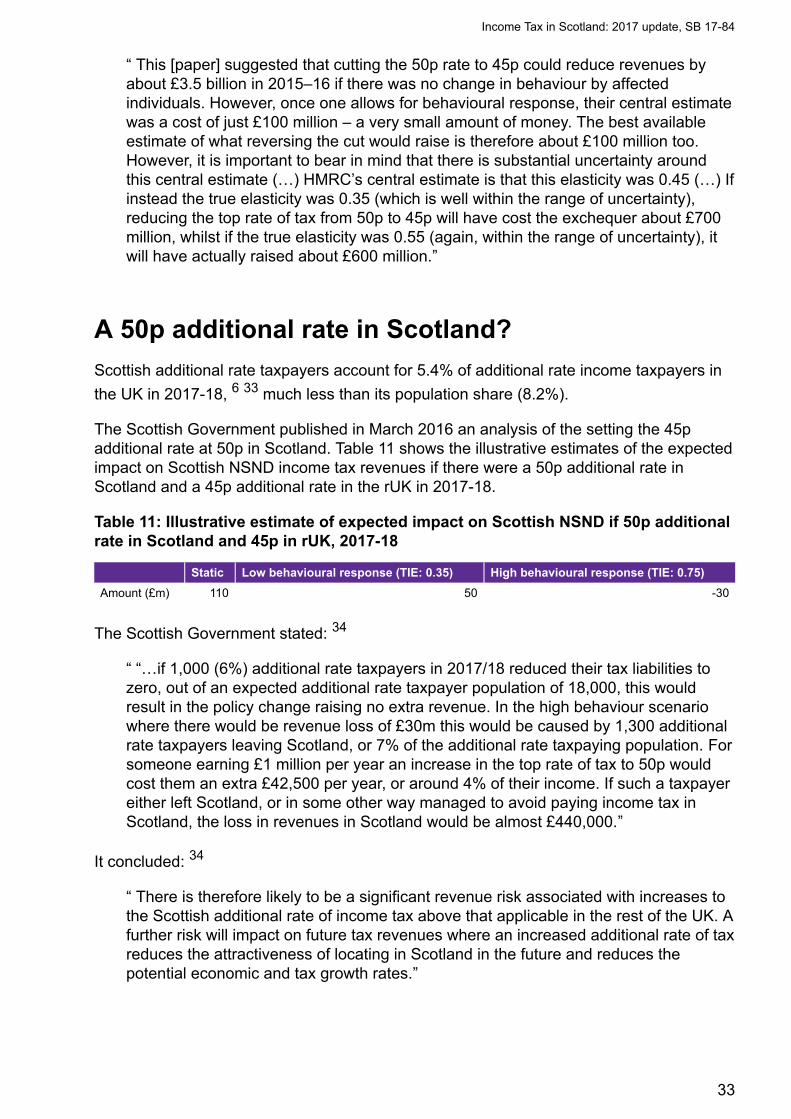
A 50p additional rate in Scotland?
Scottish additional rate taxpayers account for 5.4% of additional rate income taxpayers in
the UK in 2017-18, 6 33 much less than its population share (8.2%).
The Scottish Government published in March 2016 an analysis of the setting the 45padditional rate at 50p in Scotland. Table 11 shows the illustrative estimates of the expectedimpact on Scottish NSND income tax revenues if there were a 50p additional rate inScotland and a 45p additional rate in the rUK in 2017-18.
Table 11: Illustrative estimate of expected impact on Scottish NSND if 50p additionalrate in Scotland and 45p in rUK, 2017-18
Static Low behavioural response (TIE: 0.35) High behavioural response (TIE: 0.75)
Amount (£m) 110 50 -30
The Scottish Government stated: 34
It concluded: 34
“ This [paper] suggested that cutting the 50p rate to 45p could reduce revenues byabout £3.5 billion in 2015–16 if there was no change in behaviour by affectedindividuals. However, once one allows for behavioural response, their central estimatewas a cost of just £100 million – a very small amount of money. The best availableestimate of what reversing the cut would raise is therefore about £100 million too.However, it is important to bear in mind that there is substantial uncertainty aroundthis central estimate (…) HMRC’s central estimate is that this elasticity was 0.45 (…) Ifinstead the true elasticity was 0.35 (which is well within the range of uncertainty),reducing the top rate of tax from 50p to 45p will have cost the exchequer about £700million, whilst if the true elasticity was 0.55 (again, within the range of uncertainty), itwill have actually raised about £600 million.”
“ “…if 1,000 (6%) additional rate taxpayers in 2017/18 reduced their tax liabilities tozero, out of an expected additional rate taxpayer population of 18,000, this wouldresult in the policy change raising no extra revenue. In the high behaviour scenariowhere there would be revenue loss of £30m this would be caused by 1,300 additionalrate taxpayers leaving Scotland, or 7% of the additional rate taxpaying population. Forsomeone earning £1 million per year an increase in the top rate of tax to 50p wouldcost them an extra £42,500 per year, or around 4% of their income. If such a taxpayereither left Scotland, or in some other way managed to avoid paying income tax inScotland, the loss in revenues in Scotland would be almost £440,000.”
“ There is therefore likely to be a significant revenue risk associated with increases tothe Scottish additional rate of income tax above that applicable in the rest of the UK. Afurther risk will impact on future tax revenues where an increased additional rate of taxreduces the attractiveness of locating in Scotland in the future and reduces thepotential economic and tax growth rates.”
Income Tax in Scotland: 2017 update, SB 17-84
33
Block grant adjustmentHMRC pay Scottish income tax revenues into the UK Consolidated Fund. These revenuesare then transferred to the Scottish Government and the Scottish block grant is reducedaccordingly. The details of this arrangement are set out in the The agreement between theScottish government and the United Kingdom government on the Scottish government’s
fiscal framework 29 ('the fiscal framework'). This applies from 2017-18 onwards.
Adjustment to the block grant in 2016-17
Prior to the fiscal framework agreement, the BGA in respect of SRIT for 2016- 17 was set
equal to the OBR's forecast SRIT revenue (£4,900m). 4 This amount flowed from HMTreasury into the Scottish Government's Consolidated Fund.
2016-17 is a transitional year of implementation of SRIT. Because no change in rates wasmade in 2016-17 (SRIT as set at 10p), the net effect of this block grant adjustment (BGA)was zero - the OBR’s forecast for SRIT revenues were notionally taken off the block grantand automatically added on to the Scottish budget.
The revenue added to the Scottish budget was therefore equal to the reduction in theblock grant and the net effect on the Scottish budget was 0. There will be no reconciliationto this adjustment once outturn data becomes available because of the agreement that theUK Government bears forecasting risks in the initial transitional period. The ScottishGovernment's spending power in 2016-17 was therefore unaffected by forecast or actual
receipts from SRIT. 35
The OBR estimated in November 2017 that SRIT revenues were £4,597 million (£303million lower than the BGA), down from its March 2017 estimate that 2016-17 revenue
would be £4,597 million. 36
The fiscal framework and block grant adjustment
The block grant continues to be determined by the Barnett Formula. There will be anannual 'block grant adjustment' (BGA) for each devolved (and assigned tax) includingincome tax. For income tax, this will be calculated using:
• An 'initial baseline deduction', equal to NSND income tax revenue the year prior todevolution (2016-17). Note the baseline adjustment is the revenue for the tax the yearbefore its devolution. With income tax, this corresponds to NSND income tax actuallyraised in 2016-17 from Scottish taxpayers. This is because the Scottish Governmentset SRIT at 10p, leaving income tax the same in Scotland and rUK.
• An 'indexation mechanism': this incorporates population growth in Scotland and rUK,as well as the growth in ‘comparable revenues’ in rUK. The OBR publishes rUK NSNDincome tax revenues in Devolved Taxes Forecast.
Each year, both Scottish income tax receipts and the BGA will initially be based on aforecast and then reconciled to actual receipts collected which will become known around
Income Tax in Scotland: 2017 update, SB 17-84
34
15 months after the end of the financial year in question. The actual reconciliation will takeplace at Autumn Budget and impact the following tax year (ordinarily) and will not be an inyear adjustment in the Summer immediately when outturn data becomes available.
Over the period to 2020-21, the indexation mechanism for the devolved taxes will bebased on the ‘Comparable Method’ (CM), but then reconciled to the 'Indexed Per Capita'(IPC) method. The main difference between the two methods is the way they account forrelative population growth between Scotland and rUK.
The IPC method indexes the BGA to the growth in tax revenues per capita in rUK and therate of population growth in Scotland. For example, if rUK revenues per capita grow by 5%and the Scottish population grows by 1%, the BGA grows by approximately 6%. The
precise rate of growth of the BGA is 6.05%, calculated as (1.01)*(1.05)*100 – 100. 37
In-year estimates of income tax receipts are imprecise due to:
• HMRC's end-of-year reconciliation in the pay-as-you-earn (PAYE) process to seewhether people have paid too much/too little
• The timing of self-assessment returns which, in some cases, are provided to HMRCuntil 10 months after the end of the tax year to which they relate
The fiscal framework states that the Scottish Government will have access to Scottishincome tax receipts as they are received by HMRC.
Role of the Scottish Government/Scottish FiscalCommission and OBR in forecasting Scottishincome tax
Income Tax forecast by the Scottish Government for 2017-18, and the Scottish FiscalCommission (SFC) from 2018-19 onwards, is the amount available to the ScottishGovernment to draw down from Treasury throughout that year.
In February 2017 the Scottish Government forecast Scottish NSND income tax revenuesfor 2017-18 at £11,857 million and this is what was available to the Scottish Government.Until reconciliation to outturn data occurs (outturn data will be available about 15 monthsafter the end of the financial year and actual reconciliation will take place at the AutumnBudget), the net impact on the Scottish budget after the BGA relating to income tax istherefore £107m in additional revenue for 2017-18.
The OBR also forecasts NSND income tax in the UK and Scotland in Scottish tax
forecasts 15 published alongside Economic and Fiscal Outlooks. 16 The rUK figures feedinto the annual indexation of the BGA in relation to income tax. In November 2017, theOBR estimated Scottish 2017-18 NSND revenue would be £11,932 million.
The Scottish Government and the OBR have a slightly different methodology to forecastNSND income tax. The OBR's methodology was set out in 2012 in Forecasting Scottish
taxes. 38
Income Tax in Scotland: 2017 update, SB 17-84
35
Differences between the Scottish Government and the OBR's forecasts are due todifferences in the timing of the forecast, and methodological differences. The OBR has a"top-down" approach and derives the Scottish tax forecast by applying the Scottish share
(based on historical shares) to their projection of the UK tax base. 38 This is because themacroeconomic data that the OBR would need to produce a Scottish macroeconomicforecast and economic determinants is generally not available at a Scottish level or is only
available with a long lag. 38
The Scottish Government's methodology for 2017-18 was set out in Devolved Taxes
Forecast Methodology 39 . The income tax model is "bottom up" in that the Governmentprojected the Scottish tax base forward using assumptions about future growth in NSNDincome and the number of Scottish taxpayers.
For 2018-19 onwards, as stated above, the SFC will produce forecasts for Scottishonshore GDP, Income Tax, devolved taxes, non-domestic rates, devolved demand-ledsocial security payments for 2018-19 onwards. It is required to produce at least two, five-year forecasts a year.
The SFC set out their Current Approach to Forecasting September 2017 40 . Themethodology is similar to the Scottish Government's and uses the samemacroeconometric forecasting model, “SGGEM” which was built by the ScottishGovernment and the National Institute of Economic and Social Research (NIESR). It isowned by the Scottish Government and is used by the SFC who put their own
assumptions in it. 40 The Protocol for engagement between the Scottish Fiscal
Commission and the Scottish Government 41 sets out the timescales according to whichthe Scottish Government must communicate with the Scottish Fiscal Commission aroundthe budget. The SFC will provide the Scottish Government with copies of their forecastingmodels before publication of the budget to allow for further policy development in advanceof the budget. The Scottish Government then shares near-final policy measures forinclusion in forecasts (the protocol says 18 days before the budget) and 10-15 before thebudget the SFC produces forecasts incorporating Scottish Government policy. The SFCdoes not incorporate any policy measures notified to it less than 10 days before thebudget.The SFC report is laid in Parliament and published on the SFC’s website after the
Cabinet Secretary has presented the Budget document to Parliament. 41
Block grant adjustment for 2017-18
The initial baseline adjustment is the OBR's estimate of Scottish NSND income tax in
2016-17 (produced in November 2016) - £11,525 million. 42 This will be reconciled against
outturn data once this is available 4 . In its latest forecast (November 2017), the OBRestimated 2016-17 revenues to be £11,520 million.
In Draft Budget 2017-18, the Scottish Government proposed to leave income tax rates thesame as rUK, but to set the higher rate threshold at £43,430 (compared to £45,000 in rUK)
for 2017-18. It estimated NSND income tax revenues would be £11,829 million. 4 TheScottish Parliament agreed on 21 February 2017 to freeze the higher rate threshold incash terms at £43,000 for 2017-18 and estimated this would raise £11,857m (£28 millionmore). This is the amount available to the Scottish Government to draw down from HM
Income Tax in Scotland: 2017 update, SB 17-84
36

Treasury throughout 2017-18. The reconciliation process against the final outturn figure
will be in 2019, to determine the adjustment to the block grant for 2020-21. 35
Table 12 shows the BGA for 2017-18.
Table 12: 2017-18 NSND income tax revenue estimates
2017-18 Revenue Difference with BGA (IPC)
BGA (IPC method) (Dec. 2016) 11,750
BGA (CM) (Dec. 2016) 11,790
Scottish Government forecast (HRT at £43,430) (Dec. 2016) 11,829 79
Scottish Government forecast (HRT at £43,000) (Feb. 2017) 11,857 107
OBR (HRT at £43,000) (Nov. 2017) 11,932 182
Income Tax in Scotland: 2017 update, SB 17-84
37
How much revenue could alternativeproposals raise?
The baseline
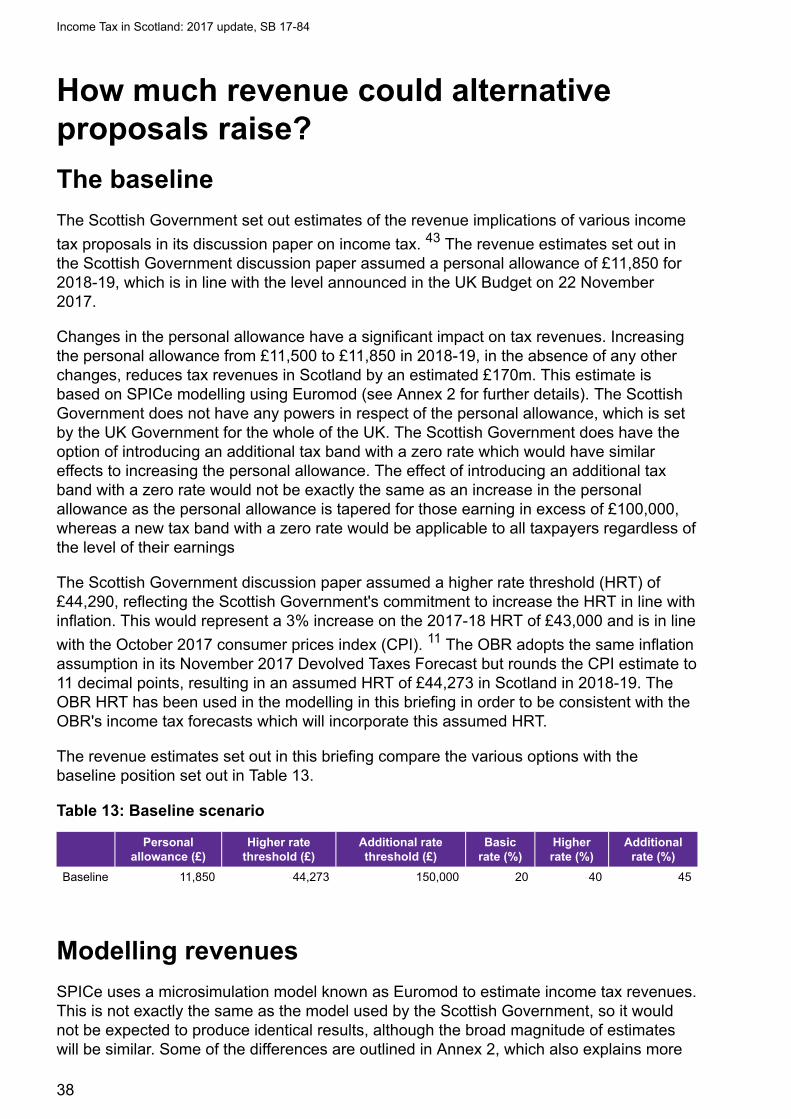
The Scottish Government set out estimates of the revenue implications of various income
tax proposals in its discussion paper on income tax. 43 The revenue estimates set out inthe Scottish Government discussion paper assumed a personal allowance of £11,850 for2018-19, which is in line with the level announced in the UK Budget on 22 November2017.
Changes in the personal allowance have a significant impact on tax revenues. Increasingthe personal allowance from £11,500 to £11,850 in 2018-19, in the absence of any otherchanges, reduces tax revenues in Scotland by an estimated £170m. This estimate isbased on SPICe modelling using Euromod (see Annex 2 for further details). The ScottishGovernment does not have any powers in respect of the personal allowance, which is setby the UK Government for the whole of the UK. The Scottish Government does have theoption of introducing an additional tax band with a zero rate which would have similareffects to increasing the personal allowance. The effect of introducing an additional taxband with a zero rate would not be exactly the same as an increase in the personalallowance as the personal allowance is tapered for those earning in excess of £100,000,whereas a new tax band with a zero rate would be applicable to all taxpayers regardless ofthe level of their earnings
The Scottish Government discussion paper assumed a higher rate threshold (HRT) of£44,290, reflecting the Scottish Government's commitment to increase the HRT in line withinflation. This would represent a 3% increase on the 2017-18 HRT of £43,000 and is in line
with the October 2017 consumer prices index (CPI). 11 The OBR adopts the same inflationassumption in its November 2017 Devolved Taxes Forecast but rounds the CPI estimate to11 decimal points, resulting in an assumed HRT of £44,273 in Scotland in 2018-19. TheOBR HRT has been used in the modelling in this briefing in order to be consistent with theOBR's income tax forecasts which will incorporate this assumed HRT.
The revenue estimates set out in this briefing compare the various options with thebaseline position set out in Table 13.
Table 13: Baseline scenario
Personalallowance (£)
Higher ratethreshold (£)
Additional ratethreshold (£)
Basicrate (%)
Higherrate (%)
Additionalrate (%)
Baseline 11,850 44,273 150,000 20 40 45
Modelling revenues
SPICe uses a microsimulation model known as Euromod to estimate income tax revenues.This is not exactly the same as the model used by the Scottish Government, so it wouldnot be expected to produce identical results, although the broad magnitude of estimateswill be similar. Some of the differences are outlined in Annex 2, which also explains more
Income Tax in Scotland: 2017 update, SB 17-84
38
about the approach to modelling. An important point to note is that the SPICe estimatespresented in this briefing do not take account of behavioural effects. That is, they are notadjusted for any changes in behaviour that might result from a change in income taxpolicy.
Income tax revenue estimates
The estimated revenues from a range of possible policy measures are set out in Table 14.In all cases, values relate to non-savings, non dividend (NSND) income tax revenues inScotland. All calculations are relative to the baseline scenario outlined in Table 14.
Table 14: Estimated impact on income tax revenues in Scotland, 2018-19
Policy measure Estimated impact on income tax revenues, £m
Increase basic rate by 1p 380
Increase higher rate by 1p 100
Increase additional rate by 1p 10
Increase all rates by 1p 490
Introduce new zero rate band of £1,000 above personal allowance -470
Decrease HRT by £1,000 80
11 bands (see Annex 4 for rates and thresholds) -250
See Annex 3 for the impact on household income tax for selected scenarios by incomedecile.
Note the margin of error in Euromod for the additional rate is very high and figures shouldbe interpreted with caution, particularly at the additional rate level. The ScottishGovernment forecast that raising the additional rate in 2018-19 by 1p would lead to a £30
million increase in revenues for instance. 43 This is using the SPI while Euromod uses theFamily Resource Survey which has a very small sample of additional rate taxpayers.
Behavioural responses to tax changes
The estimates presented in Table 14 do not take account of behavioural responses tochanges in tax policy. As discussed earlier in this briefing, in response to a change in taxrates or bands, individuals might change the number of hours they work, relocate to adifferent tax jurisdiction or (if they are able) alter the way in which they receive income (forexample, from earnings to dividends). These types of behavioural responses are generallyunderstood to be potentially greater for high earners, who have a higher incentive and/orare more able to adjust their behaviour in response to changes in tax policy. However, asthe Scottish Government notes in its discussion paper on income tax, "the extent of any
behavioural response is uncertain". 43
While noting the uncertainties surrounding estimates of behavioural responses, theScottish Government presents some estimates of behavioural responses in its discussionpaper. Their estimates reflect the fact that behavioural responses are anticipated to begreater for higher earners. The Scottish Government note that for those earning more than
Income Tax in Scotland: 2017 update, SB 17-84
39
£250,000, it uses a TIE range of 0.35-0.75, while for those earning up to £150,000 it usesthe same TIE, but does not give details of the values it has used.
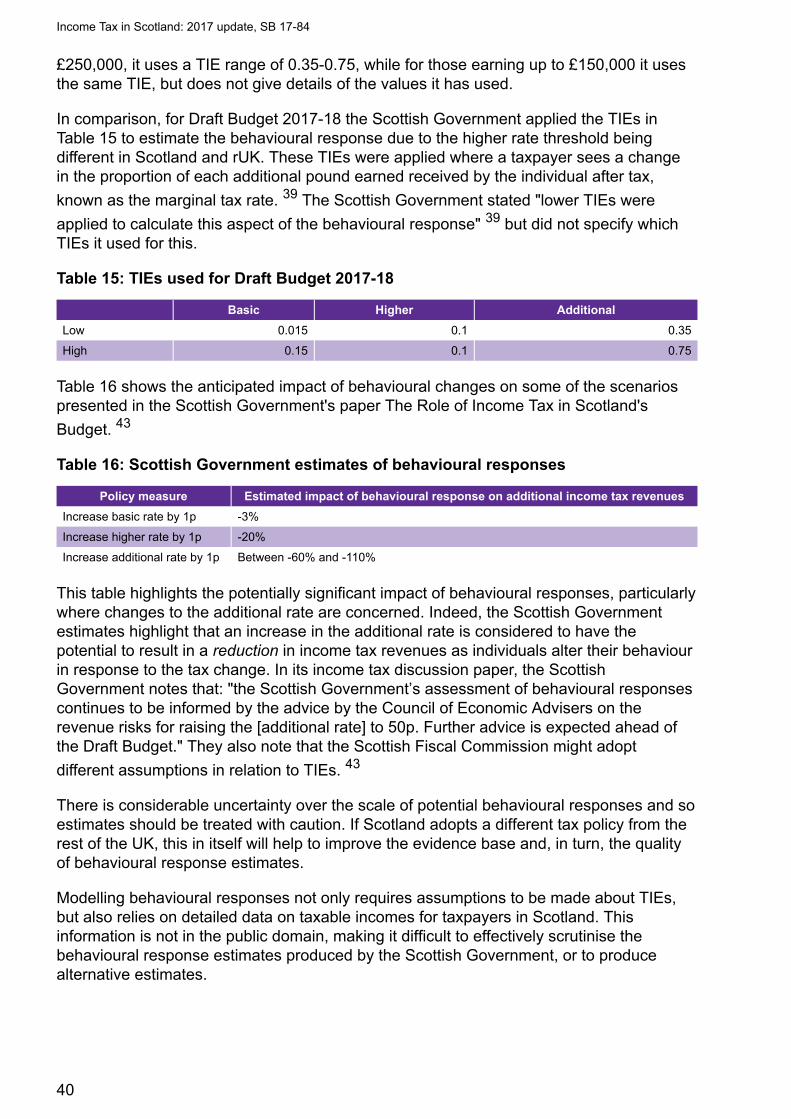
In comparison, for Draft Budget 2017-18 the Scottish Government applied the TIEs inTable 15 to estimate the behavioural response due to the higher rate threshold beingdifferent in Scotland and rUK. These TIEs were applied where a taxpayer sees a changein the proportion of each additional pound earned received by the individual after tax,
known as the marginal tax rate. 39 The Scottish Government stated "lower TIEs were
applied to calculate this aspect of the behavioural response" 39 but did not specify whichTIEs it used for this.
Table 15: TIEs used for Draft Budget 2017-18
Basic Higher Additional
Low 0.015 0.1 0.35
High 0.15 0.1 0.75
Table 16 shows the anticipated impact of behavioural changes on some of the scenariospresented in the Scottish Government's paper The Role of Income Tax in Scotland's
Budget. 43
Table 16: Scottish Government estimates of behavioural responses
Policy measure Estimated impact of behavioural response on additional income tax revenues
Increase basic rate by 1p -3%
Increase higher rate by 1p -20%
Increase additional rate by 1p Between -60% and -110%
This table highlights the potentially significant impact of behavioural responses, particularlywhere changes to the additional rate are concerned. Indeed, the Scottish Governmentestimates highlight that an increase in the additional rate is considered to have thepotential to result in a reduction in income tax revenues as individuals alter their behaviourin response to the tax change. In its income tax discussion paper, the ScottishGovernment notes that: "the Scottish Government’s assessment of behavioural responsescontinues to be informed by the advice by the Council of Economic Advisers on therevenue risks for raising the [additional rate] to 50p. Further advice is expected ahead ofthe Draft Budget." They also note that the Scottish Fiscal Commission might adopt
different assumptions in relation to TIEs. 43
There is considerable uncertainty over the scale of potential behavioural responses and soestimates should be treated with caution. If Scotland adopts a different tax policy from therest of the UK, this in itself will help to improve the evidence base and, in turn, the qualityof behavioural response estimates.
Modelling behavioural responses not only requires assumptions to be made about TIEs,but also relies on detailed data on taxable incomes for taxpayers in Scotland. Thisinformation is not in the public domain, making it difficult to effectively scrutinise thebehavioural response estimates produced by the Scottish Government, or to producealternative estimates.
Income Tax in Scotland: 2017 update, SB 17-84
40
Further sources of informationHMRC income tables:
• Table 2.1 33 Total UK (no regional breakdown) of number of individual incometaxpayers from 1990-91 to 2017-18, including breakdown by marginal rate, male/female, non-pensioners/pensioners. Last updated 31 May 2017.
• Table 2.2 6 Regional breakdown (no UK total) of number of individual incometaxpayers from 1990-91 to 2017-18, including breakdown by marginal rate, total/male/female, non-pensioners/pensioners. Last updated 31 May 2017.
• Table 3.11 12 Regional breakdown (including UK total) of different types of income(self-employment; employment; pension; property, interest, dividend and other; total)and total income tax, total/male/female, 2014-15, for different income brackets (UKtotal provides further breakdowns for incomes above £200,000, up to £1,000,000+;while Scotland provides only £200,000 + at that level)
• Table 3.14 13 Regional and unitary authority breakdown (no UK total) of the totalnumber of individuals, mean and median incomes of different types of income (self-employment; employment; pension; property, interest, dividend and other; total), andnumber of individuals, mean and median total income tax paid
HMRC do not publish total income tax paid by taxpayers broken down by marginal rate forScotland - only for different income brackets.
HMRC analysis:
• Personal incomes statistics: 2014 to 2015: introduction, commentary and tables 3.1 to
3.11 (revised). 9 . Revised 19 April 2017. Only Table 3.11 has figures for Scotland (seeabove).
Income Tax in Scotland: 2017 update, SB 17-84
41
Annex 1: Taxable and non-taxablebenefitsThe following benefits are taxable: 44
• State Pension
• Jobseeker’s Allowance
• Carer’s Allowance
• Employment and Support Allowance (contribution based)
• Incapacity Benefit (from the 29th week the recipient gets it)
• Bereavement Allowance
• pensions paid by the Industrial Death Benefit scheme
• Widowed Parent’s Allowance
• Widow’s pension
The most common non-taxable state benefits are: 44
• Housing Benefit
• Employment and Support Allowance (income related)
• Income Support - though you may have to pay tax on Income Support if the recipientis involved in a strike
• Working Tax Credit
• Child Tax Credit
• Disability Living Allowance
• Child Benefit (depending on the recipient's income, they may be charged income tax)
• Personal Independence Payment (PIP)
• Guardian’s Allowance
• Attendance Allowance
• Pension Credit
• Winter Fuel Payments and Christmas Bonus
• free TV licence for over-75s
• lump-sum bereavement payments
Income Tax in Scotland: 2017 update, SB 17-84
42

• Maternity Allowance
• Industrial Injuries Benefit
• Severe Disablement Allowance
• Universal Credit
• War Widow’s Pension
Income Tax in Scotland: 2017 update, SB 17-84
43
Annex 2: Case study of behaviouralresponses: Switzerland
Case study: Switzerland
Switzerland differs from the UK namely in its much higher levels of public consultationon a cantonal level and higher public expectations of government services andinfrastructure. This may cause Swiss taxpayers to place more importance on wheretheir tax goes than in the UK and could lead to different behavioural responses tochanges in income tax.
Switzerland has the highest rate of annual wealth taxation in the developed world.Swiss cantons are largely autonomous regarding the base and rates of income tax. It.While the wealth tax base is defined at the federal level, tax rates vary considerablyacross locations and over time. Large disparities exist on a small geographical scalebetween other income tax rates also (e/g/ on earnings) despite recent attempts atharmonisation, particularly for high income earners. For example, marginal rates at anannual income of 500,000 Swiss Francs ranged from about 21%to more than 46% in
cantons less than 200km apart in 2004. 45 There is some evidence that those withhigh incomes choose their place of residence depending on their income tax liability.46 Another study found similar results although it did not control for the fact that rich
households may prefer to live near other rich households. 47
A third study found no relation between migration and tax burden. 45 This is supportedanecdotally by a survey cited in the study which asked why people had migrated - norespondent cited tax as the prime motivation. However, there was no major overhaulin the tax system during the study period.
Recently, Brulhart et al. (2016) found that 2013 changes to wealth tax caused strongbehavioural responses in the short-run and less so in the medium-term. This led theauthors to state that current rates are well below the revenue maximizing rate. Theyfound that taxpayers bunch below the tax threshold and that this is due to changes in
reported wealth, not by mobility. 48
Income Tax in Scotland: 2017 update, SB 17-84
44

Annex 3: SPICe approach to modellingincome tax revenuesThe SPICe estimates of non-savings, non-dividend (NSND) income tax revenues arebased on analysis using Euromod, a tax-benefit microsimulation model which ismaintained, developed and managed by the Institute for Social and Economic Research(ISER) at the University of Essex. This model allows users to model the impact of changesin taxes or benefits on individuals and households in Scotland. All the analysis is static innature i.e. it does not take into account any behavioural responses that might occurfollowing a change in taxes or benefits.
Euromod uses a slightly modified version of the Family Resource Survey (FRS) from2014-15. This is an annual UK-wide household survey carried out by the ONS that collectsinformation on the income and circumstances of private households in Great Britain. Themodel updates monetary variables in line with OBR forecasts to March 2017. However itdoes not make any other adjustments. Thus the distribution of characteristics (such asemployment status and demographic variables) as well as the distribution of each incomesource that is not simulated by Euromod remains as they were in 2014-15. See this link forfurther details:
https://www.euromod.ac.uk/sites/default/files/country-reports/year7/Y7_CR_UK_Final.pdf
The tax and benefit rules in Euromod are for 2017-18. However, for the 2018-19 scenariosmodelled in this briefing, we have adjusted the personal allowance and higher ratethreshold to reflect anticipated policy parameters for 2018-19.
Euromod simulations have been used to estimate the percentage change in tax receiptsthat would occur under each modelled scenario. These estimates have then been appliedto OBR tax revenue forecasts to provide estimates of the monetary impact of theproposals. This is in order to adjust for the fact that Euromod is known to underestimatetotal taxable income, especially for higher earners. The OBR estimates that Scottish non-savings non-dividend (NSND) income tax receipts in 2018-19 will be £12,153m, assuming
inflationary uprating of the HRT and no changes to the Additional Rate threshold. 36
The estimates produced by Euromod will differ from those produced by othermicrosimulation models e.g. those used by the Scottish Government, the OBR, the IFSand the Fraser of Allander Institute. Although all the models will be built on similarprinciples, the underpinning data and uprating assumptions will differ. For example, somemodels use the Survey of Personal Incomes (SPI) rather than the Family ResourcesSurvey (FRS) as the source of income data. There may also be differences in assumptionsmade, for example, about wage growth and labour market growth.
Income Tax in Scotland: 2017 update, SB 17-84
45
Annex 4: Impact of selected scenarios onaverage household income tax by incomedecileThe following figures show the impact per year in pounds on the average householdincome tax by income decile (using equivalised household disposable income) on 4selected scenarios described in Table 14 copied in below (Table 17) for convenience.
Table 17: Estimated impact on income tax revenues in Scotland, 2018-19
Policy measure Estimated impact on income tax revenues, £m
Increase basic rate by 1p 380
Increase higher rate by 1p 100
Increase additional rate by 1p 10
Increase all rates by 1p 490
Introduce new zero rate band of £1,000 above personal allowance -470
Decrease HRT by £1,000 80
11 bands -250
The 11 band scenario is shown below:
Table 18: 11-band scenario
Rate (%) Threshold
15 12,000
18 20,000
20 30,000
23 40,000
25 50,000
30 60,000
35 70,000
40 80,000
45 90,000
48 150,000
50 n/a
Income Tax in Scotland: 2017 update, SB 17-84
46
Figure 14: Average change in tax by household and income decile, increase basicrate by 1p
Figure 15: Average change in tax by household and income decile, increase all ratesby 1p
Income Tax in Scotland: 2017 update, SB 17-84
47
Figure 16: Average change in tax by household and income decile, introducing anew zero rate band of £1,000 above personal allowance
Income Tax in Scotland: 2017 update, SB 17-84
48
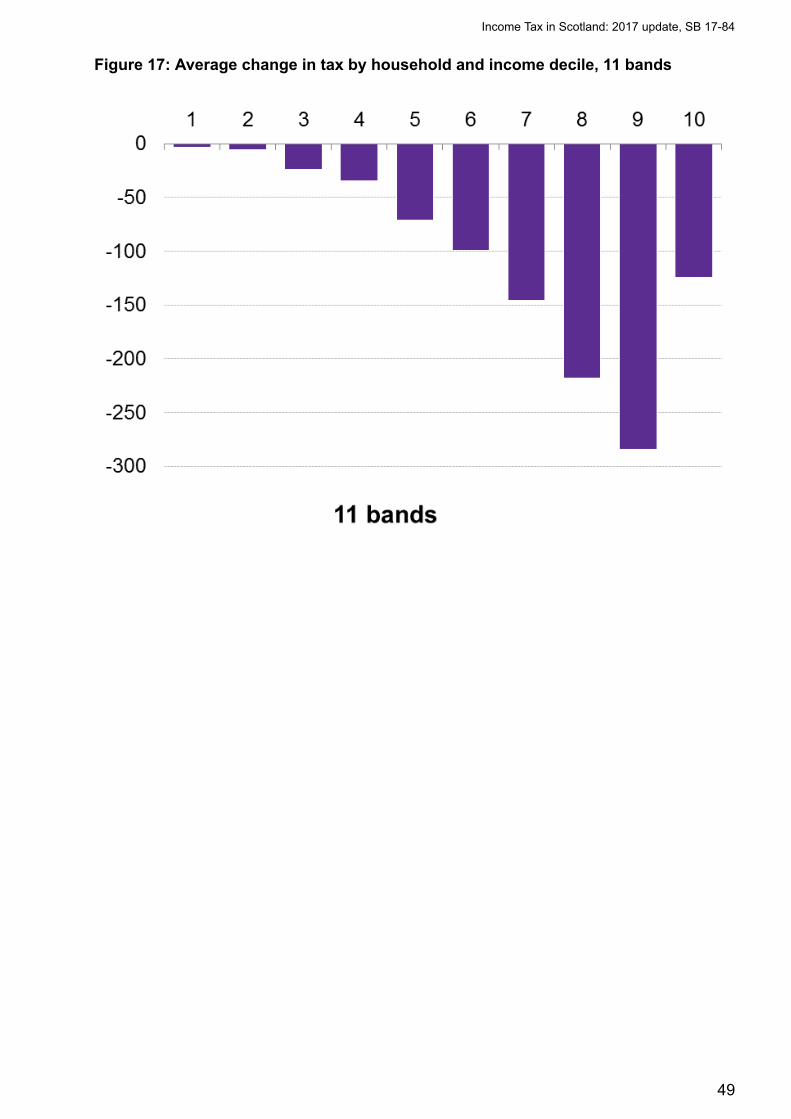
Figure 17: Average change in tax by household and income decile, 11 bands
Income Tax in Scotland: 2017 update, SB 17-84
49

BibliographyUK Government. (2016). Scottish Taxpayer Technical Guidance. Retrieved fromhttps://www.gov.uk/hmrc-internal-manuals/scottish-taxpayer-technical-guidance [accessed22 November 2017]
1
UK Government. HM Revenue & Customs. (2017). Annual Report and Accounts 2016-17.Retrieved from https://www.gov.uk/government/uploads/system/uploads/attachment_data/file/628377/HMRC_Annual_Report_and_Accounts_2016-17__print_.pdf [accessed 22November 2017]
2
Office for National Statistics. (2017). CPI: Consumer Prices Index (% change). Retrievedfrom https://www.ons.gov.uk/economy/inflationandpriceindices/timeseries/d7g7/mm23[accessed 5 December 2017]
3
Scottish Government. (2016). Scotland's Draft Budget 2017-18. Retrieved fromhttp://www.gov.scot/Resource/0051/00511808.pdf
4
Scottish Government. (2017). Protection for tax payers. Retrieved fromhttps://news.gov.scot/news/protection-for-tax-payers [accessed 26 November 2017]
5
HM Revenue and Customs. (2017). Table 2.2 Number of income taxpayers, by country.Retrieved from https://www.gov.uk/government/statistics/number-of-individual-income-taxpayers-by-marginal-rate-gender-and-age-by-country [accessed 26 November 2017]
6
UK Government. (2017). Autumn Budget 2017. Retrieved from https://www.gov.uk/government/publications/autumn-budget-2017-documents [accessed 27 November 2017]
7
HM Revenue and Customs. (2016). Savings and Investment Manual. Retrieved fromhttps://www.gov.uk/hmrc-internal-manuals/savings-and-investment-manual/saim1090[accessed 26 November 2017]
8
HM Revenue and Customs. (2017). UK Income Tax Liabilities Statistics 2014-15 Survey ofPersonal Incomes, with projections to 2017-18 Includes Tables 2.1 to 2.7. Retrieved fromhttps://www.gov.uk/government/uploads/system/uploads/attachment_data/file/616452/Income_Tax_Liabilities_Statistics_May_2017.pdf [accessed 28 November 2017]
9
Office for National Statistics. (2017). Population Estimates for UK, England and Wales,Scotland and Northern Ireland: mid-2016. Retrieved from https://www.ons.gov.uk/peoplepopulationandcommunity/populationandmigration/populationestimates/bulletins/annualmidyearpopulationestimates/mid2016 [accessed 28 November 2017]
10
Office for National Statistics. (2017, November 14). UK consumer price inflation: October2017. Retrieved from https://www.ons.gov.uk/economy/inflationandpriceindices/bulletins/consumerpriceinflation/october2017
11
HM Revenue and Customs. (2017). Income and tax, by gender, region and country.Retrieved from https://www.gov.uk/government/statistics/income-and-tax-by-gender-region-and-country-2010-to-2011 [accessed 29 November 2017]
12
HM Revenue and Customs. (2017). Income and tax by borough and district or unitaryauthority. Retrieved from https://www.gov.uk/government/statistics/income-and-tax-by-borough-and-district-or-unitary-authority-2010-to-2011 [accessed 29 November 2017]
13
Income Tax in Scotland: 2017 update, SB 17-84
50
Office for Budget Responsibility. (2017). Economic and fiscal outlook. Retrieved fromhttp://cdn.budgetresponsibility.org.uk/Nov2017EFOwebversion-2.pdf [accessed 22November 2017]
14
Office for Budget Reponsibility. (2017). Scottish tax forecasts. Retrieved fromhttp://budgetresponsibility.org.uk/topics/scotland-wales-and-northern-ireland/scottish-tax-forecasts/ [accessed 5 December 2017]
15
Office for Budget Responsibility. (2017). Economic and fiscal outlook – November 2017.Retrieved from http://budgetresponsibility.org.uk/efo/economic-fiscal-outlook-november-2017/ [accessed 5 December 2017]
16
National Audit Office. (2015). The administration of the Scottish Rate of Income Tax2014-15. Retrieved from https://www.nao.org.uk/wp-content/uploads/2015/11/The-administration-of-the-Scottish-Rate-of-Income-Tax-2014-15.pdf [accessed 22 November2017]
17
National Audit Office. (2016). The administration of the Scottish Rate of Income Tax2015-16. Retrieved from https://www.nao.org.uk/wp-content/uploads/2016/12/The-administration-of-the-Scottish-Rate-of-Income-Tax-2015-16.pdf [accessed 22 November2017]
18
National Audit Office. (2017). The administration of the Scottish Rate of Income Tax2016-17. Retrieved from https://www.nao.org.uk/report/scottish-rate-of-income-tax-2016-17/[accessed 5 December 2017]
19
Scottish Government. (2017). Personal correspondence.20
UK Government. (2017). Capital Gains Tax. Retrieved from https://www.gov.uk/capital-gains-tax/allowances
21
HM Revenue and Customs. (2017). Annual Report and Accounts 2016-17. Retrieved fromhttps://www.gov.uk/government/uploads/system/uploads/attachment_data/file/635587/HMRC_Annual_Report_and_Accounts_2016-17_web_.pdf [accessed 26 November 2017]
22
HM Revenue and Customs. (2012). The Exchequer effect of the 50 per cent additional rateof income tax. Retrieved from http://webarchive.nationalarchives.gov.uk/20130127161217/http://www.hmrc.gov.uk/budget2012/excheq-income-tax-2042.pdf [accessed 26 November2017]
23
Institute for Fiscal Studies. (2012). The IFS Green Budget February 2012. Retrieved fromhttps://www.ifs.org.uk/budgets/gb2012/gb2012.pdf [accessed 26 November 2017]
24
Giertz, S. (2010). The Elasticity of Taxable Income during the 1990s: New Estimates andSensitivity Analyses. Retrieved from http://digitalcommons.unl.edu/cgi/viewcontent.cgi?article=1069&context=econfacpub [accessed 2017 November 2017]
25
Berthier, A. (2014). The Scottish rate of income tax and additional rate taxpayers. Retrievedfrom http://www.parliament.scot/ResearchBriefingsAndFactsheets/S4/SB_14-14.pdf[accessed 26 November 2017]
26
Income Tax in Scotland: 2017 update, SB 17-84
51
Tax Analysis Division Congressional Budget Office Washington, D.C. (2005). A SensitivityAnalysis of the Elasticity of Taxable Income. Working Paper Series Congressional BudgetOffice Washington, D.C.. Retrieved from http://www.cbo.gov/sites/default/files/cbofiles/ftpdocs/60xx/doc6077/wp-2005-01.pdf [accessed 2017 November 2017]
27
UK Parliament. House of Commons Library. (2015). Income tax: the additional 50p rate.Retrieved from http://researchbriefings.parliament.uk/ResearchBriefing/Summary/SN00249[accessed 26 November 2017]
28
UK Government. (2016). The agreement between the Scottish government and the UnitedKingdom government on the Scottish government’s fiscal framework. Retrieved fromhttps://www.gov.uk/government/publications/the-agreement-between-the-scottish-government-and-the-united-kingdom-government-on-the-scottish-governments-fiscal-framework [accessed 22 November 2017]
29
HM Treasury. (2009). Budget 2009. Building Britain's future. Retrieved fromhttp://webarchive.nationalarchives.gov.uk/+/http://www.hm-treasury.gov.uk/d/bud09_completereport_2520.pdf [accessed 26 November 2017]
30
UK Parliament. House of Commons. (2012). Oral Answers to Questions. Cabinet Office.Wednesday 21 March 2012. Retrieved from https://publications.parliament.uk/pa/cm201212/cmhansrd/cm120321/debtext/120321-0001.htm [accessed 26 November 2017]
31
Institute for Fiscal Studies. (2014). 50p tax – strolling across the summit of the Laffercurve?. Retrieved from https://www.ifs.org.uk/publications/7066 [accessed 26 November2017]
32
HM Revenue and Customs. (2017). Table 2.1 Number of individual income taxpayers.Retrieved from https://www.gov.uk/government/statistics/number-of-individual-income-taxpayers-by-marginal-rate-gender-and-age [accessed 26 November 2017]
33
Scottish Government. (2016). The impact of an increase in the additional rate of income taxfrom 45p to 50p Scotland. Retrieved from http://www.gov.scot/Resource/0049/00497818.pdf [accessed 26 November 2017]
34
Scottish Government. (2017). Scottish Government Fifth Annual Report on theImplementation and Operation of Part 3 (Financial Provisions) of the Scotland Act 2012:Report on the Implementation of the Scotland Act 2016. Retrieved fromhttp://www.gov.scot/Resource/0051/00516889.pdf [accessed 23 November 2017]
35
Office for Budget Responsibility. (2017). Devolved taxes forecast. Retrieved fromhttp://cdn.budgetresponsibility.org.uk/DevolvedAutumn2017.pdf [accessed 22 November2017]
36
Eiser, D. (2017). Essentials of the Fiscal Framework. Retrieved fromhttp://www.parliament.scot/S5_Finance/Essentials_of_the_Fiscal_Framework_David_Eiser.pdf [accessed 22 November 2017]
37
Office for Budget Responsibility. (2012). Forecasting Scottish taxes. Retrieved fromhttp://budgetresponsibility.org.uk/docs/dlm_uploads/Forecasting-Scottish-taxes.pdf[accessed 5 December 2017]
38
Income Tax in Scotland: 2017 update, SB 17-84
52
Scottish Government. (2017). Scottish Budget - Draft Budget 2017-18. Devolved TaxesForecast Methodology. Retrieved from http://www.gov.scot/Resource/0051/00511834.pdf[accessed 28 November 2017]
39
Scottish Fiscal Commission. (2017). Current Approach to Forecasting September 2017.Retrieved from http://www.fiscalcommission.scot/publications/occasional-papers/current-approach-to-forecasting-september-2017/ [accessed 5 December 2017]
40
Scottish Fiscal Commission. (2017). Protocol for engagement between the Scottish FiscalCommission and the Scottish Government. Retrieved fromhttp://www.fiscalcommission.scot/media/1152/protocol-for-engagement-between-the-scottish-fiscal-commission-and-the-scottish-government.pdf [accessed 5 December 2017]
41
Office for Budget Responsibility. (2016). Supplementary forecast information release:Devolved tax forecasts. Retrieved from http://budgetresponsibility.org.uk/docs/dlm_uploads/Devolved-supplementary-release.pdf [accessed 22 November 2017]
42
Scottish Government. (2017, November). The Role of Income Tax in Scotland's Budget.Retrieved from http://www.gov.scot/Publications/2017/11/5307/downloads
43
UK Government. (2017). Income Tax. Retrieved from https://www.gov.uk/income-tax/taxfree-and-taxable-state-benefits [accessed 26 November 2017]
44
Liebig, T., & Sousa-Poza, A. (2006). The influence of taxes on migration: evidence fromSwitzerland. Cambridge Journal of Economics, 30(2), 235-252. doi: https://doi.org/10.1093/cje/bei057
45
Feld, L., & Kirchgässner, G. (2000). Income Tax Competition at the State and Local Level inSwitzerland. CESifo Working Paper Series. Retrieved from http://www.cesifo-group.de/portal/page/portal/DocBase_Content/WP/WP-CESifo_Working_Papers/wp-cesifo-2000/wp-cesifo-2000-01/WP238.PDF [accessed 26 November 2017]
46
Schmidheiny, K. (2003). Income Segregation and Local Progressive Taxation: EmpiricalEvidence from Switzerland. Retrieved from http://citeseerx.ist.psu.edu/viewdoc/download;jsessionid=8A72770D933060543F4AAF02654B6AFF?doi=10.1.1.202.6693&rep=rep1&type=pdf [accessed 26 November 2017]
47
Brülhart, M., Gruber, J., Krapf, M., & Schmidheiny, K. (2016). Taxing Wealth: Evidence fromSwitzerland. Retrieved from http://www.nber.org/papers/w22376 [accessed 26 November2017]
48
Income Tax in Scotland: 2017 update, SB 17-84
53
Scottish Parliament Information Centre (SPICe) Briefings are compiled for the benefit of theMembers of the Parliament and their personal staff. Authors are available to discuss the contentsof these papers with MSPs and their staff who should contact Anouk Berthier on telephone number85380 or [email protected] of the public or external organisations may comment on this briefing by emailing us [email protected]. However, researchers are unable to enter into personal discussion inrelation to SPICe Briefing Papers. If you have any general questions about the work of theParliament you can email the Parliament’s Public Information Service at [email protected] effort is made to ensure that the information contained in SPICe briefings is correct at thetime of publication. Readers should be aware however that briefings are not necessarily updated orotherwise amended to reflect subsequent changes.