income inequality: taking action - king county
TRANSCRIPT

Income Inequality: Taking Action
Carrie S. Cihak, Chief of Policy King County Executive’s Office

Outline
1. Local context
2. Income Inequality Basics
3. Income Inequality in King County
4. Why Does Income Inequality Matter?
5. Why is Income Inequality Increasing?
6. Can we do anything about it locally?
7. Where to Learn More

King County Outperforms U.S.

Unemployment by Race & Place
difference of 8.3% 7.4% 15.7%

difference of 39.4% 7.1% 46.5%
Adult Obesity by Race & Place

difference of 29.8% 84.8% 55.0%
Graduation Rates by Race & Place

difference of 11 years
86 years
74 years
Life Expectancy by Race & Place

Income by Race & Place
difference of 36K
$74.7K $38.7K

Index of: •Life expectancy
•Math & Literacy
•Infant mortality
•Homicides
•Imprisonment
•Teenage births
•Trust
•Obesity
•Mental illness
•Addiction
•Social mobility
Source: Wilkinson & Pickett, The Spirit Level (2009) Better
Worse
Income Inequality & Social Outcomes
Low Income Inequality High

Income Inequality Basics

Income: The flow of money from wages, interest, dividends, business profits, etc.
The distribution of wealth tracks income inequality, but tends to be even more unequal.
Wealth: The total stock of assets such as savings, inheritance,
stocks, bonds, real estate, etc., less debts or liabilities.
Income Inequality Defined
The extent to which income is distributed in an uneven manner among a population.

Many different ways to measure, e.g.:
Income Inequality Measured
As a share of total: In 2012, the top one percent of income earners in the U.S. captured 22% of total national income.
As a share of growth: In Washington State from 2009 - 2012, the top one percent captured 175% of the growth in State income.
As a range: The median income for blacks in King County is $39K, and for whites $75K, a difference of $36K.
The Gini coefficient: If everyone earns the same amount (total equality) Gini = 0. If one person earns everything and everyone else nothing (total inequality) Gini = 1.

U.S. Income Inequality is Growing
Source: Picketty & Saez, “Income Inequality in the United States, 1913-1998”, updated to 2012 by Saez.

Income Inequality in King County

King County: 806,000 households

Order households by income:

Split households into 5 groups, with the same number in each group.

Each group, or quintile, contains 20% of the total number of households
Lowest quintile
Lower Middle quintile
Middle quintile
Upper Middle quintile
Top quintile
Now, let’s measure the average income in each quintile to get King County’s
distribution of income.

$15,285 $42,110
$71,351
$112,026
$241,451
$420,560
Lowest
20%
Lower-Mid
20%
Middle
20%
Upper-Mid
20%
Top
20%
Top
5%
King County Income Distribution
King County Mean Household Income by Quintile, 2011 - 2013

$15,285 $42,110
$71,351
$112,026
$241,451
$420,560
Lowest
20%
Lower-Mid
20%
Middle
20%
Upper-Mid
20%
Top
20%
Top
5%
King County Income Distribution
King County Mean Household Income by Quintile, 2011 - 2013

Income Inequality is Growing
0
10,000
20,000
30,000
40,000
Low Income Middle Income High Income
Increase in Number of King County Households 1999 - 2012
< $35K
> $125K
Only 5% of
the net increase in
new households in King County
have been middle income.

The Virtuous Cycle
A strong middle class creates a virtuous cycle of economic growth and prosperity.
Source: Robert Reich, Inequality for All

When the middle class doesn’t share in economic gains, a vicious cycle is created leading to stagnating growth.
The Vicious Cycle
Source: Robert Reich, Inequality for All

Equity is the Superior Growth Model
Standard & Poor: “How Increasing Income Inequality Is Dampening U.S. Economic Growth, And Possible Ways To Change The Tide”
International Monetary Fund: “Inequality and Unsustainable Growth: Two Sides of the Same Coin?”
Every 10 percent increase in equality increased the length of a country’s growth periods by 50 percent.
The Federal Reserve Bank of Cleveland: “Dashboard Indicators for the Northeast Ohio Economy”
Racial inclusion and income equality matter for growth.
Chris Benner & Manuel Pastor: Just Growth: Inclusion & Prosperity in America’s Metropolitan Regions
A growing body of research shows that inequity poses a threat to U.S. economic growth and that regions with more
equity have stronger and more sustainable growth.

We are all better off when
all of us are better off.

Why is Income Inequality Increasing?

Productivity Growth
Wage Growth
Equitable Growth Reverses in 1970s
Source: Reich, Inequality for All.

National & International Macroeconomic Forces
• Decline in union membership
• Technological revolution
• Globalization
• Growth of financial markets
Policy and institutional framework influences who gains and loses:
• Shifts in national tax policy
• Shifts in other national policies, e.g., deregulation
• Decline in public investments in education and infrastructure

Can We Do Anything about Income Inequality Locally?

Building Equity & Opportunity

Building Equity & Opportunity
Together, we’ve enrolled over
200,000 King County residents!
On March 1, Metro implemented a
reduced fare for people with low income.
Executive Constantine is
proposing Best Starts for Kids, a levy to put every child on the path to success.

How Can You and Your Organization Align to
Build Equity?

Contacts
Carrie S. Cihak, Chief of Policy
Office of King County Executive Dow Constantine
(206) 263-9634
Chandler Felt, Demographer
King County Office of Performance, Strategy and Budget
(206) 263-9693
Matias Valenzuela, Director
King County Office of Equity & Social Justice
(206) 263-8697

Resources

Where to Learn More: King County’s Equity & Social Justice Work: www.kingcounty.gov/equity
• King County Equity & Social Justice Annual Report • The Determinants of Equity: Indicators to Establish a Baseline of Equity • Infographic: Building Equity & Opportunity
Best Starts for Kids: www.kingcounty.gov/beststarts
More info coming April 27 with the Executive’s State of the County address!
Videos on Inequality:
• Unnatural Causes…Is Inequality Making Us Sick? A seven part documentary series on inequality and health. www.unnaturalcauses.org
• Inequality for All A documentary film featuring former US Labor Sec. Robert Reich www.inequalityforall.com
• Wealth Inequality in America videographic www.youtube.com/watch?v=QPKKQnijnsM

Talks and Lectures on Inequality
• How Economic Inequality Harms Societies TED Talk by Richard Wilkerson, co-author of The Spirit Level http://www.ted.com/talks/richard_wilkinson?language=en
• Beware, Fellow Plutocrats, the Pitchforks are Coming TED Talk by local self-proclaimed plutocrat Nick Hanauer http://bit.ly/1zCOmxe
• Income Inequality & American Democracy Town Hall Seattle event with Nobel Laureate Joe Stiglitz, April 28 http://townhallseattle.org/event/joseph-stiglitz/
Policy Institutes & Web Resources on Inequality
• Policy Link: www.policylink.org • Economic Policy Institute: www.epi.org • The Institute for Policy Studies, project on Income Inequality
www.inequality.org • Center on Budget & Policy Priorities, Income Inequality research area
http://www.cbpp.org/research/index.cfm?fa=topic&id=153

Articles & Reports on Income Inequality
• Equity is the Superior Growth Model, Policy Link http://bit.ly/ZBXXFQ • The Increasingly Unequal States of America: Income Inequality by State
Interactive website and tool http://www.epi.org/publication/income-inequality-by-state-1917-to-2012/
• 17 Things We Learned about Income Inequality in 2014, The Atlantic http://theatln.tc/1va1ljP
• Middle Class, but Feeling Economically Insecure, NYT, Part II in three-part series, with interactive media http://nyti.ms/1Jyr12U
Books on Inequality
• The Price of Inequality: How Today’s Divided Society Endangers Our Future, Joseph Stiglitz
• Just Growth: Inclusion & Prosperity in America’s Metropolitan Regions, Chris Benner & Manuel Pastor
• The Spirit Level: Why Greater Equality Makes Societies Stronger, Richard Wilkinson & Kate Pickett

Selected Resources on Race and Implicit Bias
• Race: The Power of an Illusion A three-part documentary series http://www.pbs.org/race/000_General/000_00-Home.htm
• Embracing Inclusion for One King County: Addressing Implicit Bias, Racial Anxiety & Sterotype Threat King County 2014 Equity & Social Justice Forum featuring Rachel Godsil http://1.usa.gov/1D9TRVh
• Project Implicit Learn more about implicit biases and take the implicit associations test. https://implicit.harvard.edu/implicit/
• Racial Bias, Even When We Have Good Intentions, NYT http://nyti.ms/1EYogHu
• Blind Spot: Hidden Biases of Good People, Mahzarin R. Banaji & Anthony G. Greenwald

Selected Resources on Early Childhood Development
• The Raising of America: Early Childhood & the Future of Our Nation A five-part documentary series http://www.raisingofamerica.org/
• The “Big Bang” in Learning: Brain Changes & Childhood Learning Aspen Ideas Festival talk featuring Drs. Pat Kuhl & Andrew Meltzoff https://www.youtube.com/watch?v=4zgkSObH4dU
• Heckman: The Economics of Human Potential Website featuring the work of Nobel Laureate James Heckman ww.heckmanequation.org
• Institute for Learning & Brain Sciences http://ilabs.washington.edu/ • The First Year, National Geographic http://bit.ly/1zlj3Hn

Race & Place Matter in King County
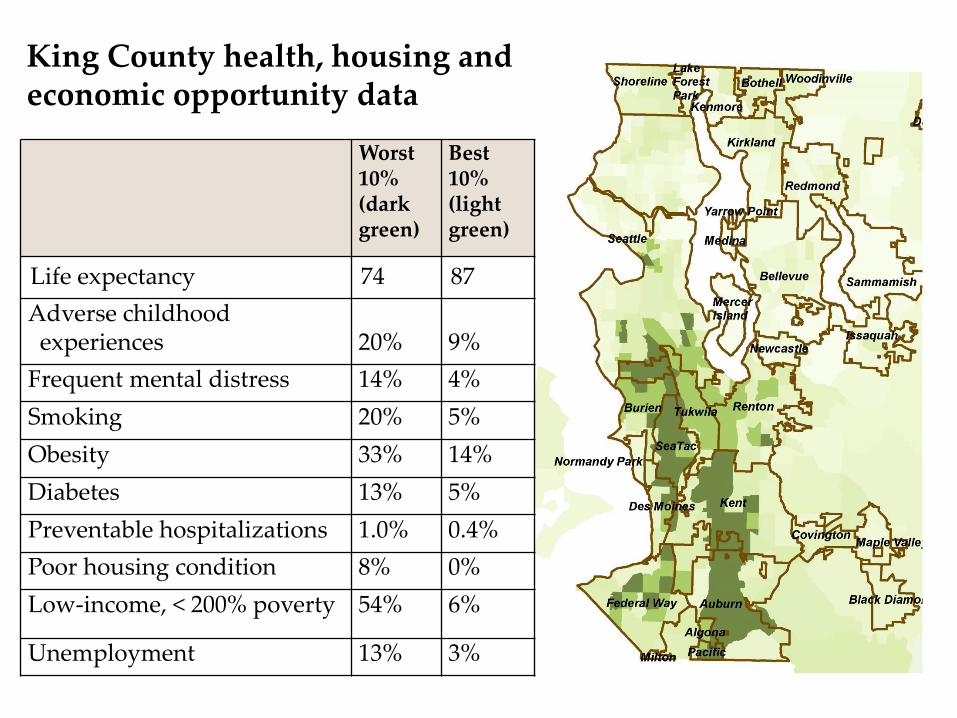
Worst 10% (dark green)
Best 10% (light green)
Life expectancy 74 87
Adverse childhood experiences
20%
9%
Frequent mental distress 14% 4%
Smoking 20% 5%
Obesity 33% 14%
Diabetes 13% 5%
Preventable hospitalizations 1.0% 0.4%
Poor housing condition 8% 0%
Low-income, < 200% poverty 54% 6%
Unemployment 13% 3%
King County health, housing and economic opportunity data