income distribution effects of green revolution in india...
TRANSCRIPT
Bulletin Number 82-2
ECONOMIC OEVELOPMENT CENTER
INCOME DISTRIBUTION EFFECTS OF GREEN REVOLUTON IN INDIA:
A REVIEW OF EMPIRICAL EVIDENCES
M. Prahladachar
ECONOMIC DEVELOPMENT CENTERDepartment of Economics, Minneapolis
Department of Agricultural and Applied Economics, St. Paul
UNIVERSITY OF MINNESOTA
__
April 1982


INCOME DISTRIBUTION EFFECTS OFGREEN REVOLUTION IN INDIA:
A REVIEW OF EMPIRICAL EVIDENCES
M. Prahladachar*
Bulletin No. 82-2April 1982
*Visiting Associate Professor, Department of Agricultural andApplied Economics, University of Minnesota, on leave fromInstitute for Social and Economic Change, Bangalore, India.
Department
Economic Development CenterDepartment of Economics, Minneapolisof Agricultural and Applied Economics, St. Paul
University of Minnesota

TABLE OF CONTENTS
Page
Introduction ............ ... . ......... ... 1
Section 1 - Adoption Pattern of MVs Among Farmers and Tenants .... 5
A. Small Versus Large Farmers 5
- Farm Size and Effective Participation in New Technology . . 12
- Farm Size and Productivity/Income of MVs ......... . 15
B. Tenancy and Adoption of MVs.. . . .. . . . . . . . . .. . 21
C. Green Revolution and Farm Income Inequality .. . .. . . .. 23
Section 2 - Green Revolution and Landless Laborers ......... . 26
Section 3 - Factor Shares and Green Revolution .. . . . ....... 30
Section 4 - Green Revolution and Regional Disparities ........ 33
Conclusion ....... . ......... . . .......... .. . 37
Footnotes . . . . . . . . . . . . . . . . . . . . . . . . . . . . .. . 40
References . . . . . . . . . . . . . . . . . . . . . . . . . . . .. 45
The publication of this report was financed by U.S. Agency forInternational Development - University of Minnesota Asia AgriculturalResearch Review Project (Contract No. AID/ASIA-C-1456).


ACKNOWLEDGEMENTS
I am deeply grateful to Professor Vernon W. Ruttan, Carl E. Pray and
Professor K. William Easter for their valuable comments on an earlier draft
of this paper. However, the usual disclaimers apply.
My sincere thanks are due to Mary Jane Luedtke for meticulous typing
of the manuscript.

Introduction
There are indeed differences among analysts whether the term "green
revolution" is appropriate in characterizing the relatively recent trends
that have set in, in Asian agriculture, with the introduction of modern
varieties of cereals. These differences reflect the controversy that has
arisen with regard to the distributional implications of green revolution
in Asian agriculture. Even before the changes associated with green
revolution were in the process of getting worked out, many analysts, as
Schultz (1978) remarks, "turned to making predictions about the
unfavorable social side effects of this type of economic dynamics"
Moreover many of these "predictions" were based on personal observations,
impressions and fragmentary evidences. The conclusions/inferences drawn by
many analysts in their studies were hasty and hypothetical, lacking in
2empirical authenticity.
The main purpose of this paper, therefore, is to examine Indian
empirical evidences on the green revolution, with a view to obtaining as
far as possible an integrated picture of its (green revolution's) effect
on selected dimensions of income distribution in India. The major credit
for the present analysis should go to the painstaking efforts of several
researchers who in the first instance collected and/or analyzed a large
amount of field data, touching on the varied aspects of green revolution
in several parts of the country. The enormity of evidences existing on
green revolution in the country makes it difficult, if not impossible, to
include each one of them in our review. Therefore, the choice of
evidences cited in the course of this review is rather dictated by their
usefulness and representatives in obtaining an integrated picture, keeping
-2-
in mind the conflicting views/hypotheses held in literature with regard to
the income distribution effects of green revolution. This review has
benefited a great deal from some of the earlier analytical studies/reviews
on the subject. Among them a spacial mention may be made of those by
C. H. H. Rao (1975), Vyas (1975), Dasgupta (1977) and K. Bardhan (1977).
The review has the following major dimensions in it's content:3
(i) income distribution effects (of green revolution) among producers (and
tenants) of a region; (ii) income distribution effects (of green revolution)
on landless laborers; (iii) relative shares of factors of production in the
increase in productivity due to modern varieties (MVs); (iv) green
revolution vis-a-vis the regional income disparities.
The growing importance of MVs in the Indian economy may be appreciated
from the fact that in 1976-77, the latest year for which data are readily
available, one-third of the total cereals' area was sown with MVs. That
the major breakthrough in new seed-water-fertilizer technology,5 both in
terms of coverage in area and yield performance, has come about mainly in
wheat crop and the reasons for being so are well documented by many
researchers. Also the reasons for the relatively limited successes of new
technology in respect of other cereals, especially rice, are critically
examined in a number of studies. Likewise, the factors accounting for the
differential adoption and performance of MVs of different cereals in the
same region and of the same cereal in different regions are analyzed in
several studies. Nevertheless, it may be pointed out that Indian empirical
evidences relating to MVs of cereals refer (i) mainly to wheat and rice
and (ii) mainly to IADP districts.6 In addition to these limitations of
crop and geographical biases in empirical evidences (in the sense MVs of
crops other than wheat and rice and areas other than IADP districts are

-3-
relatively less studied), there is the limitation of "time bias", in the
sense, most of these evidences flow from a first few years experience of
green revolution in the country. Apart from these biases, most of the
studies are conducted more or less independently in terms of research
design and methodology making it difficult to subject their data for
rigorous statistical exercises. Nevertheless, the welcome feature is
that they do contain many common elements and cover a common set of issues.7
The mainstay of green revolution has been the fact that the MVs have
high yield potential, being more responsive than the local varieties to
higher levels of fertilization, effective water control and drainage
measures and effective control of diseases and insects. These
characteristic features of MVs lie at the root of both the problems and
prospects that are germane/relevant to the income distribution effects of
green revolution. In fact much of the heat that is generated in evaluating
the impact of MVs on income distribution derives its fuel from varying
perspectives in which MVs with their inherent characteristics are held to
affect/benefit the different classes of the rural society.
At the outset it is of significance to mark the considerable amount
of empirical evidence that exists by now which has established, even in
field conditions, the economic superiority of MVs over traditional varieties
-- in terms of yields and/or net returns per unit of area, more
impressively in the case of wheat and maize, and less so in the case of
other MVs of cereals.
The fact of economic superiority of MVs over traditional varieties
lends a special edge to the income distribution effects of green revolution
among producers of a region (the first dimension in our review), provided
we discover significant differentials in levels of adoption and

-4-
performance of MVs between small and large farmers and between landowners
and tenants respectively. It is to the review of empirical evidences on
this aspect that we now turn.

-5-
Section 1
Adoption Pattern of MVs Among Farmers and Tenants:
A. Small Versus Large Farmers:9
Absence of time-series data on area under MVs, size-wise, has been
indeed a handicap in tracing the trend in adoption pattern by small and
large farmers in the country. Especially in regions where MVs are not
adopted universally, collection of such data would be of immense utility.
In the absence of such comprehensive official statistics, we are compelled
to depend on "adoption studies" undertaken by various agencies and
organizations.
Biases of crop, region and time-profile of the empirical evidences
on green revolution in the country notwithstanding, fairly comprehensive
surveys on the adoption pattern of MVs were undertaken by, (i) the Program
Evaluation Organization (PEO) of the planning commission for the years
1967-68, 1968-69 and 1969-70, and (ii) by Agro-Economic Research Centers
(AERCs) variously for the years 1966-67 to 1968-69. Findings based on a
critical analysis of data collected in these surveys are readily available
from two studies undertaken by Lockwood, Mukherjee and Shand (1971) and by
Schluter and Mellor (1972) respectively.
The Lockwood et al., study, based on data in the 1967-70 PEO surveys
covered five crops wheat, rice, maize, bajra and sorghum, and fairly large
samples from the relevant states of India for individual crops. It found
a strong positive linear relationship between the proportion of farmers
adopting HYV and the farm size. This relationship was true for each of
the five crops and each of the three years studied. However, within this
"highly generalized picture" (emphasis added) they discovered considerable

-6-
variation between states and often between districts within states. For
instance in the Punjab, the use of high yielding seed did spread fairly
evenly to farmers in all decline groups, and as the general level of
participation increased over time (a span of three years in this specific
study) the inter-decile difference in percentage of adopting farmers
declined and in 1969-70 there was virtually 100 percent participation in
all deciles. Lack of reliable irrigation (particularly where reliability
was a function of tubewell investment which was limited largely to the
larger farms), poorly organized supplies of required inputs, etc., according
to the authors, possibly prevented this situation being reached in other
states like Haryana, Rajasthan and Bihar.
Schluter and Mellor drawing primarily on the published reports of the
AERCs and PEO, found a positive relation between adoption and farm size
in most areas. In 17 of the 20 areas studied by the AERCs, the relationship
was statistically significant as it was in over half of 50 cases studied
by the PEO. In no case was there a significant inverse relationship
between adoption and size of farm. They noticed, however, considerable
variability among regions and crops in the strength of the relation
between farm size and adoption. An interesting and important observation
that these researchers made in the course of their analysis was that
although a high degree of irrigation availability was a necessary condition
for adoption, it was not a sufficient condition either for adoption or for
equalizing rates of adoption between farm size groups. For instance in
East and West Godavari districts (of Andhra Pradesh) almost the entire
acreage on all farm size groups was irrigated. But differential rates of
adoption were observed between farm size groups, as well as high rates of
nonadoption in all groups. The authors hypothesized that either high cost

-7-
of cultivation or uncertainty (both of these primarily working against
small farmers) caused differential rates of adoption between farm size
groups.
Studies done by Lockwood et al. and Schluter and Mellor do lend
support to the hypothesis that it is the large farmers who take the lead
in the adoption of MVs. But, they also implicitly suggest that with
certain conditions being fulfilled, like availability of irrigation, credit
and insurance against risk and uncertainty, small farmers would catch up
fast with the large farmers in the adoption of MVs. Therefore, it is
important to recognize that reasons for the initial lagging of small
farmers in the adoption of MVs more importantly lie in their inadequate
resource base, and in the nature of infrastructual and institutional
arrangements surrounding them rather than in the new technology as such.
In contrast to the initial picture of adoption of MVs being largely
a "large farmer phenomenon", the later picture emerging out of surveys/
field studies undertaken after a few years' experience with MVs is one of
small farmers progressively catching up with the large farmers.
A joint follow-up study by the PEO and ANU (1976) of the HYV program
in India, 1970-75 observed that if size of holding was a factor in the
spread of HYV wheat in the selected districts, it might have been a
constraint in the earlier years, but soon disappeared.
Mandal and Ghosh (1976) in their study based on a survey of 40 farm
households from each of the two selected villages in the districts of
Burdwan (west Bengal) and Shahabad (Bihar) and Sambalpur (Orissa)
respectively, in the years 1972-73 and 1973-74, found that the
participation was more or less equal among all sections of the farming
community irrespective of Tenurial status and the size of holdings.
-8-
They attributed this dissemination to factors like "concentrated extension
service, administrative efforts and other facilities of production" made
possible under the IADP in these districts.
Mencher's (1974) field study in Chingleput district, Tamil Nadu at
three points of time (in 1963, 1966-67 and 1970-71) showed that where new
seeds were available small farmers had begun to adopt them even though no
extension efforts were being made to reach them; with more assistance the
adoption could have been considerably increased.
With regard to the spread of H-4 variety of cotton in Sabarkantha
(Gujarat) district, Desai (1978) found that within a span of four years
(1969-70 to 1972-73), there was a rapid adoption by increasing number of
cultivators. Although the adoption began with cultivators having big
farms, superior irrigation facilities, better educational background, etc.,
very soon -- once the profitability of growing H-4 was well demonstrated
-- cultivators with smaller farms, not-so-good irrigation facilities and
poor educational background also began cultivating H-4.
NCAER's (1978) fairly comprehensive study (a sample of 25,000 farmers
spread over 17 Indian states) held in 1975-76 did not report any clear
relationship between farm size and rice area in MV in 14 of 17 Indian
states.
As a part of Global-2 Indian studies, surveys done in Muzaffarnagar
(Uttar Pradesh) and Ferozpur (Punjab) revealed that over a span of 5
years (1967 to 1972), the adoption of HYV wheat became virtually universal.2
Above cited studies do bring forth the salient point of small
farmers progressively catching up with the large farmers in the adoption
of MVs within a relatively limited number of years, thereby refuting the
hypothesis that green revolution has been essentially a large farmer
-9-
phenomenon; although in the initial phase it appeared to be so, it turned
out to be a transitory phenomenon.
However, studies which report a progressive number of small farmers
adopting MVs within a limited span of years thus catching up with large
farmers do not present, with some exceptions, a systematic and in-depth
analysis of circumstances/factors that made the process possible, although
some broad statements and indications to that effect can be picked up. A
detailed accounting and stock-checking of factors that contributed to this
trend over different regions would have proved immensly beneficial for
gaining a better perspective of the new technology and also for initiating
appropriate policy measures.
Despite many evidences pointing out to the wide diffusion of MVs among
producers over time, forcefully countering the view that it has been
predominantly a large farmer phenomenon, it serves well to remind us that
the diffusion process is neither assured nor automatic and depends a great
deal on political, social and economic conditions under which MVs are
introduced. A study by Parthasarathy and Prasad (1978) undertaken in 1972
in a canal irrigated rice village in West Godavari district (Andhra Pradesh)
-- with no other crop in either the wet or dry season -- found a significant
association between farm size and adoption of modern varieties, in both the
wet and dry season, when cultivators were classified into groups that farm
less than or more than 4 ha. "The big farmers led in using the new
technology, were ahead of others in terms of rates of adoption and used a
greater proportion of the package of inputs". Small farmers, according to
the authors, were obviously placed in a disadvantageous position with regard
to investable resources and imperfections in the input markets.

-10-
Supporting evidence to Parthasarathy and Prasad's finding that even
after a few years of diffusion of MVs, small farmers may be still deprived
of its benefits comes from Chinnappa's study (1977) of MVs of paddy in
North Arcot district (Tamil Nadu) for the year 1973-74. In the survey area,
possession of pumpsets emerged as the one factor leading to higher rate of
adoption among all groups of cultivators: big and small. But the proportion
of small cultivators who could afford pumpsets was much lower than that
among the larger cultivators. Other constraints appeared to be the scarcity
and high price of fertilizers and the nonavailability of credit, particularly
to small cultivators.
The PEO and ANU Study (1976) observed indeed that the coverages of
HYVs in wheat growing areas extended very fast and reached a saturation
point in certain districts, often as short a time as five years. But the
same study drew attention to the rather disturbing fact that in a few of
the primarily wheat growing areas -- such as Hissar and Sonepat blocks in
the progressive state of Haryana -- there was either still rather poor
coverage or a shift away from HYVs to local improved varieties since 1971-
72. The constraints for this situation prevailing were, among others, the
lack of adequate or assured supply of water for irrigation, inadequate
supplies of fertilizers, high prices of fertilizers and chemicals, lack of
institutional credit especially for the small farmers who faced problems
in all selected districts (except Ludhiana in Punjab and Muzaffarnagar in
Uttar Pradesh). The farmers in the districts of Hissar (Haryana), Rohtak
(Haryana), and Basti (Uttar Pradesh) had frequently to resort to private
money lenders and big landlords with rates of interest varying from 18 to
40 percent. In some of the districts, viz Amritsar (Punjab), Gaya (Bihar)
and Basti (Uttar Pradesh), a number of cooperative societies were defunct
on account of accumulation of heavy overdues.

-11-
From the PEO and ANU Study (1976), we further gather that with respect
to MVs of paddy, the picture was much more diffused and complex. Even
after a decade of the operation of the HYV program, HYV area coverage
exceeded 50 percent of the total paddy area in only 3 of 27 blocks selected.
In another 3 blocks, it ranged from one-fourth to one-half. In the other
16 blocks, coverage was less than 25 percent. It was negligible in 5 blocks.
The factors accounting for the low HYV paddy coverage were lack of assured
irrigation, nonavailability of varieties of required duration to suit local
and seasonal conditions, lack of institutional finance, etc.
The findings of the above cited studies helped highlight the fact that
the adoption process of MVs among producers is by no means automatic (which
seems to be suggested in the evaluations of over-zealous enthusiasts of
green revolution). They also bring out among other things the relevance
and importance of physical and institutional infrastructure to ensure
universal diffusion of MVs among the producers.
The proportion of farmers in different size groups, adopting MVs, is
only a partial indicator and any inferences drawn regarding its likely
effect on income distribution among producers may be misleading. For a
meaningful appraisal of income distribution effects of green revolution
among producers, we have to take into account related parameters of
adoption pattern of MVs viz: differences in the intensity of adoption
(i.e. effective participation), and yield rates (preferably net income)
obtained across farm size. It is to the examination of empirical evidences
relating to these parameters of the adoption pattern across farm size that
we now turn.
-12-
Farm Size and Effective Participation in New Technology:
The study by Lockwood et al. (1971) showed that there was a slight
inverse association between farm size and proportion of HYV rice area.
But in wheat areas, the same study found a positive relationship between
the proportion of acreage under MVs and farm size. Supporting evidence
to PEO studies' finding (with regard to MV wheat) may be found in IADP
Aligarh study and AERC studies in Karnal and Amritsar. AERC studies in
Kota, Bijapur, Faizabad and Saharanpur exhibited the reverse trend. The
farm management study of Ferozpur suggested a positive relationship
between farm size and proportion of wheat area under MV, although no such
evidence was forthcoming in another farm management study (i.e. of
Muzaffarnagar) (Vyas: 1975; p. 18).
Analysis by Schluter and Mellor (1972) referred to varying situations
with regard to the relationship between the proportion of acreage under the
MVs and farm size. In the case of rice, generally as farm size increased,
the proportion of the crop's acreage put under the new varieties decreased.
This was hypothesized by the authors to be mainly due to problems like
labor shortage and labor supervision. In contrast, large farmers put a
greater proportion of their wheat acreage under the new varieties than the
small farmers. But in bajra growing areas, evidences of both direct and
inverse relationships of the proportion of hybrid varieties with the farm
size were observed. For maize and jowar crops, there was not a
significant relationship between proportion of acreage under the new
varieties and farm size.
Chowdhury (1970) pointed out in his study that in Birbhum district
(West Bengal) nearly one-fourth of the cultivated area in the lower size
group had been brought under the HYV crop (rice) but in the other
-13-
contiguous size groups the extent declined considerably. Likewise in
Saran district (Bihar), the farmers in the lowest size group had put nearly
one-third of the total cultivated area under hybrid maize. In the
preceding size groups, the importance of hybrid maize declined consistently
so that in the highest size group, the extent of hybrid crops was as low
as 7 percent of the total cultivated area. On the basis of this evidence,
Chowdhury concluded that the "effective participation" by small farms in
the HYV program was no less satisfactory than that of the large farms.
Supporting evidence to Schluter and Mellor's finding that in the case
of rice there existed an inverse relationship between farm size and
proportion of acreage under MVs comes from Chinnappa's study (1977). Small
cultivators (in the survey areas of North Arcot district) particularly those
possessing 0.6 to 1.0 hectare had higher rates of adoption than cultivators
with smaller acreages and those in the next higher size group (1 to 2
hectares).
It is obvious from the evidences cited above that we cannot draw any
firm conclusion regarding the relationship between adoption levels of MVs
and farm size. Evidences seem to be mixed in nature (possibly with the
exception of those for MVs of rice), for a given crop across regions and
for a given region across crops. Therefore, either of the claims that
"effective participation" in the spread of MVs is clearly more among small
farmers or among large farmers seems to be not "conclusive".
It may be noted, however, that in general, in studies dealing with
adoption of MVs, effective participation in new technology by farms in
different size groups is measured in terms of proportion of MVs' area
to their respective farm size. But, if it is conceded that irrigation is
the major determinant of adoption of MVs, then a more relevant index of

-14-
participation would be the proportion of MVs' area to irrigated area on
13farms of different size groups. Making use of this criterion, Bhalla
(1979) observed in his study, based on a fairly comprehensive NCAER household
survey data for the three years 1968-69 through 1970-71, that 46 percent
of the irrigated large farms and 34 percent of the irrigated small farms
grew HYV varieties in 1968-69. But by 1970-71 both the small (62%) and
large farmers (66%) were almost on equal ground. The crucial difference
was, however, that within three years, the large farmers could increase
their area under HYV the most: 63 percent compared to 13 percent for the
small farmers. Thus, the effective participation of small farmers in HYV
adoption, according to this evidence, did not keep pace with that of the
larger farmer. Details for wheat and rice farmers showed similar trends
in HYV adoption with respect to farm size as did the aggregate data on
adoption. The lower resource base of the small farmer, lack of investable
surplus, high cost of cultivation, etc. were presumably the constraints
operating against the small farmers in progressively increasing their area
under MVs, despite the fact of irrigation availability. (Interestingly
enough, the study noted that different reasons were offered by small and
large farmers for not using fertilizer in 1970-71. Lack of credit was
mentioned as a major constraint by 48 percent of the small farmers and only
6 percent of the large farmers; and as contrast, 32 percent of small
farmers and 84 percent of large farmers mentioned irrigation as a major
limitation).
A point that forcefully emerges, either explicitly or implicitly from
a survey of the adoption studies is that given the necessary support --
institutional, infrastructural, etc. small farmers do participate
increasingly and effectively in the adoption of new technology. In such
-15-
a situation, new technology, being scale neutral, would help improving
their income status. On the contrary, if supportive measures to remove
the constraints: institutional, economic, political, etc., faced by small
farmers are not forthcoming, they would not be able to reap the benefits
from new technology, although it is technically neutral to scale. Therefore,
it needs to be recognized that it is the institutional, economic and
political conditions under which the new technology is operating that
discriminates against small farmers relative to large farmers rather than
the new technology as such.
Farm Size and Productivity/Income of MVs:
Yield/income differentials of MVs between small and large farmers is
another parameter in the adoption pattern that can either narrow down or
widen the income disparities among producers. What does the empirical
evidence look like on this parameter and what does it suggest? Rather than
reproducing the large amount of field evidence available on yield/income
of MVs by farm-size, we prefer to start with the summary findings based on
such evidences on wheat and rice: the two major food crops in India, by
Vyas (1975) and Herdt (1980) respectively.
Vyas, relying on evidences put forward by farm management surveys of
Ferozpur (Punjab) in 1969-70 and Muzaffarnagar (Uttar Pradesh) in 1968-69
and several AERC studies concluded that the "weight of evidence" suggested
a positive association of per hectare net income and the size of holding.
However, Vyas did make a cautious and careful qualification that this was
not a universal phenomenon and there were other studies which did not
support this conclusion.
-16-
Herdt assembled data variously spread over the period 1970-78 on
yields (and fertilizer use) obtained in studies of villages growing modern
rice varieties. Because each study used its own division of size groups,
Herdt, for the purposes of comparison consolidated all the observations
into two groups: large and small, by averaging all observations below
the middle size and all above the middle size. Of the 28 Indian locations
for which data were available, in 17 the yields of large farmers exceeded
those of small farmers (ranging from 0.1 t/ha. to 1 t/ha.), in 8 the yields
of small farmers exceeded those of large farmers (ranging from 0.1 t/ha. to
0.4 t/ha.) and in 3 the yields of large and small farmers were equal. Thus,
large farms outnumbered small farms in reporting higher yields of MVs on
their farms. Fertilizer use likewise seemed to be somewhat higher on
large farms, although the difference occasionally was in favor of the
small farms. However, most of the studies from which Herdt assembled
yield data contained no statistical tests.
Although sheer "numerical weight" of evidences offered by Vyas and
Herdt in respect of yield of MVs of wheat and rice, prima facie seems to
suggest a positive relationship between yield/income per unit of area and
farm size, it should not be misconstrued to interpret or conclude that
large farms are better suited (or better performing) to the cultivation
of MVs than the small farms. For one thing these data do not contain
statistical tests of significance and for another it is not clear whether
they separate out the influence of a number of confounding factors on
yield like differences in soil quality, irrigation, level of inputs used
etc., across the farms. Differentials in yield/income per unit of area
between large and small farms growing MVs, may at best be taken as
reflections of the differentials in the levels of inputs used, which in
-17-
turn may be due to a host of peculiar economic, social, political and
institutional factors. In an environment devoid of these limitations,
or relatively less pronounced, one may perhaps visualize, new technology
living up to its virtue of scale-neutrality. In fact Sidhu's (1974)
econometric exercise for HYV wheat in the Punjab indicates that new
technology has been approximately neutral with respect to scale, that it
has not been strongly biased in either labor-saving or capital-saving
direction and small and large farms have achieved approximately equal gains
in efficiency. Unfortunately such rigorous and methodologically satisfying
econometric exercises are not undertaken for other regions or crops in the
country.
A preliminary comparison of yield rates/income per acre of MVs as
such across the farms though helpful is obviously crude and has its own
limitations in offering firm and integrated evidence about the relationship
between farm size and productivity, and also in tracing the change in that
relationship in the pregreen revolution and post-green revolution period in
Indian agriculture. It is often contended that in the post-green revolution
period the income disparities between large and small farmers have widened
because the inverse relationship that generally obtained between farm size
and productivity in the traditional technology in 50's and early 60's has
weakened or even reversed itself in the late 60's and 70's, because of
presumed advantages of the larger farms in access to and use of the new
14technologies.
In support of this view, C. H. H. Rao (1975) assembled regression
results from studies for three regions and a number of years and pointed
out that the negative relationships between gross value of output per
acre and farm size had weakened between the 50's and the 60's (see Table 1).

-18-
Table 1. Relationship Between the Gross Value of Output Per Acre andFarm Size
Muzaffarnagar (Uttar Pradesh)
Year Slope (b) Coefficient of Correlation
1955-56 -0.25* -0.461956-57 -0.17* -0.331966-67 -0.14* -0.251967-68 -0.09* -0.251968-69 -0.04* -0.17
Ferozepur (Punjab)
1955-56 -0.06 -0.091956-57 -0.17* -0.281967-68 -0.03 -0.051968-69 -0.03 -0.04
West Godavari (Andhra Pradesh)
1957-60Output -0.11*** -0.62Labor -0.13** -0.82Fertilizer -0.05 -0.21
1969-70 Output -0.02 0.15Labor -0.16** -0.86Fertilizer 0.10*** 0.77
*Significant at 0.1% level; **Significant at 1% level; ***Significant at5% level; the remaining coefficients are not significant at 5% level.
SOURCE: C. H. H. Rao, Technological Change and Distribution of Gains inIndian Agriculture (Delhi: Macmillan Co. of India Ltd., 1975,p. 143. Adapted from the following sources:
(1) The results pertaining to Muzaffarnagar and Ferozepur aretaken from N. Bhattacharya and G. R. Saini, 'Farm Size andProductivity: A Fresh Look,' Economic and Political Weekly,Review of Agriculture, 24 June 1972.
(2) The results relating to West Godavari for the period 1957-60are obtained by using the data contained in Directorate ofEconomics and Statistics, Ministry of Food and Agriculture.
Studies in Economics of Farm Management, West Godavari.
(3) The results relating to West Godavari for the year 1969-70
are obtained on the basis of the data contained in Waheeduddin
Khan and R. N. Tripathy, Intensive Agriculture and Modern
Inputs: Prospects of Small Farmers - A Study in West
Godavari District, National Institute of Community Development,
Hyderabad, 1972, pp. 13, 64 and 76.
-19-
Being too limited in coverage and based mostly on group averages the
results of these studies are, however, of limited utility, especially in
obtaining a general picture at the all India level.
Fortunately Bhalla's study (1979) based on farm level data (1,772
farm households dispersed throughout India) collected by NCAER as a part
of its "Additional Rural Income Survey" (ARIS) for the years 1968-69,
1969-70 and 1970-71 offers such a possibility. The principal findings of
this study were as follows: (i) the hypothesized inverse relationship
between farm size and output per farm area was confirmed empirically, for
the years 1968-69 to 1970-71, when major changes due to green revolution
were taking place.5 This relationship was true even when the influence
of land quality (as reflected by land price) was removed and also when the
influence of irrigation was removed; (ii) the relationship held
systematically at the level of the individual product sector, so that
changing product-mix alone did not account for declining output per farm
area.
Although Bhalla's study confirmed that the inverse relationship
between farm size and productivity persisted even in green revolution
period (1968 to 1971), it did, however, observe that the factor
combinations shifted away from labor toward land and to a lesser degree
capital as farm size increased. The elasticity of input use with respect
to farm size (percent rise in input use per percentage rise in farmland
area) was only 0.55 for labor, 0.74 for capital and 0.77 for seeds,
fertilizers and insecticides. Also during the period of the green
revolution (1968 to 1971) larger farms appeared to have increased both
output per acre and the fractions of their farm area in MV (as mentioned
earlier) more rapidly than the small farms. This relative change was

-20-
primarily facilitated, as contended by the author, by easier and cheaper
access to credit for large farms than for small.
Above qualifications found in Bhalla's study (set within the major
finding of an inverse relationship between farm size and productivity
even in green revolution phase) do suggest the necessity and importance of
ensuring a greater accessibility to inputs for small farmers (critically of
credit to meet both the increasing operating expenditures and long term
investments in controlled water supply facilities), if they were to retain
their historical edvantage of higher yield per unit of area over large
farms even in the context of new technology.
To sum up, broadly two views may be distinguished in literature with
regard to the income distribution effects of green revolution among
producers: (i) new technology has widened the income disparities among
producers, since it is the large farmers who have adopted it to a far
greater degree (because of capital-intensive nature of new technology and
easy accessibility to inputs by large farmers) and therefore, the gains
from green revolution have gone disproportionately to large farmers, (ii)
new technology is fairly diffused among all the classes of farmers and new
technology being scale-neutral, the gains from it are proportionately
shared by them.
However, from the detailed review of empirical evidences at our
disposal, the following integrated view seems to be fair and realistic.
Green revolution has not been predominantly "a large farmer phenomenon",
although large farmers did take the initial lead, possibly due to their
comparatively better resource position, access to information,
accessibility to inputs, etc. But, small farmers did show a remarkable
tendency to catch up with the large farmers within a short span of time.

-21-
However, the pace and effectiveness with which this was achieved across the
regions (and crops) depended upon a set of supportive measures that was
offered to them in the infrastructural, institutional, economic spheres,
16etc. The latter qualification implied that the sheer virtue of new
technology being scale-neutral, though important, was not sufficient to
ensure that the gains would be partitioned proportionately among producers,
unless it was accompanied by a fair degree of equity in the distribution of
resources.
B. Tenancy and Adoption of MVs:
Whether or not tenancy acts as a handicap for introducing innovations
in farming has been debated in literature by many scholars offering their
own theoretical formulations. In a recent survey, Binswanger and
Rosenzweig (1981), after thoroughly discussing these various theoretical
propositions and studying empirical evidences come to the conclusion that
tenancy need not and would not retard innovations in farming. Indian
empirical evidences regarding the adoption of MVs by tenants seem to
support this conclusion.
The investigation by Mandal and Ghosh (1976) of farm households in the
districts of Burdwan (West Bengal), Shahabad (Bihar) and Sambalpur (Orissa)
conducted during 1972-73 and 1974 revealed that the participation in HYV
program was more or less equal among all sections of the farming community
irrespective of tenurial status (and the size of holdings).
Mishra and Tyagi (1972) in their study of Kota district of Rajasthan
found that the percentage of owners-cum-tenants was higher among the
adopters than among the nonadopters.

-22-
Lockwood et al. study (1971) observed that no significant difference
occurred as between the performance of the owners and tenants. If
anything, it appeared that the tenant farms had used on an average more
fertilizer per hectare than the owners. Mukherjee (1970) argued that the
similarity in adoption pattern between owner and tenant farmers was
because of the high potential that the MVs had for achieving substantial
higher yields which could more than compensate for the onerous terms of
tenancy.
Muthaiah (1971) in his analysis of AERC data for Thanjavur district
(Tamil Nadu) for the years 1967-69, found that the tenants did not seem to
lag much behind the owners either in the application of fertilizers or in
productivity of HYV paddy.
However, Parthasarathy and and Babu (1970) pointed out that it was
necessary to distinguish between "pure tenants" (cultivating only land
taken on lease) and "owner-tenants" (owners who add to their cultivated
area by leasing-in) for making a meaningful appraisal of tenancy vis-a-vis
adoption of MVs. In fact Parthasarathy and Prasad in their study (1978)
based on field investigation of a village in West Godavari (Andhra Pradesh),
mentioned earlier, found that the allocation between tenure and adoption
was significant at 5 percent level, indicating that owners had an edge
over tenants. (Likewise, in the application of relatively new inputs,
tenants revealed a lag and also used them in smaller quantities compared
to large farmers). This evidence of a negative relationship between
tenancy and adoption of MVs, shown by Parthasarathy and Prasad in their
rather limited study, may be taken to be more apparent than real for two
reasons. Firstly, in the Indian context, even the "pure tenants" do not
constitute a homogeneous group to draw any meaningful generalizations.
-23-
(For instance Mukherjee (1970a) pointed out that in Punjab, 57.1 percent
of the selected "pure-tenant-participants" in the HYV program had
operational holdings of 5 acres or less, while the remaining had operational
holdings ranging from 5 to 10 acres. In Tamil Nadu, on the other hand,
96 percent of the selected "pure-tenant-participants" had operational
holdings of 5 acres or less, in many cases the figures being 1 to 2 acres).
Secondly, as rightly argued by Binswanger and Rosenzweig in their above
mentioned survey, it was perhaps the limiting factors (capital constraint
etc.) applicable to small farmers that held good for tenants also (in the
village studied by Parthasarathy and Prasad) in adopting MVS rather than
the "tenancy" as such.
C. Green Revolution and Farm Income Inequality:
In support of the thesis that green revolution has (not) aggravated
the income disparities among producers, some extended exercises have been
made to study and compare the size distribution of farm income at two points
of time: (i) pregreen revolution period and (ii) postgreen revolution
period with a view to providing evidences to the role of new technology in
accentuating or narrowing the income inequality between the two distributions.
Studies made by Katar Singh (1973), Bardhan (1974), Junankar (1975), Saini
(1976), and Raju (1976), may be mentioned as being important in this
field of inquiry. While Bardhan, Junankar, and Saini have made use of
farm-level farm management survey data for selected districts in Punjab
and/or Uttar Pradesh, Maharasthra, West Bengal, Katar Singh and Raju have
taken farm-level data from the Bench Mark and Assessment Survey of IADP
districts of Aligarh (Uttar Pradesh) and West Godavari (Andhra Pradesh)
respectively.
-24-
Among various measures available to quantify the difference in
inequality between the two distributions, the most commonly used in these
studies have been, either singly or severally, concentration ratio,
standard deviation of the logarithms of incomes and coefficient of
17variation.
18The dispersion in data sources, sampling-design, areas studied and
time-reference, together with the conflicting findings emerging from these
studies fails to provide a solid basis for drawing any firm conclusion
with regard to the impact of new technology in accentuating or redressing
the farm income inequality. For instance Bardhan's analysis of 4
districts: Ferozpur, Muzaffarnagar, Ahmadnagar and Hooghly revealed, one
case each of clear increase and clear decrease in concentration ratio,
with two ambiguous cases of changes in the Lorenz curve. Junankar's study
of Ferozpur district revealed that there was a slight decrease in inequality
of farm business income between 1968-69 and 1969-70. Saini found that in
Uttar Pradesh there was some increase, though small -- in the inequality
of farm income distribution, whereas the magnitude of growing inequalities
was markedly high in Punjab. In contrast, Katar Singh's study concluded
that the farm income inequality declined in Aligarh in the period 1963-64
to 1968-69. Likewise was the case with West Godavari district between
1967-68 and 1970-71 as revealed in Raju's analysis.
Moreover, the method adopted in the studies cited above has been to
analyze data relating to "farms" rather than to "families" at two points
of time (with the exception of Junankar's study). In situations where
the two terms may not refer to identical entities, the analysis in terms
of "families" is likely to provide findings which are both more relevant
19and more readily interpretable. Besides these studies about the income

-25-
distribution effects of new technology among farm households are of
limited value as they are based on analysis of farm business income data,
which is not a comprehensive indicator of the income status of the farm
households. In addition to farm business income, it is meaningful and
important to take into account, as rightly noted by Junankar (1975), wages
earned outside the family farm.

-26-
Section 2
Green Revolution and Landless Laborers:
The nature of income distribution effects of green revolution on
(landless) laborers, through changes in their levels of employment, is
essentially interlinked with the direction of labor-using (saving) bias
in new technology. In order to examine the directional bias of new
technology with respect to labor employment, it is essential that the
employment effects of new seed-water-fertilizer-innovation be separated
2 0
from those of the mechanical innovations. This is obviously important
not only for understanding what has been happening but also for future
policy purposes, for, use of the growth-promoting innovations even though
accompanied by some of the labor-saving technical changes may still be a
21basically distinct and independently viable process.21 In point of fact
much of the controversy and debate that surrounds the employment effects
of green revolution arises from the failure to separate out the employment
effects of green revolution from those of mechanical innovations.
Sidhu (1974a) by making use of farm-level cross section data of old
and new varieties of wheat for the year 1967-68 from Ferozpur district of
Punjab (150 farms spread over 15 villages) indicated a 25 percent shift in
the labor demand function on farms growing HYVs of wheat.
Robert Herdt (1980) assembled labor use data on farms growing MVs and
TVs of rice from a number of empirical studies undertaken in Asia (a
majority of them referring to India) and noted that the labor use in the
cultivation of MVs as compared to TVs was "considerably higher".
Chinnappa's (1977) study relating to MVs of rice in North Arcot
reported that the increase in demand for hired labor from cultivation of
-27-
HYV paddy as compared to TV paddy was 22 percent and for nonfamily labor
(attached + hired) was 28 percent. In absolute terms every acre that
went over to HYVs from TVs of paddy generated an additional demand for
17.1 person days of all types of labor.
Short of quoting a large number of individual investigations that
looked into employment effects of new technology we prefer at best to
borrow the findings from Bartsch's systematic and careful study (1977),
based on extensive literature on alternative technologies and techniques
in Indian and other Asian countries' production systems of wheat and rice.
Bartsch showed that the switchover from traditional to HYV technology
resulted in higher labor input, (i) per unit of cropped area over a
cropped season (essentially due to increased levels of inputs used and
yield effects), (ii) per unit of cultivated area over a year (due to
greater utilization of labor per unit of cropped area and/or higher
cropping intensity), provided either the traditional techniques were
retained or the shift in cultivation techniques was limited to
intermediate techniques only. (Traditional techniques were defined as
those that depended mainly on unassisted human or human and animal power,
along with simple traditional implements, for most of the field operations.
Intermediate techniques meant substituting improved implements and
equipment for the traditional ones but retaining the same power sources).
It is clear, therefore, that the impact of new technology as such, on
labor employment is not in the direction of labor-saving, but labor-using.
Apart from the prospects of increase in the volume of employment, due
to green revolution, it is significant to note the changes, if any, in the
composition of farm labor (in terms of unpaid family labor and hired
labor).

-28-
Empirical investigations by Chawla et al. (1972), Garg et al. (1972),
Singh et al. (1972), Rathore and Subramanyam (1972) and Chinnappa (1977),
indicate, in the context of new technology, a greater increase in the use
22of hired labor than in the use of family labor.2 The dominant reason for
this trend is the requirement to complete agricultural operations in the
context of new technology within a short period of time. This feature of
increased employment of hired labor than of family labor is meaningful for
"a swelling strength of landless laborers, in the sense of providing them
with additional employment than otherwise would have been the case without
green revolution".
Additional support to the finding that the effect of green revolution
on labor employment (and hence their income status) has been favorable may
be sought, through looking into the trend in real wages of agricultural
laborers in the country in the pre and postgreen revolution period. 2 3
There are mainly two sources of data: (i) Agricultural Wages in India
(AWI), annually published by the Directorate of Economics and Statistics,
Ministry of Agriculture and Irrigation, Government of India, and (ii)
National Sample Survey (NSS) data from Rural Labor Enquiries in 1950-51,
1956-57, 1963-64 and 1970-71, which have been utilized by researchers to
study the trend in real wages of agricultural laborers. Differences in
the concepts, coverage and methods of collection of agricultural wage
data in these two sources together with differences in the time period
chosen for studying the trends have led the researchers to come out with
conflicting results. For important studies in this field of inquiry see
Bardhan (1970, 1973), Gough (1971), Krishnaji (1971), Herdt and Baker
(1972), Jose (1974) and Deepak Lal (1976). Deepak Lal's study is
particularly relevant and useful for our purpose, for it reviews the

-29-
studies of other researchers, draws attention to their various limitations
and chooses "relatively more reliable" NSS data source for its own analysis.
According to Deepak Lal's study, real agricultural wages rose in India
during the period 1956-57 to 1970-71. However, in the first part of this
period, i.e. 1956-57 to 1964-65, real wages were constant or fell in 8
out of the 15 states of India; but in the following period: 1964-65 to
1970-71 (which can be termed as "green revolution" period) they rose
sufficiently to offset the earlier decline. He concluded that the demand
inducing effects of agricultural growth did have a positive effect on real
wage rates.
The direct effect of output-increasing green revolution as such on
agricultural employment (per unit of area) and hence wage rates has to be
nothing but favorable has been made an emotional issue in literature by
mixing it up with other questions like (i) whether or not the increased
demand for agricultural labor has kept pace with the increase in supply
of labor, (ii) whether or not the rise in real agricultural wages has
been adequate to meet the increased cost of living of agricultural
laborers, and to assure a fair share of the output growth in favor of
the agricultural laborers, etc. While these related questions are
extremely important from the point of view of appropriate policy measures,
nevertheless, they seem to have clouded the vision in so far as the
assessment of the direct effects of green revolution on employment and
wages of agricultural laborers is concerned.
-30-
Section 3
Factor Shares and Green Revolution:
While discussing the changes that have occurred in the factor shares,
with a switch over from TVs to MVs, critics often do not make it clear in
literature whether they are using factor shares either with respect to
"value of output" or with respect to "value added in output". It is
important to retain this conceptual distinction while interpreting the
changes in factor shares due to MVs, for the factor shares do vary in
magnitude, if not in direction, depending on the concept of output used.
On the basis of data collected by various AER centers, PEO and
individual researchers, Mellor (1976) demonstrated effectively that the
incremental share of hired labor, in an increased gross production with
switch to HYV was, in the majority of the cases (12 out of 17 cases),
between 5 and 15 percent only. In other words the bulk of the share in
the increased production due to MVs went to other inputs: principally land
and capital. As a result the "absolute disparities" in income between
laborers on the one hand and owners of land and capital on the other got
considerably widened.
Supporting evidence to Mellor's findings may be seen in C. H. H. Rao's
(1975) analysis of farm management survey data for Ferozpur as between the
local variety and the HYVs of wheat and rice respectively for the period
1968-70. He observed the tendency for the labor's share in total output
to decline with the switch to HYVs from local varieties. Although the
absolute labor cost (including family labor at market rates) per acre was
considerably higher for HYVs of wheat and paddy than for the corresponding
local varieties, the increase in both gross and net output (net output
-31-
defined as factor income after deducting the material costs) with the
switch over to HYV from local variety was much larger, resulting in a
reduction in the relative share of labor. He showed further that, with
the switch to HYV from local variety, there was a steep decline in the
relative share of land also, but the "combined share" of rent, interest
and profit income rose significantly. As a result land-owner farmers
operating with hired labor gained absolutely as well as relatively,
whereas landless laborers gained somewhat absolutely, but lost in relative
terms.
The evidence for the relative share of hired labor in total output
to decline with the switch to MVs from LVs may also be found in the study
of Parthasarathy and Prasad (1971). Their study of cost pattern of hired
labor in the cultivation of local and IR-8 paddy in the East and West
Godavari districts of Andhra Pradesh for the year 1968-69, revealed that
the absolute share of hired labor per acre was higher for HYV paddy
compared to local paddy, but it's relative share in net or gross value
of output of HYV was smaller owing to the greater yield per acre.
Analysis by Chinnappa and Silva (1977, p. 210), relating TVs and MVs
of paddy in North Arcot district, showed that the total wages paid per
unit of land for HYVs was about 33 percent higher than for TVs; this was
mainly due to the increase in employment of hired labor for HYV harvesting
and threshing. However, the 33 percent increase earned from HYV cultivation
by agricultural laborers compared poorly with the increase of nearly 76
percent in net income earned by cultivators. In absolute terms, the
difference in increased earnings was more striking. An average cultivator
household having 1.5 hectare of land, and growing paddy on about 1 hectare
of it could increase its net income from paddy by Rs. 928 -- if it switched
-32-
from TVs to HYVs. The average landless agricultural labor household, in
the survey area, had an income of Rs. 836 and the increase in its income
because of HYV cultivation would be Rs. 276: that is just 30 percent of
the increase earned by the average cultivator household.
It can hardly be disputed that the empirical evidences conclusively
show that the switch over from local to MVs widens the absolute income
gap between owners of land and capital on the one hand and the landless
laborers on the other. But it is important to appreciate that this has
been essentially the result of an interaction between "augmentation effects"
of new technology (that enables the efficient use of all factors of
production including labor, thereby, bringing about a reduction in every
input requirement per unit of output) and the nature of supply-elasticities
of these factors of production.
Despite this observed tendency of absolute income gap widening between
owners of land and capital on the one side and landless laborers on the
other, with a switch to MVs from TVs, the crucial point that is often
overlooked and which needs to be stressed is that MVs through prospects of
an increased demand for labor per unit of area makes an improvement in the
absolute income status of landless laborers a plausible proposition. It
is quite reasonable to presume that in the absence of MVs and given the
high elasticity of the supply of labor (due to population pressure and/or
in-migration into green revolution areas) the income of landless laborers
would have degenerated further. The question of how best to narrow the
gap in the absolute income levels between land-and-capital-owners and
landless laborers falls into the realm of fiscal measures, rural works,
wage regulations, etc., by the government.

-33-
Section 4
Green Revolution and Regional Disparities:
Of various dimensions relating to the income distribution effects of
green revolution, perhaps the least controversial is one of its impact on
income differentials among regions. It is widely held view that differentials
in physical and institutional infrastructure development among the regions
reinforced by the product-resource-and location-specificity characteristics
of MVs have benefited some regions more than the other in terms of
increased productivity. Analyses carried out, on the basis of secondary
data, by C. H. H. Rao (1975), Staub and Blase (1974), Krishnaji (1975) and
Bhalla and Alagh (1979), lend support to these contentions.
C. H. H. Rao observed that the inter-state disparity in productivity
per hectare of major food crops: rice, wheat, bajra and maize,
experiencing technological change increased between 1964-65 and 1970-71
(although the variability in output of major crops did not increase due to
the compensatory changes in area allocated to these crops). Likewise,
inter-state variation in the per-capita output of foodgrains as a whole
increased because crops like wheat and bajra, which experienced a
breakthrough in output showed higher variability than other crops. These
trends, according to Rao, were associated with increasing inter-state
disparities in the supply of institutional credit per hectare and the
percentage of net sown area irrigated.
Staub and Blase noted that 76 percent of the increase in wheat
production in India which increased by 63 percent between 1965 and 1970 was
restricted to two states only: Punjab and Uttar Pradesh. They pointed out
further that the two states Punjab and Uttar Pradesh, and Tamil Nadu which
experienced the most rapid rate of adoption of HYV wheat and rice
respectively, and sustained the largest increases in farm production also
had the largest portion of farmlands irrigated of the states reported.

-34-
Krishnaji's study revealed that the overall inequality -- as
reflected in the coefficient of variation in inter-state differences in
per capita production of foodgrains -- hardly changed between 1950-53 and
1960-63, but sharply increased between 1960-63 and 1970-73. This was
entirely due to the rise in per capita production in wheat areas. The
regional averages of per capita production for the nonwheat areas hardly
changed during the sixties, remaining around 170 kg. per annum. By
contrast, the per capita production in the wheat region increased from
216 kg. in 1960-63 to 329 kg. in 1970-73. Krishnaji noted that this was a
highly aggregative, nevertheless suggestive picture of the regional
variations which emerged on the scene, owing to the green revolution.
A study by Bhalla and Alagh, based on triennium average district-wise
figures of area, and output for 19 major crops during 1962-65 and 1970-73
revealed that rapid agricultural growth was confined to 17 percent of the
districts in India. Of the 282 districts, only 68 accounting for just
18.9 percent of area recorded a growth rate exceeding 4.5 percent, 102
districts had a growth rate between 1.5 and 4.5 percent, and 62 a rate
between 0 and 1.5 percent. In addition there were as many as 70 districts
accounting for 26.78 percent area that recorded negative growth rates.
What is more significant is that high growth rates were significantly
associated with high use of modern inputs.
Although there is no one to one correspondence between the growth
in MVs area on the one hand and growth in the use of modern inputs on
the other, it may be reasonable to presume a high correlation between
them. If so we may infer that the relative performance of districts in
agricultural growth was, among others, a function of growth in area and
yield of MVs, i.e. green revolution.
-35-
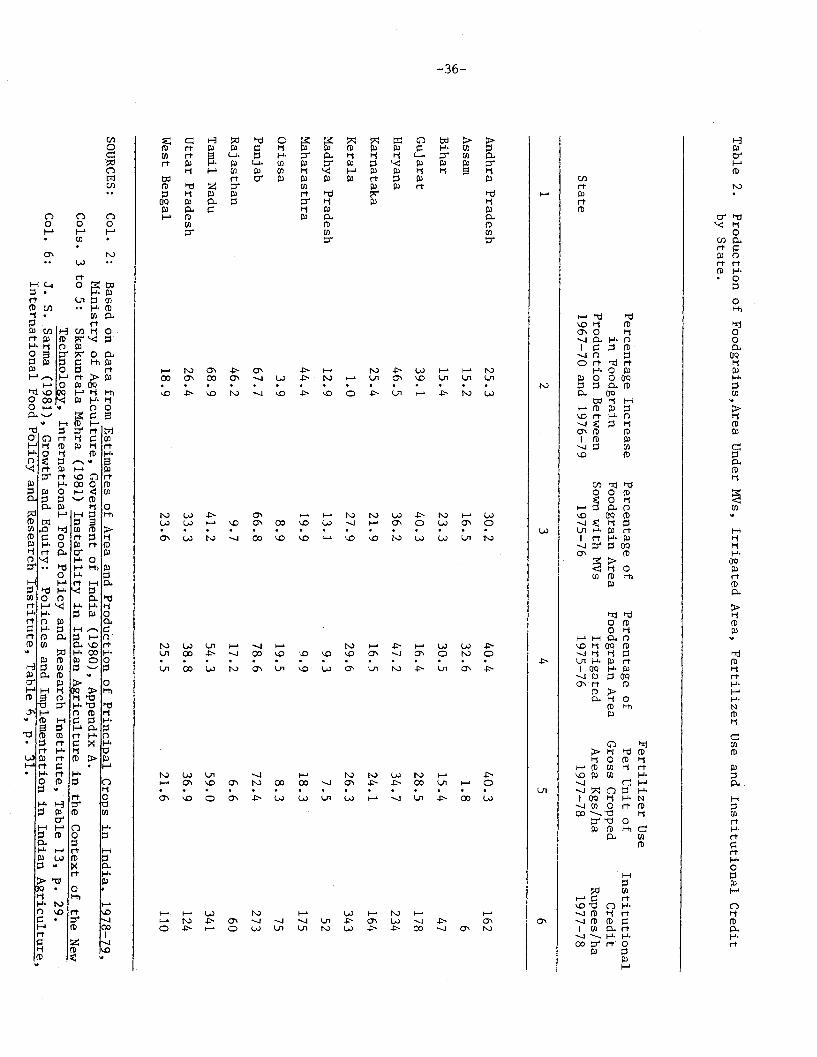
Broadly speaking, it may be seen from Table 2 (although the crop
references and years in columns 2 to 6 are not strictly comparable) that
states which recorded comparatively large increases in foodgrain
production, between 1967-70 and 1976-79, were the ones which in general had
comparatively large proportions of their foodgrain area irrigated as well
as sown with MVs. Also these states fared better in respect of fertilizer
use and availability of credit. This aggregate picture at the state-level
is indicative of the regional disparities that have emerged due to an
interaction between growth in physical and institutional infrastructure
on the one hand and growth in MVs on the other.
The study by Easter, Abel and Norton (1977) gives strong support to
the impact of physical and institutional infrastructure on the adoption
of MVs and new inputs,and thereby stresses its' importance for growth in
agricultural output. Using production functions to measure the
contribution to agricultural output of infrastructure and the quantity and
quality of inputs, the study showed that in the wheat region (comprising
73 districts in the states of Punjab, Haryana, Uttar Pradesh, Madhya
Pradesh and Rajasthan), continued increases in the quantity and quality of
irrigation, the introduction of new varieties were promising sources of
output growth. For the eastern rice region (comprising 69 districts in
Eastern Uttar Pradesh, Bihar, West Bengal, Orissa and Eastern Andhra
Pradesh), increases in irrigation quality and new varieties were
important sources of output growth.
-36-
Cl)0
o 0 o
H H H* CO
M (_n 0 0 ED en f H o, (DC *''0 CD
rt
rt0 03 (D 7 -4
,3H* F e n
0 , p 0 0 CL0 t3 * - w
S 0 rt,- 1- rt A3
o 0 A) OQ- Q N I-h0 00 r <o H. r
S (D I-
o 0' rt " COH - (CD I rt
S0 (D
S . 00 0 D0) 0'.OOCnS0 - < C
CL03 3 0
co co (D(D i0 o I-!
'-<rt C "
0 HH' jM - rt H CL
CO 0 - Lrt H H iH. hHe H. 03 0rt 0 0 &(D CO C O r' t
H 00 HW m 03 0
0,. C/)D)03 P ( 0 D1.7 P3 > 0**' CCH >D O >E l 0
S-O 0 m 1imD H 0 H'
(D Cco r HtC-0 rt 0 x H'rt HFi '-I
WD 03 rt (D > P
H' rt H*H
rt 0
S 03 D CO
SL H0H* ' rt iM-
* '* rt -'*
HO C 0
P1 CD 00
D ^
u H
mD rt 0CO rt 9rt 0 H' 0
1M H COtW rtCD d 2 0 "
H (Cm DCO
hdc2.03O
H- : r CH' 03 ) 03 P1CO P1 < H (-t
0 003 03 03 03 rtCO03 0rP
CL(DCOEn
0
(-1.
P1
m > >
0"
P1
(DCO:7
a'- 3 ON .>* ON 4> i-» N~3 4> U^J h-* i-' N300 ON 00 O "J U -> U LODn a ON D LuU' Ln
.O 4>^ ^O N) ^ .O 4>^ ^O 04 UL i-' 4>^ NJ j
rN) L) 4 O' i-' 9' - N N) N) W 4> p ' LWWO "ol-* ON OM %,. WJ -,j * ON O ON 0mO U -t1 a' 0o O -O ) O i- a' 0 0aw Ln '0
t-0 W Ln -- f 1 s i-P w w -r >
L^ ~ L 01 0 JO 0 L^ O ^O ON H ON 1 Os O
a' U) N 0 L O LnO i-' H O h 0 LO U) ) U' N
Ul oo -P --j 00 LO % 0 .0 LO a' -_j a' 0 ) N 0
;o 0 0 ) N) a' U' 0 U) a' ' N) 4> ' a' 4
fN) L4) U' -1i :' N) N) U) N[,, 4
ON ' 0 ON a' N 000 0 - a'r- -P L 00 : 0
P- ) O o (O NN) ONi0C : 0 U' U' Ln t NJ 4 _r>4 _> 00 -_ 'ON N)
I.1-1
ON
Cn
CP)rt(D
I'»-*ON
CD
e
cn0
rtCO4
HI.
O10
CL1m0H*
00
OQ
H'
CD
(D
rD0rt
0(
H
OQ(D
MC
0
CD0
0 (D0 4
I OQ H' 03-I 03 03O . t (D
CD >
03
0 0 P
(DMD
-I-
S CO 0 rt D00 "'-0 P1
0 "003 CD ht (D
CD
*-J4 (D( fD
I CO
00 7pa
0 H'P rt(D -0. rt
r't 0
H--
(D
H
0
CD
• o0rtC
(D H'
0* O
Ol
0
00Cl)
r-P
H
CO
N(D
C"rD
H0
rt
H'
CO
CQ
H'
H-
-37-
Conclusion
A review of empirical evidences on the adoption pattern of MVs in
India suggests a wide diffusion of MVs among farmers, over time, irrespective
of farm size and tenurial status. This unmistakably refutes the hypothesis
that green revolution in the country has been predominantly a large farmer
phenomenon and that the gains from it have gone disproportionately or
solely to large farmers. But the pace of diffusion of MVs of a given crop
among farmers, across the regions and over the years, has certainly
revealed a tendency to be closely interlinked with the nature and level of
their (regions) development in physical and institutional infrastructure.
For instance we may recall the poor coverage of MVs in a few of the primarily
wheat growing areas of Haryana in marked contrast to universal diffusion
of MVs of wheat in Punjab. In areas where the relative access to product
and factor markets has been unequal among the farmers, due to various
economic, social and political factors (as was the case, for instance,
with the village in Andhra Pradesh studied by Parthasarathy and Prasad),
the gains from new technology have been disproportionately shared by the
large farmers. But it is important to recognize that the regressive impact
on income distribution in such areas, which is indeed real and serious,
is not caused/accentuated by the new technology as such, but by the
nonneutrality of their economic, social and political institutions. This
"diagnostic perception" is crucial to judge the income distribution effects
of new technology in its proper perspective and also to suggest appropriate
policy measures to remedy the situation.
Being technically scale-neutral, the relevance and importance of
new technology in improving the income-status of the small farmer need
-38-
not be over emphasized. "... the HYV technology has helped to lower the
threshold of viability of small farms. On certain conditions being
fulfilled, a two-acre farm has now hope of becoming viable with the new
technology. This is not a small gain for a country whose agriculture will
continue to be dominated, at least in a forseeable future, by the small
farm economy".24 It should be noted that new technology with its
characteristics of high yield potential and scale-neutrality has offered
a possibility to break the vicious circle in which small farmers are caught
both with regard to "deficiency of investment" and "riskiness of investment".
"... The (small farm) sector is considered unproductive and therefore,
sufficient investment is not made in it. But it remains unproductive
because sufficient investment is not made in it in spite of the fact that
substantial productivity and profitability potentials exist and remain
unexploited.... Riskiness of small farm investments is mainly due to yield
instability. Yield instability in turn is mainly due to inadequate inputs
of HY seeds, irrigation, water control, pest control and fertilizers and
the absence of multiple cropping. Optimal investments in those inputs
can stabilize yields. Again, therefore, we observe investment remaining
inadequate because of its riskiness and riskiness remaining high because
of inadequate investment. Only a big investment thrust with a matching
technological, extension and delivery back up, can break the vicious
circle".2 5
With regard to the "pure effect" of new technology (devoid of
mechanical innovations) on labor employment and (hence on wage rates)
empirical evidences in India do reveal a positive influence, although
there may be differences about the quantum of additional employment
generated, and the adequacy or otherwise of the increase in wage rates
-39-
to keep pace with the increase in cost of living, etc. Through prospects
of an increased demand for labor, new technology has undoubtedly exerted
a favorable impact on the absolute income status of the landless laborer,
notwithstanding the fact that the owners of land and capital have
relatively gained more than the laborers in the increased production due
to MVs. (The latter result with MVs, which emerges essentially due to an
interaction between "augmentation effects" of new technology -- requiring
less of every input per unit of output -- and peculiar supply elasticities
of factors of production: land, labor and capital, is often misconstrued
to mean that there is labor-saving bias in new technology).
As regards the impact of new technology on regional income differences,
empirical exercises by researchers have shown a widening effect. This
result has been due to an interplay between, (i) differentials in levels
of physical and infrastructural development of regions and (ii) product-
location-specificity characteristics of new technology. However, in the
long run, if MVs are broad based, if the differentials in development of
physical and institutional infrastructure among the regions are narrowed
and if the gains from new technology in the favored regions are shared by
other regions (through appropriate government action), it is possible to
visualize an altogether different scenario Herein lies both an
opportunity and a challenge.

-40-
Footnotes
T. W. Schultz (1978), p. 6.
See, among others, Wolf Ladejinsky (1969), Walter P. Falcon (1970),
Francine R. Frankel (1971), Keith Griffin (1974), B. Sen (1974).
Another dimension that is important but has gone untouched in this
review is the distribution of gains of green revolution between producers
and consumers, (i) partly because few Indian empirical studies exist and
(ii) partly because the treatment of this aspect involves, among others,
analysis of government policies on agricultural prices, procurement,
distribution, etc., requiring a great deal of time and effort.
Crop-wise the picture was as follows:
Percentage of Area Sown With HYVsCrop in Total Area of the Crop
Rice 38.8Wheat 72.1Jowar 18.4Bajra 23.6Maize 20.5
SOURCE: Adapted from Shakuntala Mehra, Instability in Indian
Agriculture in the Context of the New Technology. International Food
Policy Research Institute, July 1981. Appendix 2, Table 19, p. 40.
In this context, skepticism of Farmer about the accuracy of Indian
official statistics may, however, be noted: "Most seriously, Nanjamma
Chinnappa's meticulous work on the North Arcot Survey ... indicates
beyond any reasonable doubt that the official statistics for the adoption
of HYVs in North Arcot district are grossly inflated, those for the areas
under HYVs by a factor of at least 3". B. H. Farmer (ed.) Green Revolution?
Westview Press, Denver, Colorado, 1977, p. 414.

-41-
5 I
The terms "green revolution", "new seed-water-fertilizer-technology",
"new technology" are used in the text interchangeably. Likewise is the
case with modern varieties (MVs) and high yielding varieties (HYVs).
For an interesting account of geographical bias, etc., in Indian
empirical evidences see John Harris, in B. H. Farmer (ed.), op cit., ch. 4.
See B. Dasgupta (1977), pp. 184-186.
8For a detailed discussion, see B. Dasgupta (1977), ch. 3.
There are indeed definitional problems in identifying the farmers as
being "large" or "small" and also problems in comparing them across the
regions. However, these problems can be overlooked if we take the broad
view for our purpose that by "small" we mean those who are on the lower
side of the land ladder and by "large" we mean those who are on the upper
side of the land ladder in a given region.
0Farmers in each village were ranked by size of operational holding
and the list was divided into ten equal groups. The corresponding decile
groups for all villages surveyed for the relevant crop in a state were
aggregated.
11It is curious to note that many researchers who cite Lockwood et al.
study in support of the hypothesis that green revolution has been mainly
a large farmer phenomenon conveniently ignore these major qualifications.
12See B. Dasgupta (1977, p. 227).
13For the exposition of this point, see S. S. Bhalla (1979; note 24,
p. 239).
The following discussion on this issue has benefited from R. A.
Berry and W. R. Cline (1979), ch. 4, pp. 106-116.

-42-
5Also study by Chattopadhyay and Rudra revealed that in selected
districts in 7 out of 10 Indian states (data ranging from 1962 to 1973)
output (of all crops) per acre was negatively associated with farm size.
For two of three others (Punjab and West Bengal), the relationship was
significantly negative in the mid-50's, went positive as HYVs began to
spread and again went negative in the third of the (successive) recent
years for which data were available.
SOURCE: Adapted from Michel Lipton (1978), "Inter-Farm, Inter-
Regional and Farm-Nonfarm Income Distribution: The Impact of the New
Cereal Varieties". World Development, Vol. 6, No. 3, p. 324.
16Vyas makes this point succinctly as follows: "... Depending upon
the institutional factors and the irrigation base of each state, the new
technology has spread in varying degree and content in many parts of the
country. Thanks to a wide network of canals and a rapid multiplication
of tubewells in recent years, very largely facilitated by the successful
completion of consolidation of holdings, flow of more institutional
finance and the government drive for rural electrification, the Punjab
state adopted the new farm technology far more quickly and comprehensively
than most other states of India.... The institutional handicaps are found
to be relatively low in Punjab.... In other areas, especially small farms
are highly restrained by these institutional handicaps to perform, unlike
large farms...". V. S. Vyas in Foreward to G. K. Chadha (1979), Production
Gains of New Agricultural Technology, Publication Bureau, Punjab
University, Chandigarh.

-43-
17For a persuasive argument about the limitations of these measures,
as regards their informativeness and ability in monitoring changes in land
and income distribution, see M. L. Dantwala and V. M. Rao, "Inequality of
Farm Income: A Comment". Economic and Political Weekly, May 18, 1974,
pp. 801-803.
18"Some attempts have recently been made to present empirical evidence
of the growing inequalities in farm incomes among different strata of farm
households at two points of time.... However, insufficient appreciation
of the difference in the sampling design of farm management surveys at the
two points of time has rendered at least some of these analyses and results
of doubtful validity...". G. R. Saini "Green Revolution and Disparities in
Farm Incomes -- A Comment," Economic and Political Weekly, Nov. 3, 1976,
pp. 1804-6.
19See Dantwala and Rao, op cit., p. 803.
202The need for maintaining this vital distinction is discussed in
Hayami and Ruttan (1970).
21K. Bardhan (1977, p. 1063).
2222On the basis of this finding, it is possible to argue that MVs will
have a discriminating effect on small farmers (as compared to large farmers)
because the cultivation of MVs by small farmers enhances their dependence
on hired labor, causing significant additions to operating costs, which
small farmers may not be able to foot in out of their own resources. This
argument, adds an urgency to the mounting up of institutional finance for
small farmers. It is important to note that higher net returns from HYVs
even on small farms offset the additional costs that could be incurred by

-44-
them. In this context, the empirical finding by Chinnappa and Silva is
worth recalling: "The increase in net income per unit of land from
cultivation of HYVs was of the order of 76 percent.... Such increases in
net incomes, even when the yield rates of HYVs were far below potential,
when the recommended package of inputs was not being applied in full and
when the market prices were lower than those for TVs suggests that
substantial increases in incomes of cultivators are possible from the
cultivation of HYVs. The scale-neutrality of HYVs will ensure similar
increases in net incomes of all cultivators, big and small...". Chinnappa
N. and W. P. T. Silva (1977, p. 207).
232However, to the extent the income status of a landless laborer
depends not only on his wage rates, but also on the quantum of employment
in a given year, and also to the extent increases in prices of wage goods
consumed by the laborer are not accompanied by compensating increases in
his wage rates (or are accompanied with a lag), enough caution needs to be
exercised in interpreting the interrelationship between trends in wage
rates and income status of landless laborers.
M. L. Dantwala (1978), p. 1300
2 Raj Krishna (1979), p.
-45-
References
1. Bardhan Kalpana (1977), "Rural Employment, Wages and Labor Markets
in India: A Survey of Research - II," Economic and Political
Weekly, July 2, 1062-1117.
2. Bardhan Pranab K. (1970), "'Green Revolution' and Agricultural
Laborers," Economic and Political Weekly, Special No., July,
1239-1246.
(1973), "Variations in Agricultural Wages: A Note,"
Economic and Political Weekly, May 26, 947-950.
(1974), "Inequality of Farm Incomes: A Study of
Four Districts," Economic and Political Weekly, Annual No.,
February, 301-307.
3. Bartsch, W. H. (1977), Employment and Technology Choice in Asian
Agriculture, Praeger Publishers, New York-London.
4. Berry, R. A. and W. R. Cline (1979), Agrarian Structure and
Productivity in Developing Countries, The Johns Hopkins University
Press, Baltimore and London.
5. Bhalla, G. S. and Y. K. Alagh (1979), Performance of Indian Agriculture:
A District-Wise Study, Sterling Publishers, New Delhi.
6. Bhalla, S. S. (1979), "Farm Size, Productivity and Technical Change in
Indian Agriculture," Appendix A in R. A. Berry and W. R. Cline
Agrarian Structure and Productivity in Developing Countries, The
Johns Hopkins University Press, Baltimore and London.
7. Binswanger, H. P. and M. Rosenzweig (eds.), (1981), Contactual
Arrangements, Employment and Wages in Rural Labor-Markets in Asia,
(mimeographed).

-46-
8. Chawla, J. S., S. S. Gill and R. P. Singh (1972), "Green Revolution,
Mechanization, and Rural Employment: A Case Study in District
Amritsar," Indian Journal of Agricultural Economics, Vol. XXVII,
No. 4, Oct.-Dec., 198-206.
9. Chinnappa Nanjamma (1977) in B. H. Farmer (ed.), Green Revolution?,
Westview Press, Boulder, Colorado, ch. 8.
10. Chinnappa Nanjamma and W. P. T. Silva (1977) in B. H. Farmer (ed.),
Greenview Revolution?, Westview Press, Boulder, Colorado, ch. 14.
11. Chowdhury, B. K. (1970), "Disparity in Income in Context of HYV,"
Economic and Political Weekly, Review of Agriculture, September,
A90-A96.
12. Dantwala, M. L. (1978), "Future of Institutional Reform and
Technological Change in Indian Agricultural Development,"
Economic and Political Weekly, Special No., August, 1299-1306.
13. Dasgupta Biplab (1977), Agrarian Change and the New Technology in
India, Geneva.
14. Desai, G. M. (1978), Cultivators' Experience of High Yielding Varieties
of Cotton: A Micro-Study in Gujarat, IIM, Ahmedabad (Monograph
No. 77).
15. Easter, K. William, Martin E. Abel and George Norton (1977), "Regional
Differences in Agricultural Productivity in Selected Areas of
India," American Journal of Agricultural Economics, May, 257-265.
16. Falcon, Walter P. (1970), "The Green Revolution: Generations of
Problems," American Journal of Agricultural Economics 52,
December, 698-710.
17. Frankel, Francine R. (1971), India's Green Revolution: Economic Gains
and Political Costs, Princeton University Press, Princeton, New
Jersey.
-47-
18. Garg, J. S., Om Prakash and H. L. Srivastava (1972), "Impact of
Modern Technology on Rural Unemployment," Indian Journal of
Agricultural Economics, Vol. XXVII, No. 4, Oct-Dec., 206-210.
19. Gough, James W. (1971), "Agricultural Wages in Punjab and Haryana,"
Economic and Political Weekly, Review of Agriculture, March,
A19-A20.
20. Griffin, Keith (1974), The Political Economy of Agrarian Change:
An Essay on the Green Revolution, Harvard University Press,
Cambridge, Massachusetts.
21. Hayami, Yujiro and V. W. Ruttan (1970), "Factor Prices and Technical
Change in Agricultural Development: The U.S. and Japan, 1800-
1900," Journal of Political Economy.
22. Herdt, Robert W. (1980), "Changing Asian Rice Technology: Impact,
Distribution of Benefits and Constraints," (mimeographed).
23. Herdt, Robert W. and E. A. Baker (1972), "Agricultural Wages,
Production and the High Yielding Varieties," Economic and Political
Weekly, Review of Agriculture, March, A23-A30.
24. Jose, A. V. (1974), "Trends in Real Wage Rates of Agricultural
Laborers," Economic and Political Weekly, Review of Agriculture,
March 30, A25-A30.
25. Junankar, P. N. (1975), "Green Revolution and Inequality," Economic
and Political Weekly, Review of Agriculture, March, A15-A18.
26. Krishna, Raj (1979), "Small Farmer Development," Economic and
Political Weekly, May 26, 913-918.
27. Krishnaji, N. (1971), "Wages of Agricultural Labor," Economic and
Political Weekly, Review of Agriculture, Sept., 25, A148-A151.

-48-
(1975), "Inter-Regional Disparities in Per Capita
Production and Productivity of Foodgrains: A Preliminary Note on
Trends," Economic and Political Weekly, Special Number, August,
1377-1385.
28. Ladejinsky, Wolf (1969), "The Green Revolution in Punjab -- A Field
Trip", Economic and Political Weekly, Review of Agriculture, June
28, A73-A82.
(1969), "The Green Revolution in Bihar: The Kosi
Area -- A Field Trip," Economic and Political Weekly, Review of
Agriculture, September 27, A147-AI62.
29. Lal Deepak (1976), "Agricultural Growth, Real Wages, and the Rural
Poor in India," Economic and Political Weekly, Review of
Agriculture, June, A47-A60.
30. Lockwood, Brian, P. E. Mukherjee and R. T. Shand (1971), The High
Yielding Varieties Program in India - Part I, The Planning
Commission of the Government of India and the Australian National
University, Canberra.
31. Mandal, G. C. and M. G. Ghosh (1976), Economics of the Green
Revolution: A Study in East India, New York: Asia Publishing
House.
32. Mellor, John W. (1976), The New Economics of Growth, Cornell
University Press, Ithaca and London, ch. 4.
33. Mencher, Joan P. (1974), "Conflicts and Contradictions in the Green
Revolution: The Case of Tamil Nadu," Economic and Political
Weekly, Nos. 6, 7 and 8, pp. 309-322.
34. Mishra, V. N. and D. S. Tyagi (1972), "An Economic Analysis of the
High Yielding Varieties of Wheat: A Study of Kota District,"
Arthavikas, January, 118-130.
-49-
35. Mukherjee, P. K. (1970), "The HYV Program: Variables that Matter",
Economic and Political Weekly, March 28, A15-A22.
(1970a), "The HYV Program: Variables that Matter --
A Reply", Economic and Political Weekly, Dec. 5, p. 1980.
36. Muthaiah, C. (1971), "The Green Revolution: Participation by
Small Versus Large Farmers," Indian Journal of Agricultural
Economics, Jan-March, 53-66.
37. National Council of Applied Economic Research (1978), Fertilizer
Demand Study: Interim Report, Vols. 2-6, New Delhi.
38. Parthasarathy, G. and D. H. Babu (1970), "HYV Program: Variables
that Matter -- A Comment," Economic and Political Weekly,
June 10, p. 986.
39. Parthasarathy, G. and D. S. Prasad (1971), "Season-Wise Progress of
High Yielding Varieties in Andhra-Pradesh: Role of Economic
Variables," Economic and Political Weekly, Review of Agriculture,
Sept. A117-A122.
(1978), "Response to the Impact of New Rice
Technology by Farm Size and Tenure - Andhra Pradesh, India," in
Interpretative Analysis of Selected Papers from Changes in Rice
Farming in Selected Areas of Asia, IRRI.
40. Program Evaluation Organization, Planning Commission, Government of
India and The Australian National University (1976), The High
Yielding Varieties Program in India: 1970-75, Part II.
41. Raju, V. T. (1976), "Impact of New Agricultural Technology on Farm
Income Distribution in West Godavari District, India," American
Journal of Agricultural Economics 58:2, 346-350.

-50-
42. Rao, C. H. H. (1975), Technological Change and Distribution of Gains
in Indian Agriculture, Macmillan Co. of India, New Delhi.
43. Rathore and Subramanyam (1972), "Farm Employment and the Green
Revolution in Rajasthan," Indian Journal of Agricultural Economics,
XXVII, No. 4, p. 233.
44. Saini, G. R. (1976), "Green Revolution and the Distribution of Farm
Incomes," Economic and Political Weekly, Review of Agriculture,
March, A17-A22.
45. Schluter, M. and J. W. Mellor (1972), "New Seed Varieties and the
Small Farm," Economic and Political Weekly, March, A31-A38.
46. Schultz, T. W. (1978), "On Economics and Politics of Agriculture,"
in T. W. Schultz (ed.), Distortions of Agricultural Incentives,
Indian University Press, Bloomington-London.
47. Sen Bandhudas (1976), The Green Revolution in India: A Perspective,
New Delhi, Wiley Eastern.
48. Sidhu (1974), "Relative Efficiency in the Wheat Production in the
Indian Punjab," The American Economic Review 64, September 742-51.
(1974a), "Economics of Technical Change in Wheat Production in
Indian Punjab", American Journal of Agricultural Economics 56,
Vol. 2:217-226.
49. Singh Katar (1973), "The Impact of New Agricultural Technology on
Farm Income Distribution in the Aligarh District of Uttar Pradesh,"
Indian Journal of Agricultural Economics 28, 2, 1-11.
50. Singh, R. I., R. Kanwar and Shri Ram (1972), "Impact of New
Agricultural Technology and Mechanization," Indian Journal of
Agricultural Economics, XXVII, No. 4, 210-214.
-51-
51. Staub, William J. and M. G. Blase (1974), "Induced Technological
Change in Developing Agricultures: Implications for Income
Distribution and Agricultural Development," The Journal of
Developing Areas, July, 581-596.
52. Vyas, V. S. (1975), India's High Yielding Varieties Program in
Wheat: 1966-67 to 1971-72, CIMMYT, Mexico.

EDC Bulletins
Bulletin Number 81-1 March 1981
Agricultural Research in Indonesia Vernon CardwellJames C. Moomaw
Vernon W. Ruttan
Bulletin Number 81-2 March 1981
The Asia Bureau Agricultural Research Review Vernon W. Ruttan
Bulletin Number 82-1 March 1982
The Agricultural Research System of Pakistan:The Report of the Minnesota Reconnaissance Team Carl E. Pray
Vernon B. CardwellBo G. Crabo
Paul S. Teng