income and wealth inequality in hong kong, 1981-2020: the
TRANSCRIPT
World Inequality Lab – Working Paper N° 2021/18
Income and Wealth Inequality in Hong Kong, 1981-2020:
The Rise of Pluto-Communism?
Thomas Piketty Li Yang
June 2021
1
Income and Wealth Inequality in Hong Kong, 1981-2020:
The Rise of Pluto-Communism?
Thomas Piketty and Li Yang1
June 2021
Abstract. This paper combines national accounts, household surveys, fiscal data,
wealth rankings and election polls, in order to provide a comprehensive analysis
of the evolution of income and wealth inequality in Hong Kong, as well as its impact
on political cleavages over the 1981-2020 period. We find a very large rise in wage
inequality since 1981, especially since the Handover of Hong Kong to China. Top
1% earners now receive a much larger fraction of the total wage bill than bottom
50% earners, while the opposite was true in pre-Handover Hong Kong. We also
observe an enormous increase in the capital share and the top wealth share
(normalized by national income) since 2000. Today Hong Kong’s very top wealth
share (top 0.001%) is ranked at very top in the world. Finally, we find that the top
income earners and high-income professions (such as executives and managers)
are more likely to vote for pro-Beijing camp, while the bottom 85% income group,
students and lower-income professionals are more likely to be pro-democratic.
1 Thomas Piketty: Paris School of Economics, [email protected]; Li Yang: Paris School of Economics and INSEAD, [email protected]. The author would like to Regina Huang for her contribution in data collection. This research is supplemented by a data appendix that is available on-line on WID.world.
2
1. Introduction
The recent wave of Hong Kong protests (2019-2020) has drawn extensive global
attention from all over the world. Since June 2019, the on-going protests have
escalated from a demonstration against a proposed extradition law into a much
wider and prolonged anti-government and anti-Beijing movement that has resulted
in increasingly violent clashes and upset the economic and social order of the city.
To a large extent, there has been an escalating social unrest in Hong Kong over
the past twenty years (i.e., the 2003 1st of July protest and the 2014 Umbrella
Revaluation). It is generally believed that beneath the political issues about
democratic rights which trigged the protests directly, there is also a bedrock of
economic and social conditions that nurtured the development of social unrest, in
which the city-state’s rising inequality and extreme concentration of wealth is the
most important one (Ng, 2013; Nagy, 2015; So, 2016; Dieter, 2019).
By combining a large number of data sources (household surveys, tax data, wealth
rankings, national accounts, election polls) and innovative methodologies, we aim
to provide in this paper a comprehensive analysis on the evolution of income and
wealth inequality in Hong Kong for the last four decades, as well as its impact on
political cleavages and voting patterns. We find a very large rise in wage inequality
since 1981, especially since 2000. We also observe an enormous increase in the
capital share and the top wealth share (normalized by national income) between
2000 and 2020. Today Hong Kong’s very top wealth share (top 0.001%) is ranked
at very top in the world. Finally, we find that the top income earners and high-
income professions (such as executives and managers) are more likely to vote for
pro-Beijing camp, while the bottom 85% income group, students and lower-income
professionals are more likely to be pro-democratic.
Our results raise interesting questions about the nature of the political regime that
is currently in power in Hong Kong and Beijing. In particular, the case of Hong Kong
3
illustrates an intriguing and probably unique example in history of a country
becoming more unequal in terms of income and wealth after becoming officially
“communist”, or at least after joining a communist regime, following the 1997
Handover of Hong Kong to the People’s Republic of China. In order to characterize
this paradox, we coin the term “pluto-communism”, i.e. a form of communism
dominated by the power of money. It is also worth pointing out the lack of
transparency about income and wealth inequality in Hong Kong (as well as in the
PRC in general). In particular, the inheritance tax was abolished in 2006, so that
we have no data at all on inheritances in Hong Kong (nor in the PRC). In this paper
we attempt to do our best by combining the data sources at our disposal, but it is
clear that one would need to access more detailed sources (especially on wealth
and capital incomes) in order to reach a finer understanding of the forces at play.
This paper contributes to the existing literature in several ways. First, we apply new
methods to combine the salary tax data and census data. To our knowledge, it is
the first time that the salary tax data and census data are jointly used to estimate
wage inequality in Hong Kong. Our estimates provide sharp upward revision of
official wage inequality estimates for the period 1981 to 2018. For instance, the top
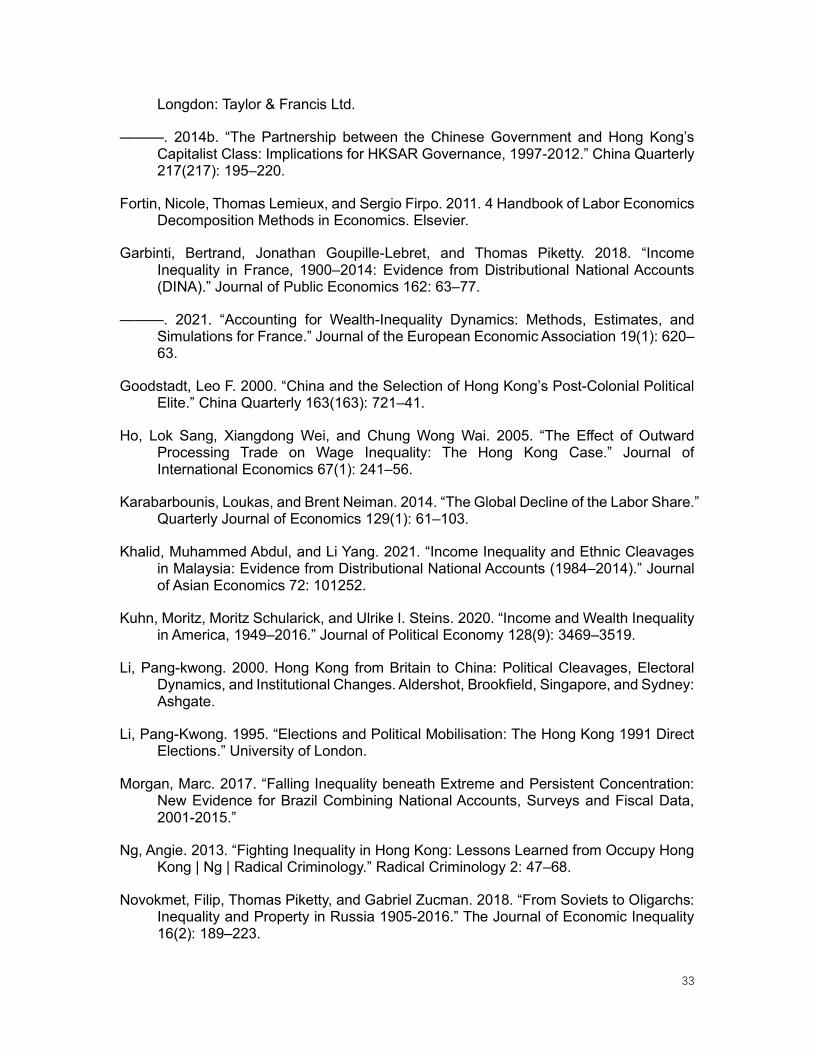
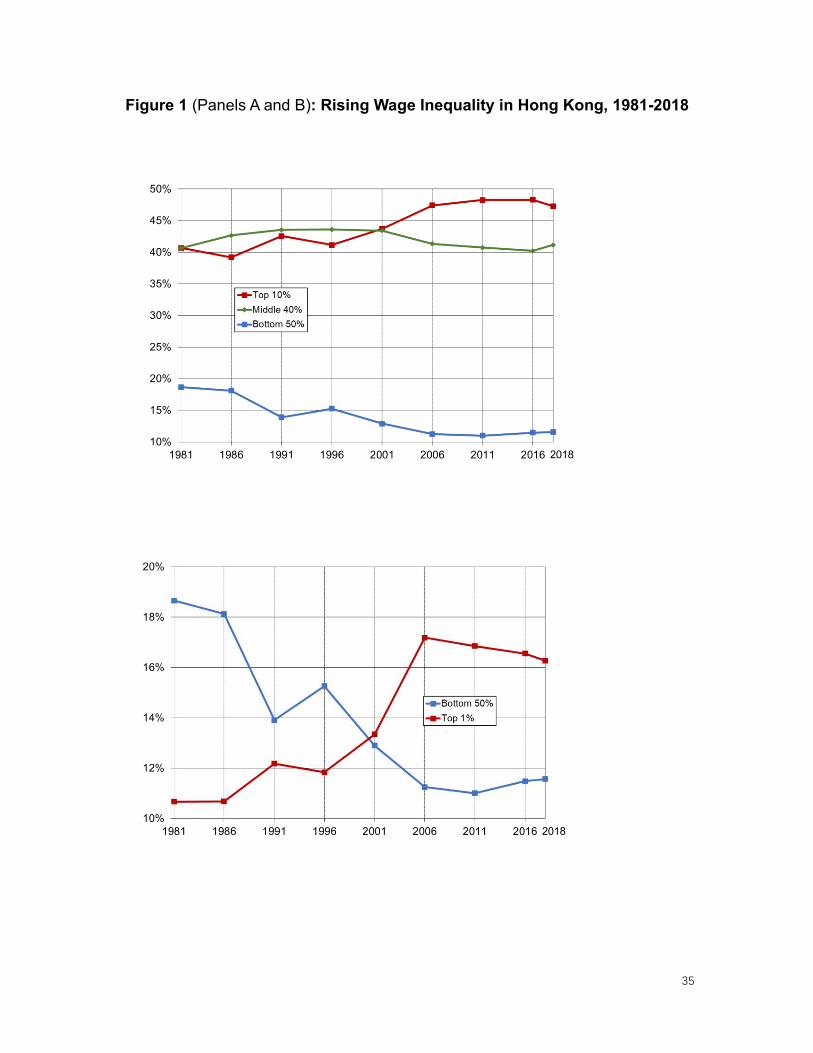
1% wage share rose from 10.7 % to 16.3% between 1981 and 2018, while the
bottom 50% share dropped from 18.7% to 11.6%. Furthermore, to understand the
drivers of rising wage inequality in Hong Kong, we adopt the Blinder-Oaxaca-type
decomposition based on the Recentered Influence Function (RIF) of the Gini index
(Firpo, Fortin, and Lemieux, 2009, 2018). Our results show that in pre-Handover
Hong Kong (1981-1996), the changing pattern of education structure and wage
premia and the transformation of industrial structure from manufacturing sector to
non-manufacturing sector (finance and service) were the major driving force for
the rise of wage inequality. In the post-Handover period (1997-2018), the latter
factor becomes the only driver for the rise of wage inequality. In particular when
further decomposing the effect of changing industrial structure into composition
effects (mechanical changes in the workforce composition) and wage structure
effects (change in skill prices), we find wage structure effects account for the lion’s
4
share. To this point, our findings complement the existing studies, which show that
the rise of producer services and outward processing trade are the major cause of
the rise of wage inequality (Chiu and Lui, 2004 and Ho et al., 2005). Education and
labor policies were unable to counteract these forces. Furthermore, we find that
rising female labor participation and the increasing share of Hong Kong born
employees contribute negatively to the evolution of wage inequality.
Next, wealth or capital income data of Hong Kong are extremely limited in both
aggregated and household level, largely due to the absence of a comprehensive
progressive tax on capital income and wealth in Hong Kong. Consequently, the
evolution of Hong Kong's capital share has not yet been documented in the
literature. Our third contribution is to bridge this gap by constructing a new Hong
Kong's capital share proxy based on corporate profit tax data, balance of payment
and national accounts. The capital share of Hong Kong has tripled since the
recovery of the 1998 Asian Financial Crisis, from about 15% of national income to
45% in 2020. In 1990s, Hong Kong’s capital share was lower than the level in most
of the high-income nations. Today, Hong Kong’s capital share is more than 1.5
times of the capital share in high-income nations.
Fourthly, we also contribute to estimate the wealth inequality of Hong Kong. Similar
to the capital share, due to the lack of data, there is no systemcally study on wealth
inequality of Hong Kong in the literature. We contribute to the literature by
constructing the first set of international comparable measurements of the top
wealth concentration for Hong Kong based Forbes Rich Lists. Hong Kong’s wealth
concentration level appears to be one of the highest in the world. If we compare
billionaire wealth or top 0,001% wealth to national income, then Hong Kong is far
above all other countries in the world. If we express top 0,001% wealth as a fraction
of total wealth (which appears to be relatively high as compared to national income
in Hong Kong), then Hong Kong’s top 0,001% wealth share is close to 10% in 2020,
which is comparable to the wealth concentration level in Russia, and much higher
than what it is in countries the USA or China.
5
Finally, we contribute to the understanding of the determinants of political attitudes.
Political cleavages in Hong Kong are strongly divided over the attitudes toward the
Chinese government and the democratization process. This has been widely
studied in the literature (see Li (1995, 2000), and Wong (2017)). However, due to
lack of data, there are very few empirical studies systemically investigating the
relationships between income inequality and political cleavage in Hong Kong.2
Using the unique data set from the pre-nomination survey for the 2016 Legislative
Council Election, we apply logit regression to estimate the determinants for political
attitudes. Our findings show that the top income earners and high-income
professions, such as executives and managers are more likely to vote for "status
quo" (which in effect amounts to pro-Beijing attitudes), while the bottom 85%
income group, students and lower-income professionals are more pro-democratic.
The rest of this paper is organized as follows. In section 2 we describe our main
data sources and methods. In Section 3, we present our results on the evolution
of wage inequality and discuss the drivers of inequality trend. Section 4 and 5
discuss the methods and results of the estimation of capital share and wealth
inequality, which we also compare to other countries. In section 6, we further
investigate the relationships between income inequality and political cleavages in
Hong Kong. Section 7 provides concluding comments. This paper is supplemented
by an extensive online appendix that includes all our raw data sources and
computer codes and presents additional robustness checks.3
2. Data Sources and Methods
This paper combines several categories of data sources: household surveys,
2 Among the limited existing studies, Wong (2000a, 2000b) studied the shift of the positions of Hong Kong parties in terms of redistributive ideology and the relationship between individual’s sociological and psychological factors and the attitude towards to redistribution respectively. See also Durrer and Gethin (2021). 3 Appendix A-E will be published together with the paper. Full data appendix is available upon request.
6
censuses and fiscal data; national accounts and wealth rankings; election polls.
We describe each of them in turn.
First, for estimating the evolution of wage inequality as well as its drivers, we use
8 waves of random Micro Sub-samples of the Hong Kong Census provided by the
Census and Statistic Department of Hong Kong covering the period 1981 to 2016.
For waves 1981 and 1986, the sub-sample data set covers 1% of the full Census.
For the rest of the waves, the sample data set covers 5% of the full Census (i.e.,
the sample covers 366,319 individuals in Census year 2016). Additionally, to
improve the estimation of wage inequality, we combine the Census data with
tabulated fiscal income data from Hong Kong salaries tax assessment, published
in the Hong Kong Inland Revenue Department Annual Reports.4
Next, we construct a new Hong Kong's capital share proxy based on corporate
profit tax data, balance of payment and national accounts. In particular, data on
corporate profits tax is taken from annual reports from the Hong Kong Inland
Revenue Department for the period 1989 to 2018.5
Thirdly, we estimate the evolution of wealth concertation for the super-rich in Hong
Kong. To do so, we rely on so-called "Rich Lists" regularly published in the Forbes
magazine. We use the rich list for the years 1988 until 2019. Before 2007 the
Forbes Magazine does not publish a separate rich list for Hong Kong. Therefore,
for the years prior to 2008 data is taken from the world billionaires list. From 2008
to 2012, the data is from the so-called "Hong Kong’s 40 Richest" list, the late data
after 2012 is from the "Hong Kong’s 50 Richest". Additionally, we also estimate the
4 Hong Kong salaries tax covers the pretax total salary income, but not capital income or business
income. For detailed tax rules of salaries please see Related Tax Rules of Guide to Tax Return,
https://www.ird.gov.hk/eng/pdf/bir60\_st\_e.pdf. 5 Hong Kong corporate profits tax covers profits from both domestic and foreign corporations as well as domestic and foreign unincorporated businesses in Hong Kong. Unincorporated business does not possess a separate legal identity from its owner(s). The owner(s) bear full liability for any action or inaction of the business: they may sue and be sued for business activity or inactivity. Unincorporated enterprises include sole proprietor-ships, partnerships and family trusts.
7
aggregated value of private housing in Hong Kong based on the housing statistics
published by Hong Kong Rating and Valuation Department.6
Finally, to investigate the determinants of political inclination, we use election
survey data from the Public Opinion Program (POP) of The University of Hong
Kong (HKU).7 In particular, our main analysis is based on the pre-nomination
Survey for 2016 Legislative Council Election, which was conducted between June
20 and July 8, 2016 over 5,084 adult registered voters in Hong Kong who speak
Cantonese. The pre-nomination survey contains information of interviewee of
gender, age, education level, occupation, income level, and residential district, and
political inclination, which allows us to estimate the determinants of political
inclination based on logit model. As robustness check we also apply the same
analysis to another election survey, namely 2016 Election Rolling Survey for
Legislative Council Election, which provide less detailed information on education
levels and occupation.8
3. Rising Wage Inequality in Hong Kong
In this section we first present our methodological approach and results for
measuring wage inequality in Hong Kong, then analysis the drivers of the evolution
of wage inequality.
3.1. Measuring Wage Inequality
We first measure wage inequality using pre-tax monthly wage income reported in
6 https://www.rvd.gov.hk/ 7 Since 1991, POP provide various micro surveys of public opinions on elections, government, as well as important economic, social and political topics. 8 The 2016 Election Rolling Survey is a daily rolling survey, also conducted by Public Opinion Program (POP) of The University of Hong Kong (HKU) from July 30 to September 2 2016. For each day it interviews daily interviewing at least 200 adult registered voters in Hong Kong who speak Cantonese. For more details of both surveys, pleases see https://develo.pori.hk.
8
Hong Kong census. This data source entails two main limitations. First, wage
income in Hong Kong census is top-coded and the share of top-coded
observations of the sample increases over time. I.e. in 1991 only 0.07% of the
sample only report a top-coded wage income, while in 2016 the top-coded share
increased to 0.35%.9 Thus the sample will generate a downwards bias to the top
of wage distribution. Furthermore, surveys often fail at capturing the top incomes
because individuals from high-income strata typically have very low response rates
in surveys (Piketty, Saez, and Zucman, 2018; Garbinti, Goupille-Lebret, and Piketty,
2018, Piketty, Yang, Zucman, 2019).
To account for these issues, we follow several steps in order to correct the raw-
census-data-based estimation. First, to tackle the top-coding issue, we assume
that the top of the wage distribution of Hong Kong follows a Pareto distribution.
This allows us to estimate the Pareto coefficient 𝛼 using the data close to the cut
off 𝐶. We then estimate the wage mean for the top-coded observations with the
estimation of Pareto coefficient �̂� and 𝐶, which is subsequently assigned to all
observations in the top-coded group.
Secondly, in order to address the fact that surveys often underestimate the top of
the distribution, we use individual fiscal data from Hong Kong Salaries Tax
Assessment to correct the top of the census data. More precisely, we adopt the re-
weighting method proposed in Blanchet, Flores, Morgan (2018) to combine tax
tabulation and survey data (top decoded). The basic idea is to adjust the weight of
the survey using fiscal data in a non-parametric manner under the assumption that
fiscal data sets a credible lower bound on the number of people with given levels
of income. Rather than directly making assumptions regarding the behavior of
complex statistics such as quantiles or bracket averages (i.e., Piketty, Yang, and
Zucman, 2019; Chancel and Piketty, 2017; Czajka, 2017; Morgan, 2017), their
method makes easily interpretable assumptions at the observation level. By
9 For more details on top-coding, please see Online Appendix D, sheet AX5.
9
conducting simulations of the method and applications to real data (from France,
Norway, the United Kingdom, Brazil, Chile), Blanchet, Flores, Morgan (2018)
demonstrate the method improves the accuracy and precision of distributional
estimates, even under extreme assumptions, and in comparison, to other survey
correction methods using external data. For application of the method, also see
Khalid and Yang (2021). 10
Figure 1 (panel A and B) presents the evolution of wage income shares (based
on corrected survey) in Hong Kong from 1981 to 2018. We find consistent rising
trends for both Top 1% and Top 10% wage shares. In stark contrast, the Bottom
50% share declined by 40% over this period. With respect to the Middle 40%, its
income shares first increased then decreased since 1996, diverging from to Top
10% shares. Wage inequality in Hong Kong has raised significantly since 1981,
and particularly so since 1997-2000.
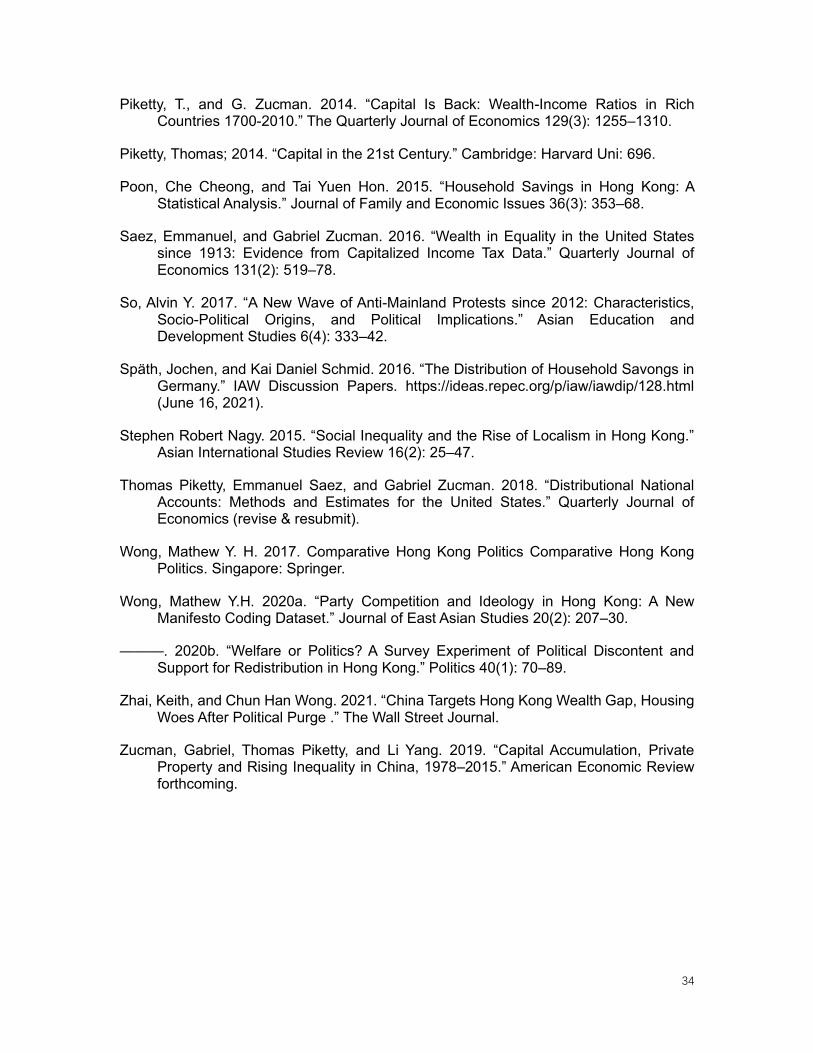
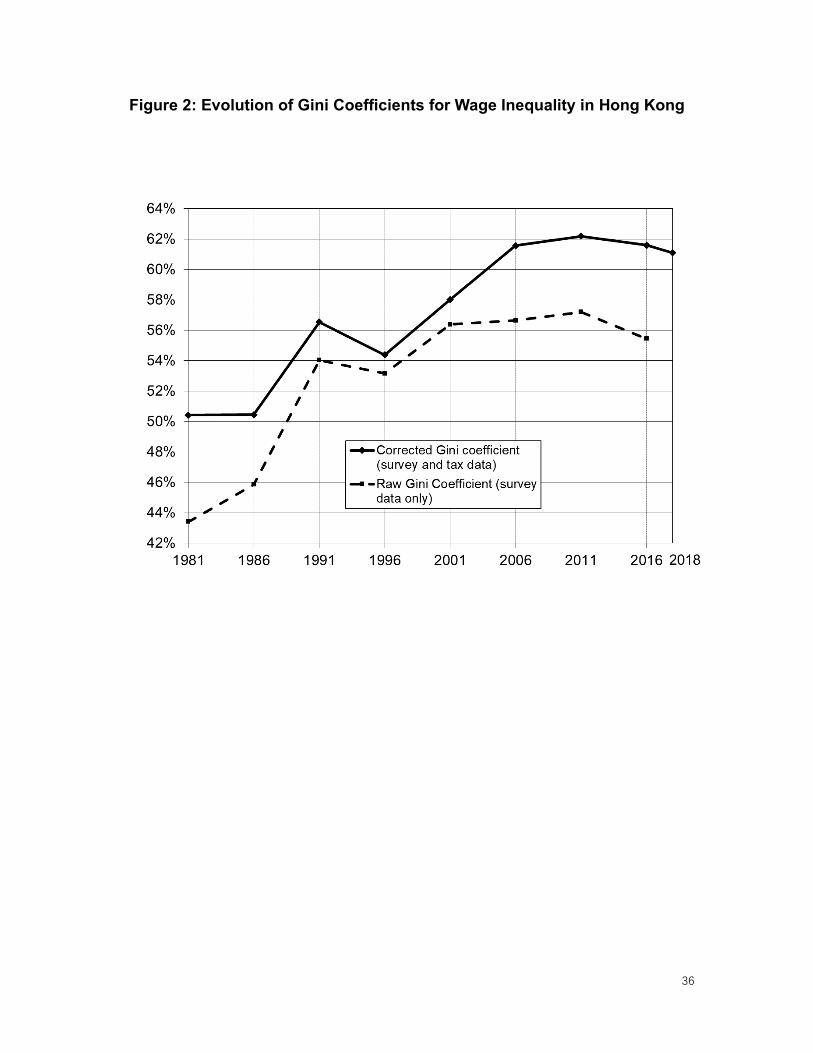
Figure 2 presents the evolution of wage Gini coefficients estimated basing on both
corrected survey (solid line) and raw survey (dash line). The results are resembling
yet striking. The corrected wage Gini raised about 12 percentage points from 50%
since 1981; when measuring with raw survey, the pattern is largely similar except
the level is much lower. After correction using the tax data, the inequality estimation
is lifted substantially, i.e., about 6% Gini percentage points in 2016.
Figure 1
Figure 2
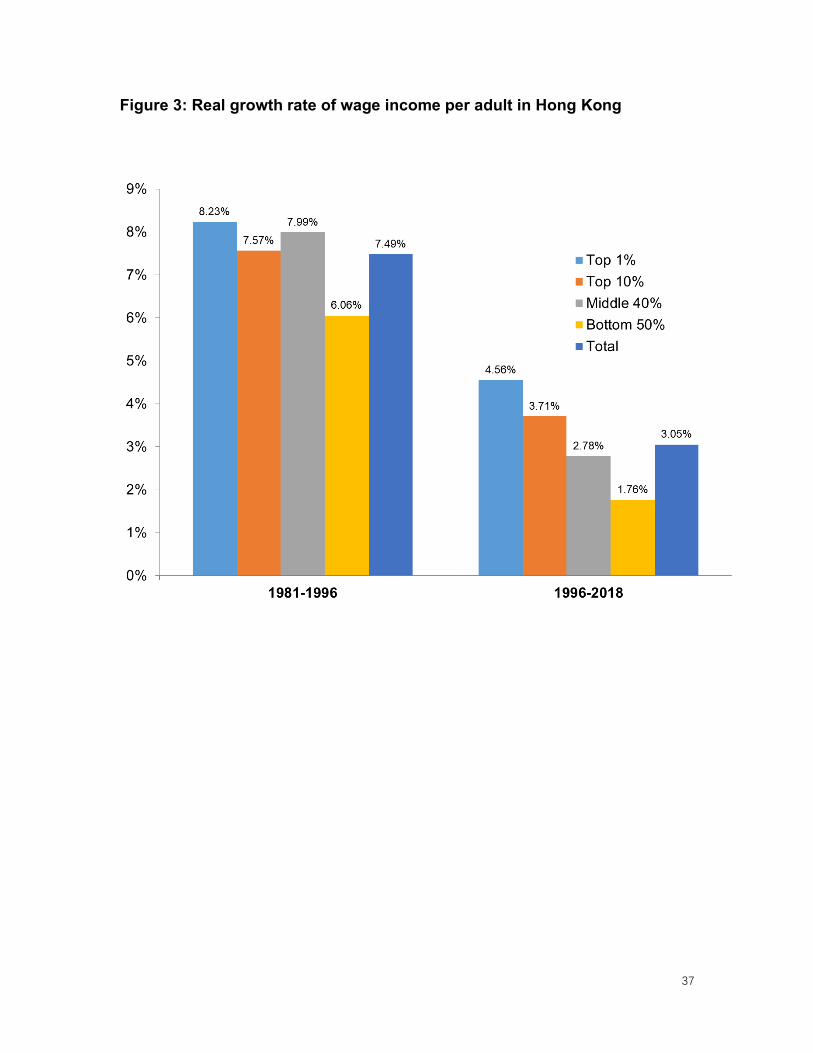
We further look in to the growth rate of wage income in different income groups.
Figure 3 shows two contrasting growth patterns for the period before and after the
10 To estimate corrected wage inequality in 2018, we first interpolate the 2018 raw wage distribution using 2016 Census and national account. We then apply the same correction using 2018 Salaries Tax Assessment.
10
handover of Hong Kong in 1997. The wage growth rates of Hong Kong are strong
and inclusive before the Handover. The average annual growth rate of wage
income for the whole population is 7%, while the growth rates of top 1% and bottom
50% are not too divergent, 8.2% vs. 6.1%. After the Handover, Hong Kong features
moderate but much less inclusive growth. The average growth rate is 3.1%, less
than half of the growth rate before the handover. Top 1% grows more than 2.5
times of the bottom 50%, 4.6% vs. 1.8%.
Figure 3
In our benchmark series, we measure wage inequality using the equal-split income
concept, i.e. assuming that wage income is equally distributed among adults in a
household. To this end, we convert the individual adult wage into the wage equal-
split among the adults in one household. We also provide in the appendix the
series based upon individual wages, as well as series on the inequality of total
income (labour and capital income) based upon the same correction coefficients
as for wage income.11 We should stress however that the lack of proper fiscal data
on capital incomes and wealth makes our series on total income inequality
relatively uncertain (and probably underestimated).12 This is why we focus in this
paper on wage inequality series and on the rise of the capital share and top wealth
shares. The full results and the corresponding computer codes for wage and
income inequality are available in the online appendix, where we also offer a
complete description of the process and detailed robustness checks of the method.
3.2. Drivers of Wage Inequality Trends
What are the major drivers for the rising wage inequality trends in Hong Kong? To
answer this question, we further look into the role of these socio-economic
11 See Appendix D, sheets 2.1-2.6 and Appendix E, sheets AF1A, AF1B, and AF2 12 See Appendix C.
11
characteristics on level and evolution of the Gini index. In line with Firpo, Fortin,
and Lemieux (2009, 2018), we adopt the Blinder-Oaxaca-type decomposition
based on the Recentered Influence Function (RIF) of the Gini index.13 To be more
precise, first, we regress the recentered influence functions (RIF) of Gini index on
the explanatory socio-economic variables.14 With this approach we are able to
estimate unconditional partial effects (UPEs) of the socio-economic characteristics
(gender, education, industries, occupations, etc.) on the Gini index separately for
each year. We then decompose the change in the Gini index over time and assess
how the socio-economic characteristics impact the change of the Gini index over
time.15 The simplest version of the RIF decomposition approach assumes that the
conditional expectation of the RIF of Gini index 𝐺 for income 𝑦, 𝑅𝐼𝐹(𝑦; 𝐺), can
be modelled as a linear function of the explanatory variables, given by matrix 𝑋,
such that the 𝛽 coefficients can be estimated by OLS:
𝐸(𝑅𝐼𝐹(𝑦; 𝐺) |𝑋) = 𝑋′𝛽 (1)
Then, by the law of iterative expectations:
𝐺 = 𝐸(𝑅𝐼𝐹(𝑦; 𝐺)) = 𝐸𝑋 [𝐸(𝑅𝐼𝐹(𝑦; 𝐺)| 𝑋] = 𝐸(𝑋)𝛽 (2)
This allows the estimation of standard partial effects (Unconditional Partial Effects)
of the socio-economic characteristics. The 𝛽 coefficients can be interpreted as
the marginal impact of a small change in 𝐸(𝑋) on the Gini index. From (2), we
can then write the difference between the Gini of the reference and target
distribution, which are two different time periods in our context, (with superscripts
13 Influence function (IF) is a widely used tool in the robust estimation of statistical or econometric models. As its name suggests the influence function 𝐹(𝑌; 𝑣, 𝐹𝑦) of a distributional statistic 𝑣(𝐹𝑦) represents the influence of an individual observation on that distributional statistic. Adding back the statistic 𝑣(𝐹𝑦) to the influence function yields re-centered influence function (RIF). 14 The RIF function of the Gini is automatically estimated with the Stata command. 15 A thorough discussion of this methodology, comparing its econometric properties with other regression-based decomposition methods available in the literature, can be found in Fortin, Lemieux, and Firpo (2011).
12
0 and 1) as:
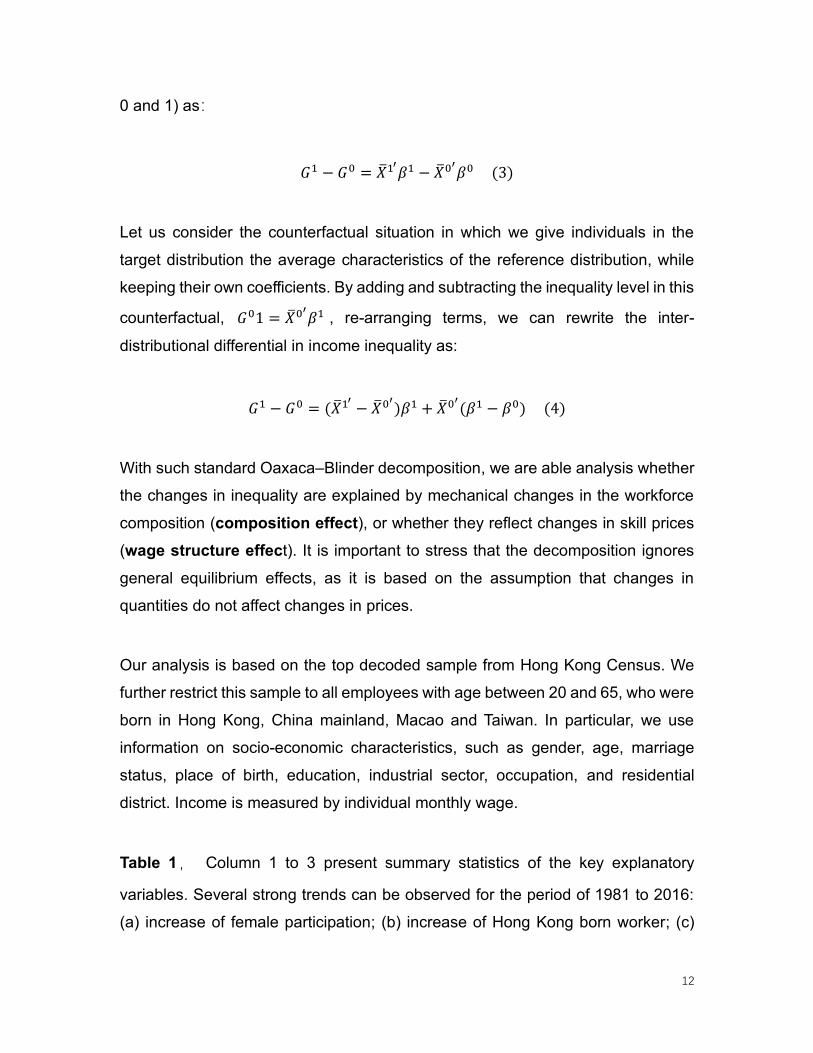
𝐺1 − 𝐺0 = �̅�1′𝛽1 − �̅�0′
𝛽0 (3)
Let us consider the counterfactual situation in which we give individuals in the
target distribution the average characteristics of the reference distribution, while
keeping their own coefficients. By adding and subtracting the inequality level in this
counterfactual, 𝐺01 = �̅�0′𝛽1 , re-arranging terms, we can rewrite the inter-
distributional differential in income inequality as:
𝐺1 − 𝐺0 = (�̅�1′− �̅�0′
)𝛽1 + �̅�0′(𝛽1 − 𝛽0) (4)
With such standard Oaxaca–Blinder decomposition, we are able analysis whether
the changes in inequality are explained by mechanical changes in the workforce
composition (composition effect), or whether they reflect changes in skill prices
(wage structure effect). It is important to stress that the decomposition ignores
general equilibrium effects, as it is based on the assumption that changes in
quantities do not affect changes in prices.
Our analysis is based on the top decoded sample from Hong Kong Census. We
further restrict this sample to all employees with age between 20 and 65, who were
born in Hong Kong, China mainland, Macao and Taiwan. In particular, we use
information on socio-economic characteristics, such as gender, age, marriage
status, place of birth, education, industrial sector, occupation, and residential
district. Income is measured by individual monthly wage.
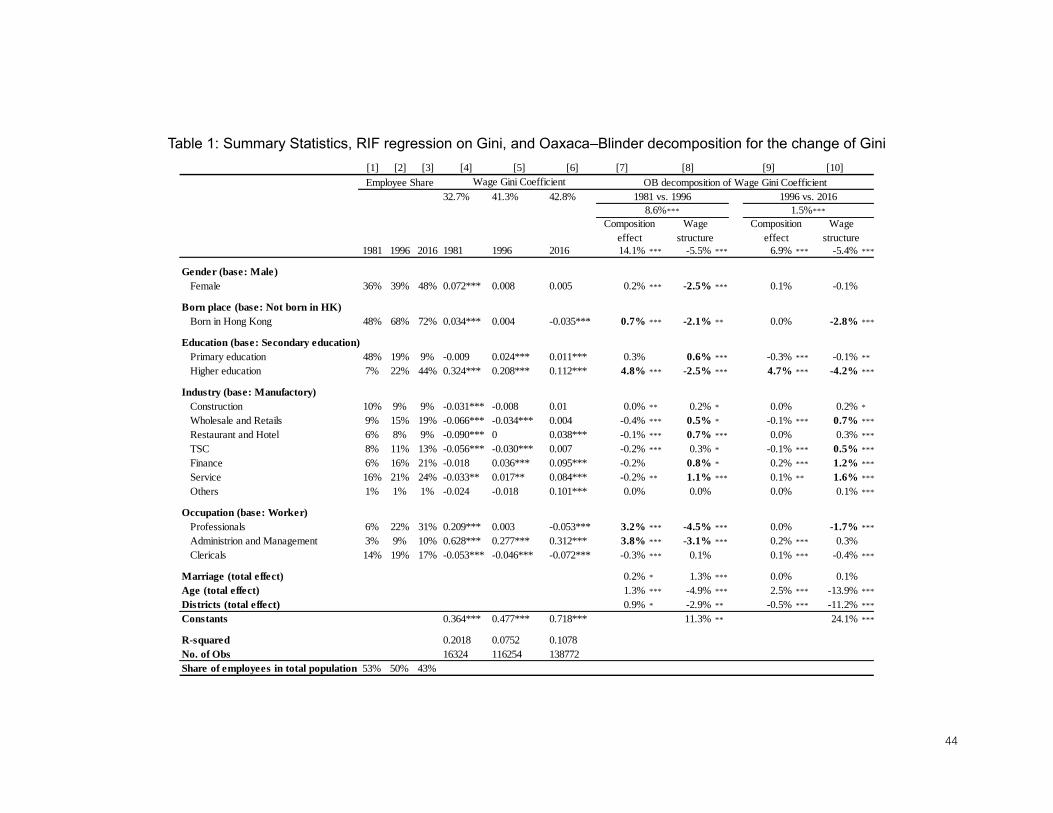
Table 1, Column 1 to 3 present summary statistics of the key explanatory
variables. Several strong trends can be observed for the period of 1981 to 2016:
(a) increase of female participation; (b) increase of Hong Kong born worker; (c)
13
expansion of high education; (d) decreasing of manufacturing and rising of finance
and service sector; (e) raise of professionals and managers.
Thus, in a nutshell, compared to 1981, in 2016, the employees in Hong Kong are
more gender balanced, skilled and educated. They are also concentrated in non-
manufacturing sectors. We then look at the estimates from the RIF regressions for
the Gini coefficient in column 4 to 6. In our analysis, we focus on a set of key
explanatory variables, namely gender, born place, education, industry, and
occupation. We also control for age, marriage status, and residential districts in the
regression. All the variables are dummies. The coefficients in the RIF regressions
indicate the magnitude and direction of the expected change in the Gini index after
a small increase in the average value of the corresponding variable, ceteris paribus.
Thus, if the coefficient is 0.5, it means that a 1% increase in the average value of
corresponding variable increases the Gini by 0.05%.
As shown in column 4, in 1981, the major variables contributing to higher Gini are
higher education, share of professionals, and managers. Furthermore, female
labor participation and the share of people born in Honk Kong increase the Gini
index. In contrast, the industrial shift from manufacturing sector to non-
manufacturing sectors such as restaurants and hotels as well as wholesale and
retail decreases the Gini index. In 2016 this picture flipped (column 6), all the
variables of industrial sectors become inequality enhancing. Contrastingly, there is
no more positive significant impact of female labor force participation and share of
people born in Hong Kong. Higher education is inequality enhancing for all the
period, but its effect decreases. Finally, share of professionals also became
inequality diminishing while high wage occupation in administration and
management remains the most inequality enhancing variable.
Column 7 to 10 present results for the standard Blinder-Oaxaca RIF Gini
decomposition exercise. From 1981 to 1996, the Gini coefficient raises 8.6
percentage points from 32.7% to 42.8%, which can be further decomposed to
14
aggregated composition effects (14.1%) and aggregated wage structure effects (-
5.5%). Correspondingly from 1996 to 2016, the Gini coefficient raises 1.5%, among
which 6.9% is due to composition effects, -5.4% is due to the change in skill price.
For both periods, the wage structure changed in the way that it reduces the wage
inequality, so the returns to the socio-economic characteristics become more
balanced across the distribution. The composition effect has a positive sign,
indicating that the changing composition of the work force is inequality enhancing.
However, the composition effect decreases over time, while the wage structure
effect remains almost the same.
Table 1
Aggregate composition and wage structure effect can be further decomposed by
explanatory variables (socio-economic characteristics). Such decomposition
enables us to calculate the overall contribution of each explanatory variable (or
cluster of explanatory variables) to the change of Gini by adding up the
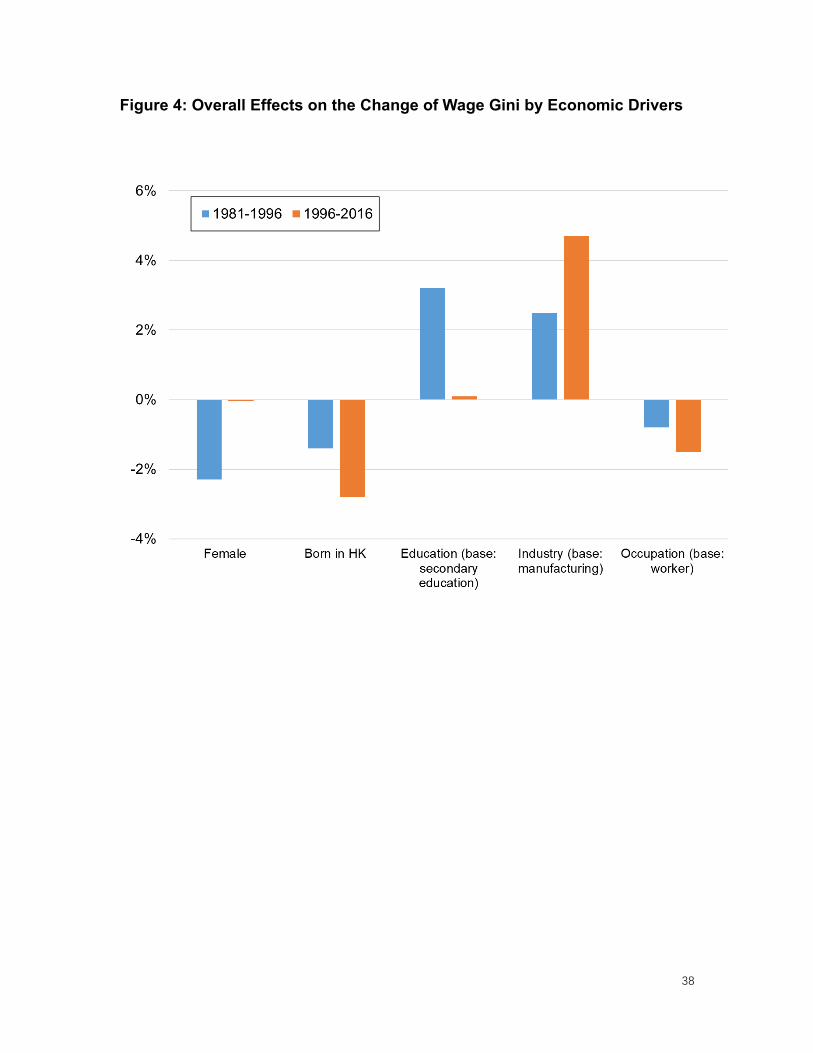
composition effect and structure effect. Figure 4 presents overall effect by main
explanatory variables calculated based on Table 1.
Before the Handover of Hong Kong (blue bars), expansion of education, especially
higher education, is the major driving force for the rise of Gini coefficient. The
change of industrial structure from manufacturing sector to non-manufacturing
sector ranks at the second major inequality enhancing force. Rising female
participation, increase Hong Kong born employee, and the occupational change
towards to the high sill job in the labor force all play significant role to drive wage
Gini down. After the Handover (orange bars), the change of industrial structure
becomes the only driver for the rise of Gini, with the biggest absolute magnitude
among all the drivers. In particular the whole industry effect on the Gini is mostly
due to wage structure effects, the evolution of returns in finance and service sector
contributed the most to the increase in overall inequality (see T1, as well as
Appendix E, sheets AF5A and AF5B). Meanwhile the impact of education
15
expansion and rising female participation on wage Gini diminish to almost 0;
Increase in Hong Kong born employee, and the occupational change, especially
increasing professionals, play even stronger role in reducing wage inequality.
Figure 4
4. Rising of capital's share in income in Hong Kong
In the last section, we presented the rising trend of labor income inequality, now
we turn to discussion of capital income evolution in Hong Kong and its implication
on inequity. In the most recent years, the research of inequality has been integrated
with a focus on capital's share in income. According to Piketty (2013) and Piketty
and Zucman (2015), capital shares have increased in all rich countries from about
15% to 25% in the 1970s to 25% to 35% in 2010.16 Given that capital ownership
is highly concentrated at the top, the rise of capital income will tend to increase
both income and wealth inequality in the longer run (Piketty 2014, Bengtsson and
Waldenström 2018).
Since Hong Kong’s capital share are not provided in its national accounts, the
evolution of Hong Kong's capital share has not yet been documented in the
literature. To bridge the gap, we construct a new Hong Kong's capital share proxy
based on corporate profit tax data, balance of payment and national accounts. We
first retrieve the total amount of corporate pre-tax profits from the revenue of
corporate profit tax.17 Since such corporate profit accrue to both Hong Kong
citizens and foreign investors, we have to adjust it using the net direct investment
and portfolio investment in order to only capture profits obtained by Hong Kong
citizens.18 Finally, the estimation of capital share is equal to the share of the
16 Also see Ellis and Smith 2007; Azmat, Manning, and Van Reenen 2012; Karabarbounis and Neiman 2014 17 Profits tax covers both corporations and unincorporated businesses. Profits is net of fixed capital consumption. We assume imputed rent is equal to depreciation of the housing. 18 Hong Kong citizen owned corporate profits = Corporate profit in Hong Kong - Direct investment
16
corporate profits obtained by Hong Kong citizens in national income.
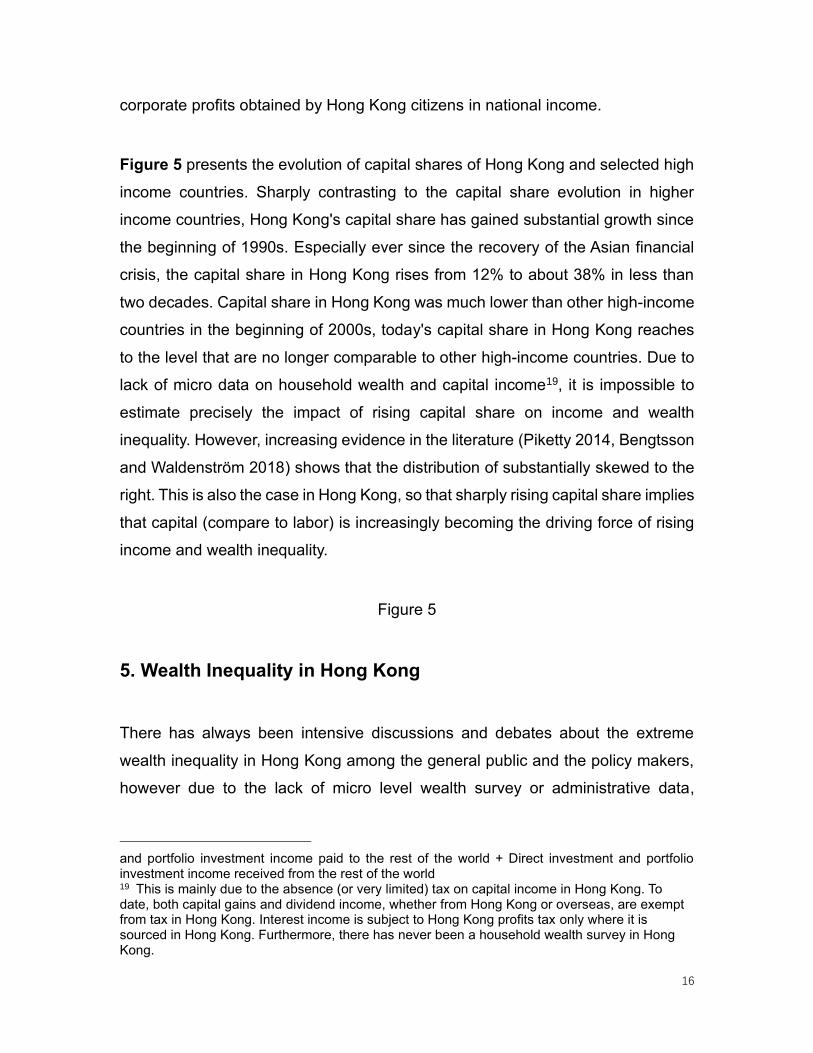
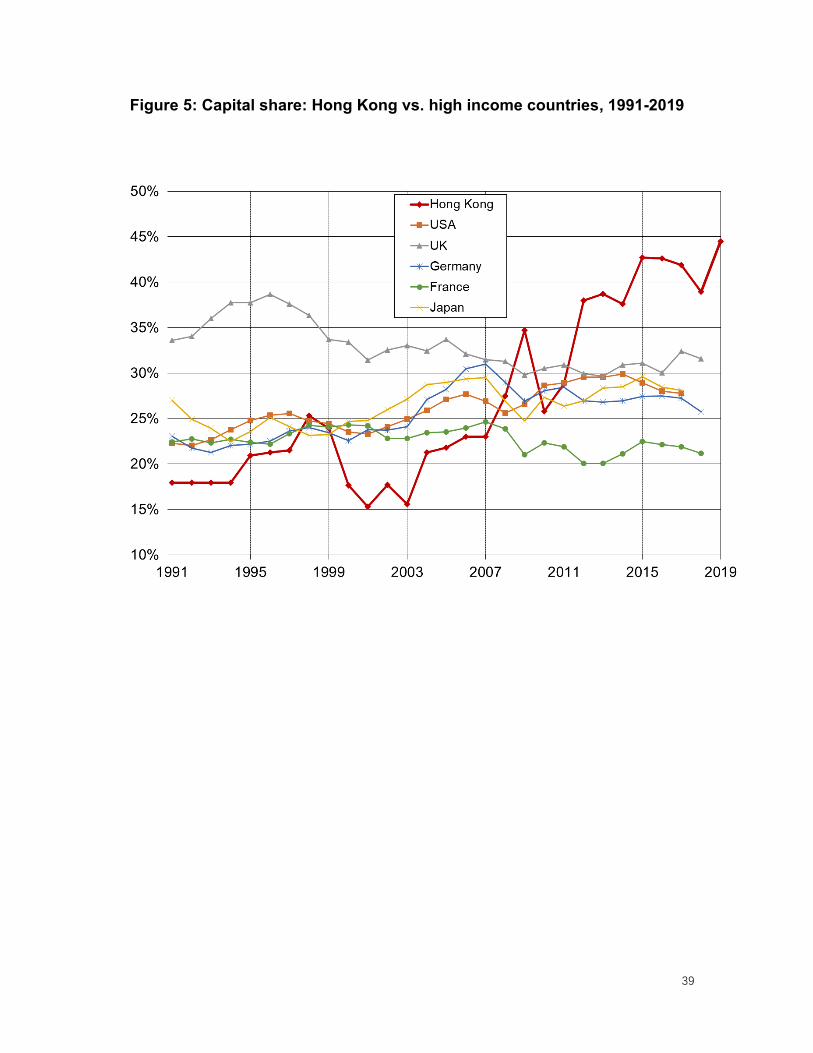
Figure 5 presents the evolution of capital shares of Hong Kong and selected high
income countries. Sharply contrasting to the capital share evolution in higher
income countries, Hong Kong's capital share has gained substantial growth since
the beginning of 1990s. Especially ever since the recovery of the Asian financial
crisis, the capital share in Hong Kong rises from 12% to about 38% in less than
two decades. Capital share in Hong Kong was much lower than other high-income
countries in the beginning of 2000s, today's capital share in Hong Kong reaches
to the level that are no longer comparable to other high-income countries. Due to
lack of micro data on household wealth and capital income19, it is impossible to
estimate precisely the impact of rising capital share on income and wealth
inequality. However, increasing evidence in the literature (Piketty 2014, Bengtsson
and Waldenström 2018) shows that the distribution of substantially skewed to the
right. This is also the case in Hong Kong, so that sharply rising capital share implies
that capital (compare to labor) is increasingly becoming the driving force of rising
income and wealth inequality.
Figure 5
5. Wealth Inequality in Hong Kong
There has always been intensive discussions and debates about the extreme
wealth inequality in Hong Kong among the general public and the policy makers,
however due to the lack of micro level wealth survey or administrative data,
and portfolio investment income paid to the rest of the world + Direct investment and portfolio investment income received from the rest of the world 19 This is mainly due to the absence (or very limited) tax on capital income in Hong Kong. To date, both capital gains and dividend income, whether from Hong Kong or overseas, are exempt from tax in Hong Kong. Interest income is subject to Hong Kong profits tax only where it is sourced in Hong Kong. Furthermore, there has never been a household wealth survey in Hong Kong.
17
empirical studies are extremely limited till today.
To address this gap, in this section we provide for the first time a set of
internationally comparable wealth concentration estimates based on the Forbes
Rich Lists. Additionally, based on wealth accumulation model, we conduct
simulations for the evolution of wealth inequality in Hong Kong over the period from
1981 to 2016. Our findings show that Hong Kong's wealth concentration level is at
the very top of the world. Moreover, based on our simulation, the wealth inequality
has been increasing for both period before and after 1996. In particular price effect
and saving effect plays different role in the evolution of wealth shares for rich
people and poor people over two periods.
5.1. Measuring the Top Wealth Concentration of Hong Kong
In the recent emerging literature on the evolution of wealth inequality, Forbes Rich
Lists has been increasingly using to estimate the wealth concentration at the very
top, often as consistency check or correction for the wealth survey and for the fiscal
data (see Saez and Zucman 2016; Alvaredo et al. 2018; Novokmet et al. 2018;
Piketty et al. 2019; Garbinti et al. 2021). The reliability of these lists is contentious
due to several drawbacks. First the data is compiled relying on various sources
and the methodology cannot be transparently evaluated. Second, the Rich Lists
presumably neglect a number of private assets and liabilities, which may lead to
the underestimation of wealth concentration. Last but not the least, the unit of
analysis is not always consistent across observations, often it reports wealth for
entire family consisting of more than one individual (or household). Further
adjustment is required when using Forbes Rich List to estimate individual level
wealth concentration.
Despite of above-mentioned drawbacks, the Rich Lists are the only source we
could possibly rely on to estimate top wealth concentration in Hong Kong, where
there is no wealth survey and no fiscal data on either capital incomes or
18
inheritances (which can be used in a number of other countries). We would like to
stress that our estimation still suffer from serious limitations, due to the lack of
accurate statistical information both on the production and on the bias of this list.
Our estimations have to be seen as first steps towards to a better understanding
of the level and the evolution of the wealth concentration in Hong Kong.
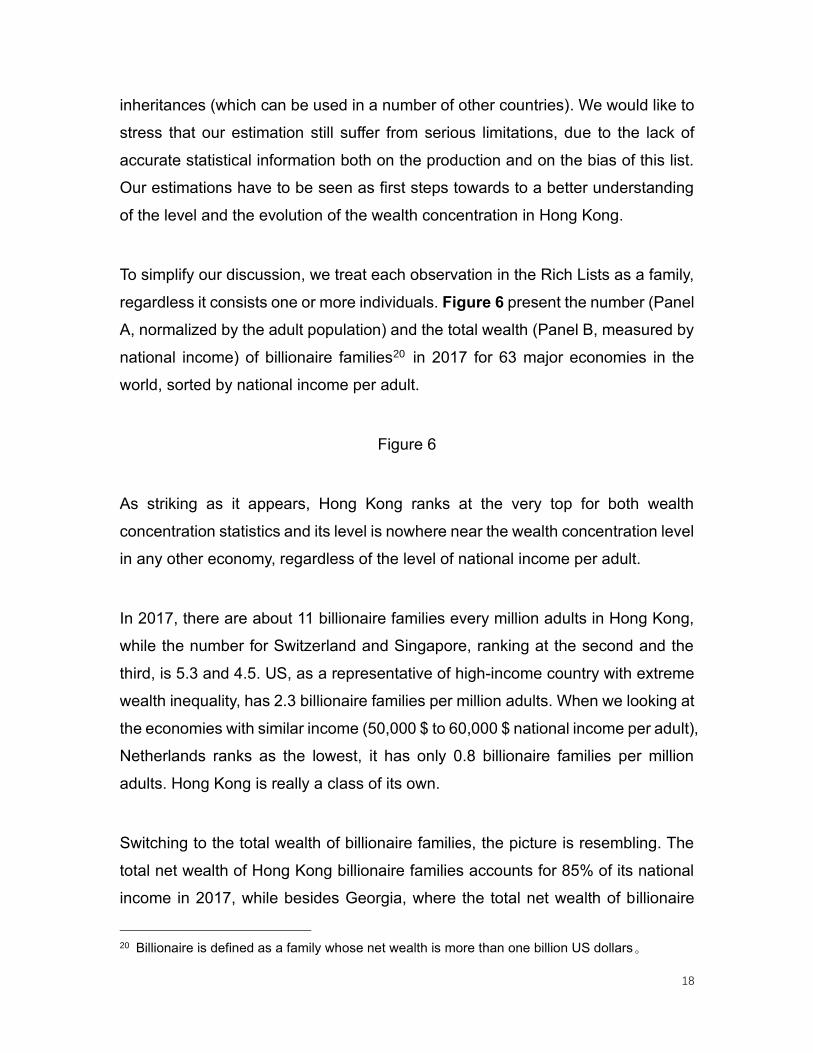
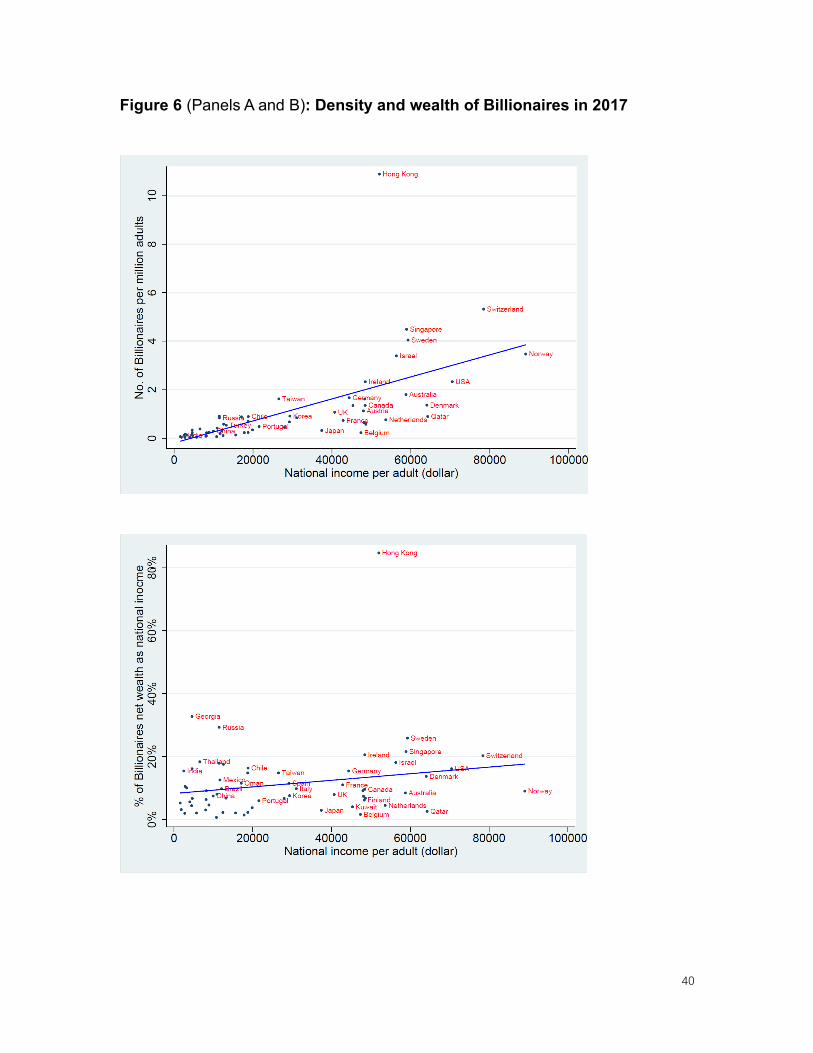
To simplify our discussion, we treat each observation in the Rich Lists as a family,
regardless it consists one or more individuals. Figure 6 present the number (Panel
A, normalized by the adult population) and the total wealth (Panel B, measured by
national income) of billionaire families20 in 2017 for 63 major economies in the
world, sorted by national income per adult.
Figure 6
As striking as it appears, Hong Kong ranks at the very top for both wealth
concentration statistics and its level is nowhere near the wealth concentration level
in any other economy, regardless of the level of national income per adult.
In 2017, there are about 11 billionaire families every million adults in Hong Kong,
while the number for Switzerland and Singapore, ranking at the second and the
third, is 5.3 and 4.5. US, as a representative of high-income country with extreme
wealth inequality, has 2.3 billionaire families per million adults. When we looking at
the economies with similar income (50,000 $ to 60,000 $ national income per adult),
Netherlands ranks as the lowest, it has only 0.8 billionaire families per million
adults. Hong Kong is really a class of its own.
Switching to the total wealth of billionaire families, the picture is resembling. The
total net wealth of Hong Kong billionaire families accounts for 85% of its national
income in 2017, while besides Georgia, where the total net wealth of billionaire
20 Billionaire is defined as a family whose net wealth is more than one billion US dollars。
19
families account for 33% of national income, the level for all other countries is
below 30%. Such results confirm public concern about inequality in Hong Kong.
The appealing truth is that Hong Kong's wealth concentration level is extremely
server to the degree that it is not comparable to any other economy in the world.
How did wealth concentration in Hong Kong reach such an outstanding level? How
does the wealth concentration evolve compared to other economies? To address
these questions, we need to construct comparable wealth shares series across
economies and along the time, which requires to estimate individual level (instead
of family level) wealth statistics. So far there is no consensus in the literature on
how to individualize the family wealth reported in the Rich Lists.21 In the present
paper we adopt the following procedures to individualize the Rich Lists family
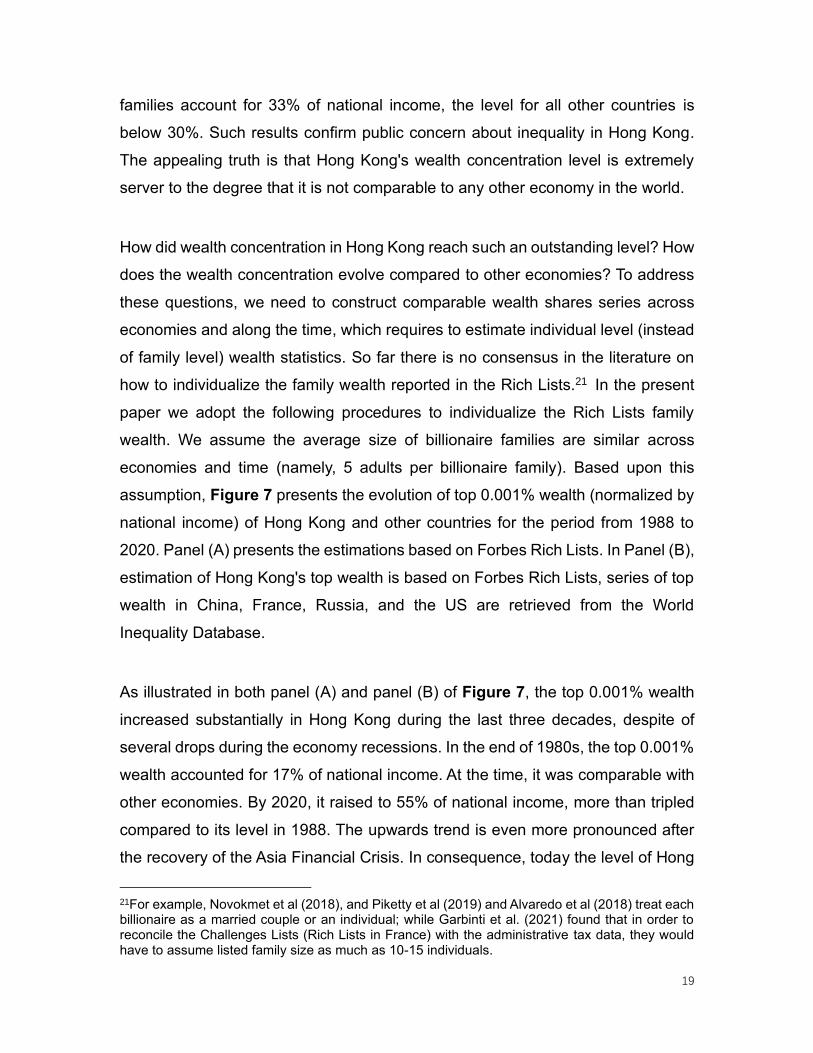
wealth. We assume the average size of billionaire families are similar across
economies and time (namely, 5 adults per billionaire family). Based upon this
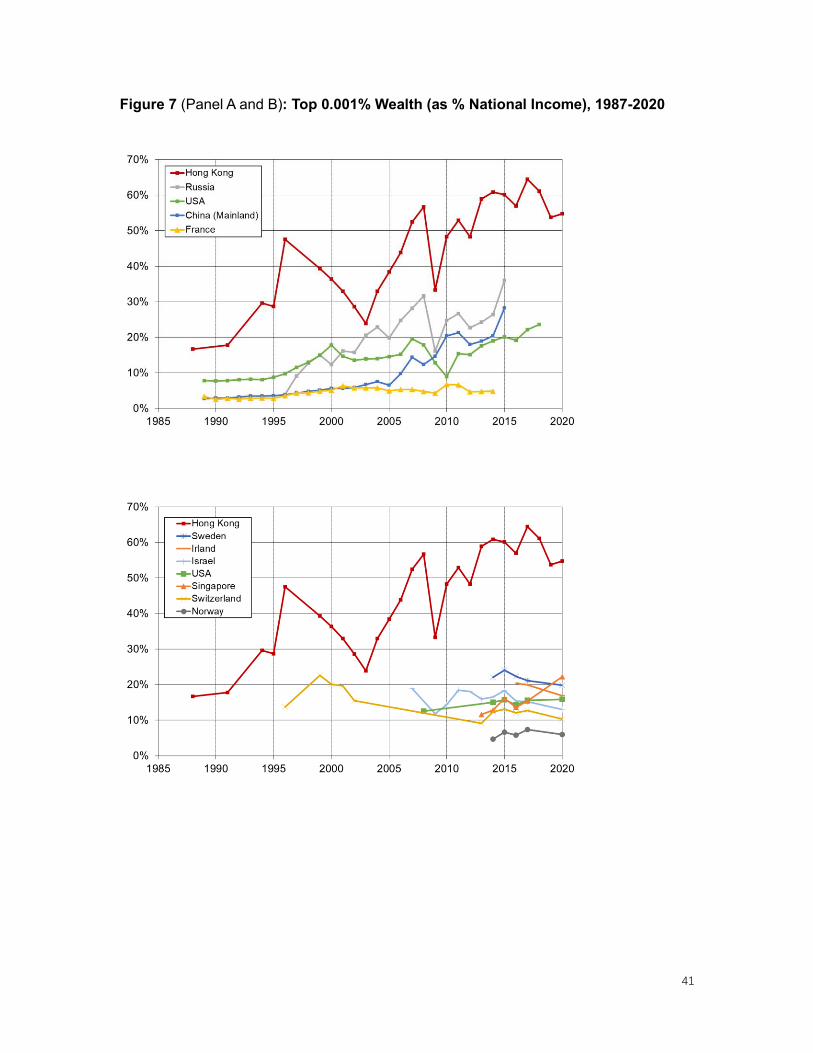
assumption, Figure 7 presents the evolution of top 0.001% wealth (normalized by
national income) of Hong Kong and other countries for the period from 1988 to
2020. Panel (A) presents the estimations based on Forbes Rich Lists. In Panel (B),
estimation of Hong Kong's top wealth is based on Forbes Rich Lists, series of top
wealth in China, France, Russia, and the US are retrieved from the World
Inequality Database.
As illustrated in both panel (A) and panel (B) of Figure 7, the top 0.001% wealth
increased substantially in Hong Kong during the last three decades, despite of
several drops during the economy recessions. In the end of 1980s, the top 0.001%
wealth accounted for 17% of national income. At the time, it was comparable with
other economies. By 2020, it raised to 55% of national income, more than tripled
compared to its level in 1988. The upwards trend is even more pronounced after
the recovery of the Asia Financial Crisis. In consequence, today the level of Hong
21For example, Novokmet et al (2018), and Piketty et al (2019) and Alvaredo et al (2018) treat each billionaire as a married couple or an individual; while Garbinti et al. (2021) found that in order to reconcile the Challenges Lists (Rich Lists in France) with the administrative tax data, they would have to assume listed family size as much as 10-15 individuals.
20
Kong's normalized 0.001% wealth is well beyond the reach of other economies.
Even Russia who is notorious for its high wealth concentration due to its business
oligarchs, is pales in comparison.
Figure 7
However, an increase of normalized top wealth (relative to national income) does
not necessarily mean raise of top wealth share, since it can be decomposed into
the product of top wealth share and net private wealth-income ratio 𝛽𝑡𝑝𝑟𝑖𝑣𝑎𝑡𝑒
:
𝑊𝑡𝑡𝑜𝑝 0.001%
𝑌𝑡=
𝑊𝑡𝑡𝑜𝑝 0.001%
𝑊𝑡∗
𝑊𝑡
𝑌𝑡=
𝑊𝑡𝑡𝑜𝑝 0.001%
𝑊𝑡∗ 𝛽𝑡
𝑝𝑟𝑖𝑣𝑎𝑡𝑒
Here, 𝑌𝑡 indicates net national income in year t, 𝑊𝑡 indicate net private wealth in
year t. Hence, by construction the level of top wealth share is jointly determinate
by the normalized top wealth and 𝛽𝑡𝑝𝑟𝑖𝑣𝑎𝑡𝑒
. To calculate the top wealth share, we
would first need to estimate the value of 𝛽𝑡𝑝𝑟𝑖𝑣𝑎𝑡𝑒
for Hong Kong.
Unfortunately, aggregate balance sheets and private wealth data are not published
by the statistical authorities of Hong Kong. Here we make our own estimation of
private wealth in Hong Kong using available information following the procedures
below. First, we estimate the net private housing wealth in Hong Kong (𝛽𝑡ℎ𝑜𝑢𝑠𝑖𝑛𝑔
).
Private housing stock and housing price (market value) are published regularly by
the Rating and Valuation Department of Hong Kong 22 . Thus, we are able to
estimate the market value of private housing in Hong Kong. Outstanding mortgage
loan of Hong Kong, is published Hong Kong Monetary Authority23 . Net private
housing wealth is equal to the market value of private housing minus outstanding
22 https://www.rvd.gov.hk/ 23 https://www.hkma.gov.hk/gb_chi/data-publications-and-research/data-and-statistics/monthly-statistical-bulletin/
21
mortgage loan (For details, please see Appendix D, sheet AX10). We then estimate
the share of net housing wealth in private wealth (𝐴𝑡ℎ𝑜𝑢𝑠𝑖𝑛𝑔
), with which we are able
to subsequentially estimate the level of private wealth in Hong Kong. Thus:
𝛽𝑡𝑝𝑟𝑖𝑣𝑎𝑡𝑒 =
𝛽𝑡ℎ𝑜𝑢𝑠𝑖𝑛𝑔
𝐴𝑡ℎ𝑜𝑢𝑠𝑖𝑛𝑔
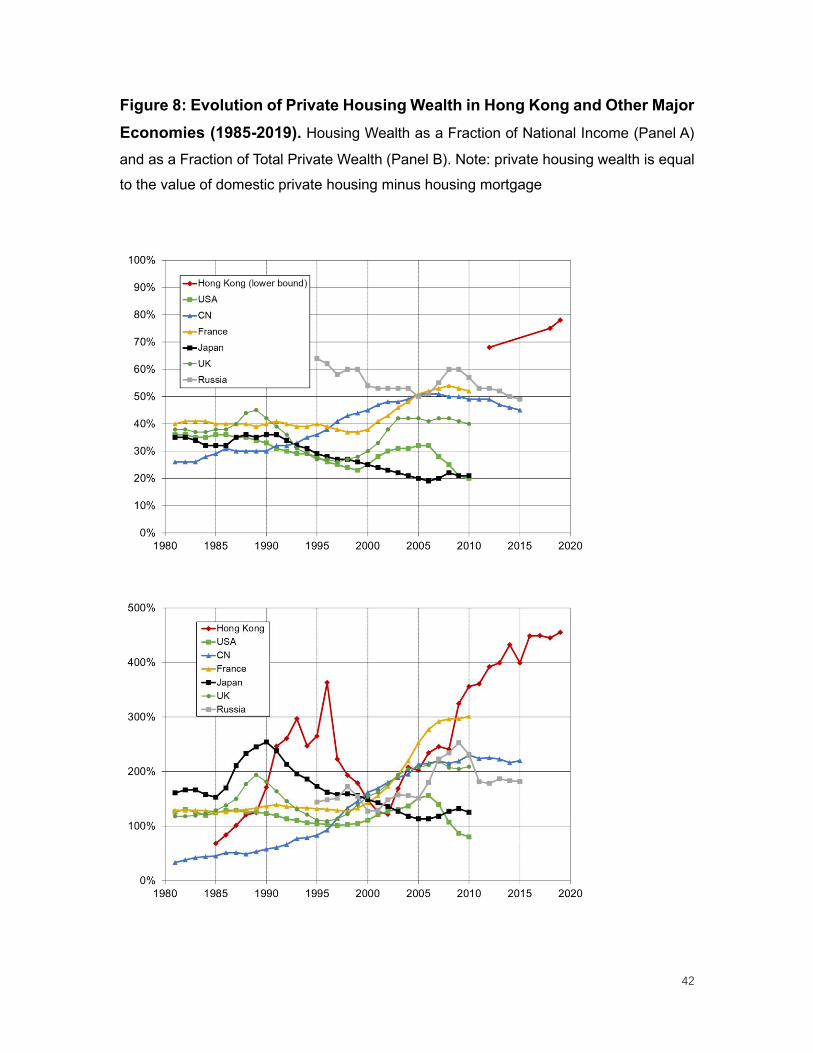
Figure 8 panel A presents the evolution of net private housing wealth in Hong Kong
and other major economics in the world. Hong Kong’s 𝛽𝑡ℎ𝑜𝑢𝑠𝑖𝑛𝑔
started in quite low
level compared to other economies in 1980s. Driven by the soaring of the assets
price, it then raised to 363% national income in 1997. During the Asia Financial
Crisis, it fell badly to 122% of national income in 2002; ever since it has raised
phenomenally, in 2018 𝛽𝑡ℎ𝑜𝑢𝑠𝑖𝑛𝑔
reach to 450%, which is unparalleled by any other
economies since 1980. What is the share of net housing wealth in private wealth
(𝐴𝑡ℎ𝑜𝑢𝑠𝑖𝑛𝑔
) in Hong Kong? Recently, Citibank released a survey-based study on
multimillionaires in Hong Kong24, according to which the share of housing in wealth
portfolio is particularly large in the city-state, and in addition that it has been rising
in the last decade: in 2018 housing wealth accounts for 75% of total net wealth of
multimillionaires, while in 2012 the share it was 68%. Housing wealth share in the
top wealth group is generally lower than it in total private wealth, since wealthy
people are more likely to hold more financial assets. Thus, we could see the
housing wealth share of multimillionaires as the lower bound of 𝐴𝑡ℎ𝑜𝑢𝑠𝑖𝑛𝑔
.
Comparing to other economies (see Figure 8, Panel B), Hong Kong’s 𝐴𝑡ℎ𝑜𝑢𝑠𝑖𝑛𝑔
is
unusually high.
Figure 8
24 “Hong Kong Affluent Study 2019/2020” by Citigroup Inc. September 23, 2020. Multimillionaires are defined as those with total net assets of HK$10 million or more and liquid assets of at least HK$1 million.
22
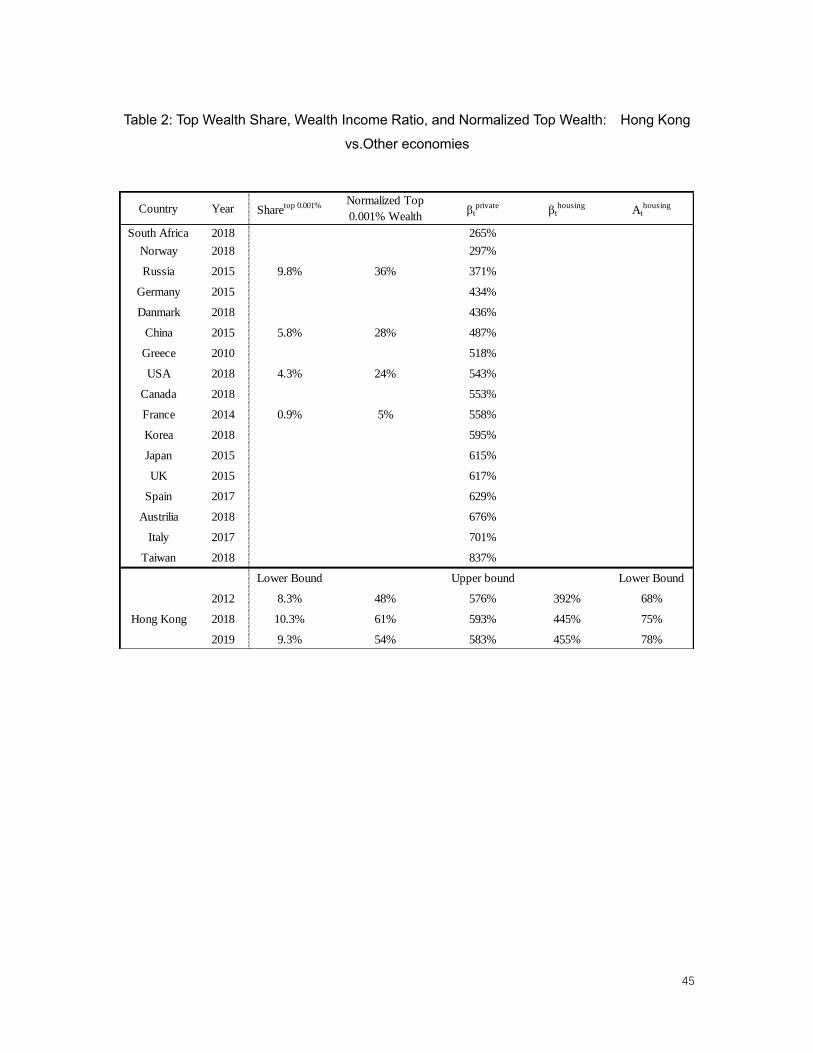
Table 2 presents our estimation of the private wealth national income ratio and top
0.001% wealth share for Hong Kong and other major economies in the world.25 In
the 2010s, the upper bond of Hong Kong’s private wealth income ratio (𝛽𝑡𝑝𝑟𝑖𝑣𝑎𝑡𝑒)
is between 576% to 593% of national income, in the similar level of Korea, Japan
and France. Under these assumptions the lower bound of top 0.001% wealth share
is between 83.% and 10.3%, which reaches to the same level of the upper bond
of top 0.001% wealth share in Russia26, and more than twice the level in US, 10
times of the level in France. In brief: expressed as a fraction of national income,
billionaire wealth and top 0,001% wealth reach levels in Hong Kong that are far
higher than any other country in the world; expressed as a fraction of aggregate
private wealth (which is also particularly high in Hong Kong, though the data
sources we have to measure this are imperfect), top 0,001% wealth shares in Hong
Kong are on par with Russia and substantially higher than in all other countries.
Table 2
5.2. Saving, Assets Prices and the Evolution of Wealth Concentration
Now we move to discuss the evolution of wealth accumulation and concentration
in Hong Kong. To structure our analysis, we follow the accounting framework
adapted from Piketty and Zucman (2014), Saez and Zucman (2016) and Kuhn et
al. (2020). Consider a simplified law of motion for wealth of fractile i at time t:
𝑊𝑡+1𝑖 = (1 + 𝑞𝑡
𝑖 + 𝜎𝑡𝑖 )𝑊𝑡
𝑖 (5)
25 Data for other economies is retrieved from the World Inequality Database. 26 Estimation of top 0.001% wealth share of Russia is provided by Novokmet et al. (2018). When using Russia Forbes Rich Lists to estimate the wealth share at the very top, Novokmet et al. (2018) treat each billionaire family as one adult. Relaxing assumption on the family size of billionaires (i.e., to 5 adults) will significantly increase the population base and decrease the estimation of the wealth share. For example, under the same assumption, in 2015 the top 0.005% (not 0.001%) wealth share in Russia is 9.8%. Thus, the top 0.001% wealth share of Russia reported in Table 2 should be treated as the upper bound of the estimation.
23
With 𝑞𝑡𝑖 capturing the contribution of capital gain to wealth growth, which is equal
to the sum of the capital gain of different assets in the asset portfolio (e.g., housing,
equity, savings); 𝜎𝑡𝑖 = 𝑠𝑡
𝑖 𝑌𝑡𝑖 /𝑊𝑡
𝑖 , capturing the contribution of savings to wealth
growth. 𝑠𝑡𝑖 = 𝑆𝑡
𝑖 /𝑌𝑡𝑖 is the saving rate or fractile i at time t.
Define net private wealth 𝑊𝑡 = ∑ 𝑊𝑡𝑖𝐼
𝑖=1 , national income 𝑌𝑡 = ∑ 𝑌𝑡𝑖𝐼
𝑖=1 ,and the
wealth share of fractile i in period t is 𝜔𝑡𝑖 = 𝑊𝑡
𝑖 /𝑊𝑡. Then the law of motion for the
wealth share 𝜔𝑡𝑖 is
𝜔𝑡+1𝑖
𝜔𝑡𝑖
=1 + 𝑞𝑡
𝑖 + 𝜎𝑡𝑖
1 + 𝑞𝑡 + 𝜎𝑡 (6)
⇒𝜔𝑡+1
𝑖 − 𝜔𝑡𝑖
𝜔𝑡𝑖
=𝑞𝑡
𝑖 − 𝑞𝑡 + 𝜎𝑡𝑖 − 𝜎𝑡
1 + 𝑞𝑡 + 𝜎𝑡 (7)
Where 𝑞𝑡 =∑ 𝑞𝑡
𝑖𝑊𝑡𝑖𝐼
𝑖=1
𝑊𝑡, 𝑠𝑡 =
∑ 𝑠𝑡𝑖𝑌𝑡
𝑖𝐼𝑖=1
𝑌𝑡, 𝜎𝑡 =
𝑠𝑡𝑌𝑡
𝑊𝑡
Let 𝜔𝑡+1𝑖 − 𝜔𝑡
𝑖 = Δω𝑡𝑖
⇒Δω𝑡
𝑖
𝜔𝑡𝑖
=𝑞𝑡
𝑖 − 𝑞𝑡 + 𝜎𝑡𝑖 − 𝜎𝑡
1 + 𝑞𝑡 + 𝜎𝑡 (8)
Let 𝑟𝑡 denote the average rate of return, 𝛼𝑡 =𝑟𝑡𝑊𝑡
𝑌𝑡 denotes capital share of
national income at time t. By analogy, we define 𝛼𝑡𝑖 =
𝑟𝑡𝑖𝑊𝑡
𝑖
𝑌𝑡𝑖 as the capital share of
fraction i at time t.
⇒ 𝜎𝑡 =𝑠𝑡𝑌𝑡
𝑊𝑡=
𝑠𝑡𝑟𝑡
𝛼𝑡, 𝑎𝑛𝑑 𝜎𝑡
𝑖 =𝑠𝑡
𝑖𝑌𝑡𝑖
𝑊𝑡𝑖
=𝑠𝑡
𝑖𝑟𝑡𝑖
𝛼𝑡𝑖
(9)
24
⇒Δω𝑡
𝑖
𝜔𝑡𝑖
=𝑞𝑡
𝑖 − 𝑞𝑡
1 + 𝑞𝑡 + 𝜎𝑡+
𝑠𝑡𝑖𝑟𝑡
𝑖
𝛼𝑡𝑖 −
𝑠𝑡𝑟𝑡
𝛼𝑡
1 + 𝑞𝑡 + 𝜎𝑡 (10)
We denote as 𝜑𝑡𝑞,𝑖 =
𝑞𝑡𝑖
𝑞𝑡 the relative the asset price premium of fraction i at time t,
𝜑𝑡𝑟,𝑖 =
𝑟𝑡𝑖
𝑟𝑡 the relative rate of return premium of fraction i at time t.
⇒Δω𝑡
𝑖
𝜔𝑡𝑖
=𝑞𝑡
1 + 𝑞𝑡 + 𝑟𝑡 ∗𝑠𝑡
𝛼𝑡
∗ (𝜑𝑡𝑞,𝑖 − 1) +
𝑟𝑡
1 + 𝑞𝑡 + 𝑟𝑡 ∗𝑠𝑡
𝛼𝑡
∗ (𝑠𝑡
𝑖
𝛼𝑡𝑖
∗ 𝜑𝑡𝑟,𝑖 −
𝑠𝑡
𝛼𝑡) (11)
This equation decomposes the change in wealth share (in percentage) of fractile i
to asset price effect 𝑞𝑡
1+𝑞𝑡+ 𝑟𝑡∗𝑠𝑡𝛼𝑡
∗ (𝜑𝑡𝑞,𝑖 − 1) , and saving effect
𝑟𝑡
1+𝑞𝑡+ 𝑟𝑡∗𝑠𝑡𝛼𝑡
∗ (𝑠𝑡
𝑖
𝛼𝑡𝑖 ∗
𝜑𝑡𝑟,𝑖 −
𝑠𝑡
𝛼𝑡) . Based on the decomposition results, when holding aggregate
parameters (i.e. 𝑞𝑡, 𝑟𝑡, 𝑠𝑡, 𝛼𝑡) constant, the asset price effect in the change of wealth
share is positively correlated with fractile i’s relative asset price premium 𝜑𝑡𝑞,𝑖
,
while saving effect is positively correlated with i’s saving rate 𝑠𝑡𝑖, relative rate of
return premium 𝜑𝑡𝑟,𝑖
, and the reciprocal of the capital share in its income. The
above decomposition also allows to conduct simulations of the evolution of wealth
shares. Due to lack of information on several key parameters for the period before
1996, our simulations focus only on the post-Handover period (1996-2016).
Table 3
The aggregate level parameters, namely 𝑟𝑡 , 𝛼𝑡 , 𝑠𝑡 , and 𝑞𝑡 , are presented in
Table 3. 𝑟𝑡 represents the real rate of return in Hong Kong for total private wealth,
which is equal to weighted average real rate of return on different type of private
assets. Since we do not have detailed data on rate of return by assets or shares
25
of assets, here we use the prime rate27 in real terms28 as a proxy for 𝑟𝑡. For the
whole period (1996-2016), the accumulated rate of return is 164% (yearly rate
5.0 %). 𝛼𝑡 represents the average capital share in national income over the period,
calculated based on our estimation of capital share in previous section. 𝑠𝑡
represents average private saving rate, estimated based on Hong Kong’s national
accounts. 𝑞𝑡 is contribution of capital gain to wealth growth, which can be
expressed as weighted capital gain of various assets (housing, equity, and
savings), 𝑞𝑡 = ∑ 𝑞𝑡𝑗𝐽
𝑗 𝐴𝑡𝑗, 𝐴𝑡
𝑗 represents share of asset j in net private wealth at time
t. We estimate real housing capital gain rate 𝑞𝑡ℎ𝑜𝑢𝑠𝑖𝑛𝑔
based the price index for
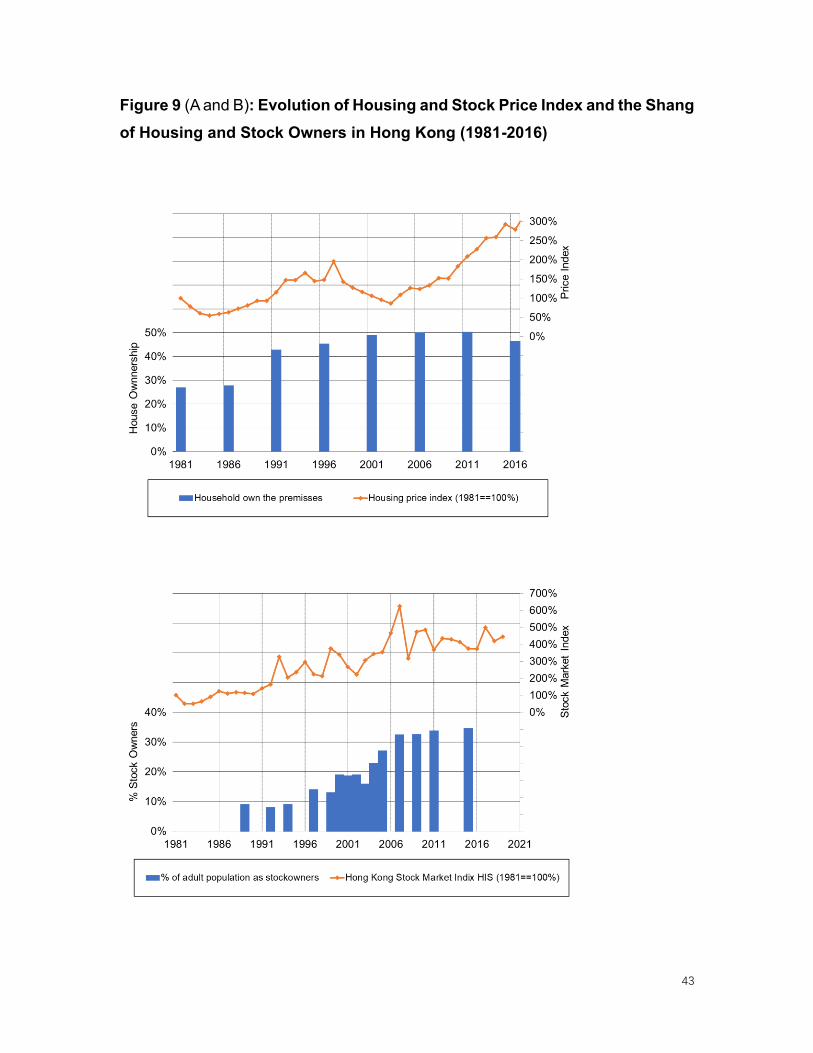
private domestic properties 29 and CPI (see Figure 10 panel A). 𝑞𝑡𝑒𝑞𝑢𝑖𝑡𝑦
is
estimated based on Hong Kong stock market price index (HIS) deflated by CPI
(see Figure 9 panel B). We assume the rate of capital gain on saving assets
(deposit, loans, bonds) 𝑞𝑡𝑠𝑎𝑣𝑖𝑛𝑔𝑠
equal to zero. National level capital gain in
housing and equities are estimated based on housing and stock index, see Figure
9 (Panel A and B). We assume 𝑞𝑡𝑠𝑎𝑣𝑖𝑛𝑔𝑠
equal to zero.
In order to estimate 𝑞𝑡, we also need to make assumption on the share of different
assets in net private wealth (𝐴𝑡𝑗). Based on Figure 8 Panel B, for most the rich
countries, the housing share in net private wealth in 1996 is below 40%. Due to
the rising of housing price (see Figure 8 Panel A and Figure 9 Panel A), housing
wealth national income ratio in Hong Kong is much higher than other countries,
thus we assume the housing share 𝐴1996ℎ𝑜𝑢𝑖𝑠𝑛𝑔
in Hong Kong is higher than other
countries by assigning 𝐴1996ℎ𝑜𝑢𝑖𝑠𝑛𝑔
equal to 50%. We then split the rest of private
wealth between equity wealth and non-equity financial wealth. Under such
assumption, the contribution of capital gain to wealth growth 𝑞𝑡 is equal to 51%
(see Table 3). We have to admit that to certain extent such assumption is arbitrary,
27 prime rate is the interest rate that commercial banks charge their most creditworthy corporate customers. 28 deflated by consumer price index (CPI) 29 published by Census and Statistics Department of Hong Kong
26
since we do not have further information on the portfolio of private wealth in Hong
Kong, however after experimenting with different assumptions in the simulation,
we find that our different assumptions result in the very similar evolution of wealth
inequality.
We now simulate the evolution of wealth share for the wealth group in the bottom
and at the top. Regarding Bottom wealth group, Figure 9 (Panel A and B) shows
that in 1996, more than 50% the households own an apartment and less than 20%
adult owns any stocks. Poon and Hon (2015) shows in 2014, the bottom 50%
income group in Hong Kong do not save or save very little30. Accordingly, we define
bottom groups as: the households who do not own any property or equity (𝜑𝑡𝑞,𝑖 =
0) and do not save (𝑠𝑡
𝑖
𝛼𝑡𝑖 ∗ 𝜑𝑡
𝑟,𝑖 = 0). Simulation results shows the wealth share for
bottom group will decrease 56% for the period of 1996-2016, while price effect and
saving effect are equally responsible for the decrease of wealth share (price effect
= -26% vs. saving effect= -31%). Given in Hong Kong a significant share of
household fall in this group, it is striking that their wealth share shrank so much.
We now move to top wealth groups. We define top wealth group as the superrich
(top 0.001%). We adopt moderate assumption by assuming the assets portfolio
consist only equity (𝐴𝑡𝑒𝑞𝑢𝑖𝑡𝑦
= 100%) and there is no capital gain premium within
assets, thus the capital gain is equal to the market capital gain (𝑞𝑡𝑖 = 26%). We
also adopt moderate assumption by assuming the saving rate of top group A (𝑠𝑡𝑖)
is 40%.31 We assume relative rate of return premium (𝜑𝑡𝑟,𝑖) is equal to 150% and
capital share (𝛼𝑡𝑖) is equal to 80%. Under such assumption, the total wealth share
of top wealth group raises 9%, which can be decomposed into -14% of price effect
and 23% of saving effect. Such results can be seen as the lower bound of the
30 Households in the bottom 50 income group own less than 5% of total household savings, see Poon and Hon (2015). 31 Saez and Zucman (2016) shows that the saving rate of top 1% wealth group in the US is between 30% to 45% for the period 1975 to 2012; Spaeth and Schmidt (2016) show that the saving rate of top 1% wealth group in Germany is 25% in 2013.
27
estimation, due to our moderate assumption. Increase the capital gain or saving
rate, or decrease the capital share in income will increase the wealth share of top
wealth group. Our simulation also shows that the rise of equity price relative to the
raise of housing price have a direct impact on the wealth share of the superrich
through the channel of price effect, since the share of equity in the wealth portfolio
of the superrich is often higher than the share of properties. By the same token,
when housing price rising faster than equity price, than the wealth share for the
middle class (house owners) will increase driven by the price effect. Such race
between the stock market and the housing market and its impact on the evolution
of wealth inequality have been carefully discussed in Kuhn et al. (2020) using US
data. However, such race only matters for the people who have (property or equity).
For those who do not own any real asset and only have small nominal savings,
their wealth share will decrease while the assets price increase.
6. Determinants of Political Attitudes in Hong Kong
What are the relationships between inequality and political cleavages in Hong
Kong? Are the top income earners and high-income professionals voting for the
same pollical collations as others ? In this section, we are going to extend previous
discussions and address these questions. Under Hong Kong’s partial-democratic
political structure, the Legislative Council (LegCo) has been formed by two
sections, namely the Functional Constituencies (FC) and the Geographical
Constituencies (GC). There are in total 70 seats in LegCo, which are equally
distributed between two sections since 2004. GC members in LegCo are returned
by direct elections from five geographical districts, while within functional
constituencies, 5 seats attribute to district council, the other 30 seats are limited to
about 230,000 voters in the other functional constituencies (mainly composed of
business and professional sectors). The Chief Executive is elected by a 1200-
member Election Committee drawn mostly from the voters in the FC. By design,
such system introduces certain disparity in representation between different
constituencies. For example, big corporations, business elites, and political elites

28
have privileged access to many constituencies with a small electorate, a handful
of sectors have a much larger voter base.
Since the first direct elections of LegCo in Hong Kong in 1991, the major political
cleavage dividing political parties has always been the attitude toward the Chinese
government and the issue of democratization. The pro-democracy camp generally
advocates a faster pace in democratization (including universal suffrage of the CE,
abolition of the FC), the protection of the rule of law and a higher degree of
autonomy. On the other hand, the pro-establishment (pro-Beijing) camp places
less emphasis on the progress of democratization than the need for stability and
harmony. They are more supportive of a closer integration between Hong Kong
and the mainland. The Centrist represent those who do not take sides between the
pro-democracy and pro-establishment camp. In practice they are closer to the pro-
establishment in the sense that they favor the status quo. The formation and
evolution of political system as well as political cleavage in Hong Kong are very
complex topics, which we are not able to fully unfold in this paper, for more detailed
discussion, see Li (1995), So (2002), and Wong (2017). In this section we aim to
understand the determinants for political inclination and contribute to the
understanding of the relationships between income inequality and political
cleavage in Hong Kong.
Our main analysis is based on the pre-nomination Survey for 2016 Legislative
Council Election which was conducted over 5,084 adult registered voters (about
0.08% adult population). After dropping observations with missing values, the
sample size reduces to 4310. Table 4 column 1 to 4 present the summary statistics
for the full sample and in each political camp. In the full sample, there are 14%
interviewee support pro-establishment camp, versus 36.9% supporting pro-
democracy camp and 32.4% interviewee choose to stay central (neither pro-
establishment nor pro-democracy). Others mainly consist of people who do not
have any clear political inclination. Since the income variables is not continuous
variable (reported by income groups), to simplify our analysis, we build a top
29
income dummy for top-income earners with monthly income higher than 40,000
HK$ (about 5160$).32 The shares of top-income earners do not differ significantly
across different political camps (around 14.5%). The centrists have slightly higher
share than the rest. In terms of the occupation distribution, pro-establishment camp
features highest share of Executives and Managers (14.6%), production workers
(9.3%) as well as retirees (38.9%), contrasting to pro-democracy camp with
highest share in professionals (20%) and students (12.9%). Interestingly, the
centrist contains the highest share in housewives and clerical and service workers.
Average age of interviewee is 50, pro-establishment voters are significantly older
than the centrist and pro-democracy voters. Female ratio is highest among the
centrist and lowest among the pro-establishment voters. Regarding the education
level, pro-establishment camp contains highest share of voters with primary and
secondary level education, while pro-democracy camp contains highest share of
voters with higher education.
To better understanding the determinants for political inclination, we apply logit
regression on political inclination dummies with the social and economic
background of voters. We include voting district fixed effects (5 voting districts),
standard error is clustered at the district level. The results are present in column 5
to 7. As shown in the results, the top income group (compared to the bottom 85%)
is not significantly inclined with Pro-establishment Camp, but significantly less
inclined to the Pro-democratic Camp. The possibility for the top income group to
vote for the pro-democracy camp is 88% (𝑜𝑑𝑑𝑠 𝑟𝑎𝑡𝑖𝑜=𝑒−0.13) of the possibility for
the bottom 85% to vote for the pro-democracy camp. Looking at occupations, the
probability for the executives and managers to vote for pro-BJ camp is significantly
32 In the survey data, the income variable is tabulated, the cut off is the highest threshold in income variable. One key difference between the electoral survey data that we use here and the electoral surveys used in other studies (such as the CSDS surveys used by Durrer and Gethin 2021) is that we have a bigger sample size and a more detailed income variable, so that we have enough observations to study the political attitudes of top income groups in a statistically significant manner. In addition the survey data used here allows to look at the “centrist” and not only at the “pro-establishment” and “pro-democracy” factions. On the other hand the survey we use has many other limitations, including the fact that we can provide a longitudinal studies.
30
higher than professionals ( 𝑜𝑑𝑑𝑠 𝑟𝑎𝑡𝑖𝑜 = 𝑒−0.502 = 61% ) or students
( 𝑜𝑑𝑑𝑠 𝑟𝑎𝑡𝑖𝑜 = 𝑒−1.111 = 33% ). Other occupations (i.e., clerical, service and
production workers, housewives as well as retirees) are also less likely to vote for
pro-establishment camp comparing to the executives and managers, but the
effects are not statistically significant. For democracy camp, the results are just the
opposite, except production workers, all other occupations have stronger
inclination for pro-democracy camp, especially, the inclination for -pro-democracy
of students and professionals is significantly higher than the executives and
managers. Additionally, we found housewives are most likely to vote for the centrist,
which is in line with the results in the summary statistics (column 2).
Last but not the least, inclination to pro-democratic camp also increases with
education level and decreases by age, which is contrary to the pro-establishment
camp, inclination decreases with education level and increases with age.
To conclude, our results show that the top income earners and high-income
professions, such as executives and managers are more likely to vote for "status
quo", the bottom 85% income group, students and professionals are more "pro-
democracy". As robustness check we also apply the same analysis to 2016
Election Rolling Survey for Legislative Council Election, which provide less detailed
information on education and occupation. The results from both surveys largely
resemble each other (for results for 2016 Election Rolling Survey, see Appendix E,
sheet AT2).
The alliance between the PRC government and Hong Kong business elites has
been well studied in the literature (Goodstadt, 2000; Fong, 2014a, 2014b). Indeed,
Beijing’s attempt in the past to maintain prosperity may well have contributed to
stretching the wealth gap, however there is still lack of systematical study to help
us understand the impact of interwoven dynamics among governments of
Mainland China and Hong Kong SAR, as well as Hong Kong business elites on
rising inequality in Hong Kong. What seems certain is that the extreme level of
31
inequality in Hong Kong play significant row at the development of social unrest in
Hong Kong in the last decade. Probably with the same understanding, very
recently the senior officials from Mainland China and Hong Kong SAR are
discussing ways to broaden the city’s tax structure and increase land supply in an
effort to mitigate Hong Kong’s inequality and high living costs (Zhai and Wong,
2021).33 Whether this will be sufficient to calm down public hanger with the rise of
“pluto-communism” is very uncertain at this stage.
7. Conclusion
In this paper we have combined and confronted several data sources in order to
analyze the evolution of income, wealth and electoral inequality in Hong Kong. We
have used national accounts, surveys, wealth rankings, tax data, and election poll.
We have obtained several main findings. First, wage inequality has raised in Hong
Kong significantly in the last four decades, especially in the post-Handover period.
Second, the capital share as well as the top wealth (normalized by national income)
in Hong Kong have increased enormously since the beginning of the century.
Today, Hong Kong is ranked at very top in the world in either the capital share, the
top wealth, or the top wealth share. Finally, the top income earners and high-
income professions, such as executives and managers are more likely to vote for
pro-establishment camp, the bottom 85% income group, students and lower-
income professionals are more pro-democratic.
We should stress again that our study has many limitations, in particular due to the
lack of adequate data access. The complete absence of fiscal data on capital
income, wealth and inheritances is particularly problematic. We very much hope
that more data will be available in the future in order to facilitate a finer
understanding of inequality trends in Hong Kong and China.
33 https://www.wsj.com/articles/china-targets-hong-kong-wealth-gap-housing-woes-after-political-purge-11615813651
32
Reference
Alvaredo, Facundo, Anthony B. Atkinson, and Salvatore Morelli. 2018. “Top Wealth Shares in the UK over More than a Century.” Journal of Public Economics 162: 26–47.
Alvaredo, Facundo, Bertrand Garbinti, and Thomas Piketty. 2017. “On the Share of Inheritance in Aggregate Wealth: Europe and the USA, 1900–2010.” Economica 84: 239–60.
Azmat, Ghazala, Alan Manning, and John Van Reenen. 2012. “Privatization and the Decline of Labour’s Share: International Evidence from Network Industries.” Economica 79(315): 470–92.
Bengtsson, Erik, and Daniel Waldenström. 2018. “Capital Shares and Income Inequality: Evidence from the Long Run.” Journal of Economic History 78(3): 712–43.
Blanchet, Thomas, Ignacio Flores, and Marc Morgan. 2018. “The Weight of the Rich: Improving Surveys Using Tax Data World Inequality Lab.” WID Working Paper Series No. 2018/12.
Chancel, Lucas, and Thomas Piketty. 2017. “Indian Income Inequality, 1922-2015: From British Raj to Billionaire Raj? World Inequality Lab.” WID Working Paper 2017/11
Chiu, Stephen W.K., and Tai Lok Lui. 2004. “Testing the Global City-Social Polarisation Thesis: Hong Kong since the 1990s.” Urban Studies 41(10): 1863–88.
Citigroup Inc. 2020. Hong Kong Affluent Study 2019/2020. Hong Kong. https://www.citibank.com.hk/english/info/pdf/Citibank_Announces_Results_of_Hong_Kong_Affluent_Study_2019-2020_Eng_final.pdf (June 16, 2021).
Czajka, Léo. 2017. “Income Inequality in Côte d’Ivoire: 1985-2014.” WID Working Paper Series No. 2017/8.
Dieter, Heribert. 2019. “Inequality and Social Problems in Hong Kong: The Reasons for the Broad Support of the Unrest.” Australian Journal of International Affairs.
Durrer, Carmen, Amory Gethin, “Inequality, Identity and the Structure of Political Cleavages in South Korea, Taiwan, and Hong Kong, 1996-2016”, WID WP 2021/06
Ellis, Luci, and Kathryn Smith. 2007. “The Global Upward Trend in the Profit Share.” BIS Working Papers.
Firpo, Sergio, Nicole Fortin, and Thomas Lemieux. 2018. “Decomposing Wage Distributions Using Recentered Influence Function Regressions.” Econometrics 6(2): 28.
Firpo, Sergio, Nicole M. Fortin, and Thomas Lemieux. 2009. “Unconditional Quantile Regressions.” Econometrica 77(3): 953–73.
Fong, Brian C.H. 2014a. Hong Kong’s Governance Under Chinese Sovereignty . 2nd ed.
33
Longdon: Taylor & Francis Ltd.
———. 2014b. “The Partnership between the Chinese Government and Hong Kong’s Capitalist Class: Implications for HKSAR Governance, 1997-2012.” China Quarterly 217(217): 195–220.
Fortin, Nicole, Thomas Lemieux, and Sergio Firpo. 2011. 4 Handbook of Labor Economics Decomposition Methods in Economics. Elsevier.
Garbinti, Bertrand, Jonathan Goupille-Lebret, and Thomas Piketty. 2018. “Income Inequality in France, 1900–2014: Evidence from Distributional National Accounts (DINA).” Journal of Public Economics 162: 63–77.
———. 2021. “Accounting for Wealth-Inequality Dynamics: Methods, Estimates, and Simulations for France.” Journal of the European Economic Association 19(1): 620–63.
Goodstadt, Leo F. 2000. “China and the Selection of Hong Kong’s Post-Colonial Political Elite.” China Quarterly 163(163): 721–41.
Ho, Lok Sang, Xiangdong Wei, and Chung Wong Wai. 2005. “The Effect of Outward Processing Trade on Wage Inequality: The Hong Kong Case.” Journal of International Economics 67(1): 241–56.
Karabarbounis, Loukas, and Brent Neiman. 2014. “The Global Decline of the Labor Share.” Quarterly Journal of Economics 129(1): 61–103.
Khalid, Muhammed Abdul, and Li Yang. 2021. “Income Inequality and Ethnic Cleavages in Malaysia: Evidence from Distributional National Accounts (1984–2014).” Journal of Asian Economics 72: 101252.
Kuhn, Moritz, Moritz Schularick, and Ulrike I. Steins. 2020. “Income and Wealth Inequality in America, 1949–2016.” Journal of Political Economy 128(9): 3469–3519.
Li, Pang-kwong. 2000. Hong Kong from Britain to China: Political Cleavages, Electoral Dynamics, and Institutional Changes. Aldershot, Brookfield, Singapore, and Sydney: Ashgate.
Li, Pang-Kwong. 1995. “Elections and Political Mobilisation: The Hong Kong 1991 Direct Elections.” University of London.
Morgan, Marc. 2017. “Falling Inequality beneath Extreme and Persistent Concentration: New Evidence for Brazil Combining National Accounts, Surveys and Fiscal Data, 2001-2015.”
Ng, Angie. 2013. “Fighting Inequality in Hong Kong: Lessons Learned from Occupy Hong Kong | Ng | Radical Criminology.” Radical Criminology 2: 47–68.
Novokmet, Filip, Thomas Piketty, and Gabriel Zucman. 2018. “From Soviets to Oligarchs: Inequality and Property in Russia 1905-2016.” The Journal of Economic Inequality 16(2): 189–223.
34
Piketty, T., and G. Zucman. 2014. “Capital Is Back: Wealth-Income Ratios in Rich Countries 1700-2010.” The Quarterly Journal of Economics 129(3): 1255–1310.
Piketty, Thomas; 2014. “Capital in the 21st Century.” Cambridge: Harvard Uni: 696.
Poon, Che Cheong, and Tai Yuen Hon. 2015. “Household Savings in Hong Kong: A Statistical Analysis.” Journal of Family and Economic Issues 36(3): 353–68.
Saez, Emmanuel, and Gabriel Zucman. 2016. “Wealth in Equality in the United States since 1913: Evidence from Capitalized Income Tax Data.” Quarterly Journal of Economics 131(2): 519–78.
So, Alvin Y. 2017. “A New Wave of Anti-Mainland Protests since 2012: Characteristics, Socio-Political Origins, and Political Implications.” Asian Education and Development Studies 6(4): 333–42.
Späth, Jochen, and Kai Daniel Schmid. 2016. “The Distribution of Household Savongs in Germany.” IAW Discussion Papers. https://ideas.repec.org/p/iaw/iawdip/128.html (June 16, 2021).
Stephen Robert Nagy. 2015. “Social Inequality and the Rise of Localism in Hong Kong.” Asian International Studies Review 16(2): 25–47.
Thomas Piketty, Emmanuel Saez, and Gabriel Zucman. 2018. “Distributional National Accounts: Methods and Estimates for the United States.” Quarterly Journal of Economics (revise & resubmit).
Wong, Mathew Y. H. 2017. Comparative Hong Kong Politics Comparative Hong Kong Politics. Singapore: Springer.
Wong, Mathew Y.H. 2020a. “Party Competition and Ideology in Hong Kong: A New Manifesto Coding Dataset.” Journal of East Asian Studies 20(2): 207–30.
———. 2020b. “Welfare or Politics? A Survey Experiment of Political Discontent and Support for Redistribution in Hong Kong.” Politics 40(1): 70–89.
Zhai, Keith, and Chun Han Wong. 2021. “China Targets Hong Kong Wealth Gap, Housing Woes After Political Purge .” The Wall Street Journal.
Zucman, Gabriel, Thomas Piketty, and Li Yang. 2019. “Capital Accumulation, Private Property and Rising Inequality in China, 1978–2015.” American Economic Review forthcoming.
35
Figure 1 (Panels A and B): Rising Wage Inequality in Hong Kong, 1981-2018
36
Figure 2: Evolution of Gini Coefficients for Wage Inequality in Hong Kong
37
Figure 3: Real growth rate of wage income per adult in Hong Kong
38
Figure 4: Overall Effects on the Change of Wage Gini by Economic Drivers
39
Figure 5: Capital share: Hong Kong vs. high income countries, 1991-2019
40
Figure 6 (Panels A and B): Density and wealth of Billionaires in 2017
41
Figure 7 (Panel A and B): Top 0.001% Wealth (as % National Income), 1987-2020
42
Figure 8: Evolution of Private Housing Wealth in Hong Kong and Other Major
Economies (1985-2019). Housing Wealth as a Fraction of National Income (Panel A)
and as a Fraction of Total Private Wealth (Panel B). Note: private housing wealth is equal
to the value of domestic private housing minus housing mortgage
43
Figure 9 (A and B): Evolution of Housing and Stock Price Index and the Shang
of Housing and Stock Owners in Hong Kong (1981-2016)
44
Table 1: Summary Statistics, RIF regression on Gini, and Oaxaca–Blinder decomposition for the change of Gini
[1] [2] [3] [4] [5] [6] [7] [8] [9] [10]
32.7% 41.3% 42.8%
1981 1996 2016 1981 1996 2016 14.1% *** -5.5% *** 6.9% *** -5.4% ***
Gender (base: Male)
Female 36% 39% 48% 0.072*** 0.008 0.005 0.2% *** -2.5% *** 0.1% -0.1%
Born place (base: Not born in HK)
Born in Hong Kong 48% 68% 72% 0.034*** 0.004 -0.035*** 0.7% *** -2.1% ** 0.0% -2.8% ***
Education (base: Secondary education)
Primary education 48% 19% 9% -0.009 0.024*** 0.011*** 0.3% 0.6% *** -0.3% *** -0.1% **
Higher education 7% 22% 44% 0.324*** 0.208*** 0.112*** 4.8% *** -2.5% *** 4.7% *** -4.2% ***
Industry (base: Manufactory)
Construction 10% 9% 9% -0.031*** -0.008 0.01 0.0% ** 0.2% * 0.0% 0.2% *
Wholesale and Retails 9% 15% 19% -0.066*** -0.034*** 0.004 -0.4% *** 0.5% * -0.1% *** 0.7% ***
Restaurant and Hotel 6% 8% 9% -0.090*** 0 0.038*** -0.1% *** 0.7% *** 0.0% 0.3% ***
TSC 8% 11% 13% -0.056*** -0.030*** 0.007 -0.2% *** 0.3% * -0.1% *** 0.5% ***
Finance 6% 16% 21% -0.018 0.036*** 0.095*** -0.2% 0.8% * 0.2% *** 1.2% ***
Service 16% 21% 24% -0.033** 0.017** 0.084*** -0.2% ** 1.1% *** 0.1% ** 1.6% ***
Others 1% 1% 1% -0.024 -0.018 0.101*** 0.0% 0.0% 0.0% 0.1% ***
Occupation (base: Worker)
Professionals 6% 22% 31% 0.209*** 0.003 -0.053*** 3.2% *** -4.5% *** 0.0% -1.7% ***
Administrion and Management 3% 9% 10% 0.628*** 0.277*** 0.312*** 3.8% *** -3.1% *** 0.2% *** 0.3%
Clericals 14% 19% 17% -0.053*** -0.046*** -0.072*** -0.3% *** 0.1% 0.1% *** -0.4% ***
Marriage (total effect) 0.2% * 1.3% *** 0.0% 0.1%
Age (total effect) 1.3% *** -4.9% *** 2.5% *** -13.9% ***
Districts (total effect) 0.9% * -2.9% ** -0.5% *** -11.2% ***
Constants 0.364*** 0.477*** 0.718*** 11.3% ** 24.1% ***
R-squared 0.2018 0.0752 0.1078
No. of Obs 16324 116254 138772
Share of employees in total population 53% 50% 43%
Employee Share Wage Gini Coefficient OB decomposition of Wage Gini Coefficient
1981 vs. 1996 1996 vs. 2016
Composition
effect
Wage
structure
Composition
effect
Wage
structure
8.6%*** 1.5%***
45
Table 2: Top Wealth Share, Wealth Income Ratio, and Normalized Top Wealth: Hong Kong
vs.Other economies
Country Year Sharetop 0.001%
Normalized Top
0.001% Wealthβt
privateβt
housingAt
housing
South Africa 2018 265%
Norway 2018 297%
Russia 2015 9.8% 36% 371%
Germany 2015 434%
Danmark 2018 436%
China 2015 5.8% 28% 487%
Greece 2010 518%
USA 2018 4.3% 24% 543%
Canada 2018 553%
France 2014 0.9% 5% 558%
Korea 2018 595%
Japan 2015 615%
UK 2015 617%
Spain 2017 629%
Austrilia 2018 676%
Italy 2017 701%
Taiwan 2018 837%
Lower Bound Upper bound Lower Bound
2012 8.3% 48% 576% 392% 68%
2018 10.3% 61% 593% 445% 75%
2019 9.3% 54% 583% 455% 78%
Hong Kong
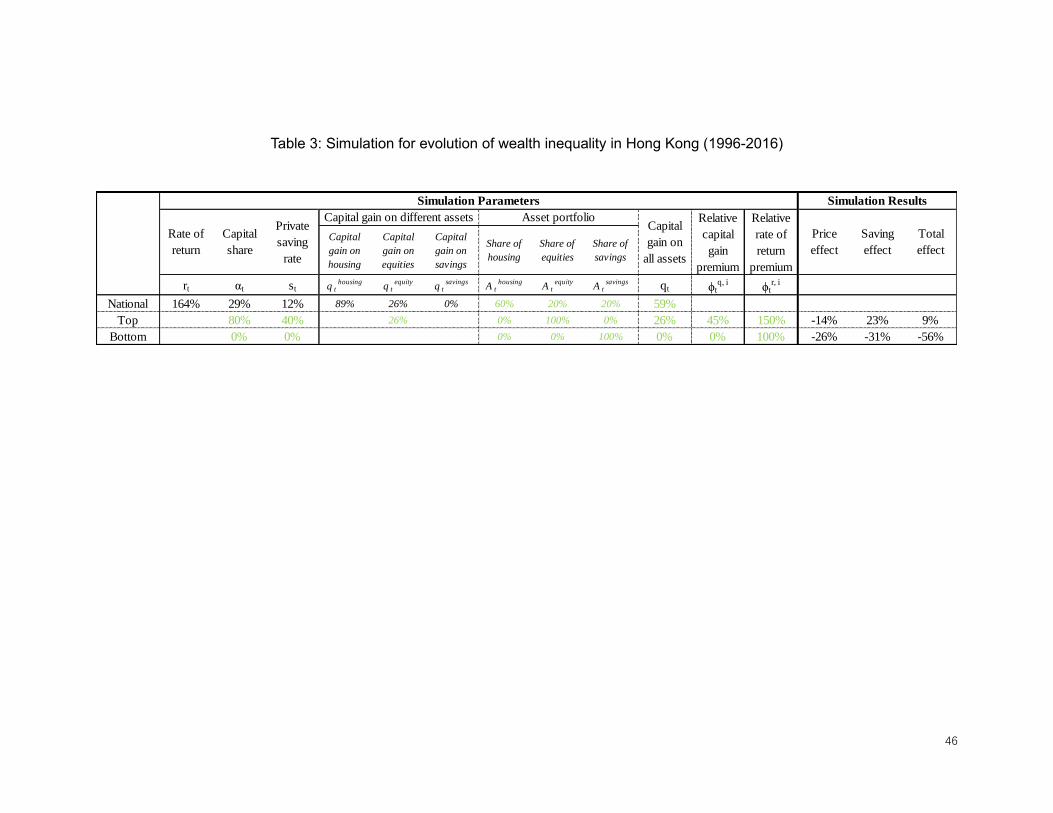
46
Table 3: Simulation for evolution of wealth inequality in Hong Kong (1996-2016)
Capital
gain on
housing
Capital
gain on
equities
Capital
gain on
savings
Share of
housing
Share of
equities
Share of
savings
rt αt st q thousing
q tequity
q tsavings
A thousing
A tequity
A tsavings qt ϕt
q, iϕt
r, i
National 164% 29% 12% 89% 26% 0% 60% 20% 20% 59%
Top 80% 40% 26% 0% 100% 0% 26% 45% 150% -14% 23% 9%
Bottom 0% 0% 0% 0% 100% 0% 0% 100% -26% -31% -56%
Price
effect
Saving
effect
Total
effect
Simulation ResultsSimulation Parameters
Relative
capital
gain
premium
Relative
rate of
return
premium
Rate of
return
Capital
share
Private
saving
rate
Capital gain on different assets Asset portfolioCapital
gain on
all assets
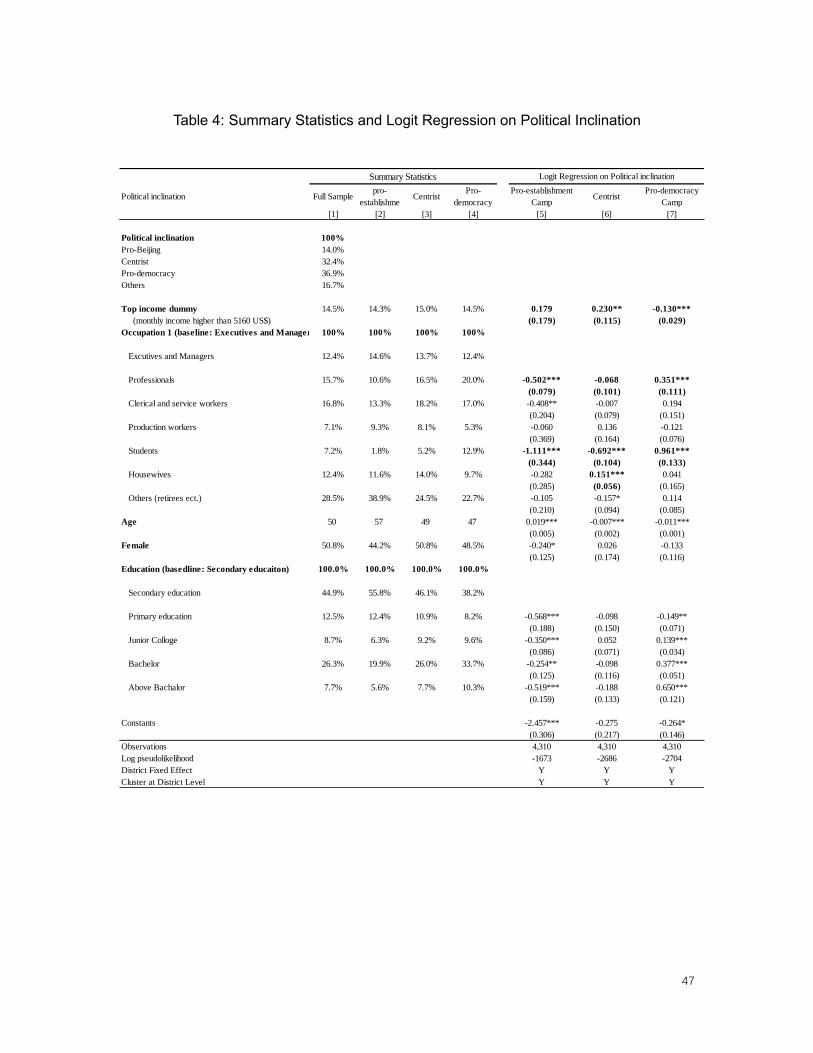
47
Table 4: Summary Statistics and Logit Regression on Political Inclination
Political inclination Full Samplepro-
establishmeCentrist
Pro-
democracy
Pro-establishment
CampCentrist
Pro-democracy
Camp
[1] [2] [3] [4] [5] [6] [7]
Political inclination 100%
Pro-Beijing 14.0%
Centrist 32.4%
Pro-democracy 36.9%
Others 16.7%
Top income dummy 14.5% 14.3% 15.0% 14.5% 0.179 0.230** -0.130***
(monthly income higher than 5160 US$) (0.179) (0.115) (0.029)
Occupation 1 (baseline: Executives and Managers) 100% 100% 100% 100%
Excutives and Managers 12.4% 14.6% 13.7% 12.4%
Professionals 15.7% 10.6% 16.5% 20.0% -0.502*** -0.068 0.351***
(0.079) (0.101) (0.111)
Clerical and service workers 16.8% 13.3% 18.2% 17.0% -0.408** -0.007 0.194
(0.204) (0.079) (0.151)
Production workers 7.1% 9.3% 8.1% 5.3% -0.060 0.136 -0.121
(0.369) (0.164) (0.076)
Students 7.2% 1.8% 5.2% 12.9% -1.111*** -0.692*** 0.961***
(0.344) (0.104) (0.133)
Housewives 12.4% 11.6% 14.0% 9.7% -0.282 0.151*** 0.041
(0.285) (0.056) (0.165)
Others (retirees ect.) 28.5% 38.9% 24.5% 22.7% -0.105 -0.157* 0.114
(0.210) (0.094) (0.085)
Age 50 57 49 47 0.019*** -0.007*** -0.011***
(0.005) (0.002) (0.001)
Female 50.8% 44.2% 50.8% 48.5% -0.240* 0.026 -0.133
(0.125) (0.174) (0.116)
Education (basedline: Secondary educaiton) 100.0% 100.0% 100.0% 100.0%
Secondary education 44.9% 55.8% 46.1% 38.2%
Primary education 12.5% 12.4% 10.9% 8.2% -0.568*** -0.098 -0.149**
(0.188) (0.150) (0.071)
Junior Colloge 8.7% 6.3% 9.2% 9.6% -0.350*** 0.052 0.139***
(0.086) (0.071) (0.034)
Bachelor 26.3% 19.9% 26.0% 33.7% -0.254** -0.098 0.377***
(0.125) (0.116) (0.051)
Above Bachalor 7.7% 5.6% 7.7% 10.3% -0.519*** -0.188 0.650***
(0.159) (0.133) (0.121)
Constants -2.457*** -0.275 -0.264*
(0.306) (0.217) (0.146)
Observations 4,310 4,310 4,310
Log pseudolikelihood -1673 -2686 -2704
District Fixed Effect Y Y Y
Cluster at District Level Y Y Y
Summary Statistics Logit Regression on Political inclination