inclusion in the recording studio - usc annenberg...
TRANSCRIPT

Inclusion in the Recording Studio?Gender and Race/Ethnicity of
Artists, Songwriters & Producers across 600 Popular Songs
from 2012-2017
Dr. Stacy L. Smith, Marc Choueiti & Dr. Katherine Pieper
January 2018
Annenberg Inclusion Initiative
Ariana Case, Sylvia Villanueva, Ozodi Onyeabor & Dorga Kim
Featuring

Annenberg Inclusion Initiative ‐‐ 1
January 25, 2018
For more than a decade, our research and advocacy think tank has become well known for its rigorous studies in entertainment. We have been examining representation on screen and hiring practices behind the camera in film and TV. Our passion to foster inclusion in media extends beyond these platforms. When we think of impactful storytelling, we think of a universal language of words and melodies that affect us all ‐ music. As a result, we announced in 2017 that we would be expanding our focus to include diversity and inclusion in the music industry.
To date, we are not aware of cutting edge, theory‐driven research and advocacy in the music space that engages with top companies and stakeholders around issues of inclusion. We’ve set our sights on filling that void.
Our vision is a first‐ever effort to combine research, industry engagement and advocacy to study inclusion in music. We believe that everyone should be seen and heard and proportional representation is just the first step in that process. The goal here is to create measureable change in hiring practices for women and underrepresented racial/ethnic groups across all facets of the music industry – on both the artistic and business sides. We are partnering with notable stakeholders to help us uncover places where improvement is needed and shape the global conversation.
We invite you to join us in this ambitious mission to create a national conversation around inclusion in music. We need everyone coming together, companies big and small, public and independent, and artists and executives working hand in hand on this critical task. This endeavor is about academia, the arts and industry partnering to create systemic and demonstrable change. Clearly, the time is now.
As we embark on this new chapter of the Annenberg Inclusion Initiative, we are excited to share with you our inaugural study in the music space and roll out our plans for our program of research to come.
Dr. Stacy L. Smith Leah Fischman Founder/Director Board Chair Annenberg Inclusion Initiative Annenberg Inclusion Initiative

INCLUSION IN THE RECORDING STUDIO?EXAMINING 600 POPULAR SONGS
USC ANNENBERG INCLUSION INITIATIVE @Inclusionists
FEMALES ARE MISSING IN POPULAR MUSIC
‘12 ‘13 ‘14 ‘15 ‘16 ‘17
22.7
Percentage of female artists across 600 songs... RATIO OF MALES TO FEMALES
3.5:1
TOTAL NUMBER OF ARTISTS
1,239
© 2018 DR. STACY L. SMITH
FOR FEMALES, MUSIC IS A SOLO ACTIVITYAcross 600 songs, percentage of females out of...
21.9 20.925.1
28.1
16.8
32.5
INDIVIDUALARTISTS
DUOSBANDS
22.4
ALL ARTISTS
8.7 5.1

Percentage of underrepresented artists by year...
VOICES HEARD: UNDERREPRESENTED ARTISTS ACROSS 600 SONGS
42%OF ARTISTS WERE FROM AN UNDERREPRESENTED RACIAL/ETHNIC GROUP
ACROSS 600 SONGSFROM 2012-2017
© 2018 DR. STACY L. SMITH
FEMALES
MALES
WRITTEN OFF: FEW FEMALES WORK AS SONGWRITERSSongwriter gender by year...
2012 2014 2017
89%
11%
87.3%
12.7%
87.7%
12.3%
TOTAL
88.3%
11.7%
86.3%
13.7%
86.7%
13.3%
88.6%
11.4%
2013 20162015
38.430.7 35.1
48.7 48.4
2012 2013 2014 2015 2016 2017
51.9
0
30
60
49 to 1THE RATIO OF MALE TO FEMALE PRODUCERS
ACROSS 300 POPULAR SONGS IS
FEMALES ARE PUSHED ASIDE AS PRODUCERS

© 2018 DR. STACY L. SMITH
651ONLY 2 PRODUCERS WERE FEMALES FROM AN UNDERREPRESENTED RACIAL/ETHNIC GROUP
OUT OF
20172012 2015 TOTAL
1.8%
98.2%
1.8%
98.2%
2.4%
97.6%
2%
98%
Percentage of women across three creative roles
WOMEN ARE MISSING IN THE MUSIC INDUSTRY
22.4%ARE
ARTISTS
12.3%ARE
SONGWRITERS
2% ARE
PRODUCERS
UNDERREPRESENTED FEMALES ARE INVISIBLE AS PRODUCERS
CREATIVE CONSTRAINTS: FEW FEMALE PRODUCERS WORK IN MUSIC

CREDITS & DEFICITS: MALES OUTPACE FEMALES IN SONGWRITING
Martin Sandberg (Max Martin)
Aubrey Graham (Drake)
Lukasz Gottwald (Dr. Luke)
Henry Walter (Cirkut)
Savan KotechaJohan Schuster (Shellback)
Mikkel Eriksen (Stargate)
Tor Erik Hermansen (Stargate)
THE TOP MALE WRITER HAS
36Onika Minaj (Nicki Minaj)
Katheryn Hudson (Katy Perry)
Adele Adkins
Sia Furler
Meghan Trainor
Julia Cavazos (Julia Michaels)
Robyn Fenty (Rihanna)
Brittany Hazzard (Starrah)
Taylor SwiftBenjamin Levin (Benny Blanco)
© 2018 DR. STACY L. SMITH
0
25
50
75
100
9.3%
OF GRAMMY® NOMINEESFROM 2013-2018WERE FEMALE.
90.7% WERE MALE.
THE GENDER GAP AT THE GRAMMY’S® IS REALPercentage of Female Nominees by Category, 2013-2018
93.9 78.792.1Record of the Year
Album of the Year
Song of the Year
Best NewArtist
63.6 100Producer
of the Year
6.1 21.37.9 36.4 0
Female Male
36
25
22
21
21
1717
13
13
15
13
11
9
8
87
6
6
Leading male and female songwriters by number of credits...
CREDITS
THE TOP FEMALE WRITER HAS
15CREDITS
ACROSS 600 POPULAR SONGSFROM 2012-2017
The top 9 male songwriters are responsible for roughly 20% of the 600 most popular songs from 2012 to 2017.
Top Male Songwriters # of credits Top Female Songwriters # of
credits

Annenberg Inclusion Initiative ‐‐ 6
Inclusion in the Recording Studio? Gender and Race/Ethnicity of Artists, Songwriters & Producers Across 600 Popular Songs
from 2012‐2017
Dr. Stacy L. Smith, Marc Choueiti, & Dr. Kate Pieper Annenberg Inclusion Initiative
USC The purpose of this research brief was to examine inclusion in popular music. We content analyzed artist gender and race/ethnicity across 600 songs appearing on the Billboard Hot 100 end of year charts from 2012 through 2017. A full 1,239 solo performers, duos, and bands were assessed. In addition to artists, we were also interested in how women were faring as songwriters (n=2,767) and producers (n=651) of popular lyrical content. Unlike artists and songwriters, our analysis of producers only spans 300 songs and 3 years. We also focused on talent diversity (n=899) in specific critically acclaimed classifications of the Grammy Awards®. Together, a total of 5,556 individuals comprised our intersectional analysis of artistry in popular music.
Key Findings
Artists. A total of 1,239 artists were attached to the 600 top songs. In 2017, a full 83.2% of artists were men and only 16.8% were women. This calculates into a gender ratio of 4.9 male artists to every 1 female artist. 2017 was a 6‐year low for female artists (16.8%) in popular content. In particular, the percentage of women in 2017 was significantly lower than in 2016 (28.1%) or in 2012 (22.7%). The top two genres for male and female performers were both pop and hip‐hop/rap. The third ranked genre for men was alternative and for women it was dance/electronic. Roughly a third (32.5%) of all individual credits were held by women with 2017 a 6‐year low (25.6%). Very few women were credited as band members (8.7% female, 91.3% male) and even smaller percentages were featured in duos (5.1% female, 94.9% male). The overall pool of song credits from 1,239 performers reduces to 496 unique artists. Very little deviation in the range of song credits over the sample time frame emerged by artist gender. For men, individual performing credits ranged from 1 to 25 songs. For women, the credits ranged from 1 to 20. Most men (59.3%) and women (60.5%) received only 1 solo credit across the sample time frame. Independent of gender, 8 of the 14 most successful artists were from underrepresented racial/ethnic groups. Drake, Justin Bieber, and Chris Brown topped the charts for males and Rihanna, Nicki Minaj, and Taylor Swift did so for females. A total of 24 duos were featured in the sample one or more times. A full 83.3% consisted of two males, 12.5% featured both a male and female, and only 1 or 4.2% comprised two females. The duos appearing most frequently were The Chainsmokers, Florida Georgia Line and Macklemore & Ryan Lewis. Of the 44 unique bands appearing in the sample one or more times, 31 or 70.5% featured all men, 11 or 25% were comprised of men and women, and only 2 or 4.5% contained all women. The most frequently appearing bands in the sample were all male: Maroon 5, Imagine Dragons, and One Direction.

Annenberg Inclusion Initiative ‐‐ 7
Across 1,239 artists, 42% were from underrepresented racial/ethnic groups. This point statistic is slightly above U.S. Census, which is 38.7%. The percentage of underrepresented artists has changed over time. The percentage in 2017 (51.9%) is 13.5 percentage points higher than the percentage in 2012 (38.4%). Approximately half of all artists in 2015, 2016, and 2017 were from underrepresented racial/ethnic backgrounds. Of the diverse artists, 413 (79.4%) were male and 107 (20.6%) were female. 42.9% of all male performers were underrepresented from 2012‐2017. For males, 2017 was (52.3%) higher than 2016 (46.4%) and 2012 (39.9%). Sample wide, 38.5% of all female performers were diverse. Yet in 2017 (50%) and 2016 (53.7%), fully half or more of all female artists were women of color. Moreover, the percentage of diverse females in 2017 is 16.7 percentage points higher than the percentage in 2012 (33.3%). A full 57% of all individual artists were underrepresented. 2017 was the 6‐year high for diverse artists with solo credits. Diverse artists comprised almost a third of all duos in the sample. Just under a fifth of all band members (17.9%) were from underrepresented racial/ethnic groups. The range of unique song credits for diverse artists was from 1 to 25 and for Caucasian artists the range was from 1 to 12. When we look to top underrepresented performers, Drake, Rihanna, and Nicki Minaj all outperform their Caucasian peers (i.e., Taylor Swift, Justin Bieber, Calvin Harris). A full 37.5% of all duos featured only diverse artists and 50% only featured Caucasians. Three of the duos (12.5%) were mixed with both diverse and non diverse artists. The top performing under‐represented duo was Rae Sremmurd followed by LMFAO. Few underrepresented bands appeared across the 6‐year time frame. Only 3 contained all underrepresented members. Fourteen of the bands had one or more diverse members and 27 bands or 61.4% were all Caucasian. Songwriters. Of the 2,767 songwriters credited, a full 87.7% were male and 12.3% were female. This calculates into a gender ratio of 7.1 male songwriters to every 1 female songwriter. Over time, the percentage of female songwriters has not changed. The difference between the percentage of women lyricists in 2017 and 2012 is less than one percent. Of the female songwriters, fully 40.2% were underrepresented. The percentage has increased over time. In 2012, only 29.8% of all female songwriters were diverse. In 2017, the percentage jumps to 54.4%. The 2,767 songwriters reduce to 1,322 unique individuals, of whom 1,158 were male (87.6%) and 164 (12.4%) were female. Nearly three‐fourths of these unique female songwriters (73.8%) only worked once in 6 years, 7.9% worked twice and 4.3% worked three times. Less than 6% of female songwriters had 6 or more credits across the time frame sampled. These percentages did not differ meaningfully from unique male songwriters. The most frequently working male songwriter had a total of 36 credits across the sample, while the top female had 15. All but 1 of the top females were singer‐songwriters in our sample, whereas only 1 of the males was also credited as an artist. Of the 9 top female songwriters, 44.4% were from an underrepresented racial/ethnic group. Of the 9 male songwriters listed below, 22.2% were underrepresented.

Annenberg Inclusion Initiative ‐‐ 8
The top nine male songwriters were responsible for almost one‐fifth (19.2%) of the songs in the 6‐year sample. Thus, these individuals are driving the work product and content of popular music and setting an agenda for the entire music industry. 237 songs had a female songwriter attached. These songs could be categorized in one of three ways: those with a female artist credited as a songwriter (53.6%, n=127), those with a female artist and a non‐performing female songwriter (29.1%, n=69), and those with only male artists and a female songwriter (17.3%, n=41). Of interest were the latter two categories, where there was an 11.8 percentage point (n=28 songs) difference between male and female artists working with non‐performing female songwriters. Together, these findings suggest that when a female artist is present, a female songwriter is more likely to be involved in the writing process than when only male artists are in the recording studio. Producers. Across these 300 songs and 651 producers, a full 98% were male and only 2% were female. The gender ratio of male producers to female producers is 49.1 to 1! No difference was observed over time. Of the 300 songs, a full 95.7% or 287 did not feature a single female producer. Of the female producers, only 2 were underrepresented. In terms of song credits, 9 were delineated as producers, 1 was a co producer, and 3 were vocal producers. Six of the 13 female producers were also artists, reducing the total number of producer‐only credits to 7 out of 300 songs. Grammy Award® Nominations. A total of 899 individuals were nominated for a Grammy Award® between 2013 and 2018. Of those, 90.7% were male and 9.3% were female. This is a gender ratio of 9.7 males to every 1 female. 2018 did not differ from 2017 or 2013. 2017 was the year with the lowest percentage of female nominees. Females were most likely to appear in the Best New Artist category, followed by Song of the Year. In contrast, fewer than 10% of the nominees for Record or Album of the Year were female. Over the last six years, no women have been nominated as Producer of the Year. The race/ethnicity of female nominees was ascertained. In total, 31% of nominations to females went to women from an underrepresented racial/ethnic group. Both males and females were most likely to receive just one nomination across the 6‐year sample. However, the range for females was from 1 to 7 nominations. For males, nominations ranged from 1 to 17. The report concludes by contextualizing the music findings within the larger ecosystem of entertainment. Further, a program of research is outlined that the Annenberg Inclusion Initiative (AII) intends to pursue on both the business and artistic side of the music industry. As equity and safety concerns continue to emerge in public discourse, AII is eager to partner with organizations interested in empirically‐oriented and theoretically‐driven solutions to inequality and exclusion.

Annenberg Inclusion Initiative ‐‐ 9
Inclusion in the Recording Studio? Gender and Race/Ethnicity of Artists, Songwriters & Producers Across 600 Popular Songs
from 2012‐2017
Dr. Stacy L. Smith, Marc Choueiti, & Dr. Kate Pieper Annenberg Inclusion Initiative
USC
The purpose of this research brief was to examine inclusion in popular music. To this end, we content analyzed artist gender and race/ethnicity across 600 songs appearing on the Billboard Hot 100 end of year charts from 2012 through 2017.1 In total, 1,239 solo performers, duos, and bands were assessed.2 In addition to artists, we were also interested in how women were faring as songwriters and producers of popular lyrical content. For each of these categories, the gender of content creators was noted as well as race/ethnicity of female songsmiths and producers. Unlike artists and songwriters, our analysis of producers only spans 300 songs and 3 years: 2012, 2015 and 2017. Given the anecdotal reports surrounding the infrequency of female producers in the music industry, three years provided sufficient evidence to illuminate the extent and seriousness of the problem. In addition to popular tunes, we also focused on diversity in specific critically acclaimed classifications of the Grammy Awards®. Using the same sample time frame, we were interested in the gender and race/ethnicity of female nominees and award winners in the following categories: record of the year, album of the year, song of the year, best new artist, and producer of the year. Overall, our report is divided into three major sections: 1) performers, 2) songwriters and producers, and 3) Grammy Awards®. The conclusion will focus on overall trends, limitations, and outline a program of research. Within each section, the findings are typically presented sample wide and by year. For comparison purposes, 2017 will be compared to 2016 as well as 2012. To avoid making noise about meaningless deviations, only differences of 5% or greater will be discussed.
Artists
Every credited artist across 600 songs was assessed for demographic characteristics. In this section, artist gender is overviewed from 2012 to 2017. Then, performer race/ethnicity is delineated.
Gender. A total of 1,239 artists were attached to the 600 top songs. In 2017, a full 83.2% of artists were men and only 16.8% were women. This calculates into a gender ratio of 4.9 male artists to every 1 female artist. Has the percentage of female performers changed over time? Yes! 2017 was a 6‐year low for female artists in popular content. In particular, the percentage of women in 2017 was significantly lower than in 2016 (‐11.3 percentage points) and in 2012 (‐5.9 percentage points).

Annenberg Inclusion Initiative ‐‐ 10
These findings are surprising given that females fill over half of the U.S. population and represent 50% or more of the streaming audience, digital consumers, and/or subscription holders.3
Table 1
Artist Gender by Year
Artist Gender 2012 2013 2014 2015 2016 2017 Total
Males 77.3% (n=153)
78.1% (n=168)
79.1% (n=178)
74.9% (n=146)
71.9% (n=138)
83.2% (n=178)
77.6% (n=961)
Females 22.7% (n=45)
21.9% (n=47)
20.9% (n=47)
25.1% (n=49)
28.1% (n=54)
16.8% (n=36)
22.4% (n=278)
Gender Ratio 3.4 to 1 3.6 to 1 3.8 to 1 3 to 1 2.5 to 1 4.9 to 1 3.5 to 1
We explored artist gender as it relates to two other variables: genre and credit type. In terms of genre, each song was sifted into one of six mutually exclusive categories using iTunes distinctions.4 Then, the genre tag was loaded onto each individual artist credited on the song. The results are shown in Table 2. The far right of the table shows that male artists have substantially more employment opportunities across all genres than their female peers. That said, the top two genres for male and female performers were both pop and hip‐hop/rap. The third ranked genre for men was alternative and for women it was dance/electronic.
Table 2
Song Genre by Artist Gender
Genre Males Females M to F Ratio
Pop 36.8% (n=354)
64% (n=178)
2 to 1
Hip‐Hop/Rap 25.3% (n=243)
11.9% (n=33)
7.4 to 1
Alternative 16.5% (n=159)
6.1% (n=17)
9.3 to 1
Country 6.6% (n=63)
7.5% (n=21)
3 to 1
R&B/Soul 5.9% (n=57)
2.2% (n=6)
9.5 to 1
Dance/Electronic 8.8% (n=85)
8.3% (n=23)
3.7 to 1
The credits on songs were evaluated in order to determine if performers were solo artists, duos or bands. A full 58.8% (n=728) of credits were assigned to individual artists or those listing a performer's unique name or pseudonym. Only 7.9% (n=98) of all credits were awarded to duos or two individuals that were recognized as receiving credit as a distinct and conjoined performing entity. Finally, band members accounted for 33.3% (n=413) of all credits. Bands

Annenberg Inclusion Initiative ‐‐ 11
involved three or more members that received credit via a distinct name or title. Featuring credits (19.9%, n=246) also appeared on songs (i.e., artists, duos, or bands that appear on a recording by a separate artist, duo, or band).5 Because the inclusion of featuring credits did not significantly affect overall gender trends, these artists were subsumed into the other three superordinate categories.
Table 3 Percentage of Female Artists by Credit Type
Credit Type 2012 2013 2014 2015 2016 2017 Total
Individual Artists 35.8% (n=39)
33.3% (n=37)
35.8% (n=43)
30.8% (n=41)
35.3% (n=43)
25.6% (n=34)
32.5% (n=237)
Duos 16.7% (n=1)
10% (n=2)
0 10% (n=1)
0 4.5% (n=1)
5.1% (n=5)
Bands 6% (n=5)
9.5% (n=8)
4.6% (n=4)
13.5% (n=7)
22.9% (n=11)
1.7% (n=1)
8.7% (n=36)
Note: The columns do not total to 100%. To obtain the percentage of men within each credit type by year, subtract the cell percentage from 100%. Artists receiving “featuring” credits were subsumed into one of the three credit types shown in the table. The unit of analysis is the individual within credit type.
Next, the aim was to examine whether gender varied within the three major credit types and over time. Two major trends are shown in Table 3. First, roughly a third (32.5%) of all solo credits were held by women with 2017 a 6‐year low. Second, very few women were credited in bands (8.7% female, 91.3% male) and even smaller percentages in duos (5.1% female, 94.9% male). Given the small sample sizes within these latter credit types, the over time percentages should be interpreted with caution. While the results in Table 3 are important, they do not reveal how often the same performers were populating the end of year charts. As such, we looked at the number of times each unique artist appeared on the top 100 lists within credit type by gender. To accomplish this, a two‐step process had to be undertaken. First, the songs repeating on year‐end charts had to be removed prior to analysis. This step was commenced to avoid double‐counting credits of songs that appeared more than once in the sample. A total of 53 songs fit this criterion and thus were removed. Second, every performer or group was looked up online for any and all pseudonyms. Then, the total number of times each unique artist or group appeared across the sample was tallied. This process condensed the overall pool of credits from 1,239 artists to 496 unique performers, thereby reducing the sample by almost two‐thirds (60%).

Annenberg Inclusion Initiative ‐‐ 12
Table 4 Number of Songs by Artists with Solo Credits by Gender
# of Songs
Male Artists Female Artists Total
# of Artists
% # of Artists
% # of Artists
%
1 115 59.3% 46 60.5% 161 59.6%
2 29 14.9% 8 10.5% 37 13.7%
3 18 9.3% 6 7.9% 24 8.9%
4 8 4.1% 3 3.9% 11 4.1%
5 5 2.6% 6 7.9% 11 4.1%
>6 19 9.8% 7 9.2% 26 9.6%
Total 194 100% 76 100% 270 100% Note: Percentages were calculated within gender. The range from 6 or higher was collapsed for presentational purposes. Solo credits included an artist's name or pseudonym receiving a performing or featuring credit on a song. No duos or bands were included in this analysis.
A total of 270 unique individuals received solo credits across the sample (see Table 4). Very little deviation emerged by gender. For men, individual performing credits ranged from 1 to 25 songs. For women, the credits ranged from 1 to 20. Most men (59.3%) and women (60.5%) received only 1 solo credit across the sample time frame. One meaningful difference emerged in Table 4, however. Females were slightly more likely to have 5 credits than were their male peers. Sample wide, the top performers are shown in Table 5. Independent of gender, 8 of the 14 most successful artists were from underrepresented racial/ethnic groups. Drake (25 songs), Justin Bieber (12 songs), and Chris Brown (12 songs) topped the charts for males and Rihanna (20 songs), Nicki Minaj (16 songs), and Taylor Swift (11 songs) did so for females.
Table 5 Top Individual Artists of Songs by Gender
Top Males
# of Songs
Top Females
# of Songs
Drake 25 Rihanna 20
Justin Bieber 12 Nicki Minaj 16
Chris Brown 12 Taylor Swift 11
Calvin Harris 10 Ariana Grande 9
Lil Wayne 8 Adele 8
Future 8 Katy Perry 8
Bruno Mars 8
The Weeknd 8
Annenberg Inclusion Initiative ‐‐ 13
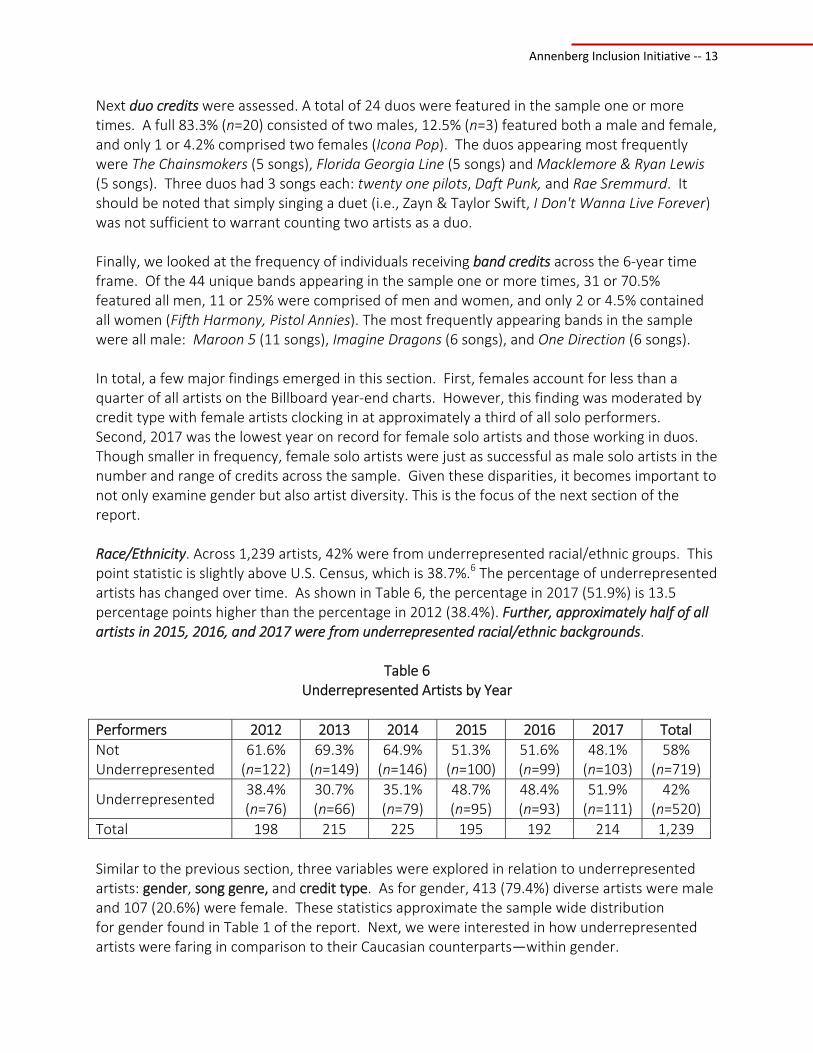
Next duo credits were assessed. A total of 24 duos were featured in the sample one or more times. A full 83.3% (n=20) consisted of two males, 12.5% (n=3) featured both a male and female, and only 1 or 4.2% comprised two females (Icona Pop). The duos appearing most frequently were The Chainsmokers (5 songs), Florida Georgia Line (5 songs) and Macklemore & Ryan Lewis (5 songs). Three duos had 3 songs each: twenty one pilots, Daft Punk, and Rae Sremmurd. It should be noted that simply singing a duet (i.e., Zayn & Taylor Swift, I Don't Wanna Live Forever) was not sufficient to warrant counting two artists as a duo. Finally, we looked at the frequency of individuals receiving band credits across the 6‐year time frame. Of the 44 unique bands appearing in the sample one or more times, 31 or 70.5% featured all men, 11 or 25% were comprised of men and women, and only 2 or 4.5% contained all women (Fifth Harmony, Pistol Annies). The most frequently appearing bands in the sample were all male: Maroon 5 (11 songs), Imagine Dragons (6 songs), and One Direction (6 songs). In total, a few major findings emerged in this section. First, females account for less than a quarter of all artists on the Billboard year‐end charts. However, this finding was moderated by credit type with female artists clocking in at approximately a third of all solo performers. Second, 2017 was the lowest year on record for female solo artists and those working in duos. Though smaller in frequency, female solo artists were just as successful as male solo artists in the number and range of credits across the sample. Given these disparities, it becomes important to not only examine gender but also artist diversity. This is the focus of the next section of the report. Race/Ethnicity. Across 1,239 artists, 42% were from underrepresented racial/ethnic groups. This point statistic is slightly above U.S. Census, which is 38.7%.6 The percentage of underrepresented artists has changed over time. As shown in Table 6, the percentage in 2017 (51.9%) is 13.5 percentage points higher than the percentage in 2012 (38.4%). Further, approximately half of all artists in 2015, 2016, and 2017 were from underrepresented racial/ethnic backgrounds.
Table 6 Underrepresented Artists by Year
Performers 2012 2013 2014 2015 2016 2017 Total
Not Underrepresented
61.6% (n=122)
69.3% (n=149)
64.9% (n=146)
51.3% (n=100)
51.6% (n=99)
48.1% (n=103)
58% (n=719)
Underrepresented 38.4% (n=76)
30.7% (n=66)
35.1% (n=79)
48.7% (n=95)
48.4% (n=93)
51.9% (n=111)
42% (n=520)
Total 198 215 225 195 192 214 1,239
Similar to the previous section, three variables were explored in relation to underrepresented artists: gender, song genre, and credit type. As for gender, 413 (79.4%) diverse artists were male and 107 (20.6%) were female. These statistics approximate the sample wide distribution for gender found in Table 1 of the report. Next, we were interested in how underrepresented artists were faring in comparison to their Caucasian counterparts—within gender.

Annenberg Inclusion Initiative ‐‐ 14
Figure 1 Underrepresented Male & Female Artists Over Time
To this end, Figure 1 displays the percentage of underrepresented males in blue. Subtracting each percentage within year from 100% will yield the percentage of Caucasian males. The same process was repeated for underrepresented females. Overall, 42.9% of all male performers were underrepresented from 2012‐2017. For males, 2017 is 5.9% higher than 2016 and 12.4% higher than 2012. Sample wide, 38.5% of all female performers were diverse. Yet in 2016 and 2017, fully half of all female artists were women of color. Moreover, the percentage of diverse females in 2017 is 16.7 points higher than the percentage in 2012 (33.3%). Song genre was also of interest. As shown in Table 7, the underrepresented status of artists is related to song type. Hip‐hop/rap and R&B/soul were far more likely to be the musical terrain of underrepresented artists than their Caucasian peers. Pop, alternative and country were more likely to be the domain of White than non White performers.

Annenberg Inclusion Initiative ‐‐ 15
Table 7
Song Genre by Underrepresented Artists
Genre Underrepresented
Artists Not Underrepresented
Artists
Pop 35.8% (n=186)
48.1% (n=346)
Hip‐Hop/Rap 45%
(n=234) 5.8% (n=42)
Alternative 1.5% (n=8)
23.4% (n=168)
Country <1% (n=2)
11.4% (n=82)
R&B/Soul 10.8% (n=56)
<1% (n=7)
Dance/Electronic 6.5% (n=34)
10.3% (n=74)
Pivoting to artist credit type (see Table 8), a full 57% of all individual artists were underrepresented. 2017 was the 6‐year high for diverse artists with solo credits. While not different from 2016, 2017 (65.4%) was significantly better for underrepresented artists with solo credits than 2012 (54.1%). Diverse artists comprised almost a third of all duos in the sample. However, the year‐to‐year findings should be interpreted with caution due to the small sample cell sizes. Just under a fifth of all band members (17.9%) were from underrepresented racial/ethnic groups, with substantial variability across years.
Table 8
Percentage of Underrepresented Artists by Credit Type
Credit Type 2012 2013 2014 2015 2016 2017 Total
UR Solo Artists 54.1% (n=59)
51.3% (n=57)
52.5% (n=63)
56.4% (n=75)
60.7% (n=74)
65.4% (n=87)
57% (n=415)
UR Artists in Duos 66.7% (n=4)
15% (n=3)
38.9% (n=7)
70% (n=7)
18.2% (n=4)
27.3% (n=6)
31.6% (n=31)
UR Artists in Bands 15.7% (n=13)
7.1% (n=6)
10.3% (n=9)
25% (n=13)
31.3% (n=15)
30.5% (n=18)
17.9% (n=74)
Note: The columns do not total to 100%. To obtain the percentage of non underrepresented artists within each credit type by year, subtract the cell percentage from 100%. Artists receiving “featuring” credits were subsumed into one of the three credit types shown in the table. The unit of analysis is the individual within credit type.
Consistent with our gender analysis, we also wanted to see how many unique under‐ represented artists populated the sample and the range of their credits. Solo credits by
Annenberg Inclusion Initiative ‐‐ 16
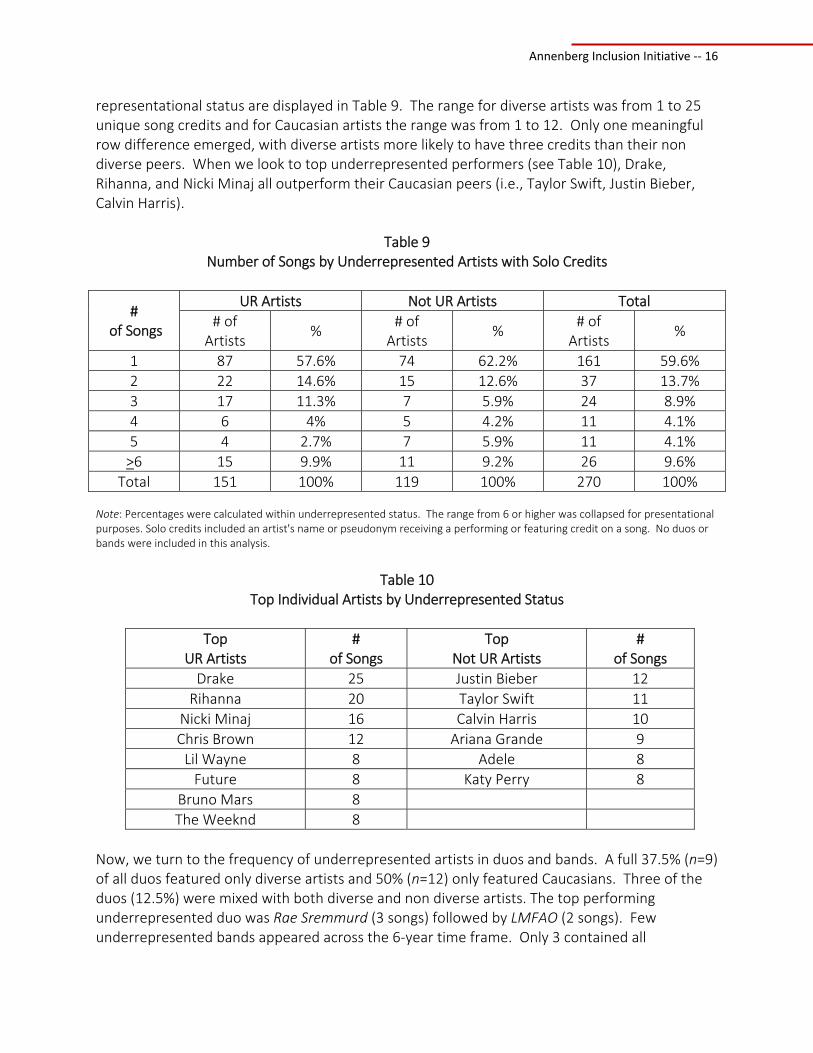
representational status are displayed in Table 9. The range for diverse artists was from 1 to 25 unique song credits and for Caucasian artists the range was from 1 to 12. Only one meaningful row difference emerged, with diverse artists more likely to have three credits than their non diverse peers. When we look to top underrepresented performers (see Table 10), Drake, Rihanna, and Nicki Minaj all outperform their Caucasian peers (i.e., Taylor Swift, Justin Bieber, Calvin Harris).
Table 9
Number of Songs by Underrepresented Artists with Solo Credits
# of Songs
UR Artists Not UR Artists Total
# of Artists
% # of Artists
% # of Artists
%
1 87 57.6% 74 62.2% 161 59.6%
2 22 14.6% 15 12.6% 37 13.7%
3 17 11.3% 7 5.9% 24 8.9%
4 6 4% 5 4.2% 11 4.1%
5 4 2.7% 7 5.9% 11 4.1%
>6 15 9.9% 11 9.2% 26 9.6%
Total 151 100% 119 100% 270 100% Note: Percentages were calculated within underrepresented status. The range from 6 or higher was collapsed for presentational purposes. Solo credits included an artist's name or pseudonym receiving a performing or featuring credit on a song. No duos or bands were included in this analysis.
Table 10
Top Individual Artists by Underrepresented Status
Top UR Artists
# of Songs
Top Not UR Artists
# of Songs
Drake 25 Justin Bieber 12
Rihanna 20 Taylor Swift 11
Nicki Minaj 16 Calvin Harris 10
Chris Brown 12 Ariana Grande 9
Lil Wayne 8 Adele 8
Future 8 Katy Perry 8
Bruno Mars 8
The Weeknd 8
Now, we turn to the frequency of underrepresented artists in duos and bands. A full 37.5% (n=9) of all duos featured only diverse artists and 50% (n=12) only featured Caucasians. Three of the duos (12.5%) were mixed with both diverse and non diverse artists. The top performing underrepresented duo was Rae Sremmurd (3 songs) followed by LMFAO (2 songs). Few underrepresented bands appeared across the 6‐year time frame. Only 3 contained all

Annenberg Inclusion Initiative ‐‐ 17
underrepresented members. Fifth Harmony and Migos both had 3 or more songs in the time frame evaluated whereas the Disciples had only 1. Fourteen of the bands had one or more diverse members and 27 bands or 61.4% were all Caucasian. Taken together, the results on underrepresented artists stand in contrast to gender. Over 40% of the credits across the top 600 songs were filled with performers from underrepresented racial/ethnic backgrounds. 2016 and 2017 were stand out years for women of color, with roughly half of all female artists from diverse groups. Further, the three most successful artists across the 6‐year time frame were people of color. Clearly, the music business is an entertainment industry leader when it comes to signing and fostering a merit‐based talent pool of performers from a variety of backgrounds and perspectives.
Songwriters & Producers
Besides artists, we wanted to assess the gender of songwriters and producers responsible for the top songs on the Billboard charts. The section below outlines our findings by gender as well as highlighting women of color within these occupational categories. Songwriters. Of the 2,767 songwriters7 credited, a full 87.7% were male and 12.3% were female. This calculates into a gender ratio of 7.1 male songwriters to every 1 female songwriter. Over time, the percentage of female songwriters has not changed (see Table 11). Matter of fact, the difference between the percentage of women lyricists in 2017 and 2012 is less than one percent.
Table 11 Songwriter Gender by Year
Writer Gender 2012 2013 2014 2015 2016 2017 Total
Males 89%
(n=380) 88.3% (n=355)
87.3% (n=407)
86.3% (n=416)
86.7% (n=425)
88.6% (n=443)
87.7% (n=2,426)
Females 11% (n=47)
11.7% (n=47)
12.7% (n=59)
13.7% (n=66)
13.3% (n=65)
11.4% (n=57)
12.3% (n=341)
Gender Ratio 8.1 to 1 7.5 to 1 6.9 to 1 6.3 to 1 6.5 to 1 7.8 to 1 7.1 to 1
Three additional attributes of female songwriters are worth noting. The first pertains to race/ethnicity. Of those female songwriters with enough information to evaluate race/ethnicity (n=341), fully 40.2% were underrepresented ‐‐ which is consistent with U.S. Census (38.7%).8 Further, the percentage has increased over time. In 2012, only 29.8% of all female songwriters were diverse. In 2017, the percentage jumps to 54.4% ‐‐ which is consistent with the proportion of underrepresented female performers noted above. The second factor pertains to genre. A full 60.1% of female songwriters’ credits were in pop and 14.7% were in Hip hop/rap. Just over 10% of women songwriters’ credits were in the electronic/dance genre. Very few females were employed as songwriters across the other genres (R&B/soul=5.9%, country=4.4%, alternative=4.4%) in the sample, however.

Annenberg Inclusion Initiative ‐‐ 18
The third attribute pertains to unique credits. The 2,767 songwriters reduce to 1,322 individuals, of whom 1,158 were male (87.6%) and 164 (12.4%) were female. As shown in Table 12, nearly three‐fourths of these female songwriters (73.8%) only worked once in 6 years, 7.9% worked twice and 4.3% worked three times. Less than 6% of female songwriters had 6 or more credits across the time frame sampled. Most male songwriters (70%) only worked once across the 6 years examined, though 12.4% worked twice, and 6.4% worked 6 or more times.
Table 12
Number of Songs by Songwriter Gender
# of Songs
Male Songwriters Female Songwriters Total
# of Writers
% # of
Writers %
# of Writers
%
1 811 70% 121 73.8% 932 70.5%
2 144 12.4% 13 7.9% 157 11.9%
3 69 6% 7 4.3% 76 5.7%
4 33 2.9% 9 5.5% 42 3.2%
5 27 2.3% 5 3.1% 32 2.4%
>6 74 6.4% 9 5.5% 83 6.3%
Total 1158 100% 164 100% 1322 100% Note: Percentages were calculated within gender. The range from 6 or more was collapsed for presentational purposes.
Table 13
Top Individual Songwriters by Gender
Top Males
# of Songs
Top Females
# of Songs
Martin Sandberg (Max Martin) 36 Onika Minaj (Nicki Minaj) 15
Aubrey Graham (Drake) 25 Robyn Fenty (Rihanna) 13
Benjamin Levin (Benny Blanco) 22 Taylor Swift 11
Lukasz Gottwald (Dr. Luke) 21 Katheryn Hudson (Katy Perry) 9
Henry Walter (Cirkut) 21 Adele Adkins 8
Savan Kotecha 17 Sia Furler 8
Johan Schuster (Shellback) 17 Brittany Hazzard (Starrah) 7
Mikkel Eriksen (Stargate) 13 Meghan Trainor 6
Tor Erik Hermansen (Stargate) 13 Julia Cavazos (Julia Michaels) 6
Who were the most frequently working male and female songwriters in popular music? Table 13 shows the answer to this question by highlighting the top scribes. The most frequently working male songwriter had a total of 36 credits across the sample, while the top female had 15. All but 1 of the females on the list were artists in our sample, whereas only 1 of the males was also credited as an artist. Of the 9 female songwriters in Table 13, 44.4% were from an

Annenberg Inclusion Initiative ‐‐ 19
underrepresented racial/ethnic group. Of the 9 male songwriters listed below, 22.2% were underrepresented. One further point related to top songwriters is of note. Together, the nine male songwriters listed in Table 13 are responsible for 19.2% of the songs in the six‐year sample. Thus, these individuals are driving the work product and content of popular music and setting an agenda for the entire music industry. We now turn our attention to the relationship between performer gender and songwriter gender. Here, we were interested in finding out whether female performers are working with female songwriters. To answer this, the sample was bifurcated into two silos. The first was the percentage of tunes with a female writer attached vs. those without female writers. Then, the percentage of songs with at least one female performer was calculated. The relationship between these two measures is shown in Figure 2. The percentage of songs with a female artist is 75.8 percentage points higher when a female writer is present.
Figure 2 Percentage of Female Artists & Female Songwriters
These findings need to be unpacked, however. As displayed in Table 13, many of the female artists in the sample were singer‐songwriters. Of the 196 songs with a female artist and songwriter, a full 64.8% (n=127) were accounted for by these hyphenates. After removing these credits from consideration, just over a third 35.2% (n=69) of all songs featuring a female performer employed one or more female songwriters. Thus, the tendency for female artists to

Annenberg Inclusion Initiative ‐‐ 20
work with female songwriters is largely explained by credits given to female artists for their work as lyricists. To further contextualize the work of female songwriters, an additional analysis was performed. The 237 songs with a female songwriter were parceled into three distinct groups: those with a female artist credited as a songwriter (53.6%, n=127), those with a female artist and a non‐performing female songwriter (29.1%, n=69), and those with only male artists and a female songwriter (17.3%, n=41). Of interest were the latter two categories, where there was an 11.8 percentage point (n=28 songs) difference between male and female artists working with non‐performing female songwriters. Together, these findings suggest that when a female artist is present, a female songwriter is more likely to be involved in the writing process than when only male artists are in the recording studio. Yet, the relationship between writer and female performer is small. Producers. Unlike artists and songwriters, we limited our investigation of producers to the 100 top songs of 2012, 2015, and 2017. Following guidelines from the Recording Academy, only producer, co‐producer, or vocal producer credits were included in this analysis.9 Repeat producers (i.e., those who received more than one producing credit across a single song) were excluded from analysis (n=12). Across these 300 songs and 651 producers, a full 98% were male and only 2% were female. The gender ratio of male producers to female producers is 49.1 to 1! No difference was observed over time (see Table 14). Of the 300 songs, a full 95.7% or 287 did not feature a single female producer.
Table 14 Producer Gender by Year
Producer Gender 2012 2015 2017 Total
Males 97.6% (n=200)
98.2% (n=217)
98.2% (n=221)
98% (n=638)
Females 2.4% (n=5)
1.8% (n=4)
1.8% (n=4)
2% (n=13)
Gender Ratio 40 to 1 54.3 to 1 55.3 to 1 49.1 to 1
Of the female producers, only 2 were underrepresented (i.e., Beyoncé, Ester Dean). In terms of song credits, 9 were delineated as producers, 1 was a co producer, and 3 were vocal producers. Six of the 13 female producers were also singer‐songwriters, reducing the total number of producer‐only credits to 7 out of 300 songs. Summing up, this section reveals that the employment opportunities for female songwriters and producers are grim. Less than one sixth of all songwriting credits and only 2% of all producing distinctions were held by women. This latter statistic is the most egregious sample wide, with the ratio of 49 male producers to every 1 female producer working across 300 songs. Clearly, these findings suggest that female producers face an epidemic of invisibility when it comes to

Annenberg Inclusion Initiative ‐‐ 21
working in the top leadership positions inside the recording industry. Next, we examine critical and award recognition.
Grammy Awards®: 2013‐2018 To understand whether awards and honors vary by gender, six years of Grammy® nominations in select categories were assessed. These categories included: Record of the Year, Album of the Year, Song of the Year, Best New Artist, and Producer of the Year. Each individual nominated for these awards from the 55th (2013) to the 60th (2018) Grammy Awards® was identified.10 If a band or a group was nominated, the individual members were ascertained and included in the analysis. Below, results are presented by year and category. Finally, the frequency of nominations by gender are evaluated. A total of 899 individuals were nominated for a Grammy Award® between 2013 and 2018. Of those, 90.7% were male and 9.3% were female. This is a gender ratio of 9.7 males to every 1 female. As depicted in Table 15, 2018 did not differ from 2017 or 2013. 2017 was the year with the lowest percentage of female nominees.
Table 15 Grammy® Nominations by Gender and Year
2013 2014 2015 2016 2017 2018 Total
Males 92.1% (n=105)
91.8% (n=156)
85.9% (n=134)
88.5% (n=138)
93.6% (n=190)
92% (n=92)
90.7% (n=815)
Females 7.9% (n=9)
8.2% (n=14)
14.1% (n=22)
11.5% (n=18)
6.4% (n=13)
8% (n=8)
9.3% (n=84)
Note: The gender of one producing group could not be identified and is not included in this analysis.
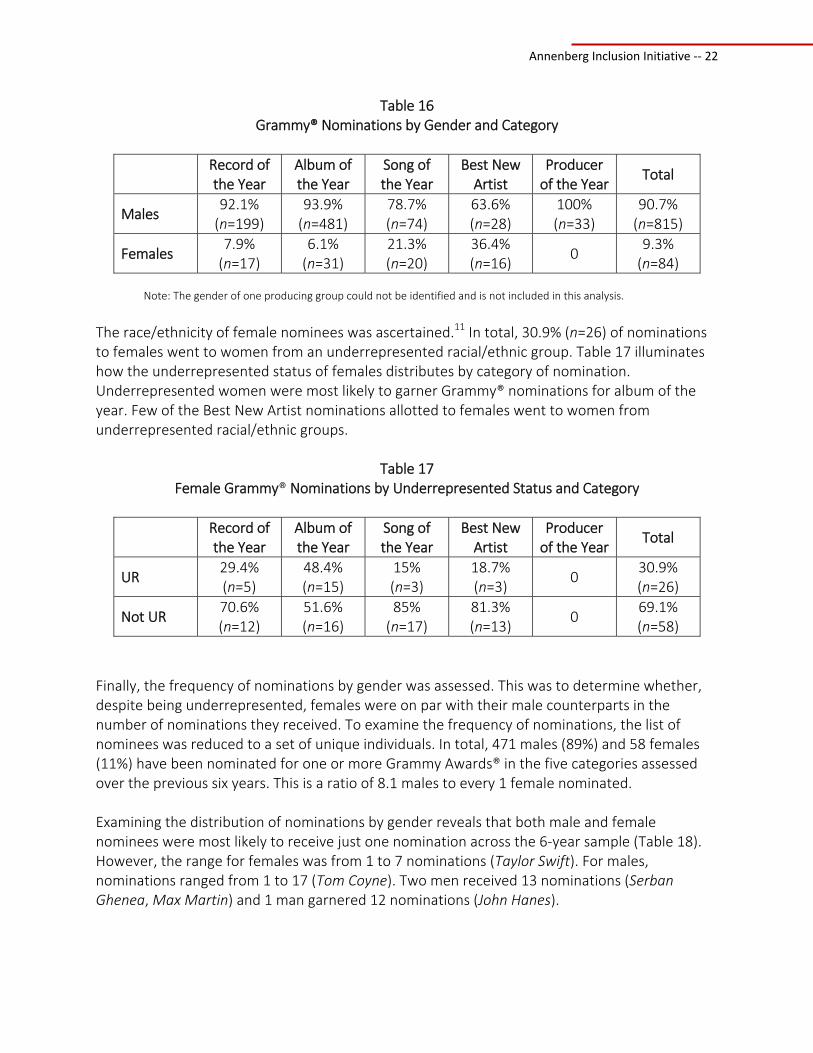
Next, each category of nomination was examined by gender. Table 16 reveals the percentage of females within award category. Females were most likely to appear in the Best New Artist category, followed by Song of the Year. In contrast, fewer than 10% of the nominees for Record or Album of the Year were female. Over the last six years, no women have been nominated as Producer of the Year.
Annenberg Inclusion Initiative ‐‐ 22
Table 16 Grammy® Nominations by Gender and Category
Record of the Year
Album of the Year
Song of the Year
Best New Artist
Producer of the Year
Total
Males 92.1% (n=199)
93.9% (n=481)
78.7% (n=74)
63.6% (n=28)
100% (n=33)
90.7% (n=815)
Females 7.9% (n=17)
6.1% (n=31)
21.3% (n=20)
36.4% (n=16)
0 9.3% (n=84)
Note: The gender of one producing group could not be identified and is not included in this analysis.
The race/ethnicity of female nominees was ascertained.11 In total, 30.9% (n=26) of nominations to females went to women from an underrepresented racial/ethnic group. Table 17 illuminates how the underrepresented status of females distributes by category of nomination. Underrepresented women were most likely to garner Grammy® nominations for album of the year. Few of the Best New Artist nominations allotted to females went to women from underrepresented racial/ethnic groups.
Table 17 Female Grammy® Nominations by Underrepresented Status and Category
Record of the Year
Album of the Year
Song of the Year
Best New Artist
Producer of the Year
Total
UR 29.4% (n=5)
48.4% (n=15)
15% (n=3)
18.7% (n=3)
0 30.9% (n=26)
Not UR 70.6% (n=12)
51.6% (n=16)
85% (n=17)
81.3% (n=13)
0 69.1% (n=58)
Finally, the frequency of nominations by gender was assessed. This was to determine whether, despite being underrepresented, females were on par with their male counterparts in the number of nominations they received. To examine the frequency of nominations, the list of nominees was reduced to a set of unique individuals. In total, 471 males (89%) and 58 females (11%) have been nominated for one or more Grammy Awards® in the five categories assessed over the previous six years. This is a ratio of 8.1 males to every 1 female nominated. Examining the distribution of nominations by gender reveals that both male and female nominees were most likely to receive just one nomination across the 6‐year sample (Table 18). However, the range for females was from 1 to 7 nominations (Taylor Swift). For males, nominations ranged from 1 to 17 (Tom Coyne). Two men received 13 nominations (Serban Ghenea, Max Martin) and 1 man garnered 12 nominations (John Hanes).

Annenberg Inclusion Initiative ‐‐ 23
Table 18 Number of Grammy® Nominations by Gender
No. of Nominations Males Females
1 70.7% (n=333) 72.4% (n=42)
2 14.9% (n=70) 19% (n=11)
3 5.3% (n=25) 5.2% (n=3)
4 3.8% (n=18) 1.7% (n=1)
>5 5.3% (n=25) 1.7% (n=1)
Total 471 58
Note: Columns total to 100%.
Examining frequency of nominations for females more specifically, slight differences emerged by race/ethnicity. Of the 58 women receiving Grammy® nominations, 32.7% (n=19) were from underrepresented racial/ethnic groups. Underrepresented females were just as likely (73.7%, n=14) as non‐underrepresented women (71.8%, n=28) to receive just one nomination in the 6‐year period. Females not from an underrepresented group were more likely to receive 3 nominations (7.7%, n=3) than diverse women (n=0). One underrepresented woman (Beyoncé) and one non underrepresented woman (Taylor Swift) received more than 3 nominations. The range for underrepresented women was from 1 to 4 nominations. The results of this section emphasize that females are underrepresented not only among the popular charts of the music industry, but when it comes to notoriety among peers and critics as well. Across 6 years of notable Grammy Award® nominations, roughly 10% of nominees were female. The frequency of nominations also reveal that, although men and women are likely to only be nominated for a single Grammy® award, women face a restriction in the range of times they are nominated whereas the cap for men is higher. These results extend the findings of the previous sections and further emphasize the degree to which the music industry marginalizes female talent.
Conclusion
The purpose of the present study was to examine gender and race/ethnicity in the music industry. As such, the study explored 6 years of popular music to assess artists, writers, and producers. Further, six years of Grammy® nominations were evaluated to understand whether acclaim from peers and critics falls along gendered lines. Four major results emerged. #1 Females are Missing in Popular Music Of 600 popular songs on the Billboard Hot 100 year end charts from 2012 to 2017, women comprised just 22.4% of artists and 12.3% of songwriters. 2017 represented a 6‐year low for female artists—an unexpected result in a year when women forcibly took hold of the cultural conversation. Of 300 popular songs, a mere 2% of producers were female. In fact, the gender

Annenberg Inclusion Initiative ‐‐ 24
ratio of male to female producers was 49.1 to 1 and in 2017, only 4 female producers worked on the 100 top songs. Finally, at the Grammy Awards® over the last 6 years, less than 10% of all nominees in 5 major categories were female. This includes a complete absence of women nominated for Producer of the Year. The lack of women in these roles is surprising, given that women are a powerful market for music consumption: women comprised 53% of digital music buyers in 2014.12 The nature of women’s participation in music is also curious. Women were less likely than men to perform in bands or duos‐‐less than 20% of duos featured a female, and less than one‐third of band members were female. For women, pursuing music as an artist is largely a solo activity, and appears to be a lonely one. #2 Racial/Ethnic Inclusion Appears in Some Areas of the Music Industry Individuals from underrepresented racial/ethnic groups comprised 42% of artists across the 6 years sampled, a percentage which has increased over time. In terms of frequency of work, these artists also outpace their non‐underrepresented peers. What is more, females from underrepresented racial/ethnic groups represented 38.5% of all female artists, and appeared with greater frequency than their White female counterparts. Similarly, though few women work as songwriters, 40.2% of these positions were held by women of color, even increasing over time alongside a rise in underrepresented female artists. The percentage of underrepresented females as artists and songwriters is in line with U.S. Census data,13 suggesting that women of color working in the music industry matches the population proportionally—though there are still fewer women overall. Where females from underrepresented groups do lag is in producing positions. Only two females from underrepresented racial/ethnic groups worked as producers across 600 songs. Clearly, this is an area where not only women, but women of color must be hired and championed, as will be discussed further below. Finally, while the percentage of underrepresented female artists and songwriters is in proportion to the U.S. population, disaggregating the data reveals a more nuanced trend. The majority of underrepresented female artists and songwriters are Black women—suggesting that women from other racial/ethnic backgrounds are not breaking into the ranks of top artists and songwriters at the same rate as their Black female peers.
#3 Genre and Gender are Linked for Women, but not for Men The third finding is that song genre plays a role in the careers of women. While males work across genres, females do not have this flexibility. Among artists, females were more likely than males to work in pop, and less likely to work in hip hop/rap or alternative music. As songwriters, over half (60%) of female songwriters wrote pop songs, with just 15% creating hip hop lyrics and 10% authoring dance/electronic music. Opportunities for female artists and songwriters appear to be linked to a particular genre, with little chance to move out of this category.
Annenberg Inclusion Initiative ‐‐ 25
Given the predominance of female artists and songwriters in a single genre (i.e., pop), it is unsurprising that the majority of songs with at least one female artist were penned by one or more female songwriters. Yet, rather than reflecting a tendency for females to collaborate, the majority of these songs (65%) were written by female singer‐songwriters. For women crafting lyrics for others to perform, female artists are important allies, but not a panacea to creating more chances for female songwriters to thrive. In particular, there is only a small increase in the number of opportunities for female songwriters by including a female performer. Seeing more female artists reach the popular charts, or greater advocacy among women for their songwriting colleagues is imperative if these findings are to change. Of course, males have a role to play as well in the expansion of opportunities for female lyricists. Nearly 20% of the popular songs in this sample were crafted with the input of nine male songwriters. Male artists, producers, and fellow songwriters can do more in to include their female contemporaries in the process of penning popular songs. #4 Music Diverges from and Dovetails with Other Forms of Entertainment The results of this report speak to both the similarities and differences between the music industry and other forms of entertainment. Previous research demonstrates that film in particular fails to represent women as speaking characters or in leading roles.14 While television and digital entertainment fare better,15 women do fall behind their male counterparts in these platforms. Music is no different. Female artists, songwriters, and producers are all less likely to appear in the Hot 100 year‐end chart than males. Where music shows a more progressive side, however, is in the percentage of underrepresented females showcased in the popular charts. In 2016, half of female artists were from underrepresented racial/ethnic backgrounds. That same year, in film, only 3 of the female leads and co leads of the 100 top‐grossing movies were underrepresented.16 Clearly, other facets of entertainment can learn from music’s example. There is a viable and vital global audience for music from underrepresented groups—and no reason to believe that these audiences would not translate to other forms of storytelling. Another similarity between the recording industry and entertainment more generally is the lack of women in key leadership positions. Across 1,100 top‐grossing films from 2007 to 2017, just 4% of all directors were female, with only 8 women from underrepresented racial/ethnic groups working in that time frame.17 In the same time frame (2007 to 2017), just 1.4% of all film composers were female.18 In music, a mere 2% of all producers of 300 top songs were women, and only 2 were women of color. The lack of women in roles responsible for creative direction across visual and audio entertainment is troubling. This appears to reflect deeply‐held biases related to women and leadership, some of which we have illuminated in film and which may carry over into the music industry.19 Addressing these beliefs is paramount to opening doors for women in all creative roles, and offering females a chance to shape the cultural narratives and landscape in which entertainment is made.

Annenberg Inclusion Initiative ‐‐ 26
Limitations A research study of this type is not without limitations, and we would be remiss not to address the most salient here. First, the sample in this study was driven by the Billboard Hot 100 year‐end charts. These charts reflect an amalgamation of air play, sales, and streaming data. Utilizing a different source or relying on a different formula weighting these factors might result in a divergent set of songs and thus, different creative participants. Further, using a larger sample or studying a greater pool of artists might provide an industry profile that differs from what is presented here. Billboard charts were seen in this study as sufficient for the purposes of identifying popular music, and their use by industry members as a source of information about song performance further influenced this choice. A second limitation relates to the measurement of race/ethnicity in this study. Racial/ethnic background for songwriters and producers was only measured for females. Additionally, all data is presented at an aggregated level focusing on whether individuals are underrepresented or not. The lack of available data on songwriters and producers (and even some artists) did not allow for these figures to be disaggregated. Future research should address this limitation to examine how different racial/ethnic groups fare in popular music and whether trends in this report are driven by the predominance of one racial group rather than by proportional representation of different groups. Further, the race/ethnicity of male songwriters and producers must be explored to understand the impediments that may be in place for men from different backgrounds throughout the music industry. Third, only select positions involved in the music industry were explored in this investigation. Additional information on individuals working as session singers, instrumentalists, mixing and mastering engineers throughout the industry must also be further clarified. Moving to the business side of the industry, the executive ranks of major music companies must be explored. These less visible but important aspects of the recording process may be places where inequality lurks. Directions for Future Research In line with the final limitation above, this report represents the first study by the Annenberg Inclusion Initiative on the music industry. As such, it serves as a critical first step in a program of research to better understand the nature, causes, and solutions to inequality in music. Below, a set of initial queries are outlined. These offer several avenues the Annenberg Inclusion Initiative plans to explore over the next several years to understand inclusion deficits and successes across the recording industry. One important future step is to continue and expand the cataloguing of gender differences throughout the industry. This implicates not only those individuals involved in the creation of songs, but the executive ranks where talent is identified and nurtured. The artistic aspects of making music do not happen in isolation from business decisions—thus it will be important to
Annenberg Inclusion Initiative ‐‐ 27
understand the profile of the decision‐makers whose opinions and beliefs dictate who is signed, promoted, and ultimately succeeds in this industry. Another fertile ground for research is the reasons for underrepresentation of women or people of color in different positions. Our previous research20 has pursued this line of inquiry for directors and producers in film, and the results point to mythologizing and other biases held by industry leaders that result in the exclusion—particularly of women and people of color—in certain creative roles. It is necessary to understand if similar (or different) factors are at work in the music industry. For instance, the barrier to entry in creating or disseminating songs may be low in music due to the existence of inexpensive technology. This may allow individuals from underrepresented communities to cultivate their talent and develop an audience. However, in more technical roles (e.g., producing, mixing, engineering), obstacles may exist for females related to pursuing math, science, or other STEM fields.21 These impediments must be determined and differentiated across positions to capture unique situations and more overarching obstacles.
Related to both of these research areas is the need to examine the pipeline for music industry workers. This includes cataloguing educational programs that train young musicians, executives, or engineers, and the pool of talent that emerges from those schools. Moreover, research should explore whether there are biases baked into music education (e.g., in history texts or other materials) that affect later career opportunities. Further, exploring the nature of mentorship and sponsorship as they relate to the trajectories of women and people of color is crucial to addressing gaps in representation at different levels of the industry. The goal of these multifaceted investigations is to develop solutions that companies, industry members, advocates, and consumers can utilize to improve representation and deepen inclusion across the music business. As we have seen in film and other visual entertainment media, studies alone are not the answer to decades of under‐ and misrepresentation. Instead, the values and strategies of the industry must shift, and theoretically and empirically relevant levers must be activated to create true change. This research report offers a thorough picture of the landscape of popular music when it comes to issues of inclusion. An industry with international reach and culture‐shaping products, the music business is a place where inclusion is imperative. Addressing the deficits that currently exist will prevent this industry from being mired in the past and make it one that is moving toward the future.

Annenberg Inclusion Initiative ‐‐ 28
Footnotes
1. Billboard charts for the Hot 100 songs each year were accessed from https://www.billboard.com /charts/year‐end. The Billboard Hot 100 was chosen as a measure of overall popularity across different genres as it includes radio play, sales, and streaming data in its calculations of popularity. The weaknesses of the Billboard Hot 100 chart include a lack of transparency in the formula used to determine chart positioning and the relative weighting of streaming data (and type of streaming data used in calculations). However, the Billboard charts remain an industry standard and were selected to reflect popular songs over a year‐long period. Due to Billboard’s calculations, some songs (n=53) repeated across years. When this occurred, the song was included in the sample for every year in which it was on the Hot 100 year‐end list. 2. Each artist, duo, or band credited by Billboard was included in the analysis. As noted in the text, individual artists were solo performers or individuals performing jointly who maintain a separate performing career but collaborate on certain songs. Duos were two individuals who consistently perform together, typically under another moniker. Bands were three or more individuals who routinely perform as a group, usually with a separate name. For duos and bands, the members of the group at the time the song was recorded were included in the analysis. In one case, two individuals were credited with their names linked by an ampersand. As this was the only song the two individuals had released, they were not considered an established duo, but two individuals. Once unitizing of artists was complete, the gender of each artist was obtained using evidence from online sources including photos, pronoun usage, and other referents. To determine whether artists were from an underrepresented racial/ethnic group (i.e., Black/African American, Hispanic/Latino, Asian, Native American/Alaska Native, Native Hawaiian/Pacific Islander, Middle Eastern, or Other/Mixed Race), research assistants consulted online databases (i.e., Variety Insight, StudioSystem) or other online sources. In the event that information was not available online, senior members of the research team rendered a judgment using a photograph of the artist. In total, the race/ethnicity of 29.4% (n=146) of all artists was inferred using this method. Previously, we have found that there is a 0.90 correlation between judgments made by research team members and verified information from online sources. 3. Music Watch. (2015). Music Consumer Profile—2015. Retrieved from https://www.riaa.com/wp‐content/uploads/2016/08/MusicWatch‐Music‐Consumer‐Profile‐2015.pdf 4. Genre was obtained by searching each sampled song and the album on which it appears in iTunes. The listed genre was used in all analyses, except when the genre did not refer to a style of music (e.g., soundtrack, compilation). The genre designations for these songs were categorized based on the genre of other music created by the artist. Some genre distinctions were collapsed prior to analysis. These included dance and electronic music. Genre analyses include all 600 songs. Excluding songs which repeated across years (n=53) did not significantly change the findings. For interested readers, the revised percentages appear in the table below.
Song Genre by Artist Gender
Genre Males Females
Pop 36.7% (n=323) 62.6% (n=159)
Hip‐Hop/Rap 26.2% (n=231) 13% (n=33)
Alternative 15.8% (n=139) 5.5% (n=14)
Country 7% (n=62) 8.3% (n=21)
R&B Soul 5.7% (n=50) 2.4% (n=6)
Dance/Electronic 8.6% (n=76) 8.3% (n=21)
5. Featuring artists were subsumed into the superordinate category (solo artists, duos, bands). Excluding featuring artists did not significantly alter findings. Additionally, a further analysis of solo performers was undertaken. This was
Annenberg Inclusion Initiative ‐‐ 29
to examine the percentage of male and female artists who were not performing with any other individuals (i.e., not a duet of two solo artists or an artist featuring another individual, duo, or band). Of the 268 individuals performing solo across the sample, 62.7% (n=168) were male and 37.3% (n=100) were female. However, the percentage for females fluctuated significantly from year to year: 2012=43.1%; 2013=37.5%; 2014=37.1%; 2015=42.2%; 2016=39.2%; 2017=23.9%. 6. U.S. Census Bureau (2016). Quick Facts. https://www.census.gov/quickfacts/. 7. To identify songwriters, three separate repertory databases were queried: ASCAP (https://www.ascap.com/ repertory), BMI (http://repertoire.bmi.com), and SESAC (https://www.sesac.com/Repertory/RepertorySearch. aspx). Once the song was identified in each of the databases, the listed songwriters were added to the analysis. Duplicate individuals within a repertory or across repertories were not included (i.e., if J. Smith and J. A. Smith were both credited, researchers ensured these were the same individual before crediting only one J. Smith). There were 9 credits given to “unknown writer” or “unknown author/creator” listed in these databases. These were included in the sample, though excluded from analyses as the gender of these individuals could not be ascertained. Similar to artists, pronouns, images, and other referents were obtained through online sources to determine gender of individuals. The gender of 11 writers was identified through the use of babynames.com (11 males). For songwriters, information on the gender of 11 individuals, of whom 9 were unknown writers, could not be obtained. These 11 individuals were excluded from all analyses. 8. Race/ethnicity was assessed only for female songwriters and the top 9 male songwriters. Once again, online information was used when available and senior research team members rendered a judgment when no other sources provided information. Of the 164 female songwriters, the underrepresented status of 37.2% (n=61) was inferred by the senior members of the research team. U.S. Census Bureau (2016). Quick Facts. https://www.census.gov/quickfacts/. 9. Eligible producer credits were derived from the Recording Academy guidelines and can be found at https://www.grammy.com/sites/com/files/pages/producer_definitions_for_awards.pdf. Producers were gleaned from two sources. The first were credits appearing in an album’s liner notes. Each song’s credits were scrutinized to identify producers, co‐producers, or vocal producers (or any combination or modification thereof). If an album was not available or no credits appeared, information on producing credits was retrieved from https://genius.com/. Online credits were used for 71 (23.7%) songs in the sample. An online article from Slate.com was used in one case. Similar to artists, the individual members of groups or producing teams (e.g., The Arcade, Rock Mafia) were identified and each individual was included in the analysis. A procedure similar to that described for artists and songwriters was used to ascertain gender for each individual. Additionally, 1 producer credit went to a group or collective (i.e., Shampoo, Press & Curl) whose members could not be determined. No gender information was available for this group, which was excluded from all analyses. Race/ethnicity was only female producers. Online information was used when available and senior research team members rendered a judgment for 45.5% (n=5) of producers.
10. Information on Grammy® Award winners and nominees was obtained from grammys.com and other online sources. The individuals listed as nominees for Record of the Year, Album of the Year, Song of the Year, Best New Artist, and Producer of the Year were included in the analysis. Each individual credited was included as a line of data, which involved providing individual lines for members of production teams, as noted above. When nominated individuals did not appear in the sample of popular songs, their gender and underrepresented status was identified using the procedures outlined earlier.

Annenberg Inclusion Initiative ‐‐ 30
11. For Grammy® nominees, only females were included in the race/ethnicity assessment. Of these 58 individuals, the underrepresented status of 31% (n=18) was inferred by the senior research team.
12. Ugwu, R. (2014, September 17). Who Buys Music Anymore? A Statistical Inquiry. Buzzfeed.com. Retrieved from https://www.buzzfeed.com/reggieugwu/who‐buys‐music‐anymore‐a‐statistical‐inquiry?utm_term=.yaw6EkRAx#.lu8rxjDJ7. 13. U.S. Census Bureau (2016). Quick Facts. https://www.census.gov/quickfacts/. 14. Smith, S.L., Choueiti, M., & Pieper, K. (2017). Inequality in 900 Popular Films: Examining Portrayals of Gender, Race/Ethnicity, LGBT, and Disability from 2007‐2016. Annenberg Inclusion Initiative. Los Angeles, CA: USC Annenberg School for Communication and Journalism. 15. Smith, S.L., Choueiti, M., & Pieper, K. (2016). Inclusion or Invisibility? The Comprehensive Annenberg Report on Diversity. Annenberg Inclusion Initiative. Los Angeles, CA: USC Annenberg School for Communication and Journalism. 16. Smith, S.L., Choueiti, M., & Pieper, K. (2018). Inclusion in the Director’s Chair? Gender, Race & Age of Directors across 1,100 Films from 2007‐2017. Annenberg Inclusion Initiative. Los Angeles, CA: USC Annenberg School for Communication and Journalism. 17. Smith et al. (2017). 18. Smith et al. (2017) and unpublished data. 19. Smith, S.L., Pieper, K., & Choueiti, M. (2015). Exploring the Careers of Female Directors: Phase III. Report prepared for Women in Film Los Angeles and Sundance Institute. Annenberg Inclusion Initiative. Los Angeles, CA. USC Annenberg. Smith, S.L., Pieper, K., & Choueiti, M. (2014). Exploring the Barriers and Opportunities for Independent Women Filmmakers Phase I and II. Annenberg Inclusion Initiative. Report prepared for Sundance Institute and Women in Film Los Angeles. Annenberg Inclusion Initiative. Los Angeles, CA. USC Annenberg. Smith, S.L., Pieper, K., & Choueiti, M. (2013). Exploring the Barriers and Opportunities for Independent Women Filmmakers. Annenberg Inclusion Initiative. Report prepared for Sundance Institute and Women in Film Los Angeles. 20. Smith et al. (2015), Smith et al. (2014), Smith et al. (2013). 21. Smith, S.L., Choueiti, M., Yao, K., Pieper, K. & Lee, C. (2017). Cracking the Code: The Prevalence and Nature of Computer Science Depictions in Media. Annenberg Inclusion Initiative. Los Angeles, CA: USC Annenberg School for Communication and Journalism.

Annenberg Inclusion Initiative ‐‐ 31
Acknowledgements
Our research and advocacy wouldn’t be possible without the incredible support of many champions. For our inaugural report on music, a special thanks goes to Wallis Annenberg and Cinny Kennard of the Annenberg Foundation, along with Ruth Ann Harnisch and Jenny Raymond of The Harnisch Foundation and Thao Pham of the Clif Bar Family Foundation. We are also grateful to acknowledge one of the pioneering female producers, Tena Clark and the generous support of the Build A Bear Foundation.
Additionally, a group of bold donors who are passionate about issues of inclusion are behind us throughout the year. We are indebted to the Jacquelyn and Gregory Zehner Foundation, Barbara Bridges, Bonnie Arnold, Suzanne Lerner, Julie Parker Benello, Ann Lovell, Mari and Manuel Alba, Beth Friedman, Ann Erickson and The Pritzker Pucker Family Foundation. We are also grateful to our partners at Sony Pictures Entertainment and EPiX for their support of our efforts. Along with our remarkable Advisory Board at the Annenberg Inclusion Initiative, a special shout out and thanks to Advisory Board members Sam Kirby Yoh, Jody Gerson, Jennifer Justice, and Carla Sacks for their leadership. Additionally, we are indebted to our Board Chair Leah Fischman for her tireless efforts and commitment to our Initiative.
Last but not least, we’d like to thank our USC team: Gretchen Parker McCarthy, Mike Mauro and Rachelle Martin, as well as our researchers in the Lab that facilitate every project to completion. A special thanks to Angel Choi and junior intern Sarah (Lil Soup) Neff. Vrinda Aggarwal Mehak Arya Eduardo Baresi Astin Beal Tara Bitran Celine Carrasco Julie Chandler Qiaochu Chen Hana H. Choi Hannah De Alicante Sarah Dillon Emma Donahue Nyiri Gharakhani Morgan Grimm Jack Haley Jillian Halperin Coryanne Huixian Huang Erica Hur Destiny Jackson Megan Jackson
Simran Jehani Yizhou (Melanie) Jiang Evelyn (Ruixue) Luo Julyanna Mendez Hailey Q. Merrick Saman Narimousa Ifeoma Okoye Vanessa Paliy Lara Amalia Rosen Eliana Rosenthal Ariel Rubin Charlotte Spector Sidney Y. Sunwoo Kieran Sweeney Carolin Trocmé Jenny Truong Kelechi Ume Sarah Voss Emma Vranich Ingred Ziemniak