inception and operationalization of kaizen in tanzania
TRANSCRIPT

8/24/2021 1
Inception and Operationalization of
Kaizen in Tanzania
Dr. Edwin P. Mhede
Dar Rapid Transit Agency (DART)
Presented at the Africa Kaizen Annual Conference 2021
24th August 2021
Inception and Operationalization of Kaizen in Tanzania: The Case of Manufacturing Sector

8/24/2021 2
Outline of the Presentation
• Motivation
• The Inception Process and Landmark
• Operationalization to Manufacturing Firms
• Microeconomentric Analyses
• Conclusion and Policy Implications
Inception and Operationalization of Kaizen in Tanzania: The Case of Manufacturing Sector

The Manufacturing Sector in Tanzania
8/24/2021 3
Source: Industrial Census Report of 2013 (NBS, MIT, and CTI)
• By 2013, the Tanzania’s manufacturing sector employed about 231,099
employees, and that 53.3% of the workforce was engaged in MSMEs.
Employment Level Number of Firms Percentage (%)
1 – 4 41,919 85.1
5 – 9 6,002 12.1
10 – 19 493 1.0
20 – 49 412 0.8
50 – 99 170 0.3
100 – 499 199 0.4
500 + 48 0.1
TOTAL 49,243 100
MEs = 41,919 MEs = 85.1
SMEs = 7,077 SMEs = 14.4
LMEs = 247 SMEs = 0.5
Inception and Operationalization of Kaizen in Tanzania: The Case of Manufacturing Sector

The Typical Workshops of MSMEs
8/24/2021 4Inception and Operationalization of Kaizen in Tanzania: The Case of Manufacturing Sector

The Typical Workshops of MSMEs…
8/24/2021 5Inception and Operationalization of Kaizen in Tanzania: The Case of Manufacturing Sector

The Typical Workshops of MSMEs…
8/24/2021 6Inception and Operationalization of Kaizen in Tanzania: The Case of Manufacturing Sector

A Chance for Industrialization in SSA
78/24/2021 Inception and Operationalization of Kaizen in Tanzania: The Case of Manufacturing Sector
Changing Share of Manufacturing GDP

Motivation• Economic growth is essential for poverty reduction and that
private sector-led industrialization, through creation of decent
jobs, plays an import role (WDR, 2012; Acemoglu and Robinson,
2013; Bloom et al., 2013; Otsuka and Shiraishi, 2014).
• Entrepreneur's managerial capacity is scarce in developing
countries (Bruhn et al., 2010; Sonobe and Otsuka, 2014), hence,
poor productivity (and un-competitiveness ) is rampant there.
• Interventions to teach basic management (including Kaizen)
among entrepreneurs exist (Karlan and Valdivia, 2011; Mano et
al., 2012), but such interventions are yet to provide sufficient
evidence for policymakers (McKenzie and Woodruff, 2014).
88/24/2021 Inception and Operationalization of Kaizen in Tanzania: The Case of Manufacturing Sector

The Entry Point• We found the garment cluster in Dar es Salaam, it was born in
the 1990s by the training offered by UNIDO, which indicates
that the training is powerful tool for industrialization.
• There were as many as 700 garment workshops, with average
schooling of entrepreneurs as high as 11 years and a few
enterprises were able to export their products to Europe.
• Nonetheless, enterprises were generally small with the average
size of 5 workers, and moreover, the cluster was not growing.
• So, in order to stimulate growth of this cluster, we decided to
design and offer the basic Kaizen management training.
98/24/2021 Inception and Operationalization of Kaizen in Tanzania: The Case of Manufacturing Sector

The Inception Process and Landmark• Established coordinates, such as the Academia (GRIPS),
International Organization (World Bank, JICA, EoJ, UNIDO,
ILO), the Government (GoT-MIT-MoH), Service Providers–
mainly BDS–Public (e.g., SIDO and CBE) & Private Master
Trainers–, the end users (the entrepreneurs), and Mass Media.
• Due to poor attitude of learning even basic skills, we had to
knock several doors to convince the target audience that Kaizen
may contribute to productivity and product quality improvement.
• After a series of such interactions, the Kaizen evangelism was
accepted. So, we won the game. Key to success: top leadership
support (from both public and private sector), willingness to
change of mindset, perseverance (push until you achieve it), …
108/24/2021 Inception and Operationalization of Kaizen in Tanzania: The Case of Manufacturing Sector

What We Did (Operationalization)
• Our Approach in this WB/GRIPS/GoT experimental intervention:-
(a) Both classroom and onsite training components were provided for;
(b) Two types of training programs: Kaizen (e.g., production and
product quality control practices) and standard management (non-Kaizen); (c) Small-scale manufacturers of garments and related
products in Dar es Salaam garment industrial cluster; and (d)
Enterprise surveys of 114 enterprises in a span of four years.
• In this paper, we analyze the medium-run impact of a randomized
controlled experiment of a short-term management training
program on the adoption of management practices and business
performance of trained enterprises in Tanzania.
118/24/2021 Inception and Operationalization of Kaizen in Tanzania: The Case of Manufacturing Sector

The Preview of Major Findings
128/24/2021
The Impacts of Kaizenmanagement training program on:-
Medium-run
(3 years after the training
interventions)
The treated entrepreneur's
adoption of Management practices
(measured by management
practices score)
+ve and significant
(the same was also the case
immediately, say 1 year, after
the training)
Business performance, measured
by the Manufacturing Value Added
(MVA) and Gross Profit (expressed
in real terms)
+ve and significant
(it was not observed in the
short-run)
Inception and Operationalization of Kaizen in Tanzania: The Case of Manufacturing Sector

The Operational (Study) Sites
• We focus on garment industrial cluster in Dar es Salaam, whose
enterprise sizes are mainly small and the majority are tailor-type
while some export to neighboring countries.
• Such garment enterprises are scattered in Dar es Salaam, mostly
housewives who started business at their house after attending in
a SIDO/UNIDO business training program in 1990s.
• Focus on industrial cluster and one industry allowed us to control
various heterogeneity that would otherwise be introduced if we
were to broaden our sample enterprises.
138/24/2021 Inception and Operationalization of Kaizen in Tanzania: The Case of Manufacturing Sector

Figure 1: Location of Sample Enterprises
148/24/2021 Inception and Operationalization of Kaizen in Tanzania: The Case of Manufacturing Sector

Figure 2. Program Implementation Timeline
158/24/2021
High quality of consultants,
2.5 hrs 4 weeks = 50 hrs,
Compliance rate = 90%
Instructors visited
2 to 8 days =14 to 18 hrs,
Compliance rate = 100%
SAMPLE SIZE BY TREATMENT STATUS:Group TT (both training) = 26, Group TC
(classroom training) = 24, Group CT (onsite
training) = 28, and Group CC (control group) = 29
Inception and Operationalization of Kaizen in Tanzania: The Case of Manufacturing Sector

Kaizen: for Production Management• Kaizen (which means change for the better) a Japanese business
philosophy and scientific approach of improvement of working
practices, product quality, and productivity by reducing wasted
work and materials with the continuous and collaborative effort of
the firm manager and workers (Imai, 2012).
• Kaizen consists of:-❑ Introductory part: 5S (Sort, Set, Shine, Standardize, and Sustain);
❑ Techniques for spotting inefficiencies, finding root causes, making
hypotheses, carrying out experiments, finding solutions,
implementing and evaluating the solutions; and
❑ Advanced techniques for scaling up the implantation of solution and
improving these techniques.
168/24/2021 Inception and Operationalization of Kaizen in Tanzania: The Case of Manufacturing Sector

The 5S of KAIZEN for Improvement
178/24/2021
PRODUCTIVITY,
EFFICIENCY, AND
PRODUCT QUALITY
ENHANCEMENT
Inception and Operationalization of Kaizen in Tanzania: The Case of Manufacturing Sector

Kaizen Management Practices
188/24/2021
B 1ST 2ND 3RD
(1) (2) (3) (4)
Panel A: Kaizen Management Practices Scores (max = 15)
The enterprise/entrepreneur:
1. Assigns any workers to inspect the quality of the products before sales 10 5 3 2
2. Keeps records of quality defects 22 46 70 40
3. Records customers' complaints about the products sold 45 57 70 48
4. Instructs the worker the way of preventing the defect 9 2 4 8
5. Has a designated place for all tools 34 53 71 35
6. Has labels in the storage of tools so that workers can easily find them 3 11 23 19
7. Has a designated place for raw material storage 76 91 89 87
8. Separately stores raw materials from the scrap 75 93 94 83
9. Has no scrap cloths around the floor 13 62 61 56
10. Daily removes scraps and cleans the floor of the workplace 83 94 95 96
11. Does machine maintenance at least once a week 29 25 59 25
12. Regularly holds a meeting in which all the production workers participate 28 48 64 53
13. Has a designated area for all the production activities within the workshop 29 38 52 22
14. Has a flowchart indicating the sequence of activities in the production process 8 11 39 6
15. Completely knows the sequence and duration of each of the production activities 82 94 85 72
Average Rate of Adoption 36 49 59 44
Inception and Operationalization of Kaizen in Tanzania: The Case of Manufacturing Sector

Non-Kaizen Management Practices
198/24/2021
B 1ST 2ND 3RD
(1) (2) (3) (4)
Panel B: non-Kaizen Management Practices Scores (max = 12)
The enterprise/entrepreneur:
(1) Had any expenditure for advertisement in the last 3 months† 10 37 63 15
(2) Has any signboards in front of the workshop 39 57 75 60
(3) Distributes complimentary cards or calendar 27 43 80 57
(4) Issues invoices or receipts with workshop’s name or phone number 36 59 77 62
(5) Preserves business documents (e.g., receipts or invoices) when making a purchase 48 81 96 92
(6) Separates business and household expenses 62 84 96 82
(7) Keeps record of sales 84 92 97 93
(8) Keeps record of material purchase 70 88 97 93
(9) Can clearly describe the characteristics of their customers 42 67 93 85
(10) Can clearly describe the strength of own firm compared with his(her) competitor(s) 24 62 88 93
(11) Has clear sales target or profit target in this year 45 73 96 67
(12) Has clear plan for growth of the enterprise in five years from now 28 62 90 92
Average Rate of Adoption 43 67 87 74
Inception and Operationalization of Kaizen in Tanzania: The Case of Manufacturing Sector

Classroom and Onsite Training Sessions
208/24/2021
Onsite training in progressClassroom training in progress
Inception and Operationalization of Kaizen in Tanzania: The Case of Manufacturing Sector

Before KAIZEN Training
Work SpaceSales Space
Work Space
Stock Space
Fitting
Entrance
After KAIZEN Training
Sales Space
Work Space
Stock Space
(temporal)
Fitting
Entrance
8/24/2021 21Inception and Operationalization of Kaizen in Tanzania: The Case of Manufacturing Sector

How they could minimize loss?
228/24/2021 Inception and Operationalization of Kaizen in Tanzania: The Case of Manufacturing Sector

BEFORE AFTER
238/24/2021 Inception and Operationalization of Kaizen in Tanzania: The Case of Manufacturing Sector

Some Success Stories such as
248/24/2021 Inception and Operationalization of Kaizen in Tanzania: The Case of Manufacturing Sector
Cherie Blair, the founder of CBFW and the wife of the former UK Prime Minister
Tony Blair, observed how Rose Makoyola, a participant in the GRIPS/World
Bank training program, benefited from Kaizen (1 July 2013)

Garment industry in Dar es Salaam
258/24/2021 Inception and Operationalization of Kaizen in Tanzania: The Case of Manufacturing Sector
The same room
before the training

After the Training … Happy Faces!
268/24/2021 26Inception and Operationalization of Kaizen in Tanzania: The Case of Manufacturing Sector

Table 1: Basic Characteristics of Entrepreneurs
278/24/2021
Notes: Numbers
in square
brackets in
columns (1) - (4)
are standard
deviations.
Columns (5) to
(7) display t-values of test of
the equality of
means (i.e., t-test of null
hypothesis that
mean values are
the same in the
two groups). The
asterisks ***, **,
and * indicate
the statistical
significance
level at 1
percent, 5
percent, and 10
percent,
respectively.
TREATMENT STATUS TEST OF EQUALITY OF MEANS
Group
TT
Group
TC
Group
CT
Group
CC (1) – (4) (2) – (4) (3) – (4)
Mean Mean Mean Mean MD MD MD
[Std.] [Std.] [Std.] [Std.] (t-value) (t-value) (t-value)
(1) (2) (3) (4) (5) (6) (7)
PANEL A: INDIVIDUAL CHARACTERISTICS
Age (as of baseline survey) 44.5 44.9 45.2 44.8 -0.30 0.01 0.40
[9.06] [7.52] [9.49] [7.53] (-0.11) (0.03) (0.08)
Sex of entrepreneur 0.92 0.83 0.86 0.76 0.16* 0.07 0.10
(Female=1) [0.29] [0.31] [0.32] [0.46] (1.83) (1.28) (1.58)
Education of entrepreneur 11.3 10.3 10.6 10.7 0.60 -0.40 -0.10
(years of schooling) [2.62] [2.12] [2.66] [2.85] (0.77) (-0.58) (-0.13)
Parent’s experience in the 0.35 0.29 0.39 0.45 -0.10 -0.16 -0.06
same business (Yes=1) [0.49] [0.46] [0.50] [0.51] (-0.97) (-1.59) (-0.59)
Any prior business training 0.73 0.67 0.61 0.55 0.15 0.09 0.03
experience (Yes=1) [0.45] [0.48] [0.50] [0.51] (1.56) (0.85) (0.29)
Years of operation 11.9 11.8 12.0 10.5 1.30 1.20 1.40
(as of baseline survey) [5.45] [4.85] [6.34] [6.10] (0.56) (0.54) (0.58)
Former employee in the 0.15 0.25 0.25 0.17 -0.04 0.06 0.06
textile industry (Yes=1) [0.37] [0.44] [0.44] [0.38] (-0.51) (0.63) (0.68)
Chagga (Yes=1) 0.15 0.25 0.32 0.31 -0.16 -0.06 0.01
[0.37] [0.44] [0.48] [0.47] (-1.62) (-0.41) (0.31)
Number of entrepreneurs 26 24 28 29
Inception and Operationalization of Kaizen in Tanzania: The Case of Manufacturing Sector

Table 2: Management Practices Scores
288/24/2021
TREATMENT STATUS TEST OF EQUALITY OF MEANS
Group
TT Group
TC Group
CT Group
CC (1) – (4) (2) – (4) (3) – (4)
Mean Mean Mean Mean MD MD MD [Std.] [Std.] [Std.] [Std.] (t-value) (t-value) (t-value)
(1) (2) (3) (4) (5) (6) (7)
Baseline score 11.69 10.33 10.21 9.69 2.00* 0.64 0.52 [3.53] [2.39] [3.88] [3.33] (1.861) (0.735) (0.466) Soon after the training 17.69 16.75 14.54 12.45 5.24*** 4.30** 2.09
programs [3.94] [4.65] [5.14] [4.89] (3.281) (2.295) (1.227) 1.5 years after the 20.31 19.74 19.84 17.00 3.31*** 2.74** 2.84***
programs [2.96] [2.77] [2.60] [3.89] (3.003) (2.520) (2.803) 3 years after the 16.44 16.92 15.56 12.59 3.85*** 4.33*** 2.97**
programs [3.10] [3.03] [3.68] [3.88] (3.416) (3.806) (2.445)
Number of entrepreneurs
26 24 28 29
Following the lead of Bloom et al., (2013): We collected information on each enterprise’s adopted management practices by enumerator’s visit to each workshop and/or entrepreneurs’ response. We construct management score based on 27 YES/NO diagnostic criteria (e.g., Kaizen and non-Kaizen).
Notes: Numbers
in square brackets
in columns (1) -
(4) are standard
deviations.
Columns (5) to (7)
display t-values of
test of the
equality of means
(i.e., t-test of null
hypothesis that
mean values are
the same in the
two groups). The
asterisks ***, **,
and * indicate the
statistical
significance level
at 1 percent, 5
percent, and 10
percent,
respectively.
1012
1416
1820
2010 2011 2012 2013Year
Group TT Group TC
Group CT Group CC
Inception and Operationalization of Kaizen in Tanzania: The Case of Manufacturing Sector

Table 3: Manufacturing Value Added and Profit
298/24/2021
TREATMENT STATUS TEST OF EQUALITY OF MEANS
Group
TT Group
TC Group
CT Group
CC (1) – (4) (2) – (4) (3) – (4)
Mean Mean Mean Mean MD MD MD [Std.] [Std.] [Std.] [Std.] (t-value) (t-value) (t-value)
(1) (2) (3) (4) (5) (6) (7)
PANEL A: VALUE ADDED [USD] Baseline value 14,473 13,551 12,895 12,838 1,635 713 57 (mean of 2008 and 2009) [10,964] [12,171] [13,916] [8,744] (0.538) (0.406) (0.027)
In year 2011 18,092 23,667 20,909 22,605 -4,513 1,062 -1,696 [16,148] [23,504] [16,144] [16,048] (-0.327) (0.758) (-0.605)
In year 2012 17,380 12,059 16,445 12,574 4,806 -515 3,871 [14,978] [8,975] [27,478] [13,014] (0.874) (-0.362) (0.606)
In year 2013 18,914 12,460 13,275 12,535 6,379** -75 740 [14,214] [7,898] [15,168] [9,285] (1.984) (-0.058) (0.592) PANEL B: PROFIT [USD] Baseline value 9,098 6,872 9,614 8,856 242 -1,984 758 (mean of 2008 and 2009) [7,874] [13,068] [11,501] [10,076] (0.669) (-0.606) (0.481)
In year 2011 11,050 18,982 13,489 14,257 -3,207 4,725 -768 [13,144] [21,936] [13,521] [15,196] (-0.469) (0.572) (-0.827)
In year 2012 11,487 6,791 12,920 8,078 3,409 -1,287 4,842 [12,327] [8,057] [26,627] [9,786] (0.881) (-0.394) (0.328)
In year 2013 12,646 6,985 10,787 7,357 5,289** -372 3,430 [11,194] [8,447] [14,263] [5,969] (1.968) (-0.458) (0.585)
Number of entrepreneurs
26 24 28 29
Notes: Numbers in square brackets in columns (1) - (4) are standard deviations. The baseline values of the value-added and profit are those of the average of 2008 and 2009. The value-added and profit are presented in PPP-adjusted USD using “PPP conversion factor, GDP (LCU per international $)”, available at World Bank DATABANK. Columns (5) to (7) display t-values of test of the equality of means (i.e., t-test of null hypothesis that mean values are the same in the two groups). The asterisks ***, **, and * indicate the statistical significance level at 1 percent, 5 percent, and 10 percent, respectively.
1000
015
000
2000
025
000
2010 2011 2012 2013Year
Group TT Group TC
Group CT Group CC
MVA
5000
1000
015
000
2000
0
2010 2011 2012 2013Year
Group TT Group TC
Group CT Group CC
PROFIT
Inception and Operationalization of Kaizen in Tanzania: The Case of Manufacturing Sector

Reliability of Outcome Measures• Before implementing analysis, impact evaluation studies should
check the reliability of the outcome measures by examining how
the management practices scores and business performance are
correlated with the variables capturing the characteristics of
entrepreneurs (Bloom and van Reenen, 2007).
• We did that by conducting ex-ante regressions involving:oyi = f(Kaizen practices scores, Xi);
oyi = f(non-Kaizen practices scores, Xi); and
oyi = f(Kaizen practices scores, non-Kaizen practices scores, Xi).
• Generally, we found that, indeed, such management practices are
correlated with our measures of business performance suggesting
the reliability of our measures of outcome variables.
308/24/2021 Inception and Operationalization of Kaizen in Tanzania: The Case of Manufacturing Sector

Table 4: ex-ante Correlates of Kaizen and non-Kaizen Practices Scores and Business Performance (VA and Profit)
318/24/2021
Notes: The dependent variable in columns (1) to (6) and columns (7) to (12) is the value added (i.e., sales revenue minus material costs, subcontracting costs,
utility costs, and transportation costs) and the profit (i.e., sales revenue minus material costs, subcontracting costs, utility costs, transportation costs, and labor
costs), respectively. The value added and profit are in USD and are adjusted by using the World Bank GDP Deflator. Numbers in parentheses are robust t-statistics. The asterisks ***, **, and * indicate the statistical significance level at 1 percent, 5 percent, and 10 percent, respectively.
VALUE ADDED PROFIT
(1) (2) (3) (4) (5) (6) (7) (8) (9) (10) (11) (12)
Kaizen Practices 1,387.3*** 69.052 699.6 -144.336 973.3*** 49.056 537.4 -130.764
Scores (3.605) (0.462) (1.428) (-0.767) (3.041) (0.337) (1.192) (-0.673) non-Kaizen 1,636.4*** 324.039** 1,203.2*** 405.790* 1,095.6*** 251.812* 762.8* 328.131
Practices Scores (6.085) (2.058) (3.099) (1.903) (4.261) (1.768) (1.945) (1.624) Sex of entrepreneur 4,199.7 3,416.19** 2,232.3 2,894.19** 2,479.5 2,847.04* 3,107.9 3,517.44** 1,827.4 3,084.15** 2,017.3 3,044.89**
(Female=1) (1.494) (2.265) (0.736) (2.025) (0.869) (1.972) (1.230) (2.573) (0.696) (2.365) (0.813) (2.316) Entrepreneur’s 694.6 -175.880 383.5 -251.292 408.5 -260.139 639.1* -137.454 438.5 -200.801 457.7 -209.001
years of schooling (1.613) (-1.129) (0.892) (-1.506) (0.971) (-1.521) (1.730) (-0.992) (1.199) (-1.355) (1.270) (-1.364) Any prior training 422.8 -961.999 -639.6 -1,171.006 -406.4 -1,222.21 10.1 -1,030.99 -694.7 -1,202.06 -515.6 -1,248.45
experience (Yes=1) (0.151) (-1.030) (-0.237) (-1.235) (-0.147) (-1.262) (0.004) (-1.085) (-0.270) (-1.254) (-0.194) (-1.281) Years of business 387.3** -23.815 317.2* -38.529 319.2* -41.014 258.0* -43.371 213.3 -57.563 214.8 -59.436
Operation (2.125) (-0.299) (1.695) (-0.468) (1.807) (-0.485) (1.697) (-0.583) (1.358) (-0.737) (1.439) (-0.744) Value added/Profit 1.440*** 1.411*** 1.419*** 0.806*** 0.794*** 0.799***
in the past (YP) (11.603) (10.772) (11.317) (8.860) (8.566) (8.920) Constant 24,791.6 -9,828.0 21,421.6 -10,937.9 20,229.6 -10,880.1 39,190.5 -2,218.7 37,213.7 -3,117.5 36,298.2 -3,117.3 (0.676) (-0.468) (0.511) (-0.520) (0.521) (-0.516) (1.130) (-0.126) (0.953) (-0.178) (0.993) (-0.178) R-squared 0.240 0.891 0.265 0.895 0.280 0.895 0.185 0.854 0.196 0.858 0.208 0.858
Number of enterprises 107 107 107 107 107 107 107 107 107 107 107 107
Inception and Operationalization of Kaizen in Tanzania: The Case of Manufacturing Sector
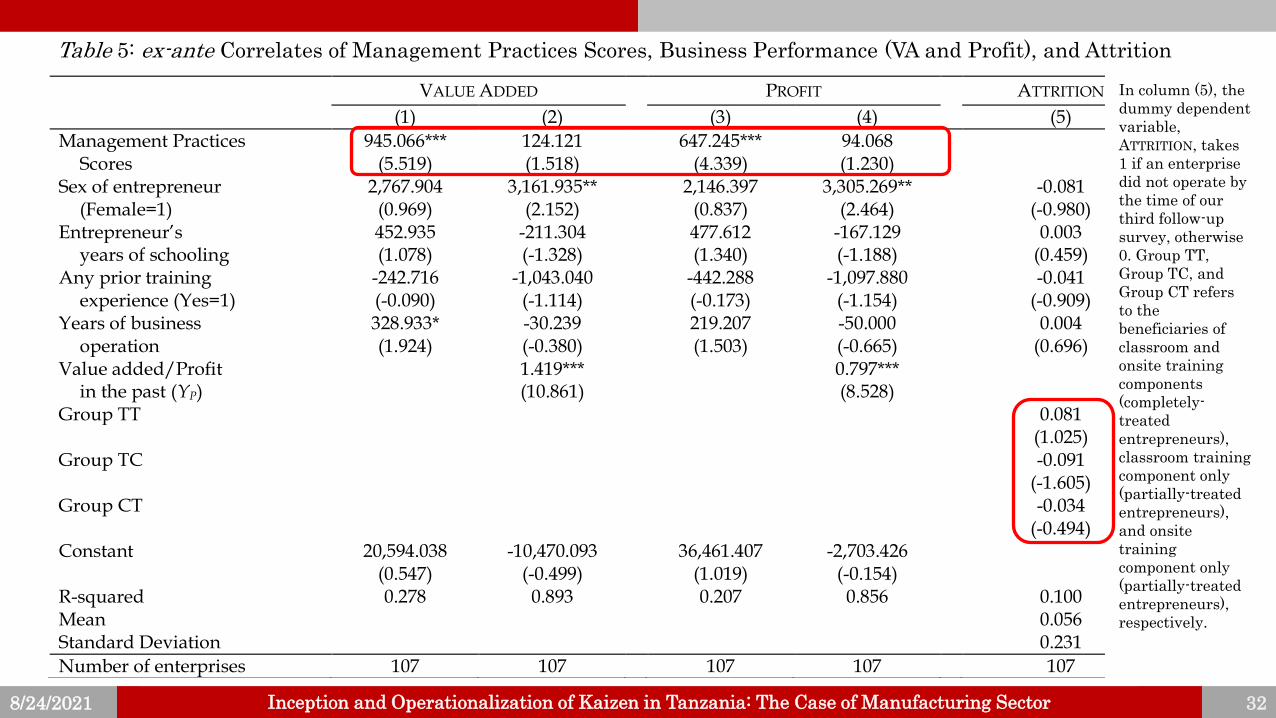
Table 5: ex-ante Correlates of Management Practices Scores, Business Performance (VA and Profit), and Attrition
328/24/2021
VALUE ADDED PROFIT ATTRITION
(1) (2) (3) (4) (5)
Management Practices 945.066*** 124.121 647.245*** 94.068 Scores (5.519) (1.518) (4.339) (1.230)
Sex of entrepreneur 2,767.904 3,161.935** 2,146.397 3,305.269** -0.081 (Female=1) (0.969) (2.152) (0.837) (2.464) (-0.980)
Entrepreneur’s 452.935 -211.304 477.612 -167.129 0.003 years of schooling (1.078) (-1.328) (1.340) (-1.188) (0.459)
Any prior training -242.716 -1,043.040 -442.288 -1,097.880 -0.041 experience (Yes=1) (-0.090) (-1.114) (-0.173) (-1.154) (-0.909)
Years of business 328.933* -30.239 219.207 -50.000 0.004 operation (1.924) (-0.380) (1.503) (-0.665) (0.696)
Value added/Profit 1.419*** 0.797*** in the past (YP) (10.861) (8.528)
Group TT 0.081 (1.025) Group TC -0.091 (-1.605) Group CT -0.034 (-0.494) Constant 20,594.038 -10,470.093 36,461.407 -2,703.426 (0.547) (-0.499) (1.019) (-0.154) R-squared 0.278 0.893 0.207 0.856 0.100 Mean 0.056 Standard Deviation 0.231
Number of enterprises 107 107 107 107 107
In column (5), the
dummy dependent
variable,
ATTRITION, takes
1 if an enterprise
did not operate by
the time of our
third follow-up
survey, otherwise
0. Group TT,
Group TC, and
Group CT refers
to the
beneficiaries of
classroom and
onsite training
components
(completely-
treated
entrepreneurs),
classroom training
component only
(partially-treated
entrepreneurs),
and onsite
training
component only
(partially-treated
entrepreneurs),
respectively.
Inception and Operationalization of Kaizen in Tanzania: The Case of Manufacturing Sector

Econometric Specification • We specify the basic econometric equation (1) as follow:
yi = τ0 + τBBi + τEEi + Xiτ + τPYPi + εi , (1)
yi = management scores, value-added, and profit of enterprise i.Bi = 1 for participant in both programs, 0 otherwise.
Ei = 1 for participant in either program, 0 otherwise.
Xi = vector of variables capturing the entrepreneurs’ characteristics.
Ypi = is the outcome variable in the past (McKenzie, 2012).
while τ0, and εi is a constant and error term, τB, τE, τ, and τP is the coefficient of Bi, Ei, and Ypi, respectively.
• We estimate equation (1) using the baseline and third follow-up survey
data conducted in April 2010 and March 2014, respectively, because we
focus on evaluating the medium-run impact of the training program.
• We use two strategies to estimate equation (1): the intention-to-treat
(ITT) and the treatment-on-the-treated (TOT ). To estimate TOT, we
instrument the actual participation status with the random invitation
status, following the lead of Imbens and Angrist (1994).
338/24/2021 Inception and Operationalization of Kaizen in Tanzania: The Case of Manufacturing Sector

Table 6: Training Impact on Adoption of Management Practices
348/24/2021
Management
Practices Scores
Kaizen Practices Scores
non-Kaizen
Practices Scores
ITT TOT ITT TOT ITT TOT (1) (2) (3) (4) (5) (6)
Both training dummy B 2.707* 2.702* 1.347 1.395 1.382* 1.322* (Yes=1) (1.971) (1.877) (1.646) (1.621) (1.923) (1.787)
Either training dummy E 3.059** 3.070** 1.186* 1.191* 1.938*** 1.937*** (Yes=1) (2.466) (2.447) (1.712) (1.719) (2.982) (2.979)
Sex of entrepreneur 1.299 1.184 0.302 0.260 0.829 0.753 (Female=1) (1.149) (1.060) (0.374) (0.330) (1.415) (1.303)
Education of entrepreneur 0.478*** 0.473*** 0.171 0.166* 0.269*** 0.272*** (years of schooling) (2.709) (2.810) (1.653) (1.682) (3.038) (3.191)
Any prior training 0.257 0.273 -0.049 -0.049 0.138 0.158 experience (Yes=1) (0.257) (0.289) (-0.082) (-0.088) (0.257) (0.308)
Kaizen/non-Kaizen/Overall 0.223 0.200 0.114 0.102 0.426** 0.393** Scores in the past (YP) (1.635) (1.377) (0.938) (0.831) (2.582) (2.308)
Constant -1.404 -1.181 0.733 0.892 -3.308 -3.289 (-0.110) (-0.096) (0.077) (0.099) (-0.587) (-0.610) First-stage F-statistics 377.52 431.24 322.06 R-squared 0.279 0.258 0.124 0.109 0.406 0.384
Number of enterprises 107 107 107 107 107 107
Due to limited
space, other
covariates are
not shown
here. The
asterisks ***,
**, and *
indicate the
statistical
significance
level at 1
percent, 5
percent, and
10 percent,
respectively.
Inception and Operationalization of Kaizen in Tanzania: The Case of Manufacturing Sector

Table 7: Training Impact on the Business Performance
358/24/2021
VALUE ADDED PROFIT
ITT TOT ITT TOT (1) (2) (3) (4)
Both training dummy B 2,710.689* 3,107.364** 2,062.191 2,380.133* (Yes=1) (1.941) (2.094) (1.590) (1.758)
Either training dummy E -102.960 -187.997 78.330 47.448 (Yes=1) (-0.108) (-0.206) (0.081) (0.051)
Sex of entrepreneur 2,932.219** 3,057.560** 3,126.412** 3,204.334*** (Female=1) (2.158) (2.333) (2.449) (2.634)
Education of entrepreneur -213.031 -234.391 -166.598 -175.113 (years of schooling) (-1.415) (-1.613) (-1.242) (-1.393)
Any prior training -1,122.129 -1,107.621 -1,162.193 -1,146.417 experience (Yes=1) (-1.141) (-1.194) (-1.169) (-1.228)
Value added/Profit 1.431*** 1.439*** 0.804*** 0.801*** in the past (YP) (12.303) (12.941) (9.283) (9.777)
Constant -12,970.279 -11,666.018 -4,972.649 -3,838.887 (-0.689) (-0.667) (-0.298) (-0.253) First-stage F-statistics 436.13 328.07 R-squared 0.899 0.896 0.860 0.861
Number of enterprises 107 107 107 107
Due to limited
space, other
covariates are
not shown
here. The
asterisks ***,
**, and *
indicate the
statistical
significance
level at 1
percent, 5
percent, and
10 percent,
respectively.
Inception and Operationalization of Kaizen in Tanzania: The Case of Manufacturing Sector

Knowledge Spillovers?• During the fieldwork, we observed entrepreneurs had instances of
communication via their social and business networks.
• We collected data related to entrepreneurs’ communication and
social network (e.g., information like the number of entrepreneurs
you known in person, number of entrepreneurs having had
conversation about our Kaizen training program, workshop visits,
and instances of imitation).
• Although we do not use such data in the main analysis of impact
evaluation due to endogeneity problem (and that we do not have
suitable IV), we have analyzed such data to explore the
correlation between entrepreneurs’ communication and our
outcome variables.
368/24/2021 Inception and Operationalization of Kaizen in Tanzania: The Case of Manufacturing Sector

Table 8a: Entrepreneurs’ Communication and Social Network
378/24/2021
Group
TT Group
TC Group
CT Group
CC Total
Mean Mean Mean Mean Mean [Std.] [Std.] [Std.] [Std.] [Std.] (1) (2) (3) (4) (5)
Panel A: Baseline Survey Number of sample entrepreneurs you know in person 35.3 39.3 27.2 20.9 29.5 [19.5] [12.7] [21.6] [13.7] [19.0]
Number of entrepreneurs in the Group 26 24 28 29 107
Panel B: Interim Follow-up Survey (Sept. 2010)
Number of sample entrepreneurs you know in person 38.6 39.1 30.4 18.6 29.0 [20.4] [15.7] [20.5] [12.1] [18.7] Number of sample entrepreneurs you have talked to 21.2 22.2 10.2 5.2 14.2
about Kaizen [14.2] [11.2] [11.9] [6.1] [13.4]
Number of entrepreneurs in the Group 26 24 28 29 107
Panel C: First Follow-up Survey (Apr. 2011)
Number of sample entrepreneurs you know in person 45.6 45.3 37.1 23.0 34.8 [17.2] [15.7] [21.8] [15.2] [20.2] Number of sample entrepreneurs you have talked to 29.5 29.5 16.9 9.7 19.4
about Kaizen [16.5] [15.5] [19.1] [12.8] [17.9] Number of sample entrepreneurs whose conversation with 27.7 27.8 16.7 9.3 18.5
you about Kaizen has led to a change in your business [17.3] [15.9] [19.3] [12.3] [17.8] Number of sample enterprises you have visited 16.3 15.6 12.6 7.3 12.0
[12.8] [12.5] [15.1] [9.7] [12.8] Number of sample enterprises from which you have 15.3 15.3 12.6 7.3 11.8
copied something [13.1] [12.4] [15.0] [9.7] [12.7]
Number of entrepreneurs in the Group 26 24 28 29 107
Notes: In this
Table, irrespective
of the treatment
status, an
entrepreneur
reports the
number of sample
entrepreneurs
s/he interacts
with. Group TT,
Group TC, Group
CT, and Group CC
denotes the
entrepreneurs
who received both
the classroom and
onsite training
components, the
classroom
training only, the
onsite training
only, and the
control group,
respectively. The
numbers in
square brackets
are standard
deviations.
Inception and Operationalization of Kaizen in Tanzania: The Case of Manufacturing Sector

Table 8b: Entrepreneurs’ Communication and Social Network
388/24/2021
Notes: In this
Table, irrespective
of the treatment
status, an
entrepreneur
reports the
number of sample
entrepreneurs
s/he interacts
with. Group TT,
Group TC, Group
CT, and Group CC
denotes the
entrepreneurs
who received both
the classroom and
onsite training
components, the
classroom
training only, the
onsite training
only, and the
control group,
respectively. The
numbers in
square brackets
are standard
deviations.
Group
TT Group
TC Group
CT Group
CC Total
Mean Mean Mean Mean Mean [Std.] [Std.] [Std.] [Std.] [Std.] (1) (2) (3) (4) (5)
Panel D: Second Follow-up Survey (Sept. 2012)
Number of sample entrepreneurs you know in person 46.1 46.2 38.0 24.8 35.9 [17.0] [15.6] [20.9] [13.8] [19.3] Number of sample entrepreneurs you have talked to 28.1 29.5 15.6 9.9 20.5
about Kaizen [17.3] [15.5] [17.0] [12.5] [18.3] Number of sample entrepreneurs whose conversation with 25.7 26.9 16.2 8.2 18.9
you about Kaizen has led to a change in your business [17.6] [16.3] [18.3] [12.1] [16.7] Number of sample enterprises you have visited 14.4 13.9 10.7 6.8 11.5
[13.2] [12.3] [13.7] [9.5] [12.1] Number of sample enterprises from which you have 12.9 13.2 10.5 5.3 9.7
copied something [11.1] [11.3] [14.6] [8.1] [11.6]
Number of entrepreneurs in the Group 26 24 28 29 107
Panel E: Third Follow-up Survey (Mar. 2014) Number of sample entrepreneurs you know in person 52.7 50.2 45.2 26.1 40.3 [17.4] [13.7] [19.3] [22.7] [20.6] Number of sample entrepreneurs you have talked to 30.8 27.0 15.6 5.3 18.6
about Kaizen [21.4] [20.4] [15.4] [11.0] [19.4] Number of sample entrepreneurs whose conversation with 25.6 22.7 11.1 4.7 15.1
you about Kaizen has led to a change in your business [22.5] [19.8] [14.0] [9.9] [18.4] Number of sample enterprises you have visited 12.6 12.1 8.4 6.3 9.7
[12.5] [13.0] [8.1] [7.2] [10.6] Number of sample entrepreneurs who have visited your 9.7 8.6 5.2 4.7 6.9
enterprise [14.0] [10.5] [6.0] [7.6] [10.1] Number of sample entrepreneurs who have visited and 8.7 6.4 3.9 3.9 5.7
copied something from your enterprise [14.0] [9.6] [4.5] [6.6] [9.5]
Number of entrepreneurs in the Group 26 24 28 29 107
Inception and Operationalization of Kaizen in Tanzania: The Case of Manufacturing Sector

Econometric Specification
398/24/2021
• We include the variables capturing entrepreneur's communication and social network in eq. (3.1) to form eq. (A.1) as follow:
yi = α0 + αBBi + αEEi + αBZBiZi + λ(1–Bi–Ei)Zi + Xiβ + αPYPi + ε’i, (A.1)
• Where Zi = entrepreneur's communication variables, which can be:-❑ “TALKED TO” (i.e., number of invited/participants with whom s/he talked to
about the Kaizen training),
❑ “VISITED” (i.e., number of invited/participants with whom s/he have visited their workshop), and
❑ “KNOWN” (i.e., number of invited/participants whom s/he knew in person).
• After regressing equation (A.1), we find suggestive evidence that entrepreneur's communication is correlated with adoption of certain management practices (Kaizen and non-Kaizen practices).
Inception and Operationalization of Kaizen in Tanzania: The Case of Manufacturing Sector

Table 9a: Communication and Management Practices
408/24/2021
TALKED VISITED KNOWN
ITT TOT ITT TOT ITT TOT (1) (2) (3) (4) (5) (6)
Both training dummy B 2.449* 2.326 3.230** 3.680** 1.977 1.372 (Yes=1) (1.776) (1.290) (2.301) (2.338) (0.807) (0.296)
Either training dummy E 3.400*** 3.603*** 3.583*** 3.760*** 2.534 2.940 (Yes=1) (3.300) (3.152) (3.066) (2.847) (1.458) (1.273)
Both training (Yes=1) 0.034 0.041 0.028 0.005 0.036 0.049 x Communication Z (0.981) (0.981) (0.379) (0.067) (0.908) (0.659)
Either training (Yes=1) 0.022 0.017 0.044 0.045 0.037 0.029 x Communication Z (0.925) (0.684) (0.905) (1.034) (1.173) (0.701)
Control (Yes = 1) x 0.125*** 0.126*** 0.147* 0.160** 0.038 0.038 communication (1 - B - E)Z (3.432) (3.526) (1.729) (1.970) (1.345) (1.366)
Sex of entrepreneur 1.977* 1.801* 1.921* 1.811* 1.853* 1.713* (Female=1) (1.857) (1.723) (1.783) (1.694) (1.738) (1.648)
Education of entrepreneur 0.264* 0.264* 0.293** 0.289** 0.278** 0.275** (years of schooling) (1.905) (1.953) (2.264) (2.370) (2.019) (2.010)
Any prior training 0.064 0.089 0.217 0.199 0.071 0.097 experience (Yes=1) (0.085) (0.125) (0.309) (0.298) (0.094) (0.133)
Overall Management Practices 0.110 0.077 0.130 0.093 0.097 0.074 Scores in the past (YP) (1.235) (0.709) (1.440) (0.835) (1.027) (0.644)
Constant 1.552 1.148 4.468 5.135 2.766 2.320 (0.131) (0.100) (0.373) (0.457) (0.218) (0.190) First-stage F statistics 176.71 217.02 234.43 R-squared 0.407 0.365 0.391 0.357 0.391 0.355
Number of enterprises 107 107 107 107 107 107
Notes: The dependent variable in
columns (1) to (6) is the overall
management practices scores (i.e.,
the sum of the Kaizen and non-
Kaizen management practices
scores). For the intention-to-treat
(ITT) effects, the reported estimates
are the coefficients of dummy
variable taking 1 if the enterprise
was assigned Group TT (both
training programs) or Group TC/CT
(either training program). For the
treatment effects on the treated
(TOT), the reported estimates are the
coefficients of the dummy variable
taking 1 if the enterprise complied
with the assigned treatment. To
estimate the TOT, we use the
instrumental variable approach by
instrumenting the actual
participation status with the random
invitation status. The variables
“TALKED”, “VISITED”, and “KNOWN”
capture the communication
networks, Z, as defined by the
number of entrepreneurs with whom
s/he talked to about the training
program, the number of
entrepreneurs with whom (s)he
visited their workshop, and the
number of entrepreneurs whom the
entrepreneur knew in person (or just
by name), respectively. The robust t-statistics and z-statistics for the ITT
and TOT are in parentheses,
respectively. The asterisks ***, **,
and * indicate the statistical
significance at 1 percent, 5 percent,
and 10 percent, respectively.
Inception and Operationalization of Kaizen in Tanzania: The Case of Manufacturing Sector

Table 10a: Communication and Business Performance
418/24/2021
TALKED VISITED KNOWN
VALUE ADDED PROFIT VALUE ADDED PROFIT VALUE ADDED PROFIT
ITT TOT ITT TOT ITT TOT ITT TOT ITT TOT ITT TOT (1) (2) (3) (4) (5) (6) (7) (8) (9) (10) (11) (12)
Both training dummy B 1,885.2 3,853.9 1,293.5 1,534.2 2,315.9 3,874.9** 1,785.1 2,083.2 -2,017.9 5,354.2 -2,816.7 -1,133.1 (Yes=1) (1.003) (1.571) (0.710) (0.780) (1.398) (2.016) (1.078) (1.193) (-0.648) (0.916) (-0.988) (-0.314)
Either training dummy E -1,432.2 -2,094.4* -1,416.8 -1,424.3 -1,347.9 -2,156.9* -1,854.7 -1,846.2 -3,244.7* -6,287.3** -3,258.8* -4,097.4** (Yes=1) (-1.196) (-1.720) (-1.113) (-1.140) (-1.182) (-1.800) (-1.563) (-1.615) (-1.931) (-2.429) (-1.981) (-2.074)
Both training (Yes=1) 30.726 -21.626 22.684 22.911 2.995 -100.729 -42.809 -48.918 72.502 -63.442 69.652 40.466 x Communication Z (0.554) (-0.370) (0.453) (0.470) (0.044) (-1.425) (-0.787) (-0.776) (1.060) (-0.614) (1.143) (0.645)
Either training (Yes=1) 62.835** 88.511*** 64.056** 62.571** 76.248 128.724** 97.761* 91.012* 47.761 110.921** 46.346 62.487 x Communication Z (2.232) (2.728) (2.066) (2.234) (1.445) (2.249) (1.857) (1.901) (1.486) (2.040) (1.479) (1.620)
Control (Yes = 1) x -12.742 -7.178 -38.375 -36.511 -51.055 -59.271 -114.395 -114.468 -40.704 -38.599 -50.772 -50.482 communication (1 - B - E)Z (-0.280) (-0.174) (-0.832) (-0.864) (-0.317) (-0.401) (-0.726) (-0.792) (-0.906) (-0.900) (-1.161) (-1.238)
Sex of entrepreneur 2,942** 3,282*** 3,132** 3,279*** 3,294** 3,848*** 3,660*** 3,869*** 2,922** 3,369*** 3,136*** 3,414*** (Female=1) (2.282) (2.636) (2.584) (2.860) (2.470) (2.979) (2.827) (3.138) (2.356) (2.755) (2.651) (3.021)
Education of entrepreneur -244.925 -292.608* -184.343 -190.324 -284.79* -304.45** -240.209* -238.71* -203.907 -264.517 -142.825 -154.358 (years of schooling) (-1.648) (-1.900) (-1.378) (-1.532) (-1.842) (-2.030) (-1.721) (-1.841) (-1.226) (-1.441) (-0.948) (-1.071)
Any prior training -1,285.2 -1,365.7 -1,299.1 -1,261.6 -1,043.0 -1,047.8 -1,016.1 -1,072.2 -1,106.6 -1,285.4 -1,104.7 -1,107.3 experience (Yes=1) (-1.270) (-1.421) (-1.246) (-1.305) (-1.050) (-1.144) (-1.002) (-1.156) (-1.085) (-1.282) (-1.076) (-1.153)
Value added/Profit in 1.410*** 1.417*** 0.795*** 0.793*** 1.426*** 1.412*** 0.807*** 0.802*** 1.426*** 1.463*** 0.807*** 0.812*** the past (YP) (11.950) (12.910) (9.129) (9.860) (12.485) (13.251) (9.498) (10.095) (13.049) (14.506) (9.917) (11.160)
Constant -13,919.0 -7,950.3 -5,417.9 -4,164.4 -12,183.8 -7,191.4 -4,055.5 -1,912.7 -19,507.9 -12,357.1 -11,992.8 -9,666.6 (-0.743) (-0.481) (-0.307) (-0.270) (-0.644) (-0.434) (-0.238) (-0.128) (-1.071) (-0.710) (-0.705) (-0.640) First-stage F statistics 204.23 211.86 215.98 201.58 204.29 218.27 R-squared 0.900 0.897 0.864 0.865 0.898 0.897 0.864 0.865 0.901 0.890 0.866 0.866
Number of enterprises 107 107 107 107 107 107 107 107 107 107 107 107
Notes: The dependent variable in columns (1), (2), (5), (6), (9), and (10) is the value added (i.e., sales revenue minus material costs, subcontracting costs, utility costs, and transportation costs). The dependent variable in columns (3), (4), (7), (8), (11), and
(12) is the profit (i.e., sales revenue minus material costs, subcontracting costs, utility costs, transportation costs, and labor costs). The value added and profit are in USD and are adjusted by using the World Bank GDP Deflator. The baseline value added
and profit (i.e., values in the past) are those of the mean values of 2008 and 2010. For the intention-to-treat (ITT) effects, the reported estimates are the coefficients of the dummy variable taking 1 if the enterprise was assigned Group TT (both training
programs) or Group TC/CT (either training programs). For the treatment effects on the treated (TOT), the reported estimates are the coefficients of the dummy variable taking 1 if the enterprise complied with the assigned treatment. To estimate the TOT,
we use the instrumental variable approach by instrumenting the actual participation status with the random invitation status. The variables “TALKED”, “VISITED”, and “KNOWN” capture the communication networks, Z, as defined by the number of
entrepreneurs with whom s/he talked to about the training program, the number of entrepreneurs with whom (s)he visited their workshop, and the number of entrepreneurs whom the entrepreneur knew in person (or just by name), respectively. The
robust t-statistics and z-statistics for the ITT and TOT are in parentheses, respectively. The asterisks ***, **, and * indicate the statistical significance at 1 percent, 5 percent, and 10 percent, respectively.
Inception and Operationalization of Kaizen in Tanzania: The Case of Manufacturing Sector

Conclusions and Policy Implications• The training program, which featured basic Kaizen approach to
productivity improvement, had a positive and statistically significant
impact on the adoption of management practices and business
performance in the medium run (i.e., 3 years after the interventions).
• Admittedly, the findings in this paper are likely to be understating the
training impacts due to potential existence of knowledge spillovers.
❑Policy: Industrial Policy that promotes and support the entrepreneur's
learning of firm-level production and business management practices,
including Kaizen approach to productivity improvement, is essential for
building a competitive industrial sector in Tanzania (also SSA).
❑Research: It is worth collecting data over a longer span after the
interventions is vital.
428/24/2021 Inception and Operationalization of Kaizen in Tanzania: The Case of Manufacturing Sector

Is Management Training Enough?• It is necessary but not a panacea (that is, not a sufficient condition
for industrialization in SSA), other critical determinants (such as
technology, affordable credit, and infrastructure (industrial
clusters) are to be logically made available.
• Then why do we emphasize the firm-level management training,
including Kaizen practices? Because of the under-evaluation of the
importance of management and that the practical results of
management training can be used to screen promising and non-
promising entrepreneurs.
• Re-emphasis: Lead role of Government is key, and top leadership
in the Government and Private Sector for institutionalization of
Kaizen is necessary to widely disseminate Kaizen.
438/24/2021 Inception and Operationalization of Kaizen in Tanzania: The Case of Manufacturing Sector

8/24/2021 44
THANK YOU FOR YOUR
AUDIENCE
Inception and Operationalization of Kaizen in Tanzania: The Case of Manufacturing Sector