in vivo microscopy of hemozoin: towards a needle free ... vivo microscopy of hemozoin: towards a...
TRANSCRIPT
In vivo microscopy of hemozoin: towards a needle free diagnostic for malaria
Jennifer L. Burnett,* Jennifer L. Carns, and Rebecca Richards-Kortum Department of Bioengineering, Rice University, 6100 Main Street, Houston, TX, 77006, USA
Abstract: Clinical diagnosis of malaria suffers from poor specificity leading to overtreatment with antimalarial medications. Alternatives, like blood smear microscopy or antigen-based tests, require a blood sample. We investigate in vivo microscopy as a needle-free malaria diagnostic. Two optical signatures, birefringence and absorbance, of the endogenous malaria by-product hemozoin were evaluated as in vivo optical biomarkers. Hemozoin birefringence was difficult to detect in highly scattering tissue; however, hemozoin absorbance was observed in increasingly complex biological environments and detectable over a clinically-relevant range of parasitemia in vivo in a P. yoelii-infected mouse model of malaria.
©2015 Optical Society of America
OCIS codes: (170.0180) Microscopy; (170.1470) Blood or tissue constituent monitoring; (260.1440) Birefringence.
References and links 1. World Health Organization, World Malaria Report (WHO Press, 2012). 2. M. E. Rafael, T. Taylor, A. Magill, Y. W. Lim, F. Girosi, and R. Allan, “Reducing the burden of childhood
malaria in Africa: the role of improved,” Nature 444(Suppl 1), 39–48 (2006). 3. J. A. Rowe, A. Claessens, R. A. Corrigan, and M. Arman, “Adhesion of Plasmodium falciparum-infected
erythrocytes to human cells: molecular mechanisms and therapeutic implications,” Expert Rev. Mol. Med. 11, e16 (2009).
4. T. J. Egan, “Recent advances in understanding the mechanism of hemozoin (malaria pigment) formation,” J. Inorg. Biochem. 102(5-6), 1288–1299 (2008).
5. B. K. Wilson, M. R. Behrend, M. P. Horning, and M. C. Hegg, “Detection of malarial byproduct hemozoin utilizing its unique scattering properties,” Opt. Express 19(13), 12190–12196 (2011).
6. A. Butykai, A. Orbán, V. Kocsis, D. Szaller, S. Bordács, E. Tátrai-Szekeres, L. F. Kiss, A. Bóta, B. G. Vértessy, T. Zelles, and I. Kézsmárki, “Malaria pigment crystals as magnetic micro-rotors: key for high-sensitivity diagnosis,” Sci. Rep. 3, 1431 (2013).
7. P. F. Scholl, D. Kongkasuriyachai, P. A. Demirev, A. B. Feldman, J. S. Lin, D. J. Sullivan, Jr., and N. Kumar, “Rapid detection of malaria infection in vivo by laser desorption mass spectrometry,” Am. J. Trop. Med. Hyg. 71(5), 546–551 (2004).
8. D. M. Newman, R. J. Matelon, M. L. Wears, and L. B. Savage, “The in vivo diagnosis of malaria: Feasibility study into a magneto-optic fingertip probe,” IEEE J. Sel. Top. Quantum Electron. 16(3), 573–580 (2010).
9. E. Y. Lukianova-Hleb, K. M. Campbell, P. E. Constantinou, J. Braam, J. S. Olson, R. E. Ware, D. J. Sullivan, Jr., and D. O. Lapotko, “Hemozoin-generated vapor nanobubbles for transdermal reagent- and needle-free detection of malaria,” Proc. Natl. Acad. Sci. U.S.A. 111(3), 900–905 (2014).
10. A. M. Dondorp, C. Ince, P. Charunwatthana, J. Hanson, A. van Kuijen, M. A. Faiz, M. R. Rahman, M. Hasan, E. Bin Yunus, A. Ghose, R. Ruangveerayut, D. Limmathurotsakul, K. Mathura, N. J. White, and N. P. Day, “Direct in vivo assessment of microcirculatory dysfunction in severe falciparum malaria,” J. Infect. Dis. 197(1), 79–84 (2008).
11. F. Paize, R. Sarginson, N. Makwana, P. B. Baines, A. P. J. Thomson, I. Sinha, C. A. Hart, A. Riordan, K. C. Hawkins, E. D. Carrol, and C. M. Parry, “Changes in the sublingual microcirculation and endothelial adhesion molecules during the course of severe meningococcal disease treated in the paediatric intensive care unit,” Intensive Care Med. 38(5), 863–871 (2012).
12. W. M. White, M. Rajadhyaksha, S. González, R. L. Fabian, and R. R. Anderson, “Noninvasive imaging of human oral mucosa in vivo by confocal reflectance microscopy,” Laryngoscope 109(10), 1709–1717 (1999).
13. L. Golan, D. Yeheskely-Hayon, L. Minai, E. J. Dann, and D. Yelin, “Noninvasive imaging of flowing blood cells using label-free spectrally encoded flow cytometry,” Biomed. Opt. Express 3(6), 1455–1464 (2012).
14. J. M. Carlton, S. V. Angiuoli, B. B. Suh, T. W. Kooij, M. Pertea, J. C. Silva, M. D. Ermolaeva, J. E. Allen, J. D. Selengut, H. L. Koo, J. D. Peterson, M. Pop, D. S. Kosack, M. F. Shumway, S. L. Bidwell, S. J. Shallom, S. E.
#242981 Received 16 Jun 2015; revised 1 Aug 2015; accepted 3 Aug 2015; published 21 Aug 2015 (C) 2015 OSA 1 Sep 2015 | Vol. 6, No. 9 | DOI:10.1364/BOE.6.003462 | BIOMEDICAL OPTICS EXPRESS 3462

van Aken, S. B. Riedmuller, T. V. Feldblyum, J. K. Cho, J. Quackenbush, M. Sedegah, A. Shoaibi, L. M. Cummings, L. Florens, J. R. Yates, J. D. Raine, R. E. Sinden, M. A. Harris, D. A. Cunningham, P. R. Preiser, L. W. Bergman, A. B. Vaidya, L. H. van Lin, C. J. Janse, A. P. Waters, H. O. Smith, O. R. White, S. L. Salzberg, J. C. Venter, C. M. Fraser, S. L. Hoffman, M. J. Gardner, and D. J. Carucci, “Genome sequence and comparative analysis of the model rodent malaria parasite Plasmodium yoelii yoelii,” Nature 419(6906), 512–519 (2002).
15. M. M. Stevenson and E. M. Riley, “Innate immunity to malaria,” Nat. Rev. Immunol. 4(3), 169–180 (2004). 16. T. Frosch, S. Koncarevic, K. Becker, and J. Popp, “Morphology-sensitive Raman modes of the malaria pigment
hemozoin,” Analyst (Lond.) 134(6), 1126–1132 (2009). 17. H. Wayland and P. C. Johnson, “Erythrocyte velocity measurement in microvessels by a two-slit photometric
method,” J. Appl. Physiol. 22(2), 333–337 (1967). 18. H. J. van Staveren, C. J. Moes, J. van Marie, S. A. Prahl, and M. J. van Gemert, “Light scattering in Intralipid-
10% in the wavelength range of 400-1100 nm,” Appl. Opt. 30(31), 4507–4514 (1991). 19. D. Arifler, R. A. Schwarz, S. K. Chang, and R. Richards-Kortum, “Reflectance spectroscopy for diagnosis of
epithelial precancer: model-based analysis of fiber-optic probe designs to resolve spectral information from epithelium and stroma,” Appl. Opt. 44(20), 4291–4305 (2005).
20. M. G. Müller, T. A. Valdez, I. Georgakoudi, V. Backman, C. Fuentes, S. Kabani, N. Laver, Z. Wang, C. W. Boone, R. R. Dasari, S. M. Shapshay, and M. S. Feld, “Spectroscopic detection and evaluation of morphologic and biochemical changes in early human oral carcinoma,” Cancer 97(7), 1681–1692 (2003).
21. S. McGee, J. Mirkovic, V. Mardirossian, A. Elackattu, C.-C. Yu, S. Kabani, G. Gallagher, R. Pistey, L. Galindo, K. Badizadegan, Z. Wang, R. Dasari, M. S. Feld, and G. Grillone, “Model-based spectroscopic analysis of the oral cavity: impact of anatomy,” J. Biomed. Opt. 13(6), 064034 (2008).
22. A. L. L. Clark, A. Gillenwater, R. Alizadeh-Naderi, A. K. El-Naggar, and R. Richards-Kortum, “Detection and diagnosis of oral neoplasia with an optical coherence microscope,” J. Biomed. Opt. 9(6), 1271–1280 (2004).
23. B. Yu, A. Shah, V. K. Nagarajan, and D. G. Ferris, “Diffuse reflectance spectroscopy of epithelial tissue with a smart fiber-optic probe,” Biomed. Opt. Express 5(3), 675–689 (2014).
24. J. Kopacz and N. Kumar, “Murine γ δ T Lymphocytes Elicited during Plasmodium yoelii Infection Respond to Plasmodium Heat Shock Proteins,” Infect. Immun. 67(1), 57–63 (1999).
25. T. C. Minh, S. Ichioka, K. Harii, M. Shibata, J. Ando, and T. Nakatsuka, “Dorsal bipedicled island skin flap: a new flap model in mice,” Scand. J. Plast. Reconstr. Surg. Hand Surg. 36(5), 262–267 (2002).
26. A. García-Hernández, R. Roldán-Marín, P. Iglesias-Garcia, and J. Malvehy, “In vivo noninvasive imaging of healthy lower lip mucosa: a correlation study between high-definition optical coherence tomography, reflectance confocal microscopy, and histology,” Dermatol. Res. Pract. 2013, 205256 (2013).
27. I. Pavlova, C. R. Weber, R. A. Schwarz, M. Williams, A. El-Naggar, A. Gillenwater, and R. Richards-Kortum, “Monte Carlo model to describe depth selective fluorescence spectra of epithelial tissue: applications for diagnosis of oral precancer,” J. Biomed. Opt. 13(6), 064012 (2008).
28. T. P. Santisakultarm, N. R. Cornelius, N. Nishimura, A. I. Schafer, R. T. Silver, P. C. Doerschuk, W. L. Olbricht, and C. B. Schaffer, “In vivo two-photon excited fluorescence microscopy reveals cardiac- and respiration-dependent pulsatile blood flow in cortical blood vessels in mice,” Am. J. Physiol. Heart Circ. Physiol. 302(7), H1367–H1377 (2012).
29. World Health Organization, Malaria Rapid Diagnostic Test Performance: Results of WHO product testing of malaria RDTs: Round 4 (WHO Press, 2012).
30. H. Rodulfo, M. De Donato, R. Mora, L. González, and C. E. Contreras, “Comparison of the diagnosis of malaria by microscopy, immunochromatography and PCR in endemic areas of Venezuela,” Braz. J. Med. Biol. Res. 40(4), 535–543 (2007).
31. T. Planche, S. Krishna, M. Kombila, K. Engel, J. F. Faucher, E. Ngou-Milama, and P. G. Kremsner, “Comparison of methods for the rapid laboratory assessment of children with malaria,” Am. J. Trop. Med. Hyg. 65(5), 599–602 (2001).
32. K. A. Baltzell, D. Shakely, M. Hsiang, J. Kemere, A. S. Ali, A. Björkman, A. Mårtensson, R. Omar, K. Elfving, M. Msellem, B. Aydin-Schmidt, P. J. Rosenthal, and B. Greenhouse, “Prevalence of PCR Detectable Malaria Infection among Febrile Patients with a Negative Plasmodium falciparum Specific Rapid Diagnostic Test in Zanzibar,” Am. J. Trop. Med. Hyg. 88(2), 289–291 (2013).
33. T. Hänscheid, T. J. Egan, and M. P. Grobusch, “Haemozoin: from melatonin pigment to drug target, diagnostic tool, and immune modulator,” Lancet Infect. Dis. 7(10), 675–685 (2007).
34. M. Ho, M. J. Hickey, A. G. Murray, G. Andonegui, and P. Kubes, “Visualization of Plasmodium falciparum-endothelium interactions in human microvasculature: mimicry of leukocyte recruitment,” J. Exp. Med. 192(8), 1205–1212 (2000).
1. Introduction
Malaria is a potentially fatal disease caused by a mosquito-borne infection of protozoan parasites (Plasmodium spp), characterized by flu-like illness with febrile symptoms. Half of the world’s population is at risk for malaria; however, the burden of the disease rests primarily in developing countries. In 2010, 90% of malaria deaths occurred in Africa, with the highest mortality rates occurring in children under five years of age [1]. Therefore, in
#242981 Received 16 Jun 2015; revised 1 Aug 2015; accepted 3 Aug 2015; published 21 Aug 2015 (C) 2015 OSA 1 Sep 2015 | Vol. 6, No. 9 | DOI:10.1364/BOE.6.003462 | BIOMEDICAL OPTICS EXPRESS 3463

malaria endemic areas it is common for children presenting with flu-like symptoms to be treated syndromically with antimalarial drugs, leading to overtreatment. Over-use of antimalarial medications increases the likelihood that drug resistance will develop, ultimately shortening the time that first line drugs can be used. There is a clear need for a point-of-care malaria diagnostic test to avoid premature depletion of malaria drug treatments and to reduce the risk that pathogen drug resistance will emerge [2]. Blood smear microscopy and antigen based rapid diagnostic tests (RDTs) provide alternatives to clinical diagnosis, however both methods require a fingerprick blood sample and related consumables, generate bio-hazardous waste, and can potentially underestimate parasite density due to the adherence of infected red blood cells (iRBCs) to the endothelium of the microvasculature [3]. To address the limitations of conventional malaria diagnostics, we investigate a needle-free method to detect sequestered and circulating infected red blood cells in vivo, using a simple microscope system to capture the endogenous optical signatures from hemozoin, the metabolic by-product of the parasite within iRBCs.
Fig. 1. (a) Diagnostic concept: malaria-infected cells are detected circulating through the superficial microvasculature using in vivo microscopy. (b) The malaria parasite by-product, hemozoin, visualized under bright-field and (c) cross-polarized illumination.
Inside an iRBC, parasite hemoglobin consumption produces free heme which is highly cytotoxic. This by-product is converted by the parasite in a crystallization process, forming the insoluble hemozoin [4]. Owing to its crystalline nature, hemozoin is a highly scattering, birefringent material with strong optical absorbance and paramagnetic properties, making it an ideal candidate for in vivo optical interrogation [5,6]. Hemozoin has been explored as an endogenous malaria optical biomarker using laser desorption mass spectrometry, magneto-optic detection, and vapor nanobubble acoustical detection [7–9]. In this work, we explore the use of in vivo microscopy to detect hemozoin circulating in the microvasculature. In vivo microscopy has previously been used to observe microvasculature hemodynamics in sepsis and malaria-infected patients by taking advantage of hemoglobin absorbance to provide contrast with surrounding tissue [10,11]. Here, we seek to extend the ability of in vivo microscopy to identify intra-cellular hemozoin structures as a mechanism for malaria diagnosis. This approach, depicted in Fig. 1(a), uses a portable microscope with battery powered LED illumination amenable to use in resource limited areas to observe circulating blood cells in the superficial microvasculature. Hemozoin is detected via two optical
#242981 Received 16 Jun 2015; revised 1 Aug 2015; accepted 3 Aug 2015; published 21 Aug 2015 (C) 2015 OSA 1 Sep 2015 | Vol. 6, No. 9 | DOI:10.1364/BOE.6.003462 | BIOMEDICAL OPTICS EXPRESS 3464
signatures, birefringence and absorbance. These two optical signatures are observed in thin unstained blood smears by standard microscopy when imaged under bright field (Fig. 1(b)) and cross polarized illumination (Fig. 1(c)) using a research grade microscope (Zeiss Z1).
To investigate in vivo microscopy for the detection of hemozoin, we developed a Microvascular Microscope (MVM), a portable, low-cost microscope equipped with dual modes of operation- cross polarized reflectance and transmission illumination- to detect two optical signatures of hemozoin, birefringence and absorbance, respectively. The device was designed to image superficial vasculature in the human oral mucosa of the lower lip for future translation to human subjects. This imaging site was chosen for its accessibility and low melanin content [12,13]. Using the MVM, the optical signatures of hemozoin were assessed in increasingly complex biological environments. These investigations were carried out using P. yoelii-infected mice, a well-established model for malaria pathogenesis and vaccine efficacy [14,15]. First, we developed a multilayer optical phantom to replicate the microvasculature architecture of the oral mucosa. Using this model, we assessed the optical signatures of hemozoin in P. yoelii-infected blood samples. We found that hemozoin birefringence resulted in low contrast when imaged in a scattering environment with optical properties similar to tissue. However, hemozoin absorption was readily detectable under the same scattering conditions. Next, we assessed these two biomarkers in excised tissue samples from a mouse model, confirming the ability to detect hemozoin absorbance in a tissue environment. Finally, we investigated the feasibility for detecting circulating hemozoin in vivo in P. yoelii-infected mice by hemozoin absorbance. Using this model we successfully detected hemozoin structures over a range of clinically-relevant parasitemia levels, demonstrating the potential for a rapid and quantitative diagnostic technique. Taken together, these results demonstrate a proof-of-concept for the optical detection and quantification of hemozoin in vivo.
2. Methods
2.1 Microvascular microscope
The Microvascular Microscope (MVM), depicted in Fig. 2(a), employs three illumination modes, transmission green light illumination (TG), transmission red light illumination (TR), and cross polarized epi illumination (XP). TG was employed to locate vessels, TR to detect hemozoin absorbance, and XP to detect hemozoin birefringence. Samples were brought into direct contact with a modified microscope objective, L1; the outer casing of the standard objective (Newport, M-60X, NA = 0.85) was removed to reduce its size, making it easier to interface with living tissue. Light collected from L1 passed through a series of biconvex lenses, L2-L4 (Thorlabs, f = 25 mm) and field stop, FS, and was imaged on a monochromatic CCD camera (Point Grey, Chameleon). In XP, LED light (CREE, λ = 525 nm, FWHM 35 nm) was collimated and launched through a band pass filter (Chroma, λ = 530 ± 25 nm) and a linear polarizer (Thorlabs, LPVISA). Co-linear polarized light was reflected off the polarizing beam splitter, PBS (Thorlabs CM1-PBS251), and sent to the sample. Scattered light from the sample passed through the polarizing beam splitter, followed by a second linear polarizer, serving as the analyzer. The analyzer was aligned collinear to transmitted light from the PBS, but cross polarized to the illumination light. Green light illumination was chosen to take advantage of the contrast provided by the strong hemoglobin Q band absorption peak. In TR mode, light from a battery powered LED source (Luxeon, λ = 660 nm, FWHM 15 nm) was collimated, launched through a bandpass filter (Chroma, λ = 655 ± 30 nm) and transmitted through the sample. This illumination wavelength was chosen to align with the strong band at 655nm in the hemozoin absorption spectrum [16]. TG illumination was generated by a broadband LED source (CREE, 3000K CCT), passed through a band pass filter (Semrock, λ = 550 ± 44 nm), and directed to the sample by a beam splitter (Thorlabs BSS10). A USAF 1951 resolution target was imaged in TR and XP modes to assess the system imaging performance
#242981 Received 16 Jun 2015; revised 1 Aug 2015; accepted 3 Aug 2015; published 21 Aug 2015 (C) 2015 OSA 1 Sep 2015 | Vol. 6, No. 9 | DOI:10.1364/BOE.6.003462 | BIOMEDICAL OPTICS EXPRESS 3465

of high frequency objects (Fig. 2(b)). The highest frequency line pair (individual line thickness = 0.78 μm) of the resolution target is clearly distinguishable, allowing for observation of submicron structures.
The working distance of the system was varied by the translation of the final lens element to allow for imaging over a range of working distances due the heterogeneous distribution of vessel depths. Measured values of the magnification as a function of working distance were determined by imaging a 100 lp/mm Ronchi grating (Edmund Optics) with three immersion media: air, water, and a refractive index liquid (Cargille) having refractive indices of 1, 1.33, and 1.39. This relationship was calculated using the system ray transfer matrix for n = 1 between L1 and the object plane.
The inside of the lower lip of a healthy volunteer was imaged as part of an Institutional Review Board approved protocol at Rice University. Videos were collected under TG mode to preliminarily assess the ability to locate and image vessels in the oral mucosa. Light was delivered to the dermis of the lateral lower lip and the objective was placed in contact with the buccal mucosa on the opposite side of the tissue. For these images, a color camera (Point Grey, Firefly) was employed with similar pixel and sensor sizes as the monochromatic camera described above.
Fig. 2. (a) Schematic diagram of the MVM with three illumination modes: TR, transmission red, TG, transmission green, and XP, cross polarized reflectance. (b) USAF 1951 resolution target imaged under TR and XP (inset). (c) The measured and calculated magnification of the MVM as a function of working distance.
For in vivo investigations in the mouse model, the cross polarized elements outlined in Fig. 2(a) were removed from the microscope. Videos were collected at a rate of 30 fps using 2x2 pixel binning of the sensor, allowing for the full field of view to be maintained while reducing the overall file size. The exposure time was limited to 20 ms or less to reduce motion blur caused by imaging circulating cells. Imaging was limited to microvasculature, including arterioles, capillaries, and venules, with an average measured diameter of 23 µm. Image analysis was performed in ImageJ software (NIH version 1.48). All TR videos were contrast enhanced (0.4% maximum pixel saturation) for individual frame analysis. Blood flow velocity was determined by measuring the frame-to-frame distance translated by plasma gaps occurring between red blood cell clusters in TG mode. This method has been shown to
#242981 Received 16 Jun 2015; revised 1 Aug 2015; accepted 3 Aug 2015; published 21 Aug 2015 (C) 2015 OSA 1 Sep 2015 | Vol. 6, No. 9 | DOI:10.1364/BOE.6.003462 | BIOMEDICAL OPTICS EXPRESS 3466

estimate red blood cell velocity in previous in vivo investigations of microvasculature circulation [17].
2.2 Multilayer optical phantom
The microvasculature of the oral mucosa was modeled using a multilayer optical phantom composed of three distinct layers: epithelium, vessel, and stroma. The scattering conditions of tissue were mimicked using Intralipid, a fat emulsion with optical scattering properties similar to tissue [18]. To determine the appropriate Intralipid concentrations, the reduced scattering coefficient of Intralipid was modeled using an approximation to Mie theory and compared to measured and calculated reduced scattering coefficient values of oral mucosa tissue reported in the literature [19–23]. The stroma phantom was prepared from an Intralipid doped gelatin base. Agarose (Life Technologies, 15510) was dissolved into deionized water (3% w/v) and heated to a boil. Intralipid (Sigma, I141) was mixed with the gelatin to a final concentration of 1.5% v/v and allowed to cool and solidify. Vessel were modeled using thin-walled glass capillary tubes (Hampton, HR6-152) with an average inner diameter of 80µm. Tubes were secured to the stroma base and loaded with a blood sample. The epithelium was modeled using an aqueous solution placed between the capillary tube and the imaging device, allowing for easy manipulation of the epithelial thickness. First, water alone was used to mimic a non-scattering epithelium and to determine the hemozoin optical signature that could be detected from a blood volume atop a scattering stromal background. To assess the effects of increasing epithelial scattering coefficient, a series of aqueous mixtures were prepared with varying concentrations of Intralipid (0, 0.01, 0.05, 0.1, 0.5, and 1.0%).
2.3 Mouse model of malaria
Female C57/B6J albino mice were obtained at 7-9 weeks old from Jackson Laboratories. All mouse experiments were performed in accordance with an Institutional Animal Care and Use Committee approved protocol at Rice University. For the malaria model, mice were infected by i.p. injection with a 100 µl bolus of Plasmodium yoelii yoelii 17 XNL (MRA-593, MR4, ATCC Manassas Virginia). Infection was maintained through serial passage. Using this method parasitemia levels increase rapidly [24], therefore the lowest level of parasitemia assessed by in vivo microscopy was 0.03%. A reflected skin flap model was used for imaging hemozoin in a tissue environment optically similar to the human oral mucosa. Subcutaneous tissue is surgically accessed by making an arc-shaped incision along the dorsal midline and reflecting the skin flap laterally [25]. The tissue was washed with an isotonic saline solution and placed in gentle contact with the MVM for imaging in vivo. Parasitemia was assessed by microscopic examination of stained blood films using a two part differential staining solution (Diff Quik, Siemens). Blood samples were collected via cardiac puncture to avoid sampling error and accurately measure parasite density.
3. Results
3.1 MVM characterization
The MVM was developed for imaging two optical signatures of hemozoin: birefringence under cross polarized reflectance imaging and hemozoin absorbance using transmission imaging. The device was optimized for imaging blood flow in the oral mucosa. Assuming average capillary densities in the oral mucosa of 40 vessels/mm2 [12], and given the sensor area of roughly 18 mm2, the largest magnification yielding at least 1 capillary per field of view is 30x. Higher magnifications are allowable, but may require more time to locate a vessel. The lower boundary for the magnification is set by the pixel limited resolution of the system. Submicron resolution is necessary to image hemozoin crystals measuring approximately 0.7 µm in length [6]. To achieve this lateral resolution a pixel density of 2.8 pixels/µm is required by the Nyquist sampling rate. Considering a pixel width of 3.75 µm,
#242981 Received 16 Jun 2015; revised 1 Aug 2015; accepted 3 Aug 2015; published 21 Aug 2015 (C) 2015 OSA 1 Sep 2015 | Vol. 6, No. 9 | DOI:10.1364/BOE.6.003462 | BIOMEDICAL OPTICS EXPRESS 3467
this criterion requires the magnification to be at least 22.5x to allow for 2x2 pixel binning at higher frame rates. The system was designed to meet these criteria over a range of working distances because the minimum epithelium thickness of the lower lip varies, with reported values of 70-245 μm [13,26]. The magnification of the system increases with working distance demonstrated by the theoretical calculation of the system ray transfer matrix and measured values for samples imaged in air illustrated in Fig. 1(c). This increase is less striking when measured for samples imaged under refractive indexes similar to tissue, as shown for immersion media with n = 1.33 and 1.395, satisfying the magnification boundary conditions set by the desired field of view size and pixel limited lateral resolution requirements.
The ability to locate and image vessels in a normal volunteer human subject was demonstrated under green light illumination shown in Fig. 1(a). Individual red blood cells are discerned by the strong hemoglobin absorbance against the uniform optical background, demonstrating appropriate temporal and spatial resolution for imaging circulating blood cells.
3.2 Optical biomarker assessment in a multilayer tissue phantom
The optical signatures of hemozoin were assessed in a multilayer tissue phantom. Two modes of illumination were employed; XP mode to elicit hemozoin birefringence and TR to visualize hemozoin absorbance. Example images from the multilayer phantom are shown in Fig. 3. First, the hemozoin optical signature in a blood volume was imaged under non-scattering conditions, using water to model a non-scattering epithelium. When a negative control sample is imaged under TR (Fig. 3(a)), the illumination light passes through the blood sample due to the weak hemoglobin absorbance in the red wavelengths, creating a fairly uniform background with the only contrast appearing at the edge of the capillary tube horizontally crossing the image. In contrast, when imaged under XP (Fig. 3(b)) the blood background appears uniformly dark due to the rejection of the backscattered polarized illumination. In P. yoelii-infected samples, hemozoin appear as dark absorbing structures against the bright background in TR mode (Fig. 3(c)). Under XP mode, the hemozoin crystals elicit a strong scattering signal that varies rapidly over time (Fig. 3(d)). To quantify this behavior, a single hemozoin particle was selected as a region of interest (ROI) and colocalized in both modes. The coefficient of variation of the signal to background ratio (SBR) was measured over 10 consecutive frames for both TR and XP. Note that for absorbance measurements the signal intensity is less than the background, therefore the SBR in TR mode is represented as the reciprocal of the measured signal to background intensity ratio. This process was repeated for a total of 10 ROIs. The results of these measurements are shown in Fig. 3(e), demonstrating much greater variability in XP mode than TR.
#242981 Received 16 Jun 2015; revised 1 Aug 2015; accepted 3 Aug 2015; published 21 Aug 2015 (C) 2015 OSA 1 Sep 2015 | Vol. 6, No. 9 | DOI:10.1364/BOE.6.003462 | BIOMEDICAL OPTICS EXPRESS 3468

Fig. 3. MVM imaging of multilayer phantom. (a) Negative control blood sample imaged under TR and (b) XP. (c) P. yoelii-infected blood sample imaged under TR and (d) XP. Arrows indicate hemozoin particles. Scale bars = 20 µm. (e) Temporal variations in SBR quantified for 10 colocalized ROIs. (f) The SBR as a function of increasing epithelial scattering by increasing Intralipid concentration.
Next, we assessed the effect of epithelial scattering on the hemozoin signal. The scattering coefficient of the phantom epithelium layer was varied by increasing the Intralipid concentration. The epithelial reduced scattering coefficient varies dependent on the anisotropy and depth of the epithelial layer, ranging from 1.3 to 5.9 cm−1 when evaluated at 600 nm [22,27], or equivalently Intralipid concentrations of 0.15 to 0.67%. The average SBR of 20 ROIs was measured with increasing Intralipid concentration for both modes. Due to the temporal variations of hemozoin birefringent signal, the SBR from 10 consecutive frames was measured for each ROI in XP mode. The results appear in Fig. 3(f). At very low Intralipid concentrations, the XP SBR is more variable and higher than the TR signal. With increasing Intralipid concentration, the XP SBR begins to decrease as the epithelial layer depolarizes the illumination light as readily as the hemozoin crystals. The TR SBR remains nearly constant until high levels of scattering and is greater than the XP SBR at 0.5% Intralipid concentration, consistent with reported epithelial scattering conditions.
#242981 Received 16 Jun 2015; revised 1 Aug 2015; accepted 3 Aug 2015; published 21 Aug 2015 (C) 2015 OSA 1 Sep 2015 | Vol. 6, No. 9 | DOI:10.1364/BOE.6.003462 | BIOMEDICAL OPTICS EXPRESS 3469

Fig. 4. Ex vivo imaging of microvasculature in excised mouse tissue from (a-c) a negative control animal and (d-i) a P. yoelii-infected animal. Arrows indicate hemozoin particles. Scale bars = 20 µm.
3.3 Ex vivo assessment of hemozoin detection
Excised tissue from the reflected skin flap of a mouse model was imaged using the MVM. For these experiments TG mode was employed to locate superficial microvasculature using the contrast of hemoglobin absorbance against the surrounding tissue. First, tissue from a non-infected animal was examined to determine the expected optical background (Fig. 4(a)-4(c)). In TG mode, vessels appear as long tubes encapsulating granular structures due to absorbance from individual red blood cells. Adipose cells may also be observed, as in the bottom right of the image. Under TR, vessel contrast is attenuated due to the decrease in hemoglobin absorbance under red wavelengths. In XP mode, green light illumination allows for the visualization of vessels, however tissue components such as adipose cell edges and collagen fibers generate signal and diminish vascular contrast. Next, tissue from a P. yoelii-infected animal was imaged to evaluate the hemozoin optical signature in a tissue environment (Fig. 4(d)-4(f)). Again, vessels were located in TG mode. Under TR, hemozoin was observed as small dark structures throughout the vessels. When the same FOV was imaged under XP, no birefringent signal was detected corresponding to the hemozoin structures seen within the vessel in TR mode. These images are magnified and contrast enhanced (Fig. 4(g)-4(i)) to clearly illustrate the subcellular hemozoin structures.
3.4 In vivo detection of circulating hemozoin
P. yoelii-infected mice were imaged in vivo using the MVM to demonstrate the ability to detect circulating hemozoin. Based on the results of the optical phantom and ex vivo imaging experiments, cross polarized mode elements in the system were removed and all further investigations were carried out in transmission mode only. The tissue was prepared as
#242981 Received 16 Jun 2015; revised 1 Aug 2015; accepted 3 Aug 2015; published 21 Aug 2015 (C) 2015 OSA 1 Sep 2015 | Vol. 6, No. 9 | DOI:10.1364/BOE.6.003462 | BIOMEDICAL OPTICS EXPRESS 3470

described in the methods and placed in contact with the imaging device. Vessels were located under TG. Translation of the final lens in the optical train allowed for easy manipulation of the focal plane without altering the microscope-sample interface, as demonstrated in Fig. 5(a)-5(b). TR was used to detect hemozoin absorbance in the same FOV. Freely circulating and rolling cells were detected, shown in Visualization 1. Some motion artifact associated with animal respiration and heartbeat was also observed, but the FOV was maintained and hemozoin is readily detected in individual frames (Fig. 5(c), 5(d)). In this example, a total of 174 seconds of TR mode video were collected and analyzed. Individual frames were examined using ImageJ software. Thirty individual hemozoin structures were tracked from frame to frame to determine the range of cell velocities, measuring up to 2536.3 µm/s, consistent with blood flow velocity measured under TG mode and reported values of in vivo capillary blood velocity [28]. In the same vessel, the slowest observed hemozoin particle velocity was 2.5 µm/s. Sequestered cells outside the vessel were also observed, remaining stationary throughout the duration of the video collection. The smallest structure observed measured 0.8 µm at the FWHM of the intensity signal. Microvasculature in a non-infected animal was imaged under the same conditions showing similar results to ex vivo images of negative control tissue (Fig. 5(e), 5(f)), and no hemozoin structures were observed when individual frames were examined.
Fig. 5. In vivo imaging of circulating blood in superficial microvasculature of mouse model. (a,b) Axial translation of focal plane in TG mode in P. yoelii-infected animal. (c,d) Selected frames from TR mode video (Visualization 1) collected at imaging site outlined in (b). (e) Imaging of non-infected animal in TG mode and (f) TR mode. Scale bars = 20 µm.
#242981 Received 16 Jun 2015; revised 1 Aug 2015; accepted 3 Aug 2015; published 21 Aug 2015 (C) 2015 OSA 1 Sep 2015 | Vol. 6, No. 9 | DOI:10.1364/BOE.6.003462 | BIOMEDICAL OPTICS EXPRESS 3471
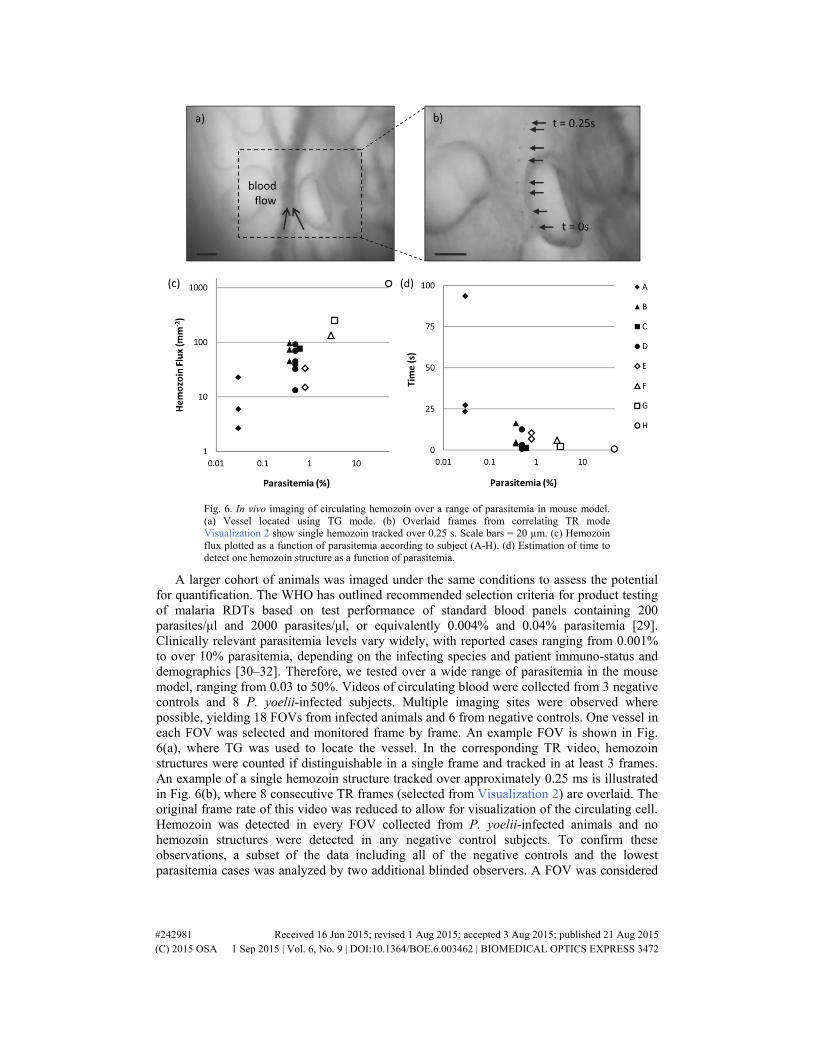
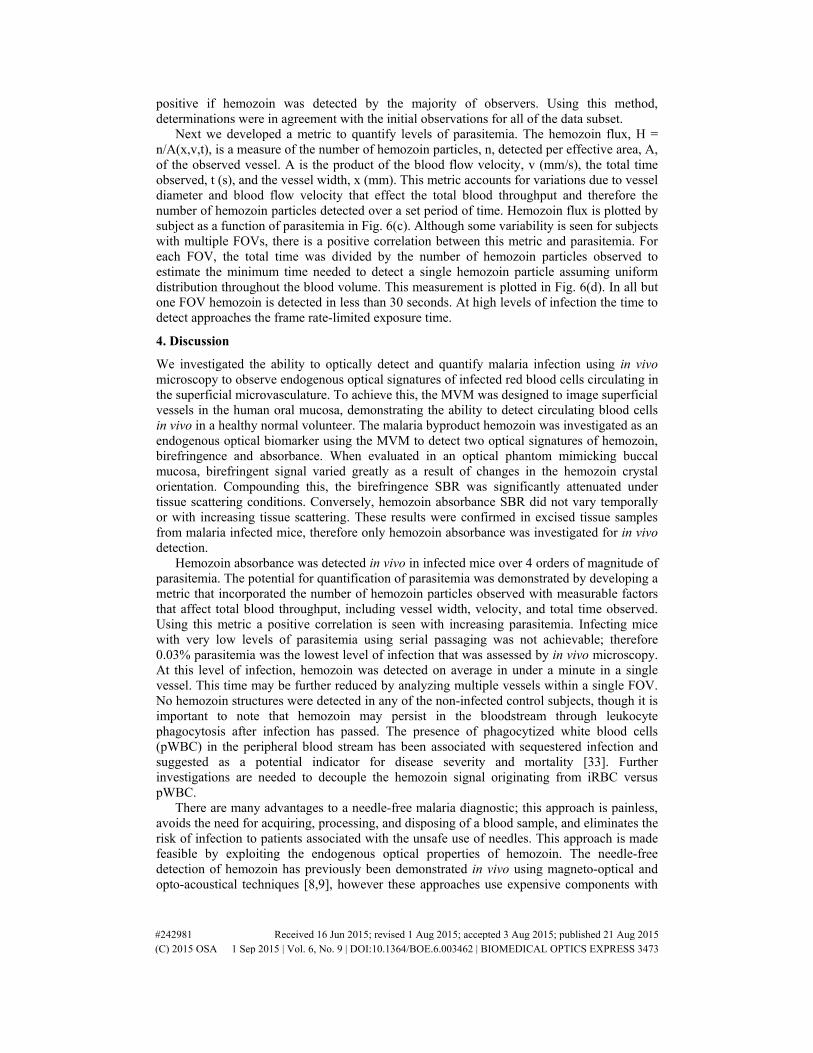
Fig. 6. In vivo imaging of circulating hemozoin over a range of parasitemia in mouse model. (a) Vessel located using TG mode. (b) Overlaid frames from correlating TR mode Visualization 2 show single hemozoin tracked over 0.25 s. Scale bars = 20 µm. (c) Hemozoin flux plotted as a function of parasitemia according to subject (A-H). (d) Estimation of time to detect one hemozoin structure as a function of parasitemia.
A larger cohort of animals was imaged under the same conditions to assess the potential for quantification. The WHO has outlined recommended selection criteria for product testing of malaria RDTs based on test performance of standard blood panels containing 200 parasites/μl and 2000 parasites/μl, or equivalently 0.004% and 0.04% parasitemia [29]. Clinically relevant parasitemia levels vary widely, with reported cases ranging from 0.001% to over 10% parasitemia, depending on the infecting species and patient immuno-status and demographics [30–32]. Therefore, we tested over a wide range of parasitemia in the mouse model, ranging from 0.03 to 50%. Videos of circulating blood were collected from 3 negative controls and 8 P. yoelii-infected subjects. Multiple imaging sites were observed where possible, yielding 18 FOVs from infected animals and 6 from negative controls. One vessel in each FOV was selected and monitored frame by frame. An example FOV is shown in Fig. 6(a), where TG was used to locate the vessel. In the corresponding TR video, hemozoin structures were counted if distinguishable in a single frame and tracked in at least 3 frames. An example of a single hemozoin structure tracked over approximately 0.25 ms is illustrated in Fig. 6(b), where 8 consecutive TR frames (selected from Visualization 2) are overlaid. The original frame rate of this video was reduced to allow for visualization of the circulating cell. Hemozoin was detected in every FOV collected from P. yoelii-infected animals and no hemozoin structures were detected in any negative control subjects. To confirm these observations, a subset of the data including all of the negative controls and the lowest parasitemia cases was analyzed by two additional blinded observers. A FOV was considered
#242981 Received 16 Jun 2015; revised 1 Aug 2015; accepted 3 Aug 2015; published 21 Aug 2015 (C) 2015 OSA 1 Sep 2015 | Vol. 6, No. 9 | DOI:10.1364/BOE.6.003462 | BIOMEDICAL OPTICS EXPRESS 3472
positive if hemozoin was detected by the majority of observers. Using this method, determinations were in agreement with the initial observations for all of the data subset.
Next we developed a metric to quantify levels of parasitemia. The hemozoin flux, H = n/A(x,v,t), is a measure of the number of hemozoin particles, n, detected per effective area, A, of the observed vessel. A is the product of the blood flow velocity, v (mm/s), the total time observed, t (s), and the vessel width, x (mm). This metric accounts for variations due to vessel diameter and blood flow velocity that effect the total blood throughput and therefore the number of hemozoin particles detected over a set period of time. Hemozoin flux is plotted by subject as a function of parasitemia in Fig. 6(c). Although some variability is seen for subjects with multiple FOVs, there is a positive correlation between this metric and parasitemia. For each FOV, the total time was divided by the number of hemozoin particles observed to estimate the minimum time needed to detect a single hemozoin particle assuming uniform distribution throughout the blood volume. This measurement is plotted in Fig. 6(d). In all but one FOV hemozoin is detected in less than 30 seconds. At high levels of infection the time to detect approaches the frame rate-limited exposure time.
4. Discussion
We investigated the ability to optically detect and quantify malaria infection using in vivo microscopy to observe endogenous optical signatures of infected red blood cells circulating in the superficial microvasculature. To achieve this, the MVM was designed to image superficial vessels in the human oral mucosa, demonstrating the ability to detect circulating blood cells in vivo in a healthy normal volunteer. The malaria byproduct hemozoin was investigated as an endogenous optical biomarker using the MVM to detect two optical signatures of hemozoin, birefringence and absorbance. When evaluated in an optical phantom mimicking buccal mucosa, birefringent signal varied greatly as a result of changes in the hemozoin crystal orientation. Compounding this, the birefringence SBR was significantly attenuated under tissue scattering conditions. Conversely, hemozoin absorbance SBR did not vary temporally or with increasing tissue scattering. These results were confirmed in excised tissue samples from malaria infected mice, therefore only hemozoin absorbance was investigated for in vivo detection.
Hemozoin absorbance was detected in vivo in infected mice over 4 orders of magnitude of parasitemia. The potential for quantification of parasitemia was demonstrated by developing a metric that incorporated the number of hemozoin particles observed with measurable factors that affect total blood throughput, including vessel width, velocity, and total time observed. Using this metric a positive correlation is seen with increasing parasitemia. Infecting mice with very low levels of parasitemia using serial passaging was not achievable; therefore 0.03% parasitemia was the lowest level of infection that was assessed by in vivo microscopy. At this level of infection, hemozoin was detected on average in under a minute in a single vessel. This time may be further reduced by analyzing multiple vessels within a single FOV. No hemozoin structures were detected in any of the non-infected control subjects, though it is important to note that hemozoin may persist in the bloodstream through leukocyte phagocytosis after infection has passed. The presence of phagocytized white blood cells (pWBC) in the peripheral blood stream has been associated with sequestered infection and suggested as a potential indicator for disease severity and mortality [33]. Further investigations are needed to decouple the hemozoin signal originating from iRBC versus pWBC.
There are many advantages to a needle-free malaria diagnostic; this approach is painless, avoids the need for acquiring, processing, and disposing of a blood sample, and eliminates the risk of infection to patients associated with the unsafe use of needles. This approach is made feasible by exploiting the endogenous optical properties of hemozoin. The needle-free detection of hemozoin has previously been demonstrated in vivo using magneto-optical and opto-acoustical techniques [8,9], however these approaches use expensive components with
#242981 Received 16 Jun 2015; revised 1 Aug 2015; accepted 3 Aug 2015; published 21 Aug 2015 (C) 2015 OSA 1 Sep 2015 | Vol. 6, No. 9 | DOI:10.1364/BOE.6.003462 | BIOMEDICAL OPTICS EXPRESS 3473

significant power requirements making them difficult to implement in low resource settings where malaria is endemic. The design of the MVM was chosen to avoid the need for elaborate alignment or use of costly optical elements and detectors. Additionally, removing cross polarized elements from the MVM reduces the overall cost and complexity of the device allowing for easier translation to low resource settings. The use of in vivo microscopy also allows for visualization of endothelial cytoadhesion and microvasculature dysfunction, physiological parameters that have been explored as indicators of disease severity [10,34].
The next step toward translation is to verify the ability to detect hemozoin particles in infected human subjects, incorporating automation of detection and quantification in the device. Manual translation of the final lens in the optical train allowed for variation of the working distance into the superficial layers of a sample while maintaining contact with the tissue, reducing the potential for motion artifacts. Future work will involve integrating a liquid lens into an automated system, removing the only freely moving component. In the current configuration illumination light is transmitted through the tissue. Translating to epi-illumination delivery will avoid the need for alignment of the illumination and collection arms and the potential subject to subject variability due to melanin and hair content, further simplifying the device operation.
In conclusion, we have demonstrated in vivo detection of an endogenous biomarker of malaria in a mouse model using a microscope platform amenable to point-of-care settings. Using this approach, malaria infection was detected over a range of parasitemia typically within 30 seconds. These results demonstrate the potential for a quantitative, rapid, needle-free malaria diagnostic using in vivo microscopy, warranting further investigations in a pilot study of smear positive patients.
Acknowledgments
This work was funded by a Global Health grant from the Bill & Melinda Gates Foundation, Award OPP1068133. We thank MR4 for providing us with malaria parasites contributed by Daniel Carucci.
#242981 Received 16 Jun 2015; revised 1 Aug 2015; accepted 3 Aug 2015; published 21 Aug 2015 (C) 2015 OSA 1 Sep 2015 | Vol. 6, No. 9 | DOI:10.1364/BOE.6.003462 | BIOMEDICAL OPTICS EXPRESS 3474