in vitro selection of rna aptamers to clinically...
TRANSCRIPT

VI-1
Chapter 6
In Vitro Selection of RNA Aptamers to Clinically Applicable Small-
Molecule Ligands

VI-2
Abstract
Various platforms for constructing ligand-responsive RNA-based gene regulatory
devices have been demonstrated. Although these devices utilize diverse architectures,
most existing devices that can sense and respond to molecular inputs include sensor
components consisting of RNA aptamers that bind to specific ligands of interest. In
particular, well-characterized aptamers such as those responsive to the small molecules
theophylline and tetracycline have been used in the majority of synthetic RNA control
devices developed to date. Although theophylline and tetracycline have been invaluable
in proof-of-concept studies, their use in practical applications such as metabolic
engineering and cellular therapy is limited by their toxicity. In vitro selection procedures
have been developed for the generation of new RNA aptamers, but few aptamers have
been selected to clinically applicable small molecules that would be required for
applications such as T-cell proliferation control in cellular immunotherapy. Here, we
present three different in vitro aptamer selection procedures for the selection of aptamers
to phenobarbital, vitamin B12, and folinic acid. While ligand binding was observed in
qualitative assays, we have been unable to quantitatively determine the binding affinities
of aptamers obtained from these initial efforts. We discuss specific aspects of the
selection processes—including partition efficiency evaluation for nitrocellulose
membranes, format and timing of counter-selections, sequence and structural analyses of
RNA pools, and techniques for characterizing putative aptamer sequences—that may
contribute to the improvement of aptamer selection protocols.

VI-3
Introduction
Ligand-responsive regulation over gene expression and cellular behavior has
broad applicability in areas ranging from fundamental biomolecular investigation to
metabolic engineering to health and medicine. However, the practicality of such
regulatory schemes is dependent, in part, on the ability to tailor the input response of
these control devices to each application. For example, control devices responsive to
specific metabolite intermediates may be required for pathway engineering in biofuel
production, whereas those responsive to pharmaceutical molecules are critical to the
success of various therapeutic applications.
The RNA-based regulatory devices developed in the Smolke Laboratory and
examined in the context of mammalian cell regulation in this thesis are composed of
modular components, including sensor domains that can be systematically altered to
program the desired input response specificity1-3. The aptamer sequence comprising the
sensor domain specifies the input responsiveness of each regulatory device, independent
of the actuator domain and the regulatory target. The work presented thus far on RNA-
based regulatory systems has utilized molecular inputs such as theophylline and
tetracycline, which are small molecules with well-characterized aptamer sequences. To
fully realize the potential of these RNA-based regulatory devices for therapeutic
applications, we investigate the generation of new RNA aptamers to clinically relevant
input molecules. In particular, we focus on small-molecule ligands to avoid the use of
heterologous proteins, which are prone to immunogenicity.
Although the Systematic Evolution of Ligands by EXponential enrichment
(SELEX; see Chapter 1 for detailed description) has been successfully applied to the

VI-4
selection of numerous ligand molecules, a number of challenges remain in generating
aptamers to clinically relevant small molecules. The ability to effectively enrich ligand-
binding sequences depends on efficient partition methods that can separate ligand-bound
sequences from the unbound pool. In the case of protein ligands, filtration through
nitrocellulose membranes, which are capable of separating proteins and protein-bound
nucleic acids from free nucleic acid molecules, is the most commonly used separation
method4-8. However, membrane filtration cannot be applied to the selection of aptamers
to small-molecule ligands due to the inability of nitrocellulose membranes to retain small
molecules. Instead, column chromatography, in which the small-molecule ligand is
immobilized onto resin particles and ligand-bound nucleic acid sequences are specifically
eluted, is the conventional separation method employed for the selection of aptamers to
small-molecule ligands9-11. However, ligand conjugation to resin particles requires that
the small molecules of interest possess suitable functional groups for the necessary
chemistry. This is a requirement unmet by many clinically relevant small molecules,
including phenobarbital and tamoxifen—two pharmaceutical molecules of particular
interest to the development of T-cell proliferation control systems due to their known
tolerance by human patients and potential for creating combinatorial regulatory systems
utilizing both RNA-based switch devices and engineered cytokine receptor chains (M.C.
Jensen, personal communication) that are responsive to these molecules.
To address this challenge, we examined the use of protein-conjugated small
molecules for aptamer selection and developed alternative methods combining both
membrane filtration and affinity elution to isolate aptamers specific for phenobarbital.
Furthermore, we performed column-based SELEX to select aptamers specific for vitamin

VI-5
B12 (cyanocobalamin) and folinic acid, two well-tolerated small molecules that are
amenable to resin conjugation. While ligand binding was observed in qualitative assays,
we have been unable to quantitatively determine the binding affinities of aptamers
isolated from our efforts to date. Nevertheless, these early attempts led to a greater
understanding of the selection procedure, which informs ongoing aptamer selection
efforts in the Smolke Laboratory. Here, we present a summary of the procedures
performed and discuss specific aspects of these selection processes—including evaluation
of partition efficiency by nitrocellulose membranes, format and timing of negative
selections, sequence and structural analyses of enriched RNA pools, and techniques for
characterizing putative aptamer sequences—that contribute to the continuing
improvement of aptamer selection protocols.
Results
Conventional Nitrocellulose Membrane-Based SELEX Has Low Partition Efficiency
and Enriches for Nitrocellulose-Binding RNA Sequences. Phenobarbital is a
barbiturate approved by the United States Food and Drug Administration for use as an
anticonvulsant in human patients12. It is well tolerated by both mouse T cells (Appendix
1) and human natural killer cells (Appendix 2) in culture, and is a promising molecule for
use in ligand-responsive RNA-based regulatory systems. As an aptamer to phenobarbital
does not exist, we attempted to isolate a novel RNA aptamer to this molecule using
SELEX. However, phenobarbital is a compact molecule with no appropriate functional
group for conjugation to resin particles (Figure 6.1), thus precluding aptamer selection
using column chromatography in the absence of chemical modification to the molecule.

VI-6
Furthermore, nitrocellulose membranes cannot retain small molecules such as
phenobarbital, thus eliminating the second conventional method for separating free and
ligand-bound nucleic acids during SELEX. To address this challenge, we performed
membrane-based selection of RNA aptamers toward phenobarbital conjugated to bovine
serum albumin (phenobarbital-BSA). The BSA enables separation by nitrocellulose
membranes, and rigorous negative selection against unconjugated BSA is expected to
reduce enrichment of BSA-binding RNA sequences.
Figure 6.1. Chemical structure of phenobarbital. In the absence of chemical modification, phenobarbital contains no functional group suitable for resin conjugation chemistry.
An initial RNA library of approximately 1.2 x 10¹³ unique sequences, each
containing a 30-nt randomized (N30) region, was subjected to 20 rounds of selection
(Figure 6.2). Prior to the first selection cycle, the RNA library was filtered through a
nitrocellulose membrane to remove membrane-binding sequences. In each selection
cycle, RNA was incubated with phenobarbital-BSA (containing 12–15 phenobarbital
molecules per BSA molecule) and filtered through a nitrocellulose membrane. The
membrane was washed by filtering through selection buffer (20 mM Tris-HCl, pH7.5;
100 mM NaCl; 750 µM MgCl2) and subsequently soaked in phenol-chloroform to elute
the bound RNA. The eluted RNA was reverse transcribed to generate DNA templates for
the subsequent selection cycle. Several selection conditions were gradually modified
throughout the process to increase selection stringency. Specifically, the phenobarbital-
to-RNA molar ratio and ligand-RNA incubation time were gradually reduced, whereas

VI-7
the wash volume was gradually increased (see Materials and Methods for detailed
protocol). In addition, negative selections against BSA were performed before positive
selections for phenobarbital-BSA in cycles 11 to 13 and 15 to 20.
!"#$%!&$'()*+*,$ !"#$-!&$'()*+*,$
./01$2$/#/"$34(567$87567497:$
!"#$!%&'#
%&(")*&!+,'"#
$$$$$$$$;8&$$
!"#$%&%'()$**+*,-$*.+/01$
-./0!"#!"*12(,'"#
(%#3456#
2"345%(''6'5)($
7(894:#($
$(*110#78%&(,'"#
*'889*%#78%&(%9#
<=74>)+*)(?+@A;8&$
:/3.#0!"#!"*12(,'"#
(%#3456#
2"345%(''6'5)($
7(894:#($
$(*110#78%&(,'"#
;()<#;!%<#21=9&#
>!)*(&>#78%&(%9#
)'(?#0902&("9#!"#
+<9"'8/*<8'&'@'&0#
+&9*!+!%(%9#981%9>#
ABC#B@6?7C$-!&$
&9$9&)9#
%&(")*&!+,'"#
%!&$
!"#$!%&'#
%&(")*&!+,'"#
-!&$D4E6?$?>$!72?$
87@79F>4$G,9@7$
Figure 6.2. Schematic of conventional nitrocellulose membrane-based SELEX for RNA aptamer selection to BSA-conjugated phenobarbital. An RNA sequence library was generated by in vitro transcription and incubated with the target protein (phenobarbital-BSA). The binding mixture was filtered through a nitrocellulose membrane, which retains proteins and protein-bound RNA molecules. The membrane was washed with selection buffer to remove non-specifically or weakly binding RNA sequences. Protein-bound RNA sequences were eluted from the membrane by phenol-chloroform and reverse transcribed into cDNA, which served as the transcription template for the next selection cycle. In cycles 11-13 and 15-20, an additional negative selection step against BSA-binding sequences was inserted before the positive selection step with phenobarbital-BSA.
RNA pools obtained after cycles 15 and 20 of the selection were examined for
ligand-binding specificity. 32P-labeled RNA sequences were incubated with

VI-8
phenobarbital-BSA, BSA (unconjugated), lysozyme, or no protein, and the binding
mixture was filtered through nitrocellulose membranes as in regular selection cycles. The
initial RNA flow-through was collected, and the membrane was washed with 1.8 ml of
selection buffer. Radioactivity in the initial filtrates and on the washed membrane was
quantified by scintillation counting to measure the extent of RNA binding to target
proteins. RNA pools from both cycles show no specific binding to phenobarbital or to
either of the proteins tested (Figure 6.3). Furthermore, the majority of RNA was retained
on the membrane even in the absence of protein input, indicating strong affinity of the
RNA library for the nitrocellulose membrane.
! "
!!""# $%&'# !()&# !$&!#
*+!%$#
&)(*&#
*'%%*#
((***#
),-.))#
",-.)*#
$,-.)*#
!,-.)*#
*,-.)*#
(,-.)*#
%,-.)*#
&,-.)*#
',-.)*#
/012345# 345# 6789:7;1# <9#
/=9>1?@#
!"#$%&'()&*+,(-.$/0#12$
A?B>=C>1#
D1;E=C@1#
!"#$% "$&!% !!$&% !#'(%
)#$(#%)"*($%
"+!"(%
!++!'%
#,-.##%
*,-.#)%
",-.#)%
!,-.#)%
),-.#)%
$,-.#)%
/012345% 345% 6789:7;1% <9%
/=9>1?@%
!"#$%&'()&*+,(-.$/0#12$
A?B>=C>1%
D1;E=C@1%
Figure 6.3. RNA sequence pools obtained after multiple selection cycles show strong affinity for nitrocellulose membranes and no specific binding for phenobarbital-BSA. Radiolabeled RNA was transcribed from cDNA obtained after (A) 12 and (B) 15 selection cycles and incubated with phenobarbital-BSA, BSA alone, lysozyme, or no protein. The binding solutions were filtered through nitrocellulose membranes, followed by washes with selection buffer. Radioactivity in the initial filtrates and on the washed membranes was quantified by scintillation counting. Regardless of the type of protein input, the majority of radioactivity is retained on the membrane, with a small fraction found in the initial filtrate, indicating strong binding to the nitrocellulose membrane.
To verify that RNA in general does not have non-specific affinity for
nitrocellulose, we performed the radioactive binding assay on the initial N30 RNA
library. The N30 RNA pool shows minimal retention by the membrane (Figure 6.4),

VI-9
suggesting the membrane-binding activities observed in post–cycle 15 and post–cycle 20
RNA pools are specific to RNA sequences that have been enriched through multiple
rounds of membrane-based separation.
!"#$%&
!'%#"&!!()*&
!'!'+&
()%& ")$& ))"&"!*&
','-.''&
",'-.'#&
(,'-.'#&
),'-.'#&
*,'-.'#&
!,'-.'(&
!,"-.'(&
!,(-.'(&
/012345& 345& 6789:7;1& <9&
/=9>1?@&
!"#$%&'()&*+,(-.$/0#12$
A?B>=C>1&
D1;E=C@1&
Figure 6.4. Randomized RNA sequence pool has minimal affinity for nitrocellulose membranes. Radiolabeled RNA was transcribed from randomized N30 DNA library and incubated with phenobarbital-BSA, BSA alone, lysozyme, or no protein. Filtration was performed as described in Figure 6.3. The majority of radioactivity is found in the initial filtrate, indicating low binding affinity for nitrocellulose membranes.
RNA pools obtained after cycles 1, 4, 8, 12, and 16 were analyzed using the
radioactive binding assay without protein incubation to better understand the process by
which nitrocellulose-binding sequences were enriched. Results indicate a noticeable
increase in nitrocellulose binding starting in cycle 8, and affinity for nitrocellulose is
prominent by cycle 12 (Figure 6.5). Although we did perform negative selection against
the nitrocellulose membrane in cycle 1, these observations suggest that the negative
selections should be continued in subsequent cycles to prevent the enrichment of
nitrocellulose-binding sequences.

VI-10
!"#$$%
&'&(&%
)(()*%
$"&')%
)"")%
#&!+(%
$)&&% "(!*% "(++%
##&)#%
")'")%
"(($"+%
(,(%
",(%
#,(%
),(%
$,(%
*,(%
(,-.((%
#,-.($%
$,-.($%
',-.($%
!,-.($%
",-.(*%
",-.(*%
/)(% 01234%"% 01234%$% 01234%!% 01234%"#% 01234%"'%
!"#$%&'"()*+,%&,"-.&/*0&123*,4-.&20-
567-.&/*0&123*,4-897!:-
56378974%0:;%
;4<=89>4%0:;%
;4<=89>4?56378974%@9AB%
Figure 6.5. Nitrocellulose membrane-binding RNA sequences are enriched through selection cycles. Radiolabeled RNA was transcribed from either the randomized N30 DNA library or cDNA obtained after various selection cycles. The RNA was filtered through nitrocellulose membranes without prior incubation with protein targets, and radioactivity was measured as described in Figure 6.3. The black curve indicates the ratio of radioactivity on the membrane to radioactivity in the filtrate. Results reveal a significant increase in membrane-binding affinity in later selection cycles.
The enrichment of membrane-binding RNA sequences suggests a more detailed
investigation on the performance characteristics of nitrocellulose membranes may be
beneficial to subsequent endeavors in membrane-based SELEX. We first examined non-
specific binding interactions between RNA and nitrocellulose membranes to determine
the wash volume needed for complete removal of RNA from the membranes in the
absence of protein components. A radioactive preparation of the N30 RNA library was
filtered through a nitrocellulose membrane without prior protein binding, and the
membrane was washed by filtering through five 1-ml aliquots of selection buffer.
Radioactivity in the initial filtrate, each wash fraction, and the washed membrane was
measured by scintillation counting. Results indicate that approximately 85% of all RNA
passed through the membrane upon initial filtration, and the first 1-ml wash was
sufficient to remove almost all residual RNA (Figure 6.6). Filtrates from subsequent wash
steps and the washed membrane yielded minimal or undetectable levels of radioactivity,
suggesting that RNA has low non-specific binding affinity for nitrocellulose membranes.

VI-11
!"#$#%
&"!#%
'% '% '% '% !%'(%
&'(%
$'(%
)'(%
#'(%
!''(%
'%
&'''%
$'''%
)'''%
#'''%
!''''%
!&'''%
!$'''%
!)'''%
*+,-./%0
,/12.13%
!41%5.46
%
&+7%5.46
%
"27%5.46
%
$16%5.46
%
816%5.46
%
93:;2.
+3%
!"#$%&'(#)(*(&+(,&-#.(/#01&#$%21-3(
456(/#01&#$%21-3(7869:(
Figure 6.6. Removal of non-specifically bound RNA molecules from nitrocellulose membranes can be achieved with small wash volumes. Radiolabeled RNA was transcribed from randomized N30 DNA library and filtered through nitrocellulose membranes without prior binding incubation with protein targets. The membrane was washed with five 1-ml aliquots of selection buffer, and radioactivity in the initial filtrate, each 1-ml wash fraction, and the washed membrane was quantified by scintillation counting. The black curve indicates the percent of total measured radioactivity in each fraction.
We next examined the efficiency of nitrocellulose membranes in separating free
and protein-bound RNA sequences by performing radioactive binding assays on known
RNA aptamers incubated with either their cognate protein targets or with a mismatched
protein (BSA). The lysozyme RNA aptamer, which has a KD of 31 nM13, was incubated
with 300 nM of either lysozyme or BSA. The NF-κB RNA aptamer, which has a KD of
5.4 nM14, was incubated with 24 nM of either NF-κB or BSA. The binding solution was
filtered through a nitrocellulose membrane, follow by washing with three 1-ml aliquots of
selection buffer. Radioactivity in the initial filtrate, each wash fraction, and the washed
membrane was measured by scintillation counting. The majority of RNA was found in
the initial filtrate and never retained by the membrane, possibly due to a molar excess of
RNA relative to protein targets (Figure 6.7). Incubating RNA aptamers with their cognate
proteins did result in greater initial RNA retention on the nitrocellulose membrane
compared to incubation with a mismatched protein, indicating protein-specific binding
activity by the aptamers. However, the retained RNA was rapidly lost during the

VI-12
subsequent wash steps, suggesting that the ligand-specific binding interaction is easily
disrupted by buffer filtration.
!"#
$!"#
%!"#
&!"#
'!"#
(!!"#
)*+,-*./0
)*+,-*./#
)*+,-*./0123# 45671045671# 456710123#
!"#$%&'(#)(*(&+(,&-#.(/#01&#$%21-3(
45-#67"89"&-71'(9#1")(
89:#;<+=#
$>:#;<+=#
(+?#;<+=#
@>AB<C#5AC?9<?/#
Figure 6.7. Nitrocellulose membranes show weak retention of RNA aptamers bound to their specific protein ligands. RNA aptamer sequences were incubated with either their cognate protein or a mismatched target (BSA) and filtered through nitrocellulose membranes. Incubation with cognate proteins results in greater RNA retention on the membrane in the initial filtration, but the retained RNA is easily removed by subsequent wash steps.
The observation that even pure RNA aptamer sequences with high affinities for
their target proteins cannot withstand relatively gentle wash conditions suggests that the
conventional membrane-based SELEX protocol—in which membranes are loaded with
RNA, washed extensively with buffer, and eluted by soaking in solutions such as phenol-
chloroform or urea—may not be the most efficient method for recovering and enriching
protein-bound RNA sequences. Specifically, protein-bound RNA sequences initially
retained on the membrane are likely to be lost during washing, while only strongly
nitrocellulose-binding sequences are able to withstand the wash steps and be recovered in
the elution step. In light of these observations, we modified the membrane-based
selection procedure to incorporate an alternative elution strategy that is similar in
principal to affinity elution in column chromatography.

VI-13
RNA Recovery by Affinity Elution Prevents Enrichment of Nitrocellulose-Binding
Sequences. In a second attempt to select for phenobarbital-binding RNA aptamers, we
modified the nitrocellulose membrane-based SELEX procedure to perform ligand-
specific elution by filtering concentrated phenobarbital solutions through the RNA-
loaded membrane (Figure 6.8). Unlike the previous RNA recovery method, in which
washed nitrocellulose membranes were soaked in phenol-chloroform to remove
membrane-bound RNA molecules, the modified protocol is expected to release
phenobarbital-specific RNA sequences from the membrane through competitive binding
between free phenobarbital and phenobarbital-BSA molecules. RNA sequences released
from the protein can flow through the membrane and be collected in the eluate fraction.
VI-14
!"#$%!&$'()*+*,$ !"#$-!&$'()*+*,$
./01$2$/#/3$45(678$986785:8;$
!"#$!%&'#
%&(")*&!+,'"#
$$$$$$<9&$$
!"#$%&%'()$*+,-.$
-./0!"#!"*12(,'"#
(%#3456#
/"012%(''3'2)($
4(5617#($
$(*110#78%&(,'"#
*'889*%#78%&(%9#
=>85?)+*)(@+AB<9&$
3./:;#0!"#!"*12(,'"#
(%#3456#
/"012%(''3'2)($
4(5617#($
$(*110#78%&(,'"#
<()=#<!%=#21>9&#
?!)*(&?#78%&(%9#
+&9*!+!%(%9#@AB#
C&'0#981(%9#
CA7@8D$-!&$
&9$9&)9#
%&(")*&!+,'"#
%!&$
!"#$!%&'#
%&(")*&!+,'"#
-!&$E5F7@$@?$!82@$
98A8:G?5$H,:A8$
=>85?)+*)(@+A$
-./0!"#!"*12(,'"#(%#
&''0#%90+9&(%1&9#
/"012%(''3'2)($
4(5617#($
$(*110#78%&(,'"#
<()=#<!%=#+=9"'2(&2!%(8#
*'889*%#981(%9#
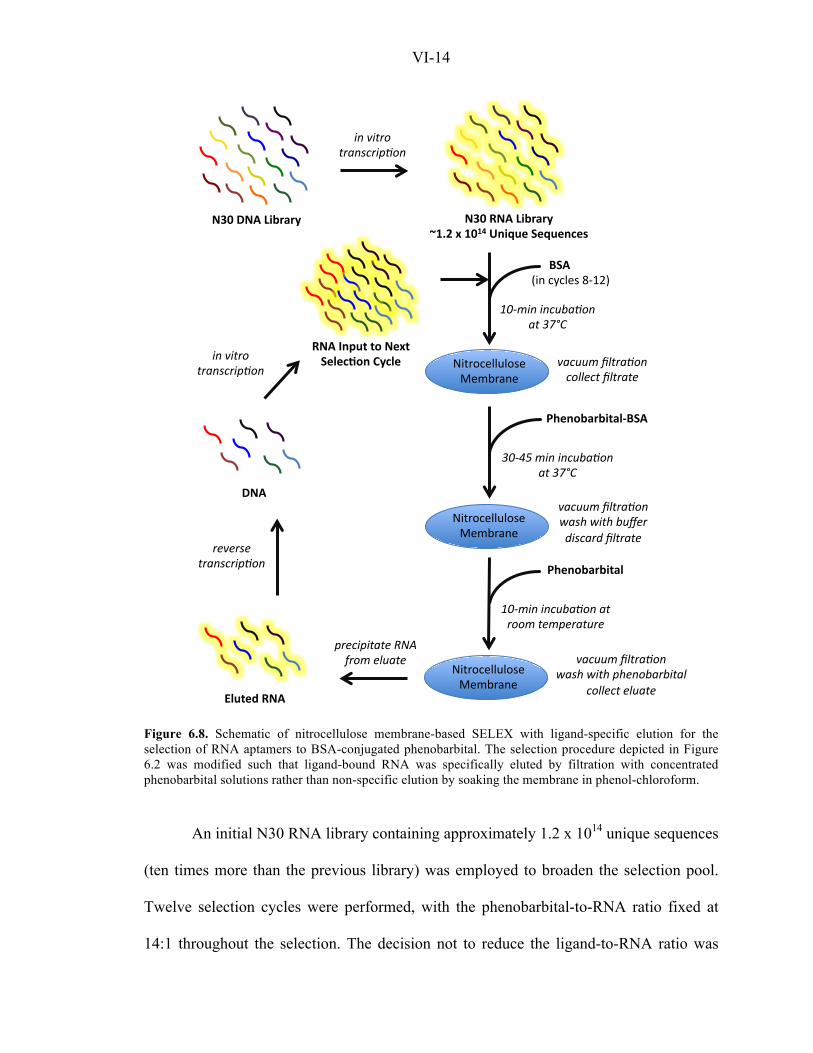
Figure 6.8. Schematic of nitrocellulose membrane-based SELEX with ligand-specific elution for the selection of RNA aptamers to BSA-conjugated phenobarbital. The selection procedure depicted in Figure 6.2 was modified such that ligand-bound RNA was specifically eluted by filtration with concentrated phenobarbital solutions rather than non-specific elution by soaking the membrane in phenol-chloroform.
An initial N30 RNA library containing approximately 1.2 x 10¹⁴ unique sequences
(ten times more than the previous library) was employed to broaden the selection pool.
Twelve selection cycles were performed, with the phenobarbital-to-RNA ratio fixed at
14:1 throughout the selection. The decision not to reduce the ligand-to-RNA ratio was

VI-15
informed by the observation that even high-affinity RNA aptamer sequences incubated
with their cognate proteins are easily lost during the filtration process (Figure 6.7),
suggesting that a low ligand-to-RNA ratio may impose an unproductively stringent
selection condition. The wash volume was maintained at 1 ml for cycles 1 through 9 and
increased to 2 ml for cycles 10 through 12. Negative selection against BSA was
performed before positive selection with phenobarbital-BSA in cycles 8 through 12.
RNA pools obtained after cycles 6 and 12 of the selection were examined for
ligand-binding specificity, and the N30 RNA library was included as a control. 32P-
labeled RNA sequences were incubated with phenobarbital-BSA, BSA, or no protein, and
the binding mixture was filtered through nitrocellulose membranes as in regular selection
cycles. The initial RNA flow-through was collected, and the membrane was washed with
1.2 ml of selection buffer followed by elution with 200 µl of 1 mM phenobarbital and
800 µl of 5 mM phenobarbital. Radioactivity in the initial filtrate, wash fraction,
combined eluate fraction, and the washed membrane was quantified by scintillation
counting. In all three RNA pools tested, the presence and identity of protein have
minimal impact on the binding and elution behavior of the RNA (Figure 6.9). Compared
to the N30 library, RNA pools from cycles 6 and 12 show significantly more RNA
retention by the membrane upon initial filtration, but the great majority of retained RNA
is removed by the wash step. The small percentage of RNA found on the final washed
membrane indicates that the modified protocol succeeded in preventing the enrichment of
nitrocellulose-binding sequences. However, the minimal amount of RNA found in the
eluate fraction also indicates that the RNA pool has not been sufficiently enriched for
phenobarbital-binding species.

VI-16
!"#$
%"#$
&#$ &#$
!'#$
%(#$
&#$ &#$
!)#$
%%#$
&#$ &#$&#$
*&#$
+&#$
,&#$
!&#$
%&&#$
-./012$3/245146$ 7189$ :2;146$ <6=>51.6$
!"#$%&'(#)(*(&+(,&-#.(/#01&#$%21-3(
?96@ABC$
ABC$
DE$?5E46/.$
!"#$
"%#$
%#$ "#$
!&#$
%'#$
"#$ &#$
&&#$
""#$
(#$)#$
*#$
%*#$
(*#$
!*#$
)*#$
+**#$
,-./01$2.134035$ 6078$ 91:035$ ;5<=40-5$
!"#$%&'(#)(*(&+(,&-#.(/#01&#$%21-3(
>85?@AB$
@AB$
CD$>4D35.-$
!!"#
$%"#
&"# &"#
!!"#
&'"#
&"# ("#
)'"#
$&"#
$"#!"#
%"#
&%"#
(%"#
!%"#
'%"#
*%%"#
+,-./0#1-023/24# 5/67# 809/24# :4;<3/,4#
!"#$%&'(#)(*(&+(,&-#.(/#01&#$%21-3(
=74>?@A#
?@A#
BC#=3C24-,#
!
"
#
Figure 6.9. RNA sequence pools obtained after multiple selection cycles show no specific binding for phenobarbital-BSA (phe-BSA) or BSA alone. (A) The N30 DNA library and cDNA obtained after (B) six and (C) twelve selection cycles served as templates for the transcription of radiolabeled RNAs, which were incubated with phenobarbital-BSA, BSA alone, or no protein. Filtration was performed as described in Figure 6.3, with an added step of elution with phenobarbital after the wash step with selection buffer. Radioactivity in each fraction was analyzed by scintillation counting. Radioactivity found in each fraction is reported as the percent of total measured radioactivity. Sequence pools obtained after cycles 6 and 12 show increased retention by the membrane upon initial filtration, but the RNA-nitrocellulose binding interaction is sufficiently weak for the majority of retained RNA to be removed by the wash step. No increase in RNA retention is seen with either phenobarbital-BSA or BSA alone.

VI-17
We sequenced the cycle 12 pool to better understand the extent of sequence
enrichment at the end of the selection process. Surprisingly, only six unique and highly
related sequences were found, with two-thirds (20 of 29) of the sequences being identical
(Cycle 12 Sequence, Figure 6.10) We then sequenced pools from the initial N30 library
and cycles 1, 4, 7, and 8 (the first cycle after negative selection began). Results from the
N30 library confirm that the initial pool is diverse, with no repeats or detectable motifs
found among 14 sequenced samples. However, the dominant sequence found in cycle 12
(SVC12.6) is already present in the cycle 1 pool. The cycle 4 pool is dominated by two
sequences, including SVC12.6, and this sequence accounts for the great majority of
sequences found in cycles 7 and 8.

VI-18
ID N30 Library Sequence Frequency
N30.1 AGCTAGCCAGGAGCGCAGCGCGCAACACGGAGAGGTTGATCGAGGCAAAGCTTCCG 1 of 14
N30.2 AGCTAGCCAGGCAGTGTGATACGCACTGAGTTCCGATGGGGGAGGCAAAGCTTCCG 1 of 14
N30.6 AGCTAGCCAGGATCTTAGGTTTACCCCTGGAGGTAGTATGGGAGGCAAAGCTTCCG 1 of 14
N30.10 AGCTAGCCAGGTGGGATACGGCCCATGAAGGCGGGCGGGATGAGGCAAAGCTTCCG 1 of 14
N30.11 AGCTAGCCAGGATCCTAGATTAGCGCAGGTAGCGTTAGTGGGAGGCAAAGCTTCCG 1 of 14
N30.13 AGCTAGCCAGGGGAGCAAAAGAGTCCCGGACTAATACAGGGGAGGCAAAGCTTCCG 1 of 14
N30.14 AGCTAGCCAGGTGTGCCGTCAGGAAAAGTGAATCACCTGTGGAGGCAAAGCTTCCG 1 of 14
N30.20 AGCTAGCCAGGGGTGGATCGTGGAATGTATCCGCACGACGGGAGGCAAAGCTTCCG 1 of 14
N30.31 AGCTAGCCAGGAAAACACCAAAAGGTGGCCAGCATCTACAGGAGGCAAAGCTTCCG 1 of 14
N30.32 AGCTAGCCAGGAGGCCGAAAGCGGAAGAAAACAAGTAGGATGAGGCAAAGCTTCCG 1 of 14
N30.33 AGCTAGCCAGGCAAACCGGTTACGTATCGTCTACGTACGGGGAGGCAAAGCTTCCG 1 of 14
N30.191 AGCTAGCCAGGAACAGGCTGCGAAGGGGTATATGATTTAGAGAGGCAAAGCTTCCG 1 of 14
N30.192 AGCTAGCCAGGATAGTTCGGGTTGTATGGTTAAGTGCTTGGGAGGCAAAGCTTCCG 1 of 14
N30.193 AGCTAGCCAGGAACAGAAGATCGAGGATCGATGAATCATG-GAGGCAAAGCTTCCG 1 of 14
ID Cycle 1 Sequence Frequency
SVC1.28 AGCTAGCCAGGCTGGGCGTCATCAGGAGTGTCGGGTCGGTGGAGGCAAAGCTTCCG 1 of 13
SVC1.30 AGCTAGCCAGGAATGGGGGACCCCAGATTAGTACCTGTGGGGAGGCAAAGCTTCCG 1 of 13
SVC1.34 AGCTAGCCAGGCATATCGGGGATCAAAGAATCGGTGGAGGGGAGGCAAAGCTTCCG 1 of 13
SVC1.36 AGCTAGCCAGGGCATTACCGAGCTACACTCAACGCCTCTGGGAGGCAAAGCTTCCG 1 of 13
SVC1.38 AGCTAGCCAGGAGTAAGTGGGAGGAGAACGTAGGGGTCTGGGAGGCAAAGCTTCCG 1 of 13
SVC1.40 AGCTAGCCAGGAAAGTGAGGAGGTGGTGAAGTACTGGTGTAGAGGCAAAGCTTCCG 1 of 13
SVC1.42 AGCTAGCCAGGCGCAAGCAGGAGGGATAACAGTACGGCGGGGAGGCAAAGCTTCCG 1 of 13
SVC1.44 AGCTAGCCAGGGCTTCGGATCGAATCTAATGCTTGATTGATGAGGCAAAGCTTCCG 1 of 13
SVC1.46 AGCTAGCCAGGAAAGTGAGGAGGTGGTGAGGTACTGGTGTAGAGGCAAAGCTTCCG 1 of 13
SVC1.50 AGCTAGCCAGGAGGAATCATACGATGTATTCGTAAGGCATGGAGGCAAAGCTTCCG 1 of 13
SVC1.321 AGCTAGCCAGGTGGCGAACAGGAGAACTGAGCGGTGAGGGTGAGGCAAAGCTTCCG 1 of 13
SVC1.322 AGCTAGCCAGGCTGAAGATGCAAGTAGGTAGGCTATGTGTTGAGGCAAAGCTTCCG 1 of 13
SVC1.323 AGCTAGCCAGGGAAGCCGGGGTGGGCAAACCAGGTGCGTGG-AGGCAAAGCTTCCG 1 OF 13
ID Cycle 4 Sequence Frequency
SVC4.8 AGCTAGCCAGGAAAGTGAGGAGGTGGTGAAGTACTGGTGTAGAGGCAAAGCTTCCG 8 of 19
SVC4.11 AGCTAGCCAGGGAACGTGACAGGAAAACTGCGTCTCGGCTGGAGGCAAAGCTTCCG 1 of 19
SVC4.16 AGCTAGCCAGGGTTGAAGGTGGAGGAGGAGTAATCTTGGTAGAGGCAAAGCTTCCG 8 of 19
SVC4.28 AGCTAGCCAGGCAATGTATTGACCTGGTATACGGGGTGGG-GAGGCAAAGCTTCCG 1 of 19
SVC4.242 AGCTAGCCAGGGTTGAAAGTGGACGAGGATTGTTGCGGGTAGAGGCAAAGCTTCCG 1 of 19
ID Cycle 7 Sequence Frequency
SVC7.27 AGCTAGCCAGGAAAGTGAGGAGGTGGTGAAGTACTGGTGTAGAGGCAAAGCTTCCG 10 of 13
SVC7.40 AGCTAGCCAGGAGAATCGTGGACTTGAGATCGTGCGCGTGGGAGGCAAAGCTTCCG 1 of 13
SVC7.45 AGCTAGCCAGGGTTGAAGGTGGAGGAGGAGTAATCTTGGTAGAGGCAAAGCTTCCG 1 of 13
SVC7.46 AGCTAGCCAGGGGCAAAAGCAATTCTTGTGTTGTTGCTGTTGAGGCAAAGCTTCCG 1 of 13
ID Cycle 8 Sequence Frequency
SVC8.2 AGCTAGCCAGGAAAGTGAGGAGGTGGTGAAGTACTGGTGTAGAGGCAAAGCTTCCG 13 of 14
SVC8.16 AGCTAGCCAGGAAAGTGAGGAGGAGGTGAAGTACTGGTGTAGAGGCAAAGCTTCCG 1 of 14
ID Cycle 12 Sequence Frequency
SVC12.6 AGCTAGCCAGGAAAGTGAGGAGGTGGTGAAGTACTGGTGTAGAGGCAAAGCTTCCG 20 of 29
SVC12.53 AGCTAGCCAGGAAAGTGAGGAGGAGGTGAAGTACTGGTGTAGAGGCAAAGCTTCCG 2 of 29
SVC12.60 AGCTAGCCAGGGCTTCGAGGGAGGAGGAGGAGTGAAGTGTTGAGGCAAAGCTTCCG 4 of 29
SVC12.70 AGCTAGCCAGGGTTGAAGGTGGAGGAGGAGTAATCTTGGTAGAGGCAAAGCTTCCG 1 of 29
SVC12.402 AGCTAGCCAGGAAAGTGAGCAGGCGCTGAAGTACTCGTGTAGAGGCAAAGCTTCCG 1 of 29
SVC12.482 AGCTAGCCAGGATTGAAGGTGGAGGAGGAGTAATCTTGGTAGAGGCAAAGCTTCCG 1 of 29
Figure 6.10. Sequences obtained after various selection cycles show a rapid decrease in sequence diversity and the early appearance of a dominant sequence. Italicized nucleotides constitute the constant regions. Bolded sequences of the same color are identical, except where blue highlights mark point mutations that distinguish the two red-colored sequences in cycles 1 and 8. Green and yellow highlights mark sequence motifs among sequences found in the cycle 12 pool.

VI-19
These results indicate that the selection conditions rapidly eliminated sequence
diversity from the RNA library. The sequence pool was nearly homogenous by the time
negative selection against BSA commenced in cycle 8, likely rendering subsequent cycles
ineffectual. However, it is curious that the SVC12.6 sequence accounts for 77% (10 of
13) of the sequenced cycle 7 pool and 93% (13 of 14) of the cycle 8 pool but only 69%
(20 of 29) of the cycle 12 pool, suggesting a resurgence of less prevalent sequences
during the later cycles. The six unique sequences found in the cycle 12 pool are all highly
enriched in G and show conserved motifs. The AGG motif (alone or in repeats) was
found in all sequences at similar positions, and the AAGT sequence was found in all but
two (Figure 6.10). The 5’ and 3’ ends of all six sequences also show convergence upon
similar bases. A purine occupies the first nucleotide after the 5’ constant region in all six
sequences, and KKGTA (K = G or T) is found immediately before the 3’ constant region
in all but one sequence (which has KKGTT). Such sequence similarities are typical of
enriched aptamer pools, yet no ligand-binding activity was detected in radioactive
binding assays performed on the final sequence pool (Figure 6.9C), suggesting that the
binding characterization method may not be ideal. As an alternative method, capillary
electrophoresis (CE) was employed for binding affinity evaluation.
Capillary Electrophoresis (CE) Assay Shows No Ligand-Binding Activity by
Putative Phenobarbital Aptamers. CE is an automated process that separates mixture
components based on differences in electrophoretic mobility, which is dependent on the
size-to-charge (approximated by the mass-to-charge, or m/z) ratios of the various species
within a mixture15. A capillary, which is typically made of fused silica and carries

VI-20
negative charges on its surface, connects an inlet anode and an outlet cathode. As a run
buffer containing background electrolytes passes through the capillary, an
electroendoosmotic flow (EOF) toward the cathode is transmitted throughout the
diameter of the capillary, creating a nearly perfect plug flow down the length of the tube.
When a sample mixture is injected into the capillary, components are simultaneously
separated by charge due to the EOF and by size due to frictional drag in accordance with
Stoke’s Law.
Since RNA molecules are highly negatively charged, a mixture of free protein,
free RNA, and protein-RNA complexes can be separated by CE based on differences in
their m/z ratios. Free protein molecules are eluted first, followed by protein-RNA
complexes and finally the free RNA molecules. For the purpose of characterizing ligand-
binding behavior of putative phenobarbital aptamers, RNA molecules were transcribed
from single-sequence DNA templates and incubated with an equimolar amount of
phenobarbital-BSA (5.24 µM each). The three most prevalent sequences from cycle 12
(SVC12.6, SVC12.60, and SVC12.70) were examined. The resulting elution profiles
show clear peaks corresponding to free phenobarbital-BSA and free RNA but no
detectable protein-RNA complex peak (Figure 6.11), indicating a lack of phenobarbital-
and BSA-binding activities by the RNA sequences. Together with the radioactive binding
assay results, these observations suggest that the selection process failed to enrich for
phenobarbital-binding sequences, and alternative aptamer selection protocols or
molecular targets need to be identified.

VI-21
!"!!#
!"!$#
!"!%#
!"!&#
!"!'#
!"!(#
!"!)#
!"#$%"&'()*+',-*
!##########%##########'##########)###########*#########$!########$%########$'########$)########$*########%!#
./01$'*2,3)*43,'5*
+,-./,0#
12.345,#
+,-./,0#
678#
!"!!#
!"!%#
!"!'#
!"!)#
!"!*#
!"#$%"&'()*+',-*
!##########%##########'##########)###########*#########$!########$%########$'########$)########$*########%!#
./01$'*2,3)*43,'5*
+,-./,0#
12.345,#
+,-./,0#
678#
!"!!#
!"!$#
!"!%#
!"!&#
!"!'#
!"!(#
!"!)#
!"!9#
!"#$%"&'()*+',-*
!##########%##########'##########)###########*#########$!########$%########$'########$)########$*########%!#
./01$'*2,3)*43,'5*
+,-./,0#
12.345,#
+,-./,0#
678#
8
:
;
Figure 6.11. Capillary electrophoresis shows no evidence of ligand binding by putative phenobarbital aptamer sequences. Selection buffer alone (green), phenobarbital-BSA alone (black), RNA alone (blue), and a binding solution containing both RNA and phenobarbital-BSA (pink) were analyzed by CE. The RNA sequences (A) SVC12.6, (B) SVC12.60, and (C) SVC12.70 were characterized, with none showing specific binding to the phenobarbital-BSA molecule.

VI-22
Column-Based SELEX for Vitamin B12 Fails to Enrich for Ligand-Binding RNA
Sequences. Unlike nitrocellulose membrane–based separation, column chromatography
allows for the selection of aptamers to small molecules without protein conjugation.
However, phenobarbital does not possess appropriate functional groups for resin-
conjugation chemistry and thus cannot be immobilized onto columns for nucleic acid
separation. As a result, alternative small-molecule ligands were evaluated as SELEX
candidates. Vitamin B12 (cyanocobalamin) and folinic acid are two small molecules
commonly used as a nutritional supplement and an adjuvant in cancer chemotherapy16,
respectively (Figure 6.12). We have also demonstrated that these molecules have low or
no toxicity toward mouse T cells (Appendix 1) and human natural killer cells (Appendix
2), and would be suitable input molecules for ligand-responsive RNA-based regulatory
systems. Importantly, both vitamin B12 and folinic acid can be conjugated to agarose
resin molecules through standard chemistry, thus enabling the use of column-based
SELEX.
! "
Figure 6.12. Chemical structures of (A) vitamin B12 (cyanocobalamin) and (B) folinic acid. Vitamin B12 can be conjugated to Sepharose 6B resin through its hydroxyl group. Folinic acid can be conjugated to EAH Sepharose 4B resin through its carboxyl groups.

VI-23
An RNA aptamer for vitamin B12 had previously been isolated by column-based
SELEX17. However, the binding activity of this aptamer is dependent on the presence of
high concentrations of Li+, making it unsuitable for in vivo applications. Furthermore,
this aptamer has a complex tertiary structure, including pseudoknots required for ligand
binding18. Such structural complexities render the incorporation of this aptamer into
RNA-based regulatory devices difficult, if not impossible. Nevertheless, the previous
example of vitamin B12 aptamer selection indicates that it is possible to isolate vitamin
B12–binding RNA sequences by column-based SELEX, and that the ion dependence of
the isolated sequences is partially dictated by the composition of the selection buffer17.
To generate a vitamin B12–specific RNA aptamer capable of in vivo functionality, we
performed a modified SELEX protocol in which the selection buffer contained a more
physiological ion concentration (250 mM NaCl and 2.5 mM MgCl2 in contrast to 1 M
LiCl and 5 mM MgCl2 in the published selection process). Furthermore, the randomized
RNA library was designed to contain 5’ and 3’ constant regions that formed a stem at the
base of all sequences to facilitate future integration into RNA-based regulatory devices
(Figure 6.13).
!
"
#
$
#
#
#
$
#
"
!
!
"
"
#
$
"%
#
$#
##
#
#"%"%
&'()*%
$
$$
Figure 6.13. The randomized RNA library contains constant regions that form a stable basal stem. The 5’ and 3’ constant regions flanking the N30 sequence form a stable hairpin through Watson-Crick base pairing to ensure that aptamer sequences obtained from the selection process have structures appropriate for integration into RNA-based regulatory devices.

VI-24
An initial RNA library containing approximately 2.4 x 10¹⁴ unique sequences was
subjected to 15 cycles of selection (Figure 6.14). In each cycle, a column packed with
commercially available vitamin B12–conjugated agarose (same as used in Ref. 17) was
equilibrated with selection buffer, loaded with RNA, washed with selection buffer, and
eluted with 5 mM vitamin B12. Eluted RNA was precipitated and reverse transcribed to
produce DNA templates for the next selection cycle. Negative selection against an adipic
acid dihydrazide agarose column was performed immediately before positive selection
for vitamin B12 in cycles 1 through 3 to eliminate agarose-binding sequences. The wash
volume was increased from 5 column volumes (CV) in cycle 1 to 10 CV in cycle 4. The
volume was subsequently increased in 10-CV intervals from cycle 5 to cycle 10, then in
20-CV intervals from cycle 10 to cycle 15. Mutagenic PCR was performed after cycle 10
to diversify the selection pool.

VI-25
!"#$%!&$'()*+*,$ !"#$-!&$'()*+*,$
./01$2$3#31$45(678$986785:8;$
!"#$!%&'#
%&(")*&!+,'"#
"-.(,$-#)-/-*,'"#
(.(!")%#(.(&')-#
0*1*/-)#2345#
+&-*!+!%(%-#678#
9&':#-/;(%-#
<=7>8?$-!&$
&-$-&)-#
%&(")*&!+,'"#
%!&$
-!&$@5A7>$>B$!82>$
98=8:CB5$D,:=8$
/'(<#;"=';"<#
9&(*,'"#'"%'#
$!%(:!"#>2?#*'/;:"#
@()A#@!%A#)-/-*,'"#=;B-&#
-/;%-#@!%A#C#:D#$!%(:!"#>2?#
!"#$!%&'#
%&(")*&!+,'"#
Figure 6.14. Schematic of column-based SELEX used to select for RNA aptamers to vitamin B12. An RNA sequence library was generated by in vitro transcription and filtered through a vitamin B12–conjugated agarose column. The column was washed with selection buffer, and specifically bound RNA was eluted with concentrated vitamin B12 solution. Eluted RNA was reverse transcribed into cDNA, which served as the transcription template for the next cycle’s RNA pool. In cycles 1-3, an additional negative selection step against agarose resin was inserted before the positive selection step with vitamin B12–conjugated agarose.
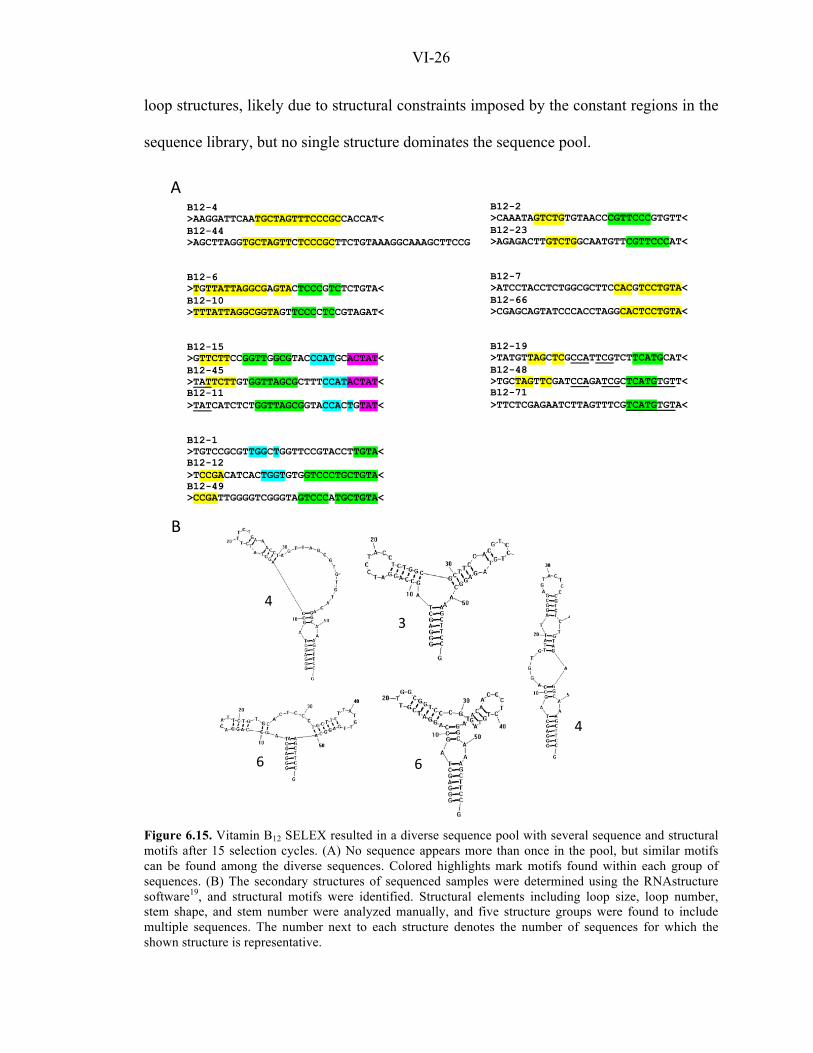
The RNA pool obtained after 15 selection cycles was sequenced, and no repeat
was observed among 43 sequenced samples. Analyses were performed to investigate
potential sequence and structural relationships among the sequences, and a number of
conserved motifs were manually identified (Figure 6.15). Several sequences form stem-
VI-26
loop structures, likely due to structural constraints imposed by the constant regions in the
sequence library, but no single structure dominates the sequence pool.
B12-4
>AAGGATTCAATGCTAGTTTCCCGCCACCAT<
B12-44
>AGCTTAGGTGCTAGTTCTCCCGCTTCTGTAAAGGCAAAGCTTCCG
B12-6
>TGTTATTAGGCGAGTACTCCCGTCTCTGTA<
B12-10
>TTTATTAGGCGGTAGTTCCCCTCCGTAGAT<
B12-15
>GTTCTTCCGGTTGGCGTACCCATGCACTAT<
B12-45
>TATTCTTGTGGTTAGCGCTTTCCATACTAT<
B12-11
>TATCATCTCTGGTTAGCGGTACCACTGTAT<
B12-1
>TGTCCGCGTTGGCTGGTTCCGTACCTTGTA<
B12-12
>TCCGACATCACTGGTGTGGTCCCTGCTGTA<
B12-49
>CCGATTGGGGTCGGGTAGTCCCATGCTGTA<
B12-2
>CAAATAGTCTGTGTAACCCGTTCCCGTGTT<
B12-23
>AGAGACTTGTCTGGCAATGTTCGTTCCCAT<
B12-7
>ATCCTACCTCTGGCGCTTCCACGTCCTGTA<
B12-66
>CGAGCAGTATCCCACCTAGGCACTCCTGTA<
B12-19
>TATGTTAGCTCGCCATTCGTCTTCATGCAT<
B12-48
>TGCTAGTTCGATCCAGATCGCTCATGTGTT<
B12-71
>TTCTCGAGAATCTTAGTTTCGTCATGTGTA<
!
"
#$$$
%$$$
&$$$ &$$$
#$$$
Figure 6.15. Vitamin B12 SELEX resulted in a diverse sequence pool with several sequence and structural motifs after 15 selection cycles. (A) No sequence appears more than once in the pool, but similar motifs can be found among the diverse sequences. Colored highlights mark motifs found within each group of sequences. (B) The secondary structures of sequenced samples were determined using the RNAstructure software19, and structural motifs were identified. Structural elements including loop size, loop number, stem shape, and stem number were analyzed manually, and five structure groups were found to include multiple sequences. The number next to each structure denotes the number of sequences for which the shown structure is representative.
VI-27
Several groups of similar sequences were identified (Figure 6.15A), and one
sequence from each of three such groups was chosen for evaluation by radioactive
binding assays. Radiolabeled RNA was loaded onto a vitamin B12–conjugated agarose
column, washed with three 500-µl aliquots of selection buffer, and eluted with six 500-µl
aliquots of 5 mM vitamin B12. Radioactive quantification of wash and eluate fractions
shows weak specific elution by vitamin B12 (Figure 6.16A). More importantly, the
overwhelming majority (>97%) of RNA remains bound to the column, indicating strong
binding affinity toward resin particles. However, the same sequences tested on adipic
acid dihydrazide agarose columns show minimal RNA retention on the column (Figure
6.16B), suggesting that the adipic acid dihydrazide agarose may not have been
sufficiently similar to the vitamin B12–conjugated agarose to serve as an effective
negative selection target, even though dihydrazide agarose was used for this purpose in
the previously published selection for vitamin B12 aptamers17.

VI-28
!"!#$
!"%#$
&"!#$
&"%#$
'"!#$
'"%#$
(&')*$ (&')+%$ (&')+,$
!"#$%&'#()*+,-+,)#.)/)&0)1&,#()234)5'-+,)
-./0$&$
-./0$'$
-./0$1$
234.56$&$
234.56$'$
234.56$1$
234.56$+$
234.56$%$
234.56$*$
!
"
!"#
$!"#
%!"#
&!"#
'!"#
(!"#
)!"#
*!"#
+$%,)# +$%,'(# +$%,'-#
!"#$%&'#()*+,-+,)#.)/)&0)1&,#()234)5'-+,)
./01#$#
./01#%#
./01#&#
234/56#$#
234/56#%#
234/56#&#
234/56#'#
234/56#(#
234/56#)#
Figure 6.16. Putative vitamin B12 aptamer sequences show weak binding affinity for vitamin B12, strong affinity for vitamin B12–conjugated agarose, and no affinity for dihydrazide agarose. Radiolabeled, single-sequence RNAs were filtered through (A) vitamin B12–conjugated or (B) adipic acid dihydrazide agarose columns. The columns were washed with selection buffer and eluted with 5 mM vitamin B12. Each 500-µl aliquot of wash and eluate was collected and analyzed for radioactivity by scintillation counting. Values are reported as a percent of total radioactivity loaded onto each column. The B12-45 and B12-48 sequences show slight preferences for specific elution by vitamin B12 compared to selection buffer. All three sequences show strong binding affinity toward vitamin B12–conjugated agarose as indicated by the small percentage of radioactivity removed from the B12–conjugated column through wash and elution. The sequences show no affinity for dihydrazide agarose and are efficiently removed from those columns.
Eight additional sequences were evaluated by a modified radioactivity binding
assay, in which alternate cycles of wash and elution steps were applied to vitamin B12–
conjugated agarose columns loaded with RNA. This alternating sequence was designed to
rule out the possibility that any increase in RNA recovery during the elution steps was

VI-29
simply due to non-specific removal by increased liquid volumes flowing through the
column. None of the sequences evaluated by this method show specific elution by
vitamin B12, and all of them show strong binding affinity toward the column matrix
(Table 6.1).
Table 6.1. Radioactive binding assay for putative vitamin B12 aptamer sequences with vitamin B12–conjugated agarose columns
% of Total RNA Inputa Seq # 2 4 7 12 15 19 23 44
Wash 1b 0.06 0.08 0.24 0.05 0.09 0.91 0.18 0.12 Wash 2 0.20 0.22 0.67 0.22 0.22 N/A 0.39 0.34 Wash 3 0.17 0.20 1.20 0.22 0.23 1.30 0.72 0.40 Eluate 1 0.15 0.16 1.64 0.17 0.24 1.06 0.76 0.33 Eluate 2 0.14 0.14 2.07 0.15 0.26 0.80 0.87 0.32 Eluate 3 0.14 0.13 2.40 0.15 0.29 0.66 0.91 0.31 Wash 4 0.13 0.13 2.35 0.13 0.29 0.59 0.98 0.31 Wash 5 0.12 0.12 2.30 0.13 0.31 0.55 1.03 0.32 Eluate 4 0.13 0.13 2.40 0.13 0.36 0.51 1.12 0.34 Eluate 5 0.15 0.15 2.32 0.13 0.41 0.45 1.21 0.34
Total 1.38 1.47 17.58 1.48 2.70 6.83 8.16 3.13 aValue indicates the radioactivity of each wash or eluate fraction as a percentage of the total radioactivity loaded onto each column. bEach wash and eluate fraction is 500 µl in volume.
Affinity toward agarose does not negate the potential usefulness of these putative
aptamer sequences, provided they exhibit sufficient binding affinity for vitamin B12.
However, the minute amount of RNA recoverable from the vitamin B12–conjugated
agarose used in the selection process compromises the accuracy of these binding assays.
To better characterize the isolated RNA sequences, we performed radioactive binding
assays using an alternative separation medium—columns with Sepharose 6B resin
particles that were either unmodified or conjugated to vitamin B12 through its hydroxyl
group. The five unique sequences tested show varying degrees of non-specific binding to
the Sepharose 6B resin, but all to a considerably lesser extent compared to the previous
agarose resin (Table 6.2). However, the results also provide no evidence of specific

VI-30
elution by vitamin B12. These findings indicate that the SELEX procedure performed has
failed to enrich for vitamin B12–binding sequences.
Table 6.2. Radioactive binding assay for putative vitamin B12 aptamer sequences with Sepharose 6B columns
% of Total RNA Inputa RNA
Sequence # Sample Unmodified Sepharose 6B
Vitamin B12–Conjugated Sepharose 6B
Wash 77.92 66.79 5 Eluate 0.35 0.28 Wash 67.74 54.96 6 Eluate 0.20 0.20 Wash 78.04 67.09 9 Eluate 0.17 0.27 Wash 50.92 45.85 45 Eluate 0.13 0.16 Wash 69.57 66.81 48 Eluate 0.13 0.13
aValue indicates the radioactivity of each wash or eluate fraction as a percentage of the total radioactivity loaded onto each column.
Column-Based SELEX Isolates Aptamer Sequences with Binding Affinity for Both
Folinic Acid and Sepharose Matrix. We also performed column-based SELEX for
RNA aptamers to folinic acid. Folinic acid is a 5-formyl derivative of folic acid and
comprises 10%–20% of total cellular folates20. The 6S stereoisomer is biologically active
and found in natural systems. Although not present in natural physiological
environments, 6R–folinic acid is equally well tolerated in vivo, and racemic 6(R,S)–
folinic acid is commonly used in cancer treatments either as an adjuvant in methotraxate
therapy or in combination with 5-fluorouracil in the treatment of colorectal cancer and
other neoplasms20-22. Pharmacokinetics studies have shown that 6R–folinic acid does not
undergo metabolism and has a significantly longer serum half-life than 6S–folinic acid23-
25. This combination of low toxicity, biological stability, and absence in natural systems
makes 6R–folinic acid an ideal input signal for ligand-responsive regulatory systems.

VI-31
Since racemic folinic acid is the most commonly used and thus widely available
therapeutic agent, we began our aptamer selection process using the racemic mixture as
the molecular target. Subsequent efforts to isolate aptamers specific to the 6R
stereoisomer are described in a later section in this chapter.
The same selection procedure as described for vitamin B12 (Figure 6.14) was
performed using racemic folinic acid as the target molecule. Folinic acid was conjugated
through its carboxyl groups to EAH Sepharose 4B resin, and unmodified EAH Sepharose
4B resin was used for negative selection against the column matrix. The RNA pool
obtained after 15 selection cycles was sequenced. In marked contrast to vitamin B12, the
folinic acid pool yielded only three unique sequences among 30 sequenced samples
(Cycle 15 Sequence, Figure 6.17). One sequence (FA15.1) accounts for 93% (28 of 30)
of the pool, and all three sequences share similar motifs. To better understand the
sequence enrichment process, we sequenced RNA pools obtained after cycles 5, 10, and
11. Sequencing results indicate a diverse sequence pool after ten selection cycles, with no
repeat observed among ten sequenced samples (Figure 6.17). Surprisingly, the dominant
sequence makes its first appearance in cycle 11, after the mutagenic PCR step,
accounting for two of ten sequenced samples. These results suggest that mutagenic PCR
may have biased the sequence library, even though a similar effect was not observed in
the vitamin B12 sequence pool.

VI-32
ID Cycle 5 Sequence Frequency
FA5.30 GGGAGCTAGCCAGGCCTTCGGGTCTCGCCGGTCCCCTTCATCGTGAGGCAAAGCTTCCG 1 of 8
FA5.37 GGGAGCTAGCCAGGATAATGGGATGGGGGCTCCGGTCGCTTGTTGAGGCAAAGCTTCCG 1 of 8
FA5.39 GGGAGCTAGCCAGGTCCACAAGGCTGTTTCCACTCTCGCGTGATGAGGCAAAGCTTCCG 1 of 8
FA5.40 GGGAGCTAGCCAGGTGTACTGGCGTGGCTCGGCGGTTCTCGTGATGAGGCAAAGCTTCC
G 1 of 8
FA5.41 GGGAGCTAGCCAGGCGCCATAACCCAGCACCTCGGCTTACCCCTGAGGCAAAGCTTCCG 1 of 8
FA5.42 GGGAGCTAGCCAGGGTCTTGTTTAAGGACTTTCGGCTAGTTGTTGAGGCAAAGCTTCCG 1 of 8
FA5.43 GGGAGCTAGCCAGGCGAGATGCTTGCGCAGGCAACCACTTTGATGAGGCAAAGCTTCCG 1 of 8
FA5.44 GGGAGCTAGCCAGGTTGAGCTGGCTAAACGATTGTGTAGGTGGTGAGGCAAAGCTTCCG 1 of 8
ID Cycle 10 Sequence Frequency
FA10.3 GGGAGCTAGCCAGGTTCCCTGACAGTTGCTTATAGTTCATTCTAGAGGCAAAGCTTCCG 1 of 10
FA10.5 GGGAGCTAGCCAGGCTCTCTGGTGCTTCCTTACTTGATTGTGATGAGGCAAAGCTTCCG 1 of 10
FA10.6 GGGAGCTAGC----------------TTGCATTAGAACTCGGTAGAGGCAAAGCTTCCG 1 of 10
FA10.7 GGGAGCTAGCCAGGATGATGCTTGGGGAGCTCTGTCTCTGCTGTGAGGCAAAGCTTCCG 1 of 10
FA10.9 GGGAGCTAGCCAGGCTTCCTTAGTGCTTCGTGGATTTATGTGATGAGGCAAAGCTTCCG 1 of 10
FA10.10 GGGAGCTAGCCAGGGTCTCTAGATTCTGTTACAGCGTTTATGTAGAGGCAAAGCTTCCG 1 of 10
FA10.11 GGGAGCTAGCCAGGTTGATACTCTAGCTCTTTAGTTGTCTTGATGAGGCAAAGCTTCCG 1 of 10
FA10.12 GGGAGCTAGCCAGGTTACTAGTTAGCTCTGCGCTGAGATGTTATGAGGCAAAGCTTCCG 1 of 10
FA10.13 GGGAGCTAGCCAGGTATTTAAGGGCTCCTTGTGTTCGTACATATGAGGCAAAGCTTCCG 1 of 10
FA10.14 GGGAGCTAGCCAGGATCTGGTCTTGGTGTTGCTCCACCTCGTGTGAGGCAAAGCTTCCG 1 of 10
ID Cycle 11 Sequence Frequency
FA11.3 GGGAGCTAGCCAGGAATGGTAGCTCGACTTCATGCTTCAGTGATGAGGCAAAGCTTCCG 2 of 10
FA11.4 GGGAGCTAGCCAGGTGTTTCAGGCTAGATTCTTAACTCGTGCATGAGGCAAAGCTTCCG 1 of 10
FA11.6 GGGAGCTAGCCAGGGCTCCGTCCTTTCCATTCTATTTTCGTGTAGAGGCAAAGCTTCCG 1 of 10
FA11.7 GGGAGCTAGCCAGGTTCCCGCTTCCACTCAGTCGATGTTGTGATGAGGCAAAGCTTCCG 1 of 10
FA11.8 GGGAGCTAGCCAGGTTGGTGCAGGCTCCGTCCTTTGTCGGCTAGAGGCAAAGCTTCCG 1 of 10
FA11.16 GGGAGCTAGCCAGGAGACTGGTTAGACTCGTCCAACCCGTTGTAGAGGCAAAGCTTCCG 1 of 10
FA11.17 GGGAGCTAGCCAGGTATGGTTCTAGCTTCGGCTTCTGGATTGTAGAGGCAAAGCTTCCG 1 of 10
FA11.18 GGGAGCTAGCCAGGACTTGGTTAGCGTCATAGTTTGCTGTAGTAGAGGCAAAGCTTCCG 1 of 10
FA11.21 GGGAGCTAGCCAGGTGTCGCACCTGCTAATCCCACTTGCTGCATGAGGCAAAGCTTCCG 1 of 10
ID Cycle 15 Sequence Frequency
FA15.1 GGGAGCTAGCCAGGAATGGTAGCTCGACTTCATGCTTCAGTGATGAGGCAAAGCTTCCG 28 of 30
FA15.5 GGGAGCTAGCCAGGAATTTGATAGCTCCGTTGGTGTTCTCATATGAGGCAAAGCTTCCG 1 of 30
FA15.35 GGGAGCTAGCCAGGTTTCTGGTACTCCGTGTTCATGTCTCGTGTGAGGCAAAGCTTCCG 1 of 30
Figure 6.17. Sequence diversity in folinic acid SELEX is dramatically reduced after mutagenic PCR. RNA pools obtained after various selection cycles were cloned and sequenced. The sequence pools remained diverse through cycle 10, but one sequence, FA15.1 (red and bolded), began to emerge in cycle 11 and eventually dominated the pool after 15 cycles. Italicized nucleotides constitute the constant regions. The yellow and green highlights mark conserved motifs among the three sequences found in the cycle 15 pool.
A radioactive binding assay was performed to evaluate the binding affinity of the
dominant FA15.1 sequence for both racemic and stereospecific isomers of folinic acid.
Columns packed with EAH Sepharose 4B resin conjugated to racemic folinic acid were
loaded with radiolabeled FA15.1 RNA and treated with alternate cycles of wash with
selection buffer and elution with 5 mM racemic folinic acid, 6R–folinic acid, or 6S–
folinic acid. Radioactivity measurement of each wash and eluate fraction indicates
specific elution by folinic acid, with no preference for either stereoisomer (Figure 6.18).

VI-33
Importantly, the sequence has a strong affinity for the Sepharose 4B resin, as more than
90% of the RNA input remain bound to the column after extensive wash and elution
steps.
!"!#$
!"%#$
!"&#$
!"'#$
!"(#$
)"!#$
)"%#$
)"&#$
)"'#$
*+,-./,$012/3/,$4,/5$ '*6012/3/,$4,/5$ '76012/3/,$4,/5$
!"#$%&'#()*+,-+,)#.)/)&0)1&,#()234)5'-+,)
8+9:$)$
8+9:$%$
8+9:$;$
<2=+>-$)$
<2=+>-$%$
<2=+>-$;$
8+9:$&$
8+9:$?$
<2=+>-$&$
<2=+>-$?$
<2=+>-$'$
Figure 6.18. The putative folinic acid aptamer sequence shows folinic acid–specific binding, no stereospecific binding preference, and strong affinity for the column resin. The FA15.1 RNA sequence was loaded onto columns packed with resin conjugated to racemic folinic acid and washed with selection buffer. RNA elution was performed with 5 mM solutions of racemic folinic acid, 6R–folinic acid, or 6S–folinic acid. Radioactivity in each 500-µl aliquot of wash or eluate fraction was quantified by scintillation counting. Values are reported as a percent of total radioactivity loaded onto each column. The RNA sequence shows specific elution with all three ligands, with no preference for either stereoisomer. The great majority of RNAs remain bound to the column despite the large wash and elution volumes applied.
To circumvent challenges posed by the RNA sequence’s affinity for Sepharose
resin, we repeated the radioactivity binding assay using a vitamin B12–conjugated agarose
column. Over 98% of the RNA loaded onto the column remains bound after washing
with three 500-µl aliquots of selection buffer, suggesting that the sequence also has non-
specific affinity for the agarose resin (Figure 6.19). However, over 60% of the RNA is
eluted from the column with three 500-µl aliquots of racemic folinic acid, indicating a
significantly stronger affinity for folinic acid than for the column matrix. This difference
in RNA elution is observed again in the second round of wash and elution steps,
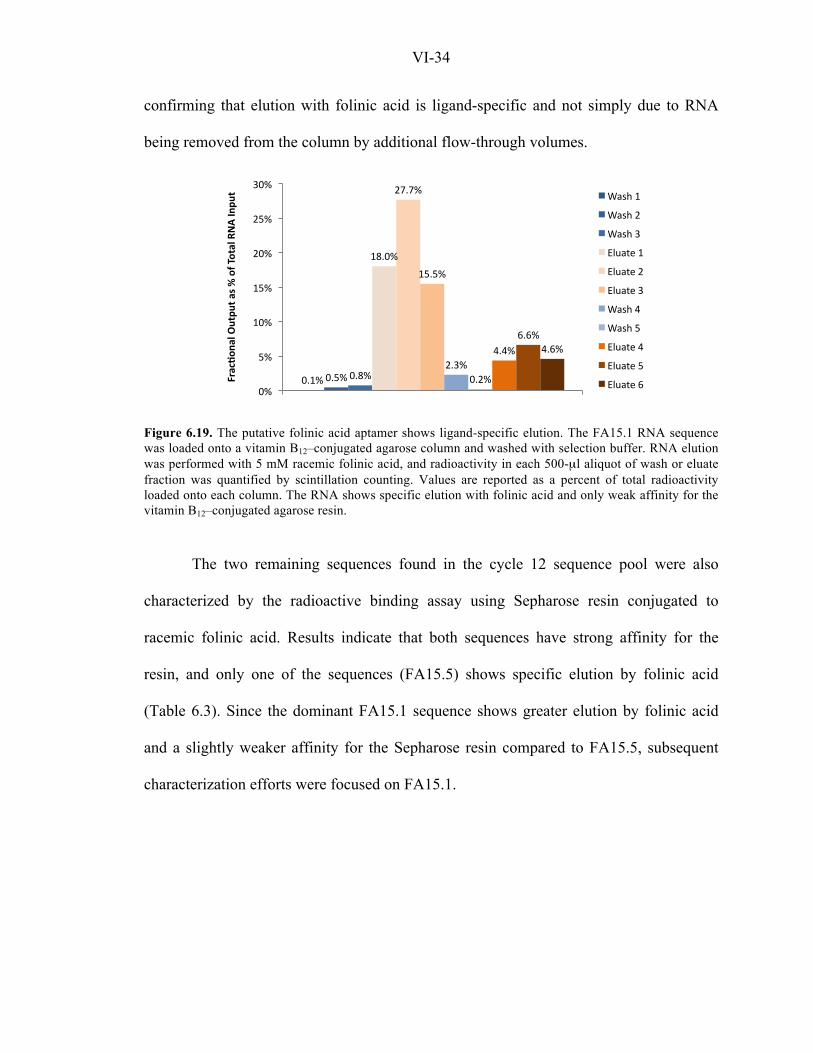
VI-34
confirming that elution with folinic acid is ligand-specific and not simply due to RNA
being removed from the column by additional flow-through volumes.
!"#$%!"&$%!"'$%
#'"!$%
()")$%
#&"&$%
("*$%
!"($%
+"+$%
,",$%
+",$%
!$%
&$%
#!$%
#&$%
(!$%
(&$%
*!$%
!"#$%&'#()*+,-+,)#.)/)&0)1&,#()234)5'-+,) -./0%#%
-./0%(%
-./0%*%
123.45%#%
123.45%(%
123.45%*%
-./0%+%
-./0%&%
123.45%+%
123.45%&%
123.45%,%
Figure 6.19. The putative folinic acid aptamer shows ligand-specific elution. The FA15.1 RNA sequence was loaded onto a vitamin B12–conjugated agarose column and washed with selection buffer. RNA elution was performed with 5 mM racemic folinic acid, and radioactivity in each 500-µl aliquot of wash or eluate fraction was quantified by scintillation counting. Values are reported as a percent of total radioactivity loaded onto each column. The RNA shows specific elution with folinic acid and only weak affinity for the vitamin B12–conjugated agarose resin.
The two remaining sequences found in the cycle 12 sequence pool were also
characterized by the radioactive binding assay using Sepharose resin conjugated to
racemic folinic acid. Results indicate that both sequences have strong affinity for the
resin, and only one of the sequences (FA15.5) shows specific elution by folinic acid
(Table 6.3). Since the dominant FA15.1 sequence shows greater elution by folinic acid
and a slightly weaker affinity for the Sepharose resin compared to FA15.5, subsequent
characterization efforts were focused on FA15.1.

VI-35
Table 6.3. Radioactive binding assay for putative folinic acid aptamer sequences with folinic acid–conjugated and unmodified Sepharose 6B columns
% of Total RNA Inputa Sequence # FA15.5 FA15.35
Column Folinic Acid Unmodified Folinic Acid Unmodified Wash 1b 0.03 0.00 0.00 0.03 Wash 2 0.09 0.00 0.01 0.09 Wash 3 0.11 0.01 0.03 0.10 Eluate 1 0.56 0.03 0.05 0.13 Wash 4 0.28 0.03 0.04 0.08 Wash 5 0.18 0.02 0.02 0.06 Wash 6 0.18 0.01 0.02 0.06 Wash 7 0.18 0.01 0.02 0.06 Eluate 2 1.06 0.03 0.05 0.12 Eluate 3 1.44 0.05 0.06 0.16 Eluate 4 1.40 0.04 0.05 0.15
Total 5.51 0.24 0.35 1.04 aValue indicates the radioactivity of each wash or eluate fraction as a percentage of the total radioactivity loaded onto each column. bEach wash and eluate fraction is 500 µl in volume. LC-MS Provides Qualitative Evaluation of Ligand-Binding Activity by Putative
Aptamer Sequences. In light of the substantial affinity toward column resins exhibited
by the putative aptamer sequences described above, binding assays utilizing alternative
separation methods are desired. Various affinity assays have been devised for the
evaluation of aptamers to small-molecule ligands9, 11, 17, 26, but quantitative measurements
of dissociation constants have generally been obtained through either surface plasmon
resonance (SPR) analysis or methods employing radiolabeled ligand molecules. We have
examined the use of SPR analysis in our efforts to characterize RNA aptamers. However,
the protocol is still in the optimization stage as of this writing, and the results will be
presented in later work. An alternative “equilibrium filtration” method that is simple and
potentially effective in aptamer evaluation was presented by Jenison and colleagues in the
characterization of the theophylline aptamer9. In this assay, known concentrations of
aptamer RNA and radiolabeled theophylline are co-incubated and filtered through a

VI-36
membrane-based size-exclusion column. Free theophylline is sufficiently small to pass
through the membrane while RNA-bound theophylline is retained. Theophylline
concentrations in the filtrate and the retentate are measured by scintillation counting, and
their difference represents the concentration of RNA-bound theophylline. The KD value is
obtained by finding the RNA concentration at which 50% of the theophylline is bound.
Radiolabeled folinic acid and vitamin B12 are not commercially available, thus
preventing the evaluation of putative aptamers to these ligands by the method described
above. However, a slightly altered protocol may be performed using liquid
chromatography (LC) combined with mass spectrometry (MS). LC-MS is a powerful tool
for the quantitative analysis of chemical mixtures, and we applied this analytical tool to
the evaluation of aptamer sequences. In this protocol, aptamer RNA is incubated with
unlabeled ligand molecules at a known concentration and filtered through a size-
exclusion column. Ligand concentration in the filtrate, which is the final free-ligand
concentration, is quantified by LC-MS. The percentage of ligand bound is calculated
from the known initial and measured final free-ligand concentrations. A range of RNA
input concentrations is tested with a fixed folinic acid input concentration to generate a
binding curve, from which the KD value can be obtained by finding the RNA
concentration at which 50% of the ligand molecules are bound.
This characterization method was first demonstrated using theophylline and its
RNA aptamer, which has a reported KD value of 0.1 µM9. RNA at concentrations ranging
from 1.25 µM to 10 µM was incubated with 5 µM theophylline and processed as
described above. Ligand concentration in the filtrate was calculated based on the intensity
of the theophylline peak in the extracted ion chromatogram, which was calibrated to a

VI-37
standard curve generated with pure theophylline solutions at known concentrations. The
resulting binding curve is incomplete in that ligand binding does not reach saturation
even at the highest RNA input concentration tested (Figure 6.20). However, the results
show a clear ligand-RNA binding response, with approximately 50% of theophylline
bound at RNA input concentrations between 1.5 µM and 2.5 µM. These observations
suggest that the LC-MS method is able to reveal aptamer-binding activity, even though
accurate quantification of the KD value remains challenging.
!"#$
%"#$
&"#$
'"#$
("#$
)"#$
*"#$
"$ +$ %$ '$ )$ ,"$ ,+$
!"#$%&'$())*+%",&-+."
/01"2+'-3"4&+5%+3678&+"9:;<"
Figure 6.20. LC-MS and size-exclusion columns can be used to verify binding interactions between RNA aptamers and their cognate small-molecule ligands. The theophylline RNA aptamer was incubated with 5 µM theophylline and filtered through a size-exclusion column. Theophylline concentration in the filtrate was measured by LC-MS, and the percent of theophylline bound to RNA (and thus retained by the membrane) was calculated based on a one-to-one theophylline-to-RNA binding assumption.
We next examined the FA15.1 RNA sequence for binding affinity toward racemic
folinic acid. RNA at concentrations ranging from 0 µM to 90 µM was incubated with 5
µM folinic acid and processed as described above. The resulting binding curve shows
clear concentration-dependent binding between folinic acid and the RNA sequence,
suggesting the FA15.1 sequence may have specific binding toward folinic acid (Figure
6.21). However, only 33% of the folinic acid was bound at the maximum RNA input
concentration tested. Higher RNA input concentrations could not be achieved due to

VI-38
limitations in in vitro transcription efficiency and RNA solubility, thus preventing
accurate quantification of the KD value by this method.
!"#
$"#
%!"#
%$"#
&!"#
&$"#
'!"#
'$"#
!# &!# (!# )!# *!# %!!#
!"#$%&'&(")(&*"+$,'*"
-.)"/'0,1"2$'(3'1456$'"789:"
Figure 6.21. The putative folinic acid aptamer shows ligand-specific binding by LC-MS analysis. The FA15.1 RNA sequence was incubated with 5 µM racemic folinic acid, and the sample was processed and analyzed as described in Figure 6.20. Increasing RNA input concentration corresponds to increasing percent of folinic acid bound, indicating specific ligand-RNA binding interaction.
The observation that almost 10% of folinic acid was missing from the filtrate even
in the absence of RNA input (Figure 6.21) suggests that the size-exclusion column retains
some free folinic acid despite the molecule’s being well below the molecular weight
cutoff of the column membrane. One possible explanation is that the ligand concentration
is above the carrying capacity of the membrane and causes membrane fouling. This
hypothesis is supported at high folinic acid concentrations by the observation that yellow
residues are retained on the column membrane for solutions at 500 mM and above. In
addition, standard curves generated with folinic acid that has been filtered through the
column in the absence of RNA deviate from linearity at concentrations beyond 100 µM
(Figure 6.22A). In comparison, standard curves generated with unfiltered folinic acid
remain linear up to 400 µM (Figure 6.22B). Even unfiltered folinic acid deviates from the
linear trend line beyond 400 µM, indicating a limited concentration range that can be

VI-39
accurately quantified by the LC-MS system. This constraint in the LC-MS detection
range can be circumvented by careful sample dilution. However, limits in the folinic acid
concentration that can be properly filtered by column membrane undermines the
feasibility of an alternative binding assay in which a fixed RNA input concentration is
paired with varying folinic acid input concentrations.
!"#"$%&'()"&"$%&'*"
+,"#"'-../0$"
'"
1%&'."
2%&'."
/%&'."
*%&'."
$%&$'"
$-1%&$'"
'" 1''" 2''" /''" *''"
!"#$%&'#$()*!+),$'-).&$')
/012"23).32()!"45#)+0"3$"#&'60")789:)
! "
!"#"$%&'()"&"*%&'("
+,"#"'-..(/."
'"
0%&'."
1%&1'"
1-0%&1'"
2%&1'"
2-0%&1'"
'" 2''" 3''" *''" /''"
!"#$%&'#$()*!+),$'-).&$')
/012"23).32()!"45#)+0"3$"#&'60")789:) Figure 6.22. LC-MS binding assays cannot be performed at high folinic acid concentrations due to errors associated with inefficient membrane filtration. LC-MS analysis was performed on racemic folinic acid solutions that are either (A) filtered through size-exclusion columns or (B) unfiltered. The integrated peak areas of extracted ion chromatograms at a molecular weight of 474 are shown. Filtered samples with concentrations above 100 µM deviate from a linear relationship between detected signal strength and folinic acid input concentration, whereas unfiltered samples remain linear through 400 µM. The difference between filtered and unfiltered samples indicates errors introduced by the membrane filtration step.
Although the binding curve shown in Figure 6.21 suggests ligand-specific binding
by the putative folinic acid aptamer, it does not rule out non-specific binding between
folinic acid and RNA in general. To evaluate this possibility, the binding assay was
repeated using the theophylline RNA aptamer instead of the FA15.1 RNA. Results
indicate that there is nonspecific loss of folinic acid from the filtrate with increasing RNA
input concentration (Theo Aptamer, Figure 6.23), either due to non-specific RNA-folinic
acid interaction or due to concentrated RNA contributing to membrane fouling.
Nevertheless, the extent of folinic acid “binding” observed with the theophylline aptamer

VI-40
is significantly less than that with the FA15.1 RNA, suggesting that the FA15.1 sequence
has specific affinity for folinic acid.
!"#
$"#
%!"#
%$"#
&!"#
&$"#
'!"#
'$"#
!# &!# (!# )!# *!# %!!#
!"#$%&'&(")(&*"+$,'*"
-.)"/'0,1"2$'(3'1456$'"789:"
+,%$-%#./,#
0123#,456728#
Figure 6.23. Folinic acid binding to the putative folinic acid aptamer is specific to the RNA sequence. The FA15.1 RNA sequence and the theophylline RNA aptamer were each incubated with 5 µM racemic folinic acid, and the samples were processed and analyzed as described in Figure 6.20. Folinic acid shows weak non-specific binding to the theophylline aptamer, but at noticeably lower levels than to the FA15.1 RNA, suggesting that the latter binding interaction is sequence specific.
Selection for Stereoisomer-Specific Folinic Acid Aptamer Results in Diverse
Sequence Pool. As described previously, 6R–folinic acid is an unnatural stereoisomer of
folinic acid whose low toxicity, relatively long serum half-life, and absence in natural
systems make it an ideal molecular input for ligand-responsive gene regulatory systems.
To isolate RNA aptamers with binding specificity for 6R–folinic acid, we used the RNA
pool obtained after cycle 10 of the racemic folinic acid aptamer selection as the starting
material. This choice was made for two reasons. First, negative selection against
chemically similar ligands are typically performed after several cycles of positive
selection in order to prevent premature elimination of sequence diversity prior to
enrichment of ligand-binding sequences. Therefore, cycle 10 is a reasonable point to
begin stereospecific selection for the 6R isoform of folinic acid. Second, sequencing
results from the racemic folinic acid aptamer selection suggest that the mutagenic PCR

VI-41
step performed after cycle 10 in that selection process may have biased the sequence
pool. Therefore, it is of interest to repeat the selection without the mutagenic PCR step to
determine whether sequence diversity would follow the same pattern as observed in the
previous selection. In light of the observation that all isolated sequences from the
previous selection show significant binding affinity toward the Sepharose 4B matrix, we
performed negative selection against unmodified Sepharose 4B resins in every cycle prior
to positive selection using a 6R–folinic acid–conjugated Sepharose 4B column.
In this selection process, RNA was filtered through an unmodified Sepharose
column and the unbound fraction was collected and loaded onto a 6R–folinic acid–
conjugated column. The column was washed with 4 CV of selection buffer followed by 5
CV of 5 mM 6S–folinic acid and another 10 CV of buffer to select against the natural
stereoisomer. The column was eluted with 7 CV of 5 mM 6R–folinic acid, and the eluted
RNA was prepared as previously described for the next selection cycle. We performed
five rounds of selection and sequenced the RNA pool obtained after the last cycle.
Results indicate a diverse sequence pool with no repeats found among 21 sequenced
samples (Figure 6.24A). FA15.1, the dominant sequence isolated from the racemic folinic
acid selection, is present in the 6R–folinic acid pool (as 6RFA15.55) but shows no
obvious relation with the remaining sequences in the pool. Short sequence motifs were
identified among the sequenced samples, but most contain slight variations among
sequences and none are truly conserved in more than two sequences (Figure 6.24B). As
of this writing, characterization of these isolated sequences awaits results from ongoing
efforts in the development of more accurate, high-throughput assays for ligand-RNA
binding affinity.

VI-42
6RFA15.84
>CTACTCACGATAACTGGTTCGCAACCTTGT<
6RFA15.53
>GCGCATAAAATTTTAATCGCAAACTTATAT<
6RFA15.1
>CTCCGCACAAATGTATCCTTACATCGTGTA<
6RFA15.1
>CTCCGCACAAATGTATCCTTACATCGTGTA<
6RFA15.72
>CTCCGTGAGTGCTTTTACAAGTGGTTGTGT<
6RFA15.49
>CTCCTCCTGTTGACTGTTCATTCAGTTGGC<
6RFA15.45
>GTTAGCTTCAGTGAGTTTCTTATTGTTGTC<
6RFA15.48
>CTTCCCTGCTAACTGTATCTCTCCGGTATA<
6RFA15.67
>TATTCCTCTTGGCTAACCCGTTGTCTCTAT<
!
"
ID Cycle 15 Sequence Frequency
6RFA15.1 GGGAGCTAGCCAGGCTCCGCACAAATGTATCCTTACATCGTGTAGAGGCAAAGCTTCCG 1 of 21
6RFA15.45 GGGAGCTAGCCAGGGTTAGCTTCAGTGAGTTTCTTATTGTTGTCGAGGCAAAGCTTCCG 1 of 21
6RFA15.48 GGGAGCTAGCCAGGCTTCCCTGCTAACTGTATCTCTCCGGTATAGAGGCAAAGCTTCCG 1 of 21
6RFA15.49 GGGAGCTAGCCAGGCTCCTCCTGTTGACTGTTCATTCAGTTGGCGAGGCAAAGCTTCCG 1 of 21
6RFA15.50 GGGAGCTAGCCAGGCTCTTGCTAGTTCCGCGCTATCTTGTGGTTGAGGCAAAGCTTCCG 1 of 21
6RFA15.52 GGGAGCTAGCCAGGATTATCCCGGTGTCTCCTATCTTGCGTTATGAGGCAAAGCTTCCG 1 of 21
6RFA15.53 GGGAGCTAGCCAGGGCGCATAAAATTTTAATCGCAAACTTATATGAGGCAAAGCTTCCG 1 of 21
6RFA15.55 GGGAGCTAGCCAGGAATGGTAGCTCGACTTCATGCTTCAGTGATGAGGCAAAGCTTCCG 1 of 21
6RFA15.57 GGGAGCTAGCCAGGATTTGCTTGGCGAACCCCGATACCTTTGTAGAGGCAAAGCTTCCG 1 of 21
6RFA15.66 GGGAGCTAGCCAGGTCCGGCAACAGGCCCTGGCCTAAATTCGATGAGGCAAAGCTTCCG 1 of 21
6RFA15.67 GGGAGCTAGCCAGGTATTCCTCTTGGCTAACCCGTTGTCTCTATGAGGCAAAGCTTCCG 1 of 21
6RFA15.68 GGGAGCTAGCCAGGTTGGACAAGCCCCAACGATTAATCTAGGAAGAGGCAAAGCTTCCG 1 of 21
6RFA15.69 GGGAGCTAGCCAGGTTGTGCTGTAGCTCACCACTCAACATGTATGAGGCAAAGCTTCCG 1 of 21
6RFA15.70 GGGAGCTAGCCAGGTGTTGTTGCTGCTCCGATGTCGTACTTCATGAGGCAAAGCTTCCG 1 of 21
6RFA15.72 GGGAGCTAGCCAGGCTCCGTGAGTGCTTTTACAAGTGGTTGTGTGAGGCAAAGCTTCCG 1 of 21
6RFA15.74 GGGAGCTAGCCAGGTAAAAGGTTACGGACACGCCGAGGGTCAGGGAGGCAAAGCTTCCG 1 of 21
6RFA15.77 GGGAGCTAGCCAGGTCTTTGGCGGCTCGCGAGTGTCTTCTAGGTGAGGCAAAGCTTCCG 1 of 21
6RFA15.80 GGGAGCTAGCCAGGTATGGCTAGGGGCTCTCGGTCTCTGAGTATGAGGCAAAGCTTCCG 1 of 21
6RFA15.84 GGGAGCTAGCCAGGCTACTCACGATAACTGGTTCGCAACCTTGTGAGGCAAAGCTTCCG 1 of 21
6RFA15.85 GGGAGCTAGCCAGGCTCCTCATATTTGGCTTTCAGATGTGTAGAGGCAAAGCTTCCG 1 of 21
6RFA15.88 GGGAGCTAGCGAACGCCAGTTTCAGTTGTGTTGAGGCAAAGCTTCCG 1 of 21
6RFA15.84
>CTACTCACGATAACTGGTTCGCAACCTTGT<
6RFA15.53
>GCGCATAAAATTTTAATCGCAAACTTATAT<
6RFA15.1
>CTCCGCACAAATGTATCCTTACATCGTGTA<
6RFA15.1
>CTCCGCACAAATGTATCCTTACATCGTGTA<
6RFA15.72
>CTCCGTGAGTGCTTTTACAAGTGGTTGTGT<
6RFA15.49
>CTCCTCCTGTTGACTGTTCATTCAGTTGGC<
6RFA15.45
>GTTAGCTTCAGTGAGTTTCTTATTGTTGTC<
6RFA15.48
>CTTCCCTGCTAACTGTATCTCTCCGGTATA<
6RFA15.67
>TATTCCTCTTGGCTAACCCGTTGTCTCTAT<
Figure 6.24. 6R–folinic acid SELEX yields a diverse sequence pool with conserved motifs. (A) The sequence pool remains diverse after 10 selection cycles toward racemic folinic acid and 5 subsequent cycles toward 6R–folinic acid. The RNA pool was cloned and sequenced. Results indicate a diverse sequence pool, even though the dominant sequence found in the racemic folinic acid selection (FA15.1) also appears in the 6R–folinic acid pool (6RFA15.55, red and bolded). (B) No sequence appears more than once in the pool, but similar motifs can be found among the diverse sequences. Italicized nucleotides constitute the constant regions. Colored highlights mark motifs found within each group of sequences.
Discussion
RNA aptamers constitute the sensor domain of most existing ligand-responsive
RNA-based regulatory devices, including the switch systems presented in this thesis. Our
efforts in selecting new RNA aptamers toward therapeutically applicable small molecules
have met with several challenges, leading to a close examination of different selection
protocols and the potential pitfalls associated with each separation method. Studies

VI-43
detailed in this chapter show that nitrocellulose membranes, though widely used for
aptamer selection to protein targets, have surprisingly low partition efficiencies.
Specifically, nitrocellulose membranes cannot effectively retain even high-affinity RNA
aptamers in the presence of their cognate protein targets, thus undermining the usefulness
of nitrocellulose membranes as a separation method in aptamer selection.
An alternative selection method employs column chromatography, which requires
target immobilization on resin particles. However, many small molecules suitable for
clinical applications lack appropriate functional groups for resin conjugation. Although
synthetic chemistry has been used to generate modified small molecules for resin
conjugation in some instances9, 27, such modifications are not always possible and may
affect the binding specificity of the aptamer sequences isolated from such selection
processes. In collaboration with the Chemistry Core Facility at City of Hope, we have
examined the possibility of chemically modifying phenobarbital for resin conjugation,
but our efforts were unsuccessful due to phenobarbital’s compact structure. Furthermore,
any modification to phenobarbital would have represented a significant change to its
chemical makeup, and aptamer sequences isolated for such modified molecules may not
have the same binding affinity for the intended target.
Another challenge associated with both membrane- and column-based selections
is the enrichment of sequences with high affinity for the solid support itself. We
repeatedly isolated sequences that bind strongly to either nitrocellulose or the column
resin used for separation. These findings indicate that stringent negative selections
against the solid support must be applied throughout the selection process. Combining
affinity elution with membrane filtration was effective in preventing the enrichment of

VI-44
membrane-binding sequences, but it is unclear whether the hybrid method is effective for
aptamer selection. The ability to use more than one separation method in a selection
process (e.g., alternating between membrane- and column-based selection for each cycle)
would shift the selection bias away from sequences with strong binding affinity for a
specific solid support. Alternative selection methods that do not require solid supports,
including the use of capillary electrophoresis28-30 and direct ribozyme switch isolation
through in vitro and in vivo screening, are also being explored in the Smolke Laboratory.
Our aptamer selection efforts yielded diverse pools of potential aptamers for
vitamin B12 and 6R–folinic acid. The binding characterization assays developed thus
far—including radioactive binding assays and LC-MS analyses—have been qualitative
and low throughput, making them unsuitable for screening through large sequence pools.
Development of more quantitative and higher throughput methods, including the use of
SPR-based technology such as Biacore (GE Healthcare), is ongoing and will be applied
to the sequence pools obtained from these selection processes.
The racemic folinic acid selection yielded a dominant sequence that shows
specific binding to its intended target by both radioactive binding assays and LC-MS
analyses. However, initial characterizations by Biacore have shown no quantitative
evidence for binding between the putative aptamer and racemic folinic acid (J. C. Liang,
personal communication). The putative aptamer sequence has been integrated into the
ribozyme switch platform and tested both by in vitro cleavage assays and in yeast
cultures, but no functional switch construct has been developed thus far (J. C. Liang and
M. N. Win, personal communication). The ribozyme switches may be improved by
randomizing the transmitter domain and performing a library screen for effective switch

VI-45
activity. Furthermore, the putative aptamer sequence will have to be characterized in
greater detail as more quantitative evaluation methods become available.
SELEX technology was first developed in 1990 and has been used widely for the
de novo generation of diverse DNA and RNA aptamer sequences. However, no aptamer
with in vivo activity and specificity for clinically suitable ligand molecules has been
isolated thus far. Our attempts at selecting novel RNA aptamers toward small-molecule
targets have generated mixed results but also provided insights into the optimization of
various selection parameters. Informed by past challenges, ongoing efforts in the Smolke
Laboratory continue to explore the intricacies of aptamer selection, with the aim of
developing more efficient and reliable methods for the isolation of new aptamers.
Materials and Methods
Nitrocellulose membrane-based SELEX for phenobarbital aptamer. A N30 DNA
library was generated by PCR using forward primer N30 Fwd (5’TTCTAATACGACTCA
CTATAGGGAGCTAGCCAGG), reverse primer N30 Rev (5’CGGAAGCTTTGCCTC),
and the N30 Template (5’ TTCTAATACGACTCACTATAGGGAGCTAGCCAGG
(N30) GAGGCAAAGCTTCCG), where the italicized sequence denotes the T7 promoter
and underlined sequences denote the restriction sites NheI and HindIII used for cloning.
All oligonucleotides were synthesized by Integrated DNA Technologies. The initial PCR
amplification was performed with 20 pmol of the N30 Template, corresponding to
approximately 1.2 x 10¹³ unique sequences, assuming complete randomization in the
oligonucleotide synthesis process. A N30 RNA library was generated by in vitro
transcription using the N30 DNA library as template. The reaction was performed with

VI-46
40 mM Tris-HCl, pH 7.9, 16 mM MgCl2, 10 mM dithiothreitol (DTT), 2 mM spermidine,
3 mM of ATP, CTP, and UTP (Epicentre), 300 µM of GTP (Invitrogen), 10 µCi of [α-
32P]-GTP (GE Healthcare), 50 U of T7 RNA polymerase (New England Biolabs), and 40
U of RNaseOUT ribonuclease inhibitor (Invitrogen) and incubated at 37°C overnight.
The transcription product was treated with 2 U of DNaseI (New England Biolabs) at
37°C for 15 min and purified with a NucAway column (Ambion) hydrated with selection
buffer (20 mM Tris-HCl, pH 7.5, 100 mM NaCl, 750 µM MgCl2). RNA was denatured
by heating to 75°C for 3 min and allowed to renature at room temperature for 30 min.
Membrane filtration was performed using a MultiscreenHTS Vacuum Manifold
(Millipore) with a 96-well MultiscreenHTS-HA filter plate (Millipore). In all filtration
steps, the membrane wells were pre-wetted by incubation with 100 µl of selection buffer
for 1 min before buffer removal by vacuum filtration at a pressure of 5 in. Hg. In cycle 1,
the N30 RNA library was filtered through a membrane well and the filtrates were
collected for incubation with 75 pmol of phenobarbital-BSA (Meridian Life Science) at
37°C for 30 min. The binding reaction was filtered through a new membrane well, and
the membrane was washed with 800 µl of selection buffer. The membrane was removed
from the plate and soaked in 600 µl of Tris-buffered phenol-chloroform, pH 7.9, at room
temperature for 30 min. RNA was extracted by adding 200 µl of RNase-free water and
collecting the aqueous layer. A second extraction step was performed with phenol-
chloroform before RNA precipitation with 2 volumes of 95% ethanol, 0.1 volumes of 3
M sodium acetate, and 0.1 mg/ml glycogen (Ambion) followed by a wash step with 500
µl of 70% ethanol. Reverse transcription and cDNA amplification was performed in a
single step with a 50-µl RT-PCR reaction containing 20 mM Tris-HCl, pH8.4, 50 mM

VI-47
KCl, 5 mM DTT, 200 µM dNTP, 0.2 µM each of the N30 Fwd and N30 Rev primers, 40
U of RNaseOUT, 200 U of SuperScriptIII reverse transcriptase (Invitrogen), and 5 U of
Taq DNA polymerase. The reaction was incubated at 55°C for 35 min (for reverse
transcription) and immediately subjected to 15 cycles of PCR amplification. The cDNA
product was used for transcription in the next selection cycle.
The process was repeated as described for 20 selection cycles with the following
changes. First, negative selection against nitrocellulose membrane was not performed
beyond cycle 1. Second, starting in cycle 3, transcriptions were performed with 3 mM of
each rNTP with no radioactivity, and the reaction was allowed to proceed at 37°C for 2
hours. RNA concentration was quantified using a Nanodrop spectrophotometer, and the
amount of phenobarbital-BSA added to the binding reaction was adjusted accordingly to
achieve the desired ligand-to-RNA ratio. The phenobarbital-BSA stock used contains 12–
15 phenobarbital molecules per BSA molecule, and the BSA:RNA ratio used in each
cycle is summarized in the table shown on the following page. Third, the ligand-RNA
incubation time was gradually decreased and the volume of selection buffer filtered
through the membrane during the wash step gradually increased through the selection
cycles to increase selection stringency (see table on next page). Fourth, negative selection
against unconjugated BSA was performed prior to positive selection with phenobarbital-
BSA in cycles 11-13 and 15-20. In these negative selections, renatured RNA was first
incubated with unconjugated BSA (New England Biolabs) at a BSA:RNA ratio of 1:10 at
37°C for 10 min. The binding mixture was filtered through a membrane well, and the
filtrate was collected for incubation with phenobarbital-BSA as in a typical selection
cycle.

VI-48
Cycle # Negative Selection
BSA:RNA Ratio (for positive selection)a
Binding Incubation Time
(min)
Wash Volume (ml)
1 Nitrocellulose 1:1 30 0.8 2 None 1:1 30 0.8 3 None 1:1 30 0.8 4 None 1:10 30 0.8 5 None 1:1 30 0.8 6 None 1:10 15 1.2 7 None 1:10 15 1.6 8 None 1:20 15 2.0 9 None 1:50 15 2.0
10 None 1:100 15 2.0 11 BSA 1:10 15 2.0 12 BSA 1:10 15 2.0 13 BSA 1:10 15 2.0 14 None 1:100 10 2.0 15 BSA 1:100 10 2.0 16 BSA 1:133 5 4.0 17 BSA 1:100 5 4.0 18 BSA 1:100 5 4.0 19 BSA 1:100 5 4.0 20 BSA 1:100 5 4.0
Nitrocellulose membrane-based SELEX for phenobarbital aptamer with ligand-
specific elution. A N30 DNA library was generated by PCR as described above using
200 pmol of template input for a total of approximately 1.2 x 10¹⁴ unique sequences.
Overnight radioactive RNA transcription was performed for cycle 1 as described
previously, and all subsequent transcriptions were performed at 37°C for 2 hours without
radiolabeling. The selection buffer composition was changed to 20 mM Tris-HCl, Ph7.5,
100 mM NaCl, and 1 mM MgCl2 for this selection process. Twelve selection cycles were
performed as described using phenobarbital-BSA, with the BSA:RNA ratio fixed at 11:1
throughout the selection. The binding reaction was performed at 37°C for 45 min in
cycles 1–5 and for 30 min in cycles 6–12. Wash volume was maintained at 1 ml for
cycles 1–9 and increased to 2 ml for cycles 10–12. Negative selection against BSA was

VI-49
performed with a BSA:RNA ratio of 1:1 before positive selection with phenobarbital-
BSA in cycles 8–12. No explicit negative selection against nitrocellulose was performed.
Nitrocellulose membrane-based radioactive binding assay. Radioactive RNA was
transcribed, purified, denatured, and renatured as described above. Radiolabeled RNA
was incubated with either no protein or the specified protein target at 37°C for 10 min.
The binding mixture was filtered through a membrane well as described above, and the
membrane was washed with selection buffer or eluted with concentrated ligand solutions
as specified by the experiment. Collected samples (either liquid filtrate or washed
nitrocellulose membrane) were added to 5 ml of Safety-Solve scintillation liquid
(Research Products International) and analyzed using a liquid scintillation counter
(Beckman Coulter).
Column-based SELEX for vitamin B12. Chromatography matrices were prepared by
packing 850 µl of vitamin B12–agarose (Sigma) or adipic acid dihydrazide-agarose
(Sigma) into columns with a column volume (CV) of approximate 500 µl following
manufacturer’s protocol (Pierce). The packed columns were washed with 25 ml of
RNase-free water and 10 ml of selection buffer and wrapped in foil (to prevent photo-
degradation of vitamin B12) prior to use. A N30 DNA library was generated by PCR as
described above using 400 pmol of template input for a total of approximately 2.4x 10¹⁴
unique sequences. The initial N30 RNA library was generated by a ten 100-µl
transcription reactions each containing 40 mM Tris-HCl, pH 7.9, 16 mM MgCl2, 10 mM
DTT, 2 mM spermidine, 25 mM of each rNTP, 200 U of T7 RNA polymerase, and 120 U

VI-50
of RNaseOUT ribonuclease inhibitor and incubated at 37°C for 2 hours. Each 100 µl of
transcription product was treated with 4 U of DNaseI at 37°C for 1 hour and purified with
a NucAway column hydrated with selection buffer (20 mM Tris-HCl, pH7.5, 250 mM
NaCl, 2.5 mM MgCl2).
The resulting RNA was split into two equal aliquots: one for vitamin B12 selection
and the other for folinic acid selection. The RNA was loaded onto the adipic acid
dihydrazide-agarose column, incubated for 20 min, and eluted with selection buffer. This
negative selection against unmodified column matrix was performed in cycles 1 through
3. The unbound fraction was subsequently loaded onto the vitamin B12–agarose column,
incubated for 20 min, and washed with 5 CV of selection buffer. The column was
incubated with 5 mM vitamin B12 (Sigma) dissolved in selection buffer for 30 min and
the RNA was eluted in a total of 7 CV of 5 mM vitamin B12. The entire column
chromatography procedure was performed at room temperature. Eluted RNA was
precipitated with 2 volumes of 95% ethanol, 0.1 volumes of 3 M sodium acetate, and 10
µg/ml of glycogen followed by a wash step with 500 µl of 70% ethanol. Reverse
transcription and cDNA amplification was performed in a single step with a 100-µl RT-
PCR reaction containing 20 mM Tris-HCl, pH8.4, 50 mM KCl, 0.1 M DTT, 200 µM
dNTP, 0.2 µM each of the N30 Fwd and N30 Rev primers, 80 U of RNaseOUT, 400 U of
SuperScriptIII reverse transcriptase, and 10 U of Taq DNA polymerase. The reaction was
incubated at 55°C for 35 min (for reverse transcription) and immediately subjected to 10
cycles of PCR amplification. Transcription for subsequent cycles was performed as
described but in one 50-µl reaction for each cycle using cDNA from the previous cycle as
template.

VI-51
Fifteen selection cycles were performed, with the wash volume increasing from 5
CV to 10 CV in cycle 4. The wash volume was subsequently increased in 10-CV
intervals from cycle 5 to cycle 10, then in 20-CV intervals from cycle 10 to cycle 15. The
cDNA obtained after cycle 10 served as template for a 15-cycle, 100-µl mutagenic PCR
reaction containing 10 mM Tris-HCl, pH8.3, 50 mM KCl, 7 mM MgCl2, 0.5 mM MnCl2,
0.4 µM each of the N30 Fwd and N30 Rev primers, 0.2 mM of dATP and dGTP, 1 mM
of dTTP and dCTP, and 10 U of Taq DNA polymerase. This PCR product was used as
the template for RNA transcription in cycle 11 of the selection process.
Column-based SELEX for racemic folinic acid. EAH Sepharose 4B resin (GE
Healthcare) washed with water at pH 4.5 and 0.5 M NaCl before overnight incubation
with 0.1 M EDAC (Invitrogen) and 5 mM racemic folinic acid (Sigma) at room
temperature in the dark on a rotating rack. Unreacted functional groups on the resin were
blocked by incubation with 1 M glacial acetic acid at room temperature for 3 hours. The
ligand-conjugated resin was packed into columns with a column volume of approximate
500 µl following manufacturer’s instructions. Three wash cycles each consisting of 10
CV of low pH salt solution (0.1 M sodium acetate, pH 4.0, 0.5 M NaCl) followed by 10
CV of high pH salt solution (0.1 M Tris-HCl, pH 8.3, 0.5 M NaCl) were performed on
the packed columns to remove unconjugated folinic acid that may have remained in the
column through weak ionic interactions. Columns were then washed with 20 CV of
selection buffer and wrapped in foil (to prevent photo-degradation of folinic acid) prior to
use. Unmodified EAH Sepharose 4B resin was washed with water and NaCl as described
above and used to pack unmodified columns used for negative selections. Packed

VI-52
columns were washed only with selection buffer prior to use. The selection process was
performed exactly as described for vitamin B12, except racemic folinic acid was used
instead of vitamin B12.
Column-based SELEX for 6R–folinic acid. EAH Sepharose 4B resin was conjugated to
5 mM 6R–folinic acid (Schircks Laboratories) and used to pack columns as described for
racemic folinic acid. cDNA obtained after cycle 10 of the racemic folinic acid aptamer
selection was used as template for in vitro transcription to generate the starting RNA pool
for this selection. In each of 5 selection cycles, RNA was first loaded unto an unmodified
Sepharose 4B column, incubated for 20 min, and eluted with selection buffer. The
unbound fraction was subsequently loaded onto the 6R–folinic acid column, incubated
for 20 min, and washed with 5 CV of selection buffer followed by 5 CV of 5 mM 6S–
folinic acid (Schircks Laboratories) and another 10 CV of selection buffer. The column
was incubated with 5 mM 6R–folinic acid dissolved in selection buffer for 30 min and
the RNA was eluted in a total of 7 CV of 5 mM 6R–folinic acid. The entire column
chromatography procedure was performed at room temperature, and the eluted RNA was
precipitated and reverse transcribed as described for the vitamin B12 selection process.
Column-based radioactive binding assay. RNA was transcribed in a 20-µl reaction
using the AmpliScribe T7 High Yield Transcription Kit (Epicentre) following
manufacturer’s protocol, except only 750 µM of GTP was used and 10 µCi of [α-32P]-
GTP was added to generate radiolabeled RNA. The transcription product was treated
with 2 U of DNaseI at 37°C for 1 hour and purified with a NucAway column hydrated

VI-53
with selection buffer. RNA was loaded onto the appropriate column as specified by the
experiment, incubated at room temperature for 20 min, and the unbound fraction was
collected. The column was subsequently washed with selection buffer or eluted with
dissolved ligand as specified by the experiment. Collected samples were added to 5 ml of
Safety-Solve scintillation liquid and analyzed using a liquid scintillation counter.
Sequence and structural analyses. RNA pools from the specified selection cycles were
reverse transcribed into cDNA and amplified by PCR as described. The PCR products
were digested with the NheI and HindIII restriction enzymes and cloned into
pcDNA3.1(+) (Invitrogen) for sequencing. Sequence results were aligned with the Clustal
X software (University College Dublin) to assist with identifying sequence motifs. RNA
folding was determined using the RNAstructure software (University of Rochester
Medical Center), and structural motifs were identified by manual sorting.
Capillary electrophoresis binding assay. DNA templates encoding the SV12.6,
SVC12.60, and SVC12.70 sequences were synthesized by Integrated DNA Technologies
and PCR amplified using the N30 Fwd and N30 Rev primers. RNA transcription was
performed in 20-µl reactions using the AmpliScribe T7 High Yield Transcription Kit
following manufacturer’s protocol. The transcription product was treated with 2 U of
DNaseI at 37°C for 1 hour and purified with a NucAway column hydrated with RNase-
free water. For RNA-only samples, RNA was diluted to 100 ng/µl (5.24 µM) with
selection buffer (20 mM Tris-HCl, Ph7.5, 100 mM NaCl, 1 mM MgCl2). For ligand-
binding reactions, 2 µg of RNA was diluted to a total volume of 17.72 µl with selection

VI-54
buffer, denatured in a PCR block at 75°C for 3 min, renatured by cooling to 25°C at
0.3°C/sec, and added to 2.28 µl of 45.81 µM phenobarbital-BSA to produce a 20-µl
mixture with a final concentration of 5.24 µM RNA and 5.24 µM phenobarbital-BSA
(molar concentration for BSA).
Capillary electrophoresis was performed with a P/ACE MDQ Capillary
Electrophoresis System (Beckman Coulter) using a photodiode array (PDA) detector. For
each run, 110 nl of sample was injected at 2 psi over 8 sec, and separation was performed
at 22.5 kV over 14 min. The capillary was filled with run buffer (25 mM sodium
tetraborate, pH 9.1) prior to each sample injection. Capillary regeneration was performed
by rinsing with 0.1 M HCl, followed by 0.1 M NaOH, water, and finally the run buffer.
Each rinse step was performed for 2 min at 20 psi. Elution profiles were analyzed using
the 32Karat software (Beckman Coulter).
LC-MS binding assay. RNA was transcribed in five 100-µl reactions using the
AmpliScribe T7 High Yield Transcription Kit following manufacturer’s protocol. Each
100-µl transcription product was treated with 20 U of DNaseI at 37°C for 1 hour and
purified with a NucAway column hydrated with RNase-Free water. The eluted RNA was
extracted with phenol-chloroform and precipitated with 2 volumes of 95% ethanol and
0.1 volume of 3 M sodium acetate followed by a wash step with 500 µl of 70% ethanol.
The precipitated RNA was resuspended in 100 µl of selection buffer (20 mM Tris-HCl,
pH7.5, 250 mM NaCl, 2.5 mM MgCl2), denatured at 75°C for 3 min, and renatured at
room temperature for 30 min. Binding reactions were set up with the RNA and ligand
(folinic acid or theophylline) concentration specified by the experiment. The binding

VI-55
mixture was incubated at 37°C for 30 min and loaded onto a Microcon YM-10 column
(Millipore). The column was centrifuged at maximum speed for 30 min, and the filtrate
was analyzed by LC-MS. Standard curves for concentration calculation were generated
with pure ligand solutions prepared at known concentrations (16 µM to 1 µM in two-fold
dilutions for typical binding assays) and filtered in the same way as the RNA-ligand
binding mixtures.
LC-MS analysis was performed with an Agilent 6320 Ion Trap LC/MS system
using either an Agilent ZORBAX SB-Aq, 3.0 x 250 mm, 5 µm column (for folinic acid)
or an Agilent ZORBAX Eclipse XDB-C18, 2.1 x 50 mm, 3.5 µm column (for
theophylline). The method for analyzing folinic acid is shown below, where solvent A is
0.1% acetic acid and 0.1% methanol in water, solvent B is 0.1% acetic acid in methanol,
and solvents A and B always sum to 100% of the liquid flux.
Time (min) % Solvent B Flow Rate (ml/min)
0.00 45 0.500 6.00 45 0.500 6.50 60 0.500 7.00 75 0.500 7.50 100 0.500
13.00 100 0.500 13.50 45 0.500 38.00 Method Ends Method Ends
The method for analyzing theophylline is shown on the following page, where the solvent
setups are as described for the folinic acid protocol.

VI-56
Time (min) % Solvent B Flow Rate (ml/min)
0.00 15 0.350 2.50 15 0.350 3.00 100 1.000 4.50 100 1.000 5.00 15 1.000 6.50 15 1.000 6.60 15 0.350 7.00 Method Ends Method Ends
Acknowledgments
The column-based selection for vitamin B12 and racemic folinic acid was performed with
J.C. Liang. We thank A. Brown and M. Greenwood-Goodwin for assistance with
capillary electrophoresis, M.N. Win for advice on column-based SELEX, and M.
Siddiqui and J. Michener for assistance with LC-MS. This work was supported by the
City of Hope’s National Cancer Institute–Cancer Center Support Grant, the National
Science Foundation (fellowship to Y.Y.C.), the Alfred P. Sloan Foundation (fellowship to
C.D.S.), and the National Institutes of Health (grant to C.D.S., RC1GM091298).
References
1. Win, M.N. & Smolke, C.D. A modular and extensible RNA-based gene-
regulatory platform for engineering cellular function. Proc Natl Acad Sci U S A
104, 14283-14288 (2007).
2. Beisel, C.L., Bayer, T.S., Hoff, K.G. & Smolke, C.D. Model-guided design of
ligand-regulated RNAi for programmable control of gene expression. Mol Syst
Biol 4, 224 (2008).

VI-57
3. Beisel, C.L., Chen, Y.Y., Culler, S.J., Hoff, K.G. & Smolke, C.D. Design of small
molecule-responsive microRNAs based on structural requirements for Drosha
processing. Nucleic Acids Res (2010). doi: 10.1093/nar/gkq954.
4. Conrad, R.C., Giver, L., Tian, Y. & Ellington, A.D. In vitro selection of nucleic
acid aptamers that bind proteins. Methods Enzymol 267, 336-367 (1996).
5. Giver, L., Bartel, D.P., Zapp, M.L., Green, M.R. & Ellington, A.D. Selection and
design of high-affinity RNA ligands for HIV-1 Rev. Gene 137, 19-24 (1993).
6. Kubik, M.F., Stephens, A.W., Schneider, D., Marlar, R.A. & Tasset, D. High-
affinity RNA ligands to human alpha-thrombin. Nucleic Acids Res 22, 2619-2626
(1994).
7. Hirao, I., Spingola, M., Peabody, D. & Ellington, A.D. The limits of specificity:
an experimental analysis with RNA aptamers to MS2 coat protein variants. Mol
Divers 4, 75-89 (1998).
8. Lebruska, L.L. & Maher, L.J., 3rd Selection and characterization of an RNA
decoy for transcription factor NF-kappa B. Biochemistry 38, 3168-3174 (1999).
9. Jenison, R.D., Gill, S.C., Pardi, A. & Polisky, B. High-resolution molecular
discrimination by RNA. Science 263, 1425-1429 (1994).
10. Berens, C., Thain, A. & Schroeder, R. A tetracycline-binding RNA aptamer.
Bioorg Med Chem 9, 2549-2556 (2001).
11. Win, M.N., Klein, J.S. & Smolke, C.D. Codeine-binding RNA aptamers and rapid
determination of their binding constants using a direct coupling surface plasmon
resonance assay. Nucleic Acids Res 34, 5670-5682 (2006).

VI-58
12. http://www.ncbi.nlm.nih.gov/pubmedhealth/PMH0000542. U.S. National Library
of Medicine, National Institutes of Health (2008).
13. Cox, J.C. & Ellington, A.D. Automated selection of anti-protein aptamers. Bioorg
Med Chem 9, 2525-2531 (2001).
14. Huang, D.B. et al. Crystal structure of NF-kappaB (p50)2 complexed to a high-
affinity RNA aptamer. Proc Natl Acad Sci U S A 100, 9268-9273 (2003).
15. Weinberger, R. Practical Capillary Electrophoresis, Edn. 2nd. (Academic Press,
San Diego; 2000).
16. Bleyer, W.A. New vistas for leucovorin in cancer chemotherapy. Cancer 63, 995-
1007 (1989).
17. Lorsch, J.R. & Szostak, J.W. In vitro selection of RNA aptamers specific for
cyanocobalamin. Biochemistry 33, 973-982 (1994).
18. Sussman, D., Nix, J.C. & Wilson, C. The structural basis for molecular
recognition by the vitamin B 12 RNA aptamer. Nat Struct Biol 7, 53-57 (2000).
19. Mathews, D.H. et al. Incorporating chemical modification constraints into a
dynamic programming algorithm for prediction of RNA secondary structure. Proc
Natl Acad Sci U S A 101, 7287-7292 (2004).
20. Keshava, C., Keshava, N., Whong, W.Z., Nath, J. & Ong, T.M. Inhibition of
methotrexate-induced chromosomal damage by folinic acid in V79 cells. Mutat
Res 397, 221-228 (1998).
21. Mini, E., Trave, F., Rustum, Y.M. & Bertino, J.R. Enhancement of the antitumor
effects of 5-fluorouracil by folinic acid. Pharmacol Ther 47, 1-19 (1990).

VI-59
22. Etienne, M.C., Thyss, A., Bertrand, Y., Rubie, H. & Milano, G. [l-folinic acid
versus racemic folinic acid in the treatment of leukemia in children with high dose
of methotrexate]. Bull Cancer 80, 357-363 (1993).
23. Etienne, M.C., Speziale, N. & Milano, G. HPLC of folinic acid diastereoisomers
and 5-methyltetrahydrofolate in plasma. Clin Chem 39, 82-86 (1993).
24. Newman, E.M., Straw, J.A. & Doroshow, J.H. Pharmacokinetics of
diastereoisomers of (6R,S)-folinic acid (leucovorin) in humans during constant
high-dose intravenous infusion. Cancer Res 49, 5755-5760 (1989).
25. Schilsky, R.L. et al. Clinical pharmacology of the stereoisomers of leucovorin
during repeated oral dosing. Cancer 63, 1018-1021 (1989).
26. Ellington, A.D. & Szostak, J.W. In vitro selection of RNA molecules that bind
specific ligands. Nature 346, 818-822 (1990).
27. Sinha, J., Reyes, S.J. & Gallivan, J.P. Reprogramming bacteria to seek and
destroy an herbicide. Nat Chem Biol 6, 464-470 (2010).
28. Mendonsa, S.D. & Bowser, M.T. In vitro selection of high-affinity DNA ligands
for human IgE using capillary electrophoresis. Anal Chem 76, 5387-5392 (2004).
29. Berezovski, M. et al. Nonequilibrium capillary electrophoresis of equilibrium
mixtures: a universal tool for development of aptamers. J Am Chem Soc 127,
3165-3171 (2005).
30. Drabovich, A., Berezovski, M. & Krylov, S.N. Selection of smart aptamers by
equilibrium capillary electrophoresis of equilibrium mixtures (ECEEM). J Am
Chem Soc 127, 11224-11225 (2005).