in-use performance testing of butanol-extended fuel in...
TRANSCRIPT
1
In-Use Performance Testing of Butanol-Extended Fuel in Recreational Marine Engines
Wolfgang WukisiewitschVice President R&D
BRP Powertrain GmbH & Co KG

2
1. W
hy
Eth
an
ol?
• Ethanol has been the primary fuel extender:– Historically, yields of ethanol were high
relative to other biologically derived
alternative fuels
– Ethanol was an available replacement
for MTBE which was known to cause
significant environmental related issues
– Government subsidies and low-interest loans for ethanol producers have lead to many ethanol production facilities across the U.S
– The establishment of the U.S Renewable fuels standard mandated specific quantities of ethanol production
– Ethanol reduces dependency on foreign sources of oil
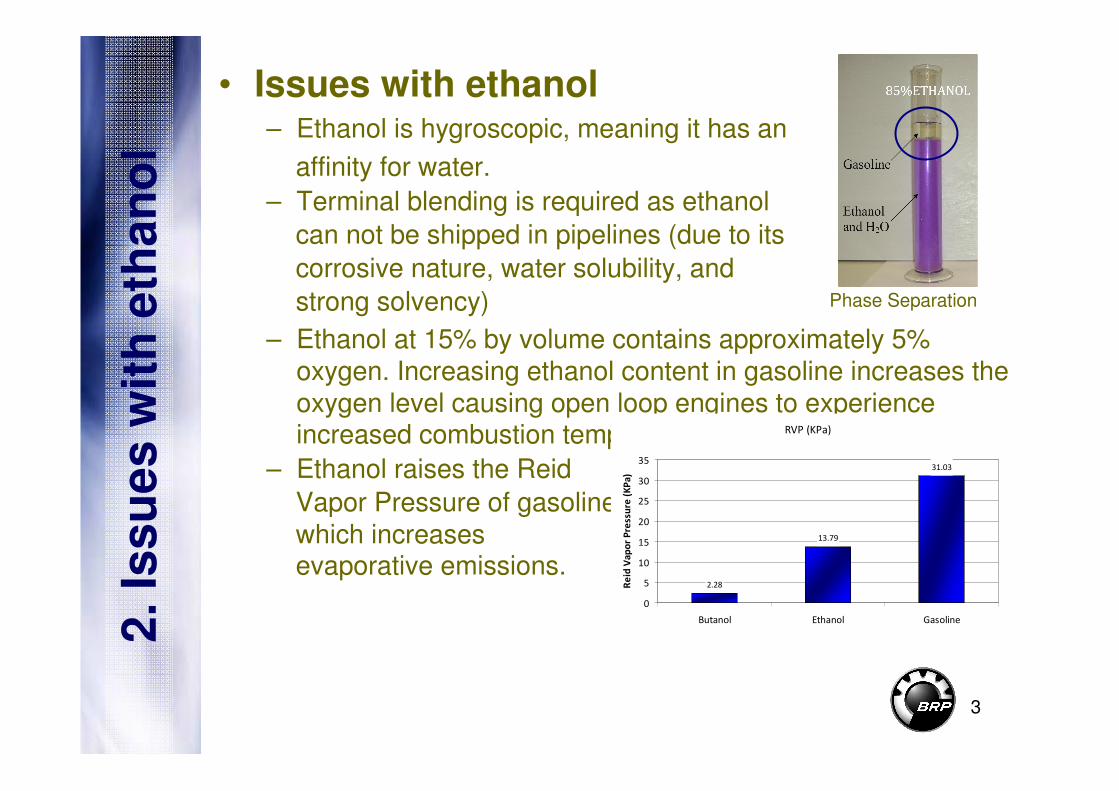
• Issues with ethanol – Ethanol is hygroscopic, meaning it has an
affinity for water.
– Terminal blending is required as ethanol
can not be shipped in pipelines (due to its
corrosive nature, water solubility, and
strong solvency)
– Ethanol at 15% by volume contains approximately 5% oxygen. Increasing ethanol content in gasoline increases the oxygen level causing open loop engines to experience increased combustion temperatures
– Ethanol raises the Reid
Vapor Pressure of gasoline
which increases evaporative emissions.
RVP (KPa)
2.28
13.79
31.03
0
5
10
15
20
25
30
35
Butanol Ethanol GasolineR
eid
Va
po
r P
ress
ure
(K
Pa
)
3
2. Is
su
es
wit
h e
tha
no
l
Phase Separation

4
2. Is
su
es
wit
h e
tha
no
l
• Specific to the marine environment– The majority of boats use an open-vented
fuel system in which water is more likely
to enter the fuel system which results in
phase-separation of the fuel.
– Ethanol causes deterioration in many fiberglass fuel tanks which are structurally part of the boat
– The usage frequency of boats, especially in northern climates, results in a greater likelihood of fuel/fuel system related issues

5
2. Is
su
es
wit
h e
tha
no
l
Higher quantities of ethanol beyond 10% by volume will only exacerbate these issues.

6
3. E
15
NR
EL
Re
po
rt
• Based on data and tests conducted by the National Renewable Fuels Laboratory, E15 has caused substantial damage to marine engines.
• E15 marine outboard engine failed exhaust valves. Metlabanalysis showed excessive metal temperatures caused a reduction in fatigue strength.
Failed Exhaust Valves from 300 HP Mercury Verado Outboard Engine
7
3. E
15
NR
EL
Re
po
rt
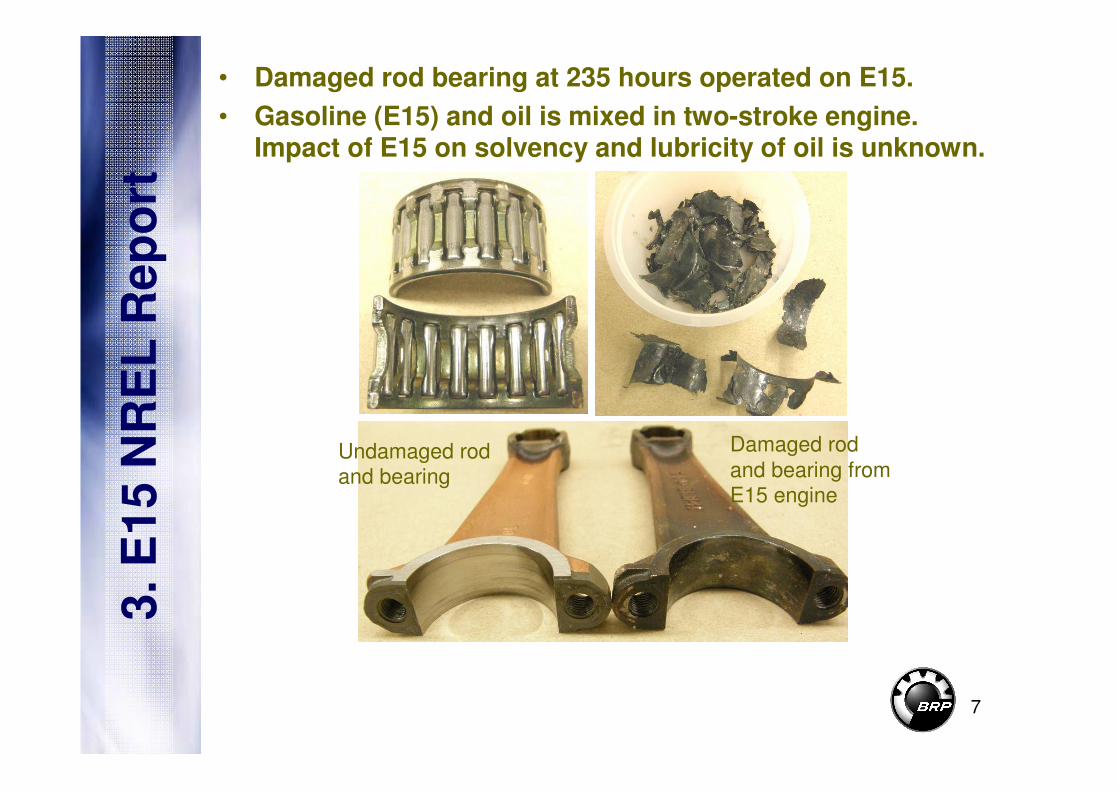
• Damaged rod bearing at 235 hours operated on E15.
• Gasoline (E15) and oil is mixed in two-stroke engine. Impact of E15 on solvency and lubricity of oil is unknown.
Damaged rod
and bearing from E15 engine
Undamaged rod and bearing

8
So why the push to E15?

US Gasoline + Ethanol Consumption 1991 - 2011 and Renewable Fuels Standard
(RFS-II) Total Renewable Fuel Requirements through 2022
[Billion gallons per year]
100
108
116
124
132
140
148
1991
1992
1993
1994
1995
1996
1997
1998
1999
2000
2001
2002
2003
2004
2005
2006
2007
2008
2009
2010
2011
2012
2013
2014
2015
2016
2017
2018
2019
2020
2021
2022
Year
Gaso
lin
e p
lus E
than
ol
Co
nsu
mp
tio
n
0
7
14
21
28
35
42
Fu
el
Eth
an
ol
Pro
du
cti
on
,
Ren
ew
ab
le F
uel
Man
date
an
d %
eth
an
ol
in g
aso
lin
e p
oo
l
Gasoline plus ethanol consumption Fuel Ethanol ConsumptionRFS-II Quantities % ethanol in gasoline poolMTBE Production
9
20
07
-2
01
1
Global Financial Crisis
% Ethanol in Gasoline Pool = 10%
J.Wasil

10
5. S
olu
tio
ns
– Solutions:
• Quickly start consuming more gasoline (unlikely)
• Realign the RFS to match the new fuel demand reality (unlikely - does nothing to address the growth of the ethanol industry)
• Raise the amount of ethanol allowed in gasoline (E15 waiver request granted – source of much debate, will cause issues)
• Find another alternative fuel that can better satisfy the RFS volumes without affecting millions of existing engines
The US Market was saturated with ethanol in 2010. The industry cannot
continue to grow beyond that of exports.

What is Butanol?
• A four carbon alcohol (C4H9OH), colorless, neutral liquid of medium volatility with a characteristic banana-like odor.
• Traditional petrochemical derived - Generally used to make other chemicals, or used as a solvent or an ingredient in formulated products such as cosmetics.
• Can be biologically derived in a fermentation process
• Butanol exists in four (4) different isomers:
The structure of the four
(4) isomers of butanol in
comparison to ethanol
(a two carbon alcohol (C2H5OH))
6. B
uta
no
la
s a
fu
el-
ex
ten
de
r
11

Properties of Butanol - Overview
Gasoline
(EEE)
Ethanol1-
butanol2-
butanol3-
butanolIso-
butanol
Composition (C,H,O) (% mass)
86, 14, 0
52, 13, 35
65,
13.5, 21.5
65,
13.5, 21.5
65,
13.5, 21.5
65,
13.5, 21.5
RON 97 107.4 98.3 106 105 105.1
MON 88.3 88.2 84.4 92 89 89.3
Melting point (ºC) - -112 -79.9 -114.7 25.5 -108
Energy content (MJ/kg)
42.9 25.6 32.9 32.9 32.9 32.8
Density (kg/L) 0.742 0.789 0.81 0.81 0.79 0.81
Energy content
relative to gasoline (%)
- 64 84 84 82 83
Solubility in water <0.1Fully
miscible7.7 7.6
6. B
uta
no
la
s a
fu
el-
ex
ten
de
r
12
(R+M)/2 = 97.2(R+M)/2 = 97.8

136. B
uta
no
la
s a
Fu
el
Ex
ten
de
r • Properties of butanol
– Less susceptible to phase separation means butanolcould be successfully delivered in existing pipelines
– Eliminates need for splash-blending
– Least corrosive of alcohols
– Higher energy content – can be blended into gasoline at higher percentages than ethanol
Adding water to ethanol and butanol

14
7. T
es
t B
oa
ts
Figure 1. 18’ Mako boat with 175 HP Evinrude Direct Fuel Injection Outboard
Figure 2. 24’ SeaDoo Challenger boat with 215 HP Rotax engine
Table 2: Engine Specifications
Evaluate 16% isobutanol-extended
fuel over summer boating season (50 hrs)

15
8. T
es
t M
eth
od
-M
PS
S
• Marine Portable Bag Sampling System (MPSS)
– Developed for the U.S EPA Marine Green House Gas reporting requirement.
– First portable emissions sampling system used to evaluate emissions from recreational boats operated on-water.
– Integrated 5-gas emissions analyzer
– Contains sample preparation unit / chiller
– Filters, pumps, sampletimer, condensation pumps, flow meters, mass flow
Figure 3: MPSS Bag Sampling System
In-Use Emissions Evaluation of Butanol
Fuel

16
8. T
es
t M
eth
od
-M
PS
S
• Marine Test Cycle
– Laboratory ISO 8178 discrete test modes
– On-water sampling method according to NTE procedure
Figure 7. Example of EPA NTE test zone. Red points indicate the standard ISO 8178
test points
Table 4. ISO 8178 Marine Test Cycle
EPA NTE ZONE and Standard ISO 8178 Test Points
0
50
100
150
200
250
300
350
400
0
10
00
20
00
30
00
40
00
50
00
60
00
70
00
80
00
90
00
RPM
To
rqu
e (
nm
)
High Load Line
Boat Load
Low Load Line
Constant Speed Lines
ICOMIA Cycle
-20
0
20
40
60
80
100
0 20 40 60 80 100
Engine Speed (% of Rated)
En
gin
e T
orq
ue
(%
of
Ra
ted
)
17
9. R
esu
lts
Figure 9. Evinrude E-TEC emission results sample bag 1 and 2 CO grams per ICOMIA
hour
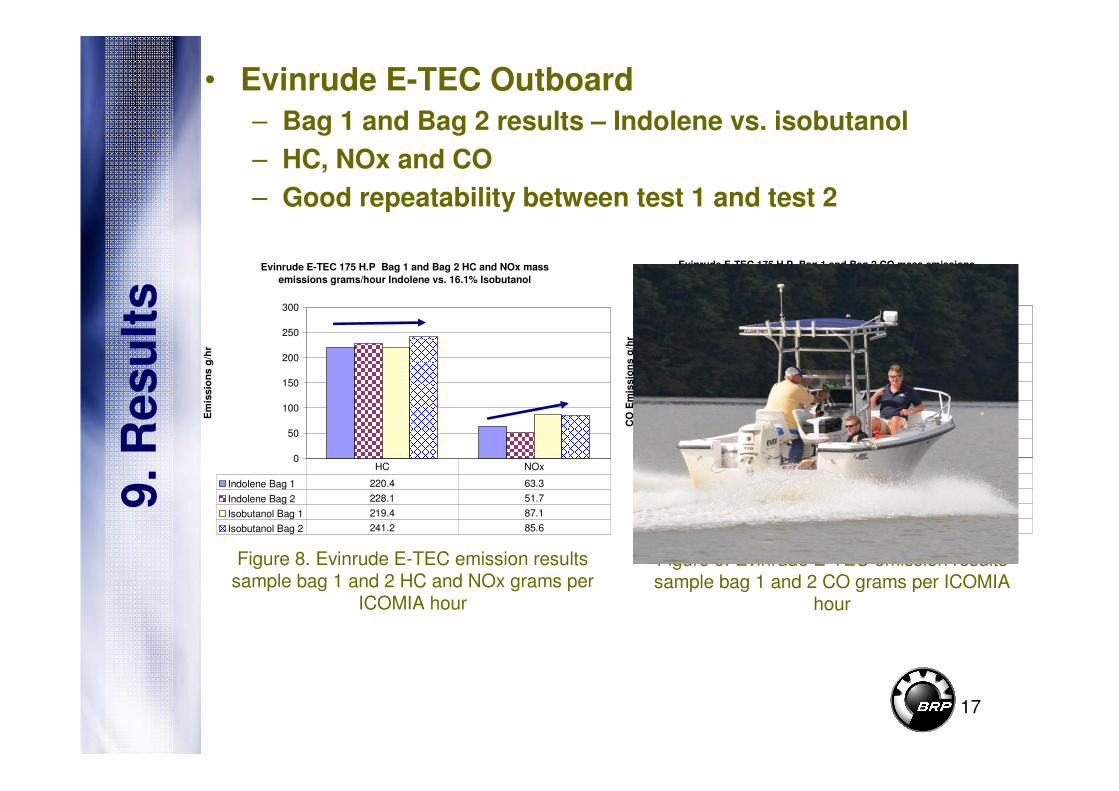
Figure 8. Evinrude E-TEC emission results sample bag 1 and 2 HC and NOx grams per
ICOMIA hour
Evinrude E-TEC 175 H.P Bag 1 and Bag 2 HC and NOx mass
emissions grams/hour Indolene vs. 16.1% Isobutanol
0
50
100
150
200
250
300
Em
issio
ns g
/hr
Indolene Bag 1 220.4 63.3
Indolene Bag 2 228.1 51.7
Isobutanol Bag 1 219.4 87.1
Isobutanol Bag 2 241.2 85.6
HC NOx
Evinrude E-TEC 175 H.P Bag 1 and Bag 2 CO mass emissions
grams/hour Indolene vs. 16.1% Isobutanol
0
500
1000
1500
2000
2500
3000
3500
4000
CO
Em
issio
ns g
/hr
Indolene Bag 1 3758.3
Indolene Bag 2 3692.4
Isobutanol Bag 1 3097.3
Isobutanol Bag 2 3086.7
CO
• Evinrude E-TEC Outboard
– Bag 1 and Bag 2 results – Indolene vs. isobutanol
– HC, NOx and CO
– Good repeatability between test 1 and test 2

18
9. R
esu
lts
• Evinrude E-TEC
– Estimated weighted power kW using throttle position and RPM look-up
– Tests comfortably under the limit and within expected range
Evinrude E-TEC average HC+NOx g/kW-hr indolene vs. isobutanol calculated from estimated
power
Evinrude E-TEC Estimated (power)
HC+NOx g/kW-hr Indolene vs. isobutanol
0.0
2.0
4.0
6.0
8.0
10.0
12.0
14.0
16.0
18.0
20.0
Indolene isobutanol
HC
+ N
Ox
g/k
W-h
r
NOx HC
9.4
10.3
Emissions Limit: 16.4 g/kW-hr
9.5%

Evinrude E-TEC Estimated (power)
CO g/kW-hr Indolene vs. isobutanol
0
50
100
150
200
250
300
Indolene isobutanol
CO
g/k
W-h
r
CO
124
102
Emissions Limit: 300 g/kW-hr
19
9. R
esu
lts
• Evinrude E-TEC
– Estimated weighted power kW using throttle position and RPM look-up
– Tests comfortably under the limit and within expected range
Evinrude E-TEC average CO g/kW-hr indolene vs. isobutanol calculated from estimated power
~17%

Evinrude E-TEC Estimated (power)
All Regulated Components HC+NOx+CO g/kW-hr
Indolene vs. isobutanol
0.0
20.0
40.0
60.0
80.0
100.0
120.0
140.0
160.0
Indolene isobutanol
Em
iss
ion
s g
/kW
-hr
NOx HC CO
20
9. R
esu
lts
• Evinrude E-TEC
– Estimated weighted power kW using throttle position and RPM look-up
– All regulated components HC+NOx+CO
Evinrude E-TEC all regulated components g/kW-hr indolene vs. isobutanol calculated from estimated
power

21
9. R
esu
lts
• SeaDoo Challenger
– Bag 1 and Bag 2 results – Indolene vs. isobutanol
– HC, NOx and CO
– Good repeatability between test 1 and test 2
Figure 14. SeaDoo emission results sample bag 1 and 2 CO grams per ICOMIA hour
Figure 13. SeaDoo boat emission results sample bag 1 and 2 HC and NOx grams per
ICOMIA hour
SeaDoo Jetboat Bag 1 and Bag 2 HC and NOx mass emissions
grams/hour Indolene vs. 16.1% Isobutanol
0
50
100
150
200
250
300
Em
issio
ns g
/hr
Indolene Bag 1 112.1 215.4
Indolene Bag 2 116.0 200.6
Isobutanol Bag 1 76.7 242.4
Isobutanol Bag 2 70.7 253.4
HC NOx
SeaDoo Jetboat Bag 1 and Bag 2 CO mass emissions grams/hour
Indolene vs. 16.1% Isobutanol
0
500
1000
1500
2000
2500
3000
3500
4000
CO
Em
issio
ns g
/hr
Indolene Bag 1 3432.4
Indolene Bag 2 3508.8
Isobutanol Bag 1 2261.2
Isobutanol Bag 2 2235.9
CO
22
6. R
esu
lts
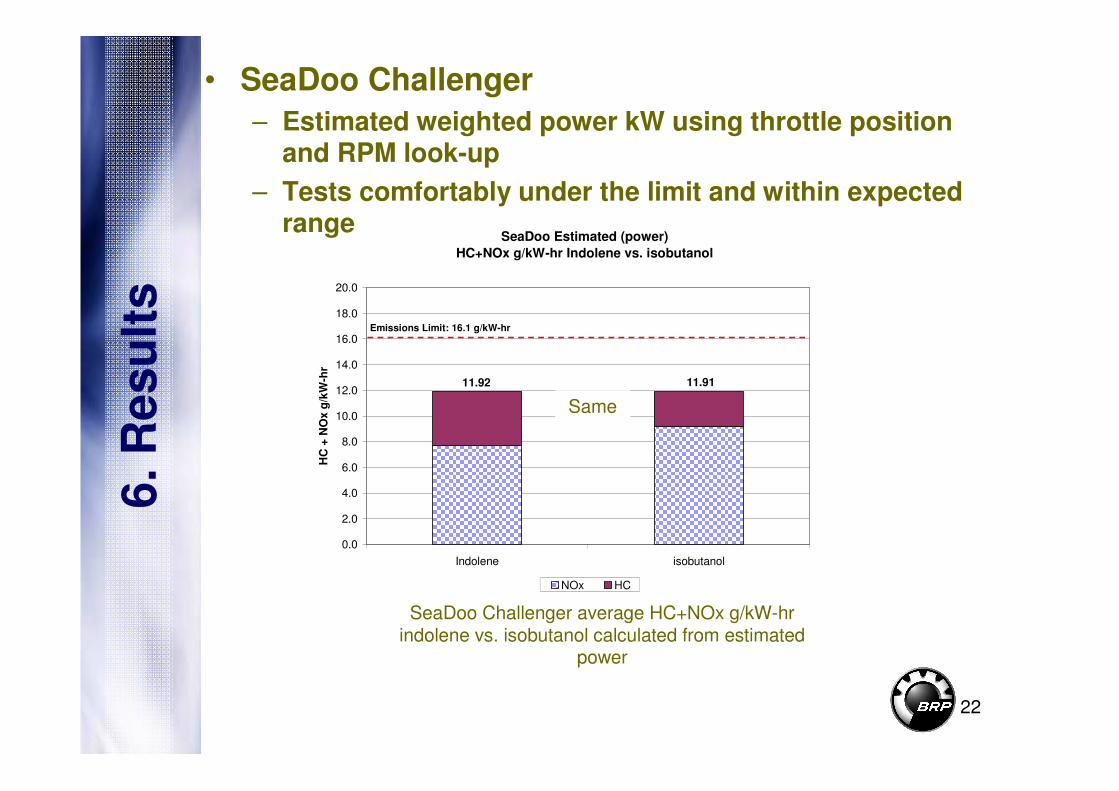
• SeaDoo Challenger
– Estimated weighted power kW using throttle position and RPM look-up
– Tests comfortably under the limit and within expected range
SeaDoo Challenger average HC+NOx g/kW-hr indolene vs. isobutanol calculated from estimated
power
SeaDoo Estimated (power)
HC+NOx g/kW-hr Indolene vs. isobutanol
0.0
2.0
4.0
6.0
8.0
10.0
12.0
14.0
16.0
18.0
20.0
Indolene isobutanol
HC
+ N
Ox
g/k
W-h
r
NOx HC
11.92 11.91
Emissions Limit: 16.1 g/kW-hr
Same

SeaDoo Challenger Estimated (power)
CO g/kW-hr Indolene vs. isobutanol
0
50
100
150
200
250
300
Indolene isobutanol
CO
g/k
W-h
r
CO
128
84
Emissions Limit: 300 g/kW-hr
23
9. R
esu
lts
• SeaDoo Challenger
– Estimated weighted power kW using throttle position and RPM look-up
– Tests comfortably under the limit and within expected range
SeaDoo Challenger average CO g/kW-hr indolenevs. isobutanol calculated from estimated power
~35%
24
9. R
esu
lts
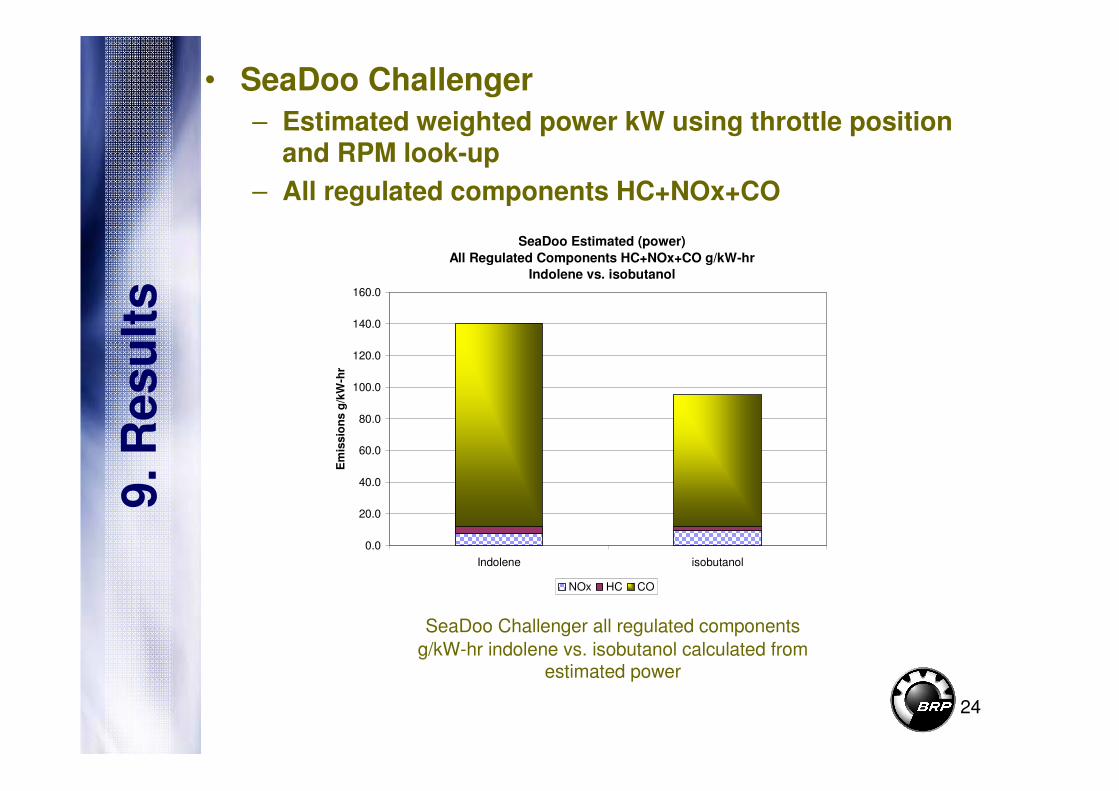
• SeaDoo Challenger
– Estimated weighted power kW using throttle position and RPM look-up
– All regulated components HC+NOx+CO
SeaDoo Challenger all regulated components
g/kW-hr indolene vs. isobutanol calculated from estimated power
SeaDoo Estimated (power)
All Regulated Components HC+NOx+CO g/kW-hr
Indolene vs. isobutanol
0.0
20.0
40.0
60.0
80.0
100.0
120.0
140.0
160.0
Indolene isobutanol
Em
iss
ion
s g
/kW
-hr
NOx HC CO

25
9. R
esu
lts
• Expected Enleanment
– The CO enleanment caused by 16.1% isobutanol(partially oxidized fuel) is within the typical range of E10
Figure 18. Percent Reduction in Open-loop Engines Mass CO relative to Non-oxygenated Indolene Certification Fuel. The enleanment for B16.1 fuel is similar to typical enleanment of
E10
CO Average Enleanment (%) and Range Relative to Non-oxygenated
Test Fuel (10% ethanol vs. 16.1% isobutanol)
-50
-45
-40
-35
-30
-25
-20
-15
-10
-5
0
10% ethanol 16.1% isobutanol
% e
nle
an
men
t

26
10
. C
on
clu
sio
n
• Conclusion:
– The boats and engines operated on a 16% isobutanol-extended fuel performed well over the 50 hour field test program
• No engine runability, startability or other issues were reported
– Field emission testing results using a 16% isobutanol-extended fuel relative to a non-oxygenated indolenetest fuel indicate:
• No change in HC+NOx for the supercharged four-stroke engine
• Slight increase in HC+NOx for the two-stroke direct fuel injection engine.
– Carbon Monoxide emissions were reduced on both boats using a 16% isobutanol-extended fuel.
– CO emissions on isobutanol are within normal expected ranges of E10

27
10
. C
on
clu
sio
n
Where do we go from here?
• DOE interest in butanol-extended fuels
• The marine industry is leading up one of the largest and most comprehensive recreational marine study using an advanced biofuel other than ethanol with Argonne National Laboratory and U.S Department of Energy oversight
• DOE interest in fuel comingling gasoline/ethanol/butanol to lower RVP
• Continued tests with the Department of Energy