in u.s.a. characteristics of the deoxyribollucleic acid of
TRANSCRIPT

JOURNAL OF VIROLOGY, May 1969, p. 528-532Copyright @ 1969 American Society for Microbiology
Vol. 3, No. 5Printed in U.S.A.
Characteristics of the Deoxyribollucleic Acid of To3,a Bacteriophage for Bacillus stearothermophilus
LARRE N. EGBERTIDivision of Biology, California Institute of Technology, Pasadena, California 91109, and Department of Biology,
The Johns Hopkins University, Baltimore, Maryland 21218
Received for publication 29 January 1969
It is shown that the individual strands of bacteriophage T43 DNA are intact andthat heat-denatured T03 DNA forms a bimodal distribution ina neutral CsCl densitygradient.
Recent reports have indicated that the dena-tured deoxyribonucleic acid (DNA) of severalbacteriophages for Bacillus stearothermophilusforms two bands in a CsCl density gradient (2,13, 15). The DNA in the two bands formed byTP-84 DNA was shown to be complementary,but the polynucleotide chains were not intact(13). The material in the two bands formed bythe denatured DNA of phage ST, was shown to becomplementary by annealing experiments (2). Inthis paper, the denatured DNA of bacteriophageT43 is reported to form a bimodal distribution ina neutral CsCl density gradient, and the individualpolynucleotide chains of the DNA of T43 areshown to be intact.Phage T43 infects B. stearothermophilus ATCC
8005 at 60 C. The head of bacteriophage T43 is57 nm long and the tail is 125 nm long and 10nm wide (4).
Tqb3 DNA was prepared from purified T43 (4)by the phenol extraction method of Mandell andHershey (10) by the procedure of Thomas andAbelson (17). The thermal denaturation profile ofT403 DNA in standard saline citrate was typicalof double-stranded DNA with a melting tempera-ture (Tm) of 87.5 C. This value corresponds to aguanine plus cytosine (G + C) content of 44.4%(11). A G + C content of 43% was obtained fromthe buoyant density of T43 DNA [p (T43 DNA)= 1.702, assuming a density for Escherichia coliDNA of 1.710 and a density for Micrococcuslysodeikticus DNA of 1.731] in a CsCl densitygradient when the procedures of Schildkraut,Marmur, and Doty (14) were used. The resultsof a chromatographic base analysis of T463 DNAare presented in Table 1.
Electron microscopy of T43 DNA was per-formed by the procedures of Kleinschmidt et al.(7). The length of individual T43 DNA moleculeswas determined by tracing enlargements of de-
1 Present address: Department of Bacteriology and PublicHealth, Utah State University, Logan, Utah 84321.
veloped negatives with a map measure. Themolecular weight of the Na+ salt of each moleculewas calculated assuming 1.92 X 10⁶ daltons per,um for DNA (3, 8, 9). Measurements of thelength of individual T43 DNA molecules whichwere prepared either by osmotic shock of thephage or from purified DNA gave similar results.The average length of 33 molecules was 12.1 i0.7 Am corresponding to a molecular weight of23.2 X 101 daltons. An electron micrograph ofT403 DNA is presented in Fig. 1.
TABLE 1. Base composition of Tc3 DNAa
Base Mole per centb Molar ratio
A 29.0 i 0.6 1.00Gc 19.4 i 0.2 0.69T 30.8 i 0.8 1.06cc 20.8 i 0.3 0.72
100.0a Whole phage or phage DNA was hydrolized in
formic acid (22) and the resulting bases were sep-arated by paper chromatography with solvent I ofKirby (6). The ultraviolet-absorbing spots werecut out and the bases were quantitatively elutedwith 0.1 N HCI. The quantity of each base presentwas determined from the ultraviolet absorptionspectra by utilizing the extinction coefficientsgiven by Bendich (1) .
b Values are averages of three determinations.c Note that total G + C = 40.2%.
Band sedimentation velocity experiments wereperformed by the procedures of Studier (16)with a type 2 band forming centerpiece (20) andan initial DNA concentration of 8 ,g/ml.Densitometer tracings of the ultracentrifuge filmsare presented in Fig. 2. The sedimentationcoefficients, S20 ,w for native T403 DNA, alkalinedenatured T453 DNA, and neutral denatured T43DNA were 33.6 i 0.9 S(4 determinations),
528
brought to you by COREView metadata, citation and similar papers at core.ac.uk
provided by Caltech Authors

VOL. 3, 1969
FIG. 1. Electron micrograph of Tc3 DNA.
NOTES 529

J. VIROL.
37.6 ±fi 0.9S (10 determinations) and 86.4 i 1.5S(5 determinations), respectively. These sedimen-tation coefficients correspond (16) to a molecu-lar weight of 28.7 X 10⁶ daltons for native T43DNA, and 13.5 X 10⁶ daltons for either alka-line denatured T43 DNA or neutral denaturedT43 DNA. The individual polynucleotide chainsof T43 DNA are therefore intact.Band sedimentation velocity experiments that
were performed with an initial concentration of133 ,ug of freshly isolated Tc/3 DNA per ml (toproduce rear sharpening of the band) indicated
Native naturedDenatu red
that less than 5 to 10% of the DNA sedimented astrailing material behind the main band.The buoyant density of T4)3 DNA in a CsCl
density gradient was determined by the procedureof Vinograd and Hearst (18) assuming thedensity of M. lysodeikticus DNA to be 1.726 (19).Native T43 DNA formed a single band in aneutral CsCl density gradient at a buoyant densityof 1.695 g/ml. Heat-denatured T43 DNA formedbands at densities of 1.707 and 1.716 (Fig. 3).After the separated bands of denaturedDNA weremixed and annealed in the centrifuge cell, the
NeutralDenatured
FIG. 2. Analytical band sedimentation patterns of T43 DNA. The interval between patterns is 16 minfor nativeDNA and alkaline denaturedDNA and 8 min for neutral denatured DNA. The sedimentation solventfor native andneutral denatured DNA was 0.1 M NaCI and 0.01 M tris(hydroxymethyl)aminomethane-hydrochloride buffer (pH7.7 at 25 C); for alkaline denatured DNA it was 0.9 M NaCI and 0.1 M NaOH. The centrifuge was operated at25,980 rev/min.
530 NOT'ES
VOL. 3, 1969
2 A
1.707
w
z
() IlB 2 BCIO
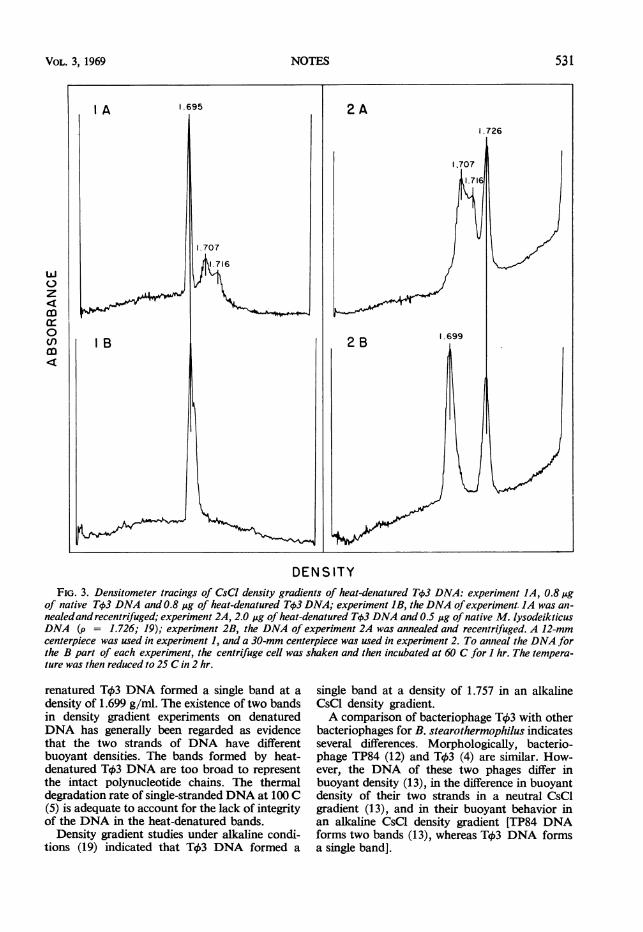
DENSITYFIG. 3. Densitometer tracings of CsCl density gradients of heat-denatured Tck3 DNA: experiment JA, 0.8,ug
of native T43 DNA and 0.8 ,ug of heat-denatured Tb3 DNA; experiment IB, the DNA ofexperiment. JA was an-nealedand recentrifuged; experiment 2A, 2.0 ,&g of heat-denatured TqS3 DNA and 0.5 ug of native M. lysodeikticusDNA (p = 1.726; 19); experiment 2B, the DNA of experiment 2A was annealed and recentrifuged. A 12-mmcenterpiece was used in experiment 1, and a 30-mm centerpiece was used in experiment 2. To anneal the DNA forthe B part of each experiment, the centrifuge cell was shaken and then incubated at 60 C for I hr. The tempera-ture was then reduced to 25 C in 2 hr.
renatured T43 DNA formed a single band at adensity of 1.699 g/ml. The existence of two bandsin density gradient experiments on denaturedDNA has generally been regarded as evidencethat the two strands of DNA have differentbuoyant densities. The bands formed by heat-denatured Tc3 DNA are too broad to representthe intact polynucleotide chains. The thermaldegradation rate of single-stranded DNA at 100 C(5) is adequate to account for the lack of integrityof the DNA in the heat-denatured bands.
Density gradient studies under alkaline condi-tions (19) indicated that Tg3 DNA formed a
single band at a density of 1.757 in an alkalineCsCl density gradient.A comparison of bacteriophage T43 with other
bacteriophages for B. stearothermophilus indicatesseveral differences. Morphologically, bacterio-phage TP84 (12) and T43 (4) are similar. How-ever, the DNA of these two phages differ inbuoyant density (13), in the difference in buoyantdensity of their two strands in a neutral CsClgradient (13), and in their buoyant behavior inan alkaline CsCl density gradient [TP84 DNAforms two bands (13), whereas T453 DNA formsa single band].
I A
531NOT'ES
532 NOTES
T143 (4) differs morphologically from phageST, (2) and the sedimentation coefficient of ST,DNA (2) is much less than that of T43 DNA.The buoyant density of the native DNA and thedifference in density of the individual strands ofthe denatured DNA of phage 4)A4 (15) aredifferent than the corresponding values for T43DNA. Bacteriophage TP1 (21) is morphologicallydistinct from T4)3 (4).
I conclude that the two strands of T13 DNAhave different buoyant densities in a neutral CsCldensity gradient and that the two strands areintact in the native, alkaline denatured, andneutral denatured forms of T4)3 DNA.
I thank H. K. Mitchell for his advice and assistance. This in-vestigation was supported by Public Health Service predoctoralfellowship GM 13791 and research grant GM 14884 from theNational Institute of General Medical Sciences.
LITERATURE CITED
1. Bendich, A. 1957. Methods for characterization of nucleicacids by base composition, p. 715-723. In S. P. Colowickand N. 0. Kaplan (ed.), Methods in enzymology, vol. 3.Academic Press, Inc., New York.
2. Carnevali, F., and G. Donelli. 1968. Some properties of athermophilic phage DNA. Arch. Biochem. Biophys. 125:376-377.
3. Caro, L. G. 1965. The molecular weight of lambda DNA.Virology 25:226-236.
4. Egbert, L. N., and H. K. Mitchell. 1967. Characteristics ofT43, a bacteriophage for Bacillus stearotherinophilus. J.Virol. 1:610-616.
5. Eigner, J., H. Boedtker, and G. Michaels. 1961. The thermaldegradation of nucleic acids. Biochim. Biophys. Acta 51:165-168.
6. Kirby, K. S. 1955. Some new solvent systems for the paperchromatography of nucleic acid degradation products.Biochim. Biophys. Acta. 18:575-576.
7. Kleinschmidt, A. K., D. Lang, D. Jacherts, and R. K. Zahn.1962. Darstellung und Langemessungen des gesamtenDesoxyribonucleinsaureinhaltes von T2-bakteriophagen.Biochim. Biophys. Acta. 61:857-864.
J. VIROL.
8. MacHattie, L. A., K. L. Berns, and C. A. Thomas, Jr. 1965.Electron microscopy of DNA from Hemophilus influenzae.J. Mol. Biol. 11:648-649.
9. MacHattie, L. A., and C. A. Thomas, Jr. 1964. DNA frombacteriophage lambda: molecular length and conformation.Science 144:1142-1144.
10. Mandell, J. D., and A. D. Hershey. 1960. A fractionatingcolumn for analysis of nucleic acids. Anal. Biochem. 1:66-77.
11. Marmur, J., and P. Doty. 1962. Determination of the basecomposition of deoxyribonucleic acid from its thermaldenaturation temperature. J. Mol. Biol. 5:109-118.
12. Saunders, G. F., and L. L. Campbell. 1966. Characterizationof a thermophilic bacteriophage for Bacillus stearother-mophilus. J. Bacteriol. 91:340-348.
13. Saunders, G. F., and L. L. Campbell. 1965. Properties of thedeoxyribonucleic acid of the thermophilic bacteriophageTP-84. Biochemistry 4:2836-2844.
14. Schildkraut, C. L., J. Marmur, and P. Doty. 1962. Determina-tion of the base composition of deoxyribonucleic acid fromits buoyant density in CsCI. J. Mol. Biol. 4:430-443.
15. Sheldrick, P., and W. Szybalski. 1967. Distribution of pyrimi-dine "clusters" between the complementary DNA strandsof certain Bacillus bacteriophages. J. Mol. Biol. 29:217-228.
16. Studier, F. W. 1965. Sedimentation studies on the size andshape of DNA. J. Mol. Biol. 11:373-390.
17. Thomas, C. A., and J. Abelson. 1966. The isolation and char-acterization of DNA from bacteriophage, p. 553-561, InG. L. C-antoni and D. R. Davies (ed.) Procedures in nucleicacid research, Harper & Row, Publishers, New York.
18. Vinograd, J., and J. E. Hearst. 1962. Equilibrium sedimiienta-tion of macromolecules and viruses in a density gradient.Fortschr. Chem. Org. Naturst. 20:372-422.
19. Vinograd, J., J. Morris, N. Davidson, and W. F. Dove, Jr.1963. The buoyant behavior of viral and bacterial DNA inalkaline CsCl. Proc. Nat. Acad. Sci. U.S.A. 49:12-17.
20. Vinograd, J., R. Radloff, and R. Bruner. 1965. Band-formingcenterpieces for the analytical ultracentrifuge. Biopolymers3:481-489.
21. Welker, N. E., and L. L. Campbell. 1965. Induction and prop-erties of a temperate bacteriophage from Bacillus stearothermtiophilus. J. Bacteriol. 89:175-184.
22. Wyatt, G. R., and S. S. Cohen. 1953. The bases of the nucleicacids of somne bacterial and animal viruses: the occurrence of5-hydroxymethylcytosine. Biochem. J. 55:774-782.